Watertown, SD Map & Demographics
Watertown Map
Watertown Overview
$35,599
PER CAPITA INCOME
$85,727
AVG FAMILY INCOME
$61,320
AVG HOUSEHOLD INCOME
35.9%
WAGE / INCOME GAP [ % ]
64.1¢/ $1
WAGE / INCOME GAP [ $ ]
0.43
INEQUALITY / GINI INDEX
22,718
TOTAL POPULATION
11,467
MALE POPULATION
11,251
FEMALE POPULATION
101.92
MALES / 100 FEMALES
98.12
FEMALES / 100 MALES
38.9
MEDIAN AGE
2.9
AVG FAMILY SIZE
2.2
AVG HOUSEHOLD SIZE
12,443
LABOR FORCE [ PEOPLE ]
68.0%
PERCENT IN LABOR FORCE
1.5%
UNEMPLOYMENT RATE
Watertown Zip Codes
Watertown Area Codes
Income in Watertown
Income Overview in Watertown
Per Capita Income in Watertown is $35,599, while median incomes of families and households are $85,727 and $61,320 respectively.
| Characteristic | Number | Measure |
| Per Capita Income | 22,718 | $35,599 |
| Median Family Income | 5,497 | $85,727 |
| Mean Family Income | 5,497 | $101,413 |
| Median Household Income | 10,018 | $61,320 |
| Mean Household Income | 10,018 | $79,231 |
| Income Deficit | 5,497 | $0 |
| Wage / Income Gap (%) | 22,718 | 35.91% |
| Wage / Income Gap ($) | 22,718 | 64.09¢ per $1 |
| Gini / Inequality Index | 22,718 | 0.43 |
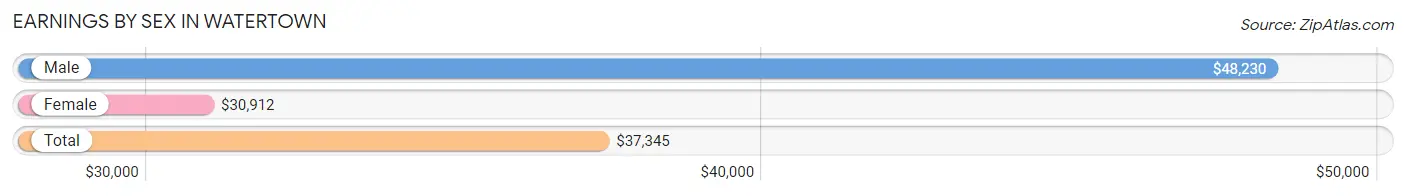
Earnings by Sex in Watertown
Average Earnings in Watertown are $37,345, $48,230 for men and $30,912 for women, a difference of 35.9%.
| Sex | Number | Average Earnings |
| Male | 7,014 (53.3%) | $48,230 |
| Female | 6,152 (46.7%) | $30,912 |
| Total | 13,166 (100.0%) | $37,345 |
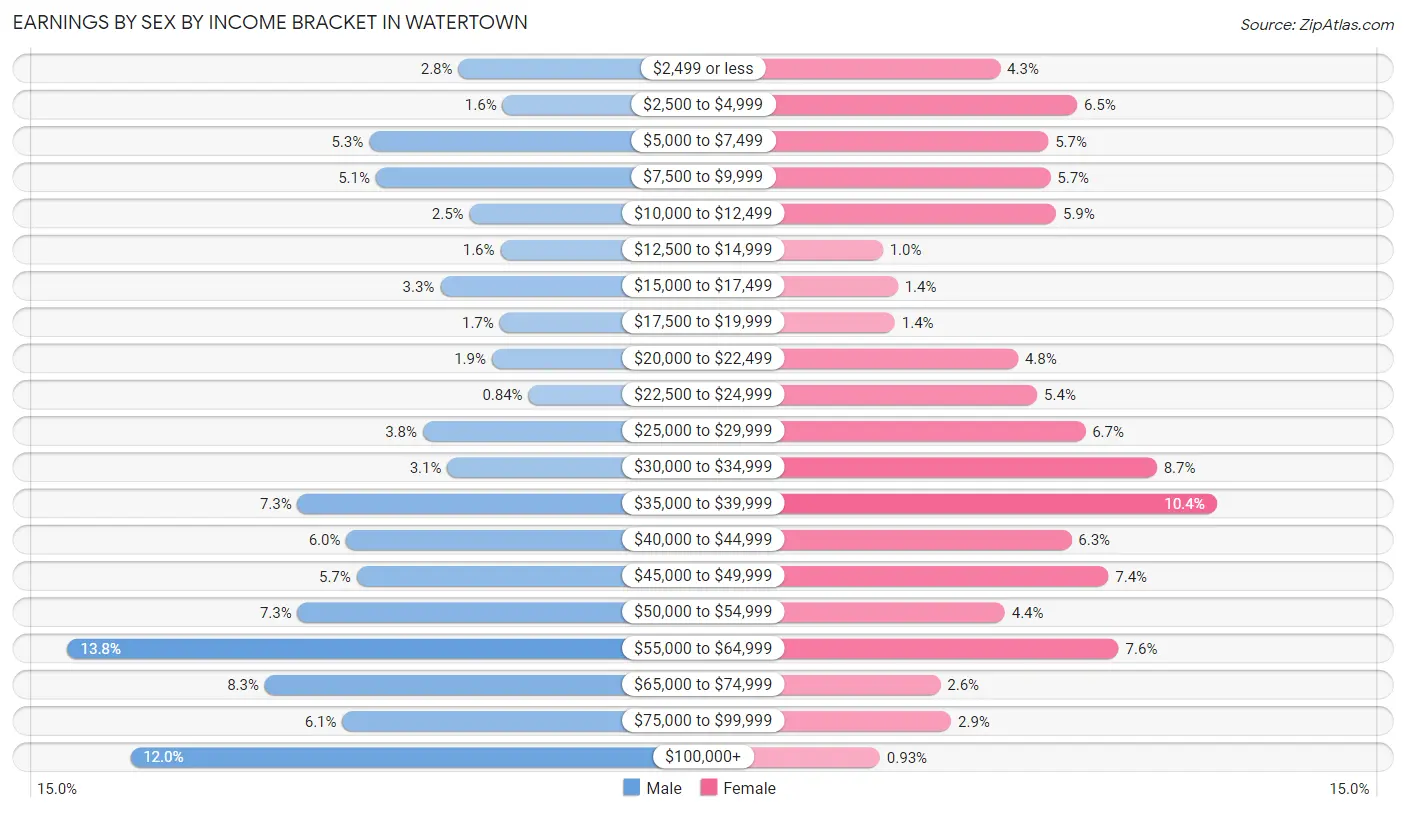
Earnings by Sex by Income Bracket in Watertown
The most common earnings brackets in Watertown are $55,000 to $64,999 for men (967 | 13.8%) and $35,000 to $39,999 for women (639 | 10.4%).
| Income | Male | Female |
| $2,499 or less | 197 (2.8%) | 265 (4.3%) |
| $2,500 to $4,999 | 110 (1.6%) | 398 (6.5%) |
| $5,000 to $7,499 | 373 (5.3%) | 348 (5.7%) |
| $7,500 to $9,999 | 360 (5.1%) | 352 (5.7%) |
| $10,000 to $12,499 | 175 (2.5%) | 362 (5.9%) |
| $12,500 to $14,999 | 114 (1.6%) | 62 (1.0%) |
| $15,000 to $17,499 | 233 (3.3%) | 88 (1.4%) |
| $17,500 to $19,999 | 116 (1.7%) | 83 (1.3%) |
| $20,000 to $22,499 | 131 (1.9%) | 296 (4.8%) |
| $22,500 to $24,999 | 59 (0.8%) | 329 (5.3%) |
| $25,000 to $29,999 | 267 (3.8%) | 412 (6.7%) |
| $30,000 to $34,999 | 219 (3.1%) | 536 (8.7%) |
| $35,000 to $39,999 | 514 (7.3%) | 639 (10.4%) |
| $40,000 to $44,999 | 418 (6.0%) | 388 (6.3%) |
| $45,000 to $49,999 | 398 (5.7%) | 452 (7.3%) |
| $50,000 to $54,999 | 514 (7.3%) | 273 (4.4%) |
| $55,000 to $64,999 | 967 (13.8%) | 470 (7.6%) |
| $65,000 to $74,999 | 579 (8.3%) | 162 (2.6%) |
| $75,000 to $99,999 | 426 (6.1%) | 180 (2.9%) |
| $100,000+ | 844 (12.0%) | 57 (0.9%) |
| Total | 7,014 (100.0%) | 6,152 (100.0%) |
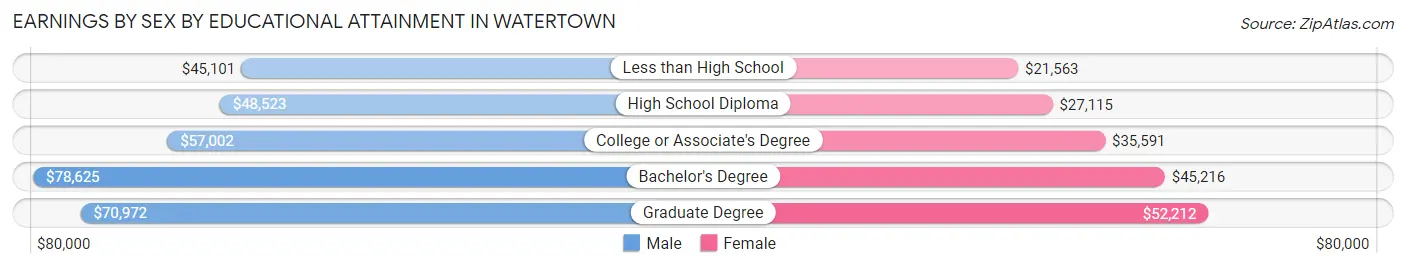
Earnings by Sex by Educational Attainment in Watertown
Average earnings in Watertown are $54,008 for men and $34,586 for women, a difference of 36.0%. Men with an educational attainment of bachelor's degree enjoy the highest average annual earnings of $78,625, while those with less than high school education earn the least with $45,101. Women with an educational attainment of graduate degree earn the most with the average annual earnings of $52,212, while those with less than high school education have the smallest earnings of $21,563.
| Educational Attainment | Male Income | Female Income |
| Less than High School | $45,101 | $21,563 |
| High School Diploma | $48,523 | $27,115 |
| College or Associate's Degree | $57,002 | $35,591 |
| Bachelor's Degree | $78,625 | $45,216 |
| Graduate Degree | $70,972 | $52,212 |
| Total | $54,008 | $34,586 |
Family Income in Watertown
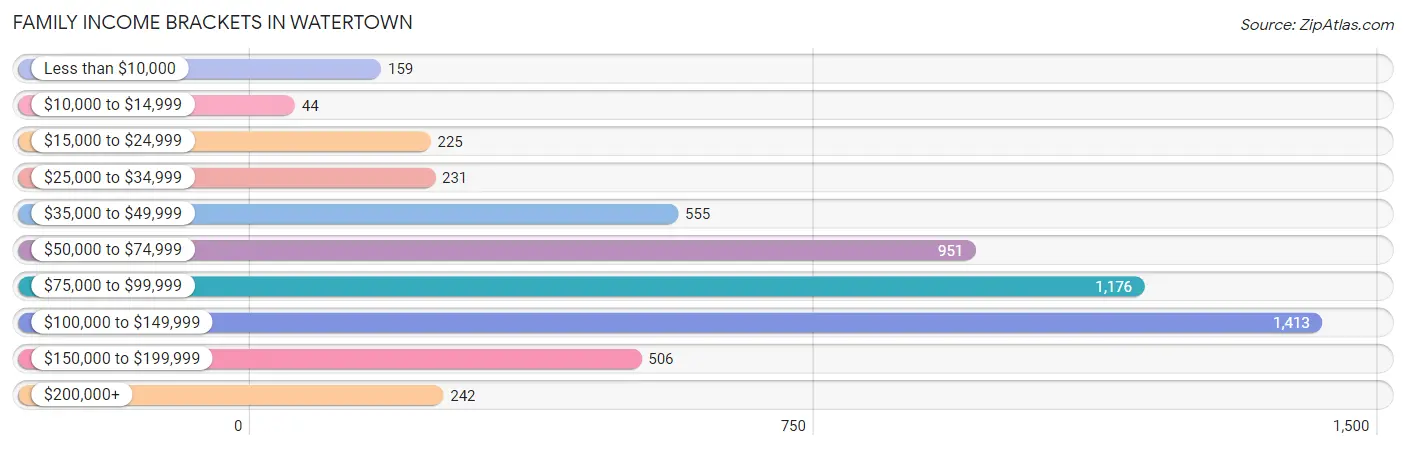
Family Income Brackets in Watertown
According to the Watertown family income data, there are 1,413 families falling into the $100,000 to $149,999 income range, which is the most common income bracket and makes up 25.7% of all families. Conversely, the $10,000 to $14,999 income bracket is the least frequent group with only 44 families (0.8%) belonging to this category.
| Income Bracket | # Families | % Families |
| Less than $10,000 | 159 | 2.9% |
| $10,000 to $14,999 | 44 | 0.8% |
| $15,000 to $24,999 | 225 | 4.1% |
| $25,000 to $34,999 | 231 | 4.2% |
| $35,000 to $49,999 | 555 | 10.1% |
| $50,000 to $74,999 | 951 | 17.3% |
| $75,000 to $99,999 | 1,176 | 21.4% |
| $100,000 to $149,999 | 1,413 | 25.7% |
| $150,000 to $199,999 | 506 | 9.2% |
| $200,000+ | 242 | 4.4% |
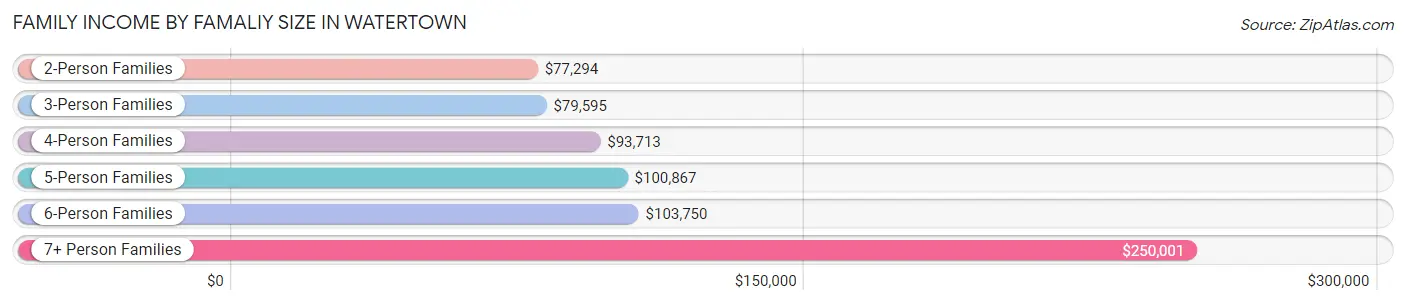
Family Income by Famaliy Size in Watertown
7+ person families (51 | 0.9%) account for the highest median family income in Watertown with $250,001 per family, while 2-person families (3,117 | 56.7%) have the highest median income of $38,647 per family member.
| Income Bracket | # Families | Median Income |
| 2-Person Families | 3,117 (56.7%) | $77,294 |
| 3-Person Families | 784 (14.3%) | $79,595 |
| 4-Person Families | 849 (15.4%) | $93,713 |
| 5-Person Families | 514 (9.3%) | $100,867 |
| 6-Person Families | 182 (3.3%) | $103,750 |
| 7+ Person Families | 51 (0.9%) | $250,001 |
| Total | 5,497 (100.0%) | $85,727 |
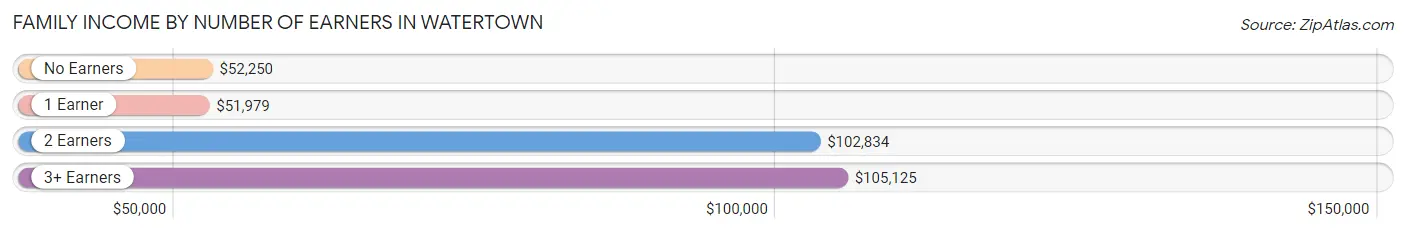
Family Income by Number of Earners in Watertown
The median family income in Watertown is $85,727, with families comprising 3+ earners (483) having the highest median family income of $105,125, while families with 1 earner (1,245) have the lowest median family income of $51,979, accounting for 8.8% and 22.7% of families, respectively.
| Number of Earners | # Families | Median Income |
| No Earners | 822 (14.9%) | $52,250 |
| 1 Earner | 1,245 (22.7%) | $51,979 |
| 2 Earners | 2,947 (53.6%) | $102,834 |
| 3+ Earners | 483 (8.8%) | $105,125 |
| Total | 5,497 (100.0%) | $85,727 |
Household Income in Watertown
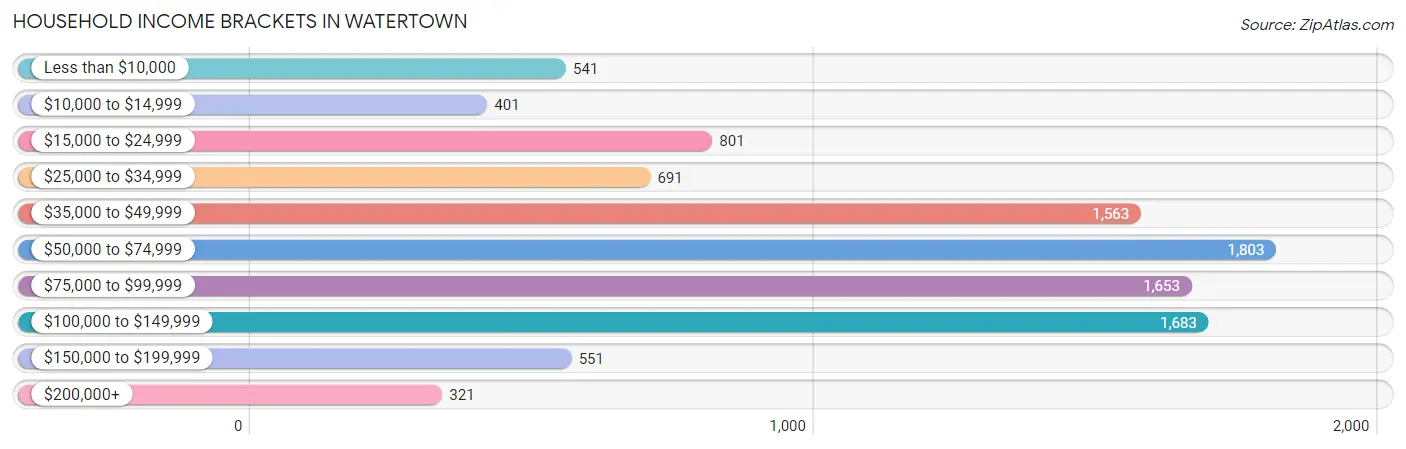
Household Income Brackets in Watertown
With 1,803 households falling in the category, the $50,000 to $74,999 income range is the most frequent in Watertown, accounting for 18.0% of all households. In contrast, only 321 households (3.2%) fall into the $200,000+ income bracket, making it the least populous group.
| Income Bracket | # Households | % Households |
| Less than $10,000 | 541 | 5.4% |
| $10,000 to $14,999 | 401 | 4.0% |
| $15,000 to $24,999 | 801 | 8.0% |
| $25,000 to $34,999 | 691 | 6.9% |
| $35,000 to $49,999 | 1,563 | 15.6% |
| $50,000 to $74,999 | 1,803 | 18.0% |
| $75,000 to $99,999 | 1,653 | 16.5% |
| $100,000 to $149,999 | 1,683 | 16.8% |
| $150,000 to $199,999 | 551 | 5.5% |
| $200,000+ | 321 | 3.2% |
Household Income by Householder Age in Watertown
The median household income in Watertown is $61,320, with the highest median household income of $79,000 found in the 45 to 64 years age bracket for the primary householder. A total of 2,864 households (28.6%) fall into this category. Meanwhile, the 15 to 24 years age bracket for the primary householder has the lowest median household income of $34,851, with 999 households (10.0%) in this group.
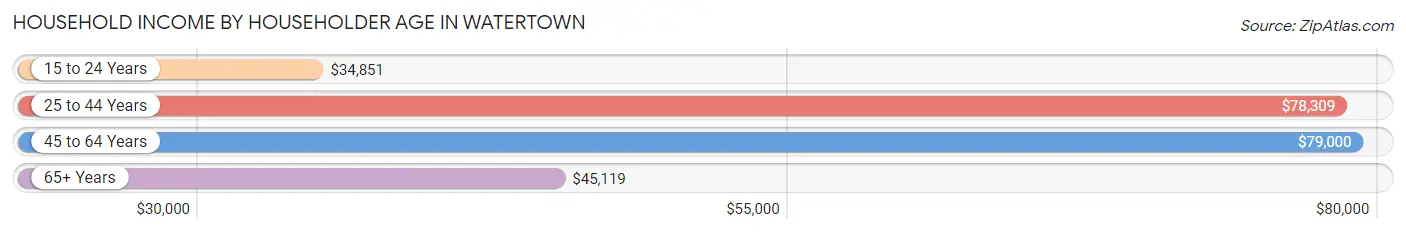
| Income Bracket | # Households | Median Income |
| 15 to 24 Years | 999 (10.0%) | $34,851 |
| 25 to 44 Years | 3,294 (32.9%) | $78,309 |
| 45 to 64 Years | 2,864 (28.6%) | $79,000 |
| 65+ Years | 2,861 (28.6%) | $45,119 |
| Total | 10,018 (100.0%) | $61,320 |
Poverty in Watertown
Income Below Poverty by Sex and Age in Watertown
With 9.4% poverty level for males and 15.2% for females among the residents of Watertown, 18 to 24 year old males and 18 to 24 year old females are the most vulnerable to poverty, with 326 males (28.9%) and 330 females (32.7%) in their respective age groups living below the poverty level.
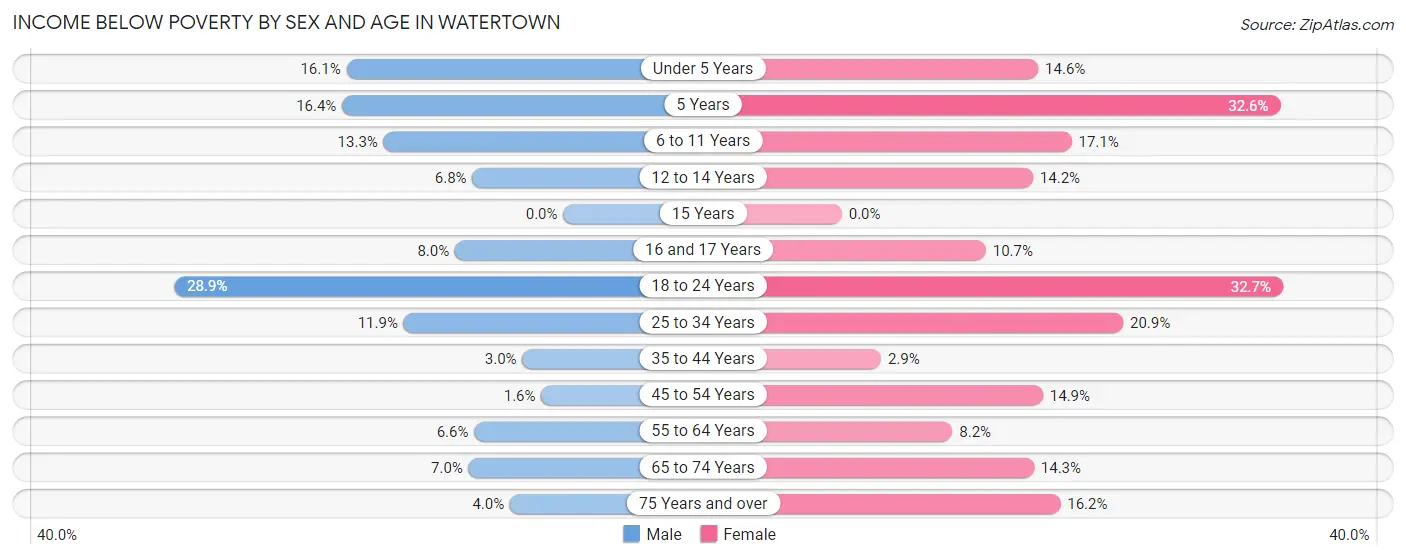
| Age Bracket | Male | Female |
| Under 5 Years | 94 (16.1%) | 91 (14.6%) |
| 5 Years | 22 (16.4%) | 56 (32.6%) |
| 6 to 11 Years | 111 (13.3%) | 151 (17.1%) |
| 12 to 14 Years | 27 (6.8%) | 61 (14.2%) |
| 15 Years | 0 (0.0%) | 0 (0.0%) |
| 16 and 17 Years | 30 (8.0%) | 37 (10.7%) |
| 18 to 24 Years | 326 (28.9%) | 330 (32.7%) |
| 25 to 34 Years | 176 (11.8%) | 291 (20.9%) |
| 35 to 44 Years | 48 (3.0%) | 39 (2.9%) |
| 45 to 54 Years | 21 (1.6%) | 178 (14.9%) |
| 55 to 64 Years | 93 (6.6%) | 113 (8.2%) |
| 65 to 74 Years | 83 (7.0%) | 154 (14.3%) |
| 75 Years and over | 29 (4.0%) | 171 (16.2%) |
| Total | 1,060 (9.4%) | 1,672 (15.2%) |
Income Above Poverty by Sex and Age in Watertown
According to the poverty statistics in Watertown, males aged 15 years and females aged 15 years are the age groups that are most secure financially, with 100.0% of males and 100.0% of females in these age groups living above the poverty line.
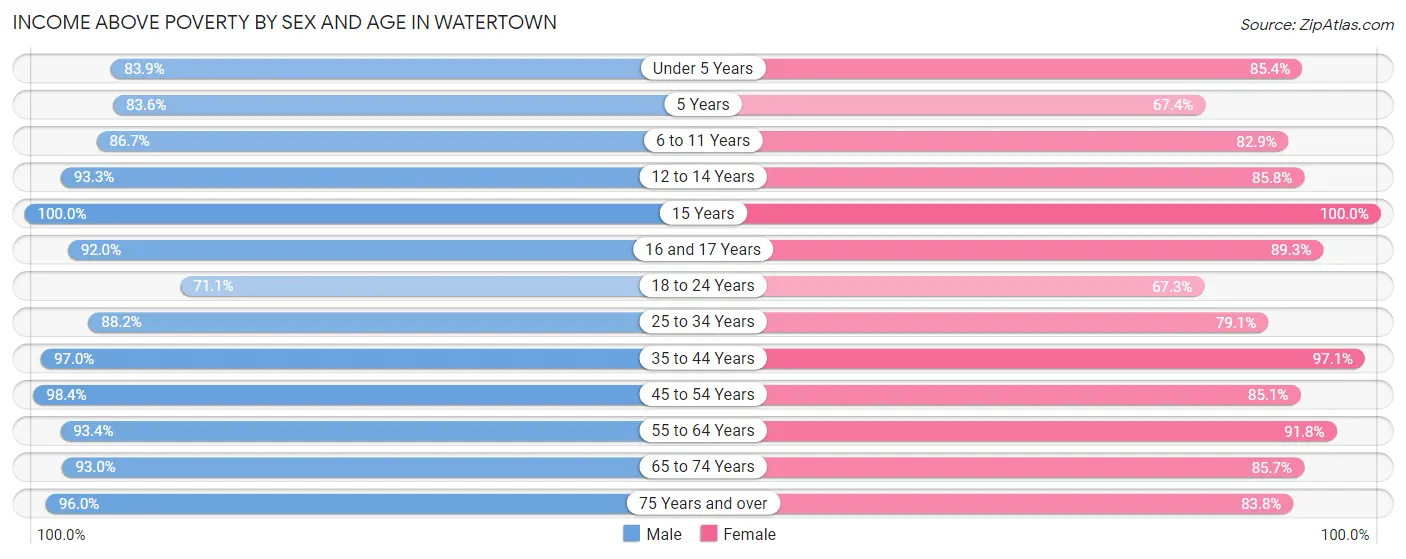
| Age Bracket | Male | Female |
| Under 5 Years | 490 (83.9%) | 533 (85.4%) |
| 5 Years | 112 (83.6%) | 116 (67.4%) |
| 6 to 11 Years | 721 (86.7%) | 734 (82.9%) |
| 12 to 14 Years | 373 (93.2%) | 369 (85.8%) |
| 15 Years | 178 (100.0%) | 77 (100.0%) |
| 16 and 17 Years | 343 (92.0%) | 309 (89.3%) |
| 18 to 24 Years | 802 (71.1%) | 678 (67.3%) |
| 25 to 34 Years | 1,309 (88.1%) | 1,103 (79.1%) |
| 35 to 44 Years | 1,531 (97.0%) | 1,302 (97.1%) |
| 45 to 54 Years | 1,265 (98.4%) | 1,014 (85.1%) |
| 55 to 64 Years | 1,314 (93.4%) | 1,264 (91.8%) |
| 65 to 74 Years | 1,098 (93.0%) | 926 (85.7%) |
| 75 Years and over | 703 (96.0%) | 883 (83.8%) |
| Total | 10,239 (90.6%) | 9,308 (84.8%) |
Income Below Poverty Among Married-Couple Families in Watertown
The poverty statistics for married-couple families in Watertown show that 2.0% or 87 of the total 4,390 families live below the poverty line. Families with 5 or more children have the highest poverty rate of 35.3%, comprising of 6 families. On the other hand, families with 1 or 2 children have the lowest poverty rate of 0.0%, which includes 0 families.
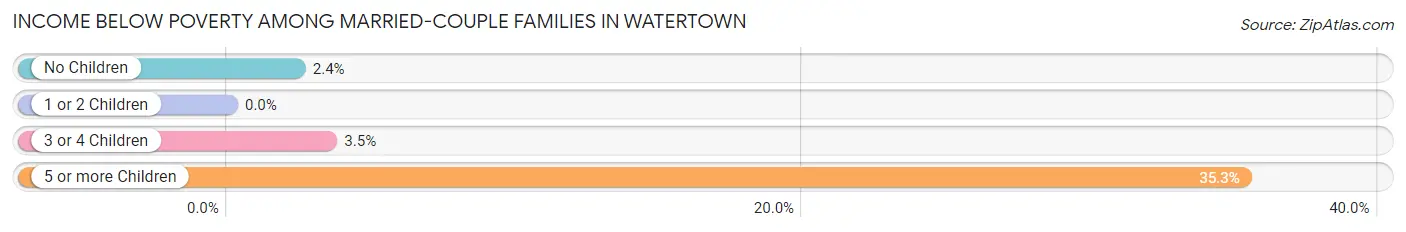
| Children | Above Poverty | Below Poverty |
| No Children | 2,444 (97.6%) | 59 (2.4%) |
| 1 or 2 Children | 1,235 (100.0%) | 0 (0.0%) |
| 3 or 4 Children | 613 (96.5%) | 22 (3.5%) |
| 5 or more Children | 11 (64.7%) | 6 (35.3%) |
| Total | 4,303 (98.0%) | 87 (2.0%) |
Income Below Poverty Among Single-Parent Households in Watertown
According to the poverty data in Watertown, 5.1% or 21 single-father households and 30.3% or 211 single-mother households are living below the poverty line. Among single-father households, those with 1 or 2 children have the highest poverty rate, with 21 households (25.0%) experiencing poverty. Likewise, among single-mother households, those with 3 or 4 children have the highest poverty rate, with 64 households (64.0%) falling below the poverty line.
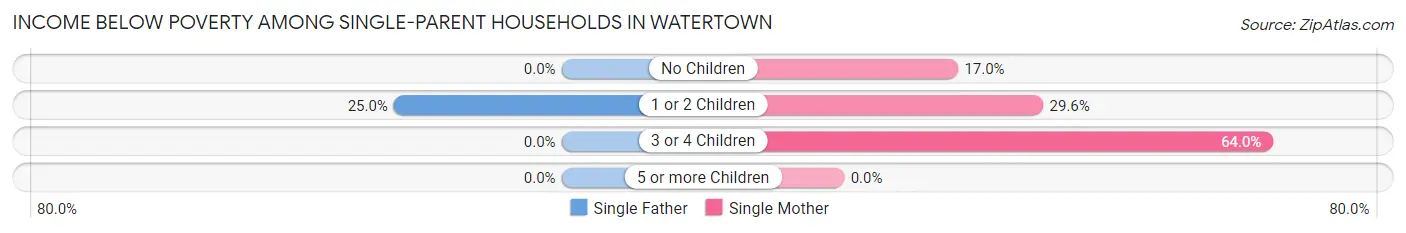
| Children | Single Father | Single Mother |
| No Children | 0 (0.0%) | 40 (17.0%) |
| 1 or 2 Children | 21 (25.0%) | 107 (29.6%) |
| 3 or 4 Children | 0 (0.0%) | 64 (64.0%) |
| 5 or more Children | 0 (0.0%) | 0 (0.0%) |
| Total | 21 (5.1%) | 211 (30.3%) |
Income Below Poverty Among Married-Couple vs Single-Parent Households in Watertown
The poverty data for Watertown shows that 87 of the married-couple family households (2.0%) and 232 of the single-parent households (21.0%) are living below the poverty level. Within the married-couple family households, those with 5 or more children have the highest poverty rate, with 6 households (35.3%) falling below the poverty line. Among the single-parent households, those with 3 or 4 children have the highest poverty rate, with 64 household (38.1%) living below poverty.
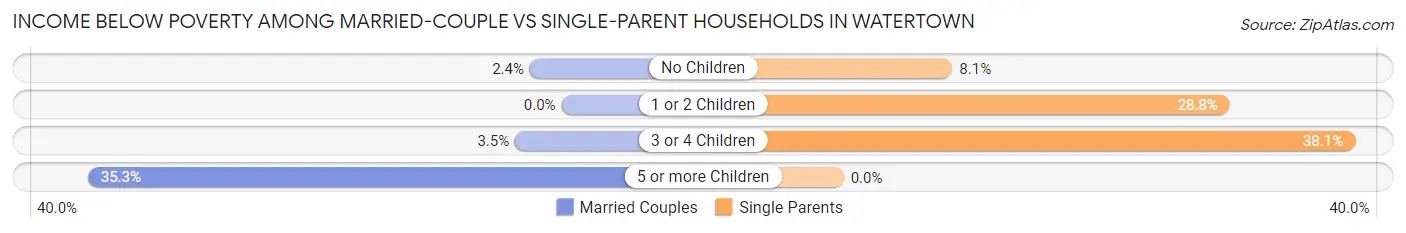
| Children | Married-Couple Families | Single-Parent Households |
| No Children | 59 (2.4%) | 40 (8.1%) |
| 1 or 2 Children | 0 (0.0%) | 128 (28.8%) |
| 3 or 4 Children | 22 (3.5%) | 64 (38.1%) |
| 5 or more Children | 6 (35.3%) | 0 (0.0%) |
| Total | 87 (2.0%) | 232 (21.0%) |
Race in Watertown
The most populous races in Watertown are White / Caucasian (20,728 | 91.2%), Two or more Races (855 | 3.8%), and Hispanic or Latino (851 | 3.7%).
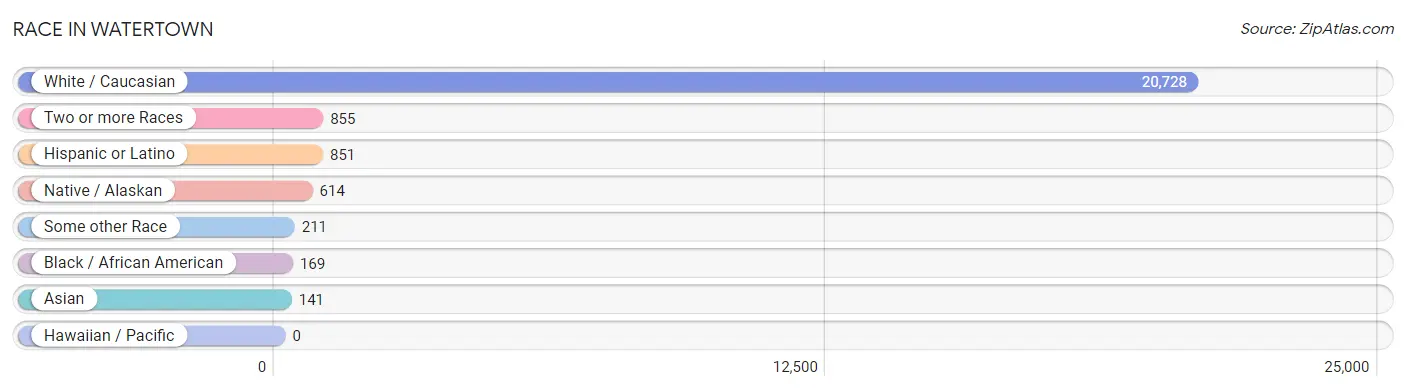
| Race | # Population | % Population |
| Asian | 141 | 0.6% |
| Black / African American | 169 | 0.7% |
| Hawaiian / Pacific | 0 | 0.0% |
| Hispanic or Latino | 851 | 3.7% |
| Native / Alaskan | 614 | 2.7% |
| White / Caucasian | 20,728 | 91.2% |
| Two or more Races | 855 | 3.8% |
| Some other Race | 211 | 0.9% |
| Total | 22,718 | 100.0% |
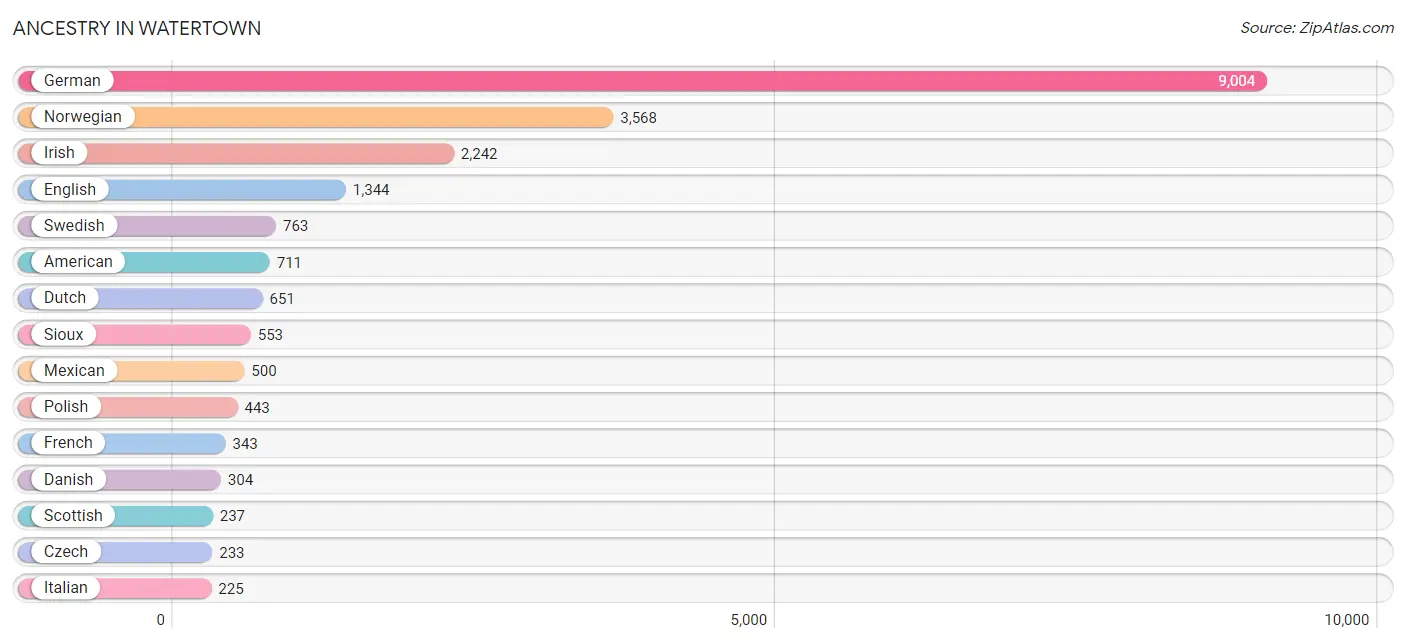
Ancestry in Watertown
The most populous ancestries reported in Watertown are German (9,004 | 39.6%), Norwegian (3,568 | 15.7%), Irish (2,242 | 9.9%), English (1,344 | 5.9%), and Swedish (763 | 3.4%), together accounting for 74.5% of all Watertown residents.
| Ancestry | # Population | % Population |
| American | 711 | 3.1% |
| Arab | 3 | 0.0% |
| Austrian | 19 | 0.1% |
| Bangladeshi | 10 | 0.0% |
| Belgian | 25 | 0.1% |
| Bhutanese | 73 | 0.3% |
| British | 94 | 0.4% |
| Burmese | 72 | 0.3% |
| Canadian | 16 | 0.1% |
| Central American | 175 | 0.8% |
| Chippewa | 1 | 0.0% |
| Cuban | 93 | 0.4% |
| Czech | 233 | 1.0% |
| Czechoslovakian | 69 | 0.3% |
| Danish | 304 | 1.3% |
| Dominican | 26 | 0.1% |
| Dutch | 651 | 2.9% |
| Eastern European | 17 | 0.1% |
| English | 1,344 | 5.9% |
| Ethiopian | 92 | 0.4% |
| European | 67 | 0.3% |
| Finnish | 157 | 0.7% |
| French | 343 | 1.5% |
| French Canadian | 46 | 0.2% |
| German | 9,004 | 39.6% |
| Greek | 17 | 0.1% |
| Guamanian / Chamorro | 35 | 0.2% |
| Guatemalan | 175 | 0.8% |
| Hungarian | 10 | 0.0% |
| Indian (Asian) | 104 | 0.5% |
| Inupiat | 16 | 0.1% |
| Irish | 2,242 | 9.9% |
| Italian | 225 | 1.0% |
| Korean | 95 | 0.4% |
| Mexican | 500 | 2.2% |
| Native Hawaiian | 37 | 0.2% |
| Northern European | 73 | 0.3% |
| Norwegian | 3,568 | 15.7% |
| Polish | 443 | 1.9% |
| Puerto Rican | 13 | 0.1% |
| Russian | 143 | 0.6% |
| Samoan | 36 | 0.2% |
| Scandinavian | 200 | 0.9% |
| Scotch-Irish | 133 | 0.6% |
| Scottish | 237 | 1.0% |
| Sioux | 553 | 2.4% |
| Spaniard | 14 | 0.1% |
| Sri Lankan | 88 | 0.4% |
| Subsaharan African | 92 | 0.4% |
| Swedish | 763 | 3.4% |
| Swiss | 20 | 0.1% |
| Thai | 75 | 0.3% |
| Ukrainian | 18 | 0.1% |
| Welsh | 113 | 0.5% | View All 54 Rows |
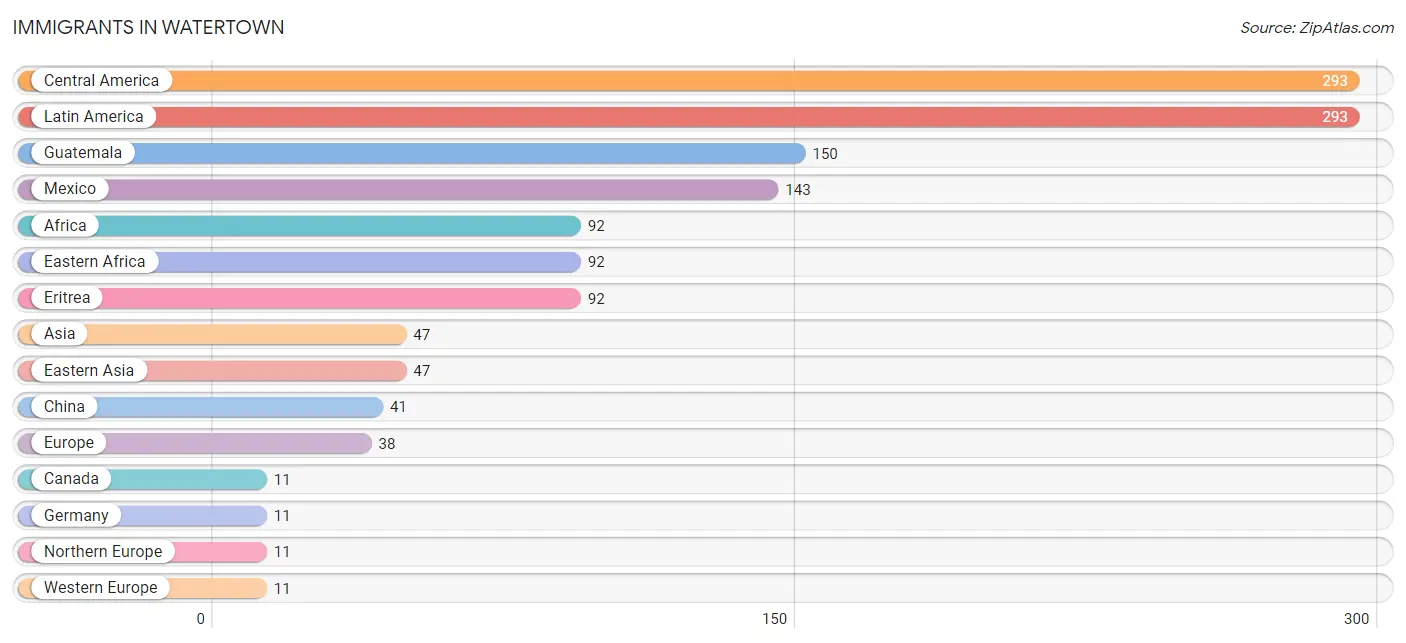
Immigrants in Watertown
The most numerous immigrant groups reported in Watertown came from Central America (293 | 1.3%), Latin America (293 | 1.3%), Guatemala (150 | 0.7%), Mexico (143 | 0.6%), and Africa (92 | 0.4%), together accounting for 4.3% of all Watertown residents.
| Immigration Origin | # Population | % Population |
| Africa | 92 | 0.4% |
| Asia | 47 | 0.2% |
| Canada | 11 | 0.1% |
| Central America | 293 | 1.3% |
| China | 41 | 0.2% |
| Eastern Africa | 92 | 0.4% |
| Eastern Asia | 47 | 0.2% |
| Eastern Europe | 10 | 0.0% |
| Eritrea | 92 | 0.4% |
| Europe | 38 | 0.2% |
| Germany | 11 | 0.1% |
| Guatemala | 150 | 0.7% |
| Italy | 6 | 0.0% |
| Korea | 6 | 0.0% |
| Latin America | 293 | 1.3% |
| Mexico | 143 | 0.6% |
| Northern Europe | 11 | 0.1% |
| Russia | 10 | 0.0% |
| Southern Europe | 6 | 0.0% |
| Western Europe | 11 | 0.1% | View All 20 Rows |
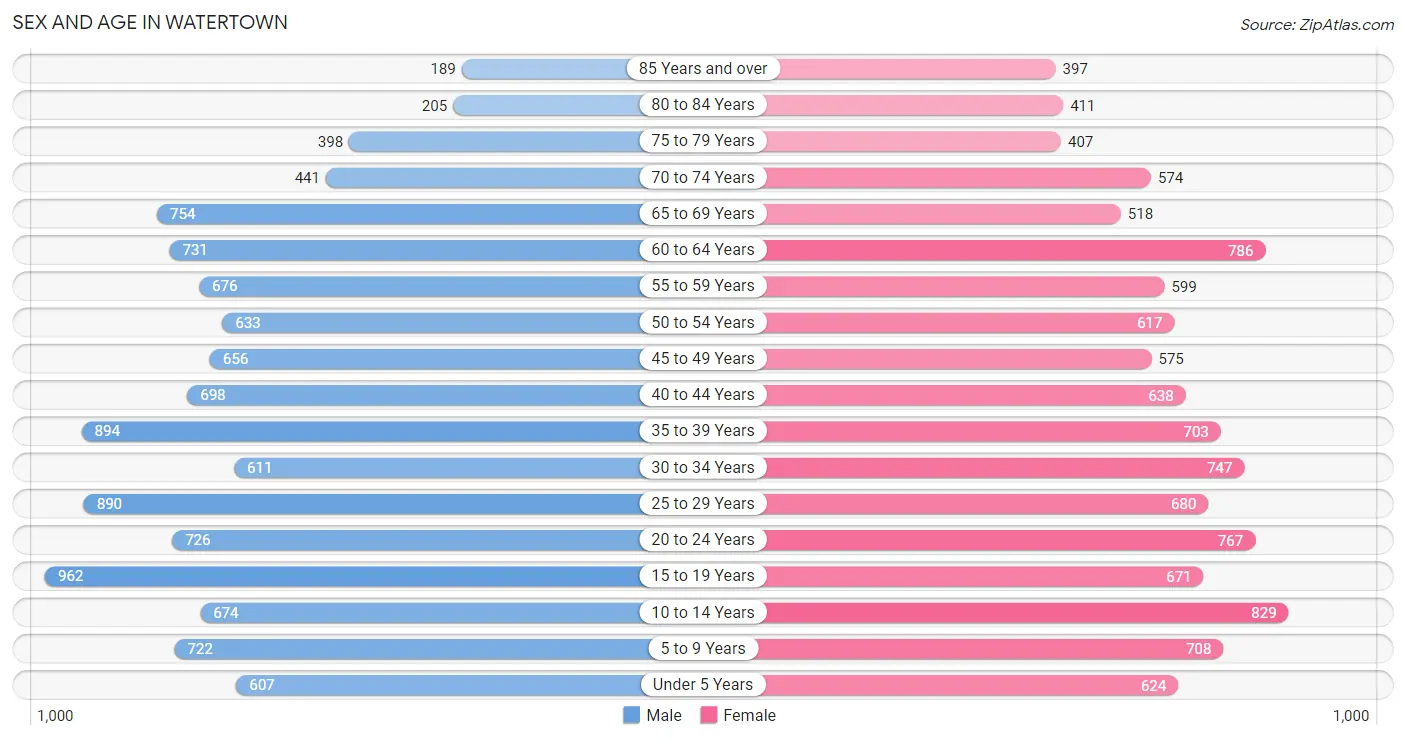
Sex and Age in Watertown
Sex and Age in Watertown
The most populous age groups in Watertown are 15 to 19 Years (962 | 8.4%) for men and 10 to 14 Years (829 | 7.4%) for women.
| Age Bracket | Male | Female |
| Under 5 Years | 607 (5.3%) | 624 (5.6%) |
| 5 to 9 Years | 722 (6.3%) | 708 (6.3%) |
| 10 to 14 Years | 674 (5.9%) | 829 (7.4%) |
| 15 to 19 Years | 962 (8.4%) | 671 (6.0%) |
| 20 to 24 Years | 726 (6.3%) | 767 (6.8%) |
| 25 to 29 Years | 890 (7.8%) | 680 (6.0%) |
| 30 to 34 Years | 611 (5.3%) | 747 (6.6%) |
| 35 to 39 Years | 894 (7.8%) | 703 (6.2%) |
| 40 to 44 Years | 698 (6.1%) | 638 (5.7%) |
| 45 to 49 Years | 656 (5.7%) | 575 (5.1%) |
| 50 to 54 Years | 633 (5.5%) | 617 (5.5%) |
| 55 to 59 Years | 676 (5.9%) | 599 (5.3%) |
| 60 to 64 Years | 731 (6.4%) | 786 (7.0%) |
| 65 to 69 Years | 754 (6.6%) | 518 (4.6%) |
| 70 to 74 Years | 441 (3.8%) | 574 (5.1%) |
| 75 to 79 Years | 398 (3.5%) | 407 (3.6%) |
| 80 to 84 Years | 205 (1.8%) | 411 (3.6%) |
| 85 Years and over | 189 (1.7%) | 397 (3.5%) |
| Total | 11,467 (100.0%) | 11,251 (100.0%) |
Families and Households in Watertown
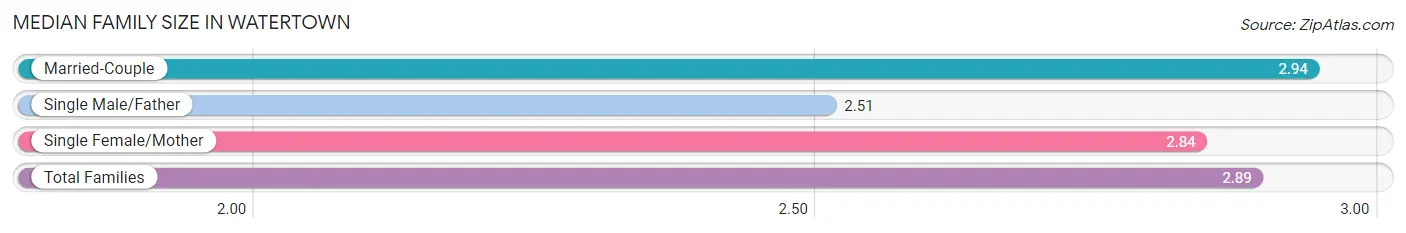
Median Family Size in Watertown
The median family size in Watertown is 2.89 persons per family, with married-couple families (4,390 | 79.9%) accounting for the largest median family size of 2.94 persons per family. On the other hand, single male/father families (410 | 7.5%) represent the smallest median family size with 2.51 persons per family.
| Family Type | # Families | Family Size |
| Married-Couple | 4,390 (79.9%) | 2.94 |
| Single Male/Father | 410 (7.5%) | 2.51 |
| Single Female/Mother | 697 (12.7%) | 2.84 |
| Total Families | 5,497 (100.0%) | 2.89 |
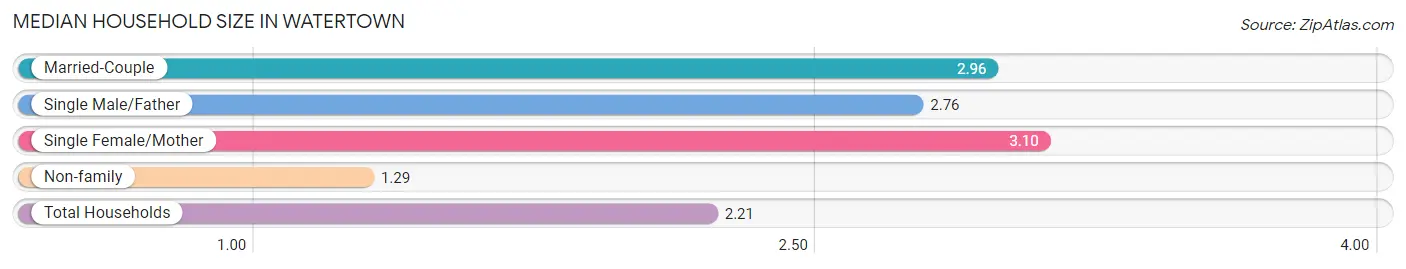
Median Household Size in Watertown
The median household size in Watertown is 2.21 persons per household, with single female/mother households (697 | 7.0%) accounting for the largest median household size of 3.1 persons per household. non-family households (4,521 | 45.1%) represent the smallest median household size with 1.29 persons per household.
| Household Type | # Households | Household Size |
| Married-Couple | 4,390 (43.8%) | 2.96 |
| Single Male/Father | 410 (4.1%) | 2.76 |
| Single Female/Mother | 697 (7.0%) | 3.10 |
| Non-family | 4,521 (45.1%) | 1.29 |
| Total Households | 10,018 (100.0%) | 2.21 |
Household Size by Marriage Status in Watertown
Out of a total of 10,018 households in Watertown, 5,497 (54.9%) are family households, while 4,521 (45.1%) are nonfamily households. The most numerous type of family households are 2-person households, comprising 2,964, and the most common type of nonfamily households are 1-person households, comprising 3,522.
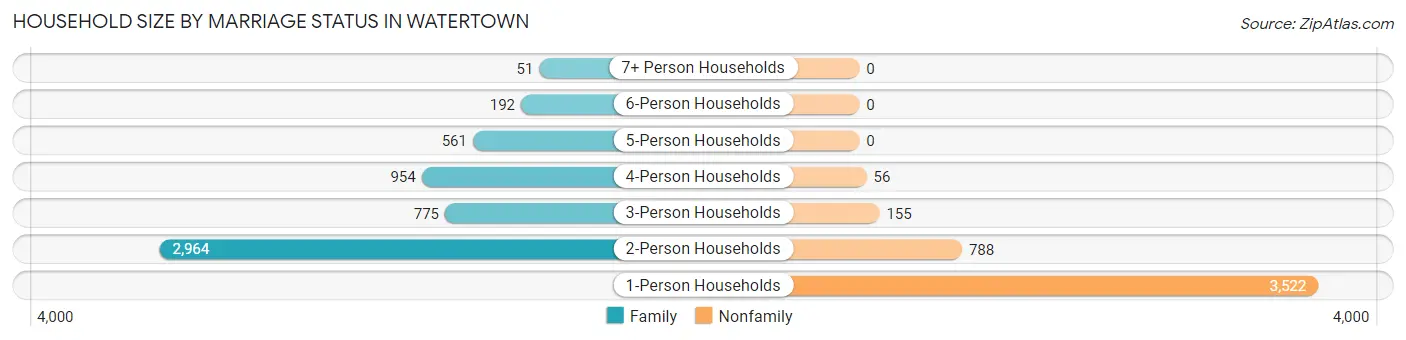
| Household Size | Family Households | Nonfamily Households |
| 1-Person Households | - | 3,522 (35.2%) |
| 2-Person Households | 2,964 (29.6%) | 788 (7.9%) |
| 3-Person Households | 775 (7.7%) | 155 (1.5%) |
| 4-Person Households | 954 (9.5%) | 56 (0.6%) |
| 5-Person Households | 561 (5.6%) | 0 (0.0%) |
| 6-Person Households | 192 (1.9%) | 0 (0.0%) |
| 7+ Person Households | 51 (0.5%) | 0 (0.0%) |
| Total | 5,497 (54.9%) | 4,521 (45.1%) |
Female Fertility in Watertown
Fertility by Age in Watertown
Average fertility rate in Watertown is 40.0 births per 1,000 women. Women in the age bracket of 20 to 34 years have the highest fertility rate with 70.0 births per 1,000 women. Women in the age bracket of 20 to 34 years acount for 77.7% of all women with births.
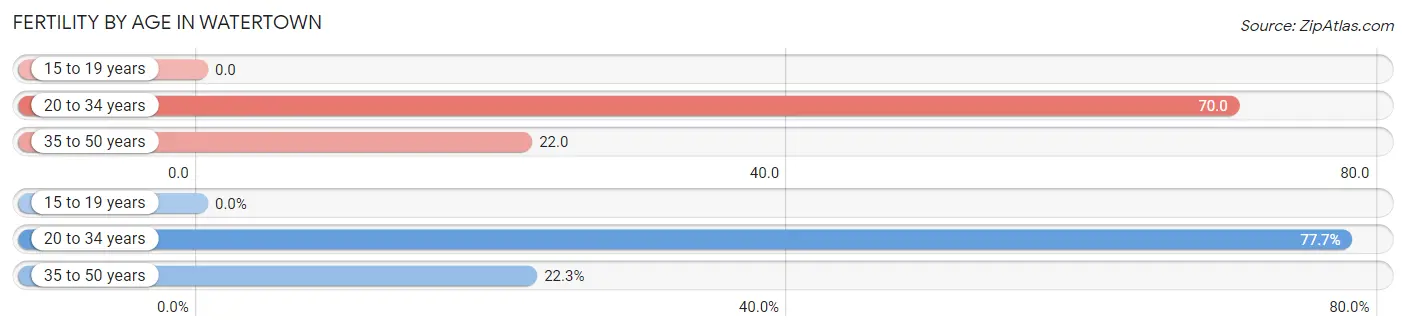
| Age Bracket | Women with Births | Births / 1,000 Women |
| 15 to 19 years | 0 (0.0%) | 0.0 |
| 20 to 34 years | 153 (77.7%) | 70.0 |
| 35 to 50 years | 44 (22.3%) | 22.0 |
| Total | 197 (100.0%) | 40.0 |
Fertility by Age by Marriage Status in Watertown
42.6% of women with births (197) in Watertown are married. The highest percentage of unmarried women with births falls into 35 to 50 years age bracket with 100.0% of them unmarried at the time of birth, while the lowest percentage of unmarried women with births belong to 20 to 34 years age bracket with 45.1% of them unmarried.
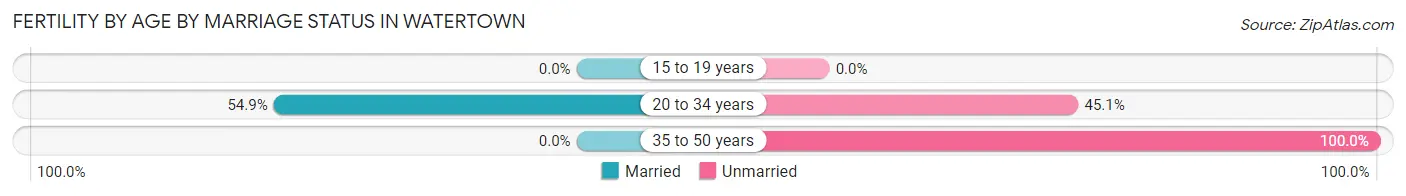
| Age Bracket | Married | Unmarried |
| 15 to 19 years | 0 (0.0%) | 0 (0.0%) |
| 20 to 34 years | 84 (54.9%) | 69 (45.1%) |
| 35 to 50 years | 0 (0.0%) | 44 (100.0%) |
| Total | 84 (42.6%) | 113 (57.4%) |
Fertility by Education in Watertown
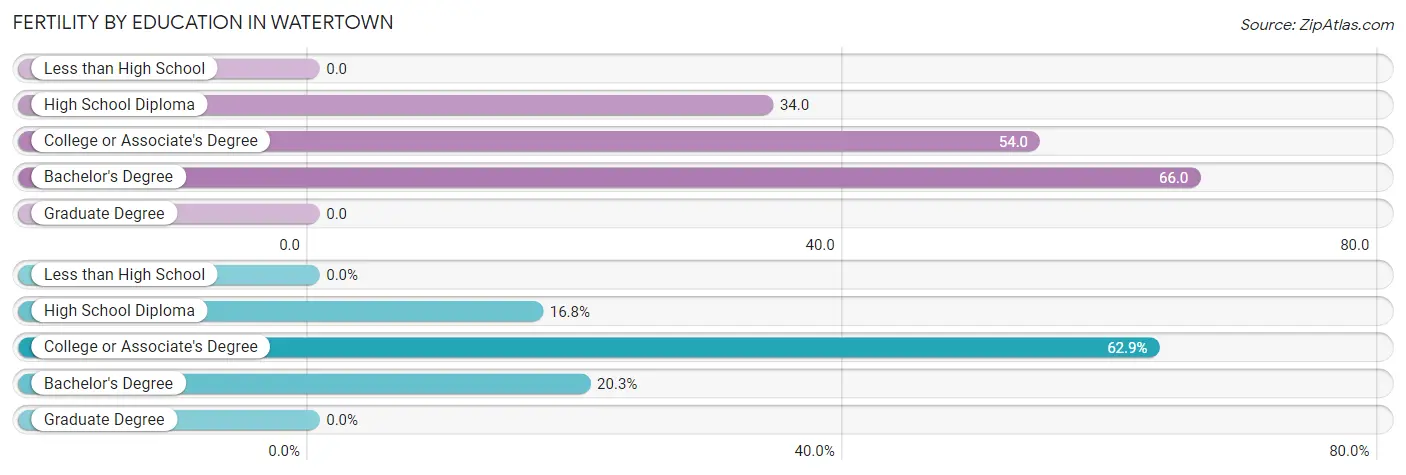
| Educational Attainment | Women with Births | Births / 1,000 Women |
| Less than High School | 0 (0.0%) | 0.0 |
| High School Diploma | 33 (16.8%) | 34.0 |
| College or Associate's Degree | 124 (62.9%) | 54.0 |
| Bachelor's Degree | 40 (20.3%) | 66.0 |
| Graduate Degree | 0 (0.0%) | 0.0 |
| Total | 197 (100.0%) | 40.0 |
Fertility by Education by Marriage Status in Watertown
57.4% of women with births in Watertown are unmarried. Women with the educational attainment of bachelor's degree are most likely to be married with 62.5% of them married at childbirth, while women with the educational attainment of high school diploma are least likely to be married with 100.0% of them unmarried at childbirth.
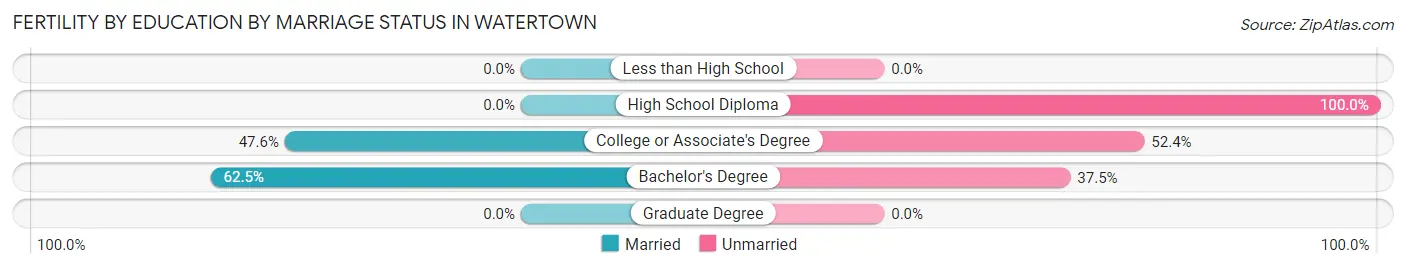
| Educational Attainment | Married | Unmarried |
| Less than High School | 0 (0.0%) | 0 (0.0%) |
| High School Diploma | 0 (0.0%) | 33 (100.0%) |
| College or Associate's Degree | 59 (47.6%) | 65 (52.4%) |
| Bachelor's Degree | 25 (62.5%) | 15 (37.5%) |
| Graduate Degree | 0 (0.0%) | 0 (0.0%) |
| Total | 84 (42.6%) | 113 (57.4%) |
Employment Characteristics in Watertown
Employment by Class of Employer in Watertown
Among the 12,116 employed individuals in Watertown, private company employees (8,439 | 69.7%), local government employees (1,120 | 9.2%), and not-for-profit organizations (928 | 7.7%) make up the most common classes of employment.
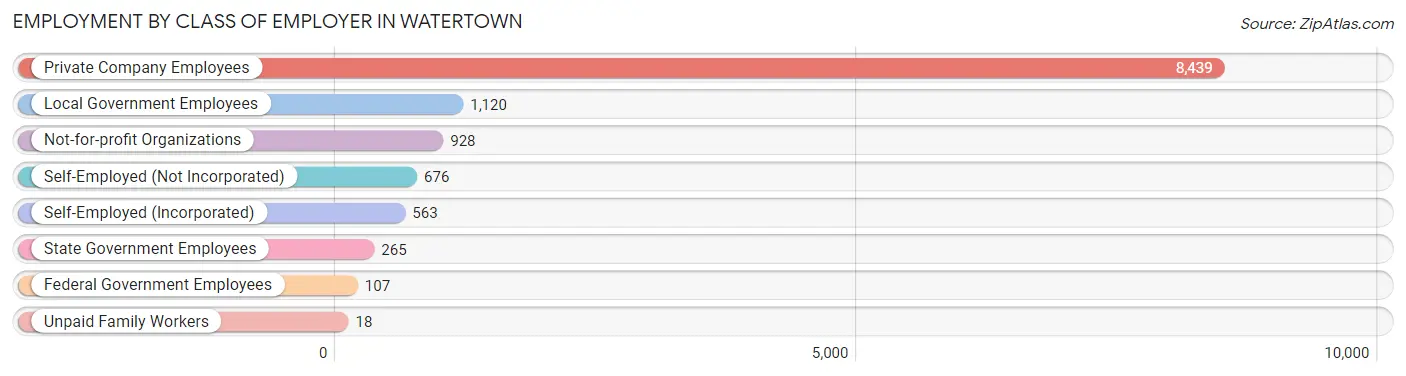
| Employer Class | # Employees | % Employees |
| Private Company Employees | 8,439 | 69.7% |
| Self-Employed (Incorporated) | 563 | 4.6% |
| Self-Employed (Not Incorporated) | 676 | 5.6% |
| Not-for-profit Organizations | 928 | 7.7% |
| Local Government Employees | 1,120 | 9.2% |
| State Government Employees | 265 | 2.2% |
| Federal Government Employees | 107 | 0.9% |
| Unpaid Family Workers | 18 | 0.2% |
| Total | 12,116 | 100.0% |
Employment Status by Age in Watertown
According to the labor force statistics for Watertown, out of the total population over 16 years of age (18,299), 68.0% or 12,443 individuals are in the labor force, with 1.5% or 187 of them unemployed. The age group with the highest labor force participation rate is 25 to 29 years, with 94.0% or 1,476 individuals in the labor force. Within the labor force, the 30 to 34 years age range has the highest percentage of unemployed individuals, with 4.7% or 54 of them being unemployed.
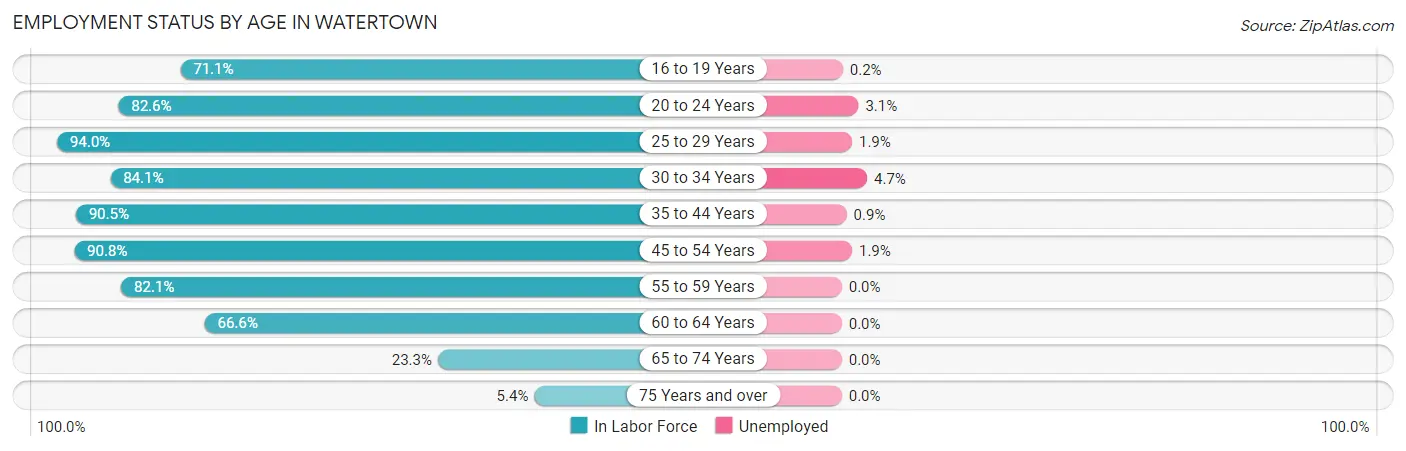
| Age Bracket | In Labor Force | Unemployed |
| 16 to 19 Years | 980 (71.1%) | 2 (0.2%) |
| 20 to 24 Years | 1,233 (82.6%) | 38 (3.1%) |
| 25 to 29 Years | 1,476 (94.0%) | 28 (1.9%) |
| 30 to 34 Years | 1,142 (84.1%) | 54 (4.7%) |
| 35 to 44 Years | 2,654 (90.5%) | 24 (0.9%) |
| 45 to 54 Years | 2,253 (90.8%) | 43 (1.9%) |
| 55 to 59 Years | 1,047 (82.1%) | 0 (0.0%) |
| 60 to 64 Years | 1,010 (66.6%) | 0 (0.0%) |
| 65 to 74 Years | 533 (23.3%) | 0 (0.0%) |
| 75 Years and over | 108 (5.4%) | 0 (0.0%) |
| Total | 12,443 (68.0%) | 187 (1.5%) |
Employment Status by Educational Attainment in Watertown
According to labor force statistics for Watertown, 86.1% of individuals (9,586) out of the total population between 25 and 64 years of age (11,134) are in the labor force, with 1.5% or 144 of them being unemployed. The group with the highest labor force participation rate are those with the educational attainment of college / associate degree, with 92.7% or 3,504 individuals in the labor force. Within the labor force, individuals with high school diploma education have the highest percentage of unemployment, with 2.2% or 71 of them being unemployed.
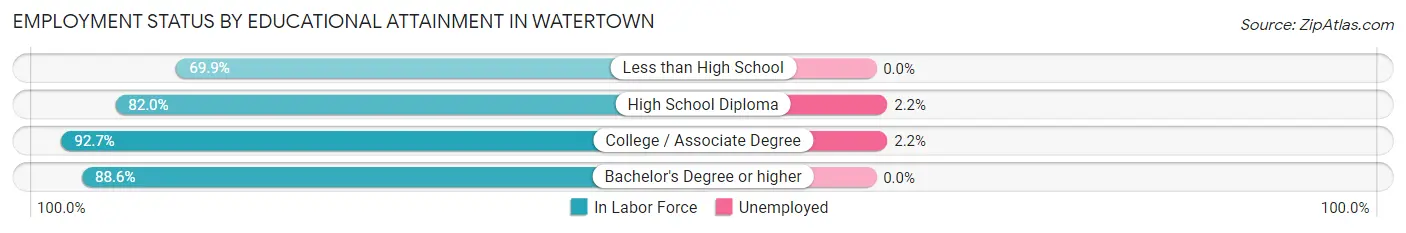
| Educational Attainment | In Labor Force | Unemployed |
| Less than High School | 668 (69.9%) | 0 (0.0%) |
| High School Diploma | 3,219 (82.0%) | 86 (2.2%) |
| College / Associate Degree | 3,504 (92.7%) | 83 (2.2%) |
| Bachelor's Degree or higher | 2,191 (88.6%) | 0 (0.0%) |
| Total | 9,586 (86.1%) | 167 (1.5%) |
Employment Occupations by Sex in Watertown
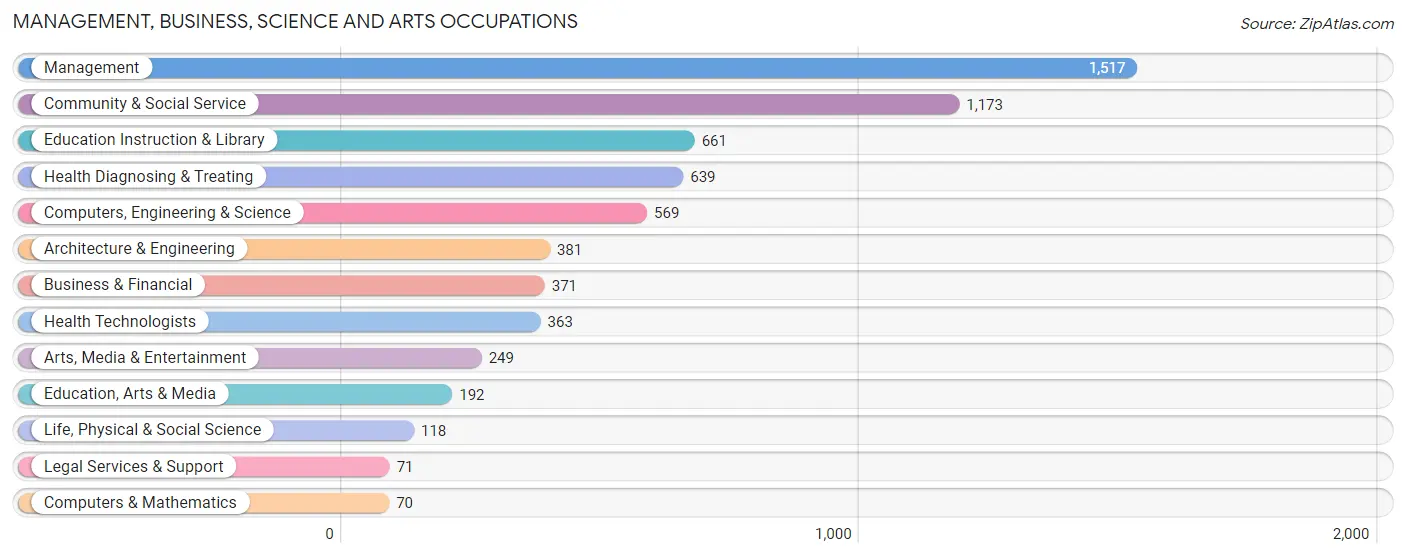
Management, Business, Science and Arts Occupations
The most common Management, Business, Science and Arts occupations in Watertown are Management (1,517 | 12.4%), Community & Social Service (1,173 | 9.6%), Education Instruction & Library (661 | 5.4%), Health Diagnosing & Treating (639 | 5.2%), and Computers, Engineering & Science (569 | 4.6%).
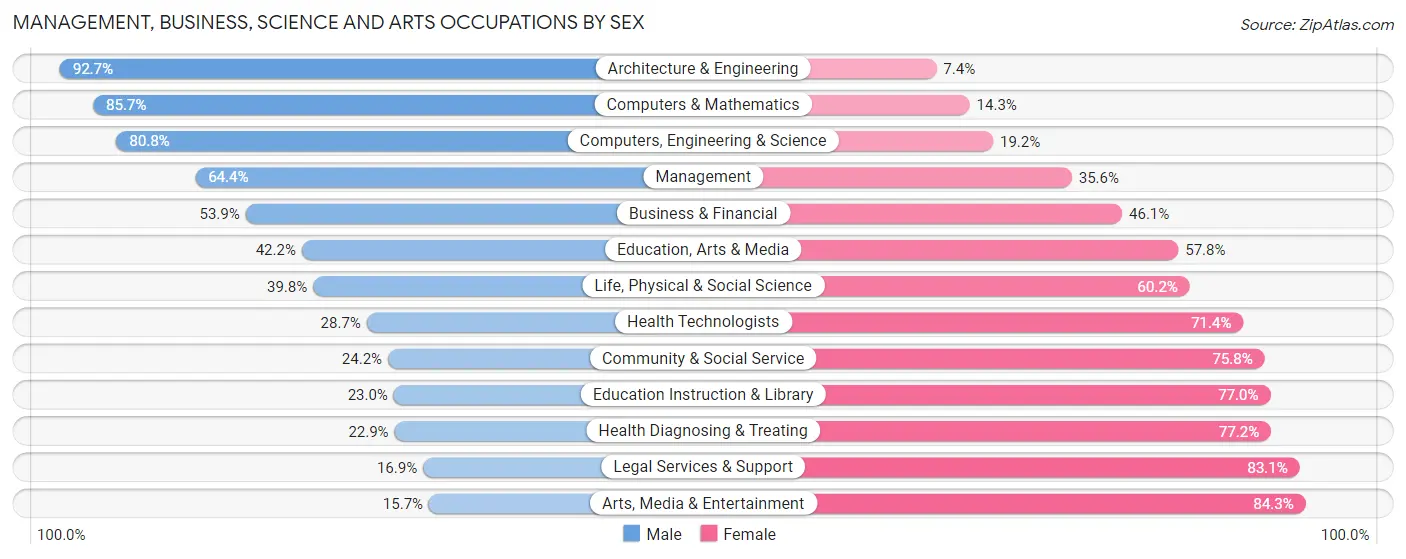
Management, Business, Science and Arts Occupations by Sex
Within the Management, Business, Science and Arts occupations in Watertown, the most male-oriented occupations are Architecture & Engineering (92.6%), Computers & Mathematics (85.7%), and Computers, Engineering & Science (80.8%), while the most female-oriented occupations are Arts, Media & Entertainment (84.3%), Legal Services & Support (83.1%), and Health Diagnosing & Treating (77.1%).
| Occupation | Male | Female |
| Management | 977 (64.4%) | 540 (35.6%) |
| Business & Financial | 200 (53.9%) | 171 (46.1%) |
| Computers, Engineering & Science | 460 (80.8%) | 109 (19.2%) |
| Computers & Mathematics | 60 (85.7%) | 10 (14.3%) |
| Architecture & Engineering | 353 (92.6%) | 28 (7.3%) |
| Life, Physical & Social Science | 47 (39.8%) | 71 (60.2%) |
| Community & Social Service | 284 (24.2%) | 889 (75.8%) |
| Education, Arts & Media | 81 (42.2%) | 111 (57.8%) |
| Legal Services & Support | 12 (16.9%) | 59 (83.1%) |
| Education Instruction & Library | 152 (23.0%) | 509 (77.0%) |
| Arts, Media & Entertainment | 39 (15.7%) | 210 (84.3%) |
| Health Diagnosing & Treating | 146 (22.9%) | 493 (77.1%) |
| Health Technologists | 104 (28.6%) | 259 (71.4%) |
| Total (Category) | 2,067 (48.4%) | 2,202 (51.6%) |
| Total (Overall) | 6,554 (53.6%) | 5,679 (46.4%) |
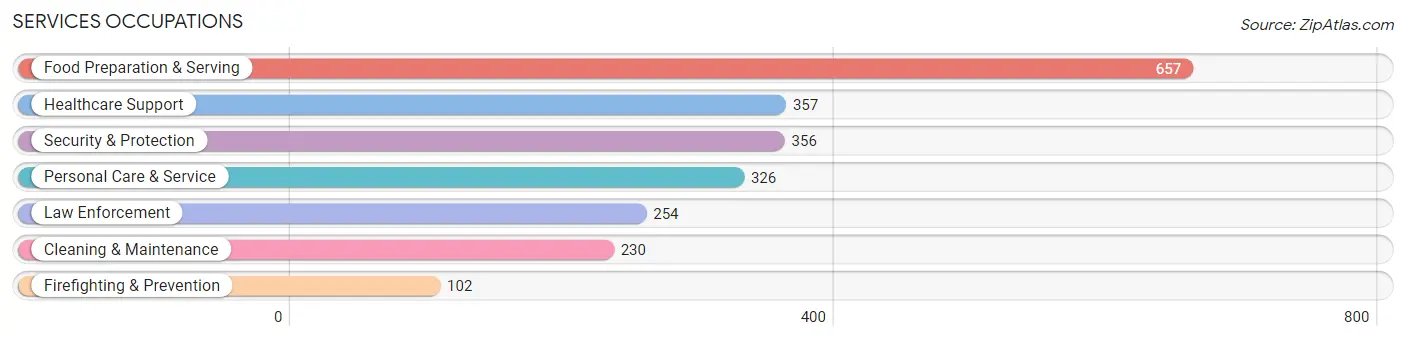
Services Occupations
The most common Services occupations in Watertown are Food Preparation & Serving (657 | 5.4%), Healthcare Support (357 | 2.9%), Security & Protection (356 | 2.9%), Personal Care & Service (326 | 2.7%), and Law Enforcement (254 | 2.1%).
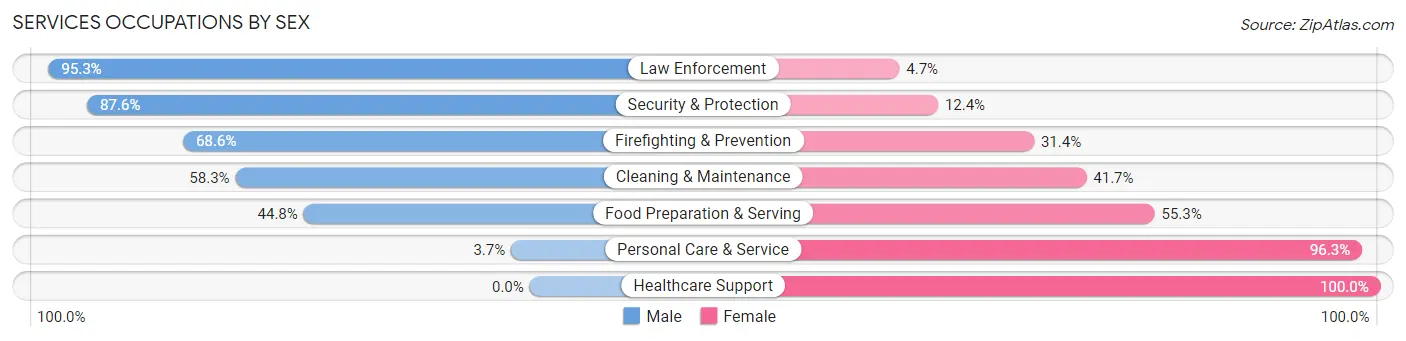
Services Occupations by Sex
Within the Services occupations in Watertown, the most male-oriented occupations are Law Enforcement (95.3%), Security & Protection (87.6%), and Firefighting & Prevention (68.6%), while the most female-oriented occupations are Healthcare Support (100.0%), Personal Care & Service (96.3%), and Food Preparation & Serving (55.2%).
| Occupation | Male | Female |
| Healthcare Support | 0 (0.0%) | 357 (100.0%) |
| Security & Protection | 312 (87.6%) | 44 (12.4%) |
| Firefighting & Prevention | 70 (68.6%) | 32 (31.4%) |
| Law Enforcement | 242 (95.3%) | 12 (4.7%) |
| Food Preparation & Serving | 294 (44.8%) | 363 (55.2%) |
| Cleaning & Maintenance | 134 (58.3%) | 96 (41.7%) |
| Personal Care & Service | 12 (3.7%) | 314 (96.3%) |
| Total (Category) | 752 (39.0%) | 1,174 (61.0%) |
| Total (Overall) | 6,554 (53.6%) | 5,679 (46.4%) |
Sales and Office Occupations
The most common Sales and Office occupations in Watertown are Office & Administration (1,344 | 11.0%), and Sales & Related (1,179 | 9.6%).
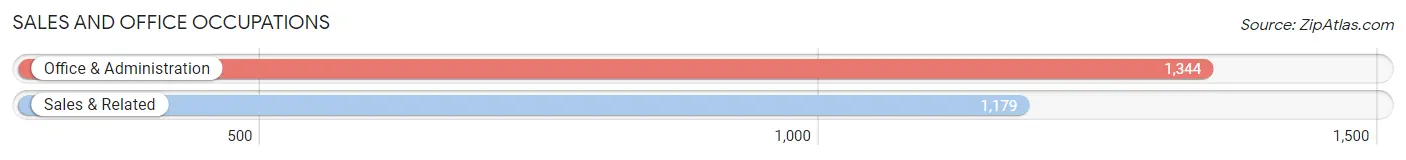
Sales and Office Occupations by Sex

| Occupation | Male | Female |
| Sales & Related | 643 (54.5%) | 536 (45.5%) |
| Office & Administration | 247 (18.4%) | 1,097 (81.6%) |
| Total (Category) | 890 (35.3%) | 1,633 (64.7%) |
| Total (Overall) | 6,554 (53.6%) | 5,679 (46.4%) |
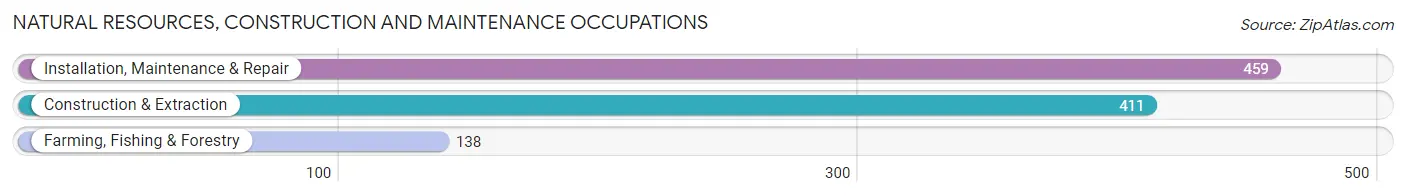
Natural Resources, Construction and Maintenance Occupations
The most common Natural Resources, Construction and Maintenance occupations in Watertown are Installation, Maintenance & Repair (459 | 3.7%), Construction & Extraction (411 | 3.4%), and Farming, Fishing & Forestry (138 | 1.1%).
Natural Resources, Construction and Maintenance Occupations by Sex
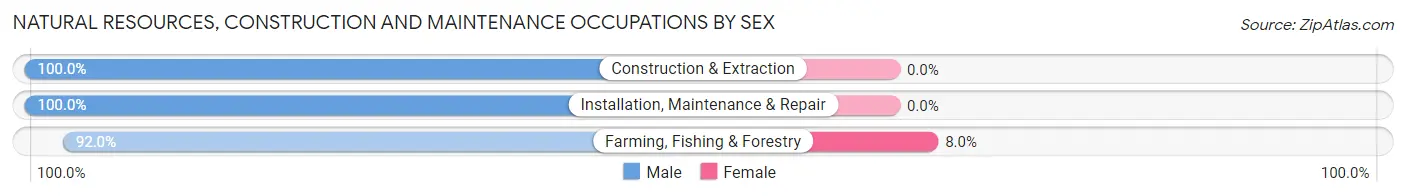
| Occupation | Male | Female |
| Farming, Fishing & Forestry | 127 (92.0%) | 11 (8.0%) |
| Construction & Extraction | 411 (100.0%) | 0 (0.0%) |
| Installation, Maintenance & Repair | 459 (100.0%) | 0 (0.0%) |
| Total (Category) | 997 (98.9%) | 11 (1.1%) |
| Total (Overall) | 6,554 (53.6%) | 5,679 (46.4%) |
Production, Transportation and Moving Occupations
The most common Production, Transportation and Moving occupations in Watertown are Production (1,347 | 11.0%), Material Moving (707 | 5.8%), and Transportation (453 | 3.7%).
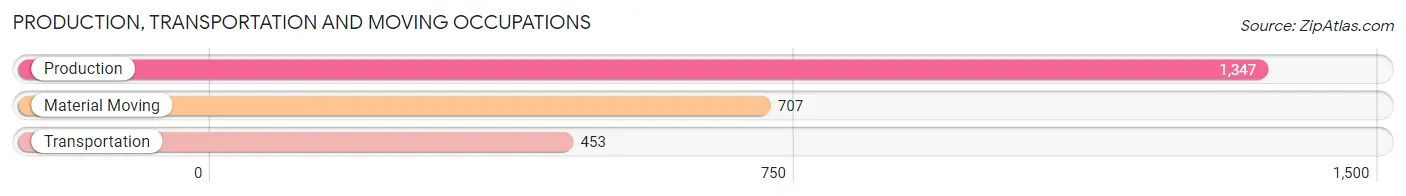
Production, Transportation and Moving Occupations by Sex
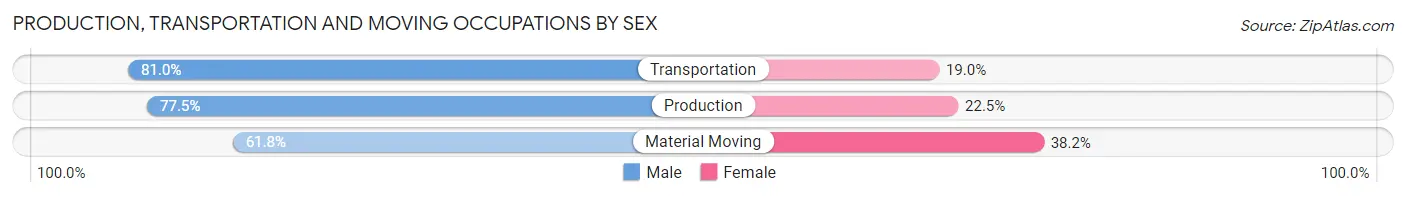
| Occupation | Male | Female |
| Production | 1,044 (77.5%) | 303 (22.5%) |
| Transportation | 367 (81.0%) | 86 (19.0%) |
| Material Moving | 437 (61.8%) | 270 (38.2%) |
| Total (Category) | 1,848 (73.7%) | 659 (26.3%) |
| Total (Overall) | 6,554 (53.6%) | 5,679 (46.4%) |
Employment Industries by Sex in Watertown
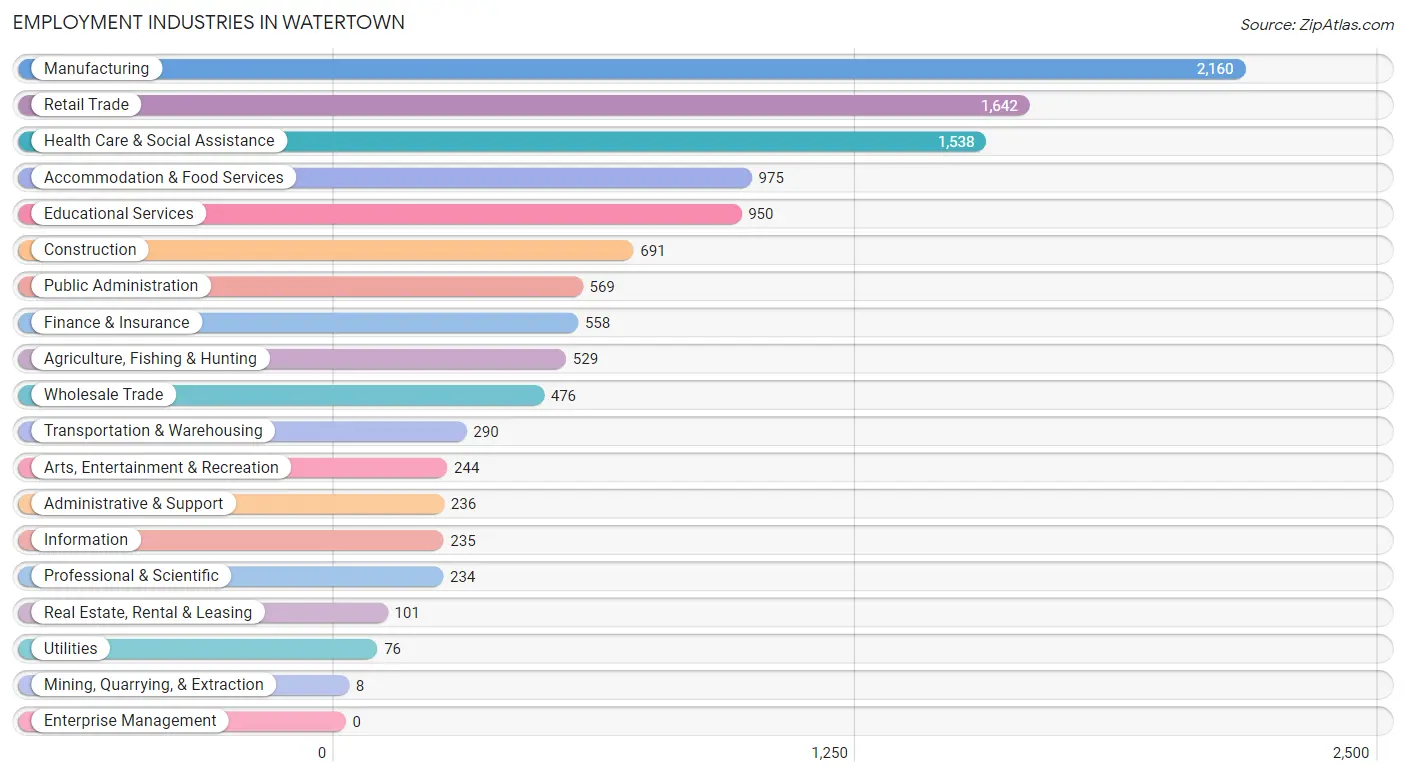
Employment Industries in Watertown
The major employment industries in Watertown include Manufacturing (2,160 | 17.7%), Retail Trade (1,642 | 13.4%), Health Care & Social Assistance (1,538 | 12.6%), Accommodation & Food Services (975 | 8.0%), and Educational Services (950 | 7.8%).
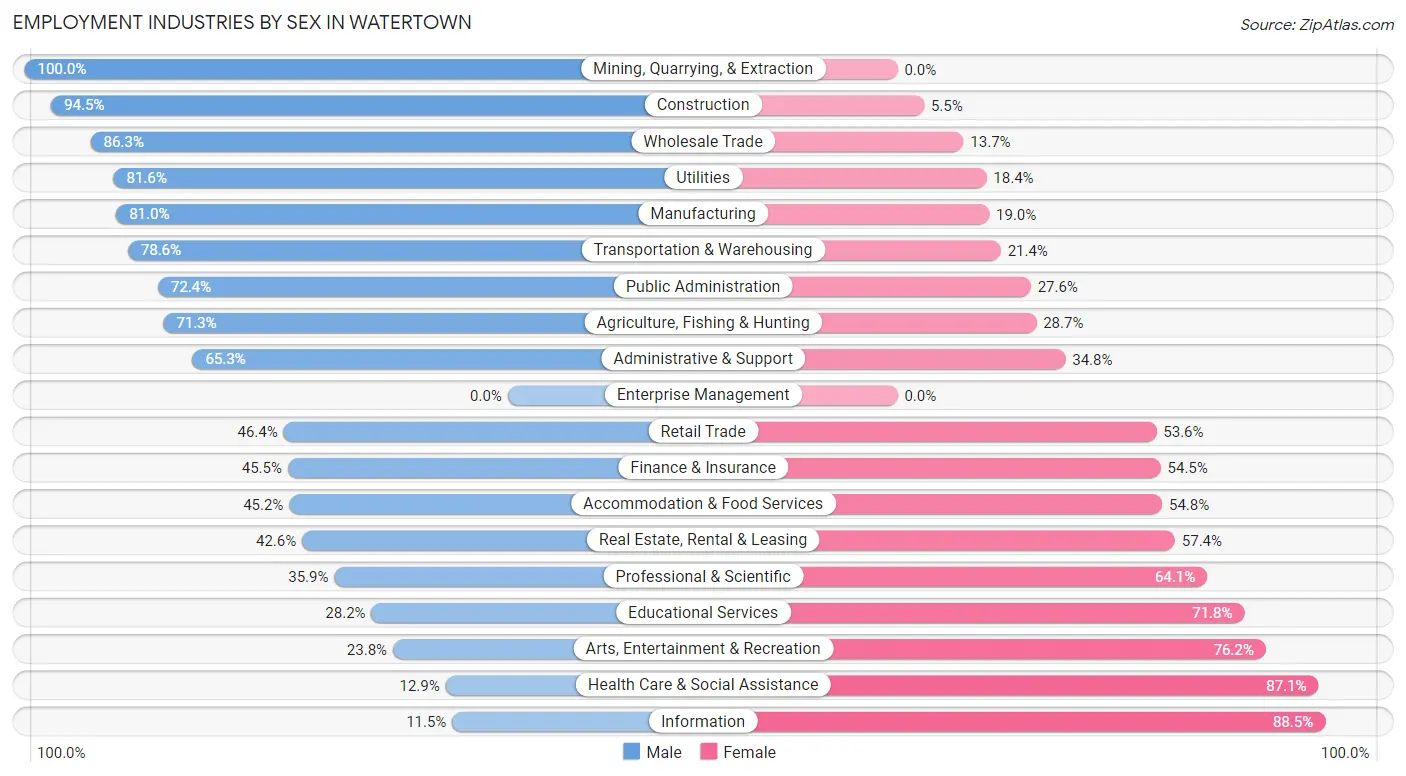
Employment Industries by Sex in Watertown
The Watertown industries that see more men than women are Mining, Quarrying, & Extraction (100.0%), Construction (94.5%), and Wholesale Trade (86.3%), whereas the industries that tend to have a higher number of women are Information (88.5%), Health Care & Social Assistance (87.1%), and Arts, Entertainment & Recreation (76.2%).
| Industry | Male | Female |
| Agriculture, Fishing & Hunting | 377 (71.3%) | 152 (28.7%) |
| Mining, Quarrying, & Extraction | 8 (100.0%) | 0 (0.0%) |
| Construction | 653 (94.5%) | 38 (5.5%) |
| Manufacturing | 1,750 (81.0%) | 410 (19.0%) |
| Wholesale Trade | 411 (86.3%) | 65 (13.7%) |
| Retail Trade | 762 (46.4%) | 880 (53.6%) |
| Transportation & Warehousing | 228 (78.6%) | 62 (21.4%) |
| Utilities | 62 (81.6%) | 14 (18.4%) |
| Information | 27 (11.5%) | 208 (88.5%) |
| Finance & Insurance | 254 (45.5%) | 304 (54.5%) |
| Real Estate, Rental & Leasing | 43 (42.6%) | 58 (57.4%) |
| Professional & Scientific | 84 (35.9%) | 150 (64.1%) |
| Enterprise Management | 0 (0.0%) | 0 (0.0%) |
| Administrative & Support | 154 (65.2%) | 82 (34.7%) |
| Educational Services | 268 (28.2%) | 682 (71.8%) |
| Health Care & Social Assistance | 198 (12.9%) | 1,340 (87.1%) |
| Arts, Entertainment & Recreation | 58 (23.8%) | 186 (76.2%) |
| Accommodation & Food Services | 441 (45.2%) | 534 (54.8%) |
| Public Administration | 412 (72.4%) | 157 (27.6%) |
| Total | 6,554 (53.6%) | 5,679 (46.4%) |
Education in Watertown
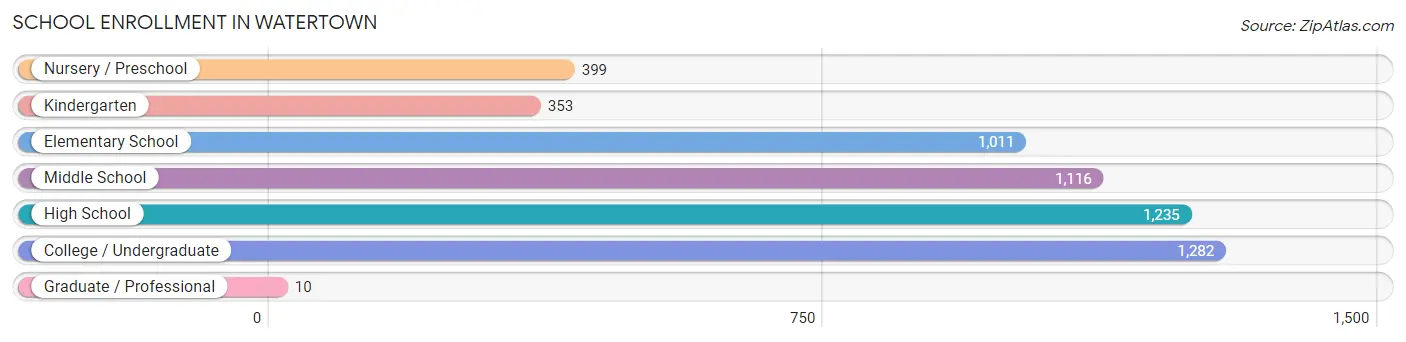
School Enrollment in Watertown
The most common levels of schooling among the 5,406 students in Watertown are college / undergraduate (1,282 | 23.7%), high school (1,235 | 22.8%), and middle school (1,116 | 20.6%).
| School Level | # Students | % Students |
| Nursery / Preschool | 399 | 7.4% |
| Kindergarten | 353 | 6.5% |
| Elementary School | 1,011 | 18.7% |
| Middle School | 1,116 | 20.6% |
| High School | 1,235 | 22.8% |
| College / Undergraduate | 1,282 | 23.7% |
| Graduate / Professional | 10 | 0.2% |
| Total | 5,406 | 100.0% |
School Enrollment by Age by Funding Source in Watertown
Out of a total of 5,406 students who are enrolled in schools in Watertown, 503 (9.3%) attend a private institution, while the remaining 4,903 (90.7%) are enrolled in public schools. The age group of 35 years and over has the highest likelihood of being enrolled in private schools, with 19 (33.3% in the age bracket) enrolled. Conversely, the age group of 20 to 24 year olds has the lowest likelihood of being enrolled in a private school, with 628 (96.6% in the age bracket) attending a public institution.
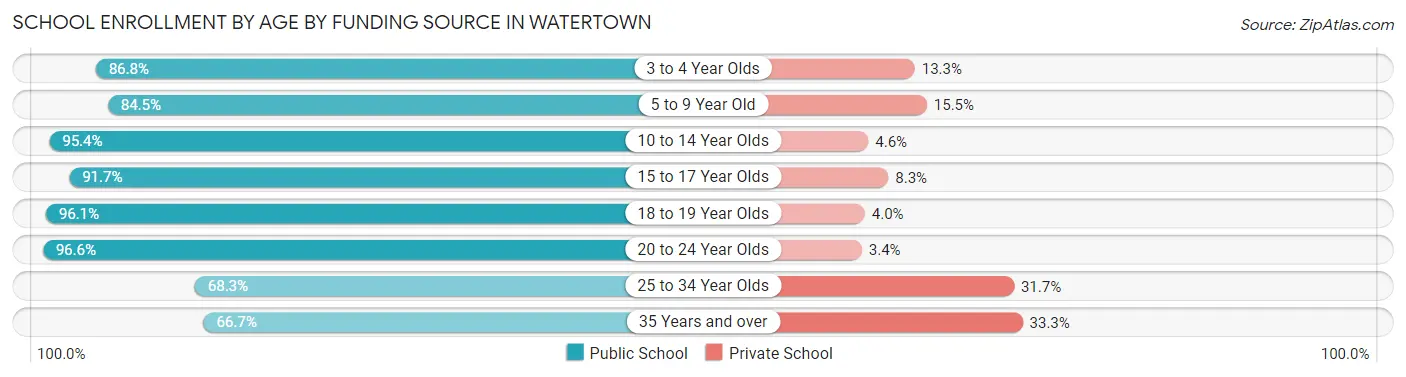
| Age Bracket | Public School | Private School |
| 3 to 4 Year Olds | 203 (86.8%) | 31 (13.3%) |
| 5 to 9 Year Old | 1,123 (84.5%) | 206 (15.5%) |
| 10 to 14 Year Olds | 1,390 (95.4%) | 67 (4.6%) |
| 15 to 17 Year Olds | 881 (91.7%) | 80 (8.3%) |
| 18 to 19 Year Olds | 511 (96.1%) | 21 (4.0%) |
| 20 to 24 Year Olds | 628 (96.6%) | 22 (3.4%) |
| 25 to 34 Year Olds | 127 (68.3%) | 59 (31.7%) |
| 35 Years and over | 38 (66.7%) | 19 (33.3%) |
| Total | 4,903 (90.7%) | 503 (9.3%) |
Educational Attainment by Field of Study in Watertown
Education (920 | 25.9%), business (562 | 15.8%), social sciences (329 | 9.2%), science & technology (262 | 7.4%), and literature & languages (216 | 6.1%) are the most common fields of study among 3,558 individuals in Watertown who have obtained a bachelor's degree or higher.
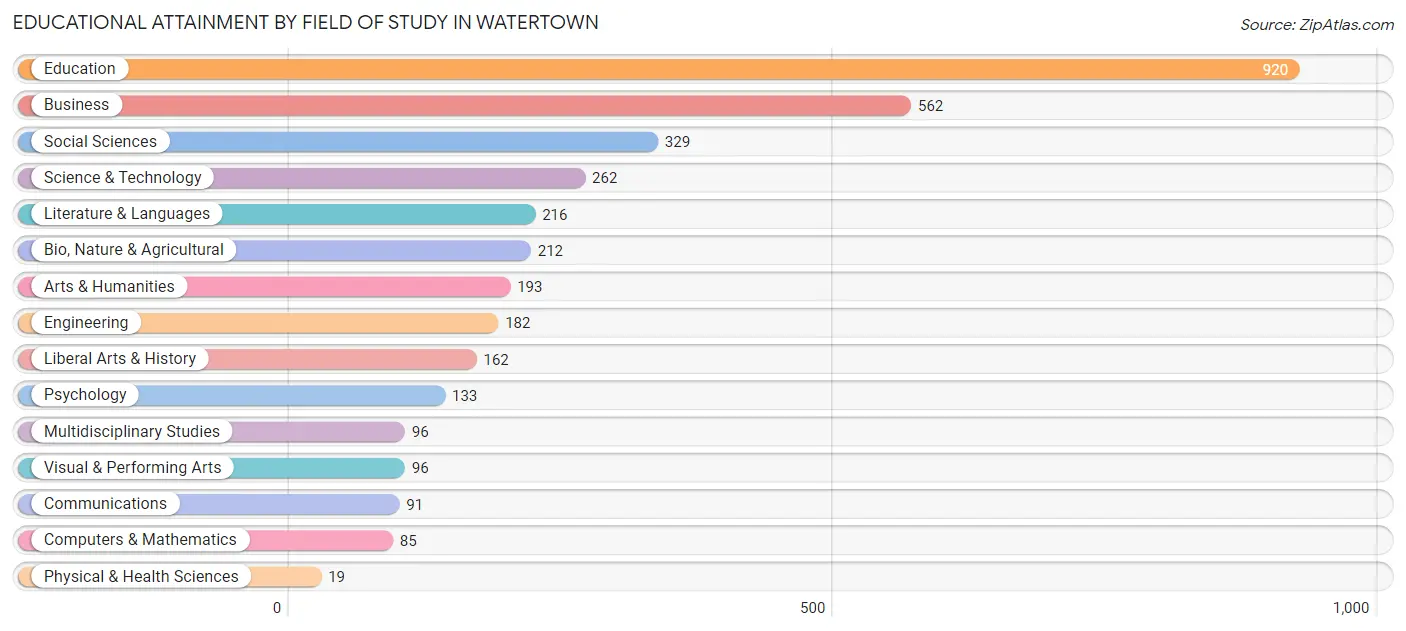
| Field of Study | # Graduates | % Graduates |
| Computers & Mathematics | 85 | 2.4% |
| Bio, Nature & Agricultural | 212 | 6.0% |
| Physical & Health Sciences | 19 | 0.5% |
| Psychology | 133 | 3.7% |
| Social Sciences | 329 | 9.2% |
| Engineering | 182 | 5.1% |
| Multidisciplinary Studies | 96 | 2.7% |
| Science & Technology | 262 | 7.4% |
| Business | 562 | 15.8% |
| Education | 920 | 25.9% |
| Literature & Languages | 216 | 6.1% |
| Liberal Arts & History | 162 | 4.5% |
| Visual & Performing Arts | 96 | 2.7% |
| Communications | 91 | 2.6% |
| Arts & Humanities | 193 | 5.4% |
| Total | 3,558 | 100.0% |
Transportation & Commute in Watertown
Vehicle Availability by Sex in Watertown
The most prevalent vehicle ownership categories in Watertown are males with 2 vehicles (2,864, accounting for 44.2%) and females with 2 vehicles (2,286, making up 51.2%).
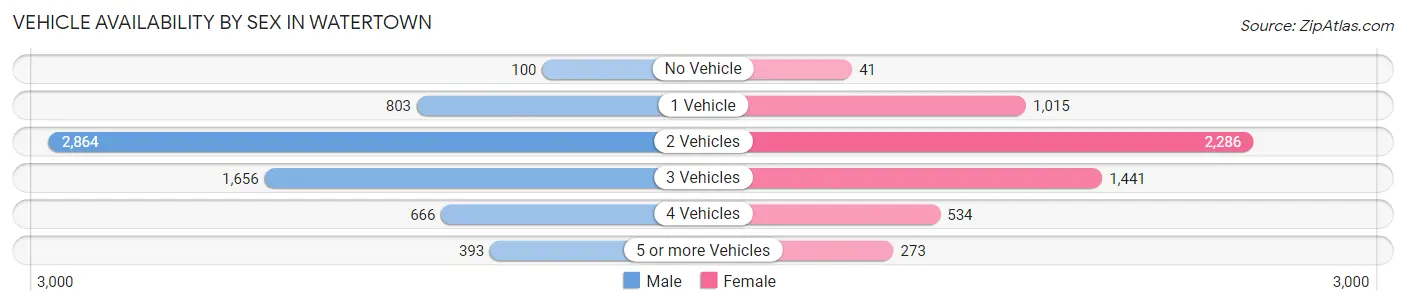
| Vehicles Available | Male | Female |
| No Vehicle | 100 (1.5%) | 41 (0.7%) |
| 1 Vehicle | 803 (12.4%) | 1,015 (18.2%) |
| 2 Vehicles | 2,864 (44.2%) | 2,286 (40.9%) |
| 3 Vehicles | 1,656 (25.6%) | 1,441 (25.8%) |
| 4 Vehicles | 666 (10.3%) | 534 (9.6%) |
| 5 or more Vehicles | 393 (6.1%) | 273 (4.9%) |
| Total | 6,482 (100.0%) | 5,590 (100.0%) |
Commute Time in Watertown
The most frequently occuring commute durations in Watertown are 10 to 14 minutes (4,081 commuters, 35.0%), 5 to 9 minutes (3,402 commuters, 29.2%), and 15 to 19 minutes (1,425 commuters, 12.2%).
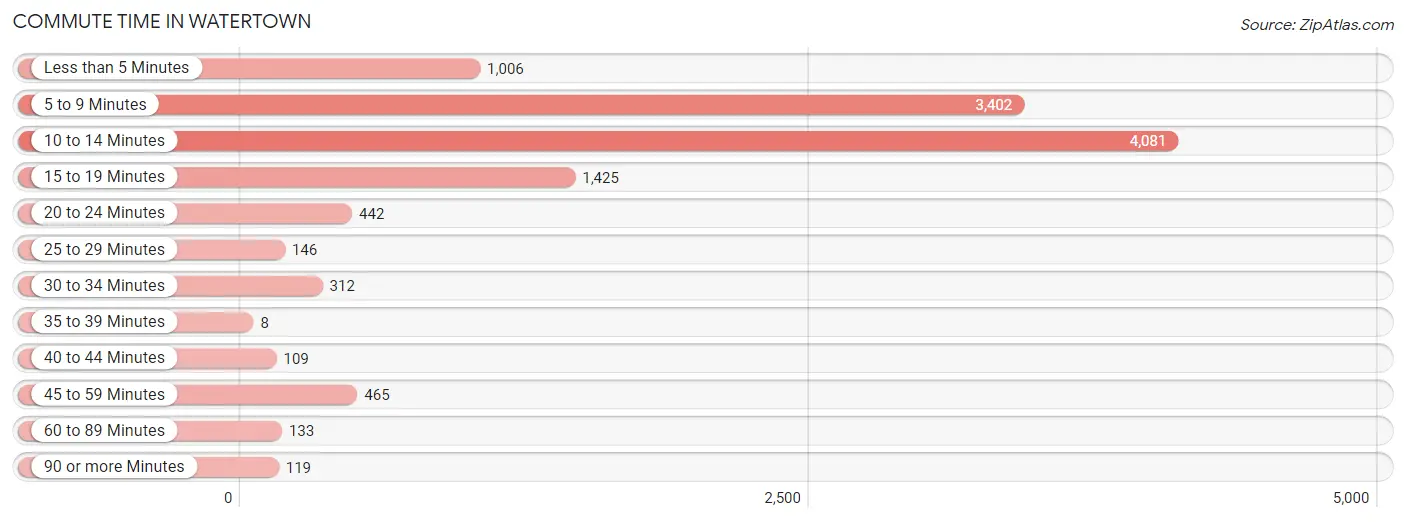
| Commute Time | # Commuters | % Commuters |
| Less than 5 Minutes | 1,006 | 8.6% |
| 5 to 9 Minutes | 3,402 | 29.2% |
| 10 to 14 Minutes | 4,081 | 35.0% |
| 15 to 19 Minutes | 1,425 | 12.2% |
| 20 to 24 Minutes | 442 | 3.8% |
| 25 to 29 Minutes | 146 | 1.3% |
| 30 to 34 Minutes | 312 | 2.7% |
| 35 to 39 Minutes | 8 | 0.1% |
| 40 to 44 Minutes | 109 | 0.9% |
| 45 to 59 Minutes | 465 | 4.0% |
| 60 to 89 Minutes | 133 | 1.1% |
| 90 or more Minutes | 119 | 1.0% |
Commute Time by Sex in Watertown
The most common commute times in Watertown are 10 to 14 minutes (2,182 commuters, 34.7%) for males and 10 to 14 minutes (1,899 commuters, 35.4%) for females.
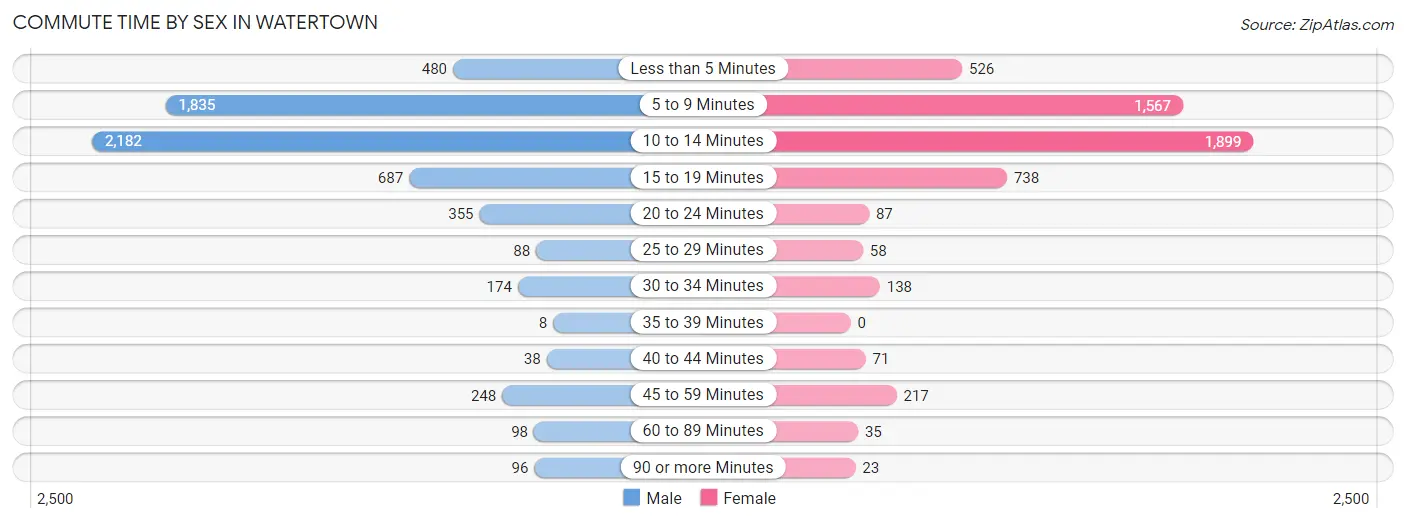
| Commute Time | Male | Female |
| Less than 5 Minutes | 480 (7.6%) | 526 (9.8%) |
| 5 to 9 Minutes | 1,835 (29.2%) | 1,567 (29.2%) |
| 10 to 14 Minutes | 2,182 (34.7%) | 1,899 (35.4%) |
| 15 to 19 Minutes | 687 (10.9%) | 738 (13.8%) |
| 20 to 24 Minutes | 355 (5.6%) | 87 (1.6%) |
| 25 to 29 Minutes | 88 (1.4%) | 58 (1.1%) |
| 30 to 34 Minutes | 174 (2.8%) | 138 (2.6%) |
| 35 to 39 Minutes | 8 (0.1%) | 0 (0.0%) |
| 40 to 44 Minutes | 38 (0.6%) | 71 (1.3%) |
| 45 to 59 Minutes | 248 (3.9%) | 217 (4.1%) |
| 60 to 89 Minutes | 98 (1.6%) | 35 (0.6%) |
| 90 or more Minutes | 96 (1.5%) | 23 (0.4%) |
Time of Departure to Work by Sex in Watertown
The most frequent times of departure to work in Watertown are 7:30 AM to 7:59 AM (1,254, 19.9%) for males and 7:30 AM to 7:59 AM (1,328, 24.8%) for females.
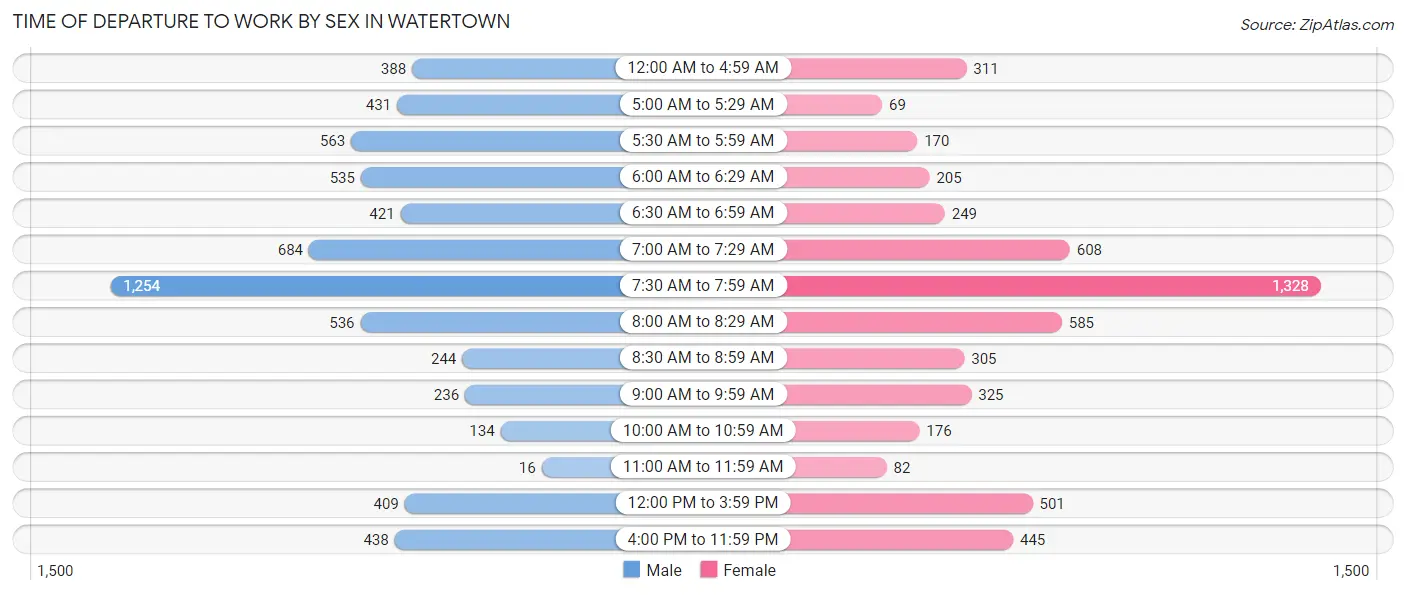
| Time of Departure | Male | Female |
| 12:00 AM to 4:59 AM | 388 (6.2%) | 311 (5.8%) |
| 5:00 AM to 5:29 AM | 431 (6.9%) | 69 (1.3%) |
| 5:30 AM to 5:59 AM | 563 (8.9%) | 170 (3.2%) |
| 6:00 AM to 6:29 AM | 535 (8.5%) | 205 (3.8%) |
| 6:30 AM to 6:59 AM | 421 (6.7%) | 249 (4.6%) |
| 7:00 AM to 7:29 AM | 684 (10.9%) | 608 (11.4%) |
| 7:30 AM to 7:59 AM | 1,254 (19.9%) | 1,328 (24.8%) |
| 8:00 AM to 8:29 AM | 536 (8.5%) | 585 (10.9%) |
| 8:30 AM to 8:59 AM | 244 (3.9%) | 305 (5.7%) |
| 9:00 AM to 9:59 AM | 236 (3.7%) | 325 (6.1%) |
| 10:00 AM to 10:59 AM | 134 (2.1%) | 176 (3.3%) |
| 11:00 AM to 11:59 AM | 16 (0.3%) | 82 (1.5%) |
| 12:00 PM to 3:59 PM | 409 (6.5%) | 501 (9.3%) |
| 4:00 PM to 11:59 PM | 438 (7.0%) | 445 (8.3%) |
| Total | 6,289 (100.0%) | 5,359 (100.0%) |
Housing Occupancy in Watertown
Occupancy by Ownership in Watertown
Of the total 10,018 dwellings in Watertown, owner-occupied units account for 6,255 (62.4%), while renter-occupied units make up 3,763 (37.6%).
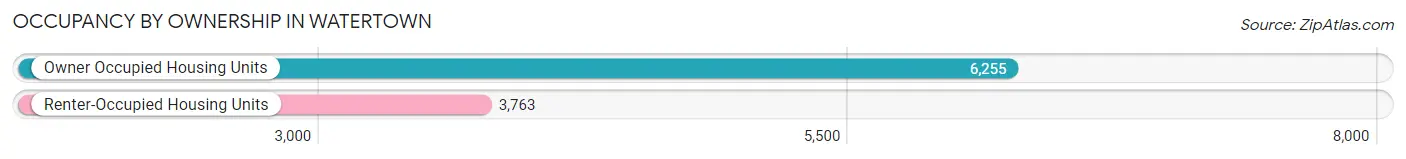
| Occupancy | # Housing Units | % Housing Units |
| Owner Occupied Housing Units | 6,255 | 62.4% |
| Renter-Occupied Housing Units | 3,763 | 37.6% |
| Total Occupied Housing Units | 10,018 | 100.0% |
Occupancy by Household Size in Watertown
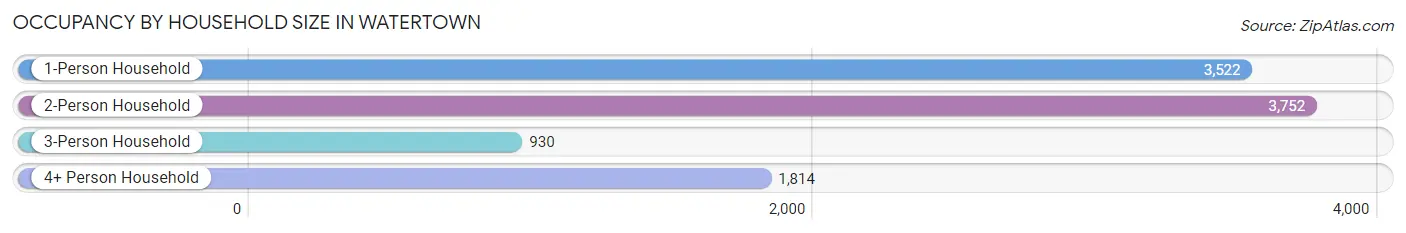
| Household Size | # Housing Units | % Housing Units |
| 1-Person Household | 3,522 | 35.2% |
| 2-Person Household | 3,752 | 37.4% |
| 3-Person Household | 930 | 9.3% |
| 4+ Person Household | 1,814 | 18.1% |
| Total Housing Units | 10,018 | 100.0% |
Occupancy by Ownership by Household Size in Watertown
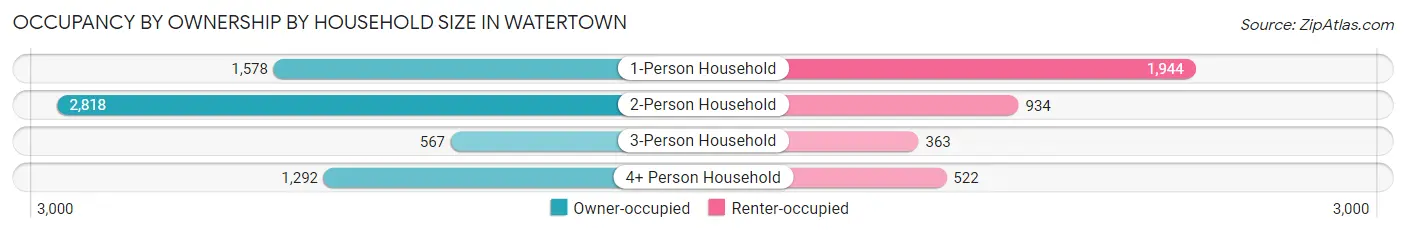
| Household Size | Owner-occupied | Renter-occupied |
| 1-Person Household | 1,578 (44.8%) | 1,944 (55.2%) |
| 2-Person Household | 2,818 (75.1%) | 934 (24.9%) |
| 3-Person Household | 567 (61.0%) | 363 (39.0%) |
| 4+ Person Household | 1,292 (71.2%) | 522 (28.8%) |
| Total Housing Units | 6,255 (62.4%) | 3,763 (37.6%) |
Occupancy by Educational Attainment in Watertown
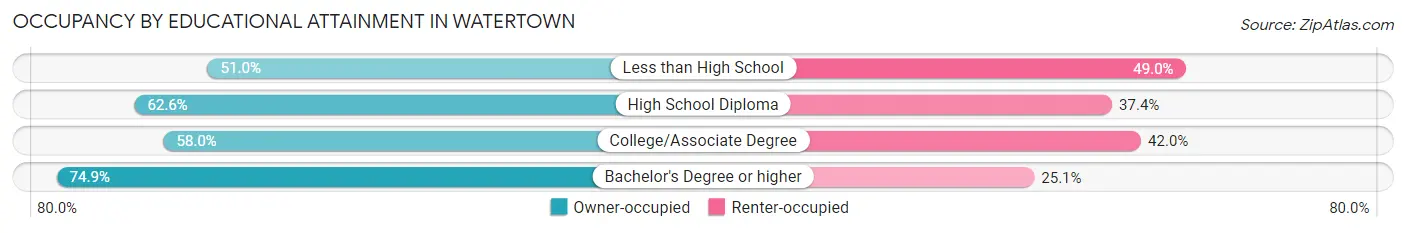
| Household Size | Owner-occupied | Renter-occupied |
| Less than High School | 426 (51.0%) | 410 (49.0%) |
| High School Diploma | 2,295 (62.6%) | 1,373 (37.4%) |
| College/Associate Degree | 2,041 (58.0%) | 1,480 (42.0%) |
| Bachelor's Degree or higher | 1,493 (74.9%) | 500 (25.1%) |
Occupancy by Age of Householder in Watertown
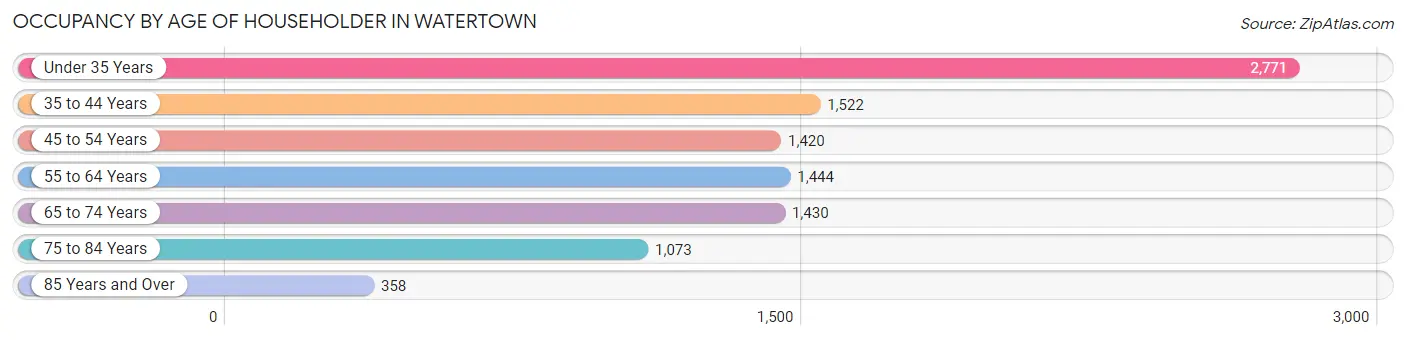
| Age Bracket | # Households | % Households |
| Under 35 Years | 2,771 | 27.7% |
| 35 to 44 Years | 1,522 | 15.2% |
| 45 to 54 Years | 1,420 | 14.2% |
| 55 to 64 Years | 1,444 | 14.4% |
| 65 to 74 Years | 1,430 | 14.3% |
| 75 to 84 Years | 1,073 | 10.7% |
| 85 Years and Over | 358 | 3.6% |
| Total | 10,018 | 100.0% |
Housing Finances in Watertown
Median Income by Occupancy in Watertown
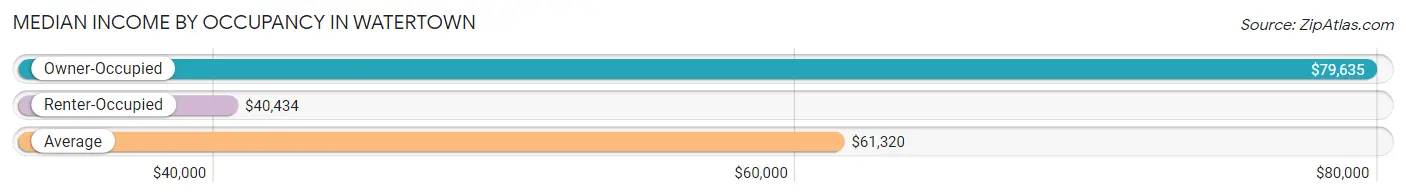
| Occupancy Type | # Households | Median Income |
| Owner-Occupied | 6,255 (62.4%) | $79,635 |
| Renter-Occupied | 3,763 (37.6%) | $40,434 |
| Average | 10,018 (100.0%) | $61,320 |
Occupancy by Householder Income Bracket in Watertown
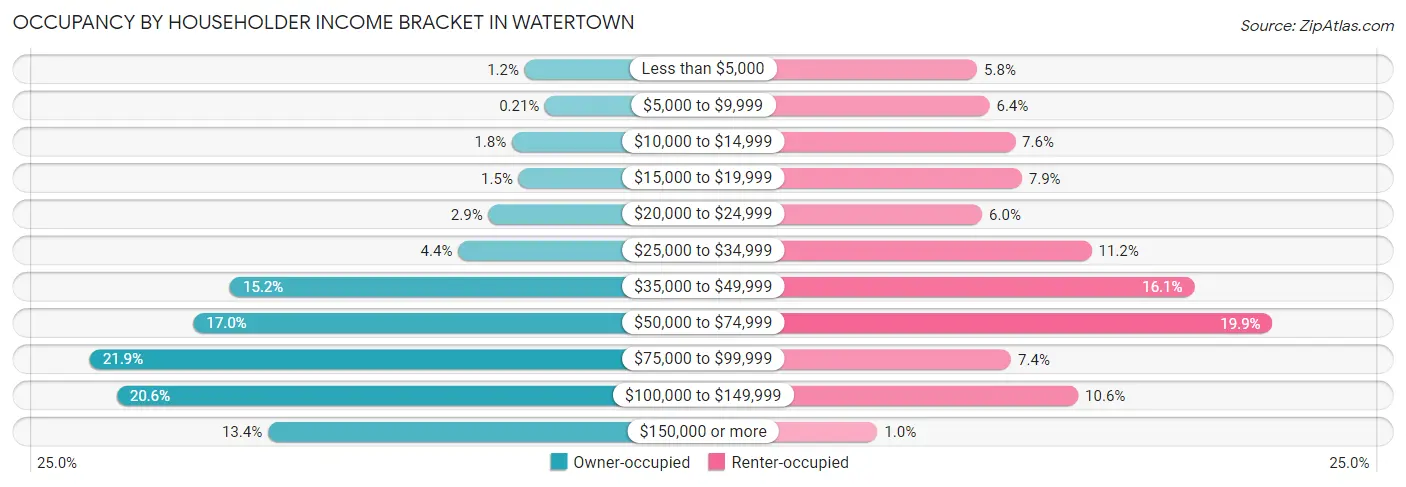
| Income Bracket | Owner-occupied | Renter-occupied |
| Less than $5,000 | 74 (1.2%) | 218 (5.8%) |
| $5,000 to $9,999 | 13 (0.2%) | 240 (6.4%) |
| $10,000 to $14,999 | 112 (1.8%) | 286 (7.6%) |
| $15,000 to $19,999 | 92 (1.5%) | 298 (7.9%) |
| $20,000 to $24,999 | 182 (2.9%) | 227 (6.0%) |
| $25,000 to $34,999 | 272 (4.3%) | 423 (11.2%) |
| $35,000 to $49,999 | 952 (15.2%) | 607 (16.1%) |
| $50,000 to $74,999 | 1,061 (17.0%) | 747 (19.9%) |
| $75,000 to $99,999 | 1,369 (21.9%) | 279 (7.4%) |
| $100,000 to $149,999 | 1,289 (20.6%) | 399 (10.6%) |
| $150,000 or more | 839 (13.4%) | 39 (1.0%) |
| Total | 6,255 (100.0%) | 3,763 (100.0%) |
Monthly Housing Cost Tiers in Watertown
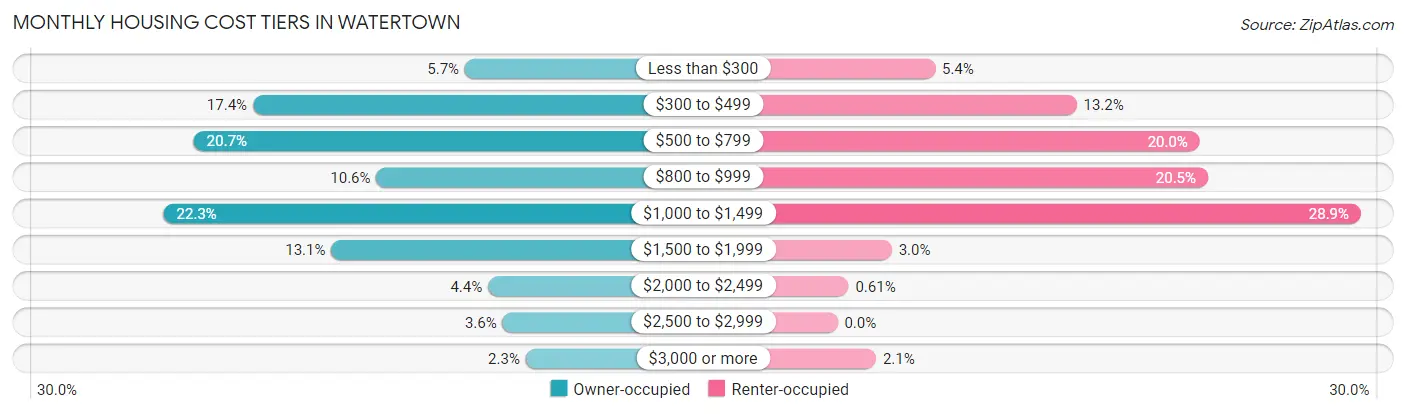
| Monthly Cost | Owner-occupied | Renter-occupied |
| Less than $300 | 355 (5.7%) | 203 (5.4%) |
| $300 to $499 | 1,088 (17.4%) | 497 (13.2%) |
| $500 to $799 | 1,292 (20.7%) | 753 (20.0%) |
| $800 to $999 | 661 (10.6%) | 770 (20.5%) |
| $1,000 to $1,499 | 1,397 (22.3%) | 1,088 (28.9%) |
| $1,500 to $1,999 | 817 (13.1%) | 113 (3.0%) |
| $2,000 to $2,499 | 275 (4.4%) | 23 (0.6%) |
| $2,500 to $2,999 | 225 (3.6%) | 0 (0.0%) |
| $3,000 or more | 145 (2.3%) | 80 (2.1%) |
| Total | 6,255 (100.0%) | 3,763 (100.0%) |
Physical Housing Characteristics in Watertown
Housing Structures in Watertown
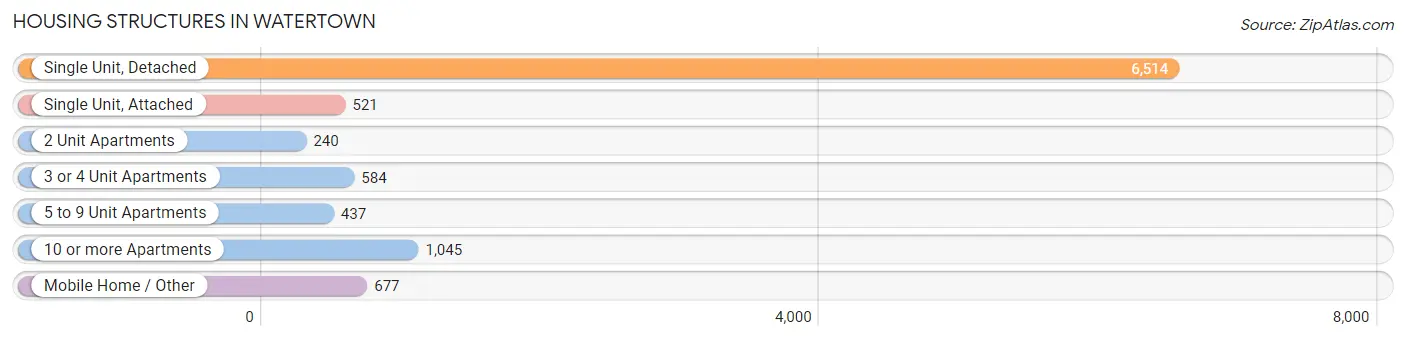
| Structure Type | # Housing Units | % Housing Units |
| Single Unit, Detached | 6,514 | 65.0% |
| Single Unit, Attached | 521 | 5.2% |
| 2 Unit Apartments | 240 | 2.4% |
| 3 or 4 Unit Apartments | 584 | 5.8% |
| 5 to 9 Unit Apartments | 437 | 4.4% |
| 10 or more Apartments | 1,045 | 10.4% |
| Mobile Home / Other | 677 | 6.8% |
| Total | 10,018 | 100.0% |
Housing Structures by Occupancy in Watertown
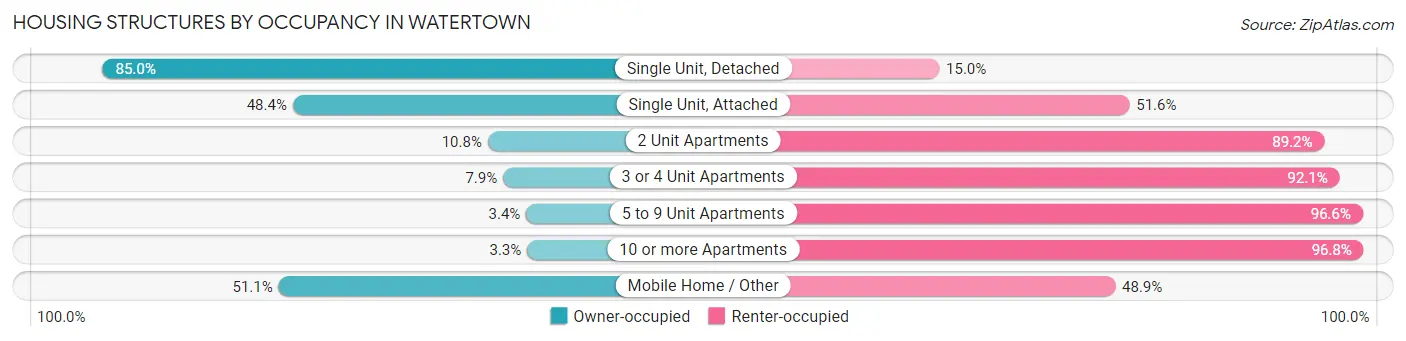
| Structure Type | Owner-occupied | Renter-occupied |
| Single Unit, Detached | 5,536 (85.0%) | 978 (15.0%) |
| Single Unit, Attached | 252 (48.4%) | 269 (51.6%) |
| 2 Unit Apartments | 26 (10.8%) | 214 (89.2%) |
| 3 or 4 Unit Apartments | 46 (7.9%) | 538 (92.1%) |
| 5 to 9 Unit Apartments | 15 (3.4%) | 422 (96.6%) |
| 10 or more Apartments | 34 (3.3%) | 1,011 (96.8%) |
| Mobile Home / Other | 346 (51.1%) | 331 (48.9%) |
| Total | 6,255 (62.4%) | 3,763 (37.6%) |
Housing Structures by Number of Rooms in Watertown
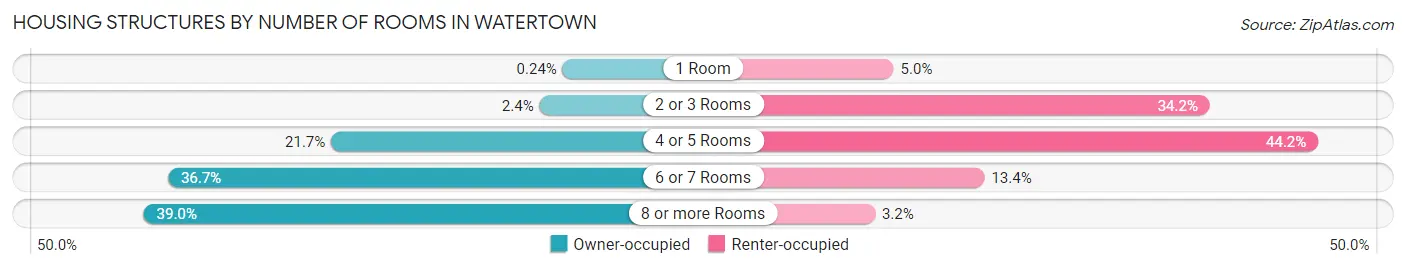
| Number of Rooms | Owner-occupied | Renter-occupied |
| 1 Room | 15 (0.2%) | 187 (5.0%) |
| 2 or 3 Rooms | 149 (2.4%) | 1,287 (34.2%) |
| 4 or 5 Rooms | 1,354 (21.6%) | 1,664 (44.2%) |
| 6 or 7 Rooms | 2,298 (36.7%) | 503 (13.4%) |
| 8 or more Rooms | 2,439 (39.0%) | 122 (3.2%) |
| Total | 6,255 (100.0%) | 3,763 (100.0%) |
Housing Structure by Heating Type in Watertown
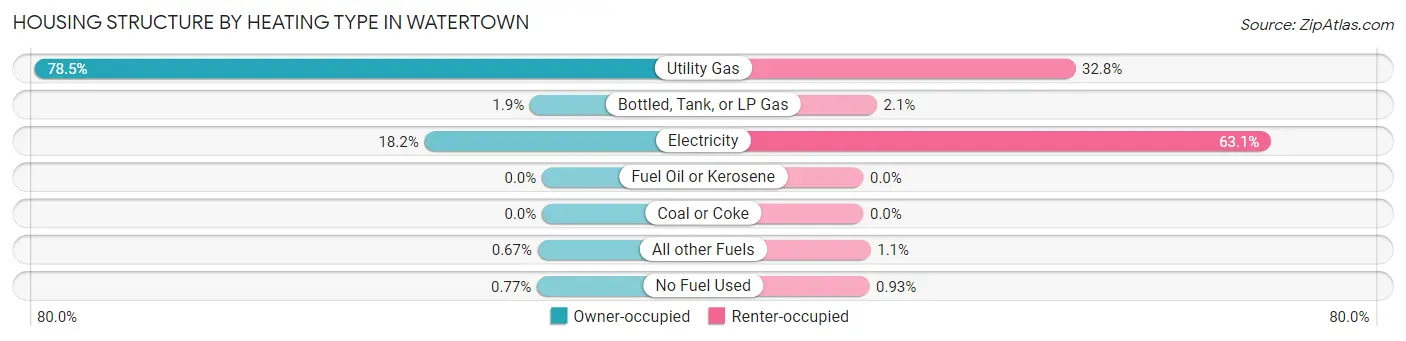
| Heating Type | Owner-occupied | Renter-occupied |
| Utility Gas | 4,911 (78.5%) | 1,233 (32.8%) |
| Bottled, Tank, or LP Gas | 117 (1.9%) | 79 (2.1%) |
| Electricity | 1,137 (18.2%) | 2,374 (63.1%) |
| Fuel Oil or Kerosene | 0 (0.0%) | 0 (0.0%) |
| Coal or Coke | 0 (0.0%) | 0 (0.0%) |
| All other Fuels | 42 (0.7%) | 42 (1.1%) |
| No Fuel Used | 48 (0.8%) | 35 (0.9%) |
| Total | 6,255 (100.0%) | 3,763 (100.0%) |
Household Vehicle Usage in Watertown
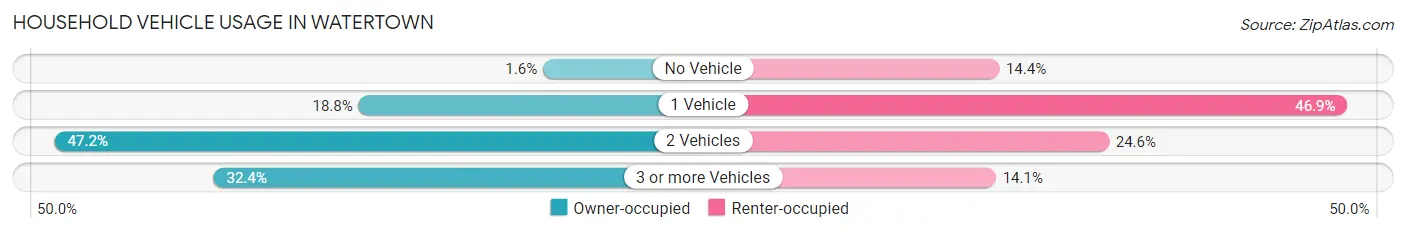
| Vehicles per Household | Owner-occupied | Renter-occupied |
| No Vehicle | 101 (1.6%) | 541 (14.4%) |
| 1 Vehicle | 1,178 (18.8%) | 1,765 (46.9%) |
| 2 Vehicles | 2,952 (47.2%) | 927 (24.6%) |
| 3 or more Vehicles | 2,024 (32.4%) | 530 (14.1%) |
| Total | 6,255 (100.0%) | 3,763 (100.0%) |
Real Estate & Mortgages in Watertown
Real Estate and Mortgage Overview in Watertown
| Characteristic | Without Mortgage | With Mortgage |
| Housing Units | 2,700 | 3,555 |
| Median Property Value | $194,600 | $200,500 |
| Median Household Income | $57,879 | $606 |
| Monthly Housing Costs | $487 | $145 |
| Real Estate Taxes | $2,355 | $151 |
Property Value by Mortgage Status in Watertown
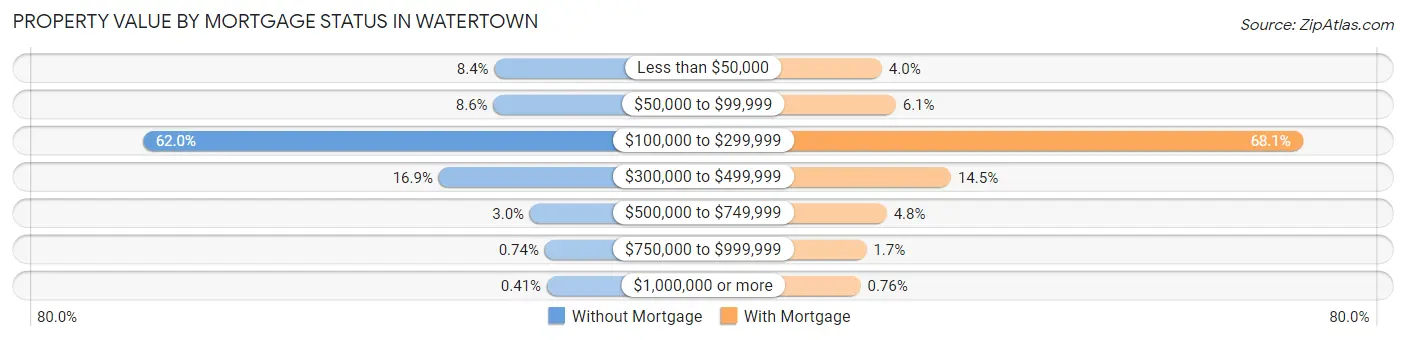
| Property Value | Without Mortgage | With Mortgage |
| Less than $50,000 | 227 (8.4%) | 143 (4.0%) |
| $50,000 to $99,999 | 231 (8.6%) | 218 (6.1%) |
| $100,000 to $299,999 | 1,674 (62.0%) | 2,422 (68.1%) |
| $300,000 to $499,999 | 456 (16.9%) | 517 (14.5%) |
| $500,000 to $749,999 | 81 (3.0%) | 169 (4.8%) |
| $750,000 to $999,999 | 20 (0.7%) | 59 (1.7%) |
| $1,000,000 or more | 11 (0.4%) | 27 (0.8%) |
| Total | 2,700 (100.0%) | 3,555 (100.0%) |
Household Income by Mortgage Status in Watertown
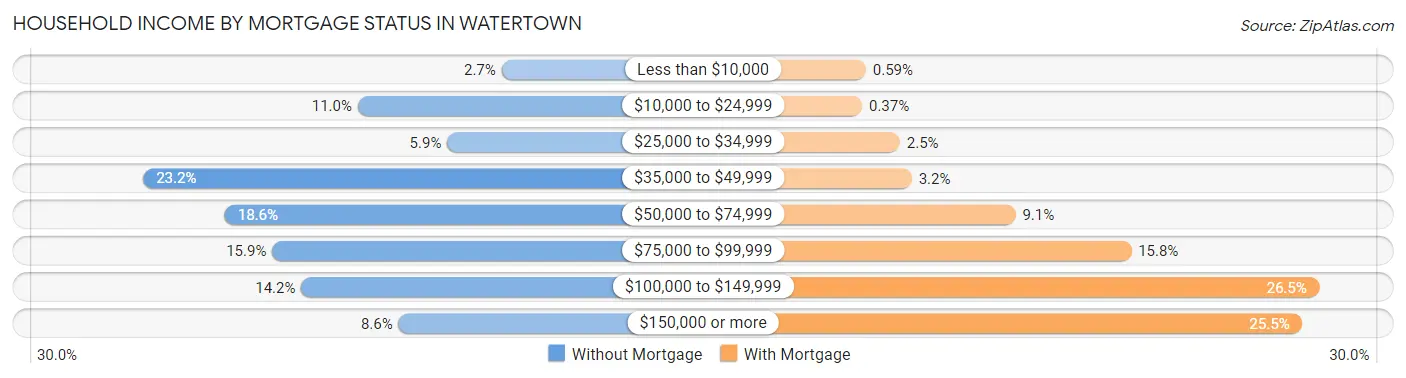
| Household Income | Without Mortgage | With Mortgage |
| Less than $10,000 | 74 (2.7%) | 21 (0.6%) |
| $10,000 to $24,999 | 296 (11.0%) | 13 (0.4%) |
| $25,000 to $34,999 | 158 (5.9%) | 90 (2.5%) |
| $35,000 to $49,999 | 627 (23.2%) | 114 (3.2%) |
| $50,000 to $74,999 | 501 (18.6%) | 325 (9.1%) |
| $75,000 to $99,999 | 428 (15.9%) | 560 (15.8%) |
| $100,000 to $149,999 | 383 (14.2%) | 941 (26.5%) |
| $150,000 or more | 233 (8.6%) | 906 (25.5%) |
| Total | 2,700 (100.0%) | 3,555 (100.0%) |
Property Value to Household Income Ratio in Watertown
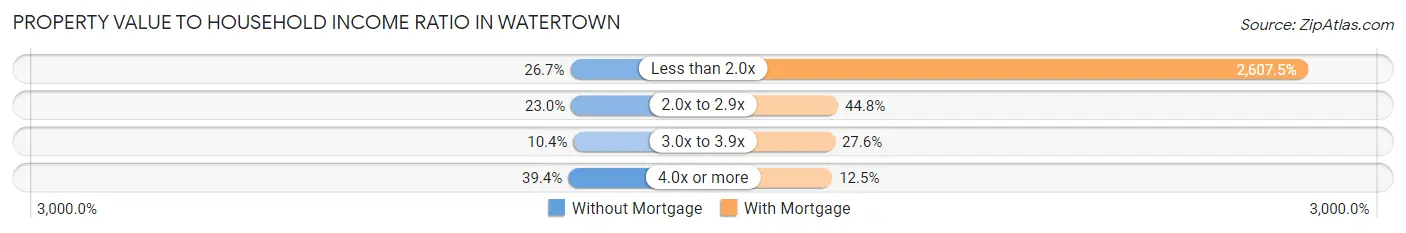
| Value-to-Income Ratio | Without Mortgage | With Mortgage |
| Less than 2.0x | 721 (26.7%) | 92,695 (2,607.5%) |
| 2.0x to 2.9x | 620 (23.0%) | 1,591 (44.8%) |
| 3.0x to 3.9x | 282 (10.4%) | 980 (27.6%) |
| 4.0x or more | 1,063 (39.4%) | 444 (12.5%) |
| Total | 2,700 (100.0%) | 3,555 (100.0%) |
Real Estate Taxes by Mortgage Status in Watertown
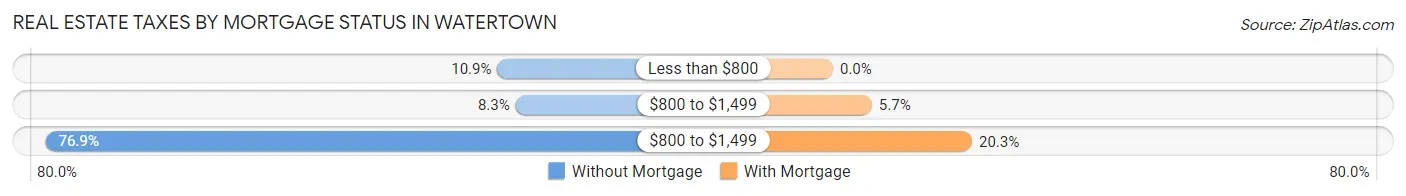
| Property Taxes | Without Mortgage | With Mortgage |
| Less than $800 | 295 (10.9%) | 0 (0.0%) |
| $800 to $1,499 | 223 (8.3%) | 202 (5.7%) |
| $800 to $1,499 | 2,077 (76.9%) | 722 (20.3%) |
| Total | 2,700 (100.0%) | 3,555 (100.0%) |
Health & Disability in Watertown
Health Insurance Coverage by Age in Watertown
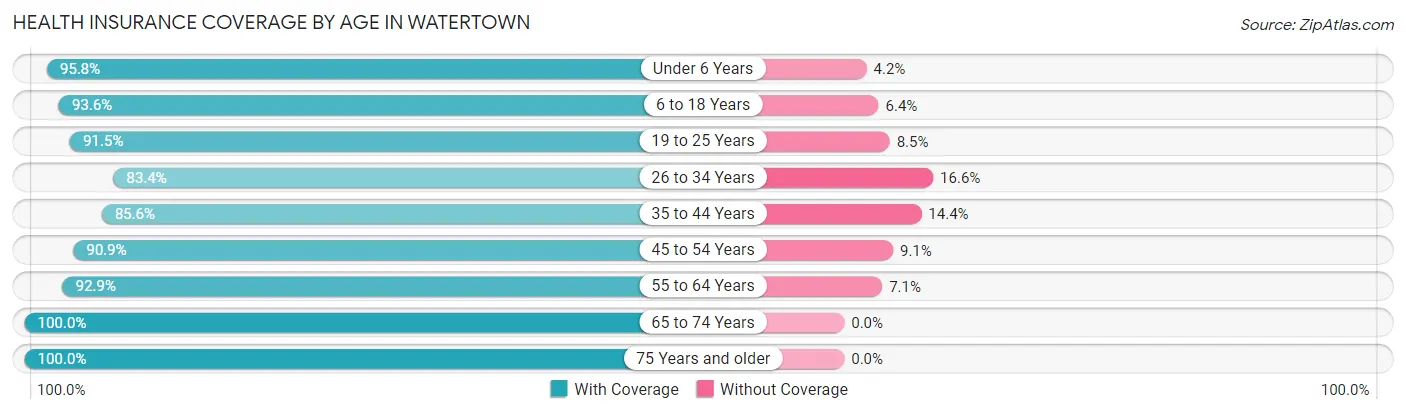
| Age Bracket | With Coverage | Without Coverage |
| Under 6 Years | 1,473 (95.8%) | 64 (4.2%) |
| 6 to 18 Years | 3,683 (93.6%) | 252 (6.4%) |
| 19 to 25 Years | 2,053 (91.5%) | 190 (8.5%) |
| 26 to 34 Years | 2,034 (83.4%) | 404 (16.6%) |
| 35 to 44 Years | 2,500 (85.6%) | 420 (14.4%) |
| 45 to 54 Years | 2,239 (90.9%) | 224 (9.1%) |
| 55 to 64 Years | 2,587 (92.9%) | 197 (7.1%) |
| 65 to 74 Years | 2,261 (100.0%) | 0 (0.0%) |
| 75 Years and older | 1,786 (100.0%) | 0 (0.0%) |
| Total | 20,616 (92.2%) | 1,751 (7.8%) |
Health Insurance Coverage by Citizenship Status in Watertown
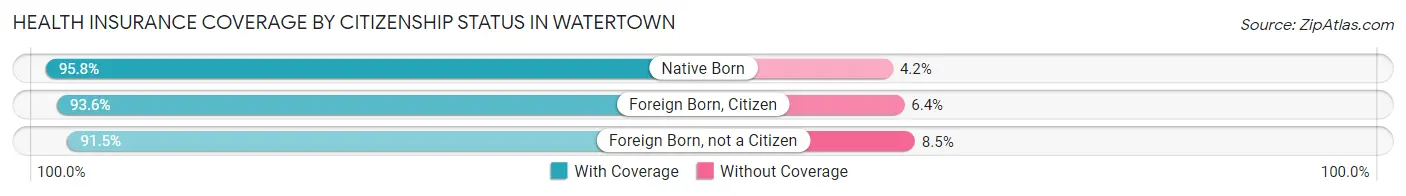
| Citizenship Status | With Coverage | Without Coverage |
| Native Born | 1,473 (95.8%) | 64 (4.2%) |
| Foreign Born, Citizen | 3,683 (93.6%) | 252 (6.4%) |
| Foreign Born, not a Citizen | 2,053 (91.5%) | 190 (8.5%) |
Health Insurance Coverage by Household Income in Watertown
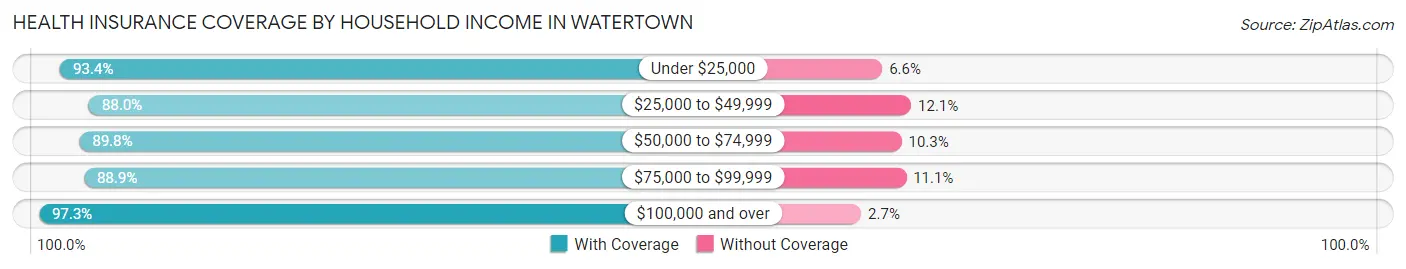
| Household Income | With Coverage | Without Coverage |
| Under $25,000 | 2,417 (93.4%) | 172 (6.6%) |
| $25,000 to $49,999 | 3,378 (87.9%) | 463 (12.0%) |
| $50,000 to $74,999 | 3,492 (89.7%) | 399 (10.2%) |
| $75,000 to $99,999 | 3,752 (88.9%) | 470 (11.1%) |
| $100,000 and over | 7,378 (97.3%) | 204 (2.7%) |
Public vs Private Health Insurance Coverage by Age in Watertown
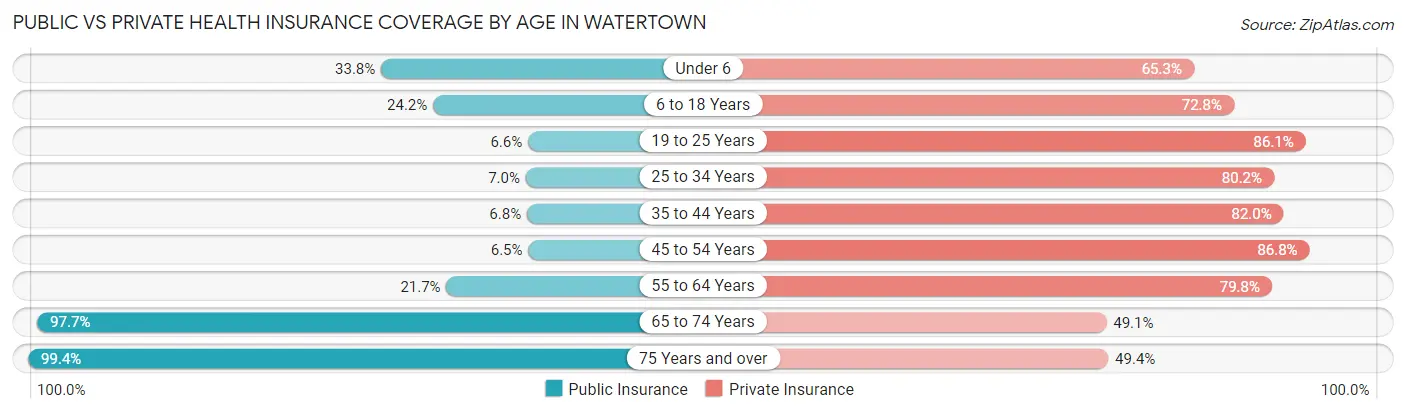
| Age Bracket | Public Insurance | Private Insurance |
| Under 6 | 520 (33.8%) | 1,004 (65.3%) |
| 6 to 18 Years | 951 (24.2%) | 2,863 (72.8%) |
| 19 to 25 Years | 147 (6.6%) | 1,931 (86.1%) |
| 25 to 34 Years | 170 (7.0%) | 1,955 (80.2%) |
| 35 to 44 Years | 197 (6.8%) | 2,394 (82.0%) |
| 45 to 54 Years | 160 (6.5%) | 2,138 (86.8%) |
| 55 to 64 Years | 604 (21.7%) | 2,222 (79.8%) |
| 65 to 74 Years | 2,208 (97.7%) | 1,110 (49.1%) |
| 75 Years and over | 1,775 (99.4%) | 883 (49.4%) |
| Total | 6,732 (30.1%) | 16,500 (73.8%) |
Disability Status by Sex by Age in Watertown
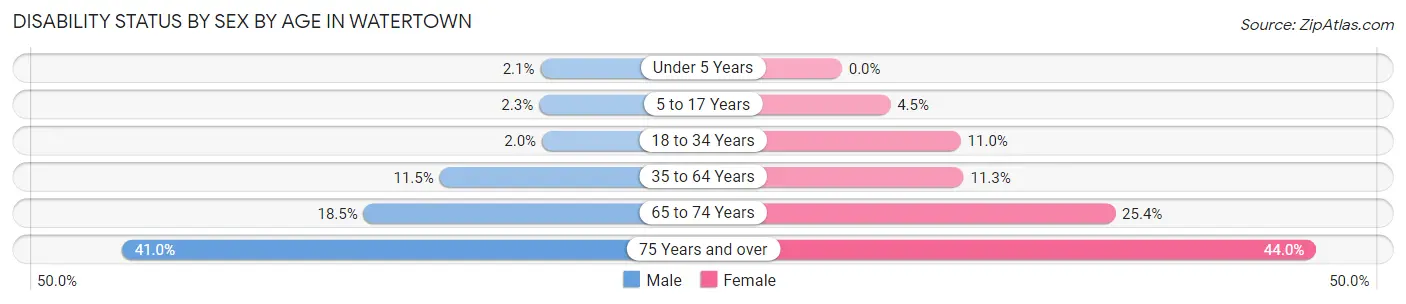
| Age Bracket | Male | Female |
| Under 5 Years | 13 (2.1%) | 0 (0.0%) |
| 5 to 17 Years | 44 (2.3%) | 88 (4.5%) |
| 18 to 34 Years | 52 (2.0%) | 265 (11.0%) |
| 35 to 64 Years | 489 (11.5%) | 442 (11.3%) |
| 65 to 74 Years | 219 (18.5%) | 274 (25.4%) |
| 75 Years and over | 300 (41.0%) | 464 (44.0%) |
Disability Class by Sex by Age in Watertown
Disability Class: Hearing Difficulty
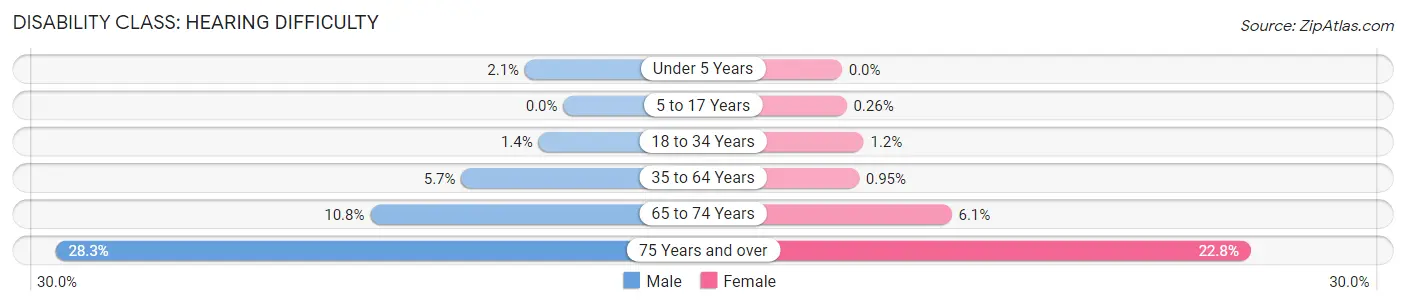
| Age Bracket | Male | Female |
| Under 5 Years | 13 (2.1%) | 0 (0.0%) |
| 5 to 17 Years | 0 (0.0%) | 5 (0.3%) |
| 18 to 34 Years | 36 (1.4%) | 29 (1.2%) |
| 35 to 64 Years | 242 (5.7%) | 37 (0.9%) |
| 65 to 74 Years | 127 (10.7%) | 66 (6.1%) |
| 75 Years and over | 207 (28.3%) | 240 (22.8%) |
Disability Class: Vision Difficulty
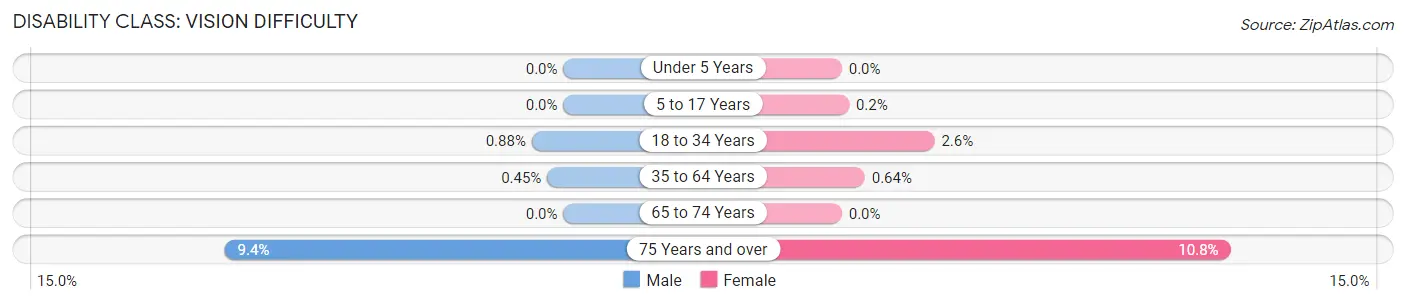
| Age Bracket | Male | Female |
| Under 5 Years | 0 (0.0%) | 0 (0.0%) |
| 5 to 17 Years | 0 (0.0%) | 4 (0.2%) |
| 18 to 34 Years | 23 (0.9%) | 62 (2.6%) |
| 35 to 64 Years | 19 (0.4%) | 25 (0.6%) |
| 65 to 74 Years | 0 (0.0%) | 0 (0.0%) |
| 75 Years and over | 69 (9.4%) | 114 (10.8%) |
Disability Class: Cognitive Difficulty
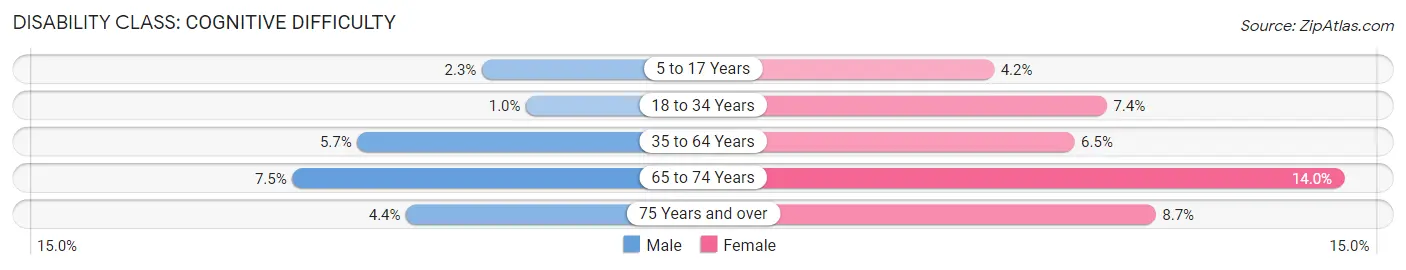
| Age Bracket | Male | Female |
| 5 to 17 Years | 44 (2.3%) | 83 (4.2%) |
| 18 to 34 Years | 27 (1.0%) | 177 (7.4%) |
| 35 to 64 Years | 244 (5.7%) | 253 (6.5%) |
| 65 to 74 Years | 89 (7.5%) | 151 (14.0%) |
| 75 Years and over | 32 (4.4%) | 92 (8.7%) |
Disability Class: Ambulatory Difficulty
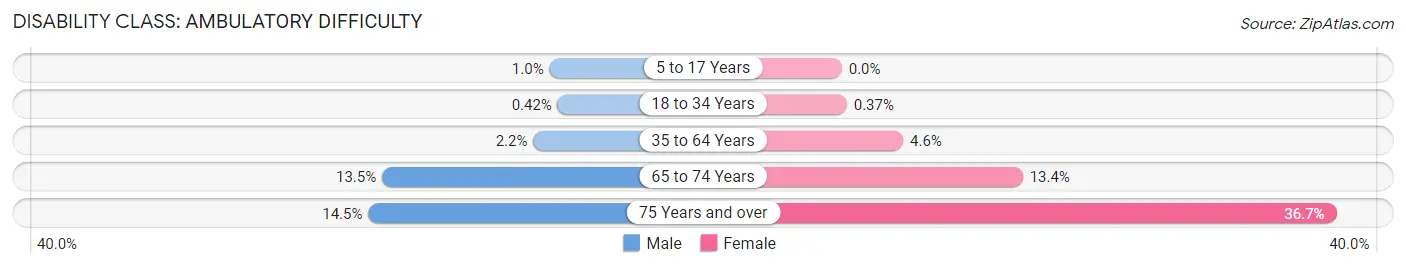
| Age Bracket | Male | Female |
| 5 to 17 Years | 20 (1.0%) | 0 (0.0%) |
| 18 to 34 Years | 11 (0.4%) | 9 (0.4%) |
| 35 to 64 Years | 95 (2.2%) | 178 (4.5%) |
| 65 to 74 Years | 159 (13.5%) | 145 (13.4%) |
| 75 Years and over | 106 (14.5%) | 387 (36.7%) |
Disability Class: Self-Care Difficulty
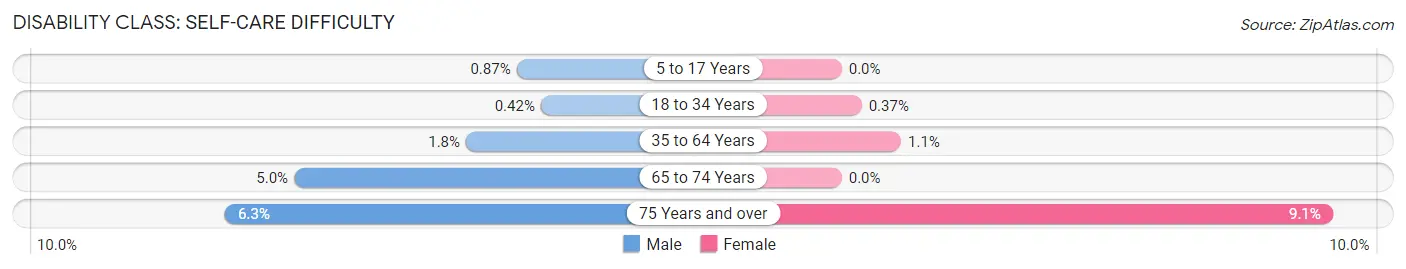
| Age Bracket | Male | Female |
| 5 to 17 Years | 17 (0.9%) | 0 (0.0%) |
| 18 to 34 Years | 11 (0.4%) | 9 (0.4%) |
| 35 to 64 Years | 77 (1.8%) | 43 (1.1%) |
| 65 to 74 Years | 59 (5.0%) | 0 (0.0%) |
| 75 Years and over | 46 (6.3%) | 96 (9.1%) |
Technology Access in Watertown
Computing Device Access in Watertown
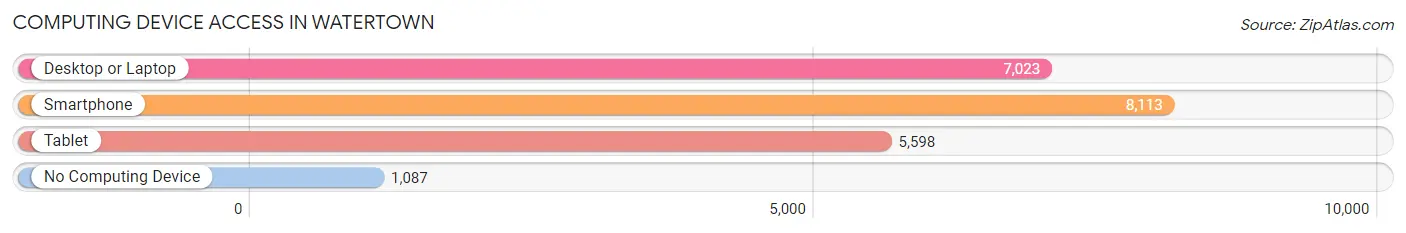
| Device Type | # Households | % Households |
| Desktop or Laptop | 7,023 | 70.1% |
| Smartphone | 8,113 | 81.0% |
| Tablet | 5,598 | 55.9% |
| No Computing Device | 1,087 | 10.8% |
| Total | 10,018 | 100.0% |
Internet Access in Watertown
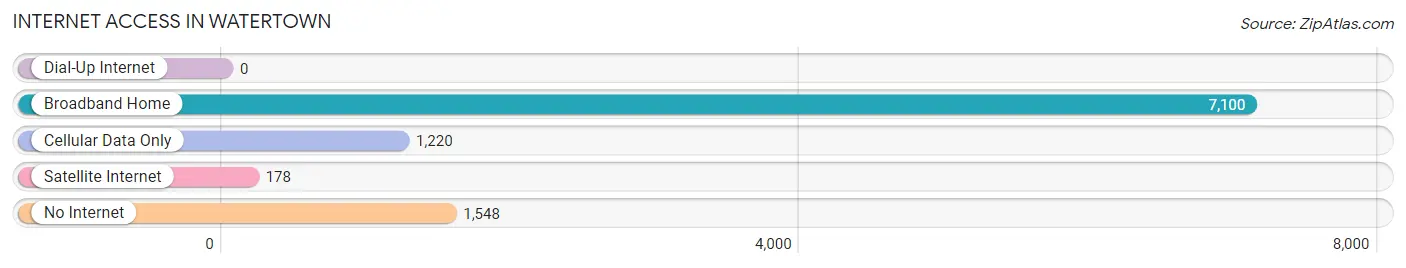
| Internet Type | # Households | % Households |
| Dial-Up Internet | 0 | 0.0% |
| Broadband Home | 7,100 | 70.9% |
| Cellular Data Only | 1,220 | 12.2% |
| Satellite Internet | 178 | 1.8% |
| No Internet | 1,548 | 15.4% |
| Total | 10,018 | 100.0% |
Watertown Summary
History
Watertown, South Dakota is a city located in the northeastern part of the state, in Codington County. It is the county seat and the largest city in the county. The city was founded in 1879 and was named after Watertown, Wisconsin. The city was originally a trading post for the Sioux Indians, and was later settled by European immigrants.
The city was incorporated in 1883 and was the first city in South Dakota to have electric lights. In the early 1900s, the city was a major hub for the railroad industry, and it was also home to several manufacturing companies. The city was also home to the first public library in South Dakota, which was established in 1883.
The city experienced a period of growth in the 1950s and 1960s, when several new industries were established in the area. The city also saw an influx of new residents during this time, as many people moved to the area to take advantage of the new job opportunities.
Geography
Watertown is located in the northeastern part of South Dakota, in Codington County. It is situated on the Big Sioux River, and is about 50 miles north of Sioux Falls. The city has a total area of 8.7 square miles, and has an elevation of 1,541 feet.
The city is located in a region of rolling hills and prairies, and is surrounded by several lakes and rivers. The city is also home to several parks and recreational areas, including the Watertown Municipal Golf Course, the Watertown Regional Airport, and the Watertown Recreation Area.
Economy
Watertown’s economy is largely based on agriculture, manufacturing, and tourism. The city is home to several large agricultural companies, including Cargill, Inc., and the South Dakota Wheat Growers Association. The city is also home to several manufacturing companies, including the Watertown Manufacturing Company, which produces a variety of products, including furniture, clothing, and automotive parts.
The city is also home to several tourist attractions, including the Watertown Regional Airport, the Watertown Recreation Area, and the Watertown Municipal Golf Course. The city also hosts several annual events, including the Watertown Summer Festival and the Watertown Winter Festival.
Demographics
As of the 2010 census, Watertown had a population of 21,482. The city has a population density of 2,457 people per square mile. The median age of the population is 37.7 years, and the median household income is $45,945.
The racial makeup of the city is 87.3% White, 5.2% African American, 0.7% Native American, 1.3% Asian, 0.1% Pacific Islander, 3.2% from other races, and 2.4% from two or more races. The city also has a large Hispanic population, with 8.3% of the population being of Hispanic or Latino origin.
Conclusion
Watertown, South Dakota is a city located in the northeastern part of the state, in Codington County. It is the county seat and the largest city in the county. The city was founded in 1879 and was named after Watertown, Wisconsin. The city has a population of 21,482 and has a largely agricultural-based economy. The city is also home to several tourist attractions, including the Watertown Regional Airport, the Watertown Recreation Area, and the Watertown Municipal Golf Course. The city also hosts several annual events, including the Watertown Summer Festival and the Watertown Winter Festival.
Common Questions
What is Per Capita Income in Watertown?
Per Capita income in Watertown is $35,599.
What is the Median Family Income in Watertown?
Median Family Income in Watertown is $85,727.
What is the Median Household income in Watertown?
Median Household Income in Watertown is $61,320.
What is Income or Wage Gap in Watertown?
Income or Wage Gap in Watertown is 35.9%.
Women in Watertown earn 64.1 cents for every dollar earned by a man.
What is Inequality or Gini Index in Watertown?
Inequality or Gini Index in Watertown is 0.43.
What is the Total Population of Watertown?
Total Population of Watertown is 22,718.
What is the Total Male Population of Watertown?
Total Male Population of Watertown is 11,467.
What is the Total Female Population of Watertown?
Total Female Population of Watertown is 11,251.
What is the Ratio of Males per 100 Females in Watertown?
There are 101.92 Males per 100 Females in Watertown.
What is the Ratio of Females per 100 Males in Watertown?
There are 98.12 Females per 100 Males in Watertown.
What is the Median Population Age in Watertown?
Median Population Age in Watertown is 38.9 Years.
What is the Average Family Size in Watertown
Average Family Size in Watertown is 2.9 People.
What is the Average Household Size in Watertown
Average Household Size in Watertown is 2.2 People.
How Large is the Labor Force in Watertown?
There are 12,443 People in the Labor Forcein in Watertown.
What is the Percentage of People in the Labor Force in Watertown?
68.0% of People are in the Labor Force in Watertown.
What is the Unemployment Rate in Watertown?
Unemployment Rate in Watertown is 1.5%.