Summerset, SD Map & Demographics
Summerset Map
Summerset Overview
$37,202
PER CAPITA INCOME
$111,875
AVG FAMILY INCOME
$98,194
AVG HOUSEHOLD INCOME
42.9%
WAGE / INCOME GAP [ % ]
57.1¢/ $1
WAGE / INCOME GAP [ $ ]
0.34
INEQUALITY / GINI INDEX
2,950
TOTAL POPULATION
1,393
MALE POPULATION
1,557
FEMALE POPULATION
89.47
MALES / 100 FEMALES
111.77
FEMALES / 100 MALES
33.4
MEDIAN AGE
3.2
AVG FAMILY SIZE
2.7
AVG HOUSEHOLD SIZE
1,636
LABOR FORCE [ PEOPLE ]
75.9%
PERCENT IN LABOR FORCE
1.9%
UNEMPLOYMENT RATE
Summerset Area Codes
Income in Summerset
Income Overview in Summerset
Per Capita Income in Summerset is $37,202, while median incomes of families and households are $111,875 and $98,194 respectively.
| Characteristic | Number | Measure |
| Per Capita Income | 2,950 | $37,202 |
| Median Family Income | 799 | $111,875 |
| Mean Family Income | 799 | $115,946 |
| Median Household Income | 1,081 | $98,194 |
| Mean Household Income | 1,081 | $103,160 |
| Income Deficit | 799 | $0 |
| Wage / Income Gap (%) | 2,950 | 42.92% |
| Wage / Income Gap ($) | 2,950 | 57.08¢ per $1 |
| Gini / Inequality Index | 2,950 | 0.34 |
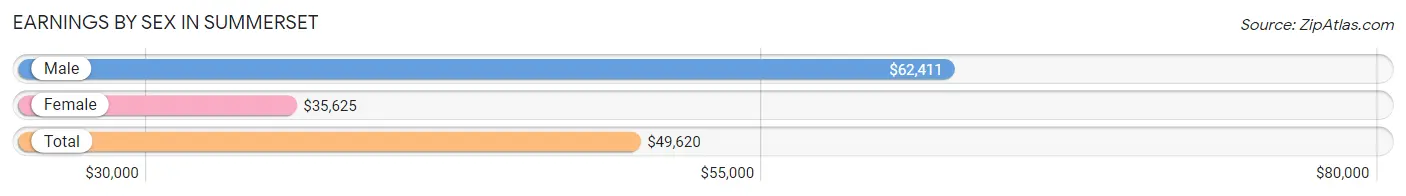
Earnings by Sex in Summerset
Average Earnings in Summerset are $49,620, $62,411 for men and $35,625 for women, a difference of 42.9%.
| Sex | Number | Average Earnings |
| Male | 789 (45.9%) | $62,411 |
| Female | 931 (54.1%) | $35,625 |
| Total | 1,720 (100.0%) | $49,620 |
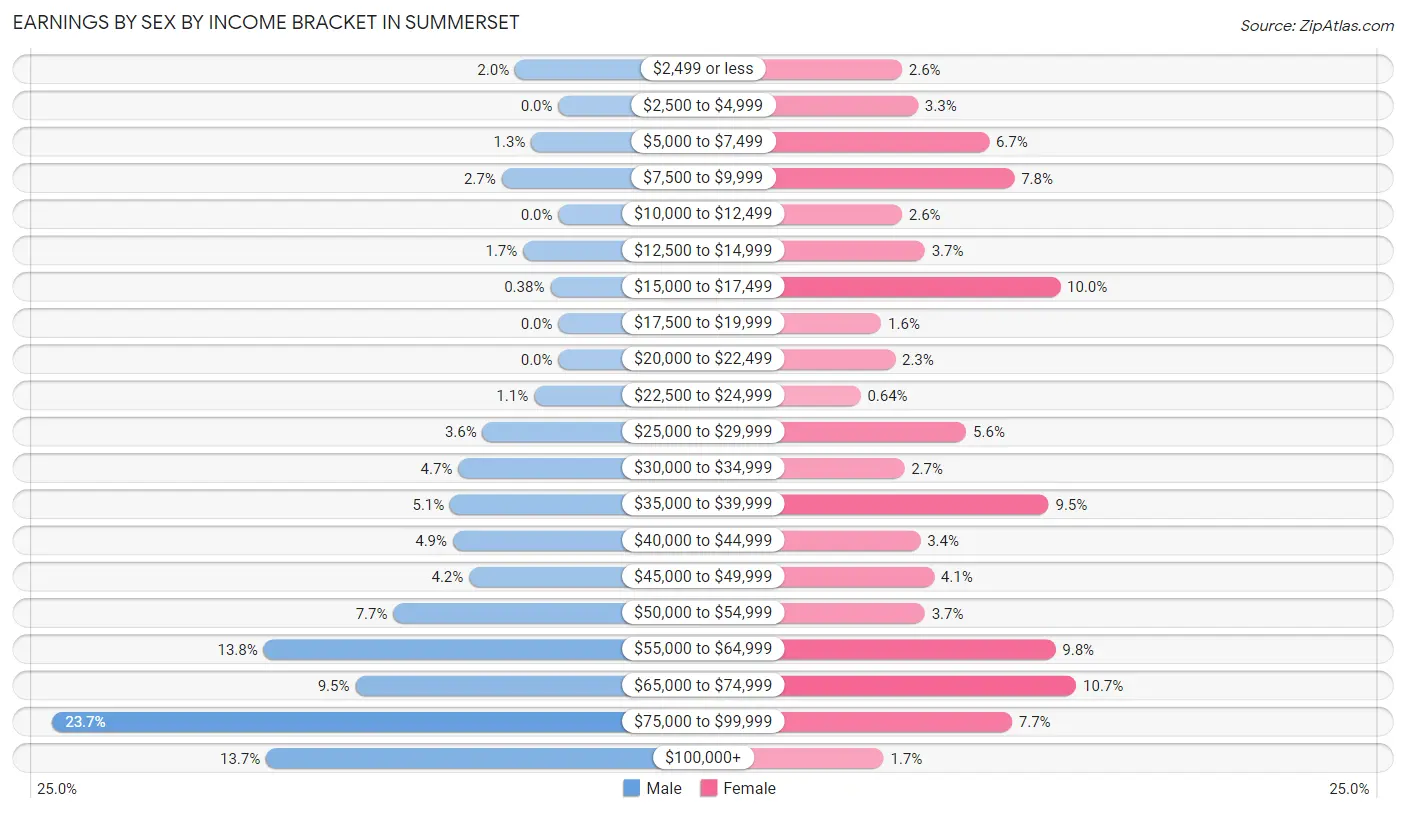
Earnings by Sex by Income Bracket in Summerset
The most common earnings brackets in Summerset are $75,000 to $99,999 for men (187 | 23.7%) and $65,000 to $74,999 for women (100 | 10.7%).
| Income | Male | Female |
| $2,499 or less | 16 (2.0%) | 24 (2.6%) |
| $2,500 to $4,999 | 0 (0.0%) | 31 (3.3%) |
| $5,000 to $7,499 | 10 (1.3%) | 62 (6.7%) |
| $7,500 to $9,999 | 21 (2.7%) | 73 (7.8%) |
| $10,000 to $12,499 | 0 (0.0%) | 24 (2.6%) |
| $12,500 to $14,999 | 13 (1.7%) | 34 (3.6%) |
| $15,000 to $17,499 | 3 (0.4%) | 93 (10.0%) |
| $17,500 to $19,999 | 0 (0.0%) | 15 (1.6%) |
| $20,000 to $22,499 | 0 (0.0%) | 21 (2.3%) |
| $22,500 to $24,999 | 9 (1.1%) | 6 (0.6%) |
| $25,000 to $29,999 | 28 (3.5%) | 52 (5.6%) |
| $30,000 to $34,999 | 37 (4.7%) | 25 (2.7%) |
| $35,000 to $39,999 | 40 (5.1%) | 88 (9.5%) |
| $40,000 to $44,999 | 39 (4.9%) | 32 (3.4%) |
| $45,000 to $49,999 | 33 (4.2%) | 38 (4.1%) |
| $50,000 to $54,999 | 61 (7.7%) | 34 (3.6%) |
| $55,000 to $64,999 | 109 (13.8%) | 91 (9.8%) |
| $65,000 to $74,999 | 75 (9.5%) | 100 (10.7%) |
| $75,000 to $99,999 | 187 (23.7%) | 72 (7.7%) |
| $100,000+ | 108 (13.7%) | 16 (1.7%) |
| Total | 789 (100.0%) | 931 (100.0%) |
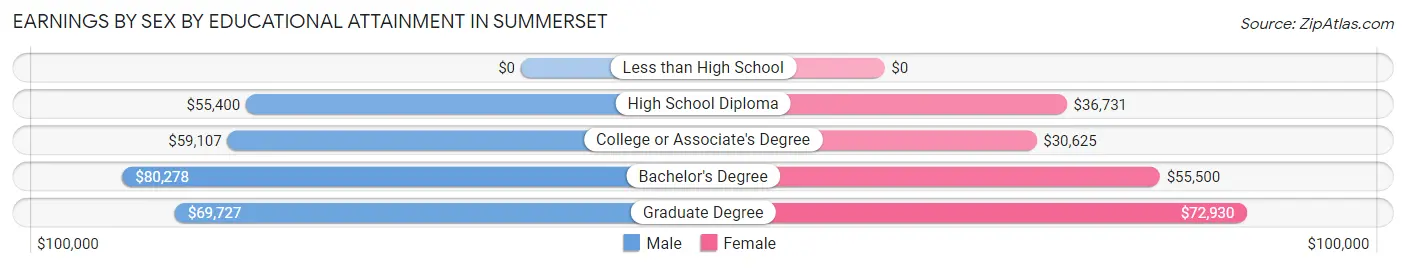
Earnings by Sex by Educational Attainment in Summerset
Average earnings in Summerset are $66,500 for men and $45,000 for women, a difference of 32.3%. Men with an educational attainment of bachelor's degree enjoy the highest average annual earnings of $80,278, while those with high school diploma education earn the least with $55,400. Women with an educational attainment of graduate degree earn the most with the average annual earnings of $72,930, while those with college or associate's degree education have the smallest earnings of $30,625.
| Educational Attainment | Male Income | Female Income |
| Less than High School | - | - |
| High School Diploma | $55,400 | $36,731 |
| College or Associate's Degree | $59,107 | $30,625 |
| Bachelor's Degree | $80,278 | $55,500 |
| Graduate Degree | $69,727 | $72,930 |
| Total | $66,500 | $45,000 |
Family Income in Summerset
Family Income Brackets in Summerset
According to the Summerset family income data, there are 300 families falling into the $100,000 to $149,999 income range, which is the most common income bracket and makes up 37.6% of all families.
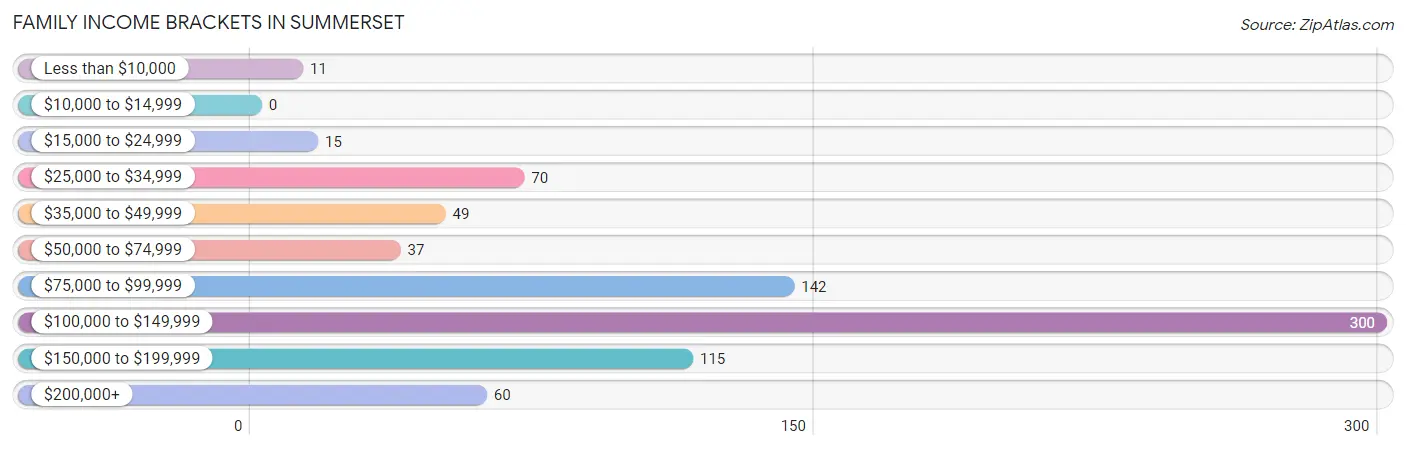
| Income Bracket | # Families | % Families |
| Less than $10,000 | 11 | 1.4% |
| $10,000 to $14,999 | 0 | 0.0% |
| $15,000 to $24,999 | 15 | 1.9% |
| $25,000 to $34,999 | 70 | 8.8% |
| $35,000 to $49,999 | 49 | 6.1% |
| $50,000 to $74,999 | 37 | 4.6% |
| $75,000 to $99,999 | 142 | 17.8% |
| $100,000 to $149,999 | 300 | 37.5% |
| $150,000 to $199,999 | 115 | 14.4% |
| $200,000+ | 60 | 7.5% |
Family Income by Famaliy Size in Summerset
4-person families (251 | 31.4%) account for the highest median family income in Summerset with $139,191 per family, while 2-person families (337 | 42.2%) have the highest median income of $46,420 per family member.
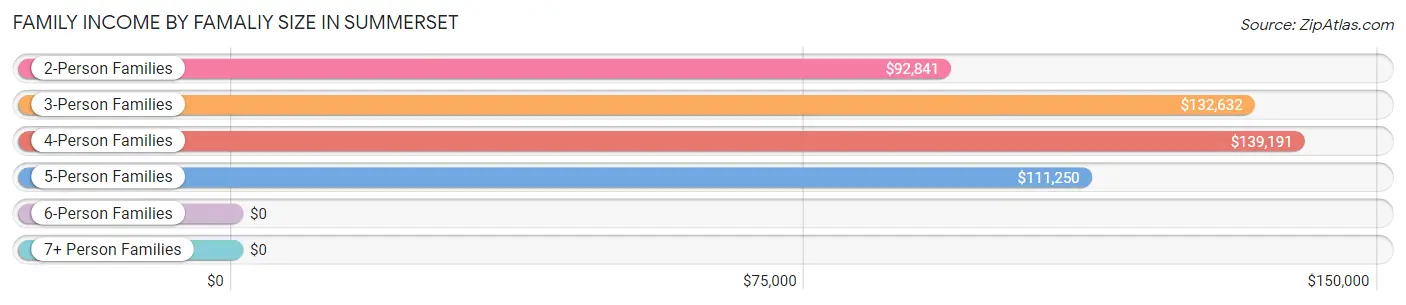
| Income Bracket | # Families | Median Income |
| 2-Person Families | 337 (42.2%) | $92,841 |
| 3-Person Families | 136 (17.0%) | $132,632 |
| 4-Person Families | 251 (31.4%) | $139,191 |
| 5-Person Families | 62 (7.8%) | $111,250 |
| 6-Person Families | 0 (0.0%) | $0 |
| 7+ Person Families | 13 (1.6%) | $0 |
| Total | 799 (100.0%) | $111,875 |
Family Income by Number of Earners in Summerset
The median family income in Summerset is $111,875, with families comprising 3+ earners (95) having the highest median family income of $162,695, while families with no earners (88) have the lowest median family income of $44,000, accounting for 11.9% and 11.0% of families, respectively.
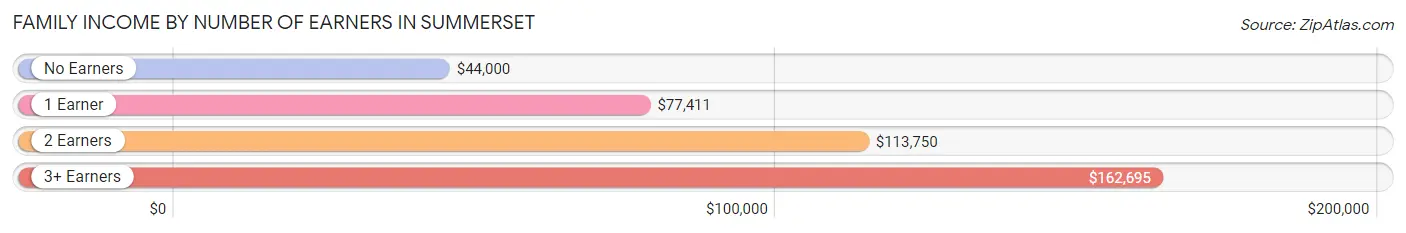
| Number of Earners | # Families | Median Income |
| No Earners | 88 (11.0%) | $44,000 |
| 1 Earner | 105 (13.1%) | $77,411 |
| 2 Earners | 511 (63.9%) | $113,750 |
| 3+ Earners | 95 (11.9%) | $162,695 |
| Total | 799 (100.0%) | $111,875 |
Household Income in Summerset
Household Income Brackets in Summerset
With 353 households falling in the category, the $100,000 to $149,999 income range is the most frequent in Summerset, accounting for 32.7% of all households. In contrast, only 8 households (0.7%) fall into the $10,000 to $14,999 income bracket, making it the least populous group.
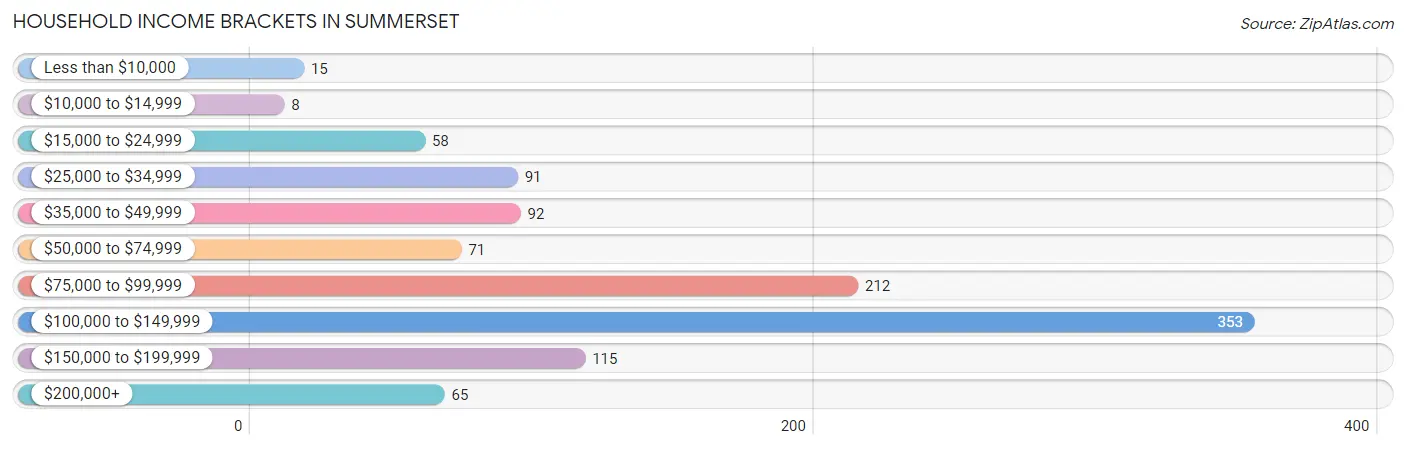
| Income Bracket | # Households | % Households |
| Less than $10,000 | 15 | 1.4% |
| $10,000 to $14,999 | 8 | 0.7% |
| $15,000 to $24,999 | 58 | 5.4% |
| $25,000 to $34,999 | 91 | 8.4% |
| $35,000 to $49,999 | 92 | 8.5% |
| $50,000 to $74,999 | 71 | 6.6% |
| $75,000 to $99,999 | 212 | 19.6% |
| $100,000 to $149,999 | 353 | 32.7% |
| $150,000 to $199,999 | 115 | 10.6% |
| $200,000+ | 65 | 6.0% |
Household Income by Householder Age in Summerset
The median household income in Summerset is $98,194, with the highest median household income of $117,500 found in the 45 to 64 years age bracket for the primary householder. A total of 352 households (32.6%) fall into this category. Meanwhile, the 15 to 24 years age bracket for the primary householder has the lowest median household income of $0, with 42 households (3.9%) in this group.
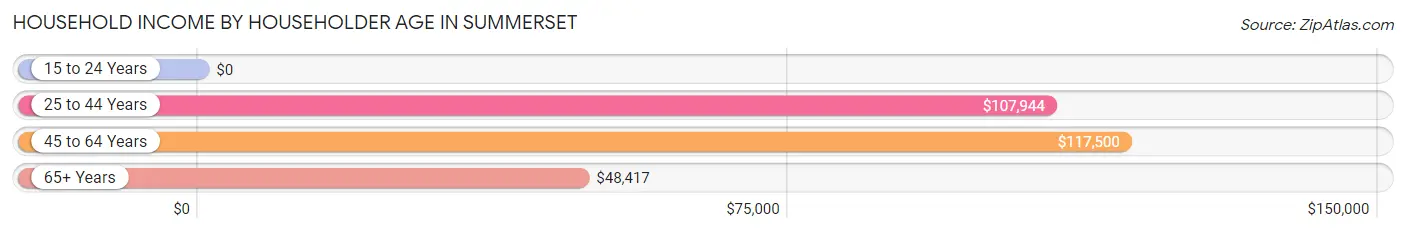
| Income Bracket | # Households | Median Income |
| 15 to 24 Years | 42 (3.9%) | $0 |
| 25 to 44 Years | 496 (45.9%) | $107,944 |
| 45 to 64 Years | 352 (32.6%) | $117,500 |
| 65+ Years | 191 (17.7%) | $48,417 |
| Total | 1,081 (100.0%) | $98,194 |
Poverty in Summerset
Income Below Poverty by Sex and Age in Summerset
With 7.5% poverty level for males and 6.5% for females among the residents of Summerset, 16 and 17 year old males and 6 to 11 year old females are the most vulnerable to poverty, with 22 males (78.6%) and 38 females (23.6%) in their respective age groups living below the poverty level.
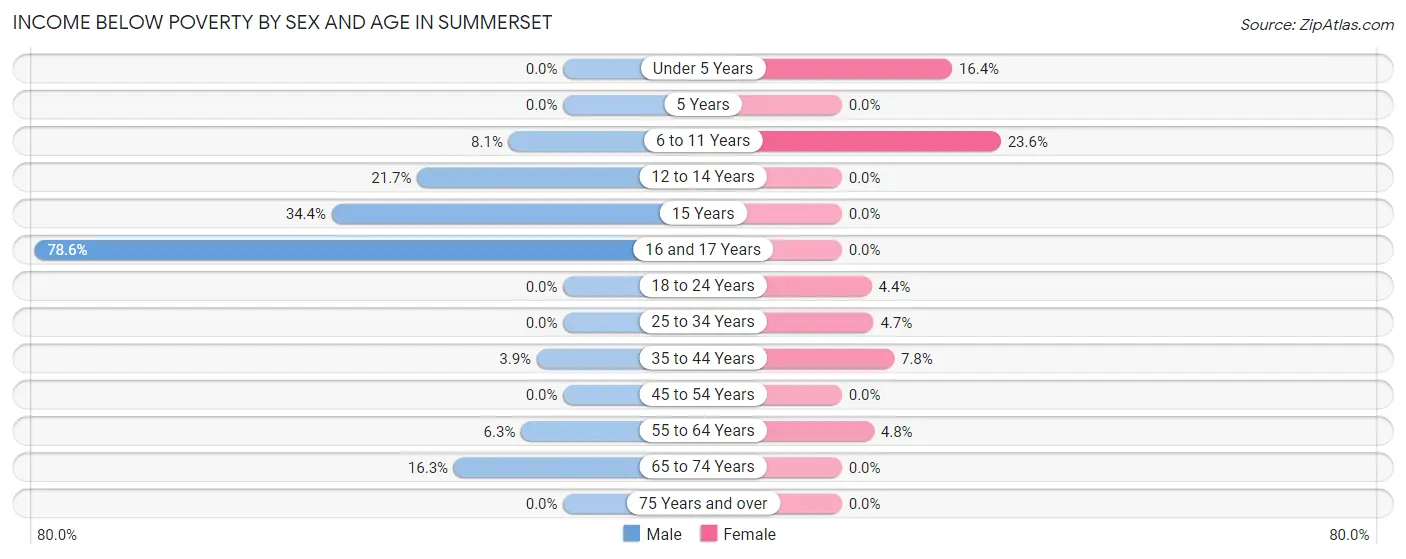
| Age Bracket | Male | Female |
| Under 5 Years | 0 (0.0%) | 18 (16.4%) |
| 5 Years | 0 (0.0%) | 0 (0.0%) |
| 6 to 11 Years | 9 (8.1%) | 38 (23.6%) |
| 12 to 14 Years | 31 (21.7%) | 0 (0.0%) |
| 15 Years | 11 (34.4%) | 0 (0.0%) |
| 16 and 17 Years | 22 (78.6%) | 0 (0.0%) |
| 18 to 24 Years | 0 (0.0%) | 11 (4.4%) |
| 25 to 34 Years | 0 (0.0%) | 11 (4.7%) |
| 35 to 44 Years | 10 (3.9%) | 17 (7.8%) |
| 45 to 54 Years | 0 (0.0%) | 0 (0.0%) |
| 55 to 64 Years | 9 (6.2%) | 6 (4.8%) |
| 65 to 74 Years | 13 (16.3%) | 0 (0.0%) |
| 75 Years and over | 0 (0.0%) | 0 (0.0%) |
| Total | 105 (7.5%) | 101 (6.5%) |
Income Above Poverty by Sex and Age in Summerset
According to the poverty statistics in Summerset, males aged under 5 years and females aged 5 years are the age groups that are most secure financially, with 100.0% of males and 100.0% of females in these age groups living above the poverty line.
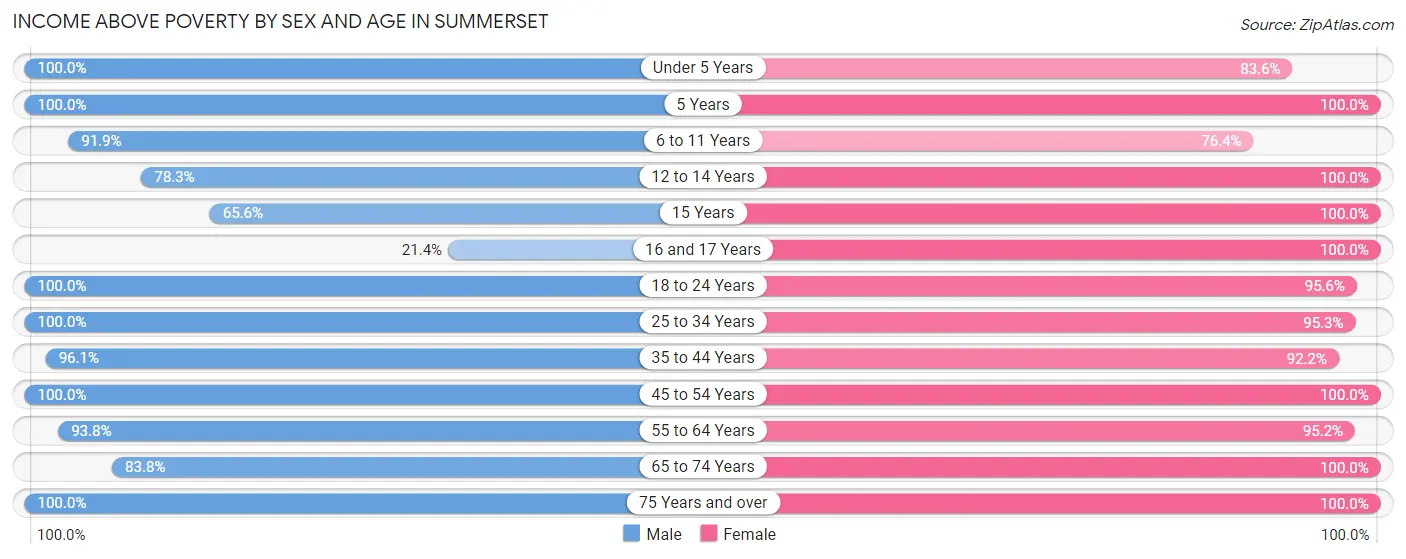
| Age Bracket | Male | Female |
| Under 5 Years | 105 (100.0%) | 92 (83.6%) |
| 5 Years | 6 (100.0%) | 31 (100.0%) |
| 6 to 11 Years | 102 (91.9%) | 123 (76.4%) |
| 12 to 14 Years | 112 (78.3%) | 72 (100.0%) |
| 15 Years | 21 (65.6%) | 23 (100.0%) |
| 16 and 17 Years | 6 (21.4%) | 16 (100.0%) |
| 18 to 24 Years | 99 (100.0%) | 238 (95.6%) |
| 25 to 34 Years | 148 (100.0%) | 223 (95.3%) |
| 35 to 44 Years | 245 (96.1%) | 202 (92.2%) |
| 45 to 54 Years | 157 (100.0%) | 153 (100.0%) |
| 55 to 64 Years | 135 (93.8%) | 120 (95.2%) |
| 65 to 74 Years | 67 (83.8%) | 86 (100.0%) |
| 75 Years and over | 85 (100.0%) | 77 (100.0%) |
| Total | 1,288 (92.5%) | 1,456 (93.5%) |
Income Below Poverty Among Married-Couple Families in Summerset
The poverty statistics for married-couple families in Summerset show that 2.1% or 14 of the total 665 families live below the poverty line. Families with 5 or more children have the highest poverty rate of 69.2%, comprising of 9 families. On the other hand, families with no children have the lowest poverty rate of 0.0%, which includes 0 families.
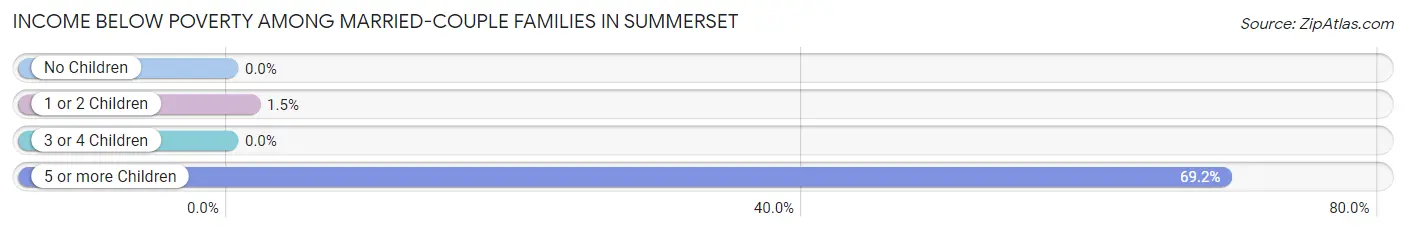
| Children | Above Poverty | Below Poverty |
| No Children | 275 (100.0%) | 0 (0.0%) |
| 1 or 2 Children | 319 (98.5%) | 5 (1.5%) |
| 3 or 4 Children | 53 (100.0%) | 0 (0.0%) |
| 5 or more Children | 4 (30.8%) | 9 (69.2%) |
| Total | 651 (97.9%) | 14 (2.1%) |
Income Below Poverty Among Single-Parent Households in Summerset
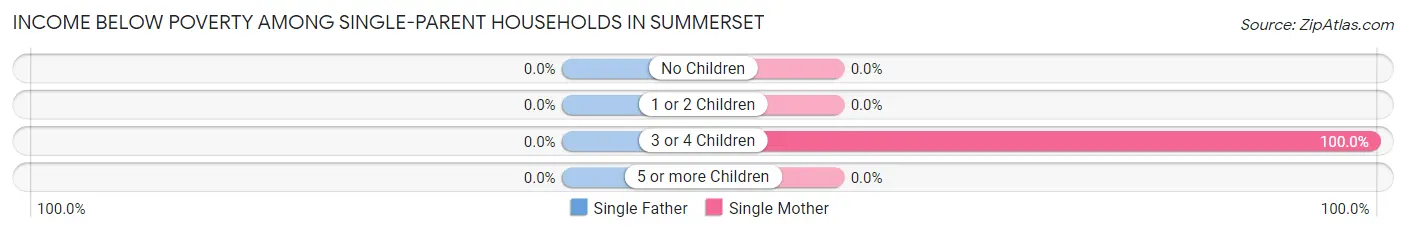
| Children | Single Father | Single Mother |
| No Children | 0 (0.0%) | 0 (0.0%) |
| 1 or 2 Children | 0 (0.0%) | 0 (0.0%) |
| 3 or 4 Children | 0 (0.0%) | 11 (100.0%) |
| 5 or more Children | 0 (0.0%) | 0 (0.0%) |
| Total | 0 (0.0%) | 11 (11.2%) |
Income Below Poverty Among Married-Couple vs Single-Parent Households in Summerset
The poverty data for Summerset shows that 14 of the married-couple family households (2.1%) and 11 of the single-parent households (8.2%) are living below the poverty level. Within the married-couple family households, those with 5 or more children have the highest poverty rate, with 9 households (69.2%) falling below the poverty line. Among the single-parent households, those with 3 or 4 children have the highest poverty rate, with 11 household (100.0%) living below poverty.
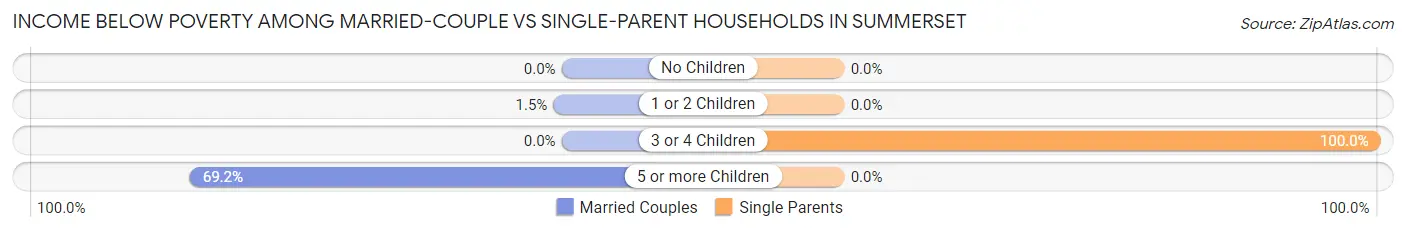
| Children | Married-Couple Families | Single-Parent Households |
| No Children | 0 (0.0%) | 0 (0.0%) |
| 1 or 2 Children | 5 (1.5%) | 0 (0.0%) |
| 3 or 4 Children | 0 (0.0%) | 11 (100.0%) |
| 5 or more Children | 9 (69.2%) | 0 (0.0%) |
| Total | 14 (2.1%) | 11 (8.2%) |
Race in Summerset
The most populous races in Summerset are White / Caucasian (2,807 | 95.2%), Two or more Races (92 | 3.1%), and Asian (40 | 1.4%).
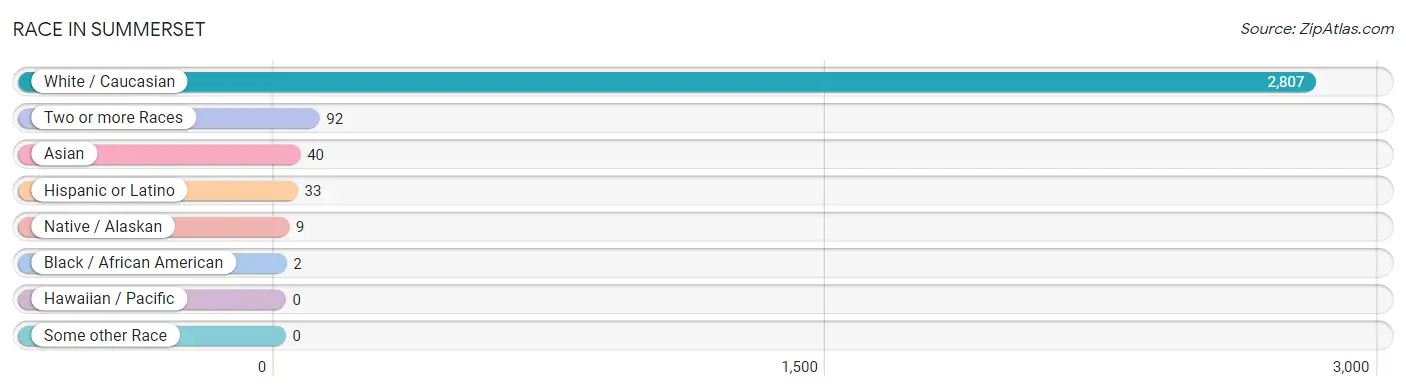
| Race | # Population | % Population |
| Asian | 40 | 1.4% |
| Black / African American | 2 | 0.1% |
| Hawaiian / Pacific | 0 | 0.0% |
| Hispanic or Latino | 33 | 1.1% |
| Native / Alaskan | 9 | 0.3% |
| White / Caucasian | 2,807 | 95.2% |
| Two or more Races | 92 | 3.1% |
| Some other Race | 0 | 0.0% |
| Total | 2,950 | 100.0% |
Ancestry in Summerset
The most populous ancestries reported in Summerset are German (1,255 | 42.5%), Norwegian (544 | 18.4%), Irish (268 | 9.1%), English (247 | 8.4%), and Polish (125 | 4.2%), together accounting for 82.7% of all Summerset residents.
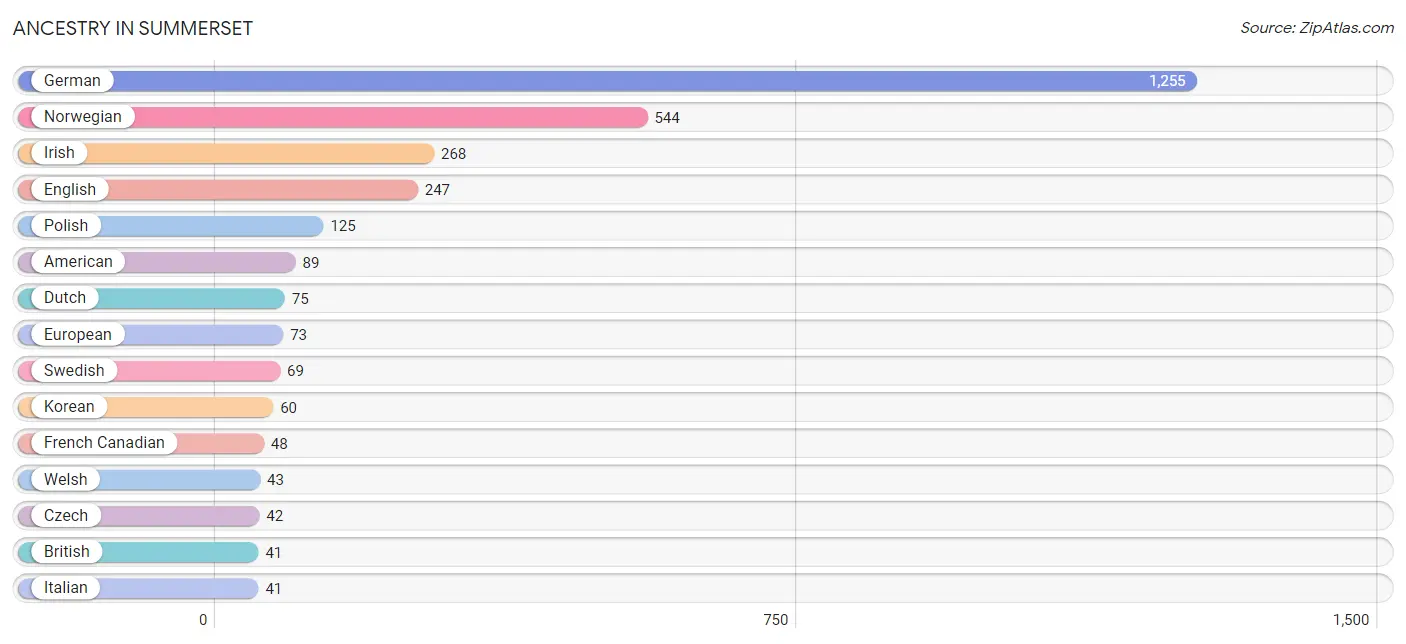
| Ancestry | # Population | % Population |
| Albanian | 8 | 0.3% |
| American | 89 | 3.0% |
| Austrian | 3 | 0.1% |
| British | 41 | 1.4% |
| Burmese | 5 | 0.2% |
| Comanche | 5 | 0.2% |
| Cuban | 8 | 0.3% |
| Czech | 42 | 1.4% |
| Danish | 16 | 0.5% |
| Dutch | 75 | 2.5% |
| English | 247 | 8.4% |
| European | 73 | 2.5% |
| French | 32 | 1.1% |
| French Canadian | 48 | 1.6% |
| German | 1,255 | 42.5% |
| Indian (Asian) | 8 | 0.3% |
| Irish | 268 | 9.1% |
| Italian | 41 | 1.4% |
| Korean | 60 | 2.0% |
| Mexican | 25 | 0.9% |
| Norwegian | 544 | 18.4% |
| Pima | 2 | 0.1% |
| Polish | 125 | 4.2% |
| Russian | 17 | 0.6% |
| Scotch-Irish | 11 | 0.4% |
| Scottish | 27 | 0.9% |
| Sioux | 7 | 0.2% |
| Swedish | 69 | 2.3% |
| Swiss | 5 | 0.2% |
| Welsh | 43 | 1.5% | View All 30 Rows |
Immigrants in Summerset
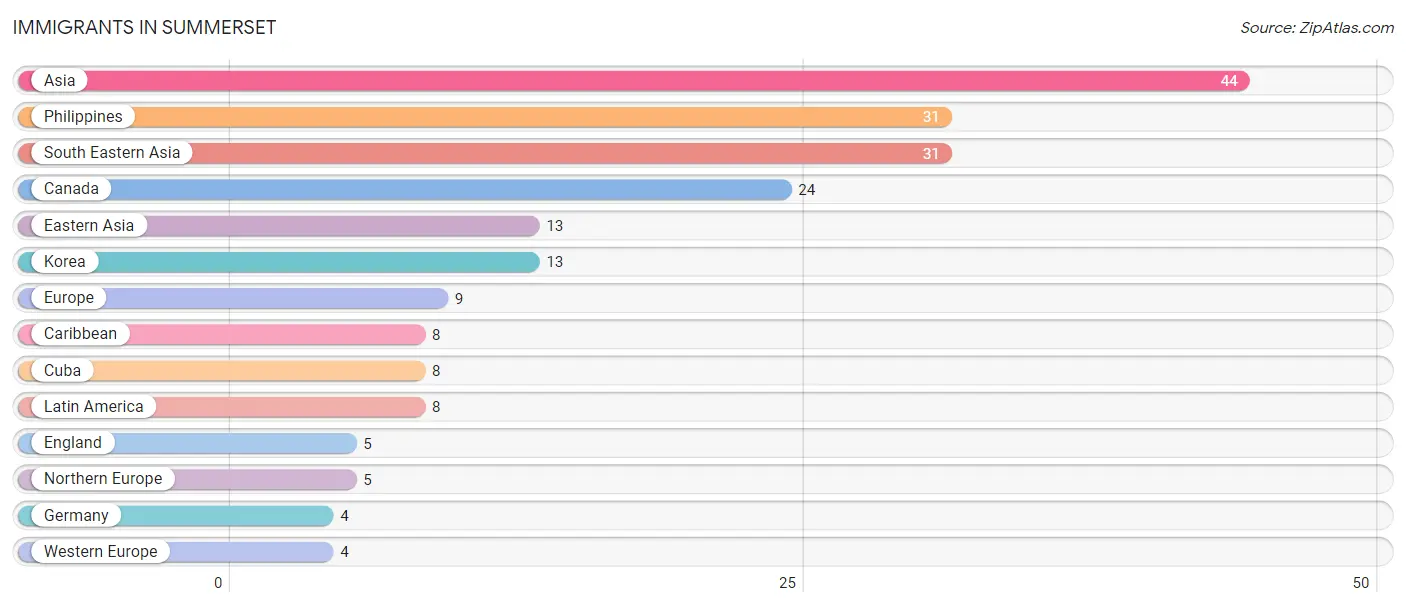
The most numerous immigrant groups reported in Summerset came from Asia (44 | 1.5%), Philippines (31 | 1.1%), South Eastern Asia (31 | 1.1%), Canada (24 | 0.8%), and Eastern Asia (13 | 0.4%), together accounting for 4.8% of all Summerset residents.
| Immigration Origin | # Population | % Population |
| Asia | 44 | 1.5% |
| Canada | 24 | 0.8% |
| Caribbean | 8 | 0.3% |
| Cuba | 8 | 0.3% |
| Eastern Asia | 13 | 0.4% |
| England | 5 | 0.2% |
| Europe | 9 | 0.3% |
| Germany | 4 | 0.1% |
| Korea | 13 | 0.4% |
| Latin America | 8 | 0.3% |
| Northern Europe | 5 | 0.2% |
| Philippines | 31 | 1.1% |
| South Eastern Asia | 31 | 1.1% |
| Western Europe | 4 | 0.1% | View All 14 Rows |
Sex and Age in Summerset
Sex and Age in Summerset
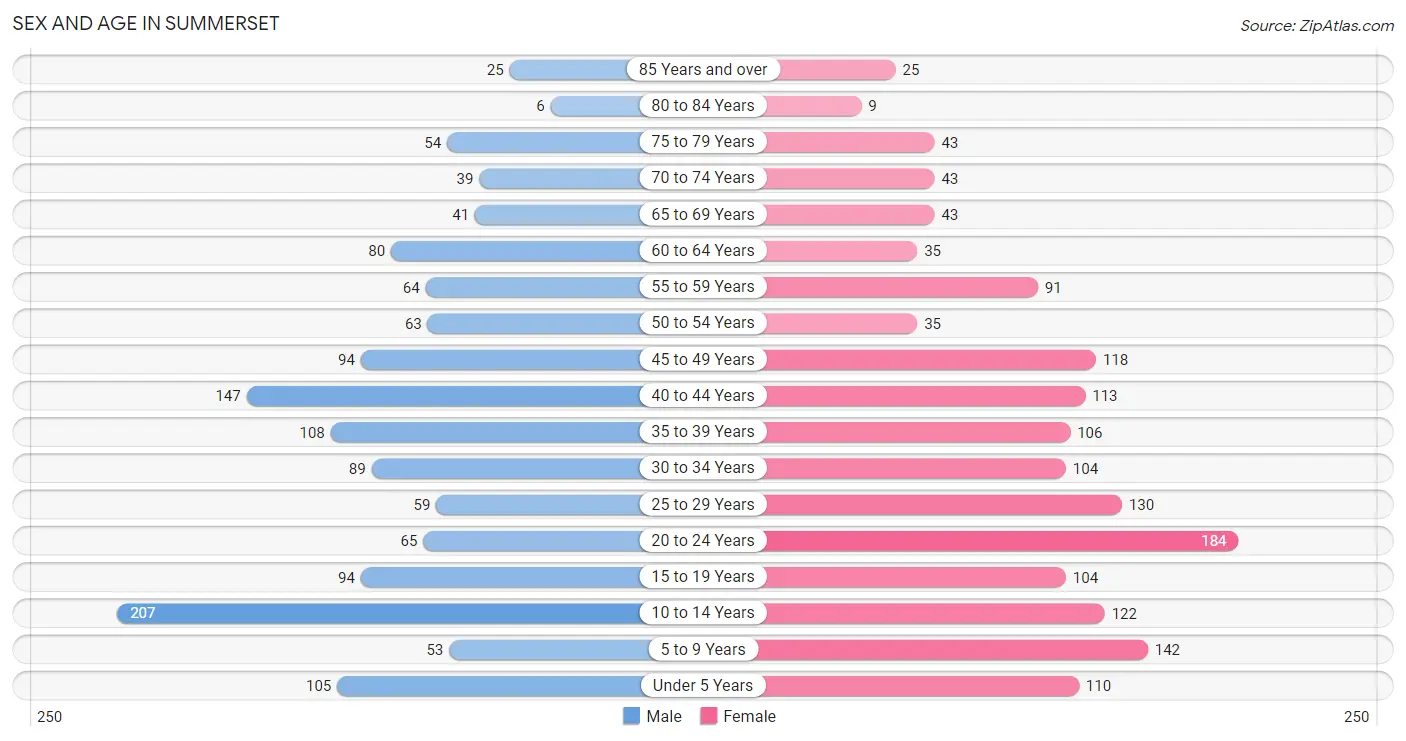
The most populous age groups in Summerset are 10 to 14 Years (207 | 14.9%) for men and 20 to 24 Years (184 | 11.8%) for women.
| Age Bracket | Male | Female |
| Under 5 Years | 105 (7.5%) | 110 (7.1%) |
| 5 to 9 Years | 53 (3.8%) | 142 (9.1%) |
| 10 to 14 Years | 207 (14.9%) | 122 (7.8%) |
| 15 to 19 Years | 94 (6.8%) | 104 (6.7%) |
| 20 to 24 Years | 65 (4.7%) | 184 (11.8%) |
| 25 to 29 Years | 59 (4.2%) | 130 (8.4%) |
| 30 to 34 Years | 89 (6.4%) | 104 (6.7%) |
| 35 to 39 Years | 108 (7.7%) | 106 (6.8%) |
| 40 to 44 Years | 147 (10.5%) | 113 (7.3%) |
| 45 to 49 Years | 94 (6.8%) | 118 (7.6%) |
| 50 to 54 Years | 63 (4.5%) | 35 (2.2%) |
| 55 to 59 Years | 64 (4.6%) | 91 (5.8%) |
| 60 to 64 Years | 80 (5.7%) | 35 (2.2%) |
| 65 to 69 Years | 41 (2.9%) | 43 (2.8%) |
| 70 to 74 Years | 39 (2.8%) | 43 (2.8%) |
| 75 to 79 Years | 54 (3.9%) | 43 (2.8%) |
| 80 to 84 Years | 6 (0.4%) | 9 (0.6%) |
| 85 Years and over | 25 (1.8%) | 25 (1.6%) |
| Total | 1,393 (100.0%) | 1,557 (100.0%) |
Families and Households in Summerset
Median Family Size in Summerset
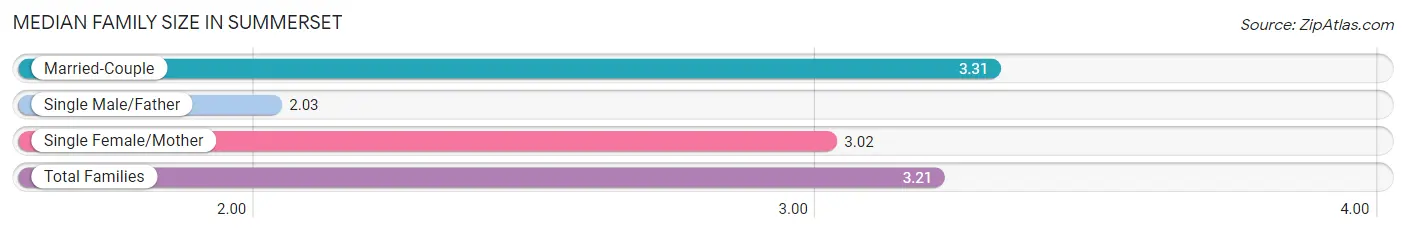
The median family size in Summerset is 3.21 persons per family, with married-couple families (665 | 83.2%) accounting for the largest median family size of 3.31 persons per family. On the other hand, single male/father families (36 | 4.5%) represent the smallest median family size with 2.03 persons per family.
| Family Type | # Families | Family Size |
| Married-Couple | 665 (83.2%) | 3.31 |
| Single Male/Father | 36 (4.5%) | 2.03 |
| Single Female/Mother | 98 (12.3%) | 3.02 |
| Total Families | 799 (100.0%) | 3.21 |
Median Household Size in Summerset
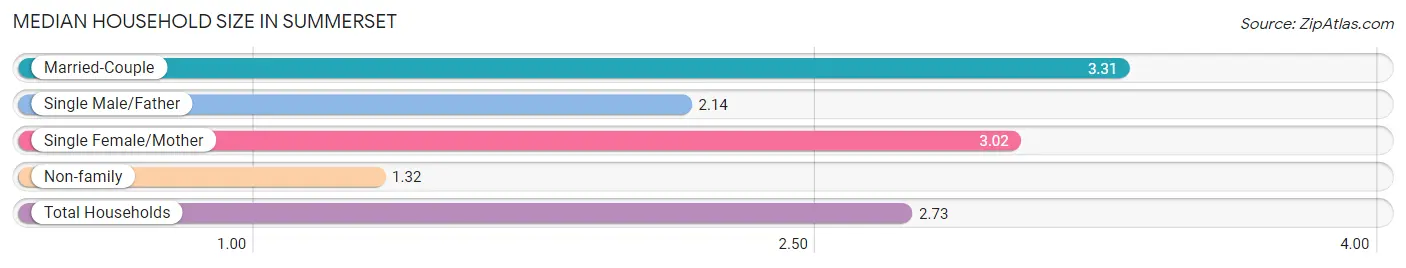
The median household size in Summerset is 2.73 persons per household, with married-couple households (665 | 61.5%) accounting for the largest median household size of 3.31 persons per household. non-family households (282 | 26.1%) represent the smallest median household size with 1.32 persons per household.
| Household Type | # Households | Household Size |
| Married-Couple | 665 (61.5%) | 3.31 |
| Single Male/Father | 36 (3.3%) | 2.14 |
| Single Female/Mother | 98 (9.1%) | 3.02 |
| Non-family | 282 (26.1%) | 1.32 |
| Total Households | 1,081 (100.0%) | 2.73 |
Household Size by Marriage Status in Summerset
Out of a total of 1,081 households in Summerset, 799 (73.9%) are family households, while 282 (26.1%) are nonfamily households. The most numerous type of family households are 2-person households, comprising 333, and the most common type of nonfamily households are 1-person households, comprising 202.
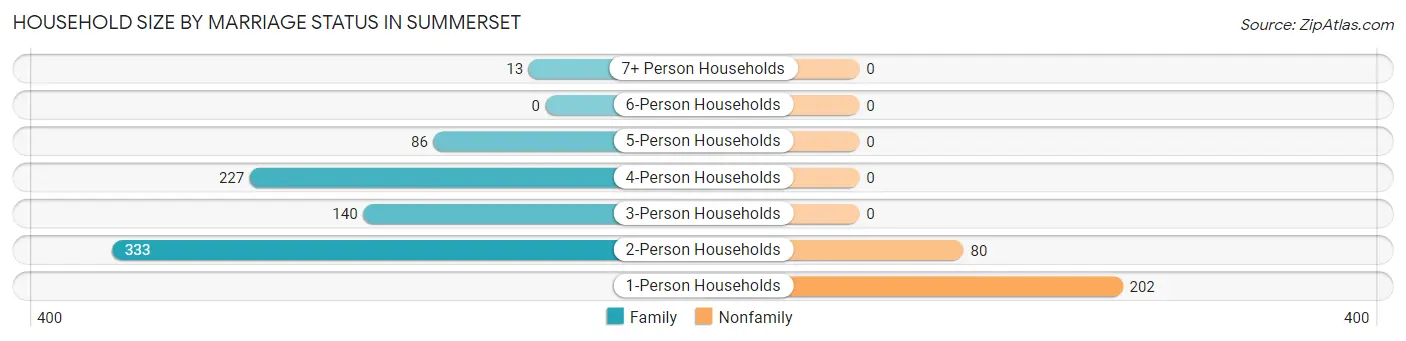
| Household Size | Family Households | Nonfamily Households |
| 1-Person Households | - | 202 (18.7%) |
| 2-Person Households | 333 (30.8%) | 80 (7.4%) |
| 3-Person Households | 140 (13.0%) | 0 (0.0%) |
| 4-Person Households | 227 (21.0%) | 0 (0.0%) |
| 5-Person Households | 86 (8.0%) | 0 (0.0%) |
| 6-Person Households | 0 (0.0%) | 0 (0.0%) |
| 7+ Person Households | 13 (1.2%) | 0 (0.0%) |
| Total | 799 (73.9%) | 282 (26.1%) |
Female Fertility in Summerset
Fertility by Age in Summerset
Average fertility rate in Summerset is 84.0 births per 1,000 women. Women in the age bracket of 20 to 34 years have the highest fertility rate with 165.0 births per 1,000 women. Women in the age bracket of 20 to 34 years acount for 95.8% of all women with births.
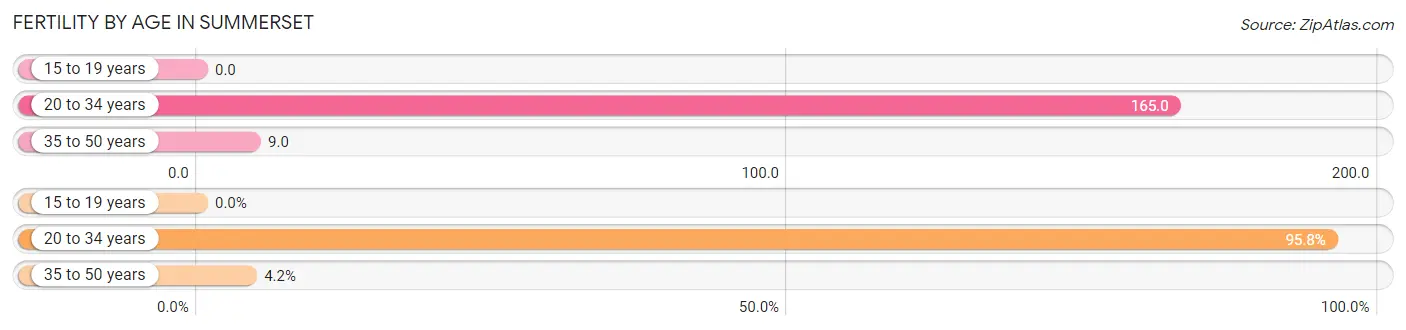
| Age Bracket | Women with Births | Births / 1,000 Women |
| 15 to 19 years | 0 (0.0%) | 0.0 |
| 20 to 34 years | 69 (95.8%) | 165.0 |
| 35 to 50 years | 3 (4.2%) | 9.0 |
| Total | 72 (100.0%) | 84.0 |
Fertility by Age by Marriage Status in Summerset
30.6% of women with births (72) in Summerset are married. The highest percentage of unmarried women with births falls into 20 to 34 years age bracket with 72.5% of them unmarried at the time of birth, while the lowest percentage of unmarried women with births belong to 35 to 50 years age bracket with 0.0% of them unmarried.
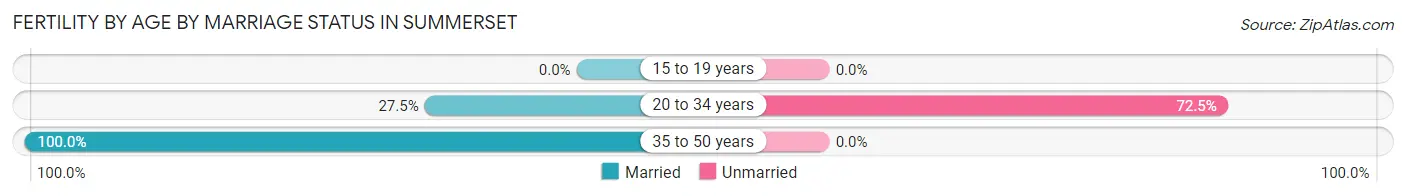
| Age Bracket | Married | Unmarried |
| 15 to 19 years | 0 (0.0%) | 0 (0.0%) |
| 20 to 34 years | 19 (27.5%) | 50 (72.5%) |
| 35 to 50 years | 3 (100.0%) | 0 (0.0%) |
| Total | 22 (30.6%) | 50 (69.4%) |
Fertility by Education in Summerset
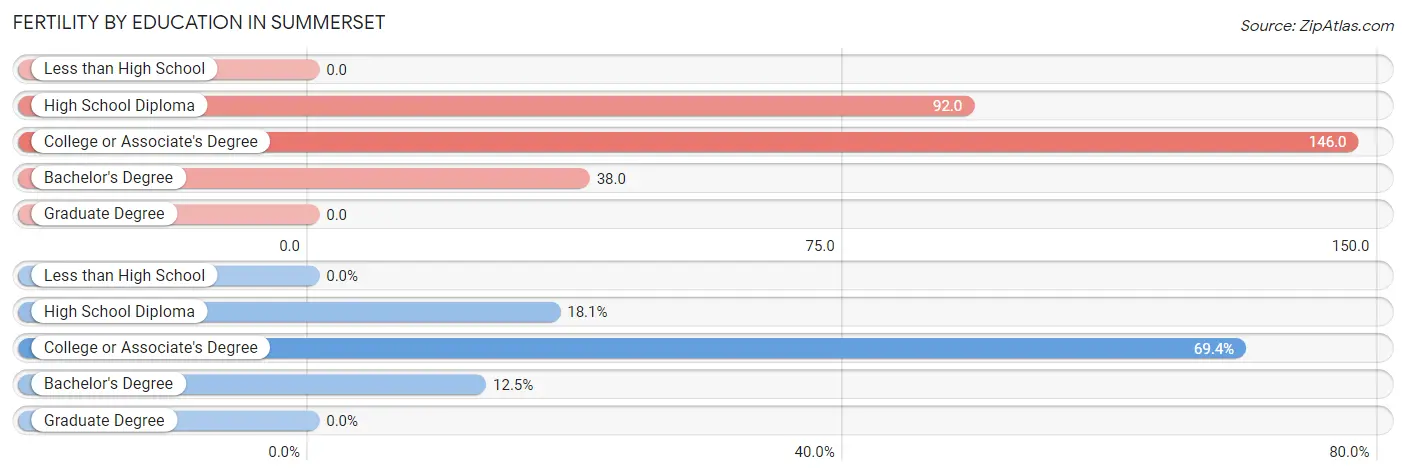
| Educational Attainment | Women with Births | Births / 1,000 Women |
| Less than High School | 0 (0.0%) | 0.0 |
| High School Diploma | 13 (18.1%) | 92.0 |
| College or Associate's Degree | 50 (69.4%) | 146.0 |
| Bachelor's Degree | 9 (12.5%) | 38.0 |
| Graduate Degree | 0 (0.0%) | 0.0 |
| Total | 72 (100.0%) | 84.0 |
Fertility by Education by Marriage Status in Summerset
69.4% of women with births in Summerset are unmarried. Women with the educational attainment of high school diploma are most likely to be married with 100.0% of them married at childbirth, while women with the educational attainment of college or associate's degree are least likely to be married with 88.0% of them unmarried at childbirth.
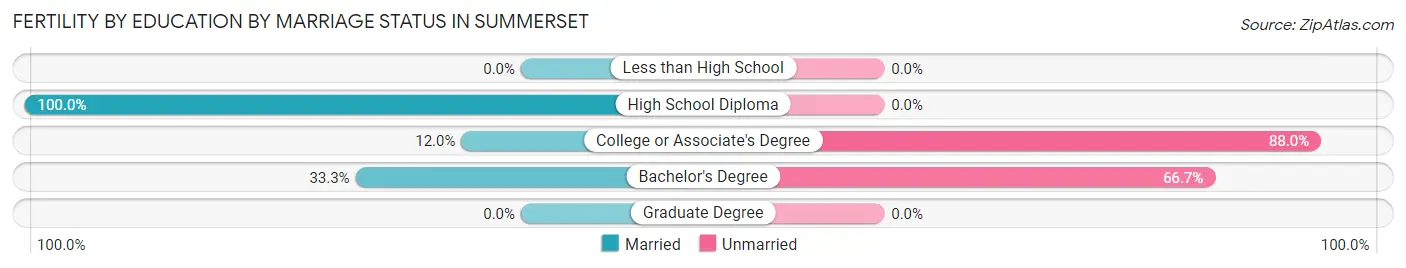
| Educational Attainment | Married | Unmarried |
| Less than High School | 0 (0.0%) | 0 (0.0%) |
| High School Diploma | 13 (100.0%) | 0 (0.0%) |
| College or Associate's Degree | 6 (12.0%) | 44 (88.0%) |
| Bachelor's Degree | 3 (33.3%) | 6 (66.7%) |
| Graduate Degree | 0 (0.0%) | 0 (0.0%) |
| Total | 22 (30.6%) | 50 (69.4%) |
Employment Characteristics in Summerset
Employment by Class of Employer in Summerset
Among the 1,576 employed individuals in Summerset, private company employees (877 | 55.6%), not-for-profit organizations (180 | 11.4%), and local government employees (159 | 10.1%) make up the most common classes of employment.
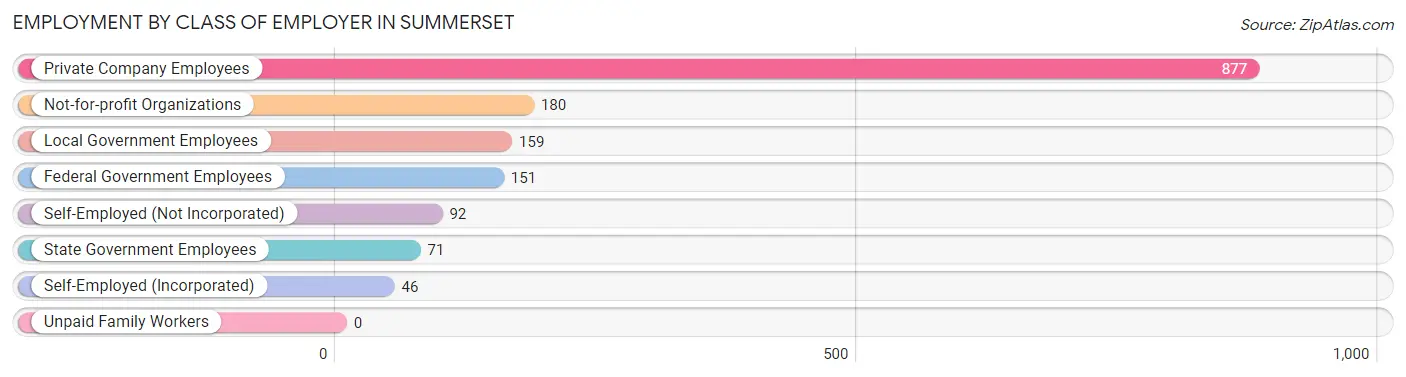
| Employer Class | # Employees | % Employees |
| Private Company Employees | 877 | 55.6% |
| Self-Employed (Incorporated) | 46 | 2.9% |
| Self-Employed (Not Incorporated) | 92 | 5.8% |
| Not-for-profit Organizations | 180 | 11.4% |
| Local Government Employees | 159 | 10.1% |
| State Government Employees | 71 | 4.5% |
| Federal Government Employees | 151 | 9.6% |
| Unpaid Family Workers | 0 | 0.0% |
| Total | 1,576 | 100.0% |
Employment Status by Age in Summerset
According to the labor force statistics for Summerset, out of the total population over 16 years of age (2,156), 75.9% or 1,636 individuals are in the labor force, with 1.9% or 31 of them unemployed. The age group with the highest labor force participation rate is 45 to 54 years, with 100.0% or 310 individuals in the labor force. Within the labor force, the 25 to 29 years age range has the highest percentage of unemployed individuals, with 18.1% or 31 of them being unemployed.
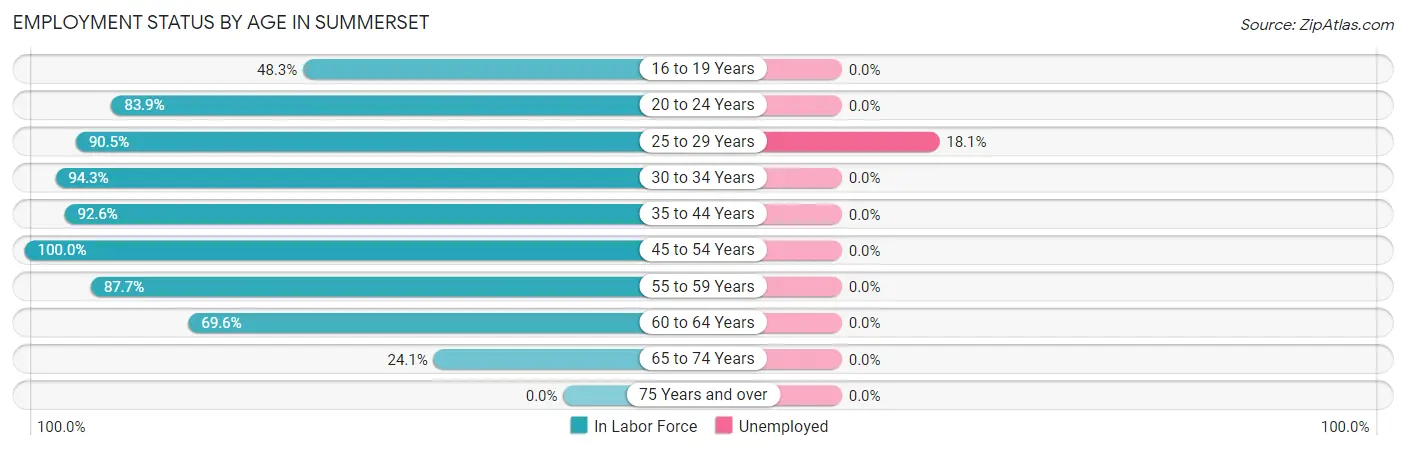
| Age Bracket | In Labor Force | Unemployed |
| 16 to 19 Years | 69 (48.3%) | 0 (0.0%) |
| 20 to 24 Years | 209 (83.9%) | 0 (0.0%) |
| 25 to 29 Years | 171 (90.5%) | 31 (18.1%) |
| 30 to 34 Years | 182 (94.3%) | 0 (0.0%) |
| 35 to 44 Years | 439 (92.6%) | 0 (0.0%) |
| 45 to 54 Years | 310 (100.0%) | 0 (0.0%) |
| 55 to 59 Years | 136 (87.7%) | 0 (0.0%) |
| 60 to 64 Years | 80 (69.6%) | 0 (0.0%) |
| 65 to 74 Years | 40 (24.1%) | 0 (0.0%) |
| 75 Years and over | 0 (0.0%) | 0 (0.0%) |
| Total | 1,636 (75.9%) | 31 (1.9%) |
Employment Status by Educational Attainment in Summerset
According to labor force statistics for Summerset, 91.8% of individuals (1,318) out of the total population between 25 and 64 years of age (1,436) are in the labor force, with 2.4% or 32 of them being unemployed. The group with the highest labor force participation rate are those with the educational attainment of bachelor's degree or higher, with 95.3% or 628 individuals in the labor force. Within the labor force, individuals with high school diploma education have the highest percentage of unemployment, with 7.4% or 14 of them being unemployed.
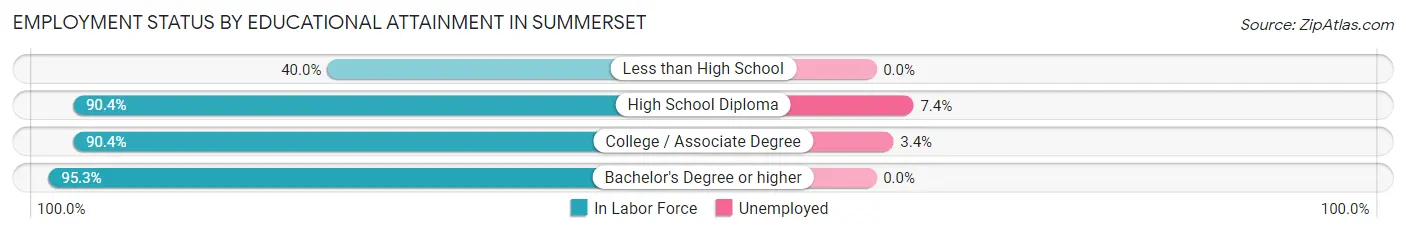
| Educational Attainment | In Labor Force | Unemployed |
| Less than High School | 10 (40.0%) | 0 (0.0%) |
| High School Diploma | 188 (90.4%) | 15 (7.4%) |
| College / Associate Degree | 492 (90.4%) | 18 (3.4%) |
| Bachelor's Degree or higher | 628 (95.3%) | 0 (0.0%) |
| Total | 1,318 (91.8%) | 34 (2.4%) |
Employment Occupations by Sex in Summerset
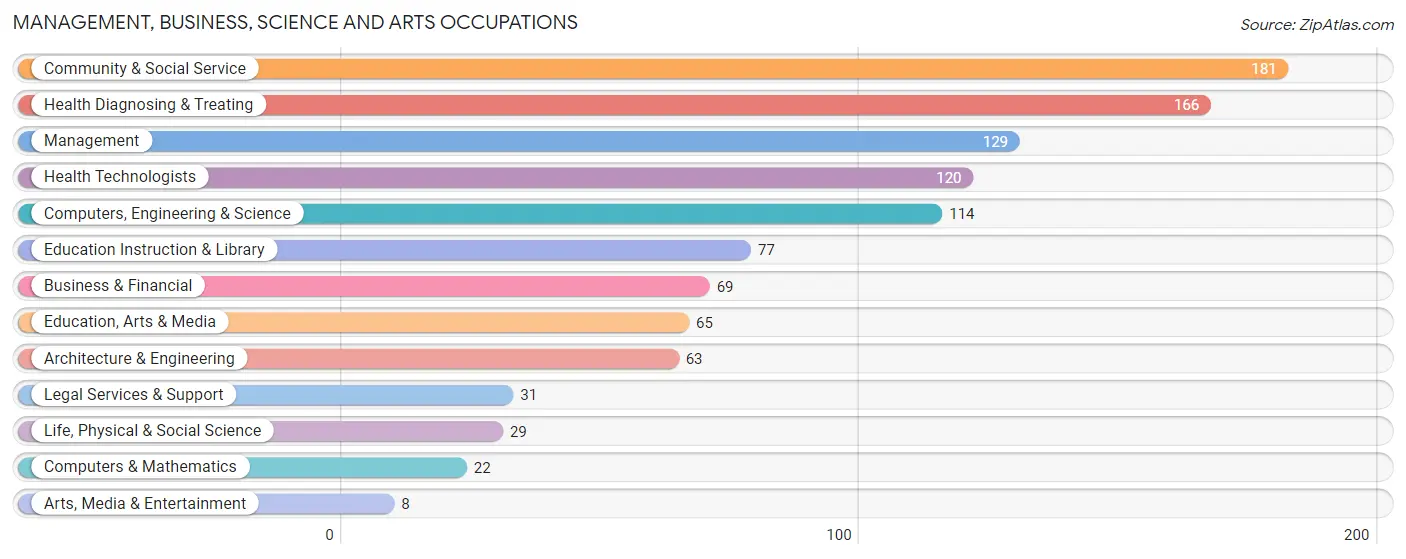
Management, Business, Science and Arts Occupations
The most common Management, Business, Science and Arts occupations in Summerset are Community & Social Service (181 | 11.6%), Health Diagnosing & Treating (166 | 10.6%), Management (129 | 8.3%), Health Technologists (120 | 7.7%), and Computers, Engineering & Science (114 | 7.3%).
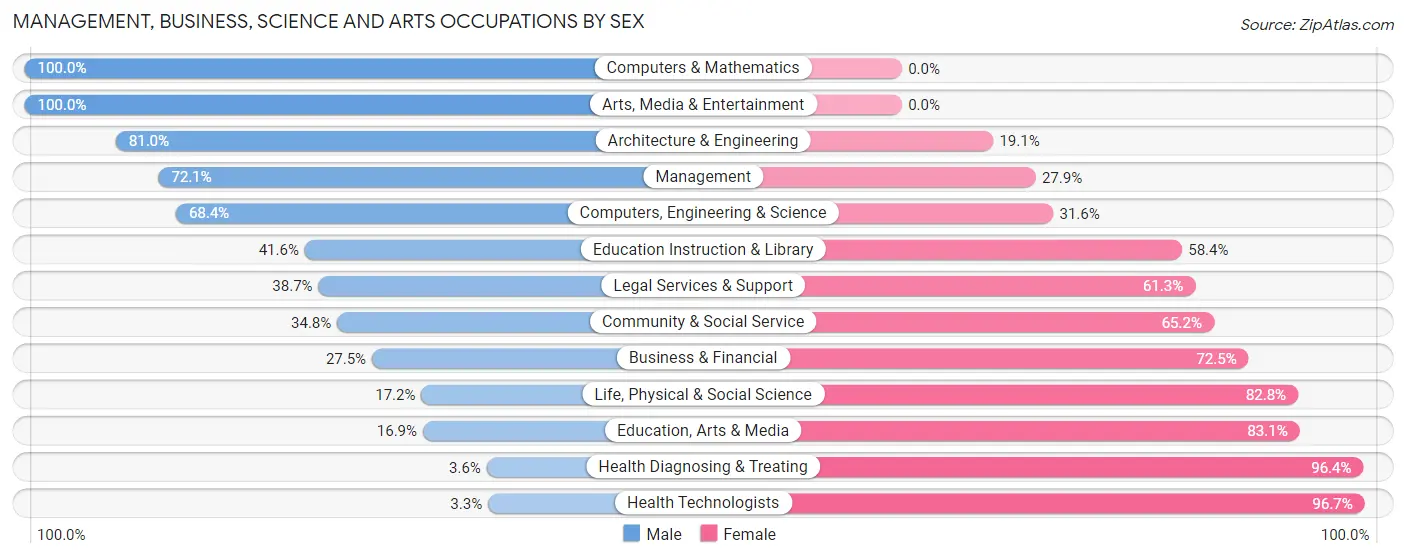
Management, Business, Science and Arts Occupations by Sex
Within the Management, Business, Science and Arts occupations in Summerset, the most male-oriented occupations are Computers & Mathematics (100.0%), Arts, Media & Entertainment (100.0%), and Architecture & Engineering (80.9%), while the most female-oriented occupations are Health Technologists (96.7%), Health Diagnosing & Treating (96.4%), and Education, Arts & Media (83.1%).
| Occupation | Male | Female |
| Management | 93 (72.1%) | 36 (27.9%) |
| Business & Financial | 19 (27.5%) | 50 (72.5%) |
| Computers, Engineering & Science | 78 (68.4%) | 36 (31.6%) |
| Computers & Mathematics | 22 (100.0%) | 0 (0.0%) |
| Architecture & Engineering | 51 (80.9%) | 12 (19.1%) |
| Life, Physical & Social Science | 5 (17.2%) | 24 (82.8%) |
| Community & Social Service | 63 (34.8%) | 118 (65.2%) |
| Education, Arts & Media | 11 (16.9%) | 54 (83.1%) |
| Legal Services & Support | 12 (38.7%) | 19 (61.3%) |
| Education Instruction & Library | 32 (41.6%) | 45 (58.4%) |
| Arts, Media & Entertainment | 8 (100.0%) | 0 (0.0%) |
| Health Diagnosing & Treating | 6 (3.6%) | 160 (96.4%) |
| Health Technologists | 4 (3.3%) | 116 (96.7%) |
| Total (Category) | 259 (39.3%) | 400 (60.7%) |
| Total (Overall) | 680 (43.6%) | 878 (56.4%) |
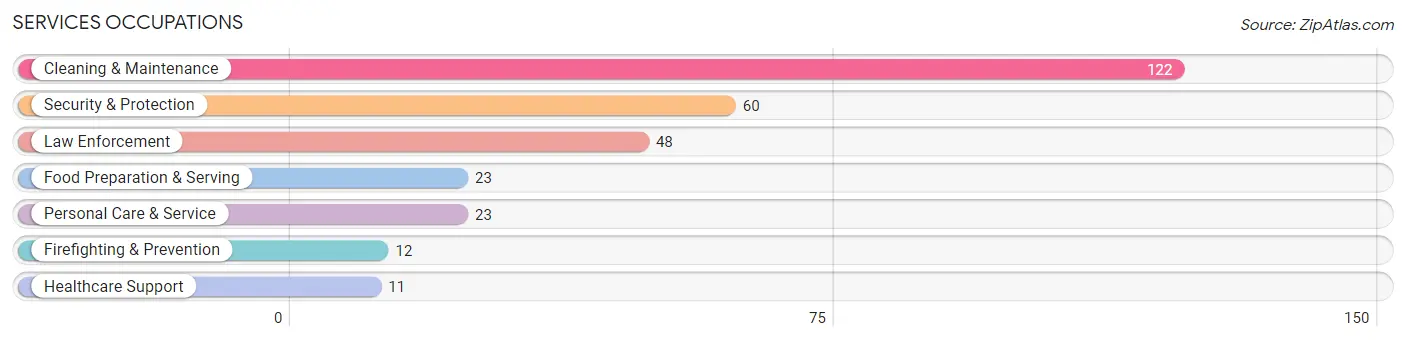
Services Occupations
The most common Services occupations in Summerset are Cleaning & Maintenance (122 | 7.8%), Security & Protection (60 | 3.8%), Law Enforcement (48 | 3.1%), Food Preparation & Serving (23 | 1.5%), and Personal Care & Service (23 | 1.5%).
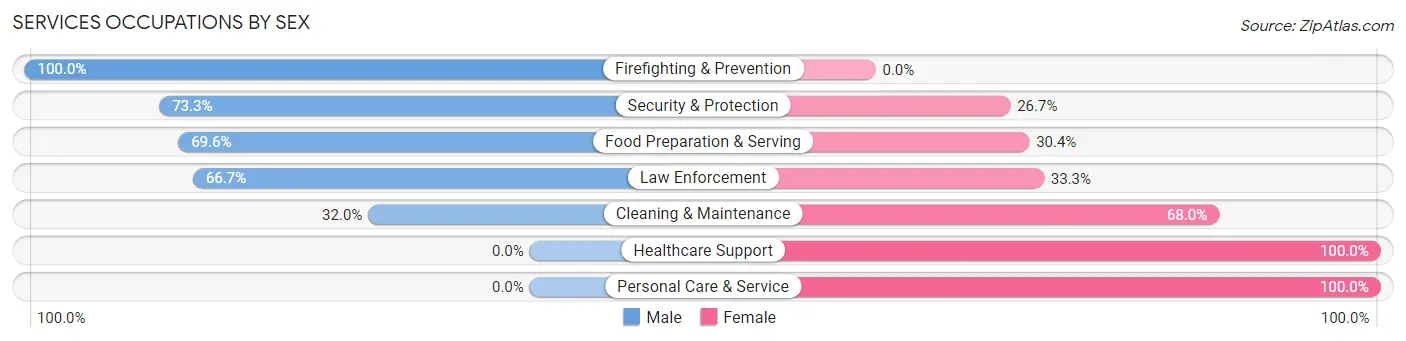
Services Occupations by Sex
Within the Services occupations in Summerset, the most male-oriented occupations are Firefighting & Prevention (100.0%), Security & Protection (73.3%), and Food Preparation & Serving (69.6%), while the most female-oriented occupations are Healthcare Support (100.0%), Personal Care & Service (100.0%), and Cleaning & Maintenance (68.0%).
| Occupation | Male | Female |
| Healthcare Support | 0 (0.0%) | 11 (100.0%) |
| Security & Protection | 44 (73.3%) | 16 (26.7%) |
| Firefighting & Prevention | 12 (100.0%) | 0 (0.0%) |
| Law Enforcement | 32 (66.7%) | 16 (33.3%) |
| Food Preparation & Serving | 16 (69.6%) | 7 (30.4%) |
| Cleaning & Maintenance | 39 (32.0%) | 83 (68.0%) |
| Personal Care & Service | 0 (0.0%) | 23 (100.0%) |
| Total (Category) | 99 (41.4%) | 140 (58.6%) |
| Total (Overall) | 680 (43.6%) | 878 (56.4%) |
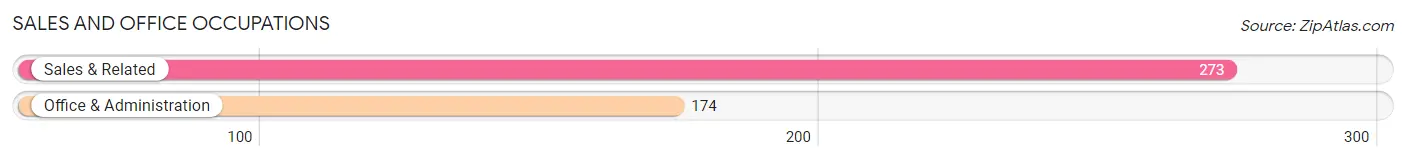
Sales and Office Occupations
The most common Sales and Office occupations in Summerset are Sales & Related (273 | 17.5%), and Office & Administration (174 | 11.2%).
Sales and Office Occupations by Sex
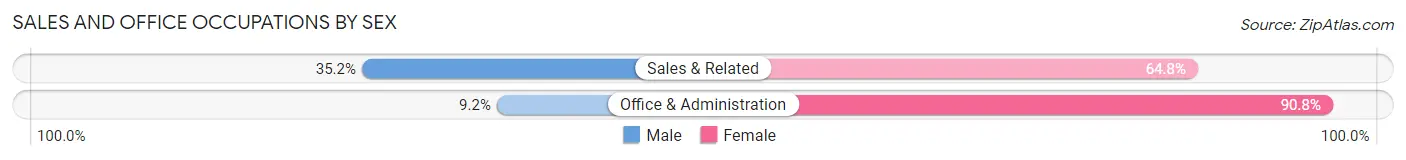
| Occupation | Male | Female |
| Sales & Related | 96 (35.2%) | 177 (64.8%) |
| Office & Administration | 16 (9.2%) | 158 (90.8%) |
| Total (Category) | 112 (25.1%) | 335 (74.9%) |
| Total (Overall) | 680 (43.6%) | 878 (56.4%) |
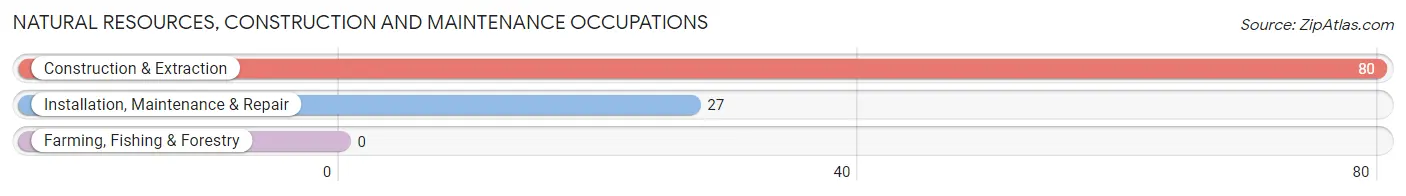
Natural Resources, Construction and Maintenance Occupations
The most common Natural Resources, Construction and Maintenance occupations in Summerset are Construction & Extraction (80 | 5.1%), and Installation, Maintenance & Repair (27 | 1.7%).
Natural Resources, Construction and Maintenance Occupations by Sex
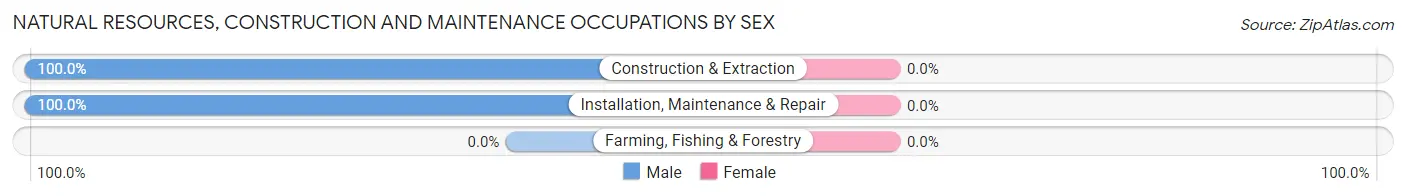
| Occupation | Male | Female |
| Farming, Fishing & Forestry | 0 (0.0%) | 0 (0.0%) |
| Construction & Extraction | 80 (100.0%) | 0 (0.0%) |
| Installation, Maintenance & Repair | 27 (100.0%) | 0 (0.0%) |
| Total (Category) | 107 (100.0%) | 0 (0.0%) |
| Total (Overall) | 680 (43.6%) | 878 (56.4%) |
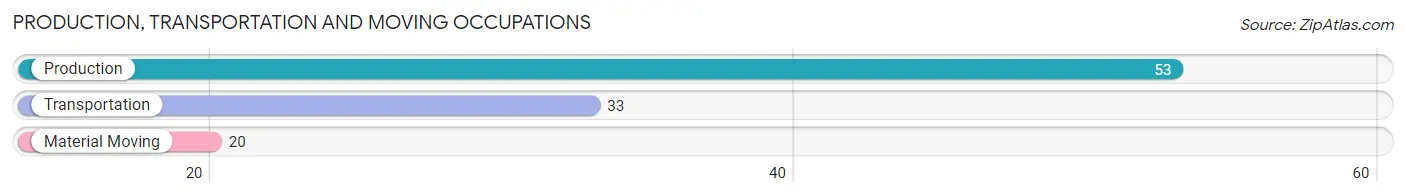
Production, Transportation and Moving Occupations
The most common Production, Transportation and Moving occupations in Summerset are Production (53 | 3.4%), Transportation (33 | 2.1%), and Material Moving (20 | 1.3%).
Production, Transportation and Moving Occupations by Sex
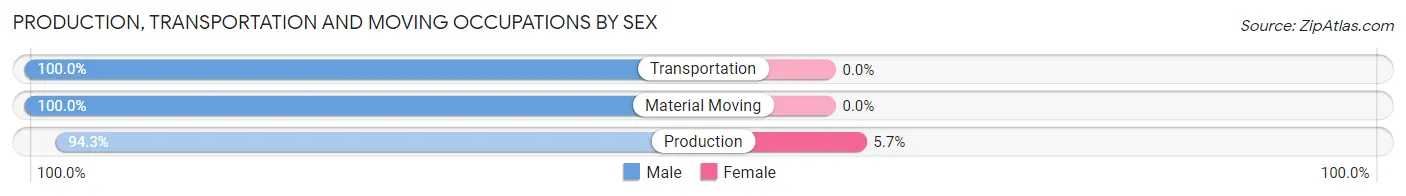
| Occupation | Male | Female |
| Production | 50 (94.3%) | 3 (5.7%) |
| Transportation | 33 (100.0%) | 0 (0.0%) |
| Material Moving | 20 (100.0%) | 0 (0.0%) |
| Total (Category) | 103 (97.2%) | 3 (2.8%) |
| Total (Overall) | 680 (43.6%) | 878 (56.4%) |
Employment Industries by Sex in Summerset
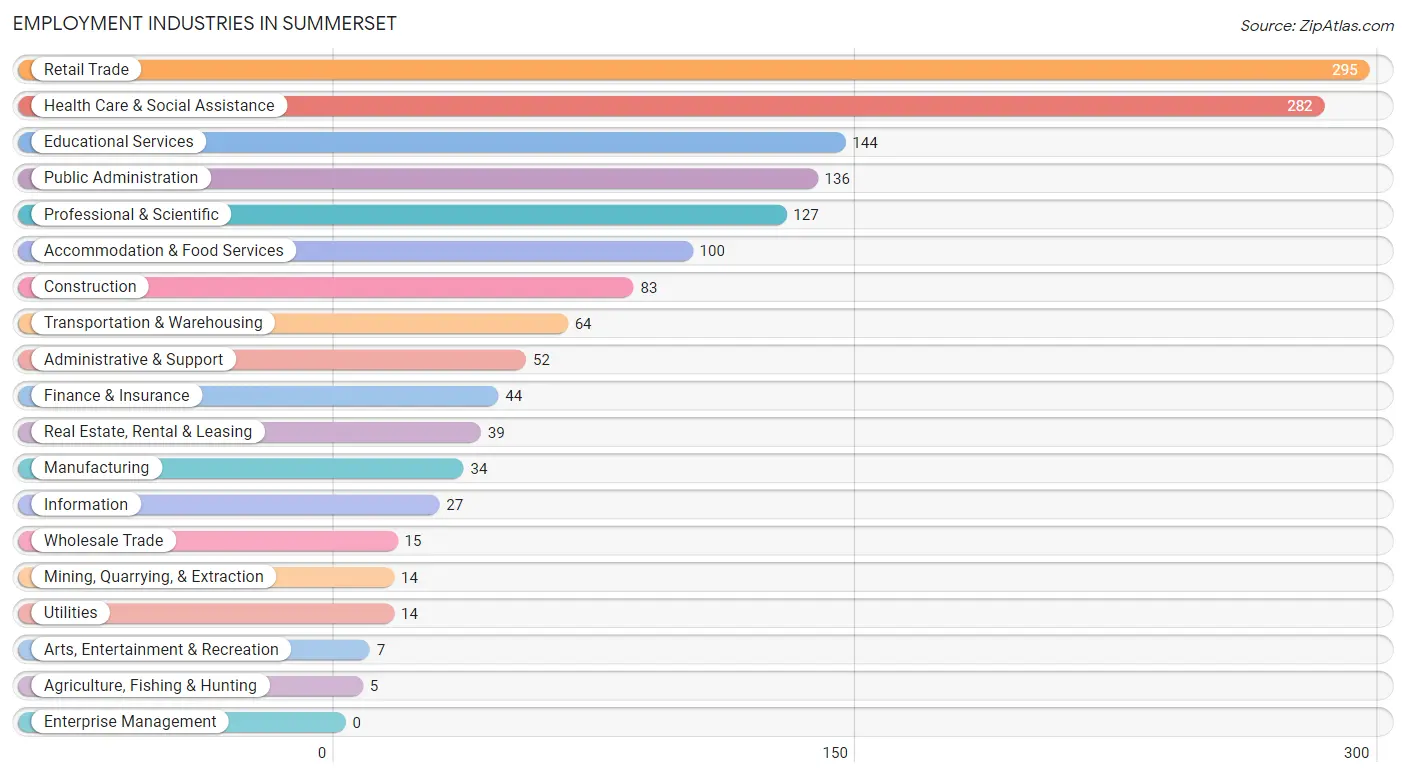
Employment Industries in Summerset
The major employment industries in Summerset include Retail Trade (295 | 18.9%), Health Care & Social Assistance (282 | 18.1%), Educational Services (144 | 9.2%), Public Administration (136 | 8.7%), and Professional & Scientific (127 | 8.2%).
Employment Industries by Sex in Summerset
The Summerset industries that see more men than women are Agriculture, Fishing & Hunting (100.0%), Mining, Quarrying, & Extraction (100.0%), and Construction (100.0%), whereas the industries that tend to have a higher number of women are Arts, Entertainment & Recreation (100.0%), Health Care & Social Assistance (87.6%), and Accommodation & Food Services (84.0%).
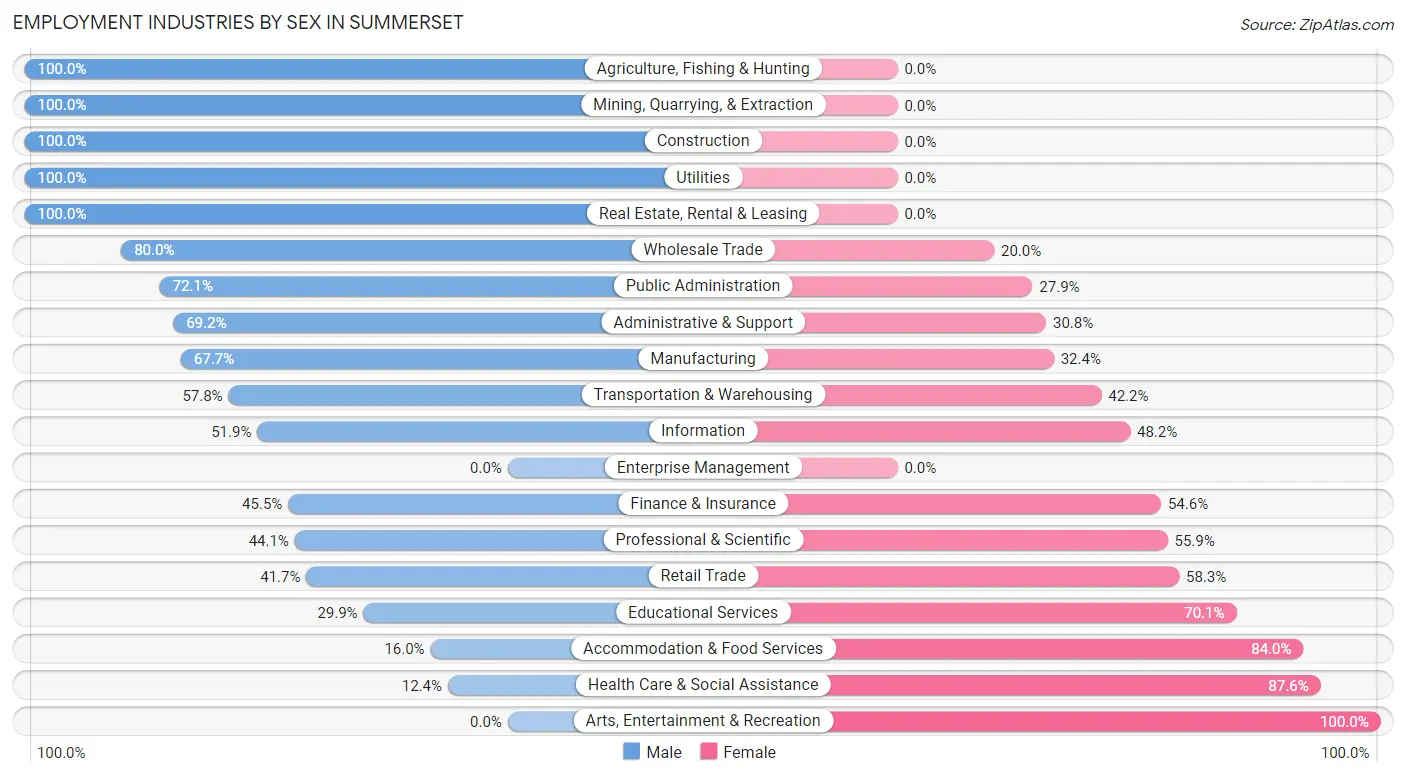
| Industry | Male | Female |
| Agriculture, Fishing & Hunting | 5 (100.0%) | 0 (0.0%) |
| Mining, Quarrying, & Extraction | 14 (100.0%) | 0 (0.0%) |
| Construction | 83 (100.0%) | 0 (0.0%) |
| Manufacturing | 23 (67.6%) | 11 (32.4%) |
| Wholesale Trade | 12 (80.0%) | 3 (20.0%) |
| Retail Trade | 123 (41.7%) | 172 (58.3%) |
| Transportation & Warehousing | 37 (57.8%) | 27 (42.2%) |
| Utilities | 14 (100.0%) | 0 (0.0%) |
| Information | 14 (51.8%) | 13 (48.1%) |
| Finance & Insurance | 20 (45.5%) | 24 (54.5%) |
| Real Estate, Rental & Leasing | 39 (100.0%) | 0 (0.0%) |
| Professional & Scientific | 56 (44.1%) | 71 (55.9%) |
| Enterprise Management | 0 (0.0%) | 0 (0.0%) |
| Administrative & Support | 36 (69.2%) | 16 (30.8%) |
| Educational Services | 43 (29.9%) | 101 (70.1%) |
| Health Care & Social Assistance | 35 (12.4%) | 247 (87.6%) |
| Arts, Entertainment & Recreation | 0 (0.0%) | 7 (100.0%) |
| Accommodation & Food Services | 16 (16.0%) | 84 (84.0%) |
| Public Administration | 98 (72.1%) | 38 (27.9%) |
| Total | 680 (43.6%) | 878 (56.4%) |
Education in Summerset
School Enrollment in Summerset
The most common levels of schooling among the 805 students in Summerset are middle school (288 | 35.8%), elementary school (161 | 20.0%), and high school (137 | 17.0%).
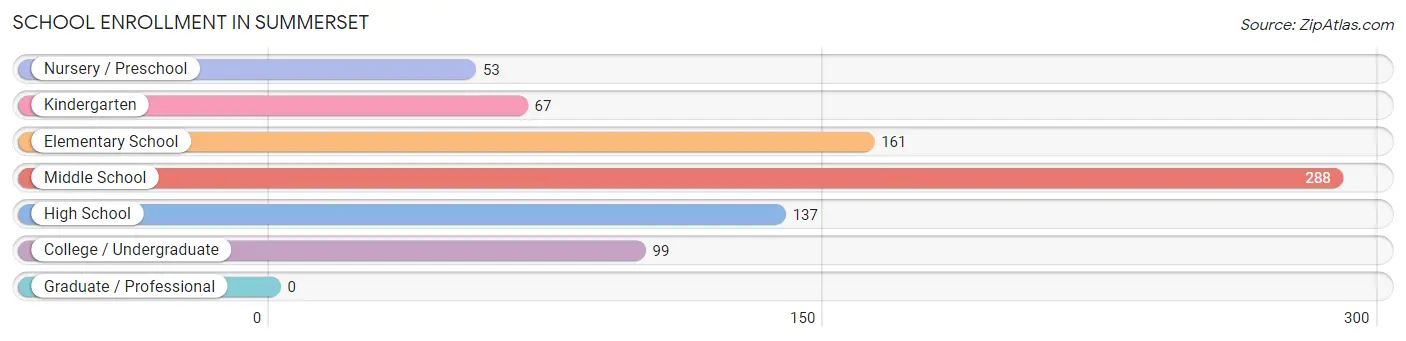
| School Level | # Students | % Students |
| Nursery / Preschool | 53 | 6.6% |
| Kindergarten | 67 | 8.3% |
| Elementary School | 161 | 20.0% |
| Middle School | 288 | 35.8% |
| High School | 137 | 17.0% |
| College / Undergraduate | 99 | 12.3% |
| Graduate / Professional | 0 | 0.0% |
| Total | 805 | 100.0% |
School Enrollment by Age by Funding Source in Summerset
Out of a total of 805 students who are enrolled in schools in Summerset, 164 (20.4%) attend a private institution, while the remaining 641 (79.6%) are enrolled in public schools. The age group of 3 to 4 year olds has the highest likelihood of being enrolled in private schools, with 14 (26.9% in the age bracket) enrolled. Conversely, the age group of 18 to 19 year olds has the lowest likelihood of being enrolled in a private school, with 75 (100.0% in the age bracket) attending a public institution.
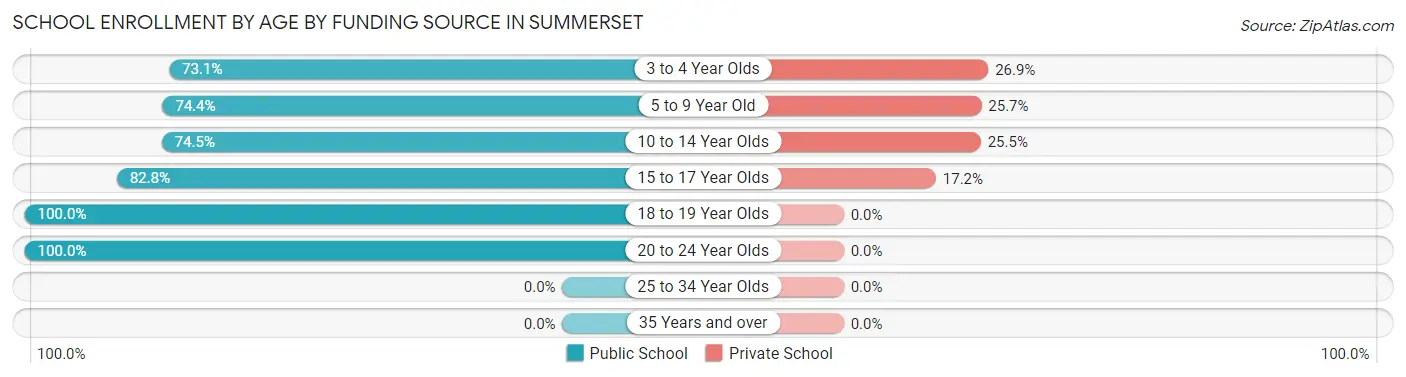
| Age Bracket | Public School | Private School |
| 3 to 4 Year Olds | 38 (73.1%) | 14 (26.9%) |
| 5 to 9 Year Old | 142 (74.4%) | 49 (25.7%) |
| 10 to 14 Year Olds | 245 (74.5%) | 84 (25.5%) |
| 15 to 17 Year Olds | 82 (82.8%) | 17 (17.2%) |
| 18 to 19 Year Olds | 75 (100.0%) | 0 (0.0%) |
| 20 to 24 Year Olds | 59 (100.0%) | 0 (0.0%) |
| 25 to 34 Year Olds | 0 (0.0%) | 0 (0.0%) |
| 35 Years and over | 0 (0.0%) | 0 (0.0%) |
| Total | 641 (79.6%) | 164 (20.4%) |
Educational Attainment by Field of Study in Summerset
Science & technology (141 | 17.3%), business (101 | 12.4%), visual & performing arts (96 | 11.7%), arts & humanities (81 | 9.9%), and social sciences (78 | 9.6%) are the most common fields of study among 817 individuals in Summerset who have obtained a bachelor's degree or higher.
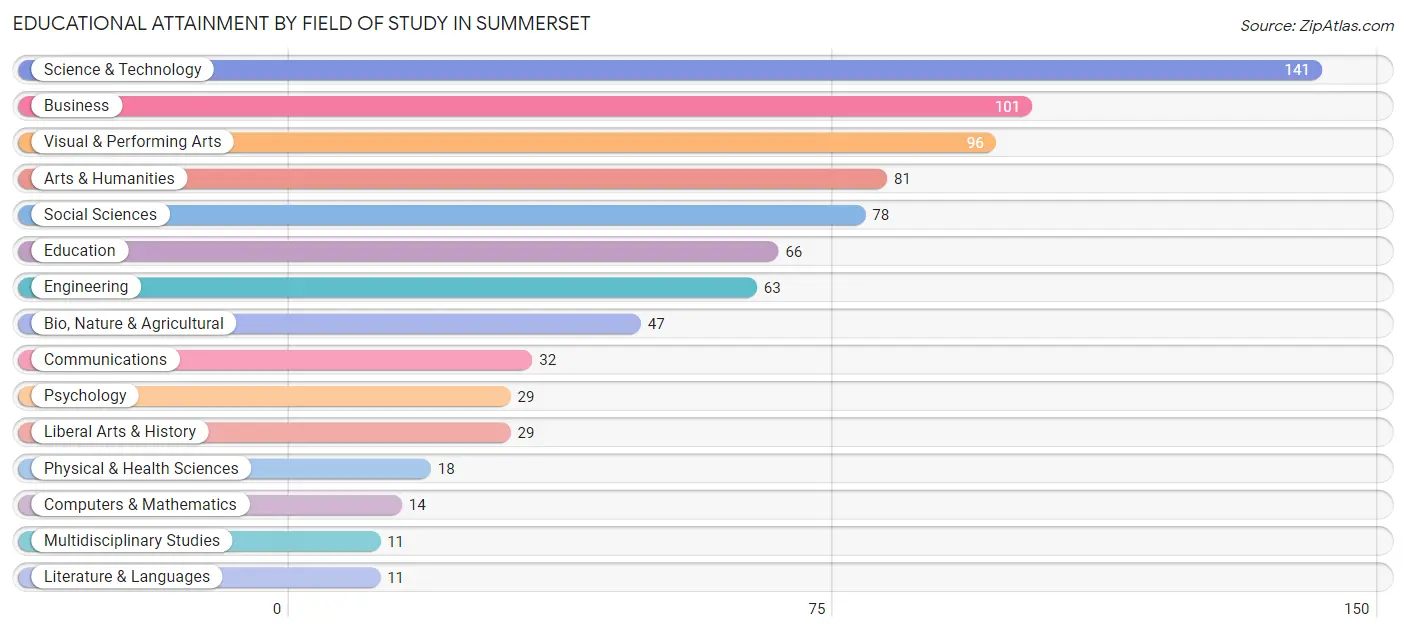
| Field of Study | # Graduates | % Graduates |
| Computers & Mathematics | 14 | 1.7% |
| Bio, Nature & Agricultural | 47 | 5.8% |
| Physical & Health Sciences | 18 | 2.2% |
| Psychology | 29 | 3.5% |
| Social Sciences | 78 | 9.6% |
| Engineering | 63 | 7.7% |
| Multidisciplinary Studies | 11 | 1.3% |
| Science & Technology | 141 | 17.3% |
| Business | 101 | 12.4% |
| Education | 66 | 8.1% |
| Literature & Languages | 11 | 1.3% |
| Liberal Arts & History | 29 | 3.5% |
| Visual & Performing Arts | 96 | 11.7% |
| Communications | 32 | 3.9% |
| Arts & Humanities | 81 | 9.9% |
| Total | 817 | 100.0% |
Transportation & Commute in Summerset
Vehicle Availability by Sex in Summerset
The most prevalent vehicle ownership categories in Summerset are males with 2 vehicles (348, accounting for 49.2%) and females with 2 vehicles (494, making up 40.1%).
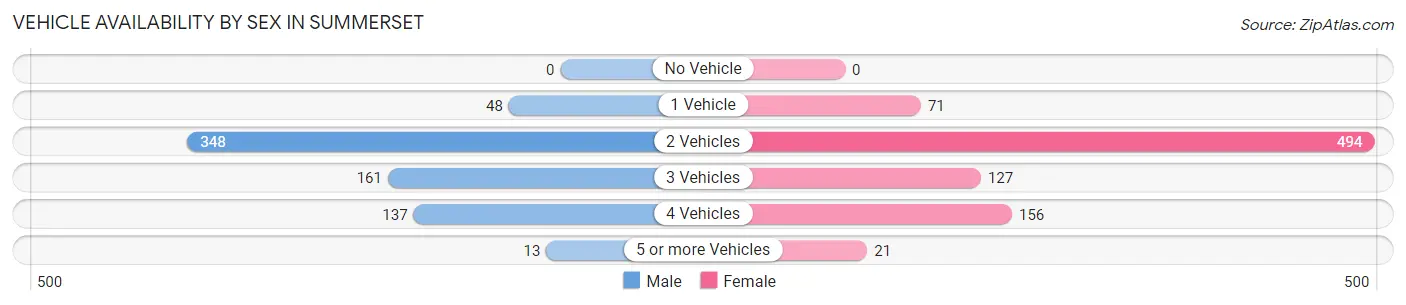
| Vehicles Available | Male | Female |
| No Vehicle | 0 (0.0%) | 0 (0.0%) |
| 1 Vehicle | 48 (6.8%) | 71 (8.2%) |
| 2 Vehicles | 348 (49.2%) | 494 (56.9%) |
| 3 Vehicles | 161 (22.8%) | 127 (14.6%) |
| 4 Vehicles | 137 (19.4%) | 156 (17.9%) |
| 5 or more Vehicles | 13 (1.8%) | 21 (2.4%) |
| Total | 707 (100.0%) | 869 (100.0%) |
Commute Time in Summerset
The most frequently occuring commute durations in Summerset are 20 to 24 minutes (399 commuters, 26.0%), 15 to 19 minutes (370 commuters, 24.1%), and 25 to 29 minutes (200 commuters, 13.0%).
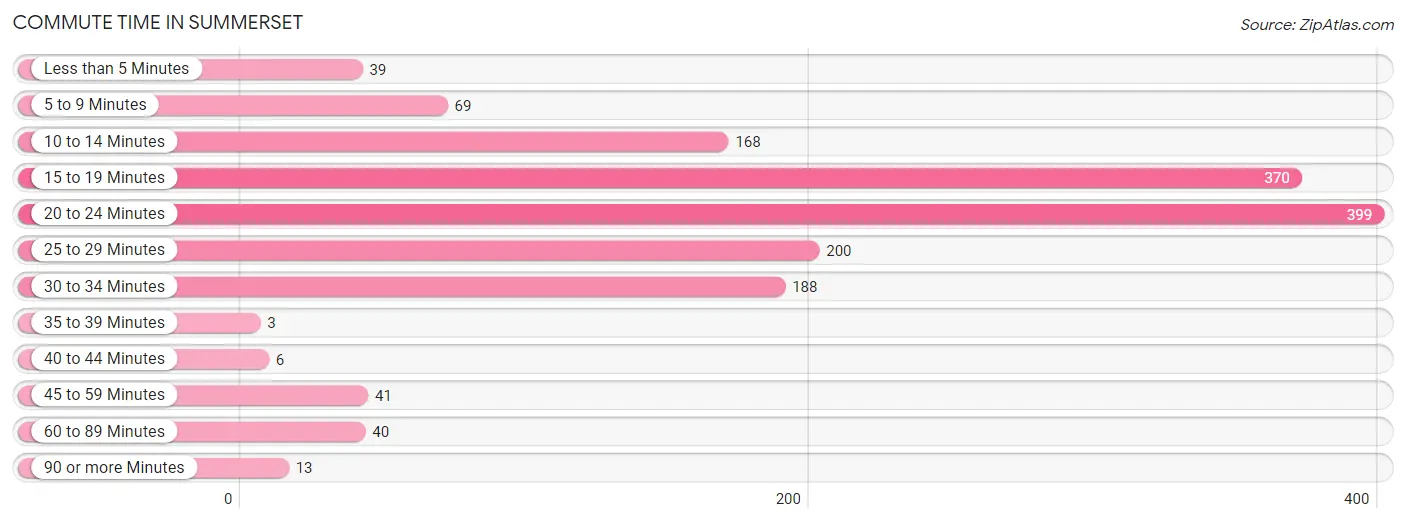
| Commute Time | # Commuters | % Commuters |
| Less than 5 Minutes | 39 | 2.5% |
| 5 to 9 Minutes | 69 | 4.5% |
| 10 to 14 Minutes | 168 | 10.9% |
| 15 to 19 Minutes | 370 | 24.1% |
| 20 to 24 Minutes | 399 | 26.0% |
| 25 to 29 Minutes | 200 | 13.0% |
| 30 to 34 Minutes | 188 | 12.2% |
| 35 to 39 Minutes | 3 | 0.2% |
| 40 to 44 Minutes | 6 | 0.4% |
| 45 to 59 Minutes | 41 | 2.7% |
| 60 to 89 Minutes | 40 | 2.6% |
| 90 or more Minutes | 13 | 0.9% |
Commute Time by Sex in Summerset
The most common commute times in Summerset are 15 to 19 minutes (164 commuters, 23.5%) for males and 20 to 24 minutes (251 commuters, 29.9%) for females.
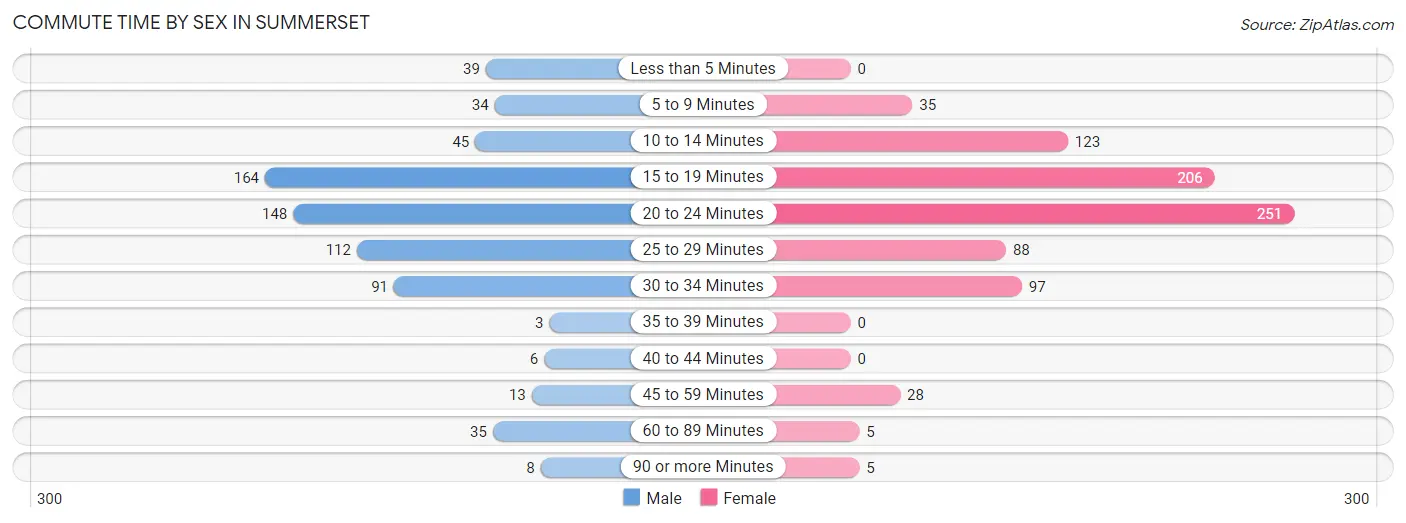
| Commute Time | Male | Female |
| Less than 5 Minutes | 39 (5.6%) | 0 (0.0%) |
| 5 to 9 Minutes | 34 (4.9%) | 35 (4.2%) |
| 10 to 14 Minutes | 45 (6.5%) | 123 (14.7%) |
| 15 to 19 Minutes | 164 (23.5%) | 206 (24.6%) |
| 20 to 24 Minutes | 148 (21.2%) | 251 (29.9%) |
| 25 to 29 Minutes | 112 (16.1%) | 88 (10.5%) |
| 30 to 34 Minutes | 91 (13.0%) | 97 (11.6%) |
| 35 to 39 Minutes | 3 (0.4%) | 0 (0.0%) |
| 40 to 44 Minutes | 6 (0.9%) | 0 (0.0%) |
| 45 to 59 Minutes | 13 (1.9%) | 28 (3.3%) |
| 60 to 89 Minutes | 35 (5.0%) | 5 (0.6%) |
| 90 or more Minutes | 8 (1.1%) | 5 (0.6%) |
Time of Departure to Work by Sex in Summerset
The most frequent times of departure to work in Summerset are 6:30 AM to 6:59 AM (125, 17.9%) for males and 7:30 AM to 7:59 AM (183, 21.8%) for females.
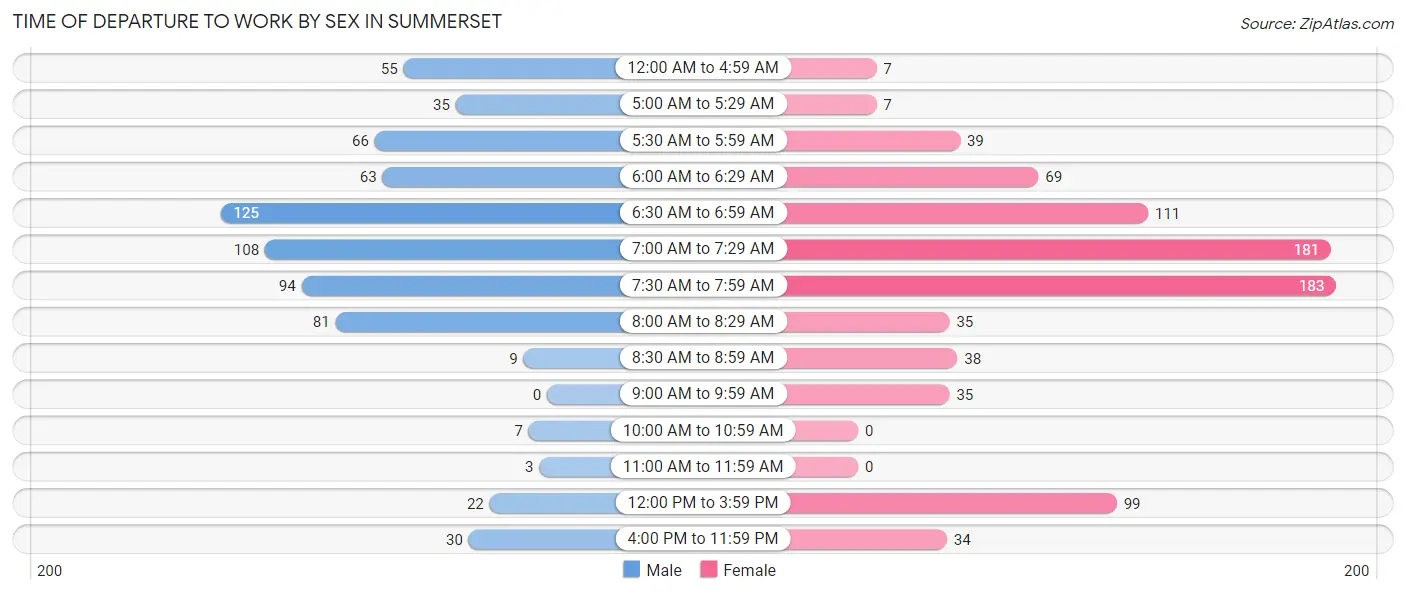
| Time of Departure | Male | Female |
| 12:00 AM to 4:59 AM | 55 (7.9%) | 7 (0.8%) |
| 5:00 AM to 5:29 AM | 35 (5.0%) | 7 (0.8%) |
| 5:30 AM to 5:59 AM | 66 (9.5%) | 39 (4.6%) |
| 6:00 AM to 6:29 AM | 63 (9.0%) | 69 (8.2%) |
| 6:30 AM to 6:59 AM | 125 (17.9%) | 111 (13.3%) |
| 7:00 AM to 7:29 AM | 108 (15.5%) | 181 (21.6%) |
| 7:30 AM to 7:59 AM | 94 (13.5%) | 183 (21.8%) |
| 8:00 AM to 8:29 AM | 81 (11.6%) | 35 (4.2%) |
| 8:30 AM to 8:59 AM | 9 (1.3%) | 38 (4.5%) |
| 9:00 AM to 9:59 AM | 0 (0.0%) | 35 (4.2%) |
| 10:00 AM to 10:59 AM | 7 (1.0%) | 0 (0.0%) |
| 11:00 AM to 11:59 AM | 3 (0.4%) | 0 (0.0%) |
| 12:00 PM to 3:59 PM | 22 (3.2%) | 99 (11.8%) |
| 4:00 PM to 11:59 PM | 30 (4.3%) | 34 (4.1%) |
| Total | 698 (100.0%) | 838 (100.0%) |
Housing Occupancy in Summerset
Occupancy by Ownership in Summerset
Of the total 1,081 dwellings in Summerset, owner-occupied units account for 851 (78.7%), while renter-occupied units make up 230 (21.3%).
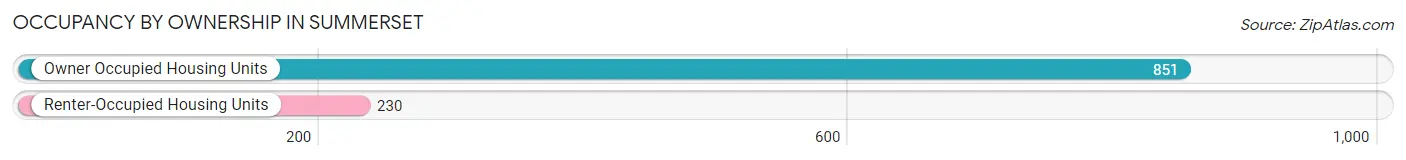
| Occupancy | # Housing Units | % Housing Units |
| Owner Occupied Housing Units | 851 | 78.7% |
| Renter-Occupied Housing Units | 230 | 21.3% |
| Total Occupied Housing Units | 1,081 | 100.0% |
Occupancy by Household Size in Summerset
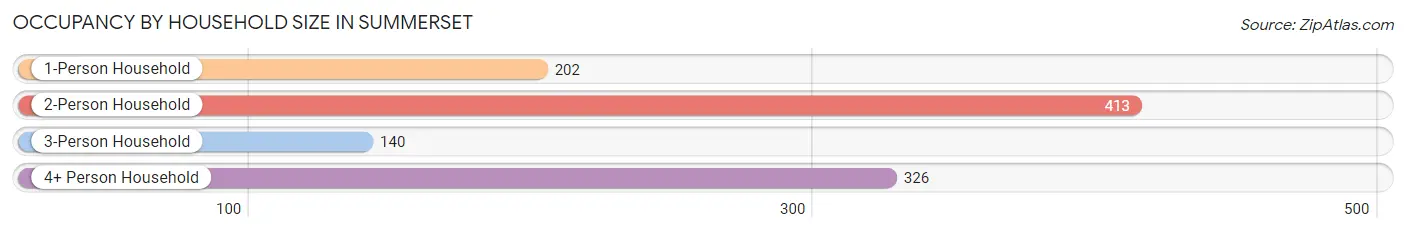
| Household Size | # Housing Units | % Housing Units |
| 1-Person Household | 202 | 18.7% |
| 2-Person Household | 413 | 38.2% |
| 3-Person Household | 140 | 13.0% |
| 4+ Person Household | 326 | 30.2% |
| Total Housing Units | 1,081 | 100.0% |
Occupancy by Ownership by Household Size in Summerset
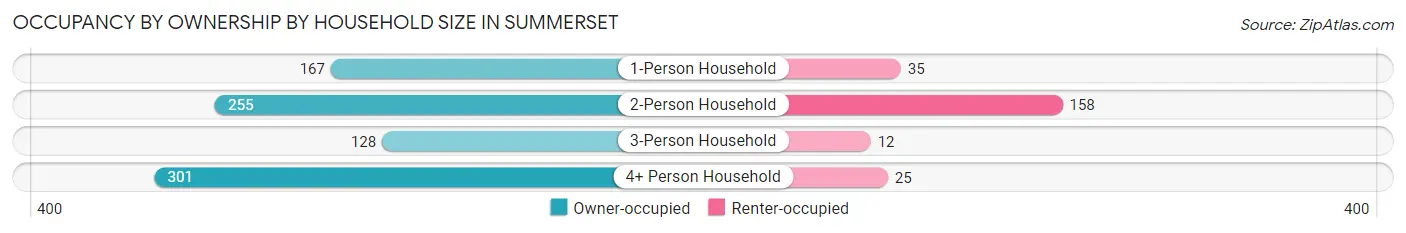
| Household Size | Owner-occupied | Renter-occupied |
| 1-Person Household | 167 (82.7%) | 35 (17.3%) |
| 2-Person Household | 255 (61.7%) | 158 (38.3%) |
| 3-Person Household | 128 (91.4%) | 12 (8.6%) |
| 4+ Person Household | 301 (92.3%) | 25 (7.7%) |
| Total Housing Units | 851 (78.7%) | 230 (21.3%) |
Occupancy by Educational Attainment in Summerset
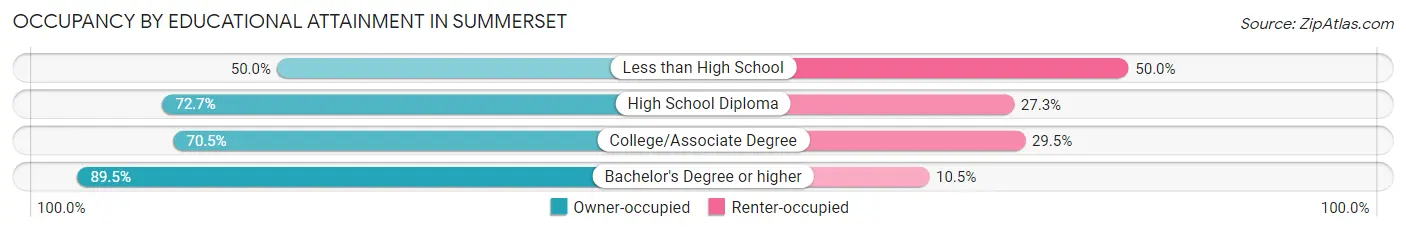
| Household Size | Owner-occupied | Renter-occupied |
| Less than High School | 3 (50.0%) | 3 (50.0%) |
| High School Diploma | 165 (72.7%) | 62 (27.3%) |
| College/Associate Degree | 282 (70.5%) | 118 (29.5%) |
| Bachelor's Degree or higher | 401 (89.5%) | 47 (10.5%) |
Occupancy by Age of Householder in Summerset
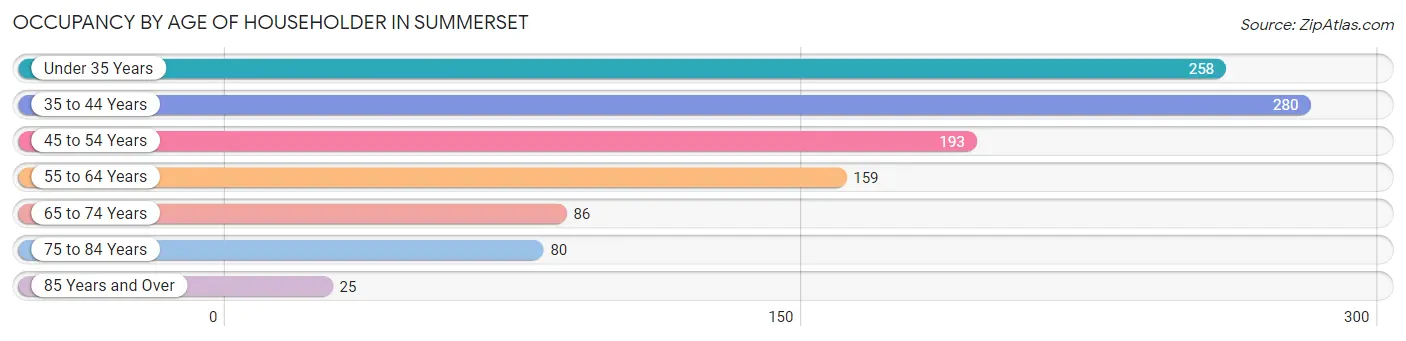
| Age Bracket | # Households | % Households |
| Under 35 Years | 258 | 23.9% |
| 35 to 44 Years | 280 | 25.9% |
| 45 to 54 Years | 193 | 17.8% |
| 55 to 64 Years | 159 | 14.7% |
| 65 to 74 Years | 86 | 8.0% |
| 75 to 84 Years | 80 | 7.4% |
| 85 Years and Over | 25 | 2.3% |
| Total | 1,081 | 100.0% |
Housing Finances in Summerset
Median Income by Occupancy in Summerset
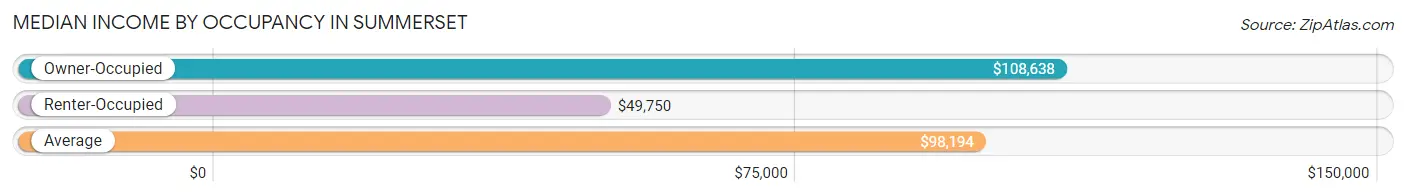
| Occupancy Type | # Households | Median Income |
| Owner-Occupied | 851 (78.7%) | $108,638 |
| Renter-Occupied | 230 (21.3%) | $49,750 |
| Average | 1,081 (100.0%) | $98,194 |
Occupancy by Householder Income Bracket in Summerset
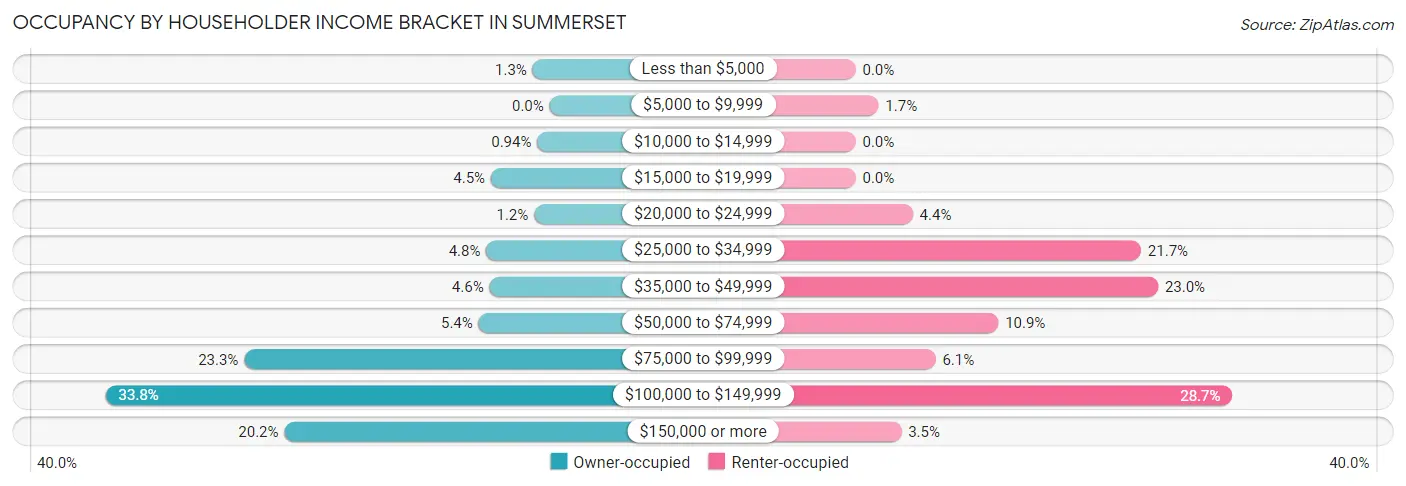
| Income Bracket | Owner-occupied | Renter-occupied |
| Less than $5,000 | 11 (1.3%) | 0 (0.0%) |
| $5,000 to $9,999 | 0 (0.0%) | 4 (1.7%) |
| $10,000 to $14,999 | 8 (0.9%) | 0 (0.0%) |
| $15,000 to $19,999 | 38 (4.5%) | 0 (0.0%) |
| $20,000 to $24,999 | 10 (1.2%) | 10 (4.3%) |
| $25,000 to $34,999 | 41 (4.8%) | 50 (21.7%) |
| $35,000 to $49,999 | 39 (4.6%) | 53 (23.0%) |
| $50,000 to $74,999 | 46 (5.4%) | 25 (10.9%) |
| $75,000 to $99,999 | 198 (23.3%) | 14 (6.1%) |
| $100,000 to $149,999 | 288 (33.8%) | 66 (28.7%) |
| $150,000 or more | 172 (20.2%) | 8 (3.5%) |
| Total | 851 (100.0%) | 230 (100.0%) |
Monthly Housing Cost Tiers in Summerset
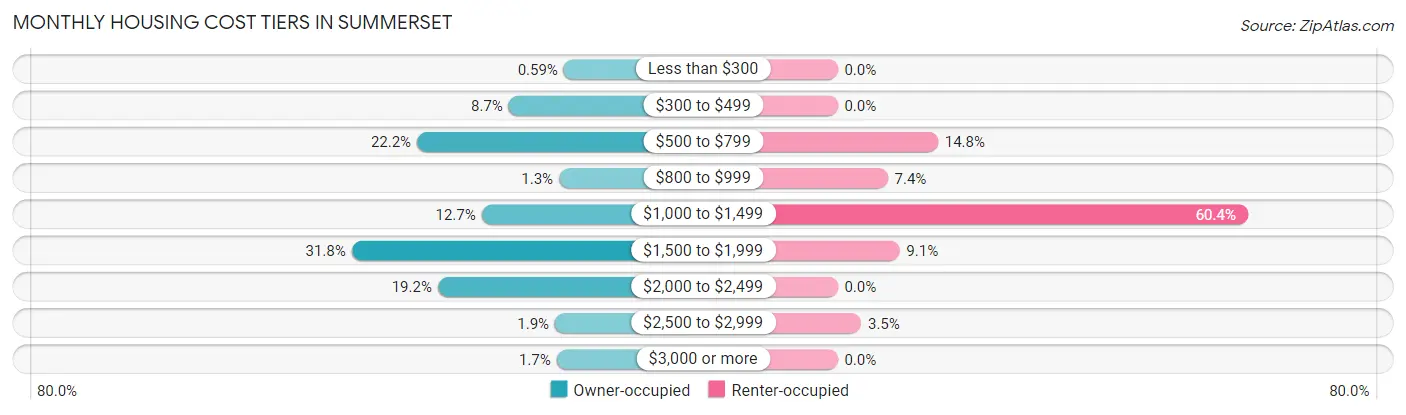
| Monthly Cost | Owner-occupied | Renter-occupied |
| Less than $300 | 5 (0.6%) | 0 (0.0%) |
| $300 to $499 | 74 (8.7%) | 0 (0.0%) |
| $500 to $799 | 189 (22.2%) | 34 (14.8%) |
| $800 to $999 | 11 (1.3%) | 17 (7.4%) |
| $1,000 to $1,499 | 108 (12.7%) | 139 (60.4%) |
| $1,500 to $1,999 | 271 (31.8%) | 21 (9.1%) |
| $2,000 to $2,499 | 163 (19.2%) | 0 (0.0%) |
| $2,500 to $2,999 | 16 (1.9%) | 8 (3.5%) |
| $3,000 or more | 14 (1.7%) | 0 (0.0%) |
| Total | 851 (100.0%) | 230 (100.0%) |
Physical Housing Characteristics in Summerset
Housing Structures in Summerset
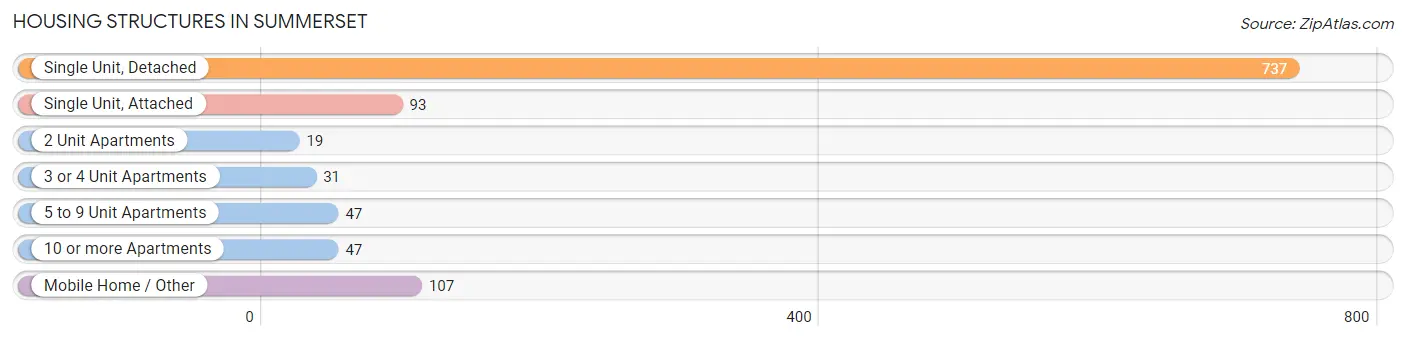
| Structure Type | # Housing Units | % Housing Units |
| Single Unit, Detached | 737 | 68.2% |
| Single Unit, Attached | 93 | 8.6% |
| 2 Unit Apartments | 19 | 1.8% |
| 3 or 4 Unit Apartments | 31 | 2.9% |
| 5 to 9 Unit Apartments | 47 | 4.3% |
| 10 or more Apartments | 47 | 4.3% |
| Mobile Home / Other | 107 | 9.9% |
| Total | 1,081 | 100.0% |
Housing Structures by Occupancy in Summerset
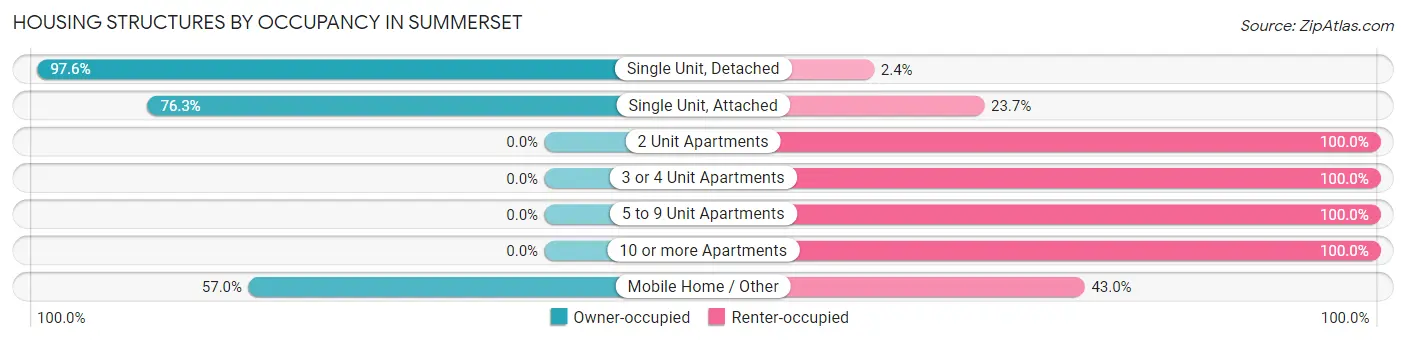
| Structure Type | Owner-occupied | Renter-occupied |
| Single Unit, Detached | 719 (97.6%) | 18 (2.4%) |
| Single Unit, Attached | 71 (76.3%) | 22 (23.7%) |
| 2 Unit Apartments | 0 (0.0%) | 19 (100.0%) |
| 3 or 4 Unit Apartments | 0 (0.0%) | 31 (100.0%) |
| 5 to 9 Unit Apartments | 0 (0.0%) | 47 (100.0%) |
| 10 or more Apartments | 0 (0.0%) | 47 (100.0%) |
| Mobile Home / Other | 61 (57.0%) | 46 (43.0%) |
| Total | 851 (78.7%) | 230 (21.3%) |
Housing Structures by Number of Rooms in Summerset
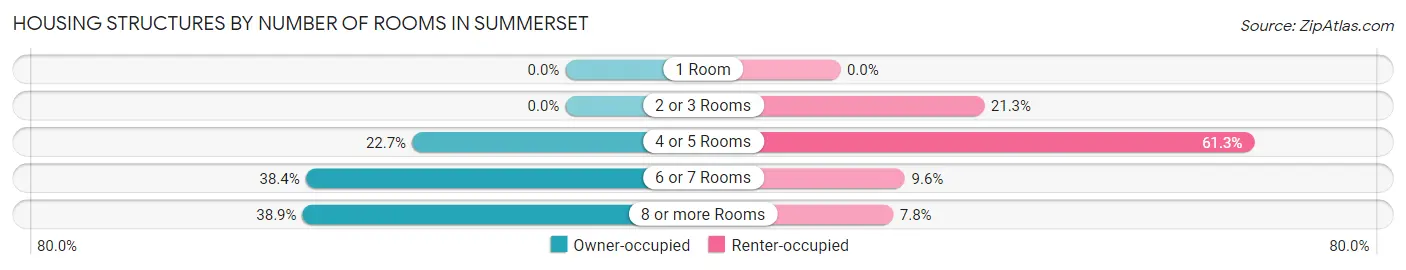
| Number of Rooms | Owner-occupied | Renter-occupied |
| 1 Room | 0 (0.0%) | 0 (0.0%) |
| 2 or 3 Rooms | 0 (0.0%) | 49 (21.3%) |
| 4 or 5 Rooms | 193 (22.7%) | 141 (61.3%) |
| 6 or 7 Rooms | 327 (38.4%) | 22 (9.6%) |
| 8 or more Rooms | 331 (38.9%) | 18 (7.8%) |
| Total | 851 (100.0%) | 230 (100.0%) |
Housing Structure by Heating Type in Summerset
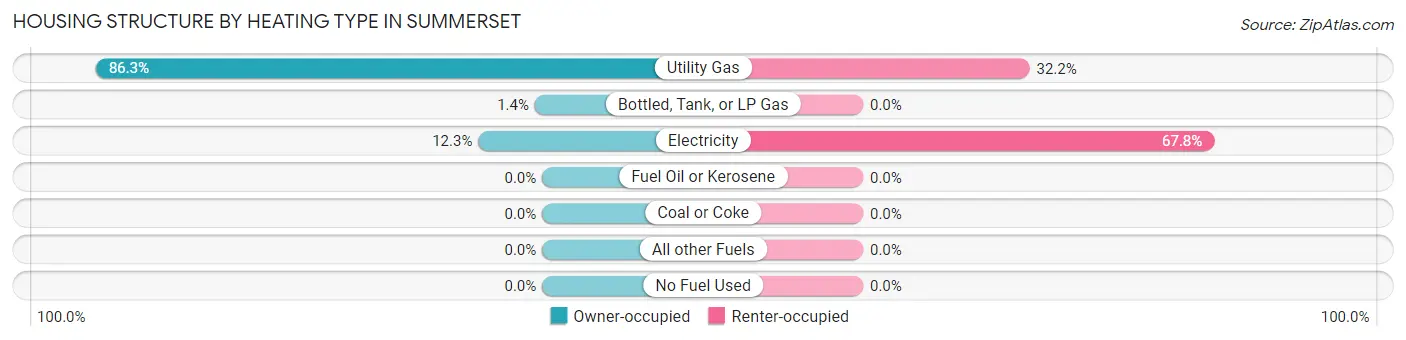
| Heating Type | Owner-occupied | Renter-occupied |
| Utility Gas | 734 (86.3%) | 74 (32.2%) |
| Bottled, Tank, or LP Gas | 12 (1.4%) | 0 (0.0%) |
| Electricity | 105 (12.3%) | 156 (67.8%) |
| Fuel Oil or Kerosene | 0 (0.0%) | 0 (0.0%) |
| Coal or Coke | 0 (0.0%) | 0 (0.0%) |
| All other Fuels | 0 (0.0%) | 0 (0.0%) |
| No Fuel Used | 0 (0.0%) | 0 (0.0%) |
| Total | 851 (100.0%) | 230 (100.0%) |
Household Vehicle Usage in Summerset
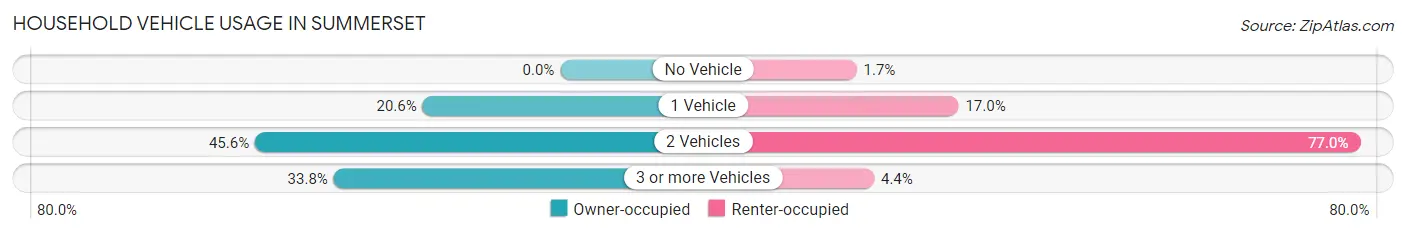
| Vehicles per Household | Owner-occupied | Renter-occupied |
| No Vehicle | 0 (0.0%) | 4 (1.7%) |
| 1 Vehicle | 175 (20.6%) | 39 (17.0%) |
| 2 Vehicles | 388 (45.6%) | 177 (77.0%) |
| 3 or more Vehicles | 288 (33.8%) | 10 (4.3%) |
| Total | 851 (100.0%) | 230 (100.0%) |
Real Estate & Mortgages in Summerset
Real Estate and Mortgage Overview in Summerset
| Characteristic | Without Mortgage | With Mortgage |
| Housing Units | 269 | 582 |
| Median Property Value | $277,700 | $296,700 |
| Median Household Income | $105,313 | $108 |
| Monthly Housing Costs | $568 | $14 |
| Real Estate Taxes | $3,139 | $28 |
Property Value by Mortgage Status in Summerset
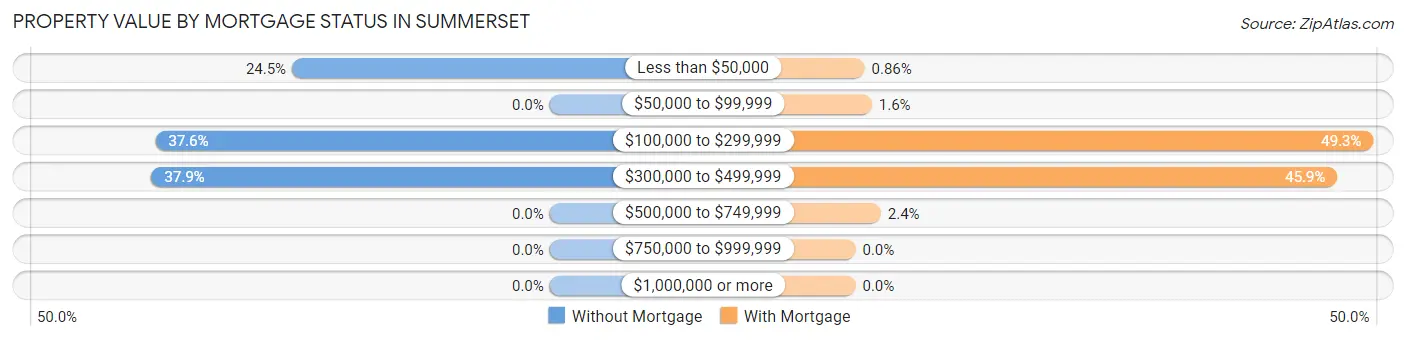
| Property Value | Without Mortgage | With Mortgage |
| Less than $50,000 | 66 (24.5%) | 5 (0.9%) |
| $50,000 to $99,999 | 0 (0.0%) | 9 (1.5%) |
| $100,000 to $299,999 | 101 (37.6%) | 287 (49.3%) |
| $300,000 to $499,999 | 102 (37.9%) | 267 (45.9%) |
| $500,000 to $749,999 | 0 (0.0%) | 14 (2.4%) |
| $750,000 to $999,999 | 0 (0.0%) | 0 (0.0%) |
| $1,000,000 or more | 0 (0.0%) | 0 (0.0%) |
| Total | 269 (100.0%) | 582 (100.0%) |
Household Income by Mortgage Status in Summerset
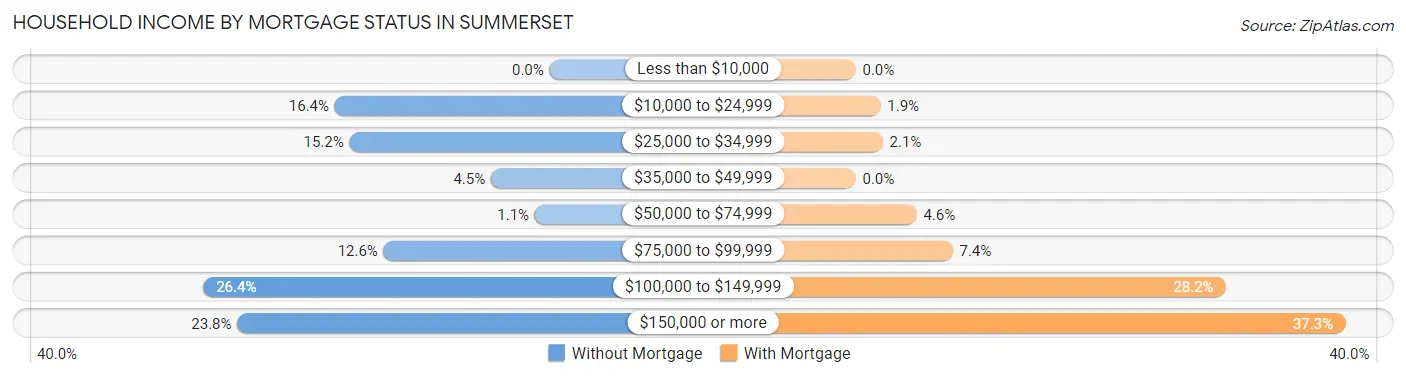
| Household Income | Without Mortgage | With Mortgage |
| Less than $10,000 | 0 (0.0%) | 0 (0.0%) |
| $10,000 to $24,999 | 44 (16.4%) | 11 (1.9%) |
| $25,000 to $34,999 | 41 (15.2%) | 12 (2.1%) |
| $35,000 to $49,999 | 12 (4.5%) | 0 (0.0%) |
| $50,000 to $74,999 | 3 (1.1%) | 27 (4.6%) |
| $75,000 to $99,999 | 34 (12.6%) | 43 (7.4%) |
| $100,000 to $149,999 | 71 (26.4%) | 164 (28.2%) |
| $150,000 or more | 64 (23.8%) | 217 (37.3%) |
| Total | 269 (100.0%) | 582 (100.0%) |
Property Value to Household Income Ratio in Summerset
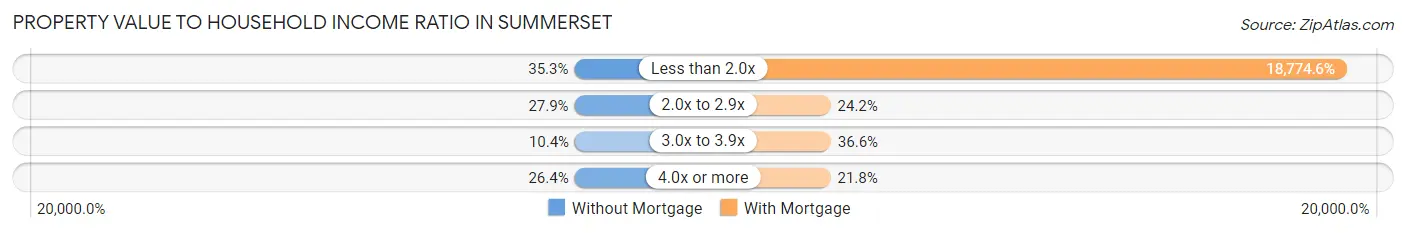
| Value-to-Income Ratio | Without Mortgage | With Mortgage |
| Less than 2.0x | 95 (35.3%) | 109,268 (18,774.6%) |
| 2.0x to 2.9x | 75 (27.9%) | 141 (24.2%) |
| 3.0x to 3.9x | 28 (10.4%) | 213 (36.6%) |
| 4.0x or more | 71 (26.4%) | 127 (21.8%) |
| Total | 269 (100.0%) | 582 (100.0%) |
Real Estate Taxes by Mortgage Status in Summerset
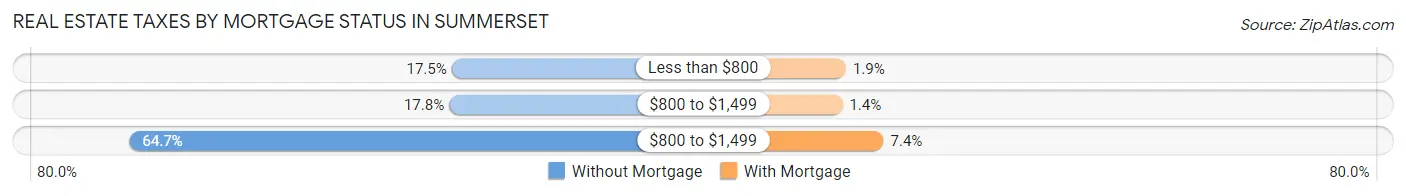
| Property Taxes | Without Mortgage | With Mortgage |
| Less than $800 | 47 (17.5%) | 11 (1.9%) |
| $800 to $1,499 | 48 (17.8%) | 8 (1.4%) |
| $800 to $1,499 | 174 (64.7%) | 43 (7.4%) |
| Total | 269 (100.0%) | 582 (100.0%) |
Health & Disability in Summerset
Health Insurance Coverage by Age in Summerset
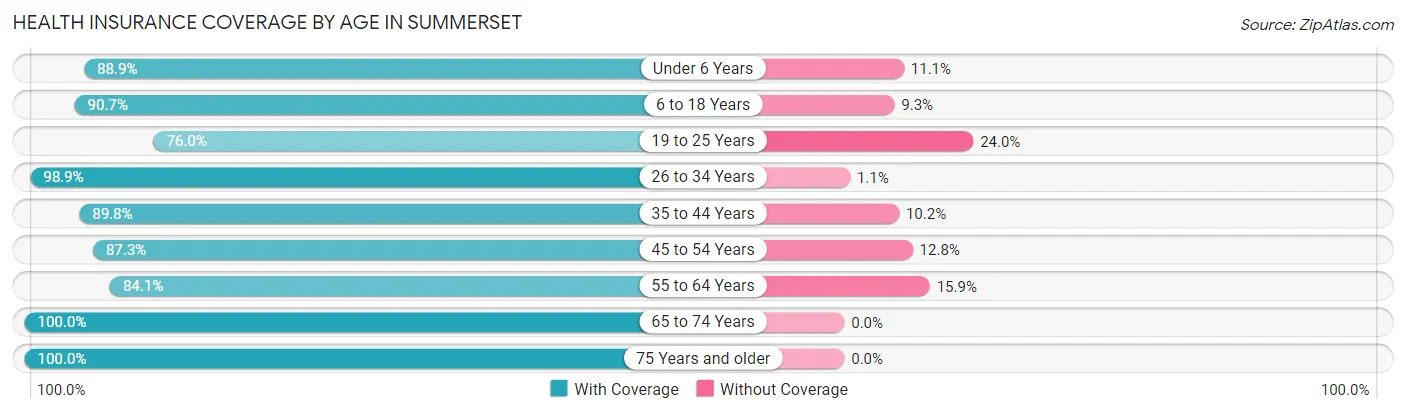
| Age Bracket | With Coverage | Without Coverage |
| Under 6 Years | 224 (88.9%) | 28 (11.1%) |
| 6 to 18 Years | 593 (90.7%) | 61 (9.3%) |
| 19 to 25 Years | 278 (76.0%) | 88 (24.0%) |
| 26 to 34 Years | 280 (98.9%) | 3 (1.1%) |
| 35 to 44 Years | 405 (89.8%) | 46 (10.2%) |
| 45 to 54 Years | 260 (87.3%) | 38 (12.8%) |
| 55 to 64 Years | 227 (84.1%) | 43 (15.9%) |
| 65 to 74 Years | 166 (100.0%) | 0 (0.0%) |
| 75 Years and older | 162 (100.0%) | 0 (0.0%) |
| Total | 2,595 (89.4%) | 307 (10.6%) |
Health Insurance Coverage by Citizenship Status in Summerset
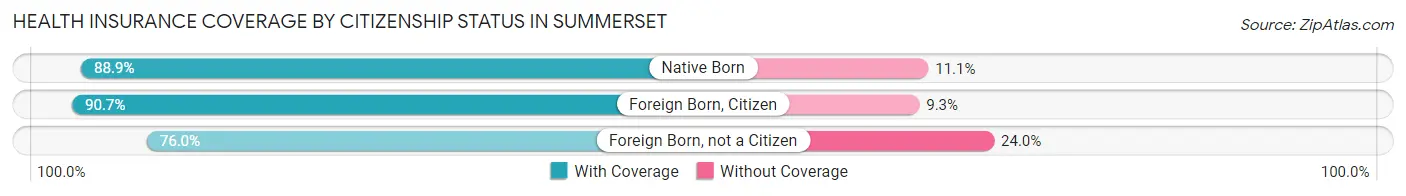
| Citizenship Status | With Coverage | Without Coverage |
| Native Born | 224 (88.9%) | 28 (11.1%) |
| Foreign Born, Citizen | 593 (90.7%) | 61 (9.3%) |
| Foreign Born, not a Citizen | 278 (76.0%) | 88 (24.0%) |
Health Insurance Coverage by Household Income in Summerset
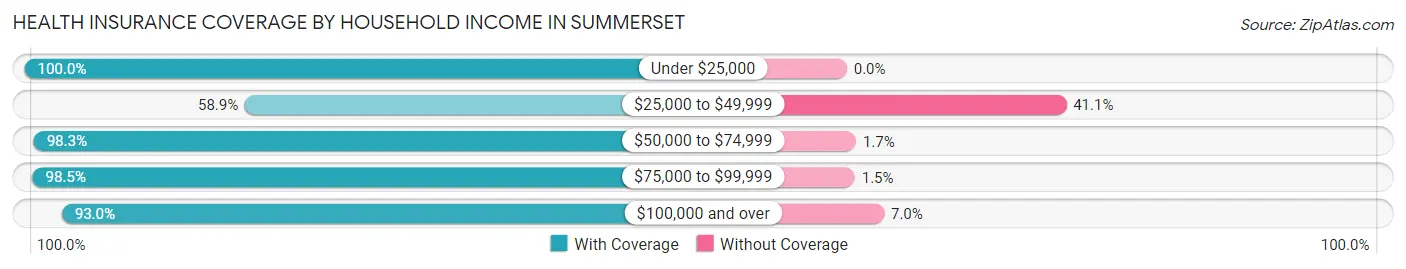
| Household Income | With Coverage | Without Coverage |
| Under $25,000 | 169 (100.0%) | 0 (0.0%) |
| $25,000 to $49,999 | 255 (58.9%) | 178 (41.1%) |
| $50,000 to $74,999 | 114 (98.3%) | 2 (1.7%) |
| $75,000 to $99,999 | 459 (98.5%) | 7 (1.5%) |
| $100,000 and over | 1,598 (93.0%) | 120 (7.0%) |
Public vs Private Health Insurance Coverage by Age in Summerset
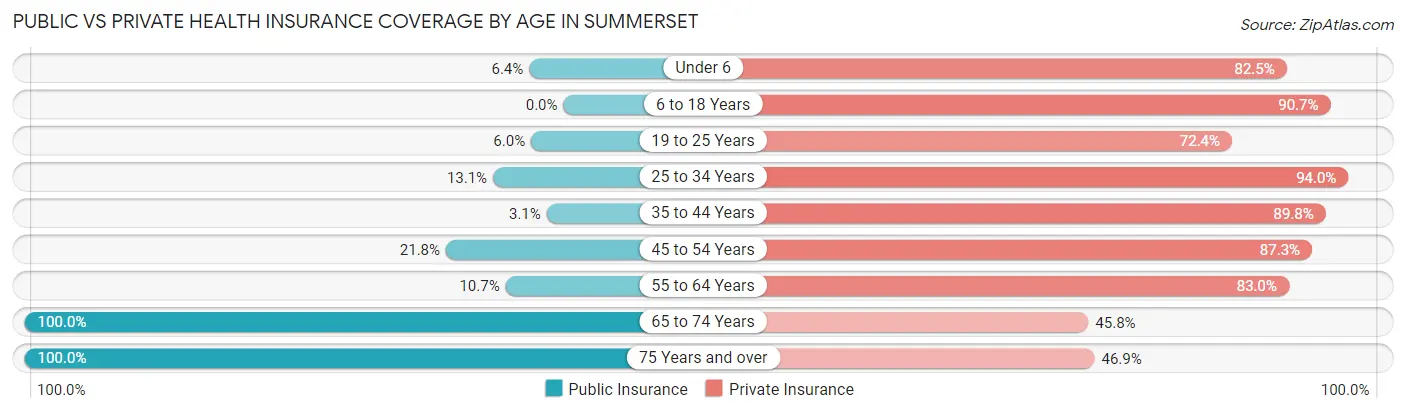
| Age Bracket | Public Insurance | Private Insurance |
| Under 6 | 16 (6.4%) | 208 (82.5%) |
| 6 to 18 Years | 0 (0.0%) | 593 (90.7%) |
| 19 to 25 Years | 22 (6.0%) | 265 (72.4%) |
| 25 to 34 Years | 37 (13.1%) | 266 (94.0%) |
| 35 to 44 Years | 14 (3.1%) | 405 (89.8%) |
| 45 to 54 Years | 65 (21.8%) | 260 (87.3%) |
| 55 to 64 Years | 29 (10.7%) | 224 (83.0%) |
| 65 to 74 Years | 166 (100.0%) | 76 (45.8%) |
| 75 Years and over | 162 (100.0%) | 76 (46.9%) |
| Total | 511 (17.6%) | 2,373 (81.8%) |
Disability Status by Sex by Age in Summerset
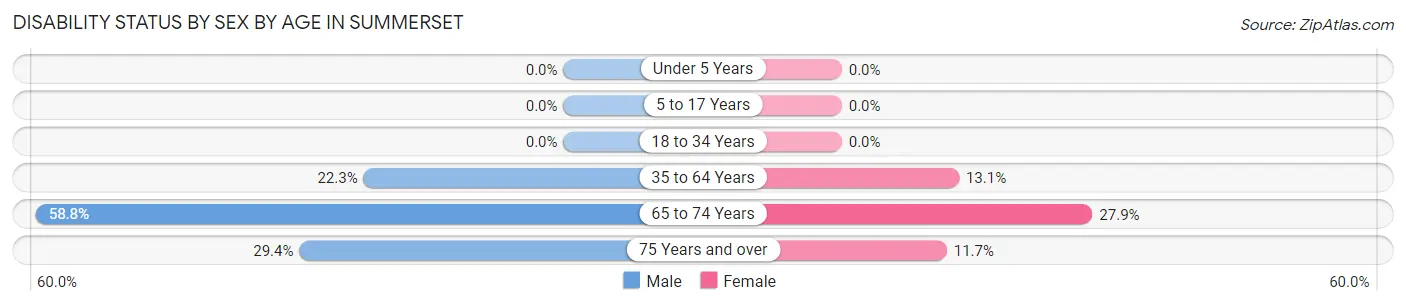
| Age Bracket | Male | Female |
| Under 5 Years | 0 (0.0%) | 0 (0.0%) |
| 5 to 17 Years | 0 (0.0%) | 0 (0.0%) |
| 18 to 34 Years | 0 (0.0%) | 0 (0.0%) |
| 35 to 64 Years | 116 (22.3%) | 65 (13.1%) |
| 65 to 74 Years | 47 (58.8%) | 24 (27.9%) |
| 75 Years and over | 25 (29.4%) | 9 (11.7%) |
Disability Class by Sex by Age in Summerset
Disability Class: Hearing Difficulty
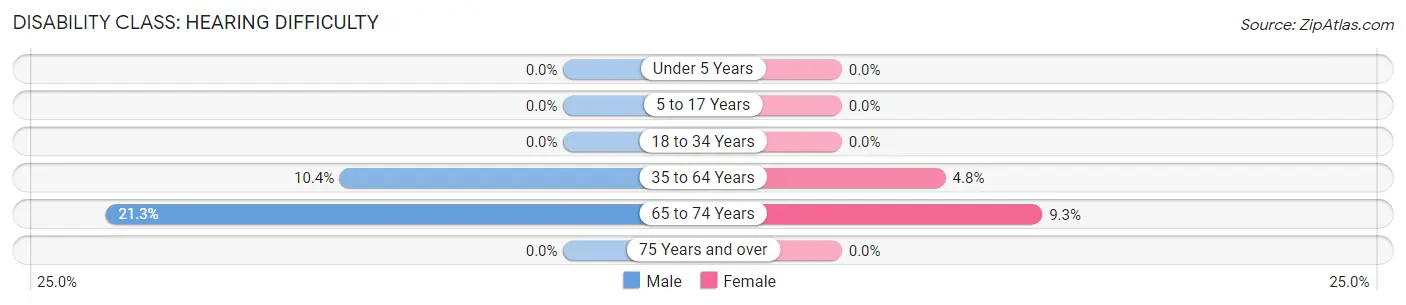
| Age Bracket | Male | Female |
| Under 5 Years | 0 (0.0%) | 0 (0.0%) |
| 5 to 17 Years | 0 (0.0%) | 0 (0.0%) |
| 18 to 34 Years | 0 (0.0%) | 0 (0.0%) |
| 35 to 64 Years | 54 (10.4%) | 24 (4.8%) |
| 65 to 74 Years | 17 (21.2%) | 8 (9.3%) |
| 75 Years and over | 0 (0.0%) | 0 (0.0%) |
Disability Class: Vision Difficulty
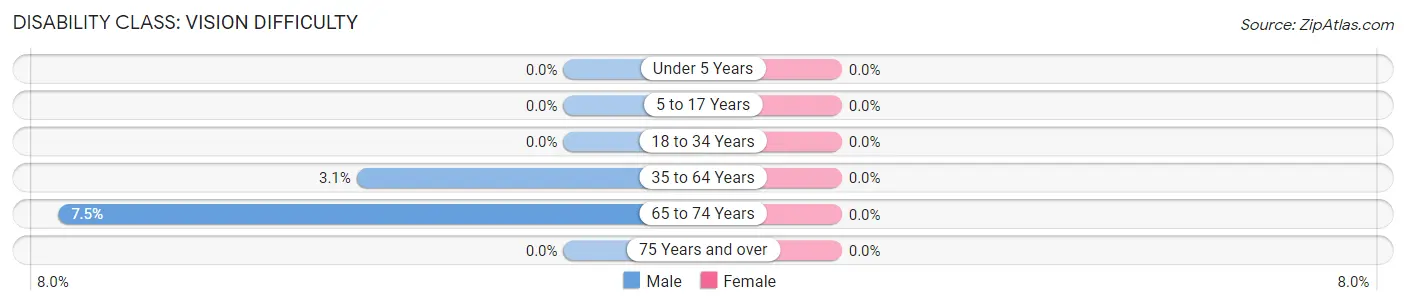
| Age Bracket | Male | Female |
| Under 5 Years | 0 (0.0%) | 0 (0.0%) |
| 5 to 17 Years | 0 (0.0%) | 0 (0.0%) |
| 18 to 34 Years | 0 (0.0%) | 0 (0.0%) |
| 35 to 64 Years | 16 (3.1%) | 0 (0.0%) |
| 65 to 74 Years | 6 (7.5%) | 0 (0.0%) |
| 75 Years and over | 0 (0.0%) | 0 (0.0%) |
Disability Class: Cognitive Difficulty
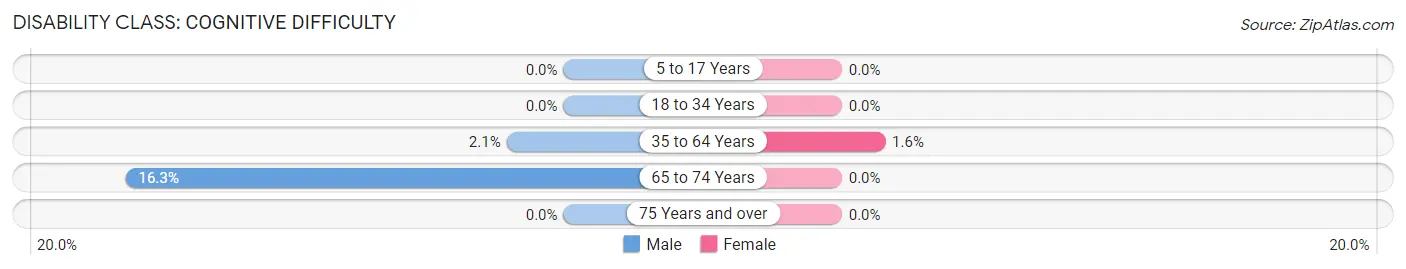
| Age Bracket | Male | Female |
| 5 to 17 Years | 0 (0.0%) | 0 (0.0%) |
| 18 to 34 Years | 0 (0.0%) | 0 (0.0%) |
| 35 to 64 Years | 11 (2.1%) | 8 (1.6%) |
| 65 to 74 Years | 13 (16.3%) | 0 (0.0%) |
| 75 Years and over | 0 (0.0%) | 0 (0.0%) |
Disability Class: Ambulatory Difficulty
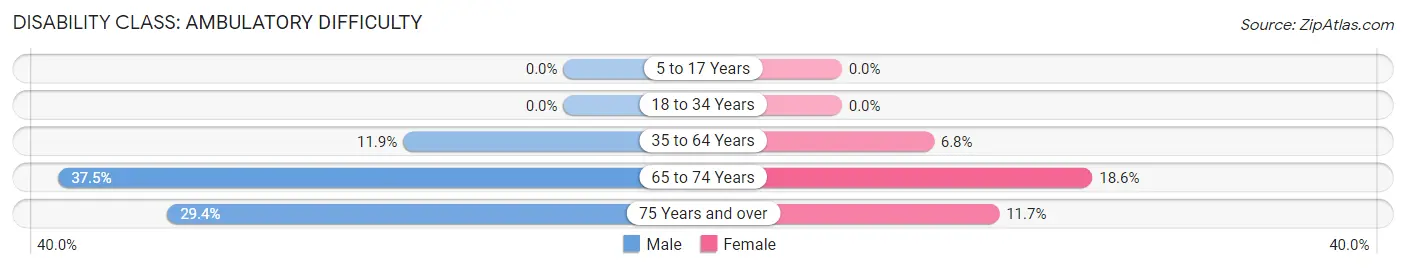
| Age Bracket | Male | Female |
| 5 to 17 Years | 0 (0.0%) | 0 (0.0%) |
| 18 to 34 Years | 0 (0.0%) | 0 (0.0%) |
| 35 to 64 Years | 62 (11.9%) | 34 (6.8%) |
| 65 to 74 Years | 30 (37.5%) | 16 (18.6%) |
| 75 Years and over | 25 (29.4%) | 9 (11.7%) |
Disability Class: Self-Care Difficulty
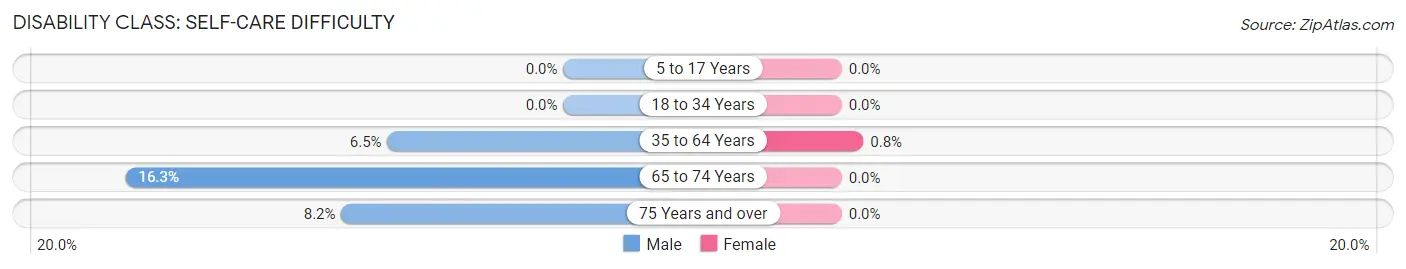
| Age Bracket | Male | Female |
| 5 to 17 Years | 0 (0.0%) | 0 (0.0%) |
| 18 to 34 Years | 0 (0.0%) | 0 (0.0%) |
| 35 to 64 Years | 34 (6.5%) | 4 (0.8%) |
| 65 to 74 Years | 13 (16.3%) | 0 (0.0%) |
| 75 Years and over | 7 (8.2%) | 0 (0.0%) |
Technology Access in Summerset
Computing Device Access in Summerset
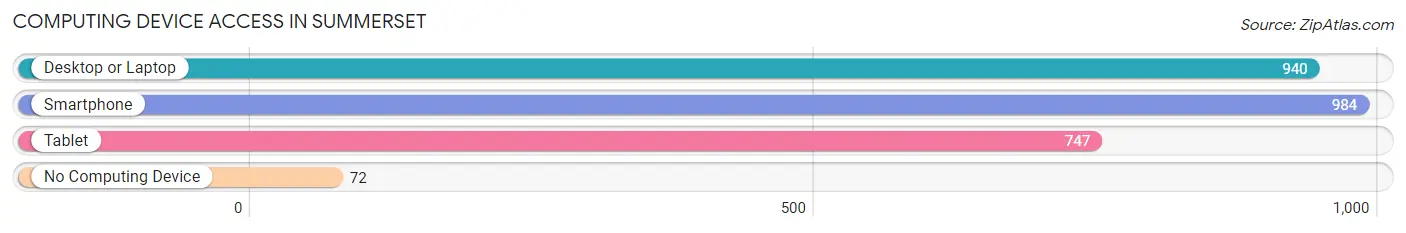
| Device Type | # Households | % Households |
| Desktop or Laptop | 940 | 87.0% |
| Smartphone | 984 | 91.0% |
| Tablet | 747 | 69.1% |
| No Computing Device | 72 | 6.7% |
| Total | 1,081 | 100.0% |
Internet Access in Summerset
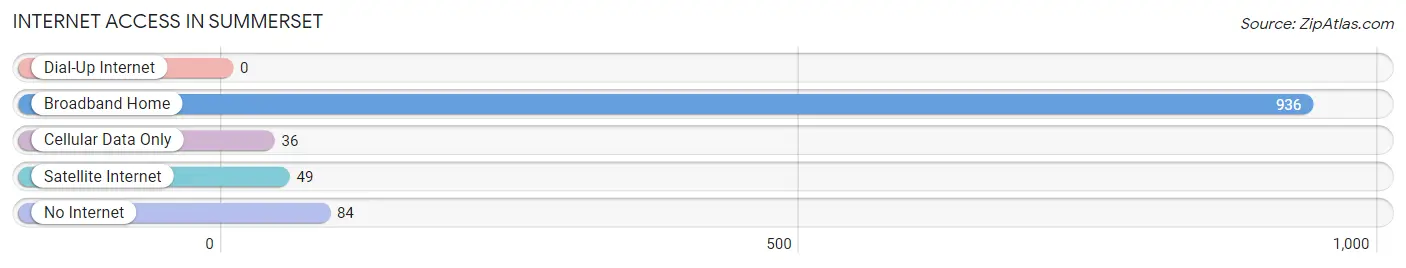
| Internet Type | # Households | % Households |
| Dial-Up Internet | 0 | 0.0% |
| Broadband Home | 936 | 86.6% |
| Cellular Data Only | 36 | 3.3% |
| Satellite Internet | 49 | 4.5% |
| No Internet | 84 | 7.8% |
| Total | 1,081 | 100.0% |
Summerset Summary
Summerset, South Dakota is a small town located in the Black Hills region of the state. It is situated in the southwestern corner of Meade County, and is bordered by the towns of Sturgis, Piedmont, and Whitewood. The town was founded in 1883 and has a population of approximately 1,500 people.
Summerset is located in the Black Hills region of South Dakota, which is known for its rugged terrain and beautiful scenery. The town is situated in a valley surrounded by hills and mountains, and is home to a variety of wildlife, including deer, elk, and bighorn sheep. Summerset is also home to the Black Hills National Forest, which provides a variety of recreational activities, such as camping, hiking, and fishing.
The economy of Summerset is largely based on tourism, as the town is a popular destination for visitors to the Black Hills region. Summerset is home to several tourist attractions, including the Black Hills National Forest, the Sturgis Motorcycle Rally, and the Crazy Horse Memorial. The town also has a variety of restaurants, shops, and other businesses that cater to tourists.
The demographics of Summerset are largely white, with a small percentage of Native American and Hispanic residents. The median household income in Summerset is approximately $45,000, and the median home value is around $150,000. The town has a low unemployment rate, and the majority of residents are employed in the tourism industry.
Summerset is a small town with a rich history and a vibrant economy. The town is home to a variety of attractions, businesses, and recreational activities, making it a popular destination for visitors to the Black Hills region. The town has a diverse population and a strong economy, making it an ideal place to live and work.
Common Questions
What is Per Capita Income in Summerset?
Per Capita income in Summerset is $37,202.
What is the Median Family Income in Summerset?
Median Family Income in Summerset is $111,875.
What is the Median Household income in Summerset?
Median Household Income in Summerset is $98,194.
What is Income or Wage Gap in Summerset?
Income or Wage Gap in Summerset is 42.9%.
Women in Summerset earn 57.1 cents for every dollar earned by a man.
What is Inequality or Gini Index in Summerset?
Inequality or Gini Index in Summerset is 0.34.
What is the Total Population of Summerset?
Total Population of Summerset is 2,950.
What is the Total Male Population of Summerset?
Total Male Population of Summerset is 1,393.
What is the Total Female Population of Summerset?
Total Female Population of Summerset is 1,557.
What is the Ratio of Males per 100 Females in Summerset?
There are 89.47 Males per 100 Females in Summerset.
What is the Ratio of Females per 100 Males in Summerset?
There are 111.77 Females per 100 Males in Summerset.
What is the Median Population Age in Summerset?
Median Population Age in Summerset is 33.4 Years.
What is the Average Family Size in Summerset
Average Family Size in Summerset is 3.2 People.
What is the Average Household Size in Summerset
Average Household Size in Summerset is 2.7 People.
How Large is the Labor Force in Summerset?
There are 1,636 People in the Labor Forcein in Summerset.
What is the Percentage of People in the Labor Force in Summerset?
75.9% of People are in the Labor Force in Summerset.
What is the Unemployment Rate in Summerset?
Unemployment Rate in Summerset is 1.9%.