Marty, SD Map & Demographics
Marty Map
Marty Overview
$11,536
PER CAPITA INCOME
$19,135
AVG FAMILY INCOME
$19,519
AVG HOUSEHOLD INCOME
0.44
INEQUALITY / GINI INDEX
197
TOTAL POPULATION
150
MALE POPULATION
47
FEMALE POPULATION
319.15
MALES / 100 FEMALES
31.33
FEMALES / 100 MALES
44.4
MEDIAN AGE
3.6
AVG FAMILY SIZE
3.0
AVG HOUSEHOLD SIZE
64
LABOR FORCE [ PEOPLE ]
39.3%
PERCENT IN LABOR FORCE
54.7%
UNEMPLOYMENT RATE
Marty Zip Codes
Marty Area Codes
Income in Marty
Income Overview in Marty
Per Capita Income in Marty is $11,536, while median incomes of families and households are $19,135 and $19,519 respectively.
| Characteristic | Number | Measure |
| Per Capita Income | 197 | $11,536 |
| Median Family Income | 46 | $19,135 |
| Mean Family Income | 46 | $24,613 |
| Median Household Income | 66 | $19,519 |
| Mean Household Income | 66 | $28,556 |
| Income Deficit | 46 | $0 |
| Wage / Income Gap (%) | 197 | 0.00% |
| Wage / Income Gap ($) | 197 | 100.00¢ per $1 |
| Gini / Inequality Index | 197 | 0.44 |
Earnings by Sex in Marty
| Sex | Number | Average Earnings |
| Male | 44 (80.0%) | $0 |
| Female | 11 (20.0%) | $0 |
| Total | 55 (100.0%) | $0 |
Earnings by Sex by Income Bracket in Marty
The most common earnings brackets in Marty are $2,499 or less for men (18 | 40.9%) and $30,000 to $34,999 for women (5 | 45.5%).
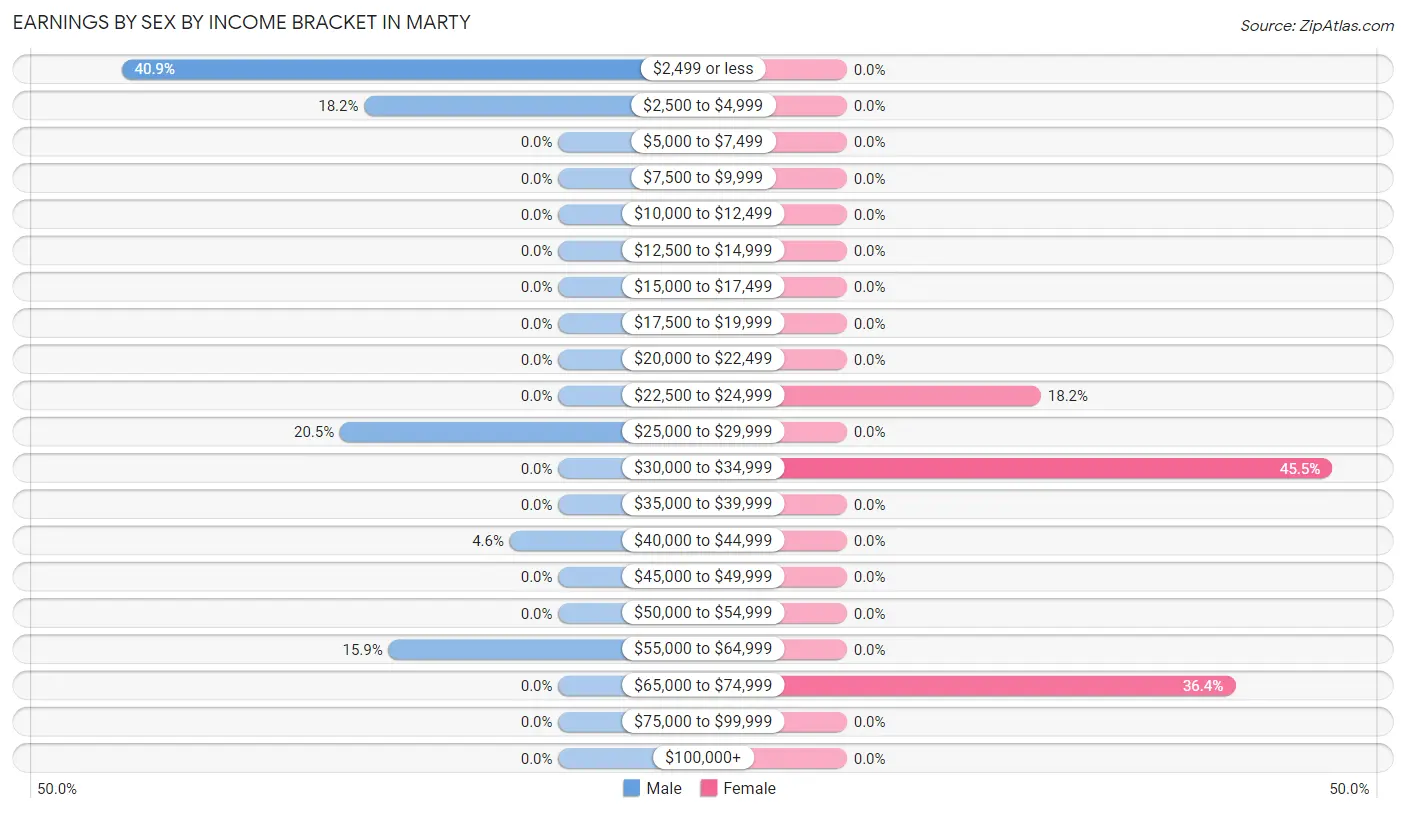
| Income | Male | Female |
| $2,499 or less | 18 (40.9%) | 0 (0.0%) |
| $2,500 to $4,999 | 8 (18.2%) | 0 (0.0%) |
| $5,000 to $7,499 | 0 (0.0%) | 0 (0.0%) |
| $7,500 to $9,999 | 0 (0.0%) | 0 (0.0%) |
| $10,000 to $12,499 | 0 (0.0%) | 0 (0.0%) |
| $12,500 to $14,999 | 0 (0.0%) | 0 (0.0%) |
| $15,000 to $17,499 | 0 (0.0%) | 0 (0.0%) |
| $17,500 to $19,999 | 0 (0.0%) | 0 (0.0%) |
| $20,000 to $22,499 | 0 (0.0%) | 0 (0.0%) |
| $22,500 to $24,999 | 0 (0.0%) | 2 (18.2%) |
| $25,000 to $29,999 | 9 (20.4%) | 0 (0.0%) |
| $30,000 to $34,999 | 0 (0.0%) | 5 (45.5%) |
| $35,000 to $39,999 | 0 (0.0%) | 0 (0.0%) |
| $40,000 to $44,999 | 2 (4.5%) | 0 (0.0%) |
| $45,000 to $49,999 | 0 (0.0%) | 0 (0.0%) |
| $50,000 to $54,999 | 0 (0.0%) | 0 (0.0%) |
| $55,000 to $64,999 | 7 (15.9%) | 0 (0.0%) |
| $65,000 to $74,999 | 0 (0.0%) | 4 (36.4%) |
| $75,000 to $99,999 | 0 (0.0%) | 0 (0.0%) |
| $100,000+ | 0 (0.0%) | 0 (0.0%) |
| Total | 44 (100.0%) | 11 (100.0%) |
Earnings by Sex by Educational Attainment in Marty
| Educational Attainment | Male Income | Female Income |
| Less than High School | - | - |
| High School Diploma | - | - |
| College or Associate's Degree | - | - |
| Bachelor's Degree | - | - |
| Graduate Degree | - | - |
| Total | - | - |
Family Income in Marty
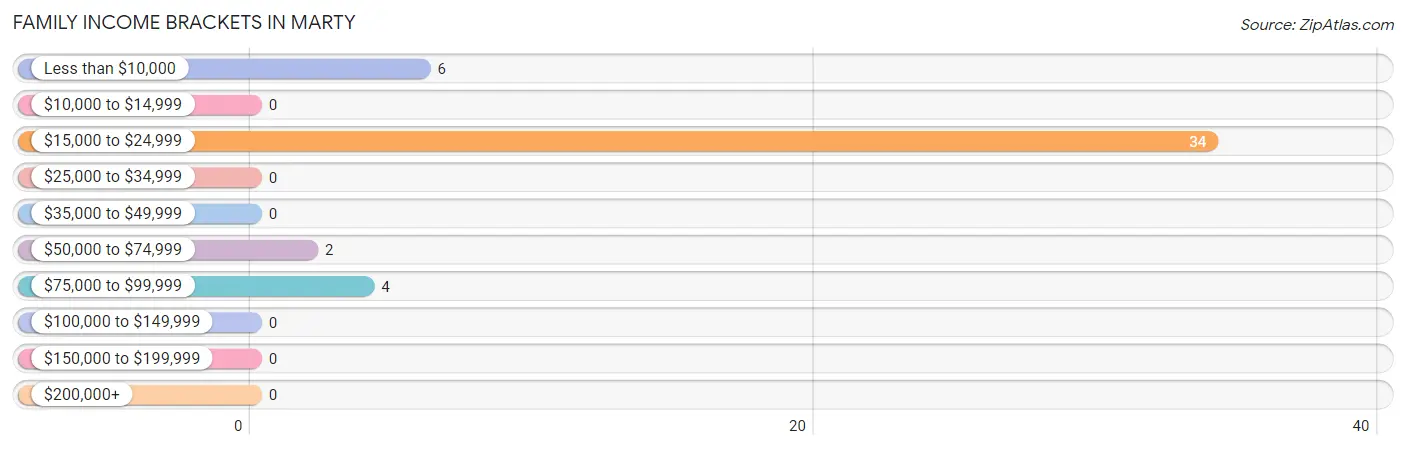
Family Income Brackets in Marty
According to the Marty family income data, there are 34 families falling into the $15,000 to $24,999 income range, which is the most common income bracket and makes up 73.9% of all families.
| Income Bracket | # Families | % Families |
| Less than $10,000 | 6 | 13.0% |
| $10,000 to $14,999 | 0 | 0.0% |
| $15,000 to $24,999 | 34 | 73.9% |
| $25,000 to $34,999 | 0 | 0.0% |
| $35,000 to $49,999 | 0 | 0.0% |
| $50,000 to $74,999 | 2 | 4.3% |
| $75,000 to $99,999 | 4 | 8.7% |
| $100,000 to $149,999 | 0 | 0.0% |
| $150,000 to $199,999 | 0 | 0.0% |
| $200,000+ | 0 | 0.0% |
Family Income by Famaliy Size in Marty
| Income Bracket | # Families | Median Income |
| 2-Person Families | 2 (4.3%) | $0 |
| 3-Person Families | 10 (21.7%) | $0 |
| 4-Person Families | 0 (0.0%) | $0 |
| 5-Person Families | 8 (17.4%) | $0 |
| 6-Person Families | 26 (56.5%) | $0 |
| 7+ Person Families | 0 (0.0%) | $0 |
| Total | 46 (100.0%) | $19,135 |
Family Income by Number of Earners in Marty
| Number of Earners | # Families | Median Income |
| No Earners | 32 (69.6%) | $0 |
| 1 Earner | 4 (8.7%) | $0 |
| 2 Earners | 10 (21.7%) | $0 |
| 3+ Earners | 0 (0.0%) | $0 |
| Total | 46 (100.0%) | $19,135 |
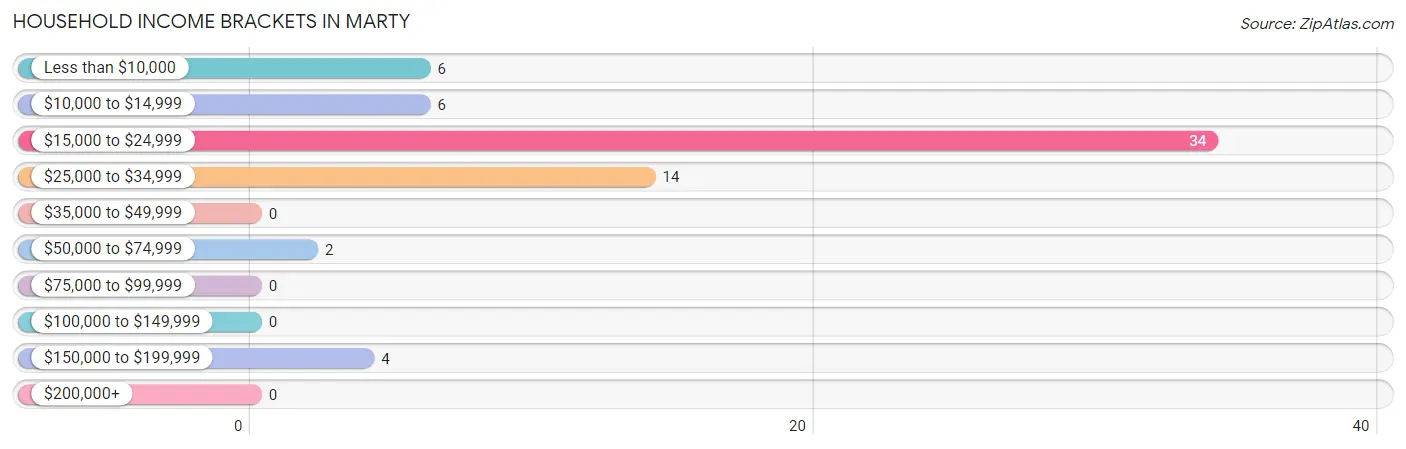
Household Income in Marty
Household Income Brackets in Marty
With 34 households falling in the category, the $15,000 to $24,999 income range is the most frequent in Marty, accounting for 51.5% of all households.
| Income Bracket | # Households | % Households |
| Less than $10,000 | 6 | 9.1% |
| $10,000 to $14,999 | 6 | 9.1% |
| $15,000 to $24,999 | 34 | 51.5% |
| $25,000 to $34,999 | 14 | 21.2% |
| $35,000 to $49,999 | 0 | 0.0% |
| $50,000 to $74,999 | 2 | 3.0% |
| $75,000 to $99,999 | 0 | 0.0% |
| $100,000 to $149,999 | 0 | 0.0% |
| $150,000 to $199,999 | 4 | 6.1% |
| $200,000+ | 0 | 0.0% |
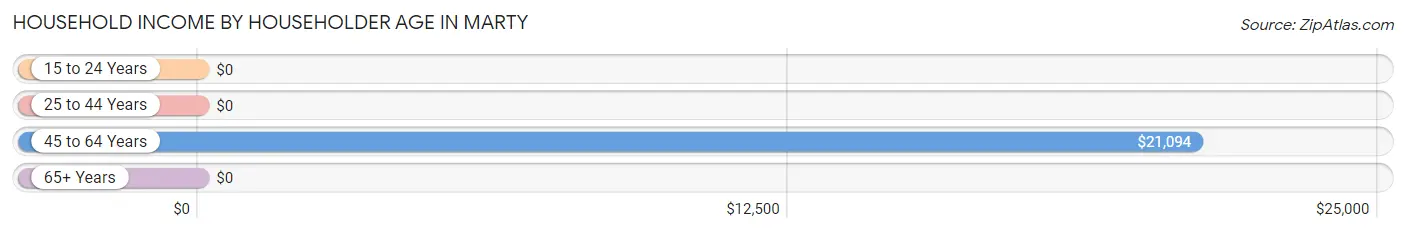
Household Income by Householder Age in Marty
The median household income in Marty is $19,519, with the highest median household income of $21,094 found in the 45 to 64 years age bracket for the primary householder. A total of 31 households (47.0%) fall into this category.
| Income Bracket | # Households | Median Income |
| 15 to 24 Years | 0 (0.0%) | $0 |
| 25 to 44 Years | 9 (13.6%) | $0 |
| 45 to 64 Years | 31 (47.0%) | $21,094 |
| 65+ Years | 26 (39.4%) | $0 |
| Total | 66 (100.0%) | $19,519 |
Poverty in Marty
Income Below Poverty by Sex and Age in Marty
With 74.7% poverty level for males and 76.6% for females among the residents of Marty, 6 to 11 year old males and 12 to 14 year old females are the most vulnerable to poverty, with 7 males (100.0%) and 8 females (100.0%) in their respective age groups living below the poverty level.
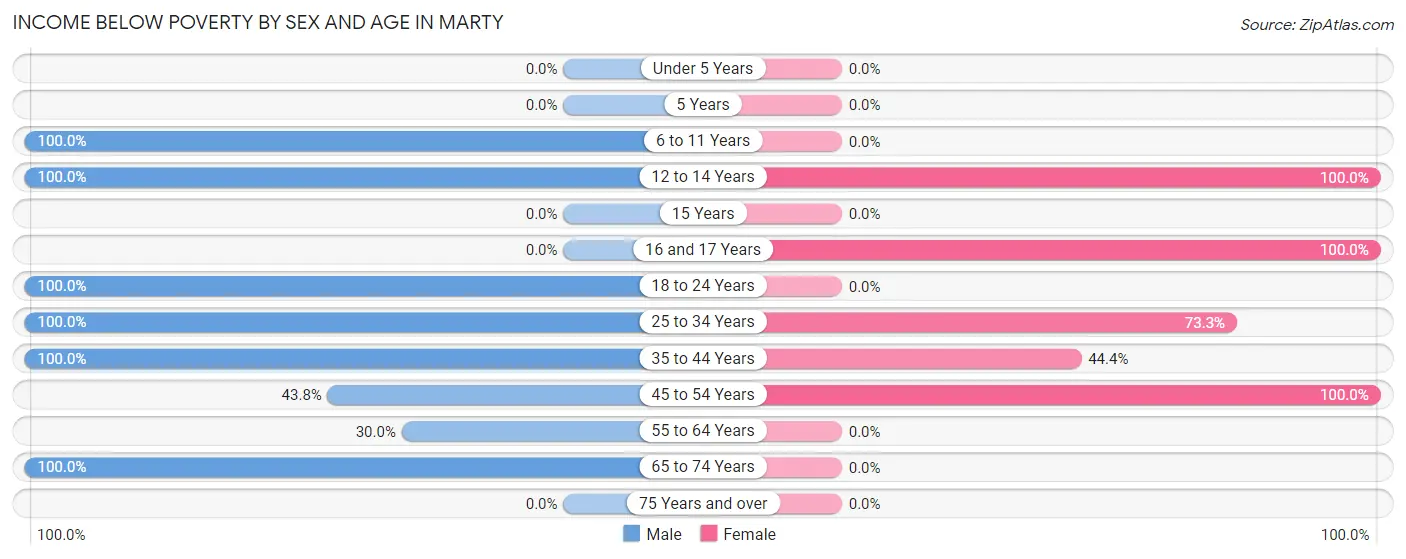
| Age Bracket | Male | Female |
| Under 5 Years | 0 (0.0%) | 0 (0.0%) |
| 5 Years | 0 (0.0%) | 0 (0.0%) |
| 6 to 11 Years | 7 (100.0%) | 0 (0.0%) |
| 12 to 14 Years | 13 (100.0%) | 8 (100.0%) |
| 15 Years | 0 (0.0%) | 0 (0.0%) |
| 16 and 17 Years | 0 (0.0%) | 4 (100.0%) |
| 18 to 24 Years | 26 (100.0%) | 0 (0.0%) |
| 25 to 34 Years | 8 (100.0%) | 11 (73.3%) |
| 35 to 44 Years | 12 (100.0%) | 4 (44.4%) |
| 45 to 54 Years | 14 (43.8%) | 9 (100.0%) |
| 55 to 64 Years | 6 (30.0%) | 0 (0.0%) |
| 65 to 74 Years | 26 (100.0%) | 0 (0.0%) |
| 75 Years and over | 0 (0.0%) | 0 (0.0%) |
| Total | 112 (74.7%) | 36 (76.6%) |
Income Above Poverty by Sex and Age in Marty
According to the poverty statistics in Marty, males aged 5 years and females aged 55 to 64 years are the age groups that are most secure financially, with 100.0% of males and 100.0% of females in these age groups living above the poverty line.
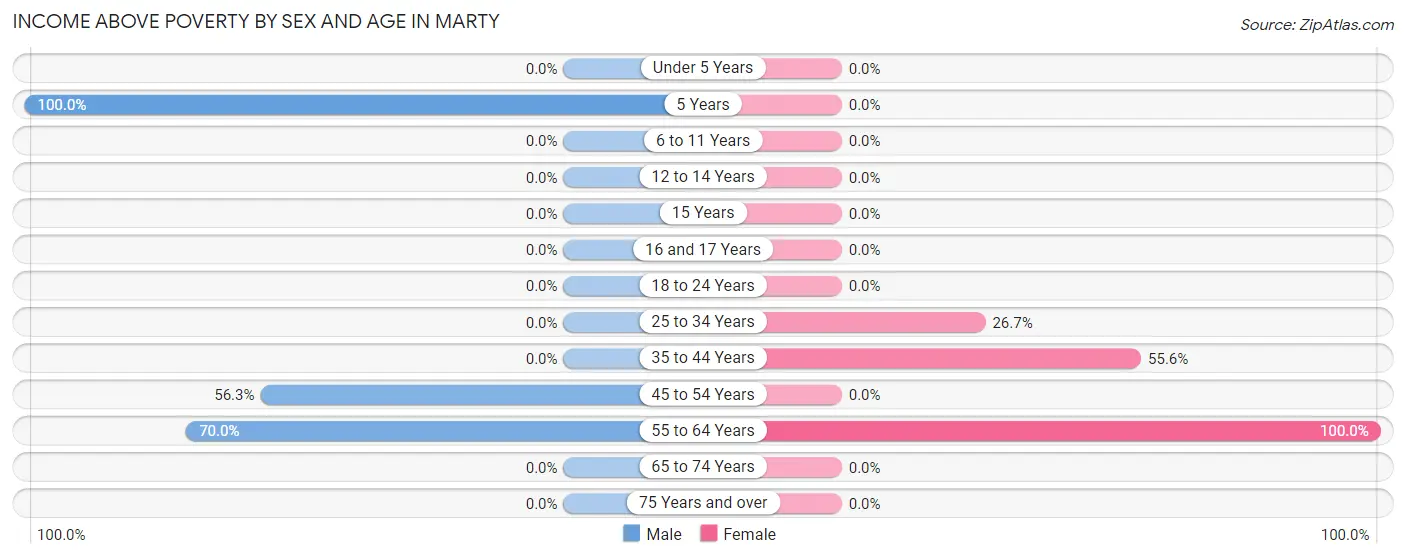
| Age Bracket | Male | Female |
| Under 5 Years | 0 (0.0%) | 0 (0.0%) |
| 5 Years | 6 (100.0%) | 0 (0.0%) |
| 6 to 11 Years | 0 (0.0%) | 0 (0.0%) |
| 12 to 14 Years | 0 (0.0%) | 0 (0.0%) |
| 15 Years | 0 (0.0%) | 0 (0.0%) |
| 16 and 17 Years | 0 (0.0%) | 0 (0.0%) |
| 18 to 24 Years | 0 (0.0%) | 0 (0.0%) |
| 25 to 34 Years | 0 (0.0%) | 4 (26.7%) |
| 35 to 44 Years | 0 (0.0%) | 5 (55.6%) |
| 45 to 54 Years | 18 (56.2%) | 0 (0.0%) |
| 55 to 64 Years | 14 (70.0%) | 2 (100.0%) |
| 65 to 74 Years | 0 (0.0%) | 0 (0.0%) |
| 75 Years and over | 0 (0.0%) | 0 (0.0%) |
| Total | 38 (25.3%) | 11 (23.4%) |
Income Below Poverty Among Married-Couple Families in Marty
The poverty statistics for married-couple families in Marty show that 80.0% or 8 of the total 10 families live below the poverty line. Families with 1 or 2 children have the highest poverty rate of 100.0%, comprising of 8 families. On the other hand, families with no children have the lowest poverty rate of 0.0%, which includes 0 families.
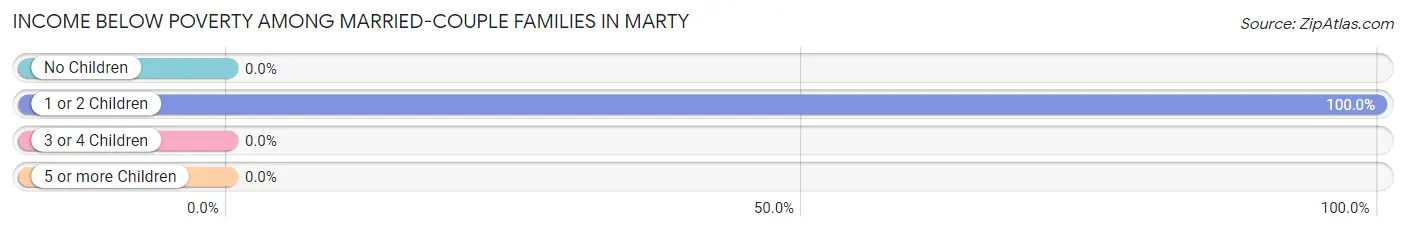
| Children | Above Poverty | Below Poverty |
| No Children | 2 (100.0%) | 0 (0.0%) |
| 1 or 2 Children | 0 (0.0%) | 8 (100.0%) |
| 3 or 4 Children | 0 (0.0%) | 0 (0.0%) |
| 5 or more Children | 0 (0.0%) | 0 (0.0%) |
| Total | 2 (20.0%) | 8 (80.0%) |
Income Below Poverty Among Single-Parent Households in Marty
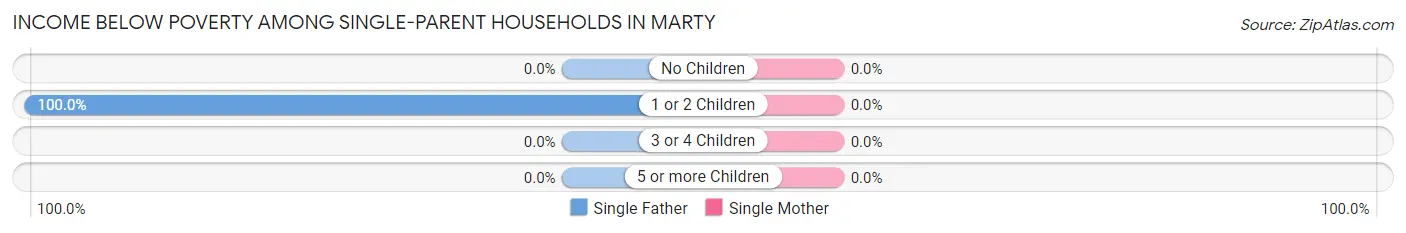
| Children | Single Father | Single Mother |
| No Children | 0 (0.0%) | 0 (0.0%) |
| 1 or 2 Children | 32 (100.0%) | 0 (0.0%) |
| 3 or 4 Children | 0 (0.0%) | 0 (0.0%) |
| 5 or more Children | 0 (0.0%) | 0 (0.0%) |
| Total | 32 (100.0%) | 0 (0.0%) |
Income Below Poverty Among Married-Couple vs Single-Parent Households in Marty
The poverty data for Marty shows that 8 of the married-couple family households (80.0%) and 32 of the single-parent households (88.9%) are living below the poverty level. Within the married-couple family households, those with 1 or 2 children have the highest poverty rate, with 8 households (100.0%) falling below the poverty line. Among the single-parent households, those with 1 or 2 children have the highest poverty rate, with 32 household (88.9%) living below poverty.
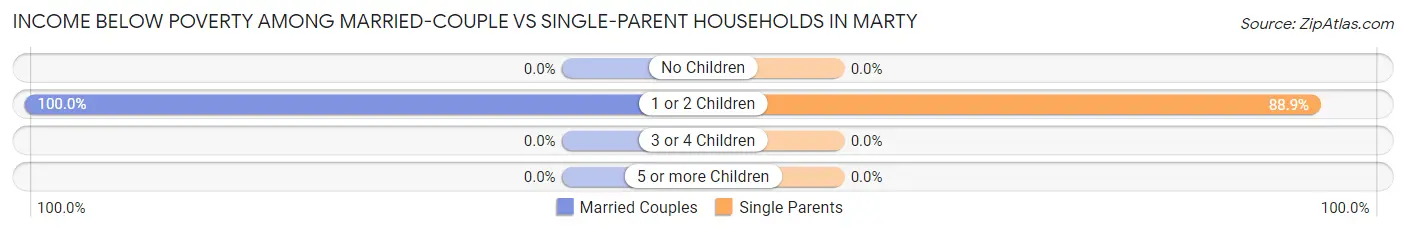
| Children | Married-Couple Families | Single-Parent Households |
| No Children | 0 (0.0%) | 0 (0.0%) |
| 1 or 2 Children | 8 (100.0%) | 32 (88.9%) |
| 3 or 4 Children | 0 (0.0%) | 0 (0.0%) |
| 5 or more Children | 0 (0.0%) | 0 (0.0%) |
| Total | 8 (80.0%) | 32 (88.9%) |
Race in Marty
The most populous races in Marty are Native / Alaskan (193 | 98.0%), and White / Caucasian (4 | 2.0%).
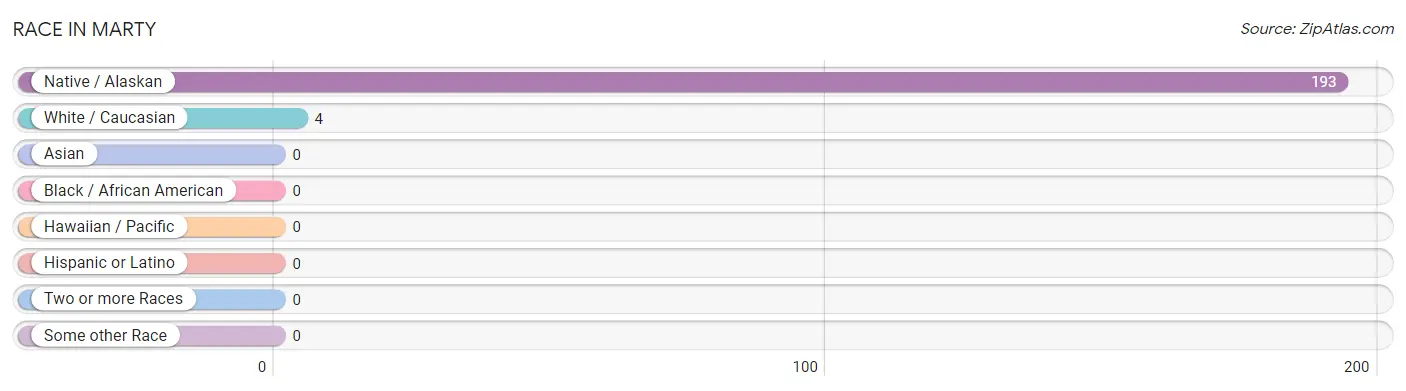
| Race | # Population | % Population |
| Asian | 0 | 0.0% |
| Black / African American | 0 | 0.0% |
| Hawaiian / Pacific | 0 | 0.0% |
| Hispanic or Latino | 0 | 0.0% |
| Native / Alaskan | 193 | 98.0% |
| White / Caucasian | 4 | 2.0% |
| Two or more Races | 0 | 0.0% |
| Some other Race | 0 | 0.0% |
| Total | 197 | 100.0% |
Ancestry in Marty
The most populous ancestries reported in Marty are Sioux (193 | 98.0%), German (4 | 2.0%), Scandinavian (2 | 1.0%), and Swedish (2 | 1.0%), together accounting for 102.0% of all Marty residents.
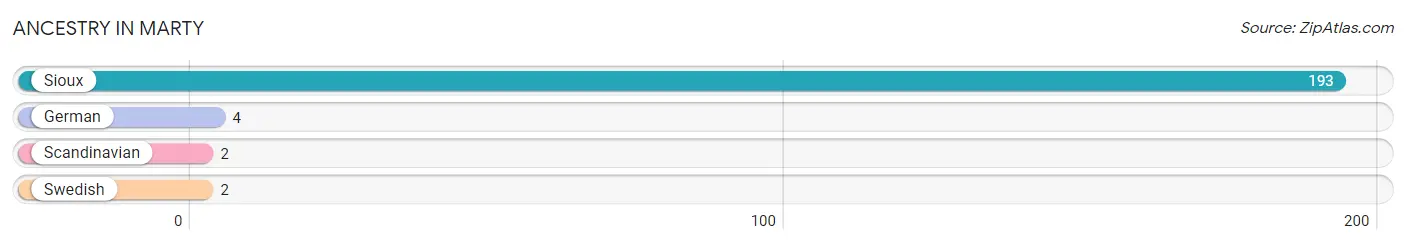
| Ancestry | # Population | % Population |
| German | 4 | 2.0% |
| Scandinavian | 2 | 1.0% |
| Sioux | 193 | 98.0% |
| Swedish | 2 | 1.0% | View All 4 Rows |
Immigrants in Marty

| Immigration Origin | # Population | % Population | View All 0 Rows |
Sex and Age in Marty
Sex and Age in Marty
The most populous age groups in Marty are 45 to 49 Years (30 | 20.0%) for men and 25 to 29 Years (11 | 23.4%) for women.
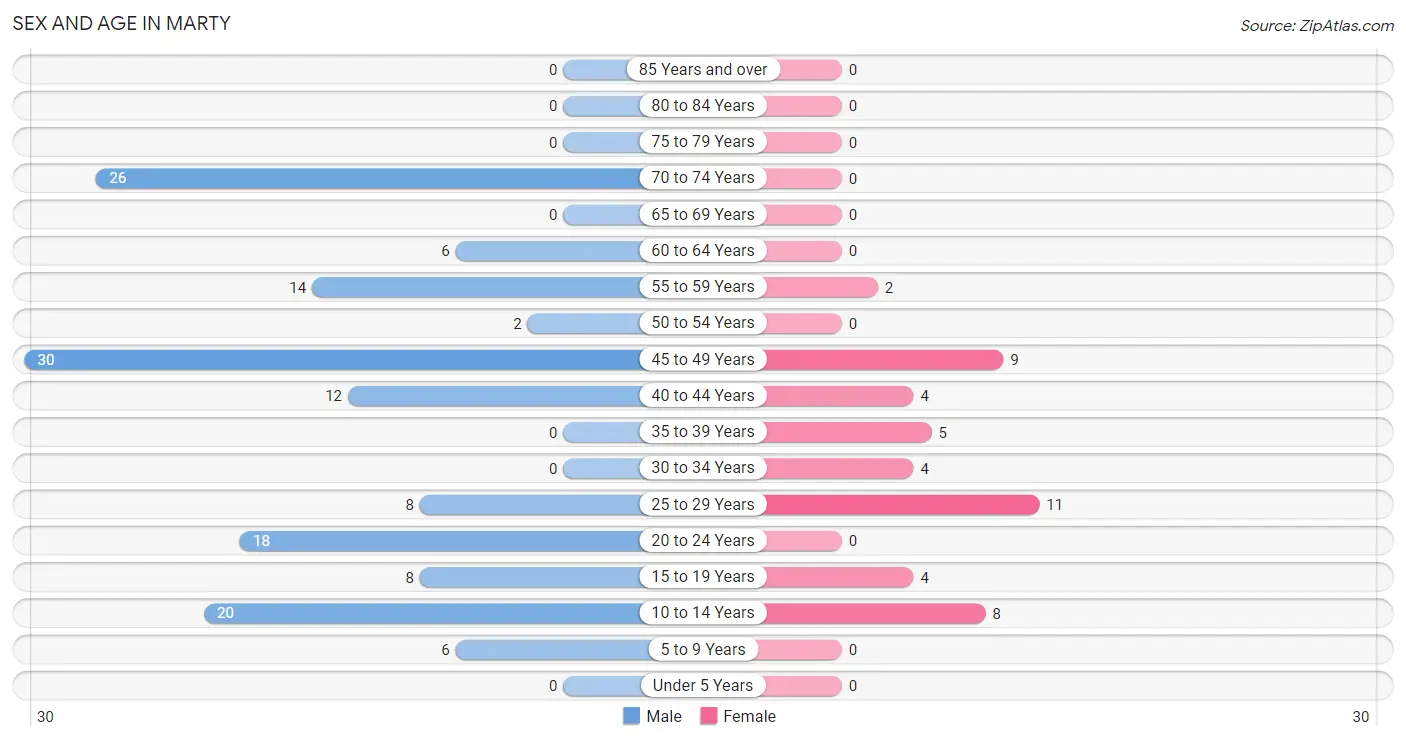
| Age Bracket | Male | Female |
| Under 5 Years | 0 (0.0%) | 0 (0.0%) |
| 5 to 9 Years | 6 (4.0%) | 0 (0.0%) |
| 10 to 14 Years | 20 (13.3%) | 8 (17.0%) |
| 15 to 19 Years | 8 (5.3%) | 4 (8.5%) |
| 20 to 24 Years | 18 (12.0%) | 0 (0.0%) |
| 25 to 29 Years | 8 (5.3%) | 11 (23.4%) |
| 30 to 34 Years | 0 (0.0%) | 4 (8.5%) |
| 35 to 39 Years | 0 (0.0%) | 5 (10.6%) |
| 40 to 44 Years | 12 (8.0%) | 4 (8.5%) |
| 45 to 49 Years | 30 (20.0%) | 9 (19.2%) |
| 50 to 54 Years | 2 (1.3%) | 0 (0.0%) |
| 55 to 59 Years | 14 (9.3%) | 2 (4.3%) |
| 60 to 64 Years | 6 (4.0%) | 0 (0.0%) |
| 65 to 69 Years | 0 (0.0%) | 0 (0.0%) |
| 70 to 74 Years | 26 (17.3%) | 0 (0.0%) |
| 75 to 79 Years | 0 (0.0%) | 0 (0.0%) |
| 80 to 84 Years | 0 (0.0%) | 0 (0.0%) |
| 85 Years and over | 0 (0.0%) | 0 (0.0%) |
| Total | 150 (100.0%) | 47 (100.0%) |
Families and Households in Marty
Median Family Size in Marty
The median family size in Marty is 3.61 persons per family, with single female/mother families (4 | 8.7%) accounting for the largest median family size of 6 persons per family. On the other hand, single male/father families (32 | 69.6%) represent the smallest median family size with 2.72 persons per family.
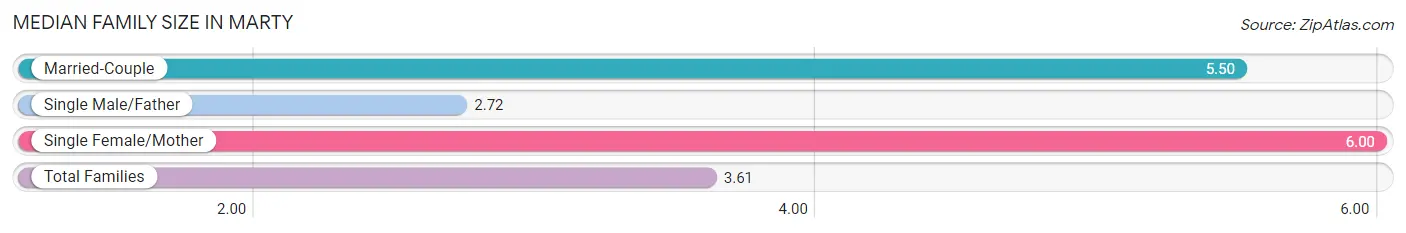
| Family Type | # Families | Family Size |
| Married-Couple | 10 (21.7%) | 5.50 |
| Single Male/Father | 32 (69.6%) | 2.72 |
| Single Female/Mother | 4 (8.7%) | 6.00 |
| Total Families | 46 (100.0%) | 3.61 |
Median Household Size in Marty
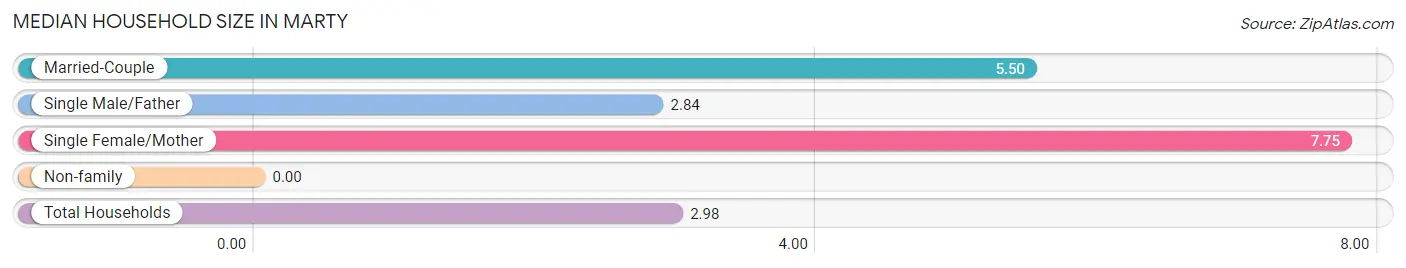
| Household Type | # Households | Household Size |
| Married-Couple | 10 (15.1%) | 5.50 |
| Single Male/Father | 32 (48.5%) | 2.84 |
| Single Female/Mother | 4 (6.1%) | 7.75 |
| Non-family | 20 (30.3%) | - |
| Total Households | 66 (100.0%) | 2.98 |
Household Size by Marriage Status in Marty
Out of a total of 66 households in Marty, 46 (69.7%) are family households, while 20 (30.3%) are nonfamily households. The most numerous type of family households are 6-person households, comprising 26, and the most common type of nonfamily households are 1-person households, comprising 20.
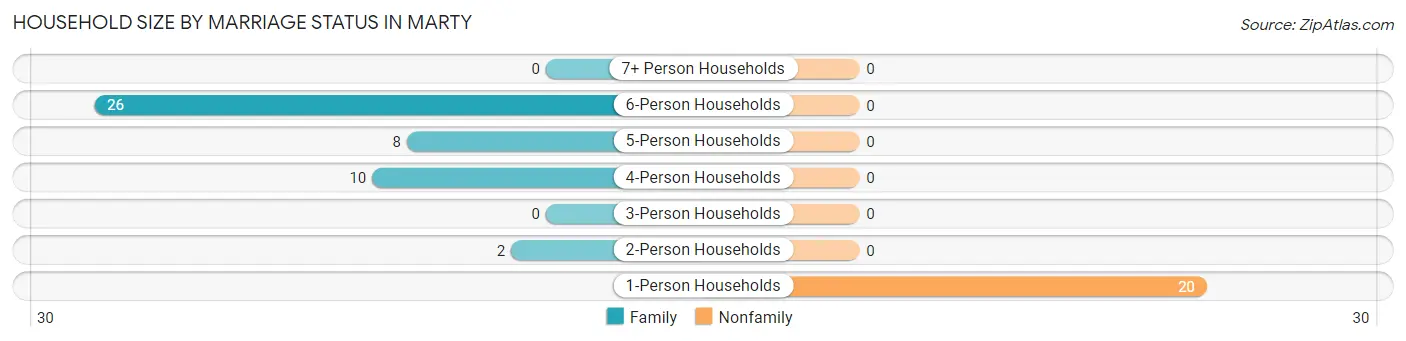
| Household Size | Family Households | Nonfamily Households |
| 1-Person Households | - | 20 (30.3%) |
| 2-Person Households | 2 (3.0%) | 0 (0.0%) |
| 3-Person Households | 0 (0.0%) | 0 (0.0%) |
| 4-Person Households | 10 (15.1%) | 0 (0.0%) |
| 5-Person Households | 8 (12.1%) | 0 (0.0%) |
| 6-Person Households | 26 (39.4%) | 0 (0.0%) |
| 7+ Person Households | 0 (0.0%) | 0 (0.0%) |
| Total | 46 (69.7%) | 20 (30.3%) |
Female Fertility in Marty
Fertility by Age in Marty
Average fertility rate in Marty is 135.0 births per 1,000 women. Women in the age bracket of 35 to 50 years have the highest fertility rate with 278.0 births per 1,000 women. Women in the age bracket of 35 to 50 years acount for 100.0% of all women with births.
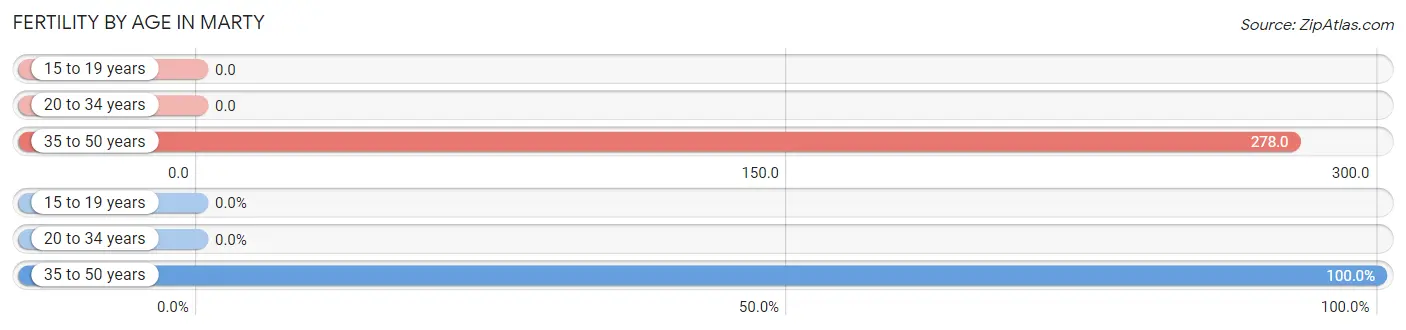
| Age Bracket | Women with Births | Births / 1,000 Women |
| 15 to 19 years | 0 (0.0%) | 0.0 |
| 20 to 34 years | 0 (0.0%) | 0.0 |
| 35 to 50 years | 5 (100.0%) | 278.0 |
| Total | 5 (100.0%) | 135.0 |
Fertility by Age by Marriage Status in Marty
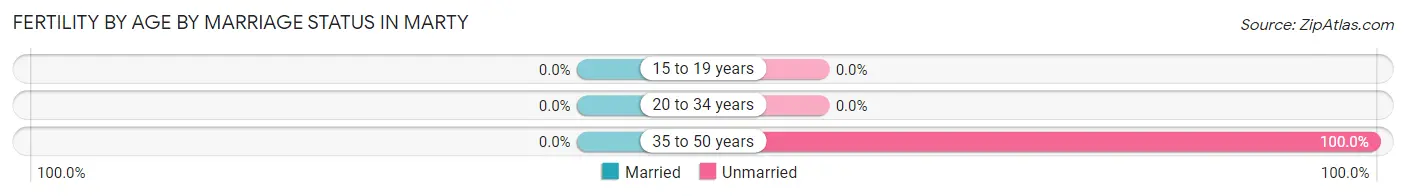
| Age Bracket | Married | Unmarried |
| 15 to 19 years | 0 (0.0%) | 0 (0.0%) |
| 20 to 34 years | 0 (0.0%) | 0 (0.0%) |
| 35 to 50 years | 0 (0.0%) | 5 (100.0%) |
| Total | 0 (0.0%) | 5 (100.0%) |
Fertility by Education in Marty
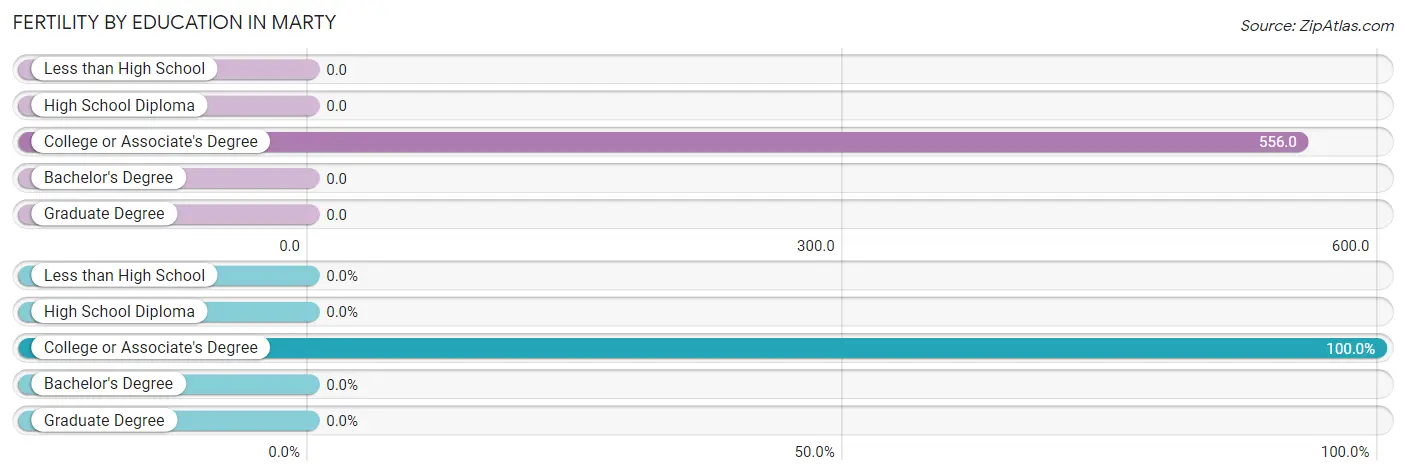
| Educational Attainment | Women with Births | Births / 1,000 Women |
| Less than High School | 0 (0.0%) | 0.0 |
| High School Diploma | 0 (0.0%) | 0.0 |
| College or Associate's Degree | 5 (100.0%) | 556.0 |
| Bachelor's Degree | 0 (0.0%) | 0.0 |
| Graduate Degree | 0 (0.0%) | 0.0 |
| Total | 5 (100.0%) | 135.0 |
Fertility by Education by Marriage Status in Marty
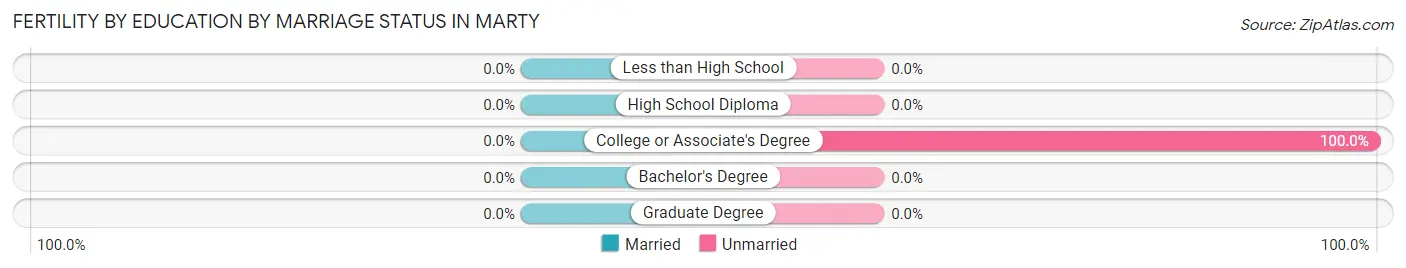
| Educational Attainment | Married | Unmarried |
| Less than High School | 0 (0.0%) | 0 (0.0%) |
| High School Diploma | 0 (0.0%) | 0 (0.0%) |
| College or Associate's Degree | 0 (0.0%) | 5 (100.0%) |
| Bachelor's Degree | 0 (0.0%) | 0 (0.0%) |
| Graduate Degree | 0 (0.0%) | 0 (0.0%) |
| Total | 0 (0.0%) | 5 (100.0%) |
Employment Characteristics in Marty
Employment by Class of Employer in Marty
Among the 29 employed individuals in Marty, local government employees (12 | 41.4%), not-for-profit organizations (9 | 31.0%), and private company employees (4 | 13.8%) make up the most common classes of employment.
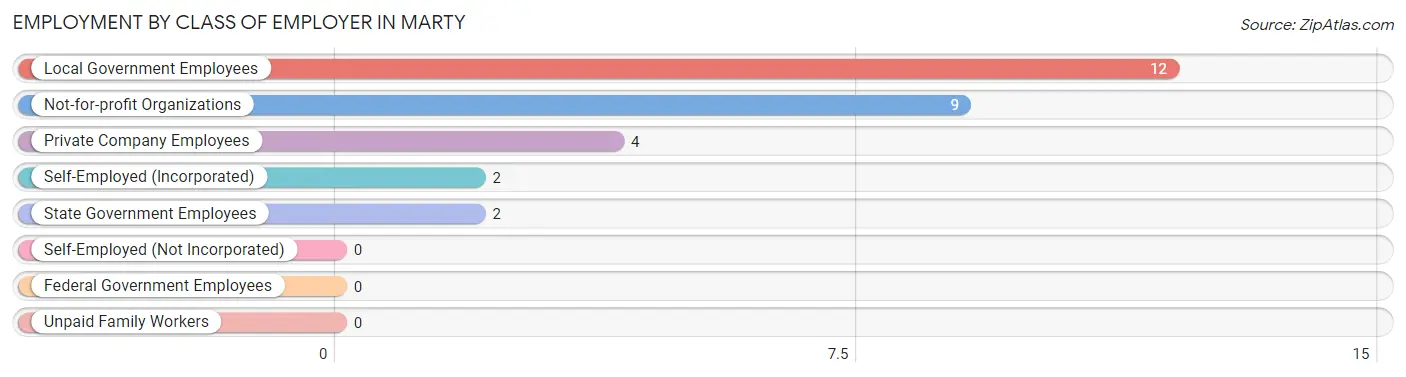
| Employer Class | # Employees | % Employees |
| Private Company Employees | 4 | 13.8% |
| Self-Employed (Incorporated) | 2 | 6.9% |
| Self-Employed (Not Incorporated) | 0 | 0.0% |
| Not-for-profit Organizations | 9 | 31.0% |
| Local Government Employees | 12 | 41.4% |
| State Government Employees | 2 | 6.9% |
| Federal Government Employees | 0 | 0.0% |
| Unpaid Family Workers | 0 | 0.0% |
| Total | 29 | 100.0% |
Employment Status by Age in Marty
According to the labor force statistics for Marty, out of the total population over 16 years of age (163), 39.3% or 64 individuals are in the labor force, with 54.7% or 35 of them unemployed. The age group with the highest labor force participation rate is 25 to 29 years, with 100.0% or 19 individuals in the labor force. Within the labor force, the 16 to 19 years age range has the highest percentage of unemployed individuals, with 100.0% or 4 of them being unemployed.
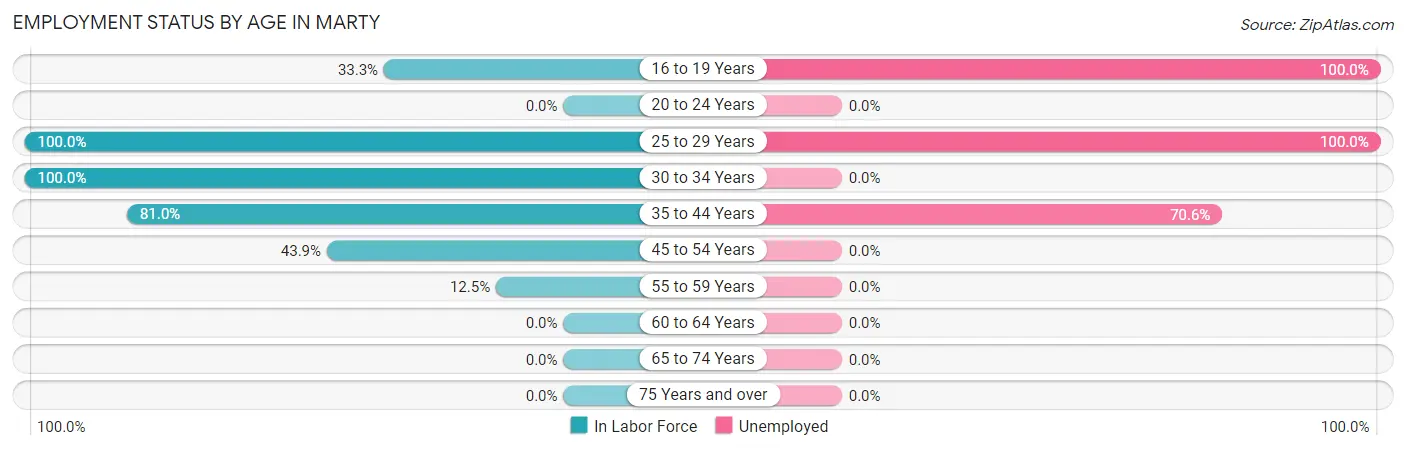
| Age Bracket | In Labor Force | Unemployed |
| 16 to 19 Years | 4 (33.3%) | 4 (100.0%) |
| 20 to 24 Years | 0 (0.0%) | 0 (0.0%) |
| 25 to 29 Years | 19 (100.0%) | 19 (100.0%) |
| 30 to 34 Years | 4 (100.0%) | 0 (0.0%) |
| 35 to 44 Years | 17 (81.0%) | 12 (70.6%) |
| 45 to 54 Years | 18 (43.9%) | 0 (0.0%) |
| 55 to 59 Years | 2 (12.5%) | 0 (0.0%) |
| 60 to 64 Years | 0 (0.0%) | 0 (0.0%) |
| 65 to 74 Years | 0 (0.0%) | 0 (0.0%) |
| 75 Years and over | 0 (0.0%) | 0 (0.0%) |
| Total | 64 (39.3%) | 35 (54.7%) |
Employment Status by Educational Attainment in Marty
According to labor force statistics for Marty, 56.1% of individuals (60) out of the total population between 25 and 64 years of age (107) are in the labor force, with 51.7% or 31 of them being unemployed. The group with the highest labor force participation rate are those with the educational attainment of less than high school, with 67.9% or 19 individuals in the labor force. Within the labor force, individuals with less than high school education have the highest percentage of unemployment, with 100.0% or 19 of them being unemployed.
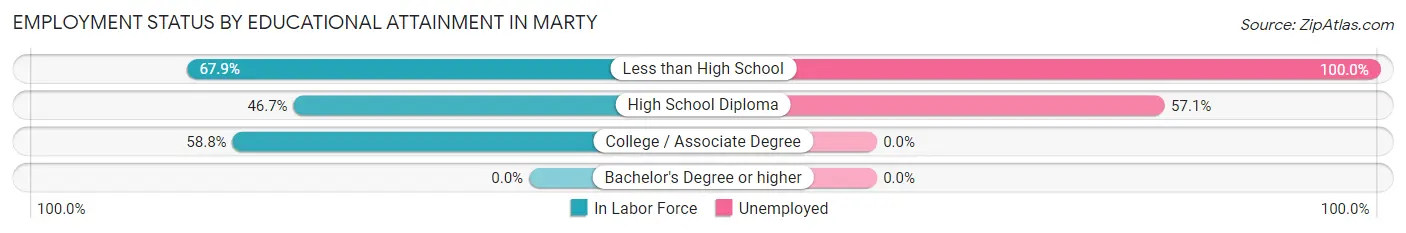
| Educational Attainment | In Labor Force | Unemployed |
| Less than High School | 19 (67.9%) | 28 (100.0%) |
| High School Diploma | 21 (46.7%) | 26 (57.1%) |
| College / Associate Degree | 20 (58.8%) | 0 (0.0%) |
| Bachelor's Degree or higher | 0 (0.0%) | 0 (0.0%) |
| Total | 60 (56.1%) | 55 (51.7%) |
Employment Occupations by Sex in Marty
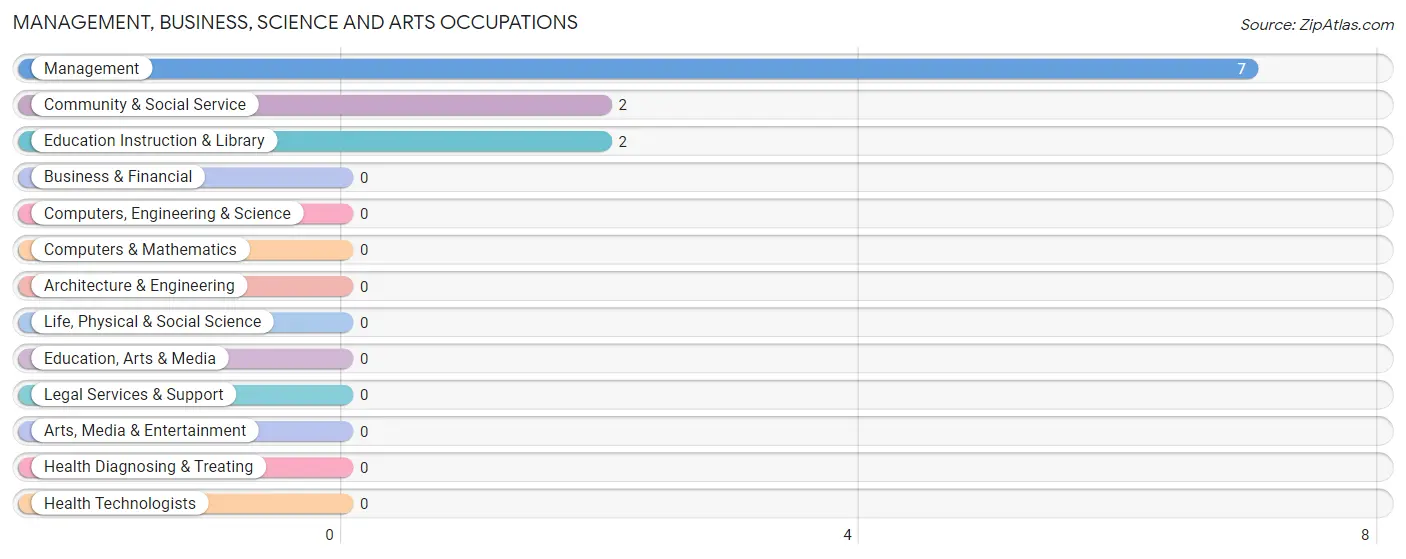
Management, Business, Science and Arts Occupations
The most common Management, Business, Science and Arts occupations in Marty are Management (7 | 24.1%), Community & Social Service (2 | 6.9%), and Education Instruction & Library (2 | 6.9%).
Management, Business, Science and Arts Occupations by Sex
| Occupation | Male | Female |
| Management | 2 (28.6%) | 5 (71.4%) |
| Business & Financial | 0 (0.0%) | 0 (0.0%) |
| Computers, Engineering & Science | 0 (0.0%) | 0 (0.0%) |
| Computers & Mathematics | 0 (0.0%) | 0 (0.0%) |
| Architecture & Engineering | 0 (0.0%) | 0 (0.0%) |
| Life, Physical & Social Science | 0 (0.0%) | 0 (0.0%) |
| Community & Social Service | 0 (0.0%) | 2 (100.0%) |
| Education, Arts & Media | 0 (0.0%) | 0 (0.0%) |
| Legal Services & Support | 0 (0.0%) | 0 (0.0%) |
| Education Instruction & Library | 0 (0.0%) | 2 (100.0%) |
| Arts, Media & Entertainment | 0 (0.0%) | 0 (0.0%) |
| Health Diagnosing & Treating | 0 (0.0%) | 0 (0.0%) |
| Health Technologists | 0 (0.0%) | 0 (0.0%) |
| Total (Category) | 2 (22.2%) | 7 (77.8%) |
| Total (Overall) | 18 (62.1%) | 11 (37.9%) |
Services Occupations
The most common Services occupations in Marty are Security & Protection (9 | 31.0%), and Firefighting & Prevention (9 | 31.0%).
Services Occupations by Sex
| Occupation | Male | Female |
| Healthcare Support | 0 (0.0%) | 0 (0.0%) |
| Security & Protection | 9 (100.0%) | 0 (0.0%) |
| Firefighting & Prevention | 9 (100.0%) | 0 (0.0%) |
| Law Enforcement | 0 (0.0%) | 0 (0.0%) |
| Food Preparation & Serving | 0 (0.0%) | 0 (0.0%) |
| Cleaning & Maintenance | 0 (0.0%) | 0 (0.0%) |
| Personal Care & Service | 0 (0.0%) | 0 (0.0%) |
| Total (Category) | 9 (100.0%) | 0 (0.0%) |
| Total (Overall) | 18 (62.1%) | 11 (37.9%) |
Sales and Office Occupations
Sales and Office Occupations by Sex
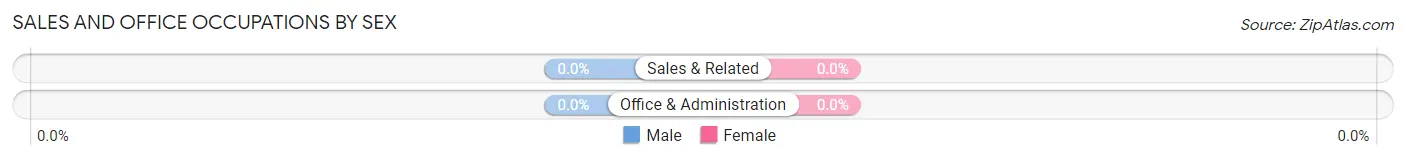
| Occupation | Male | Female |
| Sales & Related | 0 (0.0%) | 0 (0.0%) |
| Office & Administration | 0 (0.0%) | 0 (0.0%) |
| Total (Category) | 0 (0.0%) | 0 (0.0%) |
| Total (Overall) | 18 (62.1%) | 11 (37.9%) |
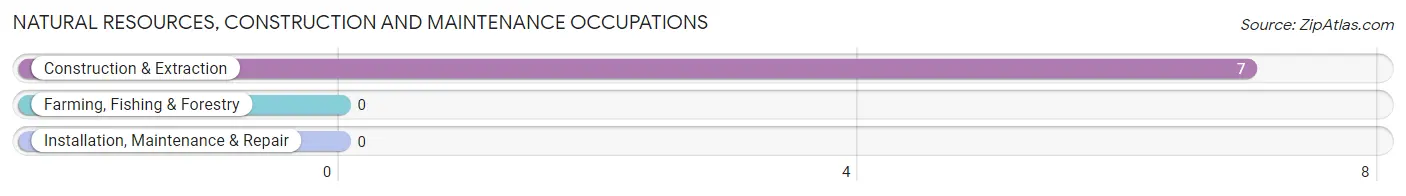
Natural Resources, Construction and Maintenance Occupations
The most common Natural Resources, Construction and Maintenance occupations in Marty are , and Construction & Extraction (7 | 24.1%).
Natural Resources, Construction and Maintenance Occupations by Sex
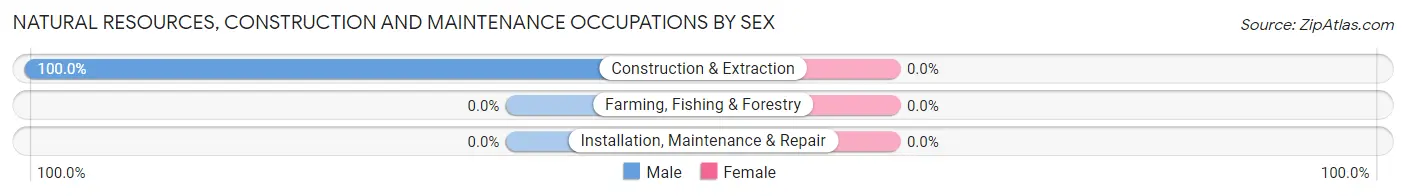
| Occupation | Male | Female |
| Farming, Fishing & Forestry | 0 (0.0%) | 0 (0.0%) |
| Construction & Extraction | 7 (100.0%) | 0 (0.0%) |
| Installation, Maintenance & Repair | 0 (0.0%) | 0 (0.0%) |
| Total (Category) | 7 (100.0%) | 0 (0.0%) |
| Total (Overall) | 18 (62.1%) | 11 (37.9%) |
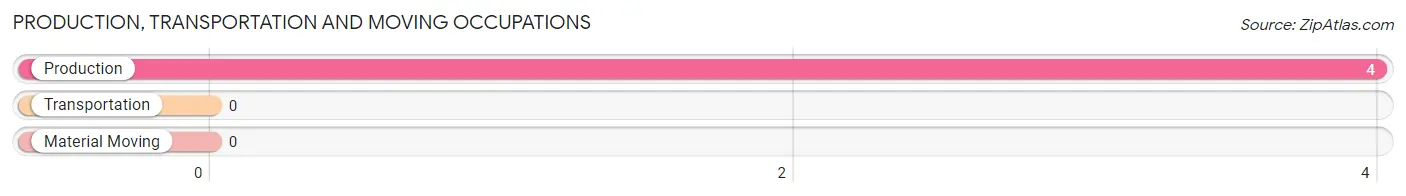
Production, Transportation and Moving Occupations
The most common Production, Transportation and Moving occupations in Marty are , and Production (4 | 13.8%).
Production, Transportation and Moving Occupations by Sex
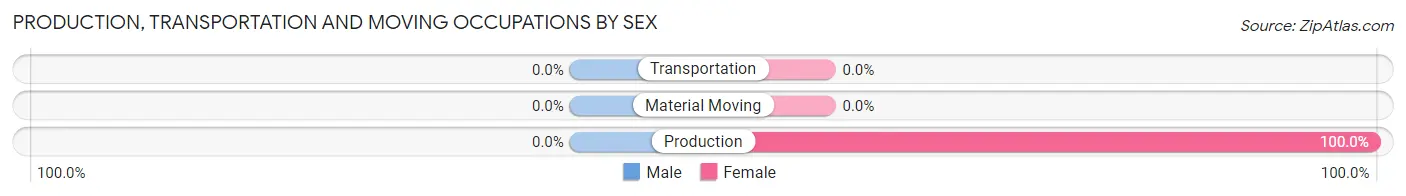
| Occupation | Male | Female |
| Production | 0 (0.0%) | 4 (100.0%) |
| Transportation | 0 (0.0%) | 0 (0.0%) |
| Material Moving | 0 (0.0%) | 0 (0.0%) |
| Total (Category) | 0 (0.0%) | 4 (100.0%) |
| Total (Overall) | 18 (62.1%) | 11 (37.9%) |
Employment Industries by Sex in Marty
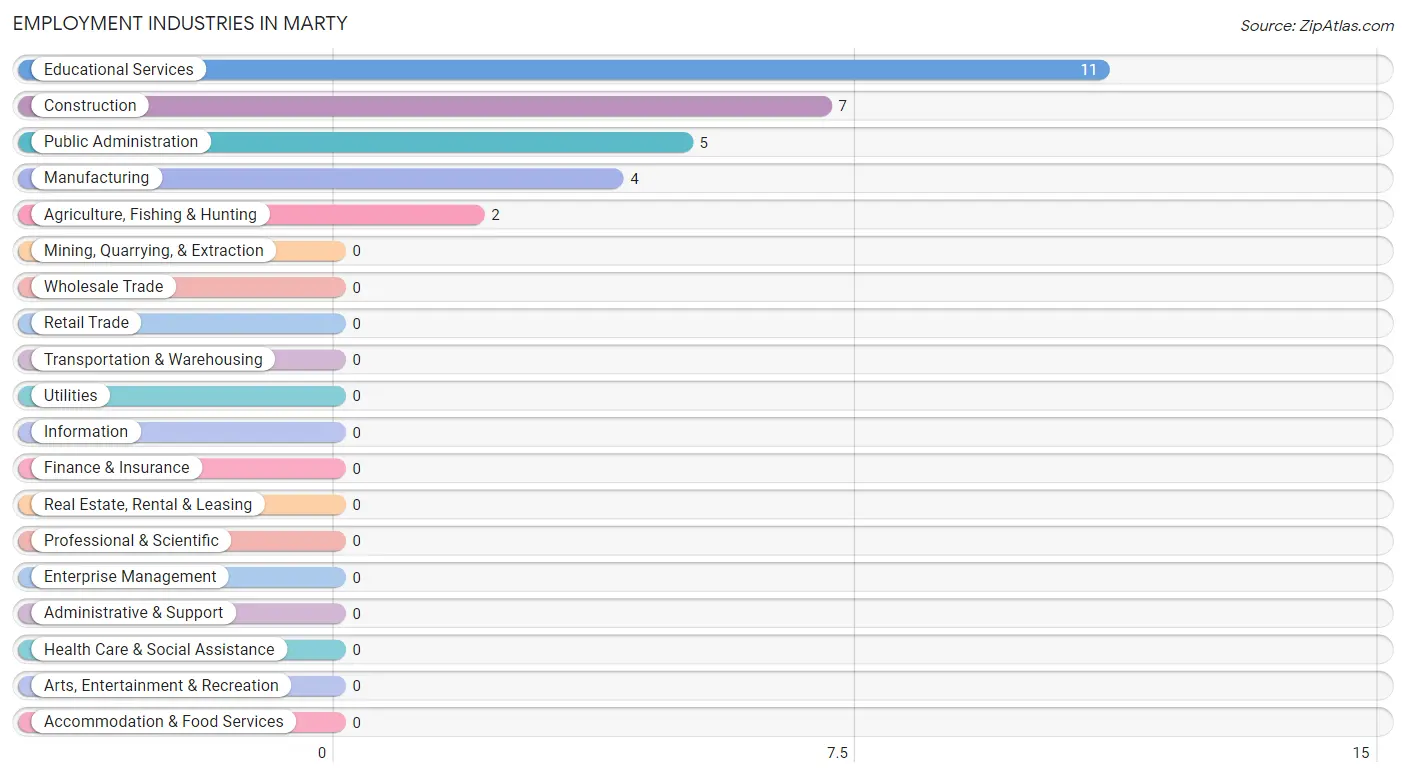
Employment Industries in Marty
The major employment industries in Marty include Educational Services (11 | 37.9%), Construction (7 | 24.1%), Public Administration (5 | 17.2%), Manufacturing (4 | 13.8%), and Agriculture, Fishing & Hunting (2 | 6.9%).
Employment Industries by Sex in Marty
The Marty industries that see more men than women are Agriculture, Fishing & Hunting (100.0%), Construction (100.0%), and Educational Services (81.8%), whereas the industries that tend to have a higher number of women are Manufacturing (100.0%), Public Administration (100.0%), and Educational Services (18.2%).
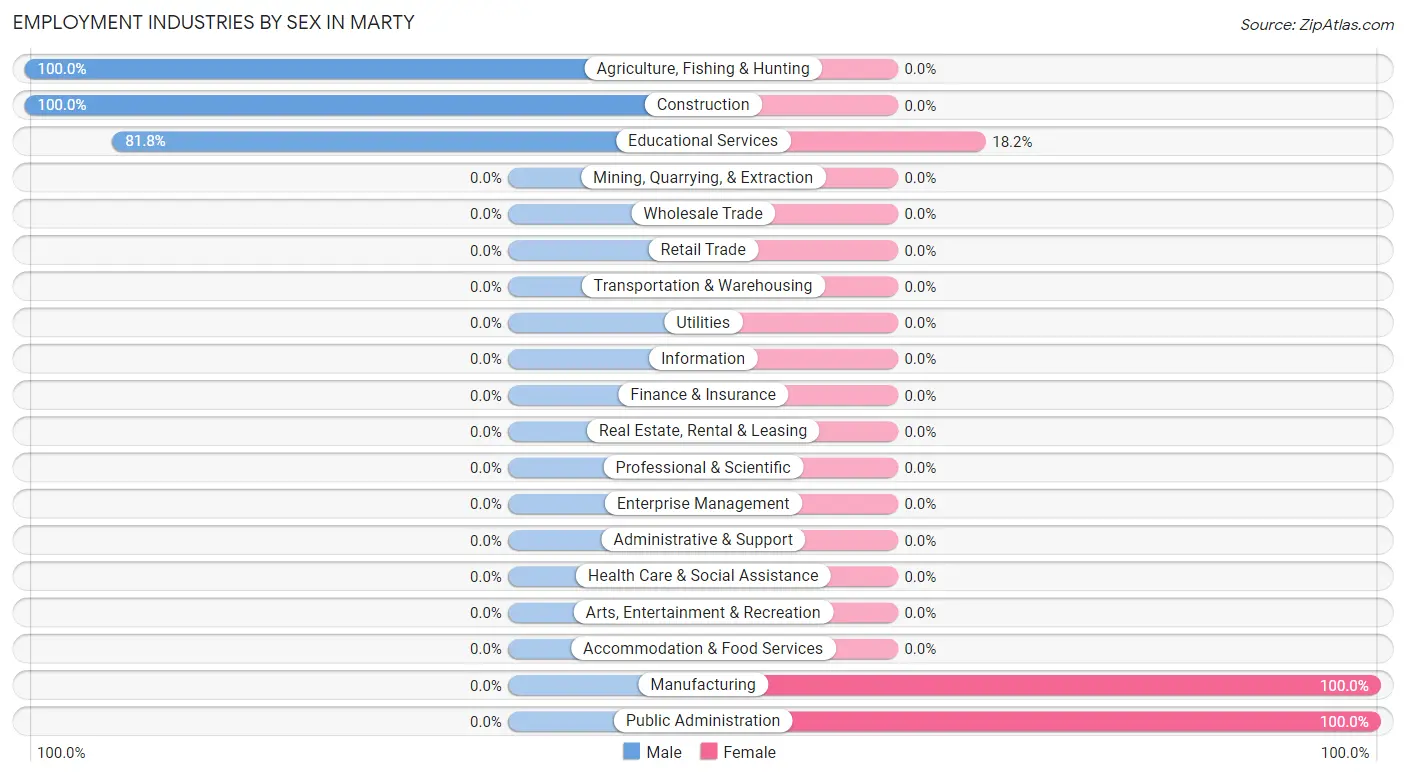
| Industry | Male | Female |
| Agriculture, Fishing & Hunting | 2 (100.0%) | 0 (0.0%) |
| Mining, Quarrying, & Extraction | 0 (0.0%) | 0 (0.0%) |
| Construction | 7 (100.0%) | 0 (0.0%) |
| Manufacturing | 0 (0.0%) | 4 (100.0%) |
| Wholesale Trade | 0 (0.0%) | 0 (0.0%) |
| Retail Trade | 0 (0.0%) | 0 (0.0%) |
| Transportation & Warehousing | 0 (0.0%) | 0 (0.0%) |
| Utilities | 0 (0.0%) | 0 (0.0%) |
| Information | 0 (0.0%) | 0 (0.0%) |
| Finance & Insurance | 0 (0.0%) | 0 (0.0%) |
| Real Estate, Rental & Leasing | 0 (0.0%) | 0 (0.0%) |
| Professional & Scientific | 0 (0.0%) | 0 (0.0%) |
| Enterprise Management | 0 (0.0%) | 0 (0.0%) |
| Administrative & Support | 0 (0.0%) | 0 (0.0%) |
| Educational Services | 9 (81.8%) | 2 (18.2%) |
| Health Care & Social Assistance | 0 (0.0%) | 0 (0.0%) |
| Arts, Entertainment & Recreation | 0 (0.0%) | 0 (0.0%) |
| Accommodation & Food Services | 0 (0.0%) | 0 (0.0%) |
| Public Administration | 0 (0.0%) | 5 (100.0%) |
| Total | 18 (62.1%) | 11 (37.9%) |
Education in Marty
School Enrollment in Marty
The most common levels of schooling among the 32 students in Marty are middle school (13 | 40.6%), high school (12 | 37.5%), and elementary school (7 | 21.9%).
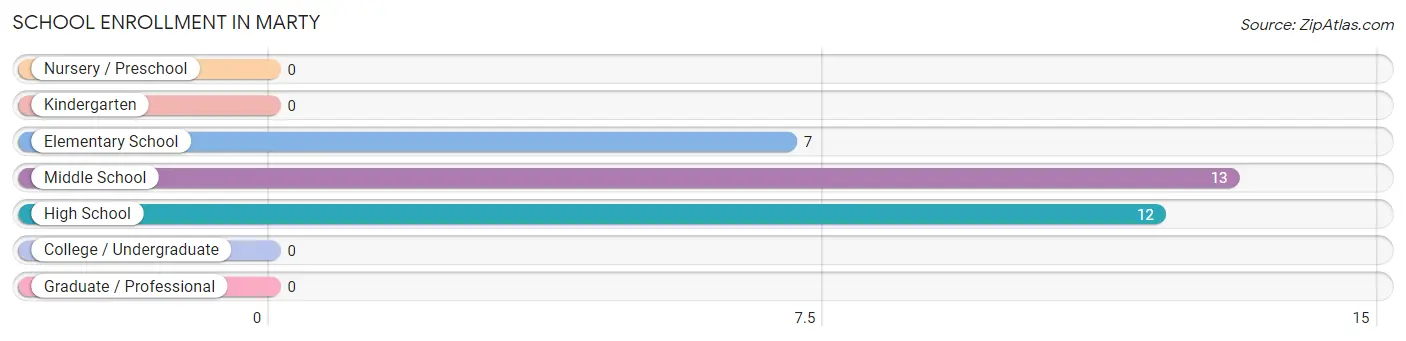
| School Level | # Students | % Students |
| Nursery / Preschool | 0 | 0.0% |
| Kindergarten | 0 | 0.0% |
| Elementary School | 7 | 21.9% |
| Middle School | 13 | 40.6% |
| High School | 12 | 37.5% |
| College / Undergraduate | 0 | 0.0% |
| Graduate / Professional | 0 | 0.0% |
| Total | 32 | 100.0% |
School Enrollment by Age by Funding Source in Marty
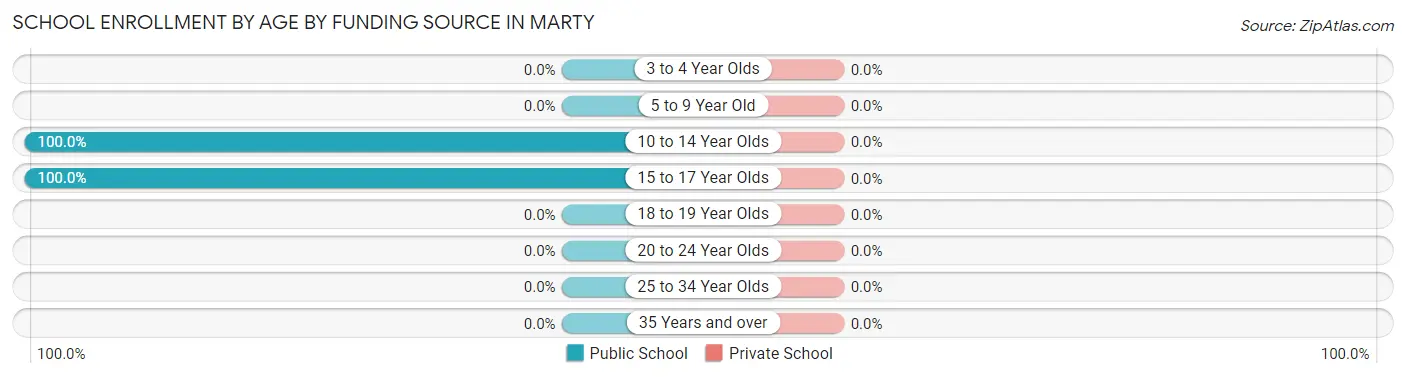
| Age Bracket | Public School | Private School |
| 3 to 4 Year Olds | 0 (0.0%) | 0 (0.0%) |
| 5 to 9 Year Old | 0 (0.0%) | 0 (0.0%) |
| 10 to 14 Year Olds | 28 (100.0%) | 0 (0.0%) |
| 15 to 17 Year Olds | 4 (100.0%) | 0 (0.0%) |
| 18 to 19 Year Olds | 0 (0.0%) | 0 (0.0%) |
| 20 to 24 Year Olds | 0 (0.0%) | 0 (0.0%) |
| 25 to 34 Year Olds | 0 (0.0%) | 0 (0.0%) |
| 35 Years and over | 0 (0.0%) | 0 (0.0%) |
| Total | 32 (100.0%) | 0 (0.0%) |
Educational Attainment by Field of Study in Marty
| Field of Study | # Graduates | % Graduates |
| Computers & Mathematics | 0 | 0.0% |
| Bio, Nature & Agricultural | 0 | 0.0% |
| Physical & Health Sciences | 0 | 0.0% |
| Psychology | 0 | 0.0% |
| Social Sciences | 0 | 0.0% |
| Engineering | 0 | 0.0% |
| Multidisciplinary Studies | 0 | 0.0% |
| Science & Technology | 0 | 0.0% |
| Business | 0 | 0.0% |
| Education | 0 | 0.0% |
| Literature & Languages | 0 | 0.0% |
| Liberal Arts & History | 0 | 0.0% |
| Visual & Performing Arts | 0 | 0.0% |
| Communications | 0 | 0.0% |
| Arts & Humanities | 0 | 0.0% |
| Total | 0 | 0.0% |
Transportation & Commute in Marty
Vehicle Availability by Sex in Marty
The most prevalent vehicle ownership categories in Marty are males with 4 vehicles (11, accounting for 61.1%) and females with 4 vehicles (2, making up 100.0%).
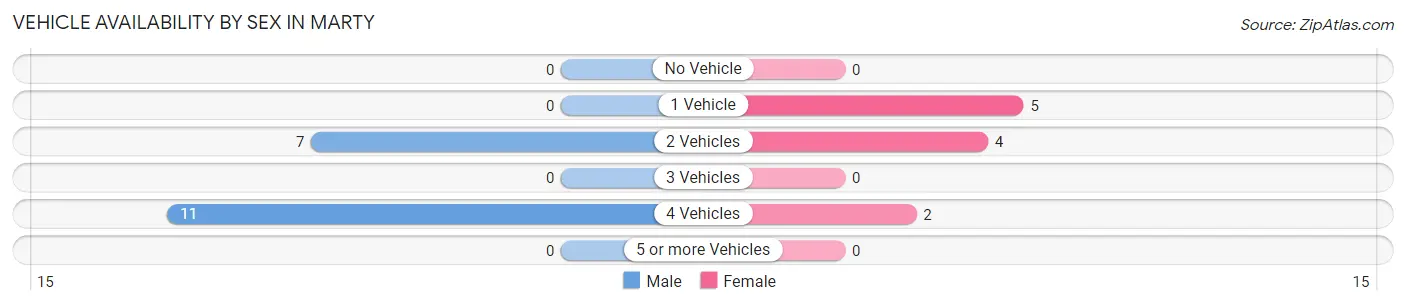
| Vehicles Available | Male | Female |
| No Vehicle | 0 (0.0%) | 0 (0.0%) |
| 1 Vehicle | 0 (0.0%) | 5 (45.5%) |
| 2 Vehicles | 7 (38.9%) | 4 (36.4%) |
| 3 Vehicles | 0 (0.0%) | 0 (0.0%) |
| 4 Vehicles | 11 (61.1%) | 2 (18.2%) |
| 5 or more Vehicles | 0 (0.0%) | 0 (0.0%) |
| Total | 18 (100.0%) | 11 (100.0%) |
Commute Time in Marty
The most frequently occuring commute durations in Marty are less than 5 minutes (9 commuters, 40.9%), 10 to 14 minutes (5 commuters, 22.7%), and 20 to 24 minutes (4 commuters, 18.2%).
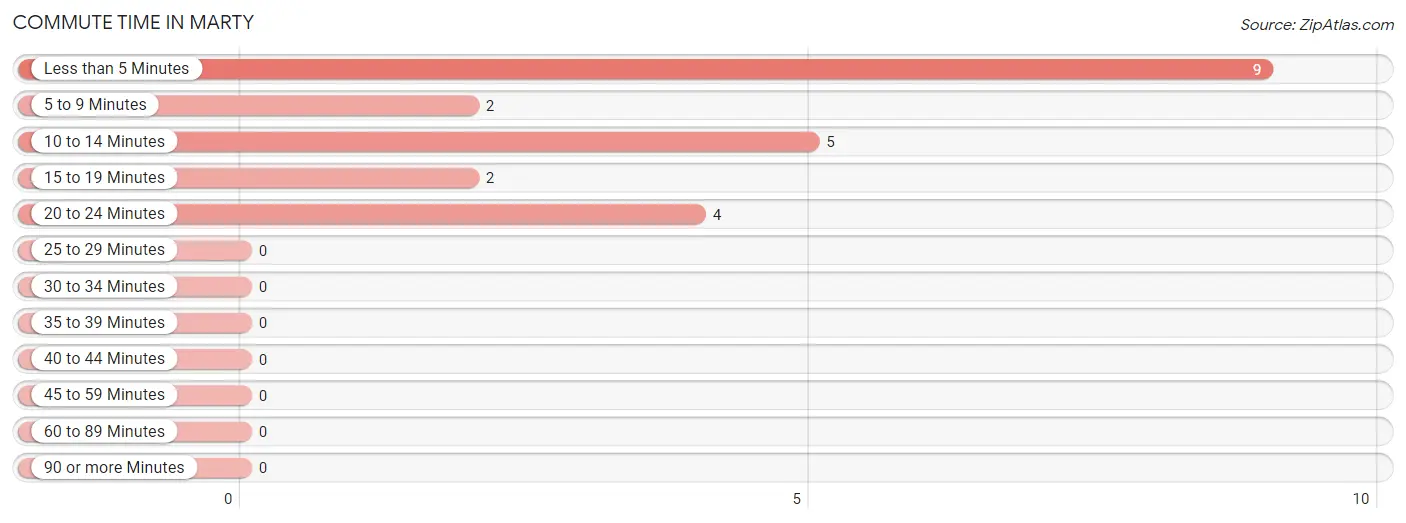
| Commute Time | # Commuters | % Commuters |
| Less than 5 Minutes | 9 | 40.9% |
| 5 to 9 Minutes | 2 | 9.1% |
| 10 to 14 Minutes | 5 | 22.7% |
| 15 to 19 Minutes | 2 | 9.1% |
| 20 to 24 Minutes | 4 | 18.2% |
| 25 to 29 Minutes | 0 | 0.0% |
| 30 to 34 Minutes | 0 | 0.0% |
| 35 to 39 Minutes | 0 | 0.0% |
| 40 to 44 Minutes | 0 | 0.0% |
| 45 to 59 Minutes | 0 | 0.0% |
| 60 to 89 Minutes | 0 | 0.0% |
| 90 or more Minutes | 0 | 0.0% |
Commute Time by Sex in Marty
The most common commute times in Marty are less than 5 minutes (9 commuters, 81.8%) for males and 10 to 14 minutes (5 commuters, 45.5%) for females.
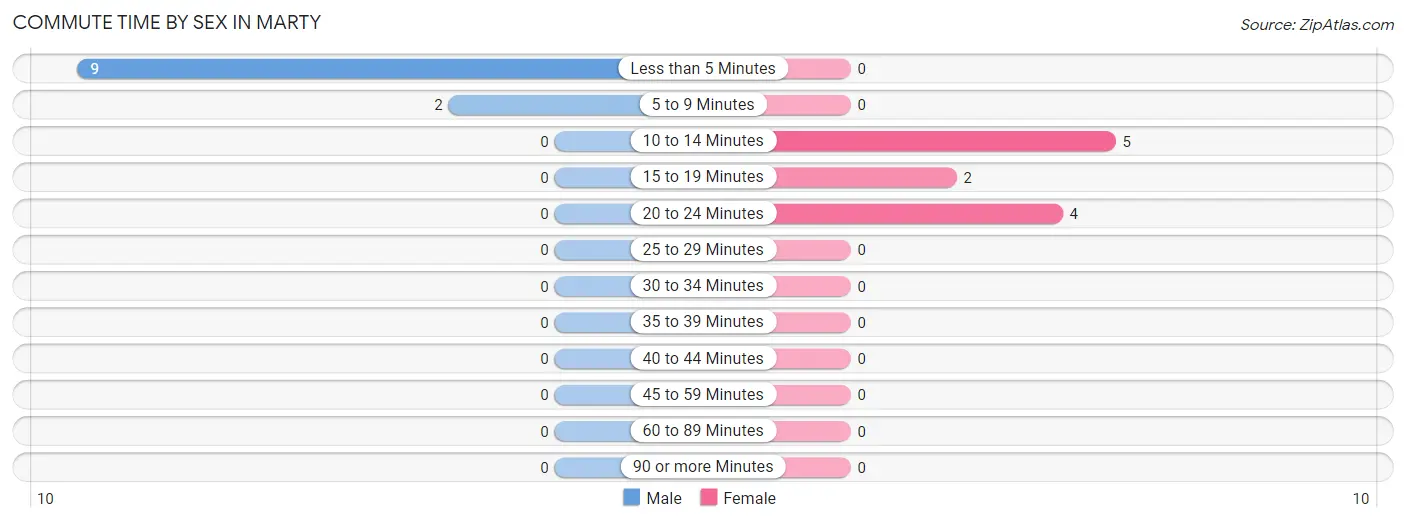
| Commute Time | Male | Female |
| Less than 5 Minutes | 9 (81.8%) | 0 (0.0%) |
| 5 to 9 Minutes | 2 (18.2%) | 0 (0.0%) |
| 10 to 14 Minutes | 0 (0.0%) | 5 (45.5%) |
| 15 to 19 Minutes | 0 (0.0%) | 2 (18.2%) |
| 20 to 24 Minutes | 0 (0.0%) | 4 (36.4%) |
| 25 to 29 Minutes | 0 (0.0%) | 0 (0.0%) |
| 30 to 34 Minutes | 0 (0.0%) | 0 (0.0%) |
| 35 to 39 Minutes | 0 (0.0%) | 0 (0.0%) |
| 40 to 44 Minutes | 0 (0.0%) | 0 (0.0%) |
| 45 to 59 Minutes | 0 (0.0%) | 0 (0.0%) |
| 60 to 89 Minutes | 0 (0.0%) | 0 (0.0%) |
| 90 or more Minutes | 0 (0.0%) | 0 (0.0%) |
Time of Departure to Work by Sex in Marty
The most frequent times of departure to work in Marty are 12:00 AM to 4:59 AM (9, 81.8%) for males and 12:00 PM to 3:59 PM (5, 45.5%) for females.
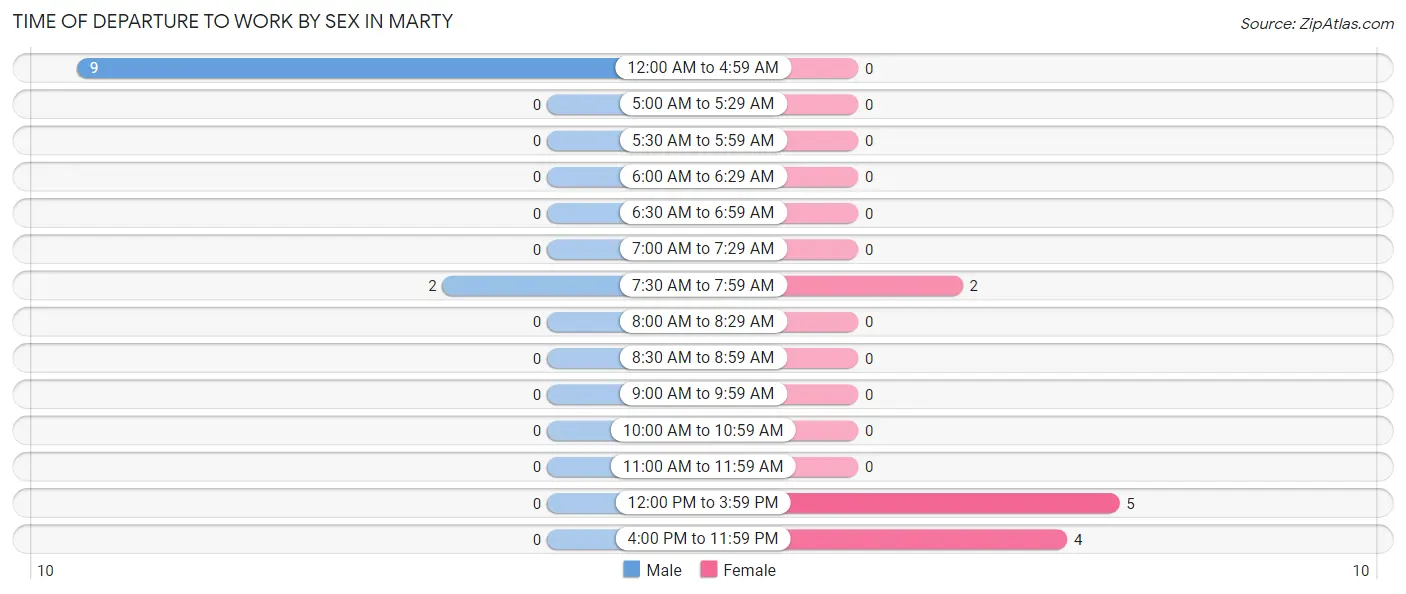
| Time of Departure | Male | Female |
| 12:00 AM to 4:59 AM | 9 (81.8%) | 0 (0.0%) |
| 5:00 AM to 5:29 AM | 0 (0.0%) | 0 (0.0%) |
| 5:30 AM to 5:59 AM | 0 (0.0%) | 0 (0.0%) |
| 6:00 AM to 6:29 AM | 0 (0.0%) | 0 (0.0%) |
| 6:30 AM to 6:59 AM | 0 (0.0%) | 0 (0.0%) |
| 7:00 AM to 7:29 AM | 0 (0.0%) | 0 (0.0%) |
| 7:30 AM to 7:59 AM | 2 (18.2%) | 2 (18.2%) |
| 8:00 AM to 8:29 AM | 0 (0.0%) | 0 (0.0%) |
| 8:30 AM to 8:59 AM | 0 (0.0%) | 0 (0.0%) |
| 9:00 AM to 9:59 AM | 0 (0.0%) | 0 (0.0%) |
| 10:00 AM to 10:59 AM | 0 (0.0%) | 0 (0.0%) |
| 11:00 AM to 11:59 AM | 0 (0.0%) | 0 (0.0%) |
| 12:00 PM to 3:59 PM | 0 (0.0%) | 5 (45.5%) |
| 4:00 PM to 11:59 PM | 0 (0.0%) | 4 (36.4%) |
| Total | 11 (100.0%) | 11 (100.0%) |
Housing Occupancy in Marty
Occupancy by Ownership in Marty
Of the total 66 dwellings in Marty, owner-occupied units account for 32 (48.5%), while renter-occupied units make up 34 (51.5%).
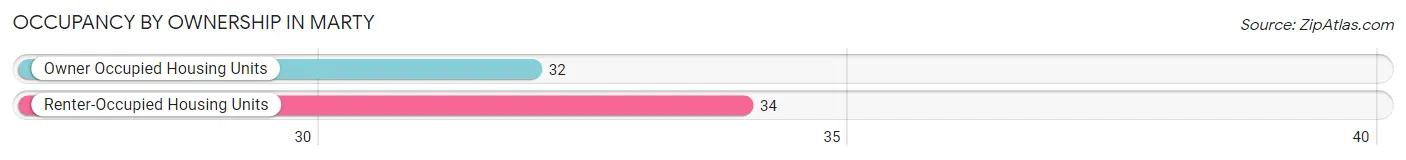
| Occupancy | # Housing Units | % Housing Units |
| Owner Occupied Housing Units | 32 | 48.5% |
| Renter-Occupied Housing Units | 34 | 51.5% |
| Total Occupied Housing Units | 66 | 100.0% |
Occupancy by Household Size in Marty
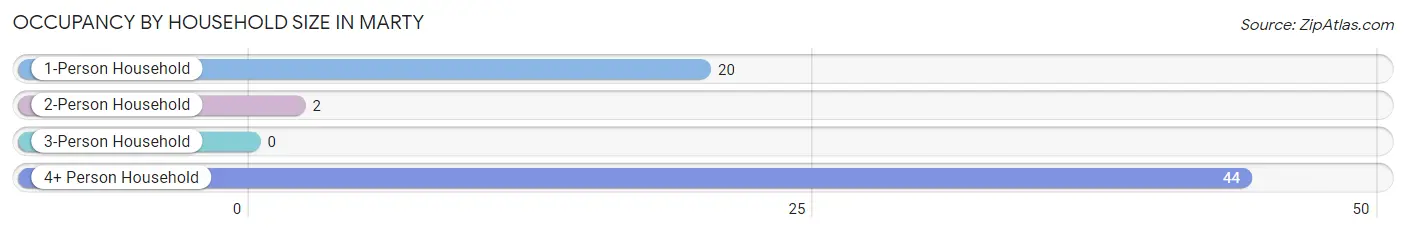
| Household Size | # Housing Units | % Housing Units |
| 1-Person Household | 20 | 30.3% |
| 2-Person Household | 2 | 3.0% |
| 3-Person Household | 0 | 0.0% |
| 4+ Person Household | 44 | 66.7% |
| Total Housing Units | 66 | 100.0% |
Occupancy by Ownership by Household Size in Marty
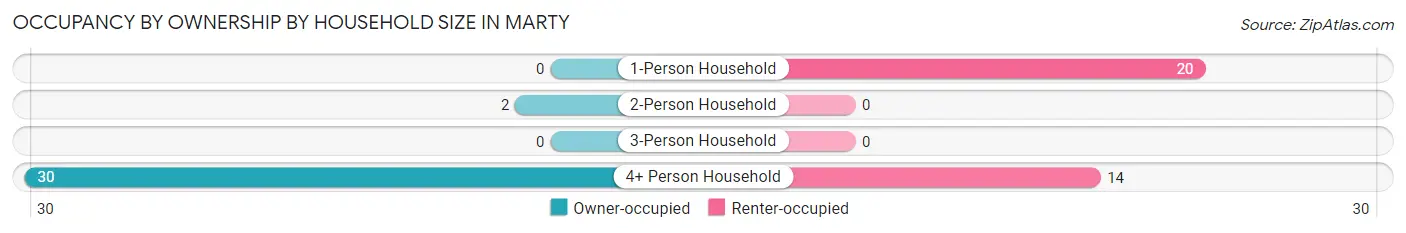
| Household Size | Owner-occupied | Renter-occupied |
| 1-Person Household | 0 (0.0%) | 20 (100.0%) |
| 2-Person Household | 2 (100.0%) | 0 (0.0%) |
| 3-Person Household | 0 (0.0%) | 0 (0.0%) |
| 4+ Person Household | 30 (68.2%) | 14 (31.8%) |
| Total Housing Units | 32 (48.5%) | 34 (51.5%) |
Occupancy by Educational Attainment in Marty
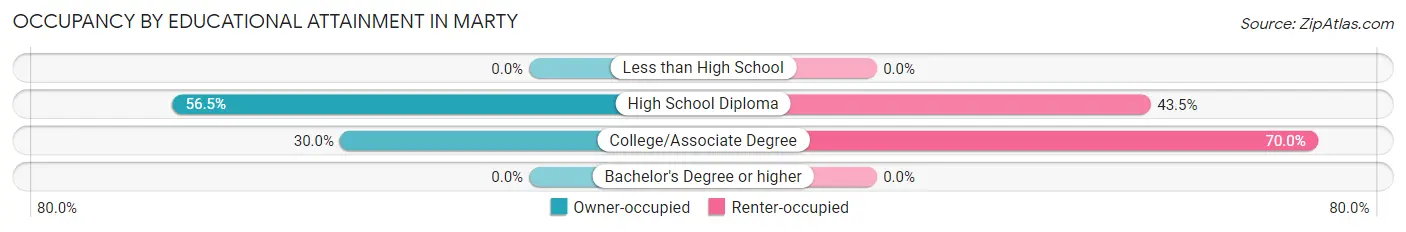
| Household Size | Owner-occupied | Renter-occupied |
| Less than High School | 0 (0.0%) | 0 (0.0%) |
| High School Diploma | 26 (56.5%) | 20 (43.5%) |
| College/Associate Degree | 6 (30.0%) | 14 (70.0%) |
| Bachelor's Degree or higher | 0 (0.0%) | 0 (0.0%) |
Occupancy by Age of Householder in Marty
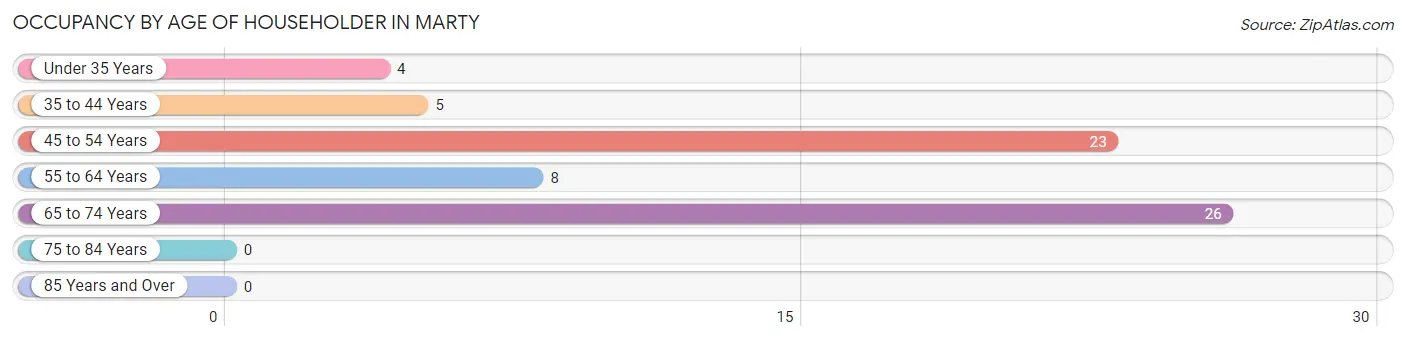
| Age Bracket | # Households | % Households |
| Under 35 Years | 4 | 6.1% |
| 35 to 44 Years | 5 | 7.6% |
| 45 to 54 Years | 23 | 34.8% |
| 55 to 64 Years | 8 | 12.1% |
| 65 to 74 Years | 26 | 39.4% |
| 75 to 84 Years | 0 | 0.0% |
| 85 Years and Over | 0 | 0.0% |
| Total | 66 | 100.0% |
Housing Finances in Marty
Median Income by Occupancy in Marty
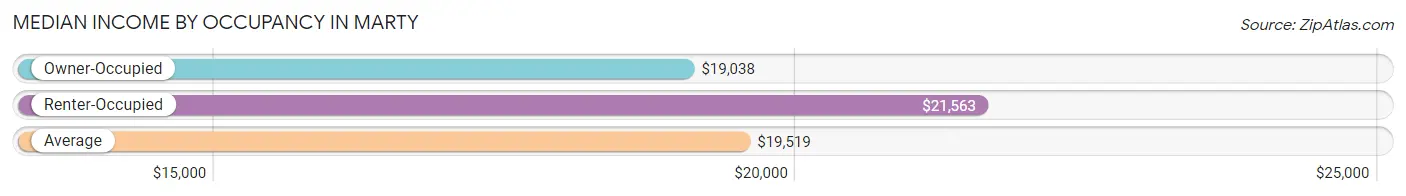
| Occupancy Type | # Households | Median Income |
| Owner-Occupied | 32 (48.5%) | $19,038 |
| Renter-Occupied | 34 (51.5%) | $21,563 |
| Average | 66 (100.0%) | $19,519 |
Occupancy by Householder Income Bracket in Marty
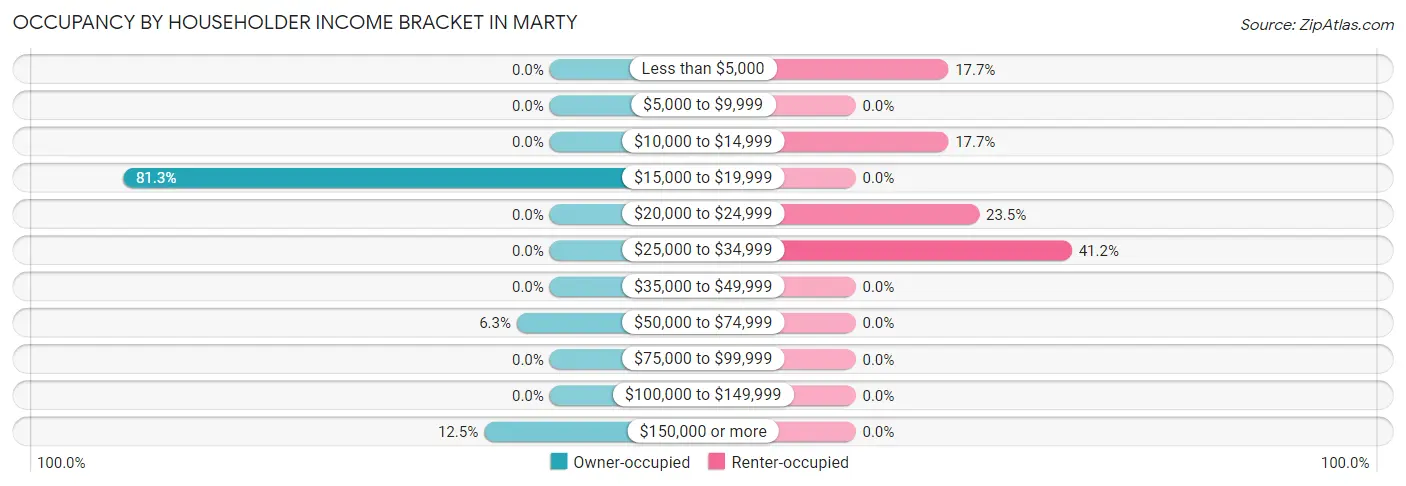
| Income Bracket | Owner-occupied | Renter-occupied |
| Less than $5,000 | 0 (0.0%) | 6 (17.6%) |
| $5,000 to $9,999 | 0 (0.0%) | 0 (0.0%) |
| $10,000 to $14,999 | 0 (0.0%) | 6 (17.6%) |
| $15,000 to $19,999 | 26 (81.2%) | 0 (0.0%) |
| $20,000 to $24,999 | 0 (0.0%) | 8 (23.5%) |
| $25,000 to $34,999 | 0 (0.0%) | 14 (41.2%) |
| $35,000 to $49,999 | 0 (0.0%) | 0 (0.0%) |
| $50,000 to $74,999 | 2 (6.2%) | 0 (0.0%) |
| $75,000 to $99,999 | 0 (0.0%) | 0 (0.0%) |
| $100,000 to $149,999 | 0 (0.0%) | 0 (0.0%) |
| $150,000 or more | 4 (12.5%) | 0 (0.0%) |
| Total | 32 (100.0%) | 34 (100.0%) |
Monthly Housing Cost Tiers in Marty
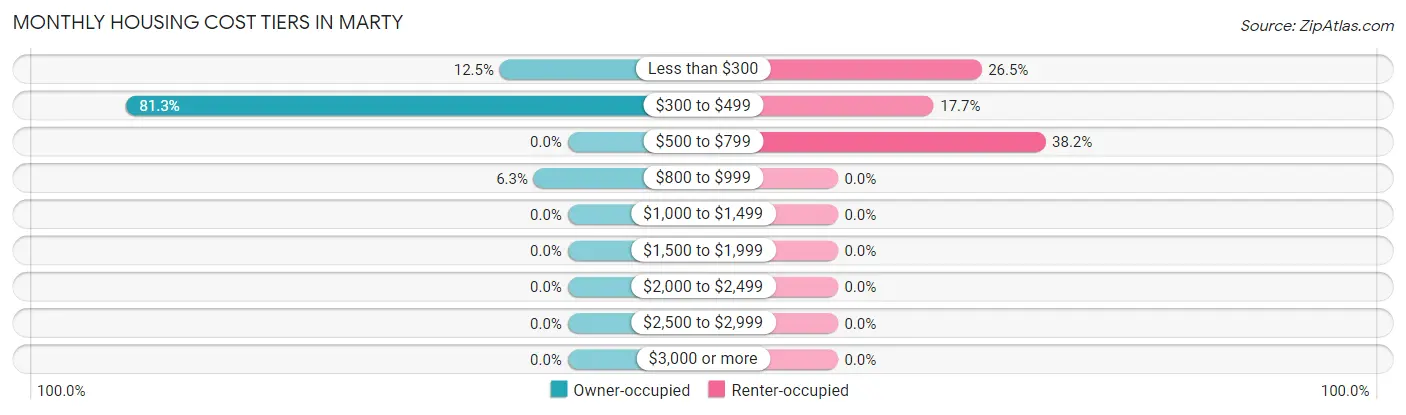
| Monthly Cost | Owner-occupied | Renter-occupied |
| Less than $300 | 4 (12.5%) | 9 (26.5%) |
| $300 to $499 | 26 (81.2%) | 6 (17.6%) |
| $500 to $799 | 0 (0.0%) | 13 (38.2%) |
| $800 to $999 | 2 (6.2%) | 0 (0.0%) |
| $1,000 to $1,499 | 0 (0.0%) | 0 (0.0%) |
| $1,500 to $1,999 | 0 (0.0%) | 0 (0.0%) |
| $2,000 to $2,499 | 0 (0.0%) | 0 (0.0%) |
| $2,500 to $2,999 | 0 (0.0%) | 0 (0.0%) |
| $3,000 or more | 0 (0.0%) | 0 (0.0%) |
| Total | 32 (100.0%) | 34 (100.0%) |
Physical Housing Characteristics in Marty
Housing Structures in Marty
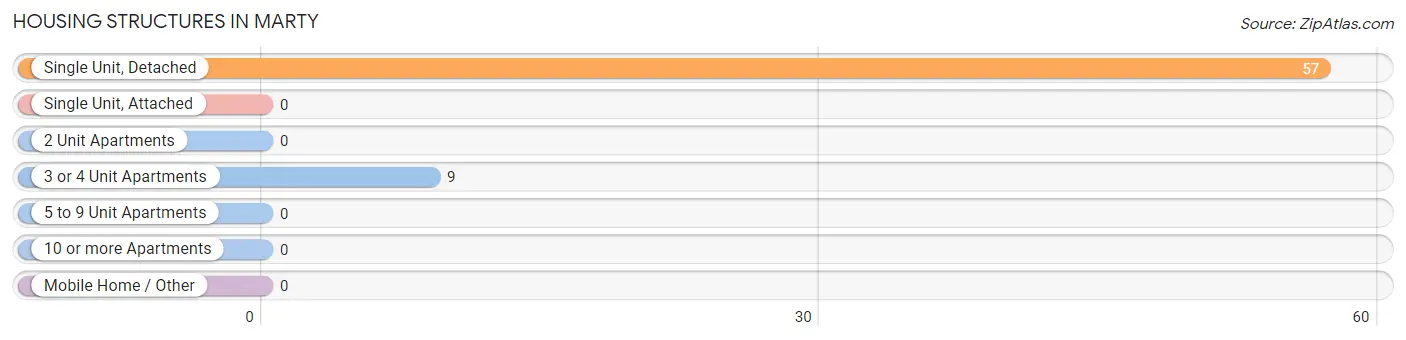
| Structure Type | # Housing Units | % Housing Units |
| Single Unit, Detached | 57 | 86.4% |
| Single Unit, Attached | 0 | 0.0% |
| 2 Unit Apartments | 0 | 0.0% |
| 3 or 4 Unit Apartments | 9 | 13.6% |
| 5 to 9 Unit Apartments | 0 | 0.0% |
| 10 or more Apartments | 0 | 0.0% |
| Mobile Home / Other | 0 | 0.0% |
| Total | 66 | 100.0% |
Housing Structures by Occupancy in Marty
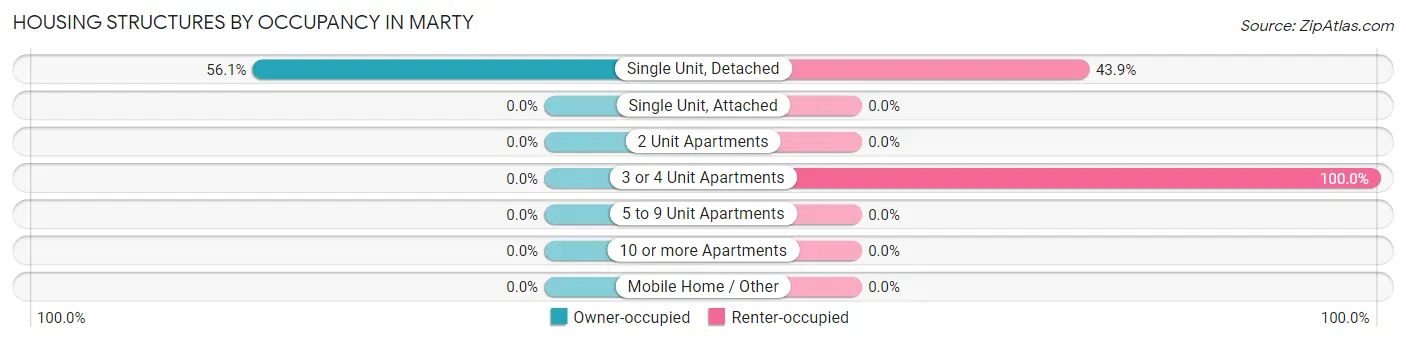
| Structure Type | Owner-occupied | Renter-occupied |
| Single Unit, Detached | 32 (56.1%) | 25 (43.9%) |
| Single Unit, Attached | 0 (0.0%) | 0 (0.0%) |
| 2 Unit Apartments | 0 (0.0%) | 0 (0.0%) |
| 3 or 4 Unit Apartments | 0 (0.0%) | 9 (100.0%) |
| 5 to 9 Unit Apartments | 0 (0.0%) | 0 (0.0%) |
| 10 or more Apartments | 0 (0.0%) | 0 (0.0%) |
| Mobile Home / Other | 0 (0.0%) | 0 (0.0%) |
| Total | 32 (48.5%) | 34 (51.5%) |
Housing Structures by Number of Rooms in Marty
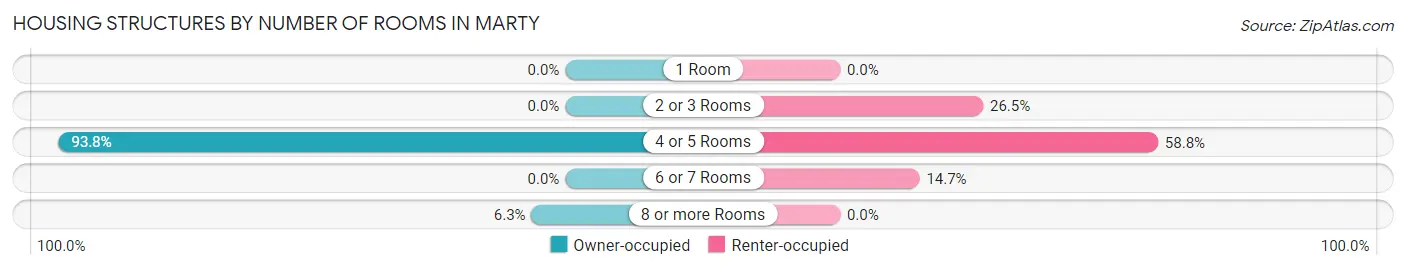
| Number of Rooms | Owner-occupied | Renter-occupied |
| 1 Room | 0 (0.0%) | 0 (0.0%) |
| 2 or 3 Rooms | 0 (0.0%) | 9 (26.5%) |
| 4 or 5 Rooms | 30 (93.8%) | 20 (58.8%) |
| 6 or 7 Rooms | 0 (0.0%) | 5 (14.7%) |
| 8 or more Rooms | 2 (6.2%) | 0 (0.0%) |
| Total | 32 (100.0%) | 34 (100.0%) |
Housing Structure by Heating Type in Marty
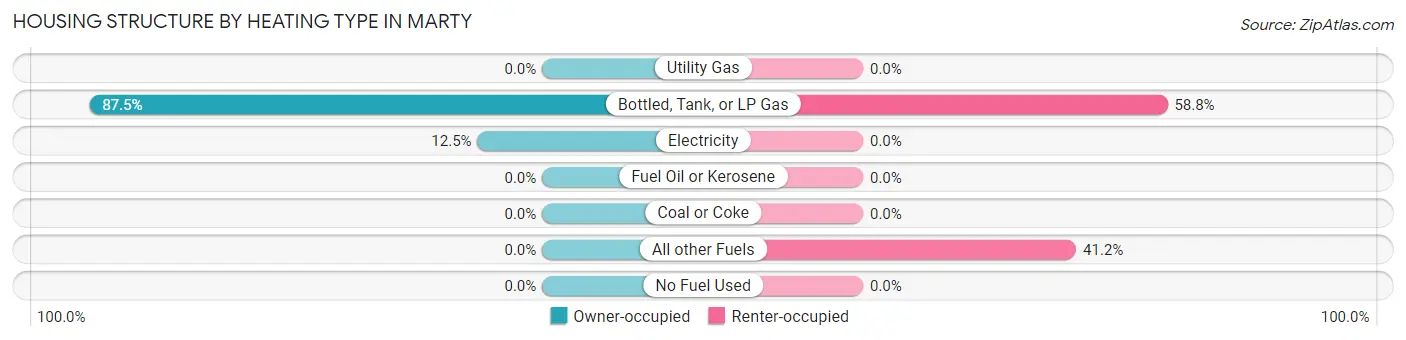
| Heating Type | Owner-occupied | Renter-occupied |
| Utility Gas | 0 (0.0%) | 0 (0.0%) |
| Bottled, Tank, or LP Gas | 28 (87.5%) | 20 (58.8%) |
| Electricity | 4 (12.5%) | 0 (0.0%) |
| Fuel Oil or Kerosene | 0 (0.0%) | 0 (0.0%) |
| Coal or Coke | 0 (0.0%) | 0 (0.0%) |
| All other Fuels | 0 (0.0%) | 14 (41.2%) |
| No Fuel Used | 0 (0.0%) | 0 (0.0%) |
| Total | 32 (100.0%) | 34 (100.0%) |
Household Vehicle Usage in Marty
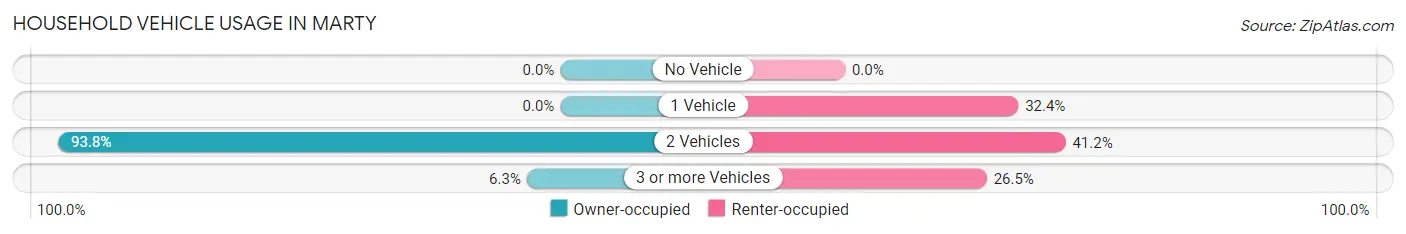
| Vehicles per Household | Owner-occupied | Renter-occupied |
| No Vehicle | 0 (0.0%) | 0 (0.0%) |
| 1 Vehicle | 0 (0.0%) | 11 (32.4%) |
| 2 Vehicles | 30 (93.8%) | 14 (41.2%) |
| 3 or more Vehicles | 2 (6.2%) | 9 (26.5%) |
| Total | 32 (100.0%) | 34 (100.0%) |
Real Estate & Mortgages in Marty
Real Estate and Mortgage Overview in Marty
| Characteristic | Without Mortgage | With Mortgage |
| Housing Units | 32 | 0 |
| Median Property Value | $23,100 | $0 |
| Median Household Income | $19,038 | $0 |
| Monthly Housing Costs | $446 | $0 |
| Real Estate Taxes | - | - |
Property Value by Mortgage Status in Marty
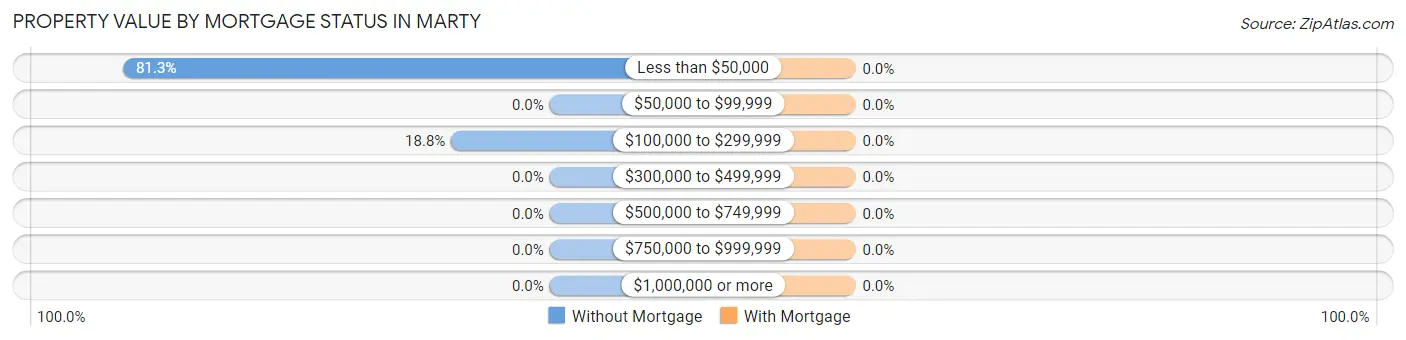
| Property Value | Without Mortgage | With Mortgage |
| Less than $50,000 | 26 (81.2%) | 0 (0.0%) |
| $50,000 to $99,999 | 0 (0.0%) | 0 (0.0%) |
| $100,000 to $299,999 | 6 (18.8%) | 0 (0.0%) |
| $300,000 to $499,999 | 0 (0.0%) | 0 (0.0%) |
| $500,000 to $749,999 | 0 (0.0%) | 0 (0.0%) |
| $750,000 to $999,999 | 0 (0.0%) | 0 (0.0%) |
| $1,000,000 or more | 0 (0.0%) | 0 (0.0%) |
| Total | 32 (100.0%) | 0 (0.0%) |
Household Income by Mortgage Status in Marty
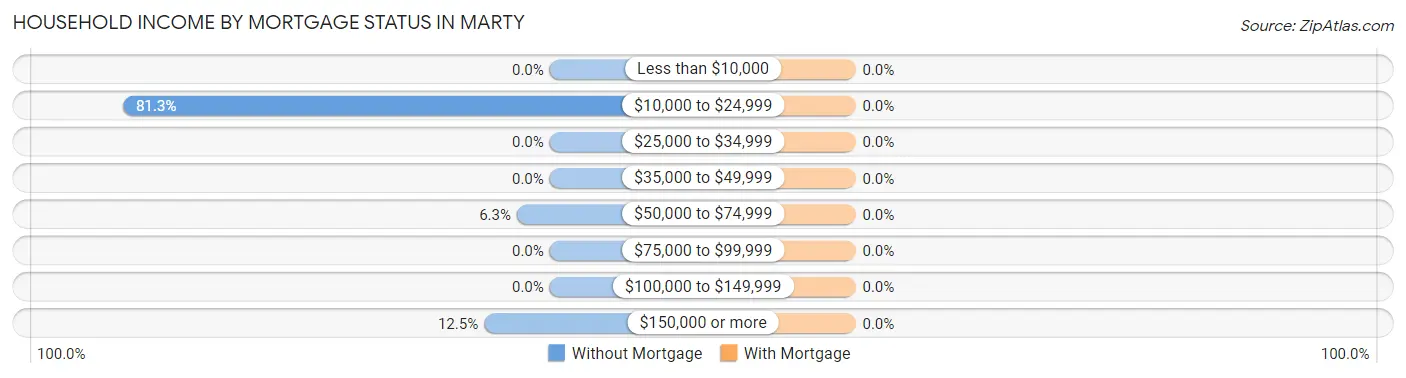
| Household Income | Without Mortgage | With Mortgage |
| Less than $10,000 | 0 (0.0%) | 0 (0.0%) |
| $10,000 to $24,999 | 26 (81.2%) | 0 (0.0%) |
| $25,000 to $34,999 | 0 (0.0%) | 0 (0.0%) |
| $35,000 to $49,999 | 0 (0.0%) | 0 (0.0%) |
| $50,000 to $74,999 | 2 (6.2%) | 0 (0.0%) |
| $75,000 to $99,999 | 0 (0.0%) | 0 (0.0%) |
| $100,000 to $149,999 | 0 (0.0%) | 0 (0.0%) |
| $150,000 or more | 4 (12.5%) | 0 (0.0%) |
| Total | 32 (100.0%) | 0 (0.0%) |
Property Value to Household Income Ratio in Marty
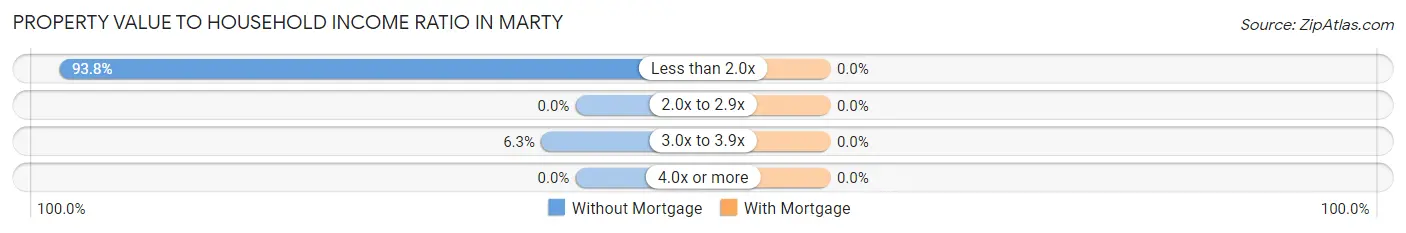
| Value-to-Income Ratio | Without Mortgage | With Mortgage |
| Less than 2.0x | 30 (93.8%) | 0 (0.0%) |
| 2.0x to 2.9x | 0 (0.0%) | 0 (0.0%) |
| 3.0x to 3.9x | 2 (6.2%) | 0 (0.0%) |
| 4.0x or more | 0 (0.0%) | 0 (0.0%) |
| Total | 32 (100.0%) | 0 (0.0%) |
Real Estate Taxes by Mortgage Status in Marty
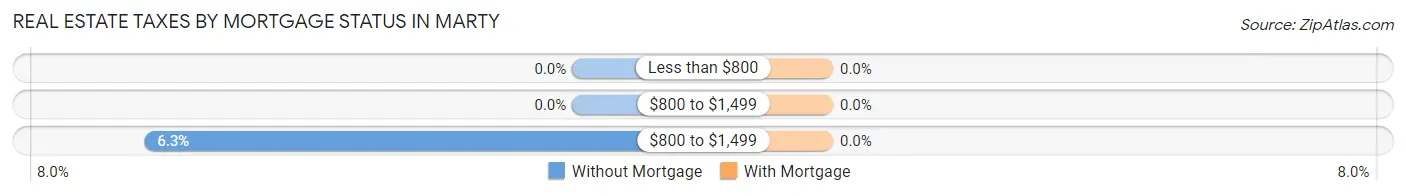
| Property Taxes | Without Mortgage | With Mortgage |
| Less than $800 | 0 (0.0%) | 0 (0.0%) |
| $800 to $1,499 | 0 (0.0%) | 0 (0.0%) |
| $800 to $1,499 | 2 (6.2%) | 0 (0.0%) |
| Total | 32 (100.0%) | 0 (0.0%) |
Health & Disability in Marty
Health Insurance Coverage by Age in Marty
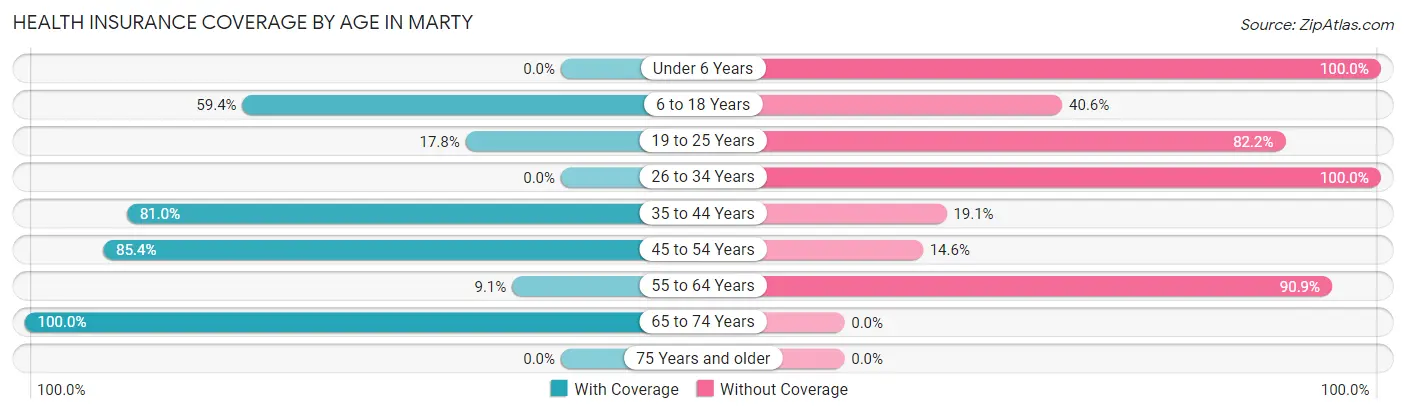
| Age Bracket | With Coverage | Without Coverage |
| Under 6 Years | 0 (0.0%) | 6 (100.0%) |
| 6 to 18 Years | 19 (59.4%) | 13 (40.6%) |
| 19 to 25 Years | 8 (17.8%) | 37 (82.2%) |
| 26 to 34 Years | 0 (0.0%) | 4 (100.0%) |
| 35 to 44 Years | 17 (80.9%) | 4 (19.1%) |
| 45 to 54 Years | 35 (85.4%) | 6 (14.6%) |
| 55 to 64 Years | 2 (9.1%) | 20 (90.9%) |
| 65 to 74 Years | 26 (100.0%) | 0 (0.0%) |
| 75 Years and older | 0 (0.0%) | 0 (0.0%) |
| Total | 107 (54.3%) | 90 (45.7%) |
Health Insurance Coverage by Citizenship Status in Marty
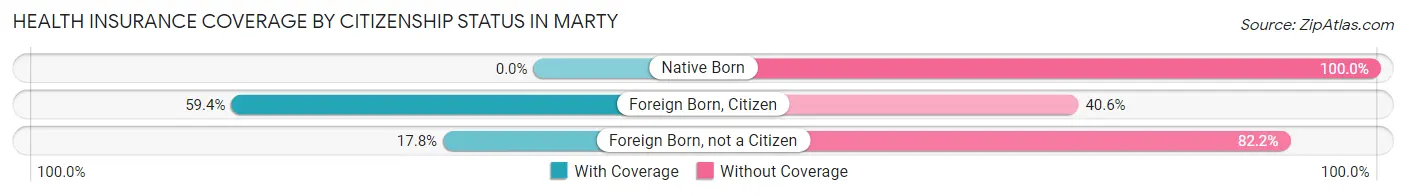
| Citizenship Status | With Coverage | Without Coverage |
| Native Born | 0 (0.0%) | 6 (100.0%) |
| Foreign Born, Citizen | 19 (59.4%) | 13 (40.6%) |
| Foreign Born, not a Citizen | 8 (17.8%) | 37 (82.2%) |
Health Insurance Coverage by Household Income in Marty
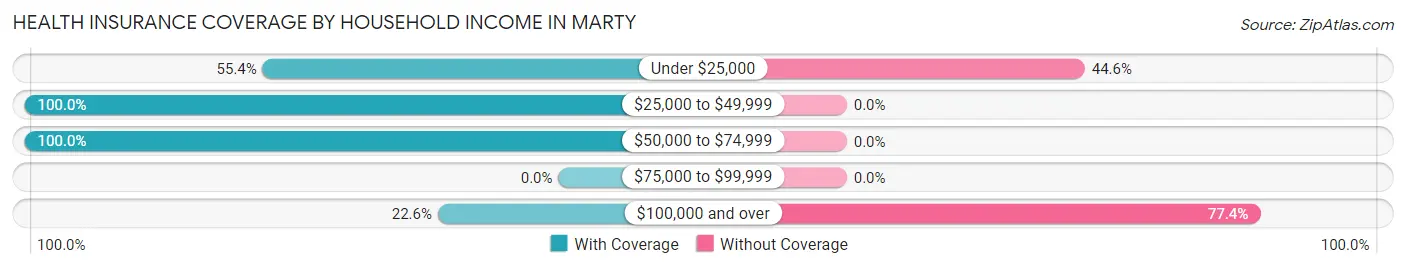
| Household Income | With Coverage | Without Coverage |
| Under $25,000 | 82 (55.4%) | 66 (44.6%) |
| $25,000 to $49,999 | 14 (100.0%) | 0 (0.0%) |
| $50,000 to $74,999 | 4 (100.0%) | 0 (0.0%) |
| $75,000 to $99,999 | 0 (0.0%) | 0 (0.0%) |
| $100,000 and over | 7 (22.6%) | 24 (77.4%) |
Public vs Private Health Insurance Coverage by Age in Marty
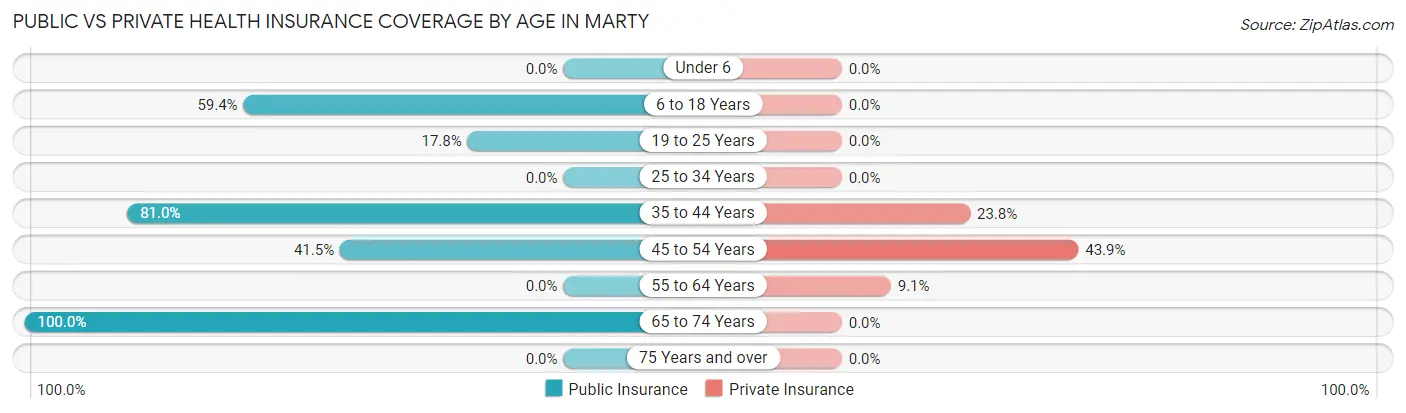
| Age Bracket | Public Insurance | Private Insurance |
| Under 6 | 0 (0.0%) | 0 (0.0%) |
| 6 to 18 Years | 19 (59.4%) | 0 (0.0%) |
| 19 to 25 Years | 8 (17.8%) | 0 (0.0%) |
| 25 to 34 Years | 0 (0.0%) | 0 (0.0%) |
| 35 to 44 Years | 17 (80.9%) | 5 (23.8%) |
| 45 to 54 Years | 17 (41.5%) | 18 (43.9%) |
| 55 to 64 Years | 0 (0.0%) | 2 (9.1%) |
| 65 to 74 Years | 26 (100.0%) | 0 (0.0%) |
| 75 Years and over | 0 (0.0%) | 0 (0.0%) |
| Total | 87 (44.2%) | 25 (12.7%) |
Disability Status by Sex by Age in Marty
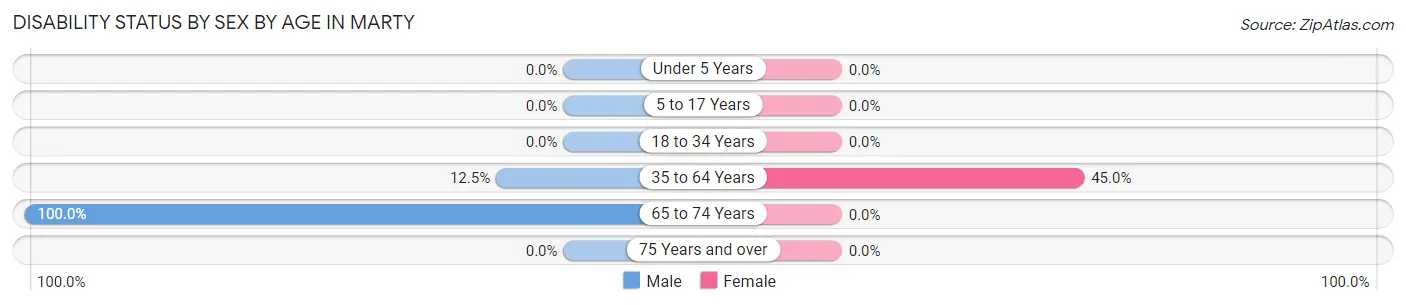
| Age Bracket | Male | Female |
| Under 5 Years | 0 (0.0%) | 0 (0.0%) |
| 5 to 17 Years | 0 (0.0%) | 0 (0.0%) |
| 18 to 34 Years | 0 (0.0%) | 0 (0.0%) |
| 35 to 64 Years | 8 (12.5%) | 9 (45.0%) |
| 65 to 74 Years | 26 (100.0%) | 0 (0.0%) |
| 75 Years and over | 0 (0.0%) | 0 (0.0%) |
Disability Class by Sex by Age in Marty
Disability Class: Hearing Difficulty
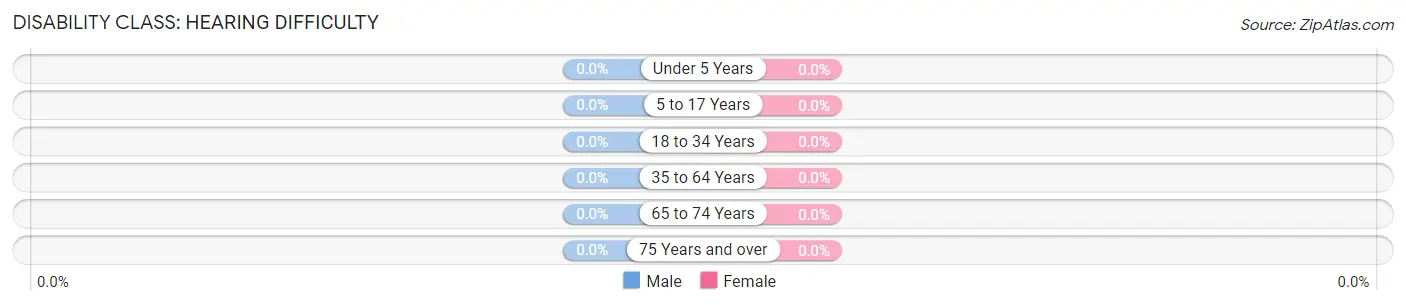
| Age Bracket | Male | Female |
| Under 5 Years | 0 (0.0%) | 0 (0.0%) |
| 5 to 17 Years | 0 (0.0%) | 0 (0.0%) |
| 18 to 34 Years | 0 (0.0%) | 0 (0.0%) |
| 35 to 64 Years | 0 (0.0%) | 0 (0.0%) |
| 65 to 74 Years | 0 (0.0%) | 0 (0.0%) |
| 75 Years and over | 0 (0.0%) | 0 (0.0%) |
Disability Class: Vision Difficulty
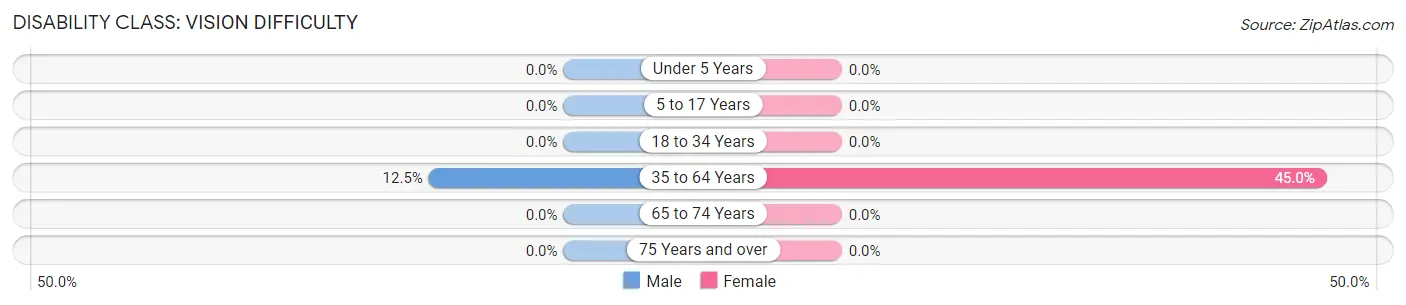
| Age Bracket | Male | Female |
| Under 5 Years | 0 (0.0%) | 0 (0.0%) |
| 5 to 17 Years | 0 (0.0%) | 0 (0.0%) |
| 18 to 34 Years | 0 (0.0%) | 0 (0.0%) |
| 35 to 64 Years | 8 (12.5%) | 9 (45.0%) |
| 65 to 74 Years | 0 (0.0%) | 0 (0.0%) |
| 75 Years and over | 0 (0.0%) | 0 (0.0%) |
Disability Class: Cognitive Difficulty
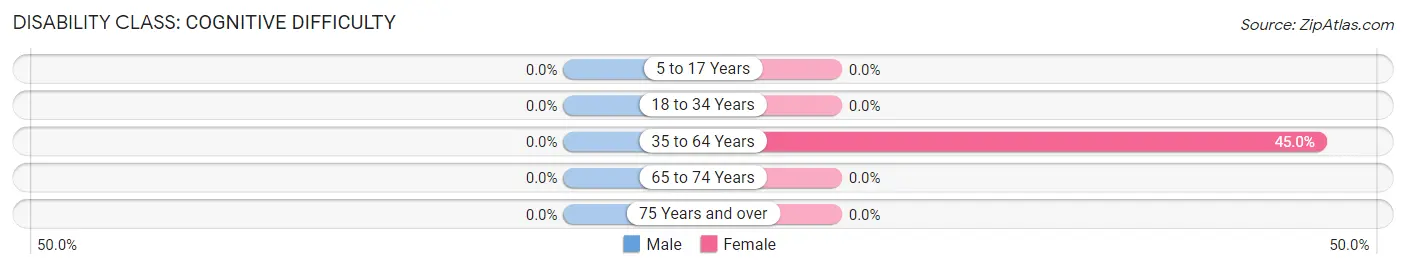
| Age Bracket | Male | Female |
| 5 to 17 Years | 0 (0.0%) | 0 (0.0%) |
| 18 to 34 Years | 0 (0.0%) | 0 (0.0%) |
| 35 to 64 Years | 0 (0.0%) | 9 (45.0%) |
| 65 to 74 Years | 0 (0.0%) | 0 (0.0%) |
| 75 Years and over | 0 (0.0%) | 0 (0.0%) |
Disability Class: Ambulatory Difficulty
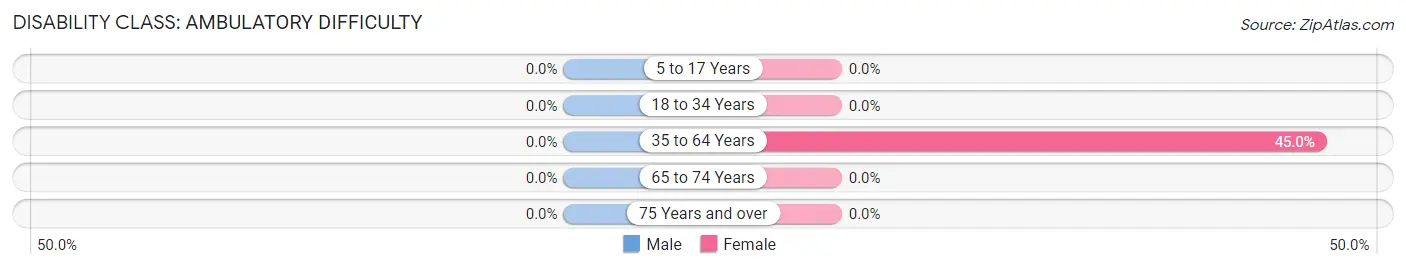
| Age Bracket | Male | Female |
| 5 to 17 Years | 0 (0.0%) | 0 (0.0%) |
| 18 to 34 Years | 0 (0.0%) | 0 (0.0%) |
| 35 to 64 Years | 0 (0.0%) | 9 (45.0%) |
| 65 to 74 Years | 0 (0.0%) | 0 (0.0%) |
| 75 Years and over | 0 (0.0%) | 0 (0.0%) |
Disability Class: Self-Care Difficulty
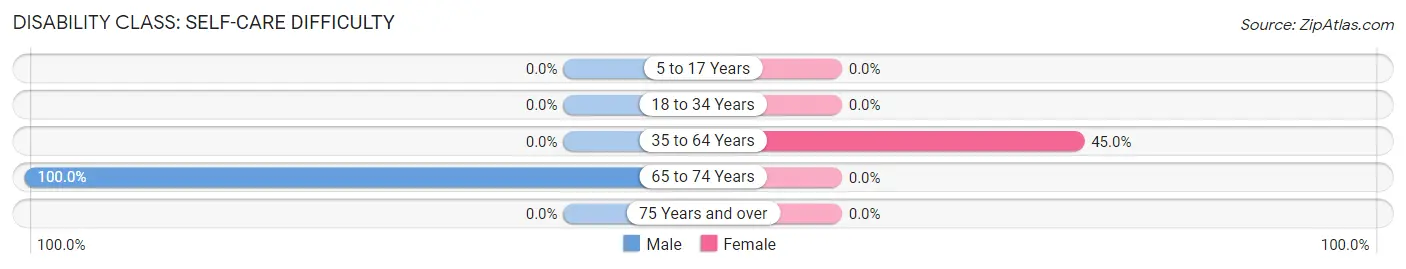
| Age Bracket | Male | Female |
| 5 to 17 Years | 0 (0.0%) | 0 (0.0%) |
| 18 to 34 Years | 0 (0.0%) | 0 (0.0%) |
| 35 to 64 Years | 0 (0.0%) | 9 (45.0%) |
| 65 to 74 Years | 26 (100.0%) | 0 (0.0%) |
| 75 Years and over | 0 (0.0%) | 0 (0.0%) |
Technology Access in Marty
Computing Device Access in Marty
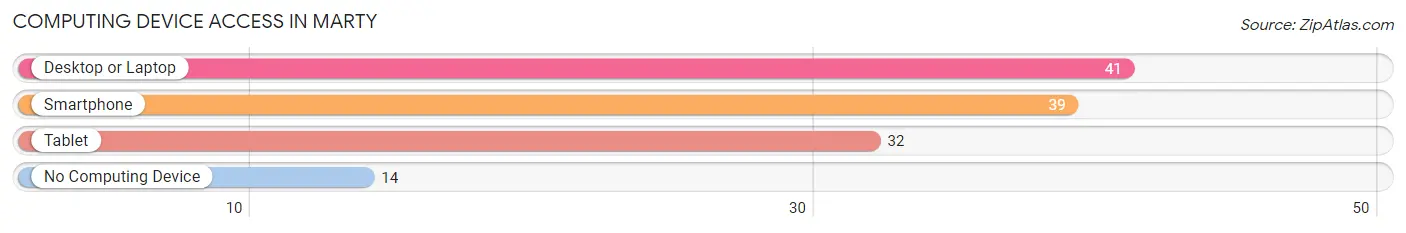
| Device Type | # Households | % Households |
| Desktop or Laptop | 41 | 62.1% |
| Smartphone | 39 | 59.1% |
| Tablet | 32 | 48.5% |
| No Computing Device | 14 | 21.2% |
| Total | 66 | 100.0% |
Internet Access in Marty
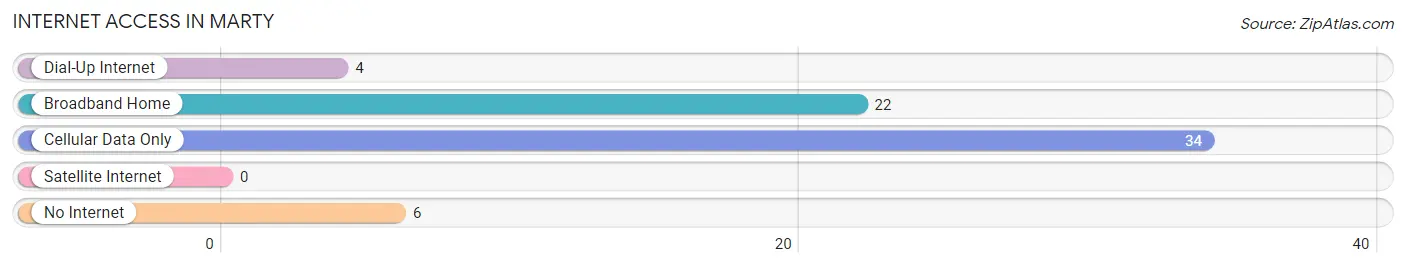
| Internet Type | # Households | % Households |
| Dial-Up Internet | 4 | 6.1% |
| Broadband Home | 22 | 33.3% |
| Cellular Data Only | 34 | 51.5% |
| Satellite Internet | 0 | 0.0% |
| No Internet | 6 | 9.1% |
| Total | 66 | 100.0% |
Marty Summary
South Dakota is a state located in the Midwestern region of the United States. It is bordered by North Dakota to the north, Minnesota to the east, Iowa to the southeast, Nebraska to the south, Wyoming to the west, and Montana to the northwest. South Dakota is the seventeenth largest state in the United States, with an area of 77,116 square miles (199,730 km2). As of 2020, the population of South Dakota was estimated to be 884,659, making it the fifth least populous state in the country.
History
The area that is now South Dakota has been inhabited by various Native American tribes for thousands of years. The first Europeans to explore the area were French fur traders, who arrived in the late 17th century. In the early 19th century, the area was part of the Louisiana Purchase, and was later organized as part of the Dakota Territory in 1861. In 1889, South Dakota became the 40th state to join the Union.
Geography
South Dakota is located in the Midwestern region of the United States. It is bordered by North Dakota to the north, Minnesota to the east, Iowa to the southeast, Nebraska to the south, Wyoming to the west, and Montana to the northwest. South Dakota is the seventeenth largest state in the United States, with an area of 77,116 square miles (199,730 km2).
The geography of South Dakota is diverse, ranging from the Great Plains in the east to the Black Hills in the west. The Missouri River forms the eastern border of the state, while the Big Sioux River forms the western border. The state is home to several national parks, including Badlands National Park, Wind Cave National Park, and Jewel Cave National Monument.
Economy
The economy of South Dakota is largely based on agriculture, tourism, and manufacturing. The state is a major producer of corn, soybeans, wheat, and other grains. It is also a major producer of beef, pork, and dairy products. Tourism is a major industry in South Dakota, with the state’s many national parks and monuments attracting millions of visitors each year. Manufacturing is also an important part of the state’s economy, with the production of food products, machinery, and chemicals being the most significant.
Demographics
As of 2020, the population of South Dakota was estimated to be 884,659, making it the fifth least populous state in the country. The population is largely concentrated in the eastern part of the state, with the largest cities being Sioux Falls, Rapid City, and Aberdeen. The population is predominantly white (84.3%), with the remaining population being made up of Native Americans (8.7%), African Americans (2.2%), and other races (4.8%). The median household income in South Dakota is $54,919, and the median age is 38.7 years. The state’s unemployment rate is 3.2%.
Common Questions
What is Per Capita Income in Marty?
Per Capita income in Marty is $11,536.
What is the Median Family Income in Marty?
Median Family Income in Marty is $19,135.
What is the Median Household income in Marty?
Median Household Income in Marty is $19,519.
What is Inequality or Gini Index in Marty?
Inequality or Gini Index in Marty is 0.44.
What is the Total Population of Marty?
Total Population of Marty is 197.
What is the Total Male Population of Marty?
Total Male Population of Marty is 150.
What is the Total Female Population of Marty?
Total Female Population of Marty is 47.
What is the Ratio of Males per 100 Females in Marty?
There are 319.15 Males per 100 Females in Marty.
What is the Ratio of Females per 100 Males in Marty?
There are 31.33 Females per 100 Males in Marty.
What is the Median Population Age in Marty?
Median Population Age in Marty is 44.4 Years.
What is the Average Family Size in Marty
Average Family Size in Marty is 3.6 People.
What is the Average Household Size in Marty
Average Household Size in Marty is 3.0 People.
How Large is the Labor Force in Marty?
There are 64 People in the Labor Forcein in Marty.
What is the Percentage of People in the Labor Force in Marty?
39.3% of People are in the Labor Force in Marty.
What is the Unemployment Rate in Marty?
Unemployment Rate in Marty is 54.7%.