Green Valley, SD Map & Demographics
Green Valley Map
Green Valley Overview
$29,105
PER CAPITA INCOME
$89,830
AVG FAMILY INCOME
$87,955
AVG HOUSEHOLD INCOME
57.3%
WAGE / INCOME GAP [ % ]
42.7¢/ $1
WAGE / INCOME GAP [ $ ]
0.32
INEQUALITY / GINI INDEX
1,353
TOTAL POPULATION
621
MALE POPULATION
732
FEMALE POPULATION
84.84
MALES / 100 FEMALES
117.87
FEMALES / 100 MALES
35.0
MEDIAN AGE
3.2
AVG FAMILY SIZE
2.9
AVG HOUSEHOLD SIZE
765
LABOR FORCE [ PEOPLE ]
80.4%
PERCENT IN LABOR FORCE
Income in Green Valley
Income Overview in Green Valley
Per Capita Income in Green Valley is $29,105, while median incomes of families and households are $89,830 and $87,955 respectively.
| Characteristic | Number | Measure |
| Per Capita Income | 1,353 | $29,105 |
| Median Family Income | 349 | $89,830 |
| Mean Family Income | 349 | $91,095 |
| Median Household Income | 460 | $87,955 |
| Mean Household Income | 460 | $81,823 |
| Income Deficit | 349 | $0 |
| Wage / Income Gap (%) | 1,353 | 57.30% |
| Wage / Income Gap ($) | 1,353 | 42.70¢ per $1 |
| Gini / Inequality Index | 1,353 | 0.32 |
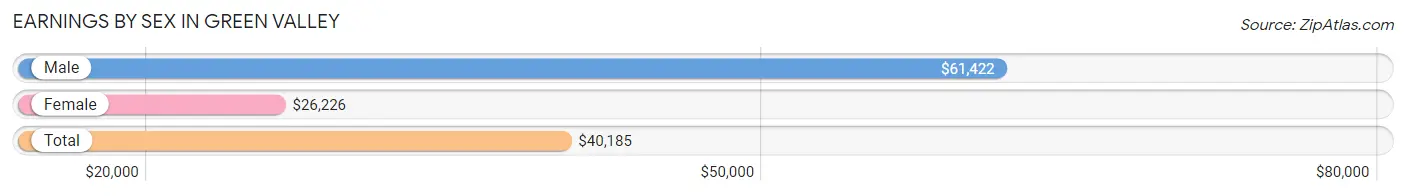
Earnings by Sex in Green Valley
Average Earnings in Green Valley are $40,185, $61,422 for men and $26,226 for women, a difference of 57.3%.
| Sex | Number | Average Earnings |
| Male | 356 (43.7%) | $61,422 |
| Female | 458 (56.3%) | $26,226 |
| Total | 814 (100.0%) | $40,185 |
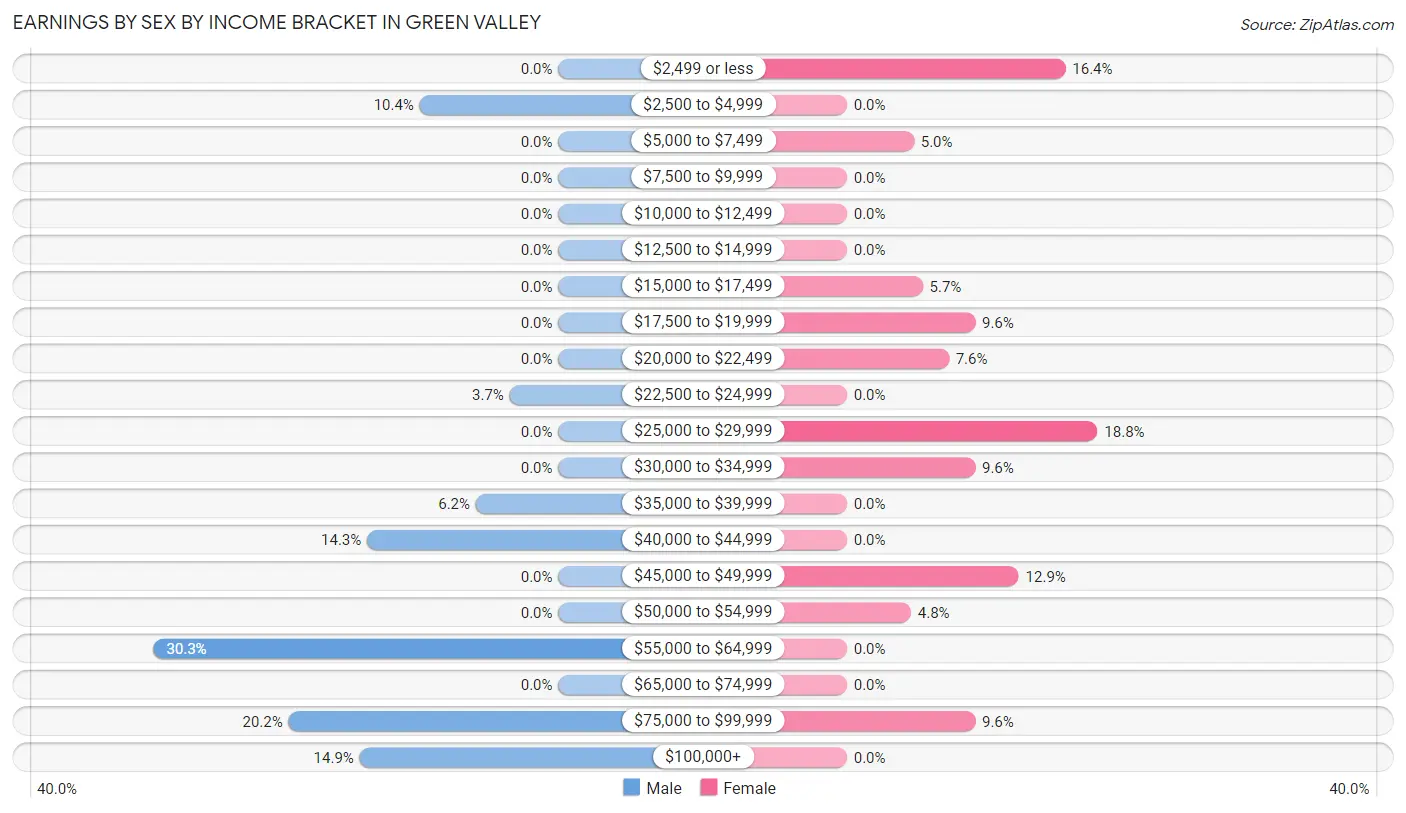
Earnings by Sex by Income Bracket in Green Valley
The most common earnings brackets in Green Valley are $55,000 to $64,999 for men (108 | 30.3%) and $25,000 to $29,999 for women (86 | 18.8%).
| Income | Male | Female |
| $2,499 or less | 0 (0.0%) | 75 (16.4%) |
| $2,500 to $4,999 | 37 (10.4%) | 0 (0.0%) |
| $5,000 to $7,499 | 0 (0.0%) | 23 (5.0%) |
| $7,500 to $9,999 | 0 (0.0%) | 0 (0.0%) |
| $10,000 to $12,499 | 0 (0.0%) | 0 (0.0%) |
| $12,500 to $14,999 | 0 (0.0%) | 0 (0.0%) |
| $15,000 to $17,499 | 0 (0.0%) | 26 (5.7%) |
| $17,500 to $19,999 | 0 (0.0%) | 44 (9.6%) |
| $20,000 to $22,499 | 0 (0.0%) | 35 (7.6%) |
| $22,500 to $24,999 | 13 (3.6%) | 0 (0.0%) |
| $25,000 to $29,999 | 0 (0.0%) | 86 (18.8%) |
| $30,000 to $34,999 | 0 (0.0%) | 44 (9.6%) |
| $35,000 to $39,999 | 22 (6.2%) | 0 (0.0%) |
| $40,000 to $44,999 | 51 (14.3%) | 0 (0.0%) |
| $45,000 to $49,999 | 0 (0.0%) | 59 (12.9%) |
| $50,000 to $54,999 | 0 (0.0%) | 22 (4.8%) |
| $55,000 to $64,999 | 108 (30.3%) | 0 (0.0%) |
| $65,000 to $74,999 | 0 (0.0%) | 0 (0.0%) |
| $75,000 to $99,999 | 72 (20.2%) | 44 (9.6%) |
| $100,000+ | 53 (14.9%) | 0 (0.0%) |
| Total | 356 (100.0%) | 458 (100.0%) |
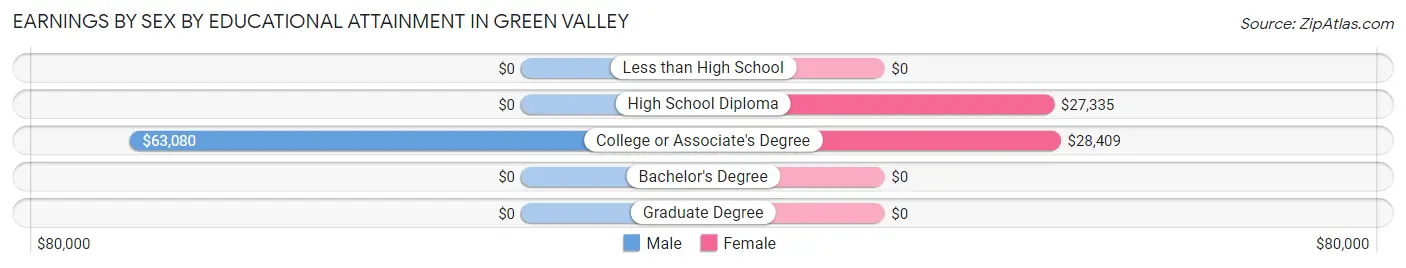
Earnings by Sex by Educational Attainment in Green Valley
Average earnings in Green Valley are $62,220 for men and $27,841 for women, a difference of 55.2%. Men with an educational attainment of college or associate's degree enjoy the highest average annual earnings of $63,080, while those with college or associate's degree education earn the least with $63,080. Women with an educational attainment of college or associate's degree earn the most with the average annual earnings of $28,409, while those with high school diploma education have the smallest earnings of $27,335.
| Educational Attainment | Male Income | Female Income |
| Less than High School | - | - |
| High School Diploma | - | - |
| College or Associate's Degree | $63,080 | $28,409 |
| Bachelor's Degree | - | - |
| Graduate Degree | - | - |
| Total | $62,220 | $27,841 |
Family Income in Green Valley
Family Income Brackets in Green Valley
According to the Green Valley family income data, there are 137 families falling into the $75,000 to $99,999 income range, which is the most common income bracket and makes up 39.3% of all families.
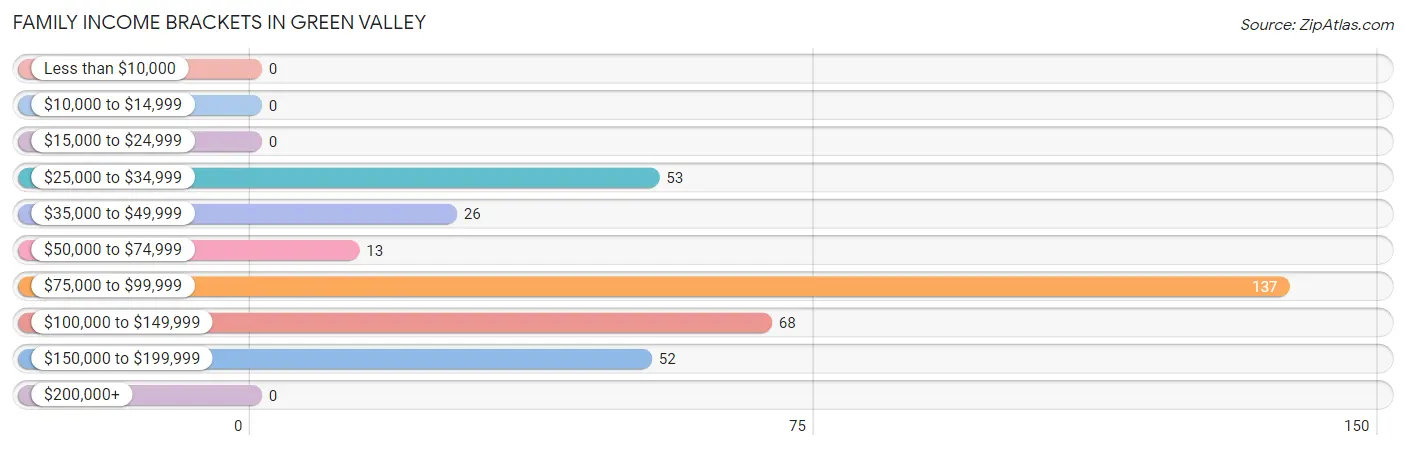
| Income Bracket | # Families | % Families |
| Less than $10,000 | 0 | 0.0% |
| $10,000 to $14,999 | 0 | 0.0% |
| $15,000 to $24,999 | 0 | 0.0% |
| $25,000 to $34,999 | 53 | 15.2% |
| $35,000 to $49,999 | 26 | 7.4% |
| $50,000 to $74,999 | 13 | 3.7% |
| $75,000 to $99,999 | 137 | 39.3% |
| $100,000 to $149,999 | 68 | 19.5% |
| $150,000 to $199,999 | 52 | 14.9% |
| $200,000+ | 0 | 0.0% |
Family Income by Famaliy Size in Green Valley
3-person families (50 | 14.3%) account for the highest median family income in Green Valley with $150,385 per family, while 3-person families (50 | 14.3%) have the highest median income of $50,128 per family member.
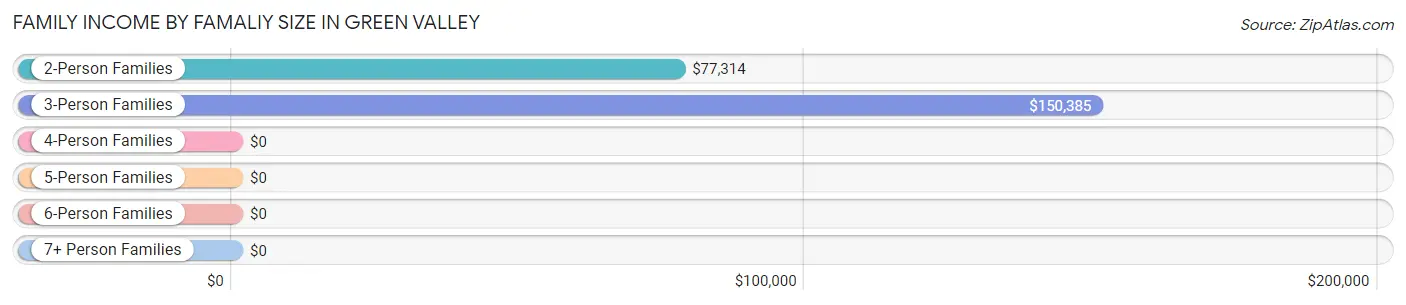
| Income Bracket | # Families | Median Income |
| 2-Person Families | 165 (47.3%) | $77,314 |
| 3-Person Families | 50 (14.3%) | $150,385 |
| 4-Person Families | 44 (12.6%) | $0 |
| 5-Person Families | 75 (21.5%) | $0 |
| 6-Person Families | 15 (4.3%) | $0 |
| 7+ Person Families | 0 (0.0%) | $0 |
| Total | 349 (100.0%) | $89,830 |
Family Income by Number of Earners in Green Valley
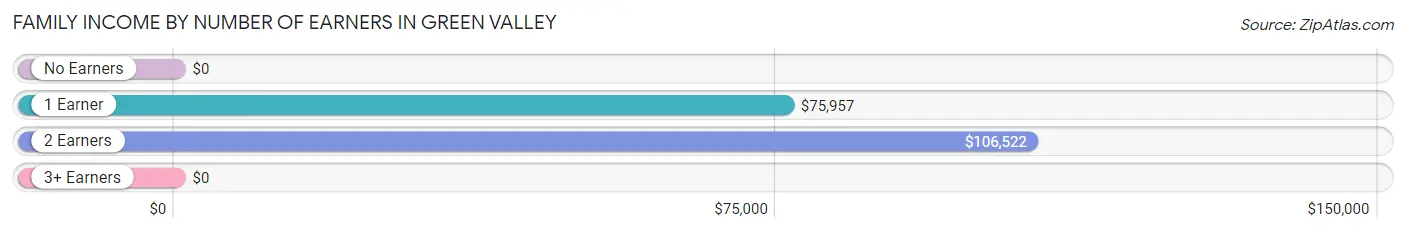
| Number of Earners | # Families | Median Income |
| No Earners | 9 (2.6%) | $0 |
| 1 Earner | 88 (25.2%) | $75,957 |
| 2 Earners | 186 (53.3%) | $106,522 |
| 3+ Earners | 66 (18.9%) | $0 |
| Total | 349 (100.0%) | $89,830 |
Household Income in Green Valley
Household Income Brackets in Green Valley
With 122 households falling in the category, the $75,000 to $99,999 income range is the most frequent in Green Valley, accounting for 26.5% of all households.
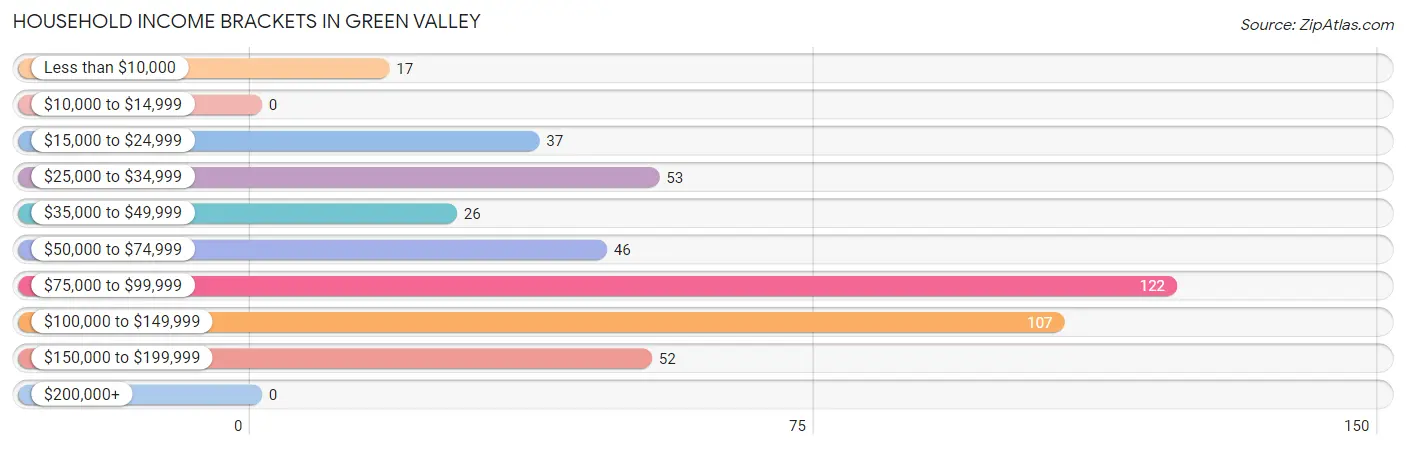
| Income Bracket | # Households | % Households |
| Less than $10,000 | 17 | 3.7% |
| $10,000 to $14,999 | 0 | 0.0% |
| $15,000 to $24,999 | 37 | 8.0% |
| $25,000 to $34,999 | 53 | 11.5% |
| $35,000 to $49,999 | 26 | 5.7% |
| $50,000 to $74,999 | 46 | 10.0% |
| $75,000 to $99,999 | 122 | 26.5% |
| $100,000 to $149,999 | 107 | 23.3% |
| $150,000 to $199,999 | 52 | 11.3% |
| $200,000+ | 0 | 0.0% |
Household Income by Householder Age in Green Valley
The median household income in Green Valley is $87,955, with the highest median household income of $98,011 found in the 25 to 44 years age bracket for the primary householder. A total of 203 households (44.1%) fall into this category. Meanwhile, the 15 to 24 years age bracket for the primary householder has the lowest median household income of $0, with 26 households (5.7%) in this group.
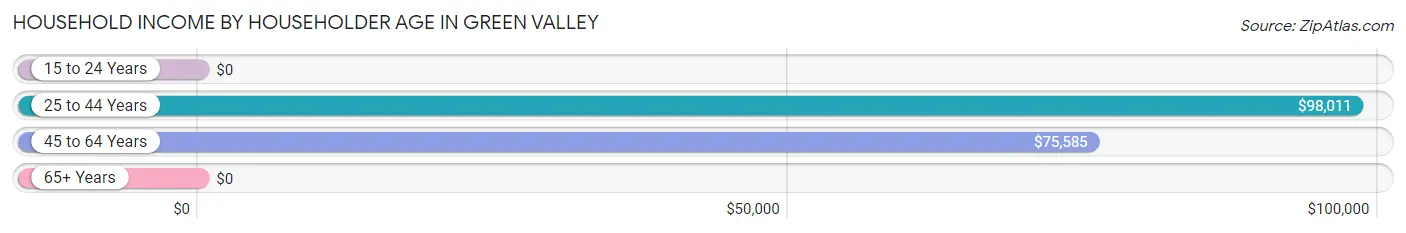
| Income Bracket | # Households | Median Income |
| 15 to 24 Years | 26 (5.7%) | $0 |
| 25 to 44 Years | 203 (44.1%) | $98,011 |
| 45 to 64 Years | 166 (36.1%) | $75,585 |
| 65+ Years | 65 (14.1%) | $0 |
| Total | 460 (100.0%) | $87,955 |
Poverty in Green Valley
Income Below Poverty by Sex and Age in Green Valley
With 21.6% poverty level for males and 16.8% for females among the residents of Green Valley, 5 year old males and 15 year old females are the most vulnerable to poverty, with 62 males (100.0%) and 12 females (100.0%) in their respective age groups living below the poverty level.
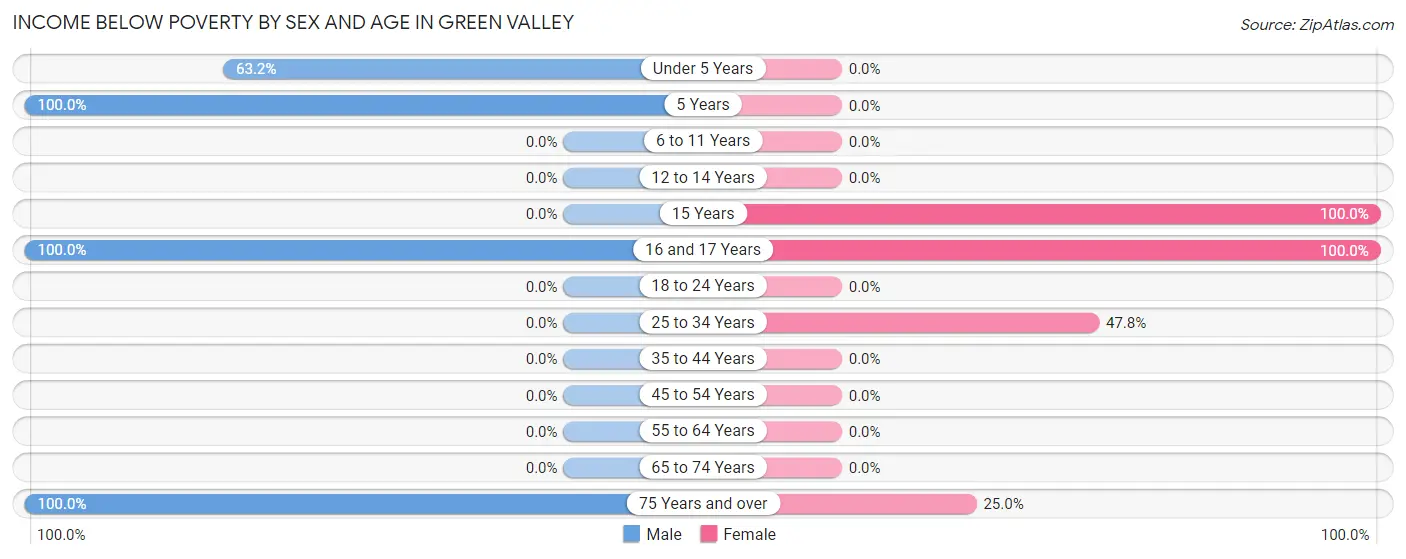
| Age Bracket | Male | Female |
| Under 5 Years | 24 (63.2%) | 0 (0.0%) |
| 5 Years | 62 (100.0%) | 0 (0.0%) |
| 6 to 11 Years | 0 (0.0%) | 0 (0.0%) |
| 12 to 14 Years | 0 (0.0%) | 0 (0.0%) |
| 15 Years | 0 (0.0%) | 12 (100.0%) |
| 16 and 17 Years | 37 (100.0%) | 37 (100.0%) |
| 18 to 24 Years | 0 (0.0%) | 0 (0.0%) |
| 25 to 34 Years | 0 (0.0%) | 53 (47.7%) |
| 35 to 44 Years | 0 (0.0%) | 0 (0.0%) |
| 45 to 54 Years | 0 (0.0%) | 0 (0.0%) |
| 55 to 64 Years | 0 (0.0%) | 0 (0.0%) |
| 65 to 74 Years | 0 (0.0%) | 0 (0.0%) |
| 75 Years and over | 11 (100.0%) | 17 (25.0%) |
| Total | 134 (21.6%) | 119 (16.8%) |
Income Above Poverty by Sex and Age in Green Valley
According to the poverty statistics in Green Valley, males aged 6 to 11 years and females aged under 5 years are the age groups that are most secure financially, with 100.0% of males and 100.0% of females in these age groups living above the poverty line.
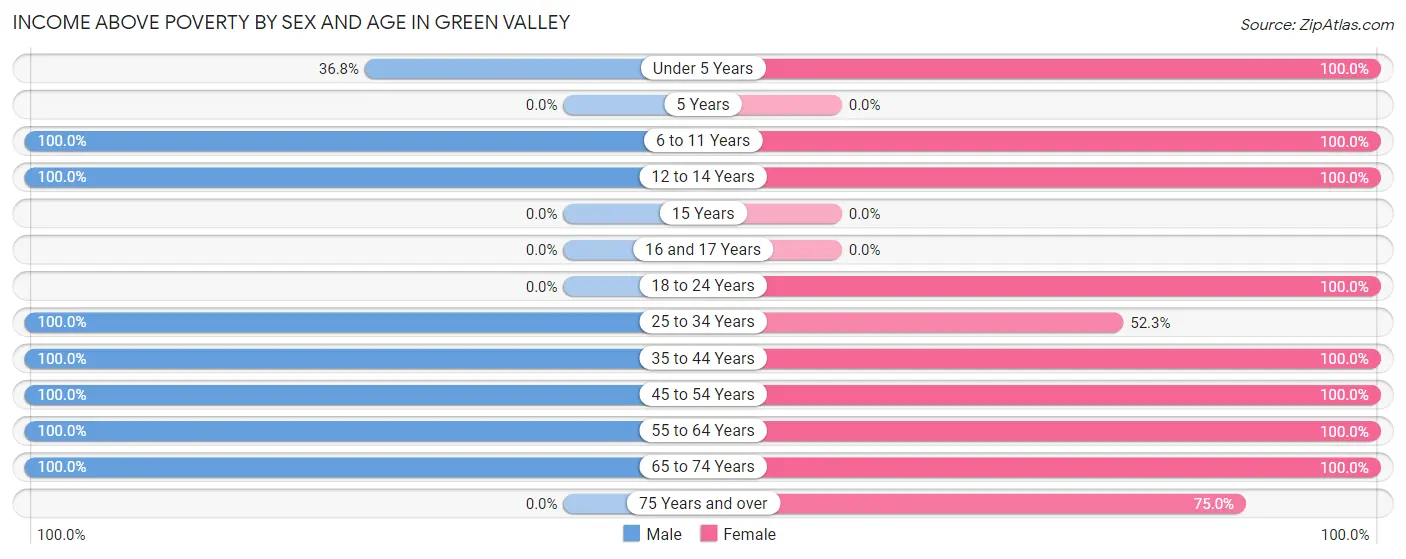
| Age Bracket | Male | Female |
| Under 5 Years | 14 (36.8%) | 52 (100.0%) |
| 5 Years | 0 (0.0%) | 0 (0.0%) |
| 6 to 11 Years | 48 (100.0%) | 62 (100.0%) |
| 12 to 14 Years | 56 (100.0%) | 46 (100.0%) |
| 15 Years | 0 (0.0%) | 0 (0.0%) |
| 16 and 17 Years | 0 (0.0%) | 0 (0.0%) |
| 18 to 24 Years | 0 (0.0%) | 26 (100.0%) |
| 25 to 34 Years | 65 (100.0%) | 58 (52.2%) |
| 35 to 44 Years | 72 (100.0%) | 111 (100.0%) |
| 45 to 54 Years | 49 (100.0%) | 44 (100.0%) |
| 55 to 64 Years | 159 (100.0%) | 81 (100.0%) |
| 65 to 74 Years | 24 (100.0%) | 57 (100.0%) |
| 75 Years and over | 0 (0.0%) | 51 (75.0%) |
| Total | 487 (78.4%) | 588 (83.2%) |
Income Below Poverty Among Married-Couple Families in Green Valley
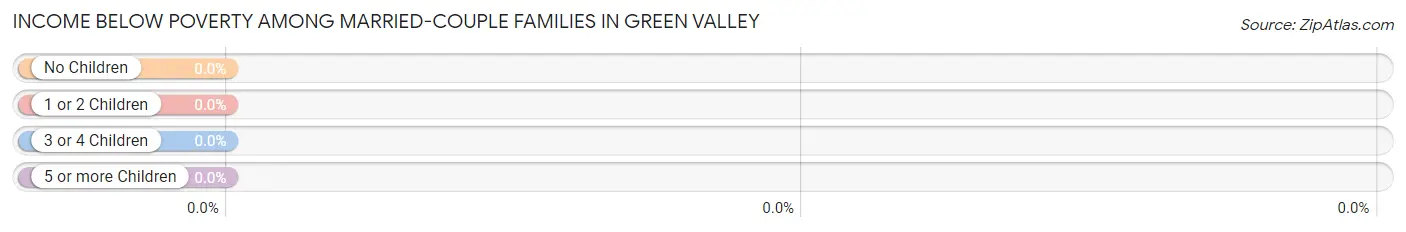
| Children | Above Poverty | Below Poverty |
| No Children | 131 (100.0%) | 0 (0.0%) |
| 1 or 2 Children | 81 (100.0%) | 0 (0.0%) |
| 3 or 4 Children | 22 (100.0%) | 0 (0.0%) |
| 5 or more Children | 0 (0.0%) | 0 (0.0%) |
| Total | 234 (100.0%) | 0 (0.0%) |
Income Below Poverty Among Single-Parent Households in Green Valley
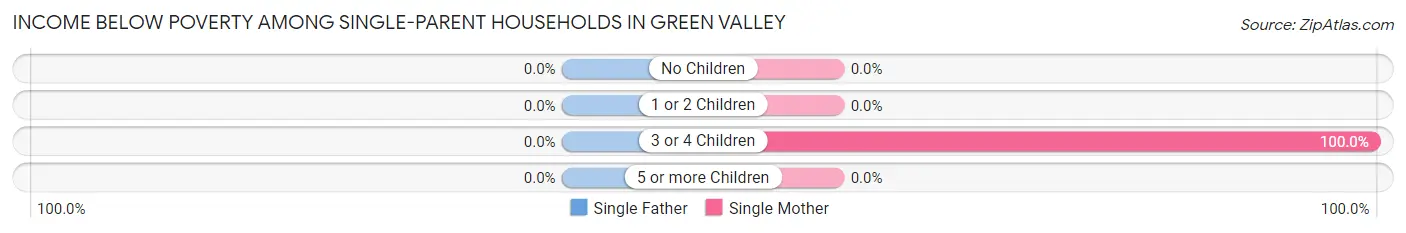
| Children | Single Father | Single Mother |
| No Children | 0 (0.0%) | 0 (0.0%) |
| 1 or 2 Children | 0 (0.0%) | 0 (0.0%) |
| 3 or 4 Children | 0 (0.0%) | 53 (100.0%) |
| 5 or more Children | 0 (0.0%) | 0 (0.0%) |
| Total | 0 (0.0%) | 53 (100.0%) |
Income Below Poverty Among Married-Couple vs Single-Parent Households in Green Valley
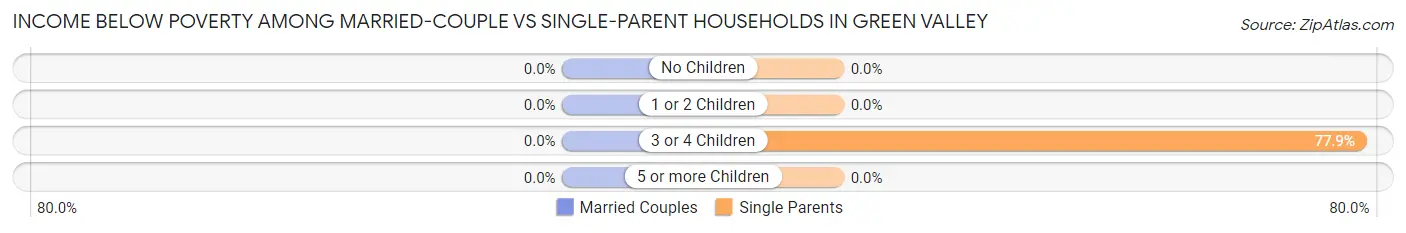
| Children | Married-Couple Families | Single-Parent Households |
| No Children | 0 (0.0%) | 0 (0.0%) |
| 1 or 2 Children | 0 (0.0%) | 0 (0.0%) |
| 3 or 4 Children | 0 (0.0%) | 53 (77.9%) |
| 5 or more Children | 0 (0.0%) | 0 (0.0%) |
| Total | 0 (0.0%) | 53 (46.1%) |
Race in Green Valley
The most populous races in Green Valley are White / Caucasian (933 | 69.0%), Native / Alaskan (331 | 24.5%), and Two or more Races (89 | 6.6%).
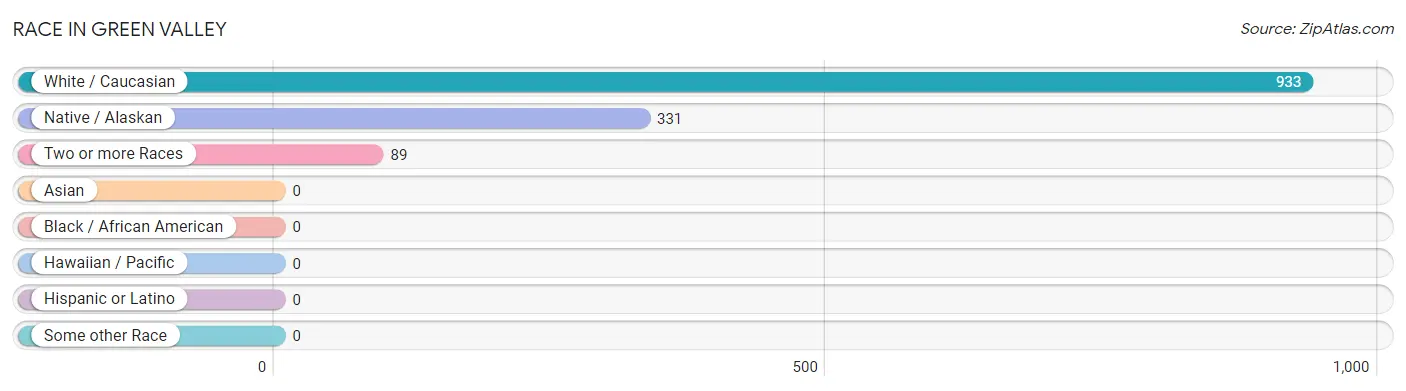
| Race | # Population | % Population |
| Asian | 0 | 0.0% |
| Black / African American | 0 | 0.0% |
| Hawaiian / Pacific | 0 | 0.0% |
| Hispanic or Latino | 0 | 0.0% |
| Native / Alaskan | 331 | 24.5% |
| White / Caucasian | 933 | 69.0% |
| Two or more Races | 89 | 6.6% |
| Some other Race | 0 | 0.0% |
| Total | 1,353 | 100.0% |
Ancestry in Green Valley
The most populous ancestries reported in Green Valley are Sioux (357 | 26.4%), German (345 | 25.5%), Irish (191 | 14.1%), Dutch (151 | 11.2%), and English (150 | 11.1%), together accounting for 88.3% of all Green Valley residents.
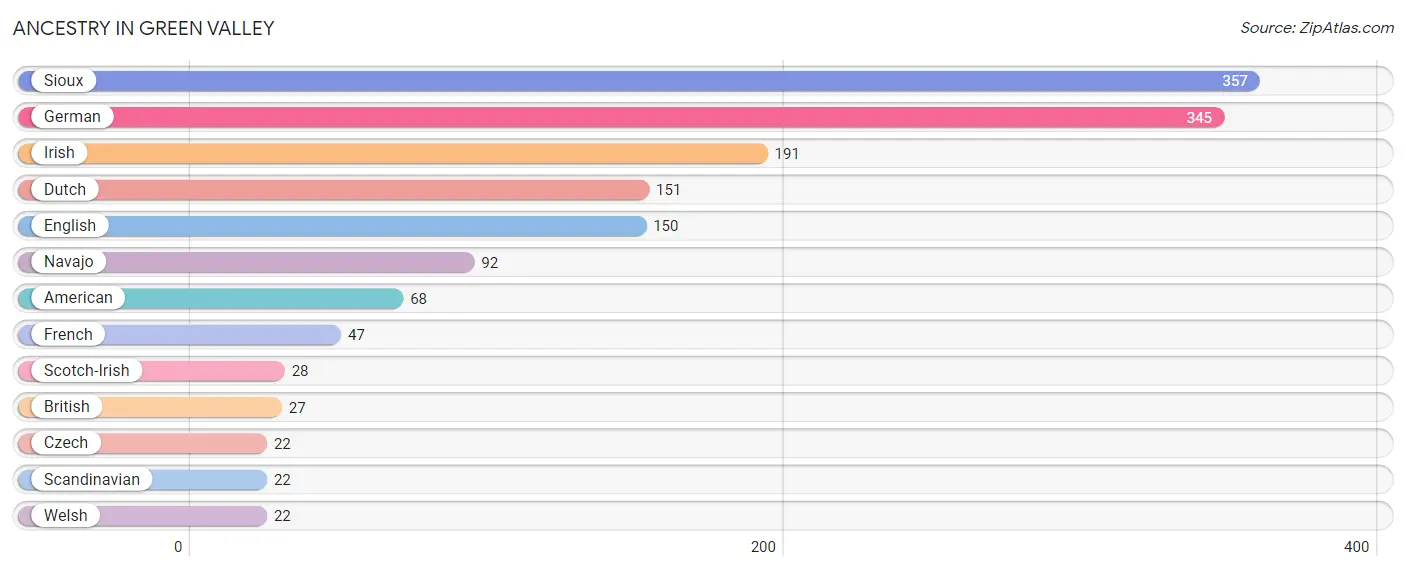
| Ancestry | # Population | % Population |
| American | 68 | 5.0% |
| British | 27 | 2.0% |
| Czech | 22 | 1.6% |
| Dutch | 151 | 11.2% |
| English | 150 | 11.1% |
| French | 47 | 3.5% |
| German | 345 | 25.5% |
| Irish | 191 | 14.1% |
| Navajo | 92 | 6.8% |
| Scandinavian | 22 | 1.6% |
| Scotch-Irish | 28 | 2.1% |
| Sioux | 357 | 26.4% |
| Welsh | 22 | 1.6% | View All 13 Rows |
Immigrants in Green Valley

| Immigration Origin | # Population | % Population | View All 0 Rows |
Sex and Age in Green Valley
Sex and Age in Green Valley
The most populous age groups in Green Valley are 5 to 9 Years (86 | 13.9%) for men and 10 to 14 Years (102 | 13.9%) for women.
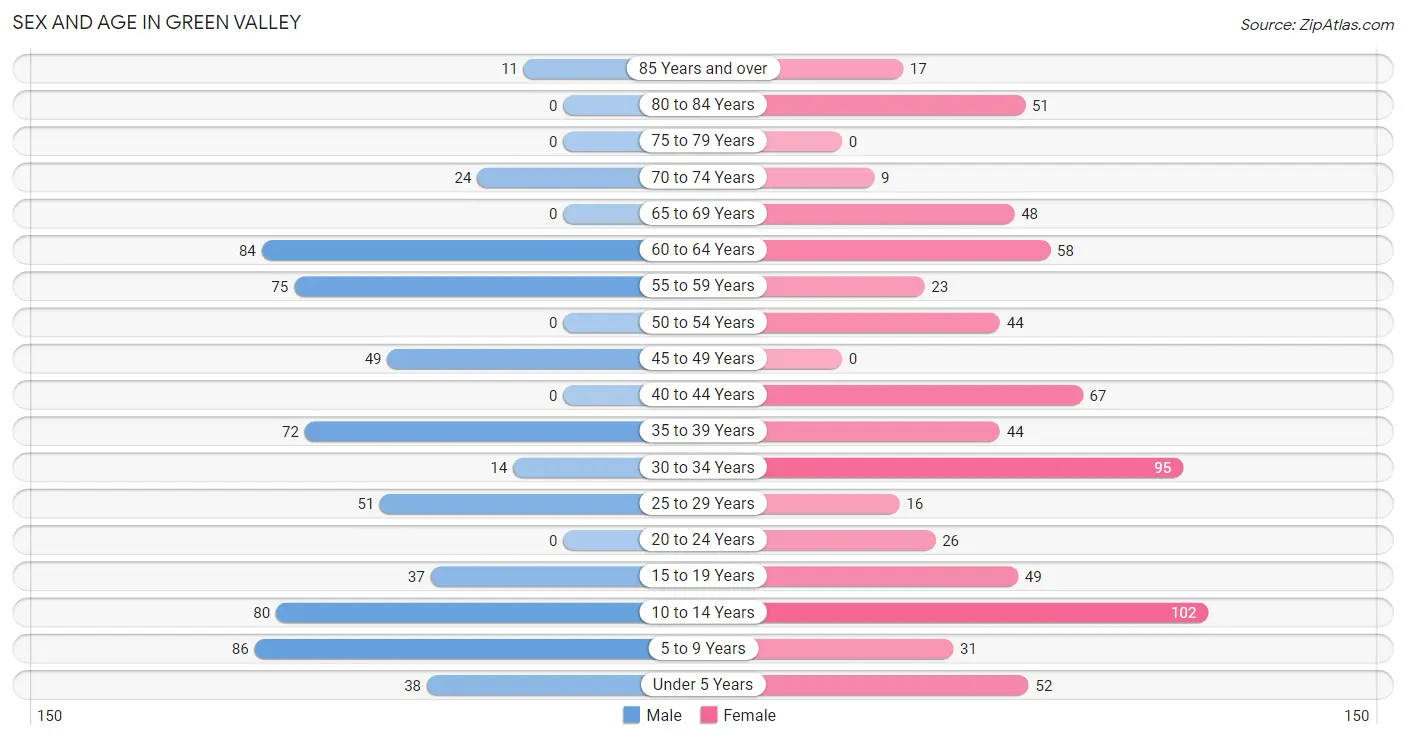
| Age Bracket | Male | Female |
| Under 5 Years | 38 (6.1%) | 52 (7.1%) |
| 5 to 9 Years | 86 (13.9%) | 31 (4.2%) |
| 10 to 14 Years | 80 (12.9%) | 102 (13.9%) |
| 15 to 19 Years | 37 (6.0%) | 49 (6.7%) |
| 20 to 24 Years | 0 (0.0%) | 26 (3.5%) |
| 25 to 29 Years | 51 (8.2%) | 16 (2.2%) |
| 30 to 34 Years | 14 (2.2%) | 95 (13.0%) |
| 35 to 39 Years | 72 (11.6%) | 44 (6.0%) |
| 40 to 44 Years | 0 (0.0%) | 67 (9.1%) |
| 45 to 49 Years | 49 (7.9%) | 0 (0.0%) |
| 50 to 54 Years | 0 (0.0%) | 44 (6.0%) |
| 55 to 59 Years | 75 (12.1%) | 23 (3.1%) |
| 60 to 64 Years | 84 (13.5%) | 58 (7.9%) |
| 65 to 69 Years | 0 (0.0%) | 48 (6.6%) |
| 70 to 74 Years | 24 (3.9%) | 9 (1.2%) |
| 75 to 79 Years | 0 (0.0%) | 0 (0.0%) |
| 80 to 84 Years | 0 (0.0%) | 51 (7.0%) |
| 85 Years and over | 11 (1.8%) | 17 (2.3%) |
| Total | 621 (100.0%) | 732 (100.0%) |
Families and Households in Green Valley
Median Family Size in Green Valley
The median family size in Green Valley is 3.18 persons per family, with single female/mother families (53 | 15.2%) accounting for the largest median family size of 4.02 persons per family. On the other hand, single male/father families (62 | 17.8%) represent the smallest median family size with 2.98 persons per family.
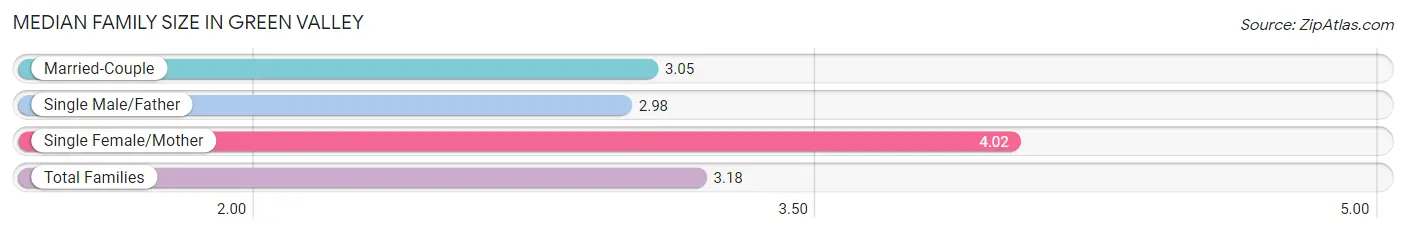
| Family Type | # Families | Family Size |
| Married-Couple | 234 (67.0%) | 3.05 |
| Single Male/Father | 62 (17.8%) | 2.98 |
| Single Female/Mother | 53 (15.2%) | 4.02 |
| Total Families | 349 (100.0%) | 3.18 |
Median Household Size in Green Valley
The median household size in Green Valley is 2.94 persons per household, with single female/mother households (53 | 11.5%) accounting for the largest median household size of 4.02 persons per household. non-family households (111 | 24.1%) represent the smallest median household size with 1.66 persons per household.
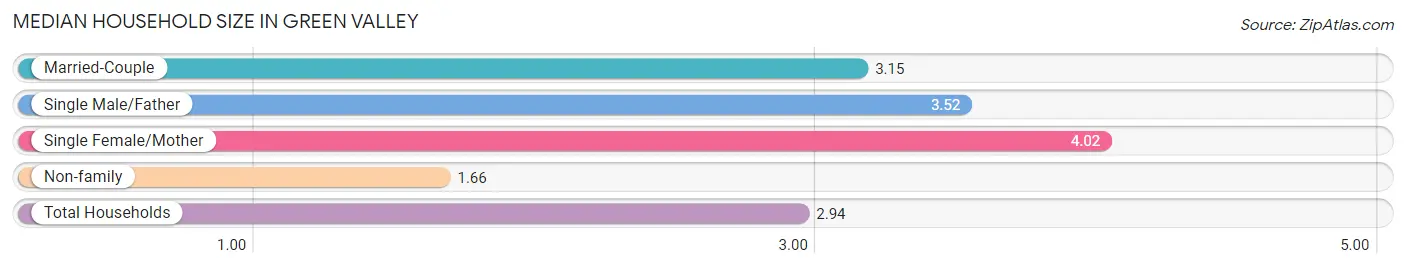
| Household Type | # Households | Household Size |
| Married-Couple | 234 (50.9%) | 3.15 |
| Single Male/Father | 62 (13.5%) | 3.52 |
| Single Female/Mother | 53 (11.5%) | 4.02 |
| Non-family | 111 (24.1%) | 1.66 |
| Total Households | 460 (100.0%) | 2.94 |
Household Size by Marriage Status in Green Valley
Out of a total of 460 households in Green Valley, 349 (75.9%) are family households, while 111 (24.1%) are nonfamily households. The most numerous type of family households are 2-person households, comprising 152, and the most common type of nonfamily households are 2-person households, comprising 68.
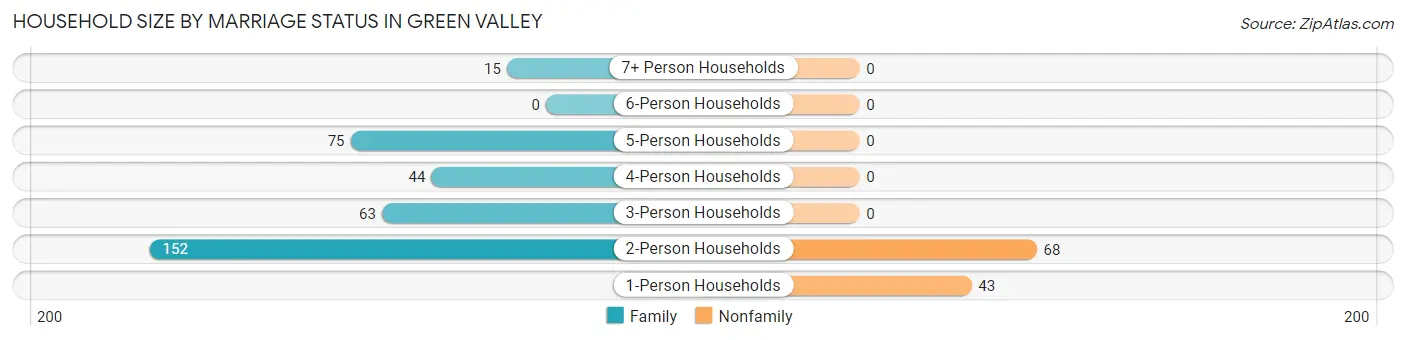
| Household Size | Family Households | Nonfamily Households |
| 1-Person Households | - | 43 (9.3%) |
| 2-Person Households | 152 (33.0%) | 68 (14.8%) |
| 3-Person Households | 63 (13.7%) | 0 (0.0%) |
| 4-Person Households | 44 (9.6%) | 0 (0.0%) |
| 5-Person Households | 75 (16.3%) | 0 (0.0%) |
| 6-Person Households | 0 (0.0%) | 0 (0.0%) |
| 7+ Person Households | 15 (3.3%) | 0 (0.0%) |
| Total | 349 (75.9%) | 111 (24.1%) |
Female Fertility in Green Valley
Fertility by Age in Green Valley
| Age Bracket | Women with Births | Births / 1,000 Women |
| 15 to 19 years | 0 (0.0%) | 0.0 |
| 20 to 34 years | 0 (0.0%) | 0.0 |
| 35 to 50 years | 0 (0.0%) | 0.0 |
| Total | 0 (0.0%) | 0.0 |
Fertility by Age by Marriage Status in Green Valley
| Age Bracket | Married | Unmarried |
| 15 to 19 years | 0 (0.0%) | 0 (0.0%) |
| 20 to 34 years | 0 (0.0%) | 0 (0.0%) |
| 35 to 50 years | 0 (0.0%) | 0 (0.0%) |
| Total | 0 (0.0%) | 0 (0.0%) |
Fertility by Education in Green Valley
| Educational Attainment | Women with Births | Births / 1,000 Women |
| Less than High School | 0 (0.0%) | 0.0 |
| High School Diploma | 0 (0.0%) | 0.0 |
| College or Associate's Degree | 0 (0.0%) | 0.0 |
| Bachelor's Degree | 0 (0.0%) | 0.0 |
| Graduate Degree | 0 (0.0%) | 0.0 |
| Total | 0 (0.0%) | 0.0 |
Fertility by Education by Marriage Status in Green Valley
| Educational Attainment | Married | Unmarried |
| Less than High School | 0 (0.0%) | 0 (0.0%) |
| High School Diploma | 0 (0.0%) | 0 (0.0%) |
| College or Associate's Degree | 0 (0.0%) | 0 (0.0%) |
| Bachelor's Degree | 0 (0.0%) | 0 (0.0%) |
| Graduate Degree | 0 (0.0%) | 0 (0.0%) |
| Total | 0 (0.0%) | 0 (0.0%) |
Employment Characteristics in Green Valley
Employment by Class of Employer in Green Valley
Among the 691 employed individuals in Green Valley, private company employees (277 | 40.1%), local government employees (121 | 17.5%), and self-employed (not incorporated) (76 | 11.0%) make up the most common classes of employment.
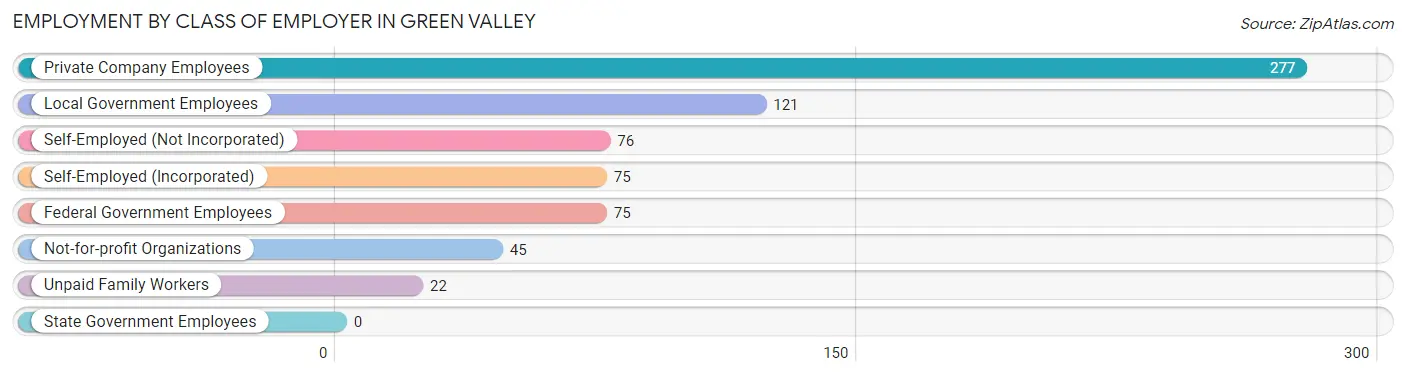
| Employer Class | # Employees | % Employees |
| Private Company Employees | 277 | 40.1% |
| Self-Employed (Incorporated) | 75 | 10.8% |
| Self-Employed (Not Incorporated) | 76 | 11.0% |
| Not-for-profit Organizations | 45 | 6.5% |
| Local Government Employees | 121 | 17.5% |
| State Government Employees | 0 | 0.0% |
| Federal Government Employees | 75 | 10.8% |
| Unpaid Family Workers | 22 | 3.2% |
| Total | 691 | 100.0% |
Employment Status by Age in Green Valley
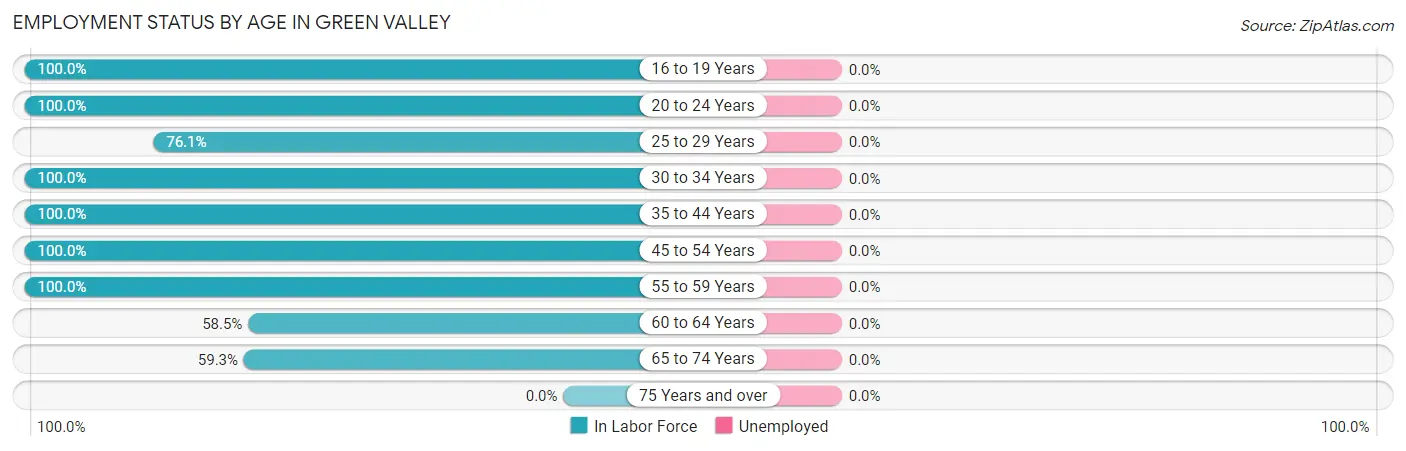
| Age Bracket | In Labor Force | Unemployed |
| 16 to 19 Years | 74 (100.0%) | 0 (0.0%) |
| 20 to 24 Years | 26 (100.0%) | 0 (0.0%) |
| 25 to 29 Years | 51 (76.1%) | 0 (0.0%) |
| 30 to 34 Years | 109 (100.0%) | 0 (0.0%) |
| 35 to 44 Years | 183 (100.0%) | 0 (0.0%) |
| 45 to 54 Years | 93 (100.0%) | 0 (0.0%) |
| 55 to 59 Years | 98 (100.0%) | 0 (0.0%) |
| 60 to 64 Years | 83 (58.5%) | 0 (0.0%) |
| 65 to 74 Years | 48 (59.3%) | 0 (0.0%) |
| 75 Years and over | 0 (0.0%) | 0 (0.0%) |
| Total | 765 (80.4%) | 0 (0.0%) |
Employment Status by Educational Attainment in Green Valley
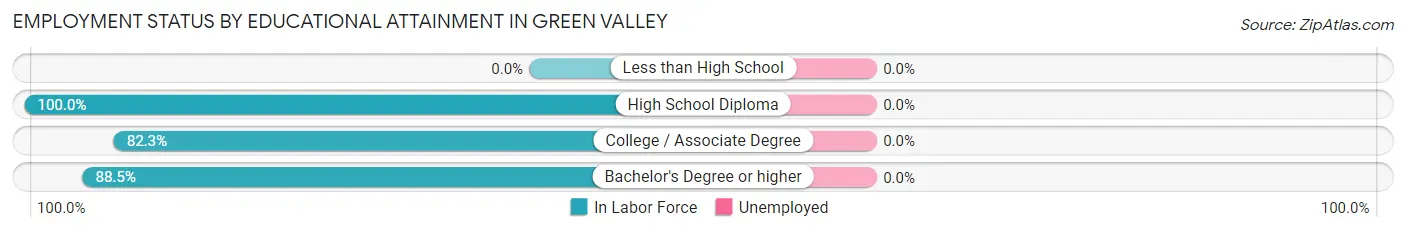
| Educational Attainment | In Labor Force | Unemployed |
| Less than High School | 0 (0.0%) | 0 (0.0%) |
| High School Diploma | 219 (100.0%) | 0 (0.0%) |
| College / Associate Degree | 275 (82.3%) | 0 (0.0%) |
| Bachelor's Degree or higher | 123 (88.5%) | 0 (0.0%) |
| Total | 617 (89.2%) | 0 (0.0%) |
Employment Occupations by Sex in Green Valley
Management, Business, Science and Arts Occupations
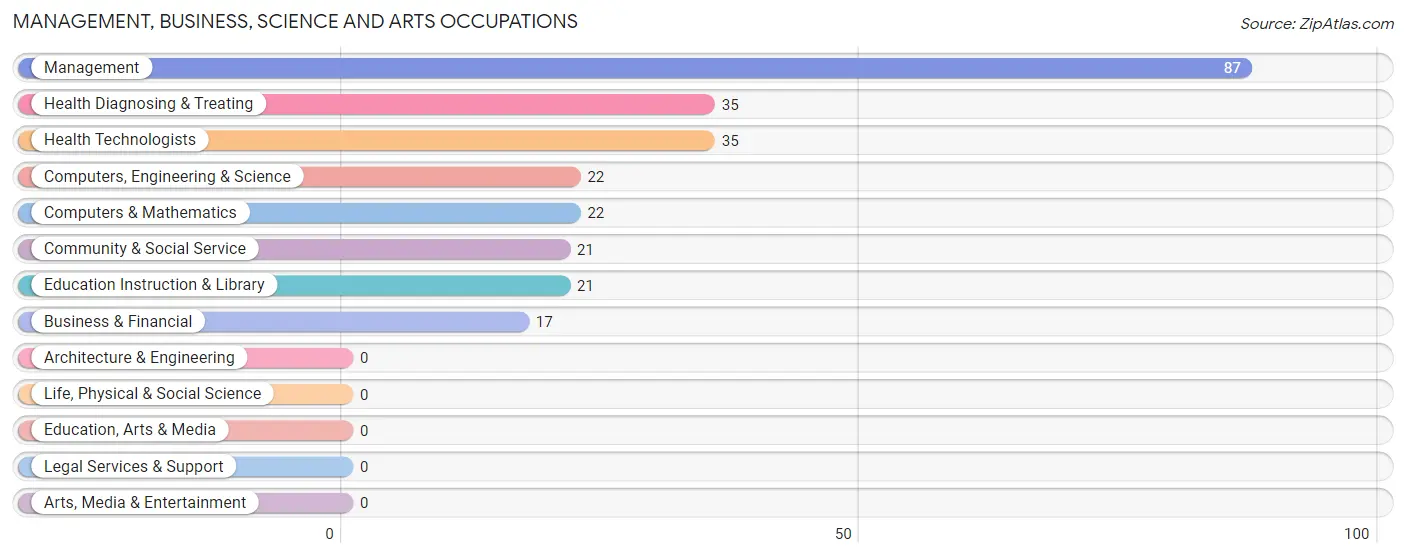
The most common Management, Business, Science and Arts occupations in Green Valley are Management (87 | 12.2%), Health Diagnosing & Treating (35 | 4.9%), Health Technologists (35 | 4.9%), Computers, Engineering & Science (22 | 3.1%), and Computers & Mathematics (22 | 3.1%).
Management, Business, Science and Arts Occupations by Sex
Within the Management, Business, Science and Arts occupations in Green Valley, the most male-oriented occupations are Business & Financial (100.0%), Computers, Engineering & Science (100.0%), and Computers & Mathematics (100.0%), while the most female-oriented occupations are Community & Social Service (100.0%), Education Instruction & Library (100.0%), and Management (74.7%).
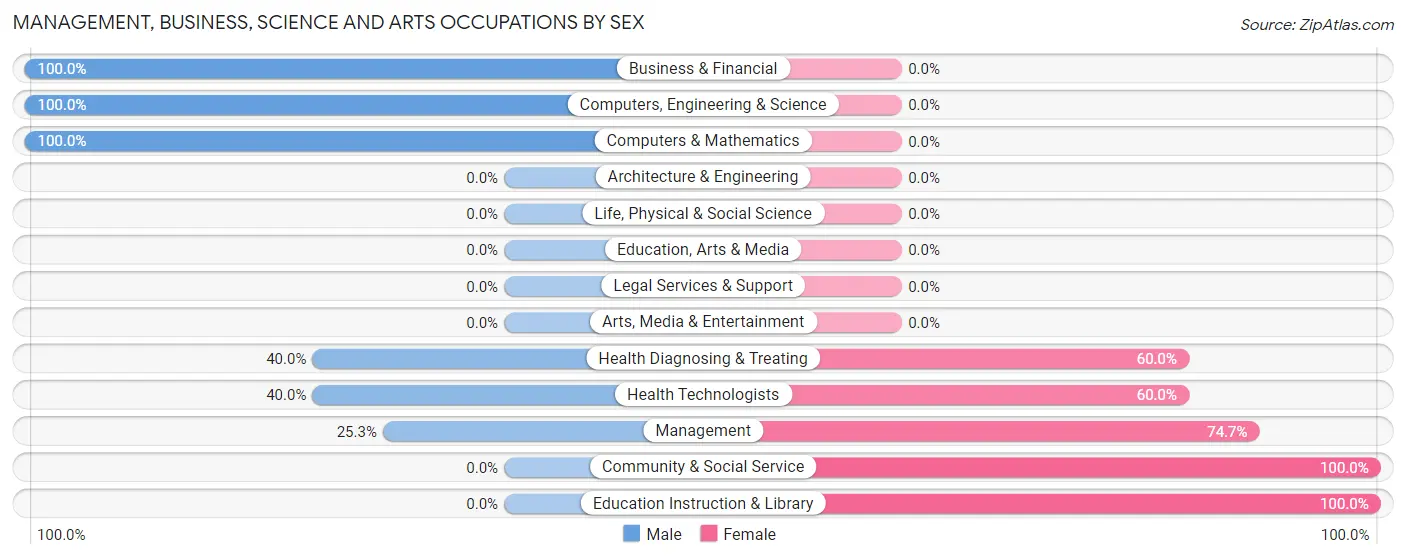
| Occupation | Male | Female |
| Management | 22 (25.3%) | 65 (74.7%) |
| Business & Financial | 17 (100.0%) | 0 (0.0%) |
| Computers, Engineering & Science | 22 (100.0%) | 0 (0.0%) |
| Computers & Mathematics | 22 (100.0%) | 0 (0.0%) |
| Architecture & Engineering | 0 (0.0%) | 0 (0.0%) |
| Life, Physical & Social Science | 0 (0.0%) | 0 (0.0%) |
| Community & Social Service | 0 (0.0%) | 21 (100.0%) |
| Education, Arts & Media | 0 (0.0%) | 0 (0.0%) |
| Legal Services & Support | 0 (0.0%) | 0 (0.0%) |
| Education Instruction & Library | 0 (0.0%) | 21 (100.0%) |
| Arts, Media & Entertainment | 0 (0.0%) | 0 (0.0%) |
| Health Diagnosing & Treating | 14 (40.0%) | 21 (60.0%) |
| Health Technologists | 14 (40.0%) | 21 (60.0%) |
| Total (Category) | 75 (41.2%) | 107 (58.8%) |
| Total (Overall) | 304 (42.6%) | 409 (57.4%) |
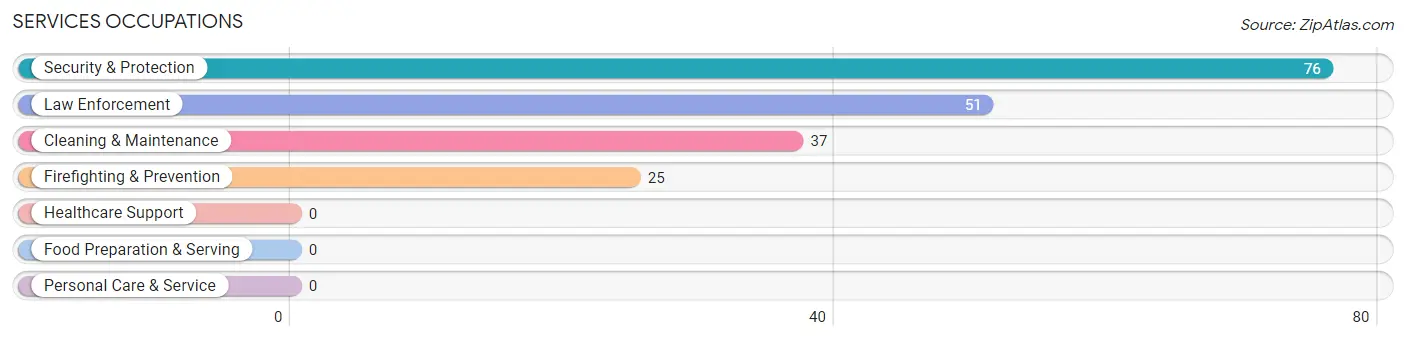
Services Occupations
The most common Services occupations in Green Valley are Security & Protection (76 | 10.7%), Law Enforcement (51 | 7.1%), Cleaning & Maintenance (37 | 5.2%), and Firefighting & Prevention (25 | 3.5%).
Services Occupations by Sex
Within the Services occupations in Green Valley, the most male-oriented occupations are Firefighting & Prevention (100.0%), Cleaning & Maintenance (100.0%), and Security & Protection (69.7%), while the most female-oriented occupations are Law Enforcement (45.1%), and Security & Protection (30.3%).
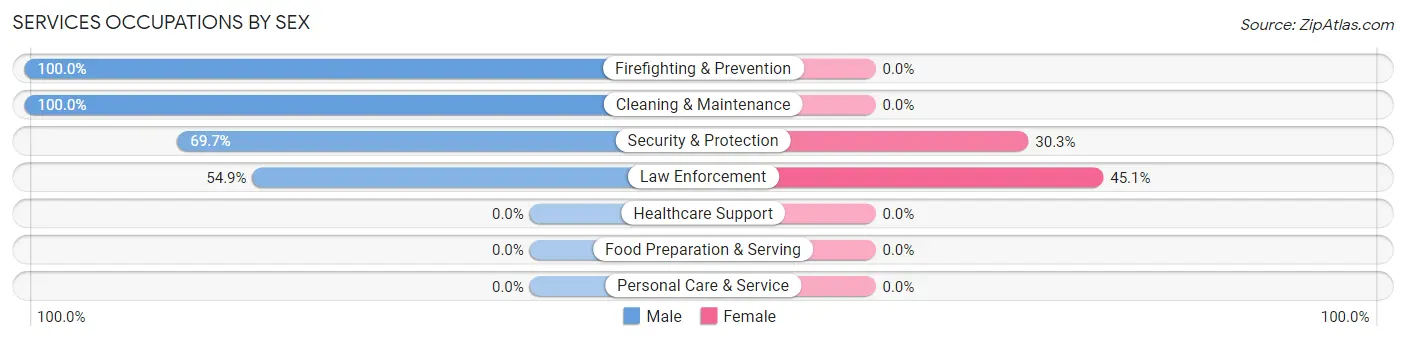
| Occupation | Male | Female |
| Healthcare Support | 0 (0.0%) | 0 (0.0%) |
| Security & Protection | 53 (69.7%) | 23 (30.3%) |
| Firefighting & Prevention | 25 (100.0%) | 0 (0.0%) |
| Law Enforcement | 28 (54.9%) | 23 (45.1%) |
| Food Preparation & Serving | 0 (0.0%) | 0 (0.0%) |
| Cleaning & Maintenance | 37 (100.0%) | 0 (0.0%) |
| Personal Care & Service | 0 (0.0%) | 0 (0.0%) |
| Total (Category) | 90 (79.6%) | 23 (20.3%) |
| Total (Overall) | 304 (42.6%) | 409 (57.4%) |
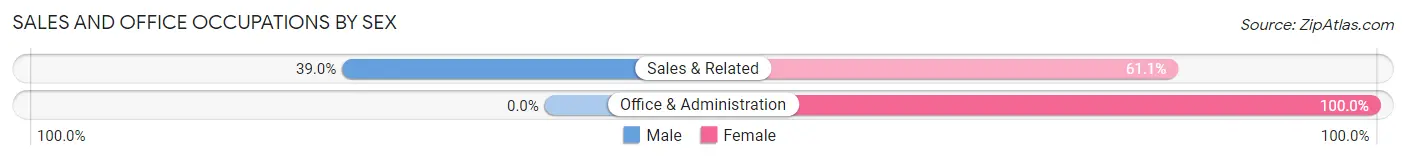
Sales and Office Occupations
The most common Sales and Office occupations in Green Valley are Office & Administration (131 | 18.4%), and Sales & Related (95 | 13.3%).

Sales and Office Occupations by Sex
| Occupation | Male | Female |
| Sales & Related | 37 (39.0%) | 58 (61.1%) |
| Office & Administration | 0 (0.0%) | 131 (100.0%) |
| Total (Category) | 37 (16.4%) | 189 (83.6%) |
| Total (Overall) | 304 (42.6%) | 409 (57.4%) |
Natural Resources, Construction and Maintenance Occupations
The most common Natural Resources, Construction and Maintenance occupations in Green Valley are Construction & Extraction (58 | 8.1%), and Installation, Maintenance & Repair (16 | 2.2%).
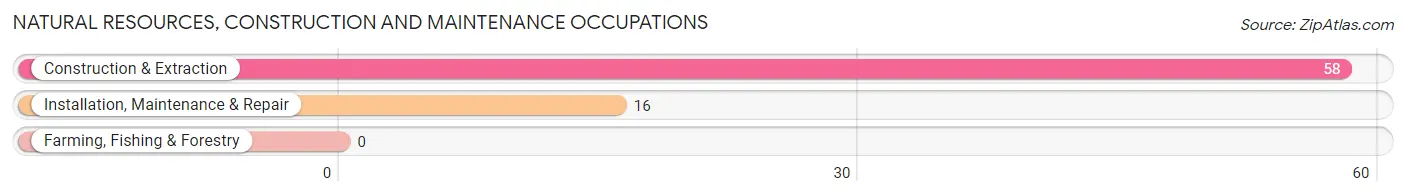
Natural Resources, Construction and Maintenance Occupations by Sex
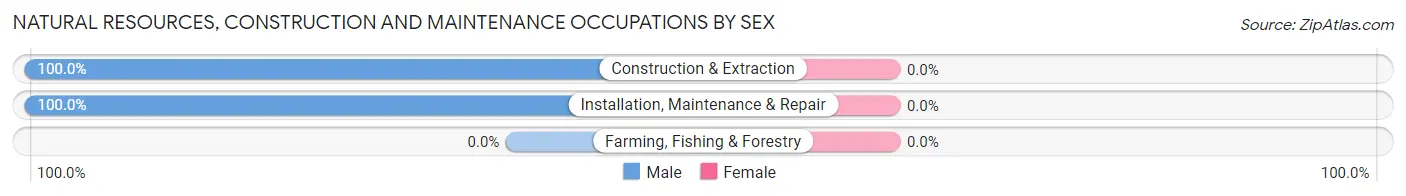
| Occupation | Male | Female |
| Farming, Fishing & Forestry | 0 (0.0%) | 0 (0.0%) |
| Construction & Extraction | 58 (100.0%) | 0 (0.0%) |
| Installation, Maintenance & Repair | 16 (100.0%) | 0 (0.0%) |
| Total (Category) | 74 (100.0%) | 0 (0.0%) |
| Total (Overall) | 304 (42.6%) | 409 (57.4%) |
Production, Transportation and Moving Occupations
The most common Production, Transportation and Moving occupations in Green Valley are Material Moving (90 | 12.6%), and Transportation (28 | 3.9%).
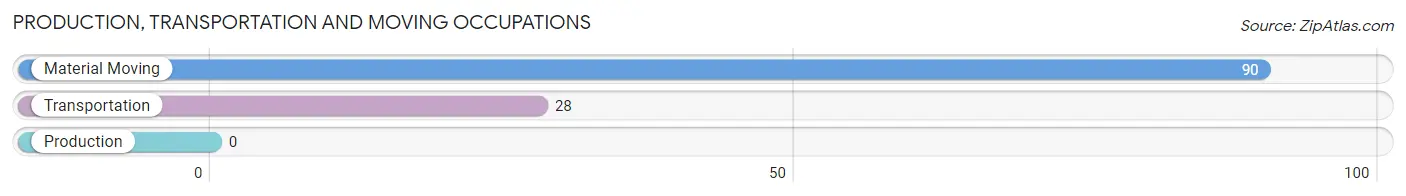
Production, Transportation and Moving Occupations by Sex
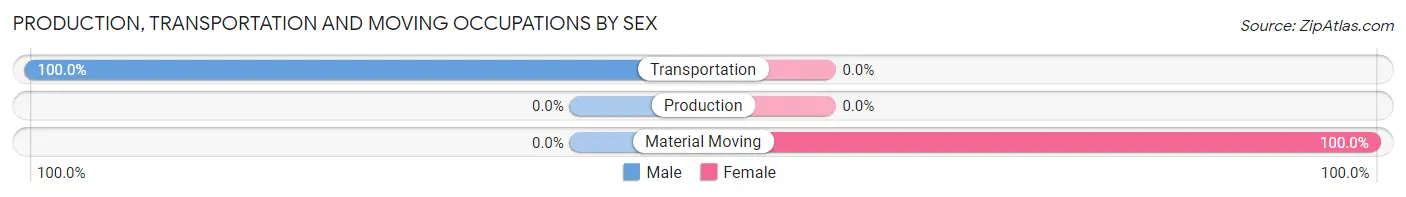
| Occupation | Male | Female |
| Production | 0 (0.0%) | 0 (0.0%) |
| Transportation | 28 (100.0%) | 0 (0.0%) |
| Material Moving | 0 (0.0%) | 90 (100.0%) |
| Total (Category) | 28 (23.7%) | 90 (76.3%) |
| Total (Overall) | 304 (42.6%) | 409 (57.4%) |
Employment Industries by Sex in Green Valley
Employment Industries in Green Valley
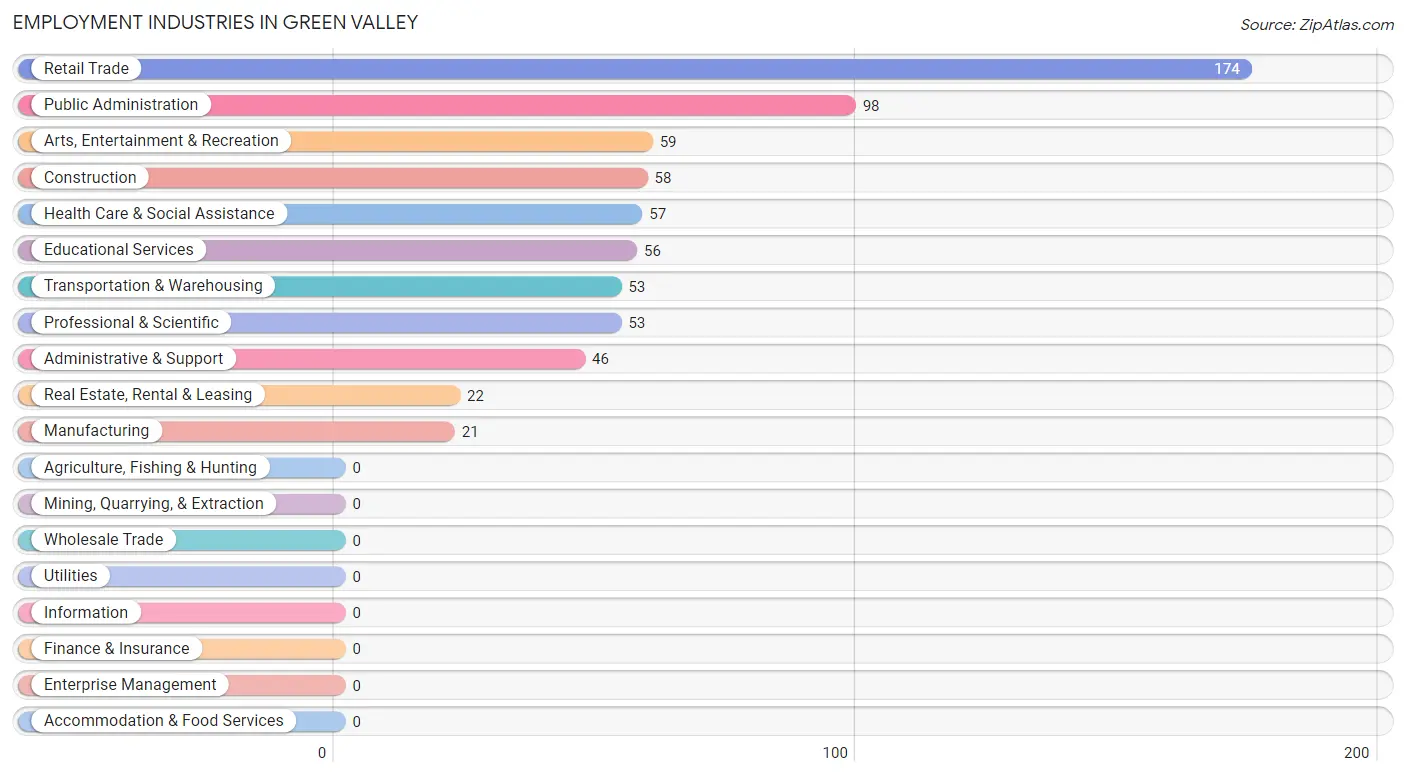
The major employment industries in Green Valley include Retail Trade (174 | 24.4%), Public Administration (98 | 13.7%), Arts, Entertainment & Recreation (59 | 8.3%), Construction (58 | 8.1%), and Health Care & Social Assistance (57 | 8.0%).
Employment Industries by Sex in Green Valley
The Green Valley industries that see more men than women are Construction (100.0%), Administrative & Support (100.0%), and Public Administration (76.5%), whereas the industries that tend to have a higher number of women are Manufacturing (100.0%), Real Estate, Rental & Leasing (100.0%), and Arts, Entertainment & Recreation (100.0%).
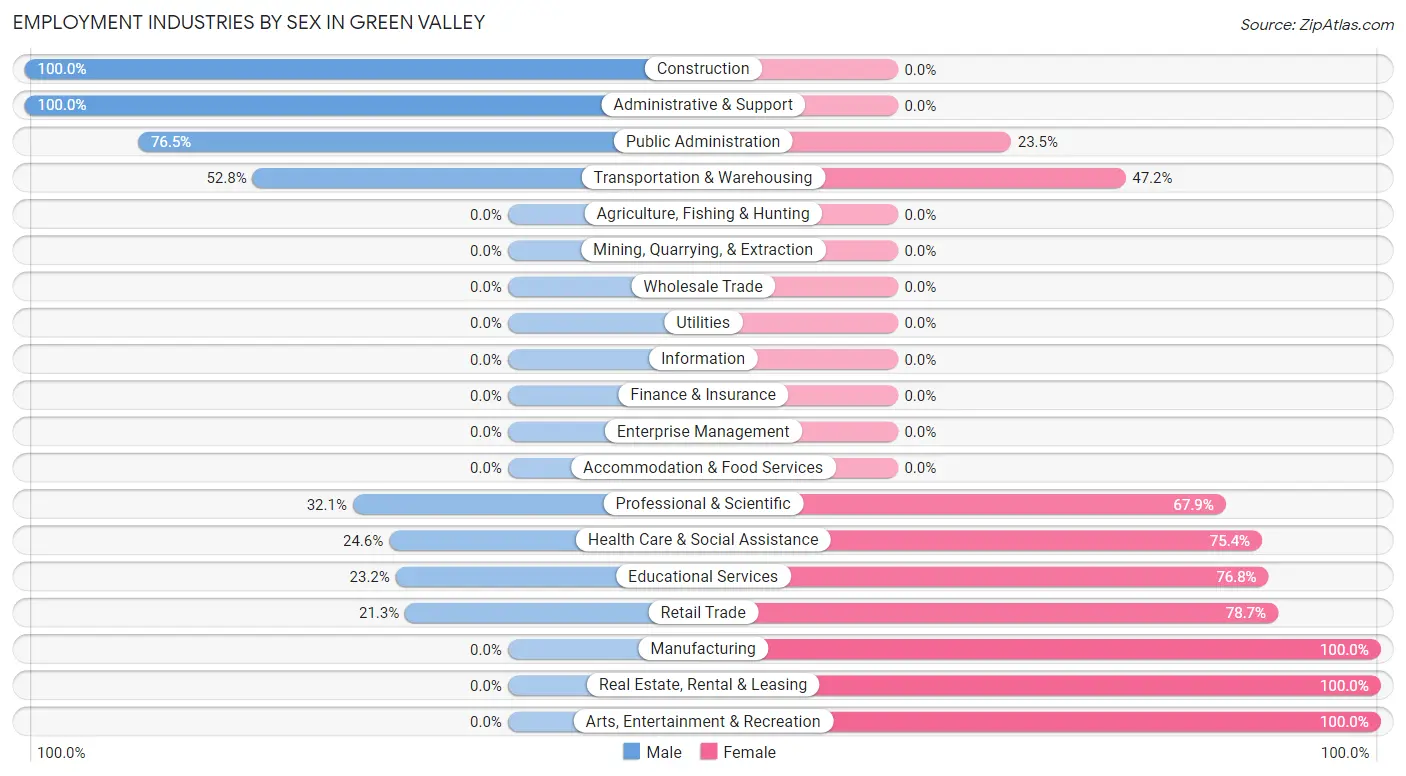
| Industry | Male | Female |
| Agriculture, Fishing & Hunting | 0 (0.0%) | 0 (0.0%) |
| Mining, Quarrying, & Extraction | 0 (0.0%) | 0 (0.0%) |
| Construction | 58 (100.0%) | 0 (0.0%) |
| Manufacturing | 0 (0.0%) | 21 (100.0%) |
| Wholesale Trade | 0 (0.0%) | 0 (0.0%) |
| Retail Trade | 37 (21.3%) | 137 (78.7%) |
| Transportation & Warehousing | 28 (52.8%) | 25 (47.2%) |
| Utilities | 0 (0.0%) | 0 (0.0%) |
| Information | 0 (0.0%) | 0 (0.0%) |
| Finance & Insurance | 0 (0.0%) | 0 (0.0%) |
| Real Estate, Rental & Leasing | 0 (0.0%) | 22 (100.0%) |
| Professional & Scientific | 17 (32.1%) | 36 (67.9%) |
| Enterprise Management | 0 (0.0%) | 0 (0.0%) |
| Administrative & Support | 46 (100.0%) | 0 (0.0%) |
| Educational Services | 13 (23.2%) | 43 (76.8%) |
| Health Care & Social Assistance | 14 (24.6%) | 43 (75.4%) |
| Arts, Entertainment & Recreation | 0 (0.0%) | 59 (100.0%) |
| Accommodation & Food Services | 0 (0.0%) | 0 (0.0%) |
| Public Administration | 75 (76.5%) | 23 (23.5%) |
| Total | 304 (42.6%) | 409 (57.4%) |
Education in Green Valley
School Enrollment in Green Valley
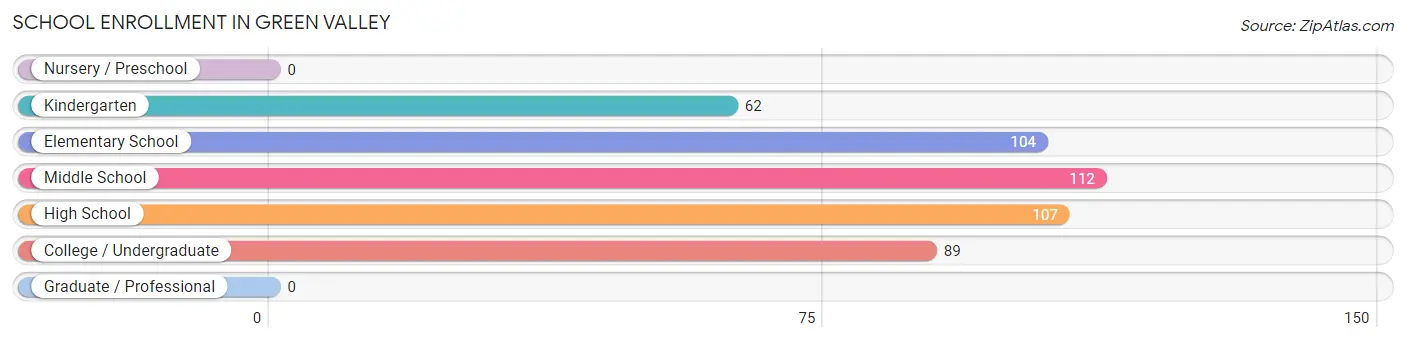
The most common levels of schooling among the 474 students in Green Valley are middle school (112 | 23.6%), high school (107 | 22.6%), and elementary school (104 | 21.9%).
| School Level | # Students | % Students |
| Nursery / Preschool | 0 | 0.0% |
| Kindergarten | 62 | 13.1% |
| Elementary School | 104 | 21.9% |
| Middle School | 112 | 23.6% |
| High School | 107 | 22.6% |
| College / Undergraduate | 89 | 18.8% |
| Graduate / Professional | 0 | 0.0% |
| Total | 474 | 100.0% |
School Enrollment by Age by Funding Source in Green Valley
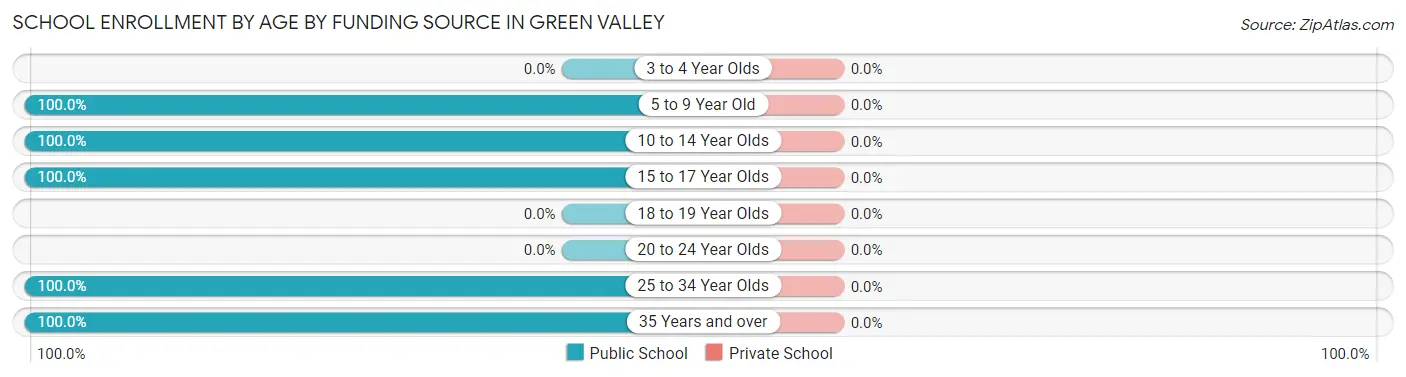
| Age Bracket | Public School | Private School |
| 3 to 4 Year Olds | 0 (0.0%) | 0 (0.0%) |
| 5 to 9 Year Old | 117 (100.0%) | 0 (0.0%) |
| 10 to 14 Year Olds | 182 (100.0%) | 0 (0.0%) |
| 15 to 17 Year Olds | 86 (100.0%) | 0 (0.0%) |
| 18 to 19 Year Olds | 0 (0.0%) | 0 (0.0%) |
| 20 to 24 Year Olds | 0 (0.0%) | 0 (0.0%) |
| 25 to 34 Year Olds | 67 (100.0%) | 0 (0.0%) |
| 35 Years and over | 22 (100.0%) | 0 (0.0%) |
| Total | 474 (100.0%) | 0 (0.0%) |
Educational Attainment by Field of Study in Green Valley
Arts & humanities (43 | 19.8%), education (41 | 18.9%), science & technology (35 | 16.1%), psychology (23 | 10.6%), and social sciences (23 | 10.6%) are the most common fields of study among 217 individuals in Green Valley who have obtained a bachelor's degree or higher.
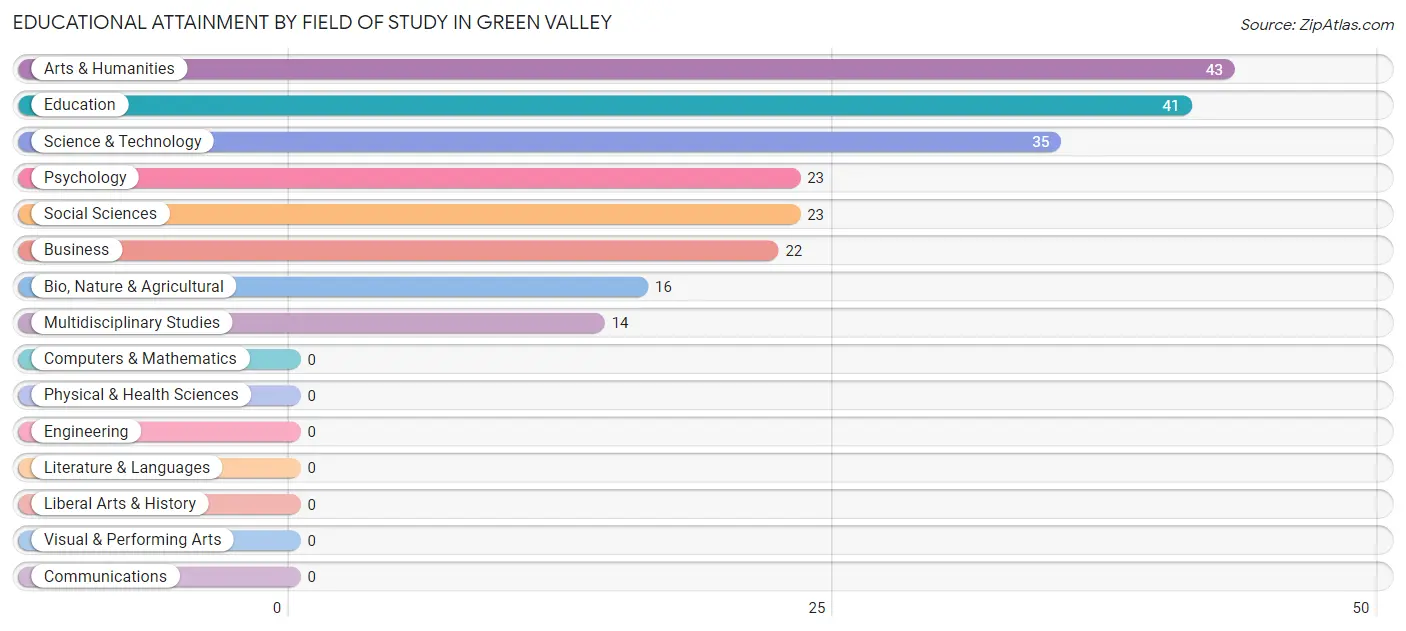
| Field of Study | # Graduates | % Graduates |
| Computers & Mathematics | 0 | 0.0% |
| Bio, Nature & Agricultural | 16 | 7.4% |
| Physical & Health Sciences | 0 | 0.0% |
| Psychology | 23 | 10.6% |
| Social Sciences | 23 | 10.6% |
| Engineering | 0 | 0.0% |
| Multidisciplinary Studies | 14 | 6.5% |
| Science & Technology | 35 | 16.1% |
| Business | 22 | 10.1% |
| Education | 41 | 18.9% |
| Literature & Languages | 0 | 0.0% |
| Liberal Arts & History | 0 | 0.0% |
| Visual & Performing Arts | 0 | 0.0% |
| Communications | 0 | 0.0% |
| Arts & Humanities | 43 | 19.8% |
| Total | 217 | 100.0% |
Transportation & Commute in Green Valley
Vehicle Availability by Sex in Green Valley
The most prevalent vehicle ownership categories in Green Valley are males with 3 vehicles (136, accounting for 42.6%) and females with 3 vehicles (133, making up 36.6%).
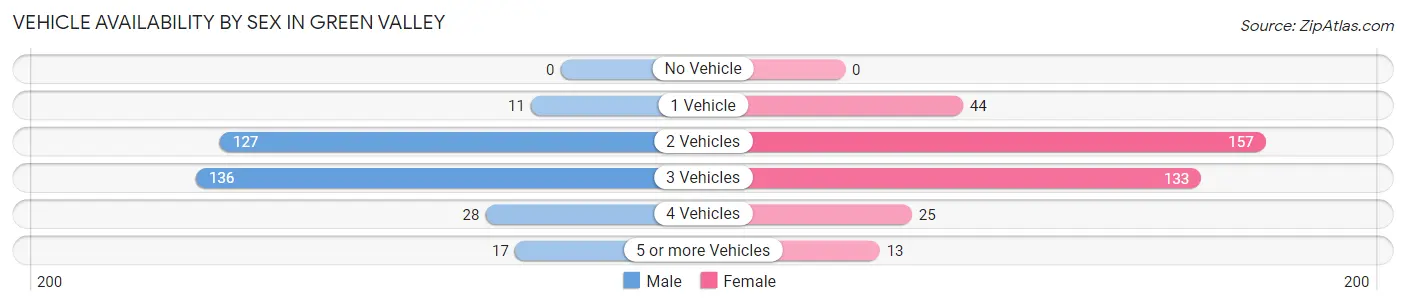
| Vehicles Available | Male | Female |
| No Vehicle | 0 (0.0%) | 0 (0.0%) |
| 1 Vehicle | 11 (3.5%) | 44 (11.8%) |
| 2 Vehicles | 127 (39.8%) | 157 (42.2%) |
| 3 Vehicles | 136 (42.6%) | 133 (35.7%) |
| 4 Vehicles | 28 (8.8%) | 25 (6.7%) |
| 5 or more Vehicles | 17 (5.3%) | 13 (3.5%) |
| Total | 319 (100.0%) | 372 (100.0%) |
Commute Time in Green Valley
The most frequently occuring commute durations in Green Valley are 20 to 24 minutes (223 commuters, 39.5%), 15 to 19 minutes (125 commuters, 22.2%), and 25 to 29 minutes (75 commuters, 13.3%).
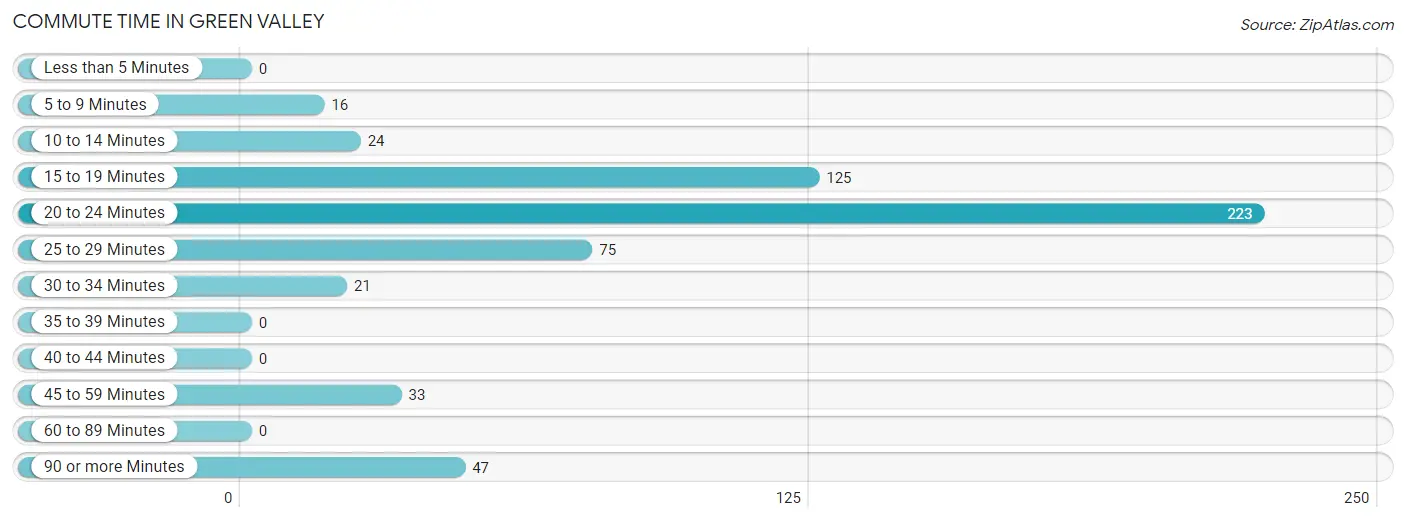
| Commute Time | # Commuters | % Commuters |
| Less than 5 Minutes | 0 | 0.0% |
| 5 to 9 Minutes | 16 | 2.8% |
| 10 to 14 Minutes | 24 | 4.3% |
| 15 to 19 Minutes | 125 | 22.2% |
| 20 to 24 Minutes | 223 | 39.5% |
| 25 to 29 Minutes | 75 | 13.3% |
| 30 to 34 Minutes | 21 | 3.7% |
| 35 to 39 Minutes | 0 | 0.0% |
| 40 to 44 Minutes | 0 | 0.0% |
| 45 to 59 Minutes | 33 | 5.9% |
| 60 to 89 Minutes | 0 | 0.0% |
| 90 or more Minutes | 47 | 8.3% |
Commute Time by Sex in Green Valley
The most common commute times in Green Valley are 20 to 24 minutes (77 commuters, 30.6%) for males and 20 to 24 minutes (146 commuters, 46.8%) for females.
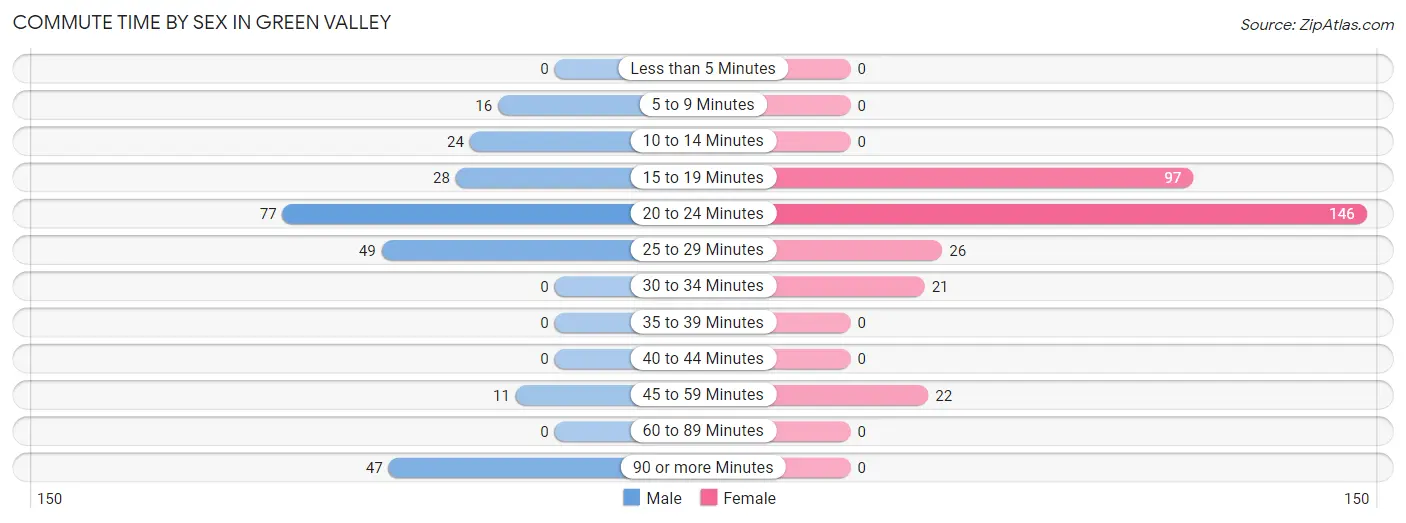
| Commute Time | Male | Female |
| Less than 5 Minutes | 0 (0.0%) | 0 (0.0%) |
| 5 to 9 Minutes | 16 (6.4%) | 0 (0.0%) |
| 10 to 14 Minutes | 24 (9.5%) | 0 (0.0%) |
| 15 to 19 Minutes | 28 (11.1%) | 97 (31.1%) |
| 20 to 24 Minutes | 77 (30.6%) | 146 (46.8%) |
| 25 to 29 Minutes | 49 (19.4%) | 26 (8.3%) |
| 30 to 34 Minutes | 0 (0.0%) | 21 (6.7%) |
| 35 to 39 Minutes | 0 (0.0%) | 0 (0.0%) |
| 40 to 44 Minutes | 0 (0.0%) | 0 (0.0%) |
| 45 to 59 Minutes | 11 (4.4%) | 22 (7.0%) |
| 60 to 89 Minutes | 0 (0.0%) | 0 (0.0%) |
| 90 or more Minutes | 47 (18.6%) | 0 (0.0%) |
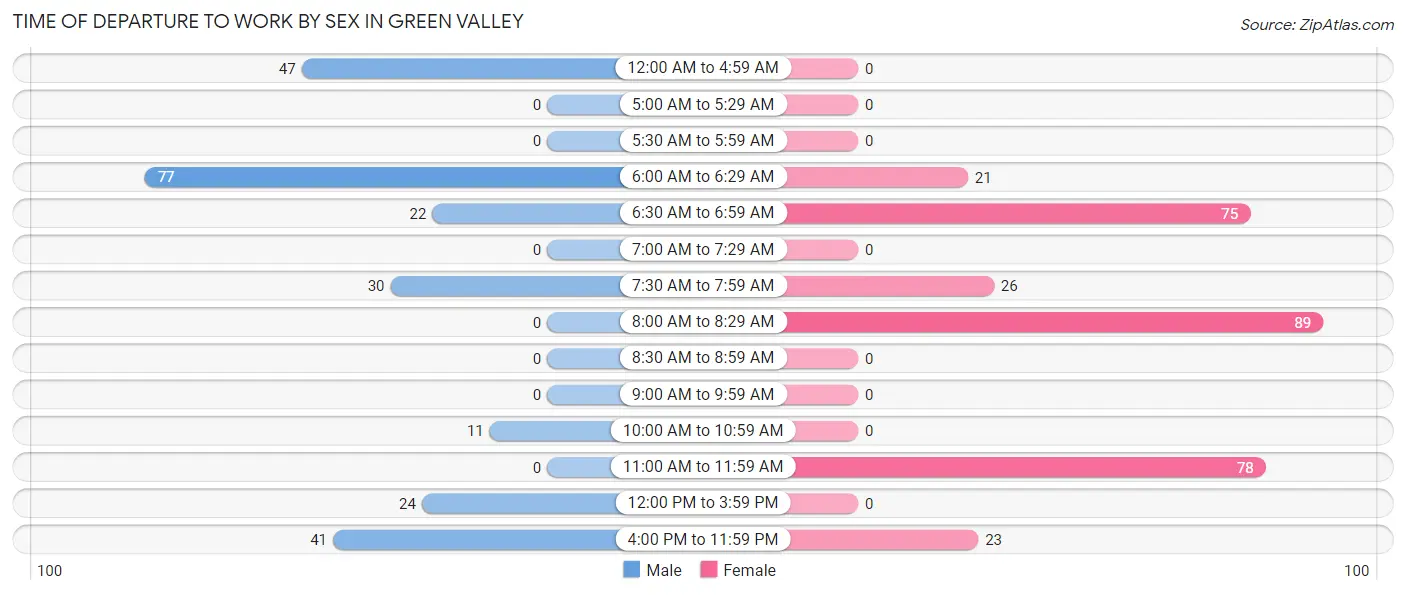
Time of Departure to Work by Sex in Green Valley
The most frequent times of departure to work in Green Valley are 6:00 AM to 6:29 AM (77, 30.6%) for males and 8:00 AM to 8:29 AM (89, 28.5%) for females.
| Time of Departure | Male | Female |
| 12:00 AM to 4:59 AM | 47 (18.6%) | 0 (0.0%) |
| 5:00 AM to 5:29 AM | 0 (0.0%) | 0 (0.0%) |
| 5:30 AM to 5:59 AM | 0 (0.0%) | 0 (0.0%) |
| 6:00 AM to 6:29 AM | 77 (30.6%) | 21 (6.7%) |
| 6:30 AM to 6:59 AM | 22 (8.7%) | 75 (24.0%) |
| 7:00 AM to 7:29 AM | 0 (0.0%) | 0 (0.0%) |
| 7:30 AM to 7:59 AM | 30 (11.9%) | 26 (8.3%) |
| 8:00 AM to 8:29 AM | 0 (0.0%) | 89 (28.5%) |
| 8:30 AM to 8:59 AM | 0 (0.0%) | 0 (0.0%) |
| 9:00 AM to 9:59 AM | 0 (0.0%) | 0 (0.0%) |
| 10:00 AM to 10:59 AM | 11 (4.4%) | 0 (0.0%) |
| 11:00 AM to 11:59 AM | 0 (0.0%) | 78 (25.0%) |
| 12:00 PM to 3:59 PM | 24 (9.5%) | 0 (0.0%) |
| 4:00 PM to 11:59 PM | 41 (16.3%) | 23 (7.4%) |
| Total | 252 (100.0%) | 312 (100.0%) |
Housing Occupancy in Green Valley
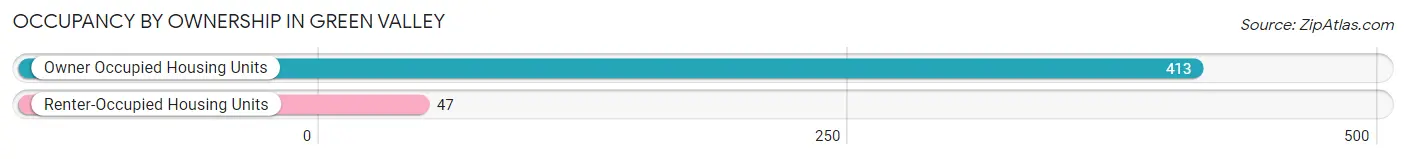
Occupancy by Ownership in Green Valley
Of the total 460 dwellings in Green Valley, owner-occupied units account for 413 (89.8%), while renter-occupied units make up 47 (10.2%).
| Occupancy | # Housing Units | % Housing Units |
| Owner Occupied Housing Units | 413 | 89.8% |
| Renter-Occupied Housing Units | 47 | 10.2% |
| Total Occupied Housing Units | 460 | 100.0% |
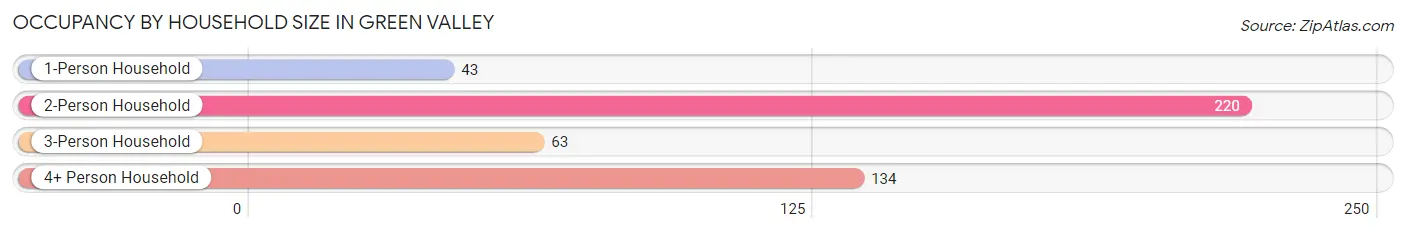
Occupancy by Household Size in Green Valley
| Household Size | # Housing Units | % Housing Units |
| 1-Person Household | 43 | 9.3% |
| 2-Person Household | 220 | 47.8% |
| 3-Person Household | 63 | 13.7% |
| 4+ Person Household | 134 | 29.1% |
| Total Housing Units | 460 | 100.0% |
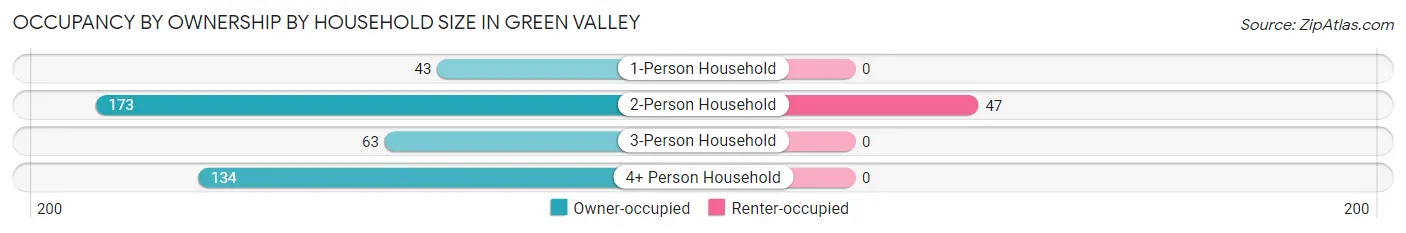
Occupancy by Ownership by Household Size in Green Valley
| Household Size | Owner-occupied | Renter-occupied |
| 1-Person Household | 43 (100.0%) | 0 (0.0%) |
| 2-Person Household | 173 (78.6%) | 47 (21.4%) |
| 3-Person Household | 63 (100.0%) | 0 (0.0%) |
| 4+ Person Household | 134 (100.0%) | 0 (0.0%) |
| Total Housing Units | 413 (89.8%) | 47 (10.2%) |
Occupancy by Educational Attainment in Green Valley
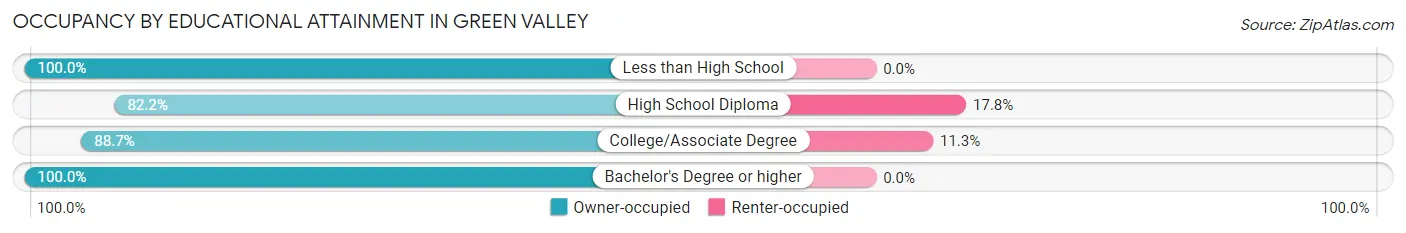
| Household Size | Owner-occupied | Renter-occupied |
| Less than High School | 17 (100.0%) | 0 (0.0%) |
| High School Diploma | 106 (82.2%) | 23 (17.8%) |
| College/Associate Degree | 189 (88.7%) | 24 (11.3%) |
| Bachelor's Degree or higher | 101 (100.0%) | 0 (0.0%) |
Occupancy by Age of Householder in Green Valley
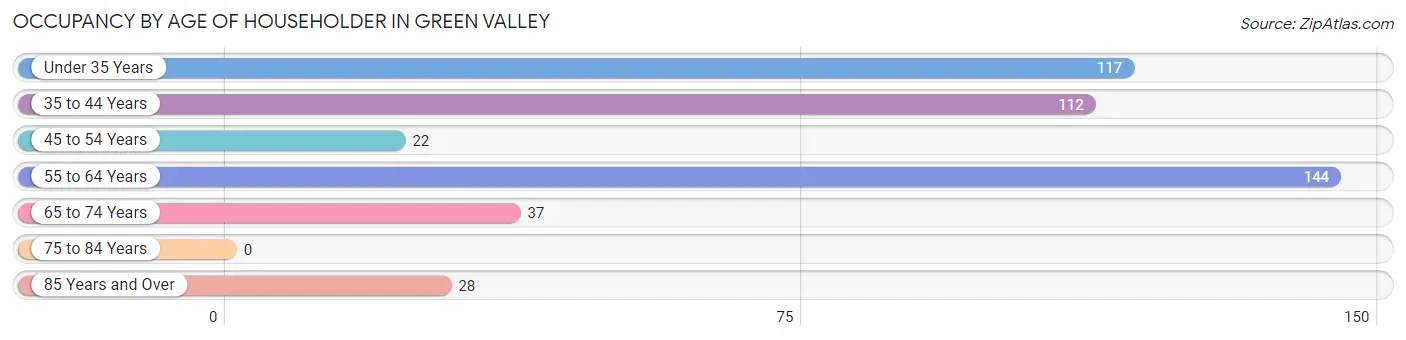
| Age Bracket | # Households | % Households |
| Under 35 Years | 117 | 25.4% |
| 35 to 44 Years | 112 | 24.3% |
| 45 to 54 Years | 22 | 4.8% |
| 55 to 64 Years | 144 | 31.3% |
| 65 to 74 Years | 37 | 8.0% |
| 75 to 84 Years | 0 | 0.0% |
| 85 Years and Over | 28 | 6.1% |
| Total | 460 | 100.0% |
Housing Finances in Green Valley
Median Income by Occupancy in Green Valley
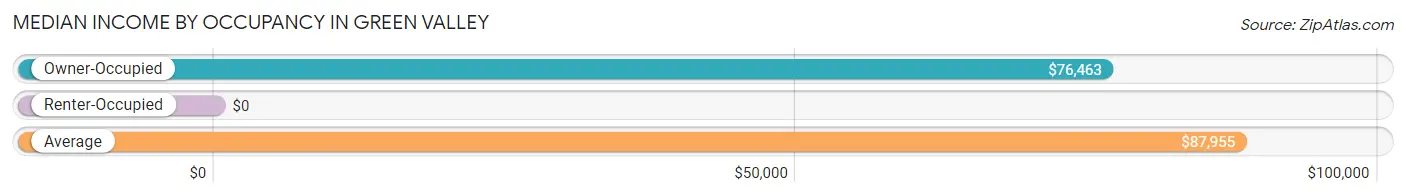
| Occupancy Type | # Households | Median Income |
| Owner-Occupied | 413 (89.8%) | $76,463 |
| Renter-Occupied | 47 (10.2%) | $0 |
| Average | 460 (100.0%) | $87,955 |
Occupancy by Householder Income Bracket in Green Valley
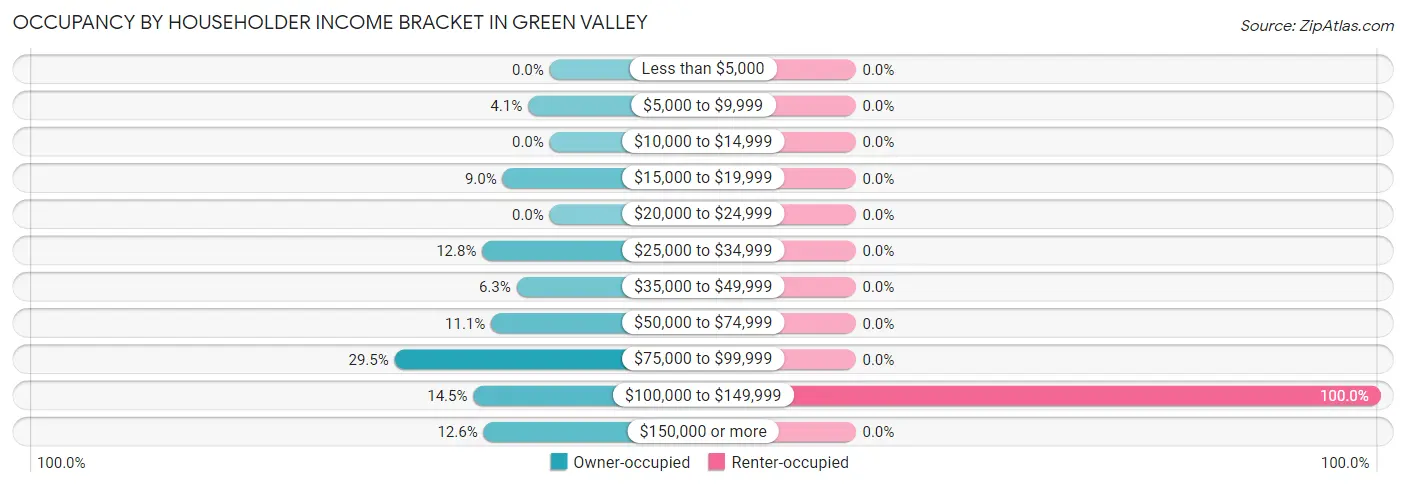
| Income Bracket | Owner-occupied | Renter-occupied |
| Less than $5,000 | 0 (0.0%) | 0 (0.0%) |
| $5,000 to $9,999 | 17 (4.1%) | 0 (0.0%) |
| $10,000 to $14,999 | 0 (0.0%) | 0 (0.0%) |
| $15,000 to $19,999 | 37 (9.0%) | 0 (0.0%) |
| $20,000 to $24,999 | 0 (0.0%) | 0 (0.0%) |
| $25,000 to $34,999 | 53 (12.8%) | 0 (0.0%) |
| $35,000 to $49,999 | 26 (6.3%) | 0 (0.0%) |
| $50,000 to $74,999 | 46 (11.1%) | 0 (0.0%) |
| $75,000 to $99,999 | 122 (29.5%) | 0 (0.0%) |
| $100,000 to $149,999 | 60 (14.5%) | 47 (100.0%) |
| $150,000 or more | 52 (12.6%) | 0 (0.0%) |
| Total | 413 (100.0%) | 47 (100.0%) |
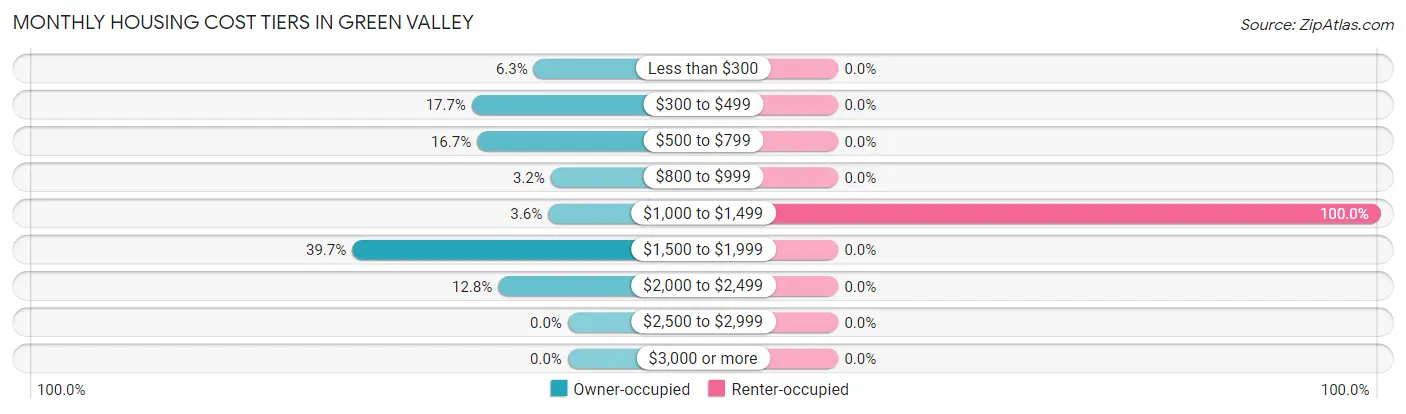
Monthly Housing Cost Tiers in Green Valley
| Monthly Cost | Owner-occupied | Renter-occupied |
| Less than $300 | 26 (6.3%) | 0 (0.0%) |
| $300 to $499 | 73 (17.7%) | 0 (0.0%) |
| $500 to $799 | 69 (16.7%) | 0 (0.0%) |
| $800 to $999 | 13 (3.2%) | 0 (0.0%) |
| $1,000 to $1,499 | 15 (3.6%) | 47 (100.0%) |
| $1,500 to $1,999 | 164 (39.7%) | 0 (0.0%) |
| $2,000 to $2,499 | 53 (12.8%) | 0 (0.0%) |
| $2,500 to $2,999 | 0 (0.0%) | 0 (0.0%) |
| $3,000 or more | 0 (0.0%) | 0 (0.0%) |
| Total | 413 (100.0%) | 47 (100.0%) |
Physical Housing Characteristics in Green Valley
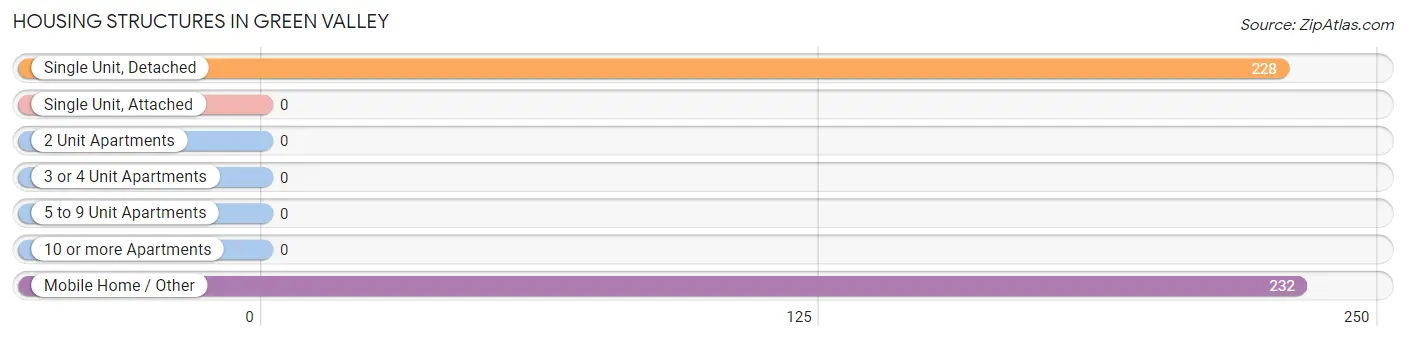
Housing Structures in Green Valley
| Structure Type | # Housing Units | % Housing Units |
| Single Unit, Detached | 228 | 49.6% |
| Single Unit, Attached | 0 | 0.0% |
| 2 Unit Apartments | 0 | 0.0% |
| 3 or 4 Unit Apartments | 0 | 0.0% |
| 5 to 9 Unit Apartments | 0 | 0.0% |
| 10 or more Apartments | 0 | 0.0% |
| Mobile Home / Other | 232 | 50.4% |
| Total | 460 | 100.0% |
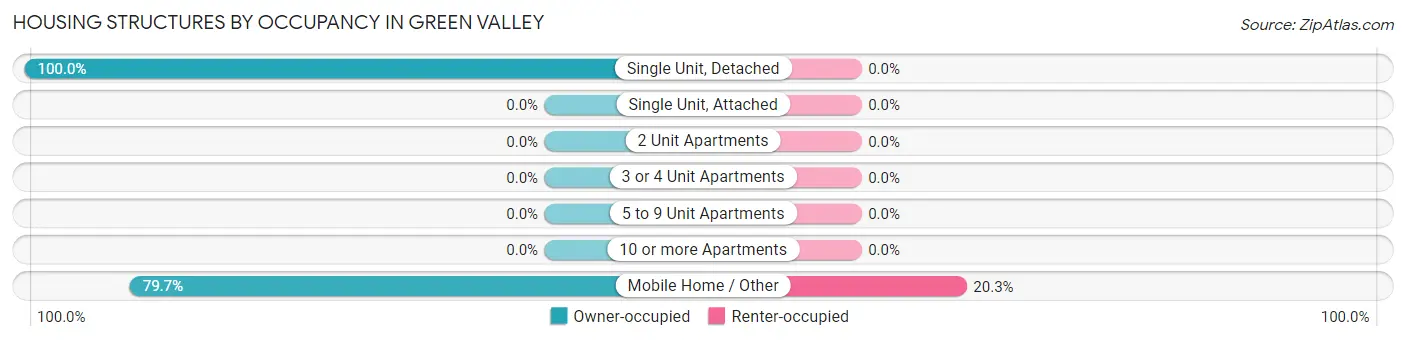
Housing Structures by Occupancy in Green Valley
| Structure Type | Owner-occupied | Renter-occupied |
| Single Unit, Detached | 228 (100.0%) | 0 (0.0%) |
| Single Unit, Attached | 0 (0.0%) | 0 (0.0%) |
| 2 Unit Apartments | 0 (0.0%) | 0 (0.0%) |
| 3 or 4 Unit Apartments | 0 (0.0%) | 0 (0.0%) |
| 5 to 9 Unit Apartments | 0 (0.0%) | 0 (0.0%) |
| 10 or more Apartments | 0 (0.0%) | 0 (0.0%) |
| Mobile Home / Other | 185 (79.7%) | 47 (20.3%) |
| Total | 413 (89.8%) | 47 (10.2%) |
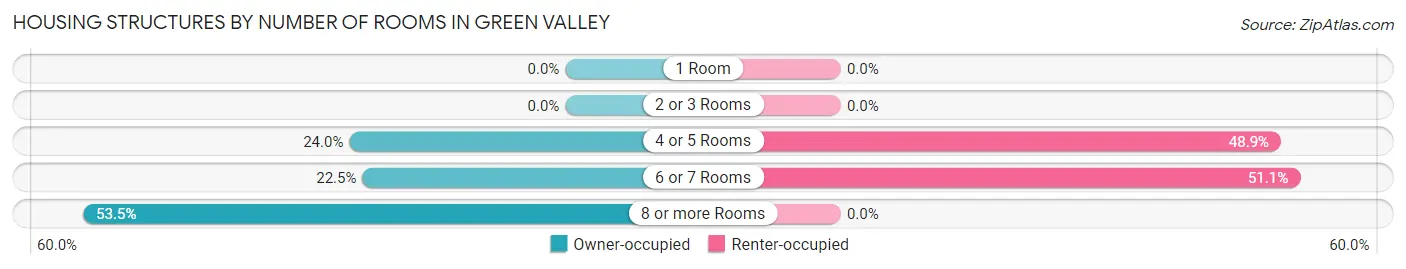
Housing Structures by Number of Rooms in Green Valley
| Number of Rooms | Owner-occupied | Renter-occupied |
| 1 Room | 0 (0.0%) | 0 (0.0%) |
| 2 or 3 Rooms | 0 (0.0%) | 0 (0.0%) |
| 4 or 5 Rooms | 99 (24.0%) | 23 (48.9%) |
| 6 or 7 Rooms | 93 (22.5%) | 24 (51.1%) |
| 8 or more Rooms | 221 (53.5%) | 0 (0.0%) |
| Total | 413 (100.0%) | 47 (100.0%) |
Housing Structure by Heating Type in Green Valley
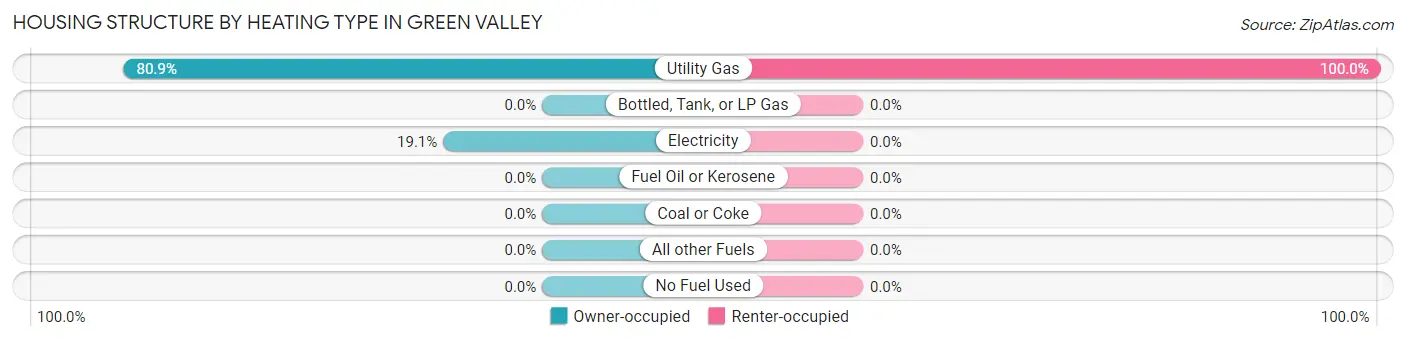
| Heating Type | Owner-occupied | Renter-occupied |
| Utility Gas | 334 (80.9%) | 47 (100.0%) |
| Bottled, Tank, or LP Gas | 0 (0.0%) | 0 (0.0%) |
| Electricity | 79 (19.1%) | 0 (0.0%) |
| Fuel Oil or Kerosene | 0 (0.0%) | 0 (0.0%) |
| Coal or Coke | 0 (0.0%) | 0 (0.0%) |
| All other Fuels | 0 (0.0%) | 0 (0.0%) |
| No Fuel Used | 0 (0.0%) | 0 (0.0%) |
| Total | 413 (100.0%) | 47 (100.0%) |
Household Vehicle Usage in Green Valley
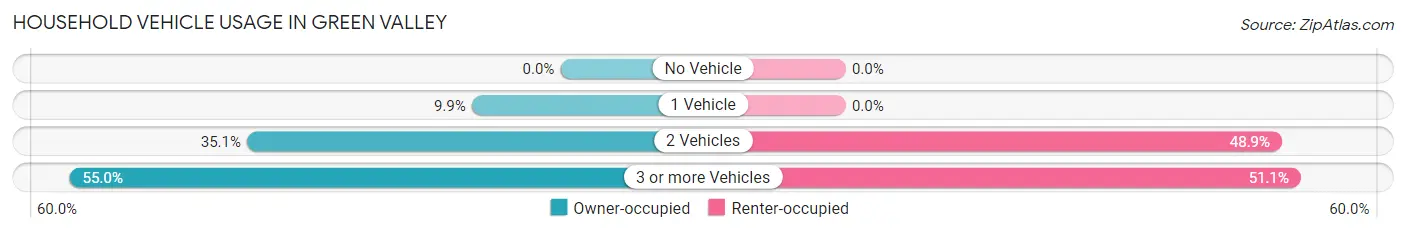
| Vehicles per Household | Owner-occupied | Renter-occupied |
| No Vehicle | 0 (0.0%) | 0 (0.0%) |
| 1 Vehicle | 41 (9.9%) | 0 (0.0%) |
| 2 Vehicles | 145 (35.1%) | 23 (48.9%) |
| 3 or more Vehicles | 227 (55.0%) | 24 (51.1%) |
| Total | 413 (100.0%) | 47 (100.0%) |
Real Estate & Mortgages in Green Valley
Real Estate and Mortgage Overview in Green Valley
| Characteristic | Without Mortgage | With Mortgage |
| Housing Units | 168 | 245 |
| Median Property Value | - | - |
| Median Household Income | $54,773 | $27 |
| Monthly Housing Costs | $479 | $0 |
| Real Estate Taxes | - | - |
Property Value by Mortgage Status in Green Valley
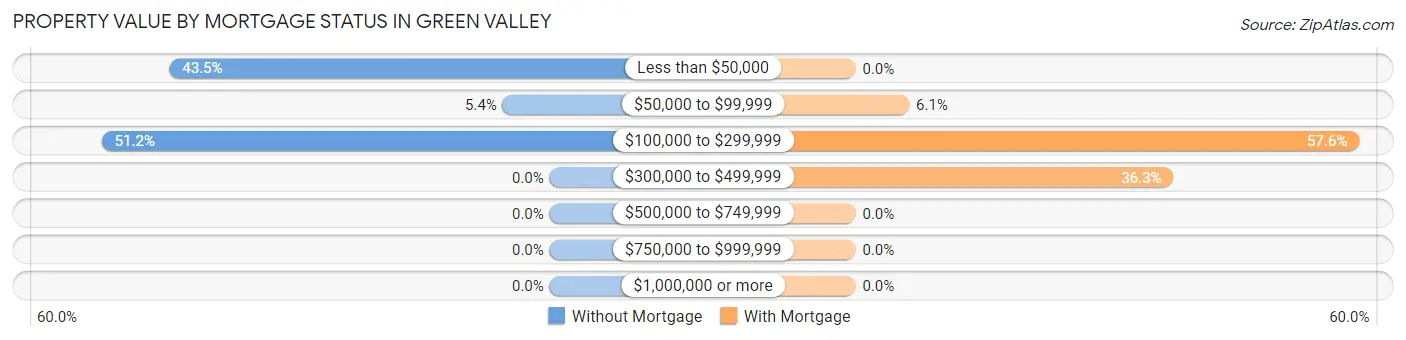
| Property Value | Without Mortgage | With Mortgage |
| Less than $50,000 | 73 (43.4%) | 0 (0.0%) |
| $50,000 to $99,999 | 9 (5.4%) | 15 (6.1%) |
| $100,000 to $299,999 | 86 (51.2%) | 141 (57.6%) |
| $300,000 to $499,999 | 0 (0.0%) | 89 (36.3%) |
| $500,000 to $749,999 | 0 (0.0%) | 0 (0.0%) |
| $750,000 to $999,999 | 0 (0.0%) | 0 (0.0%) |
| $1,000,000 or more | 0 (0.0%) | 0 (0.0%) |
| Total | 168 (100.0%) | 245 (100.0%) |
Household Income by Mortgage Status in Green Valley
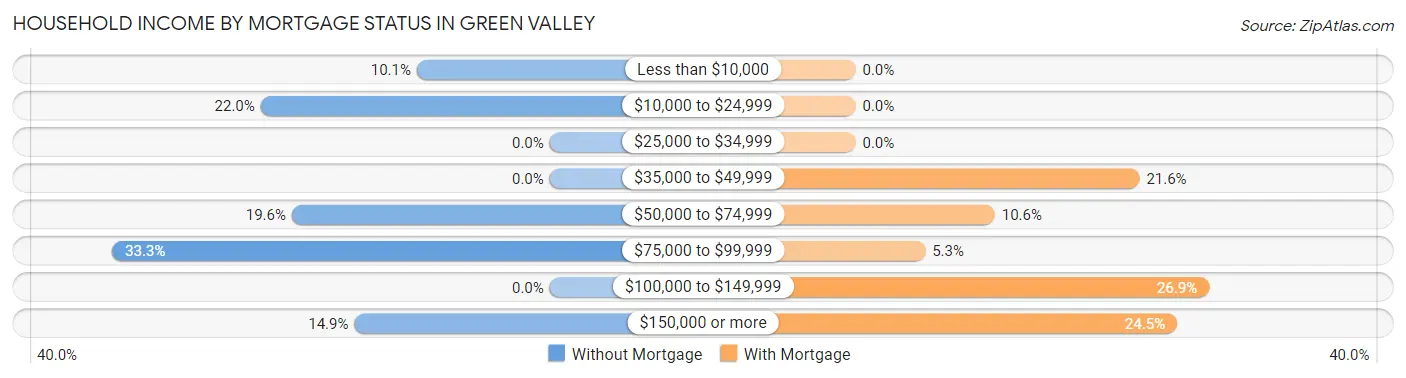
| Household Income | Without Mortgage | With Mortgage |
| Less than $10,000 | 17 (10.1%) | 0 (0.0%) |
| $10,000 to $24,999 | 37 (22.0%) | 0 (0.0%) |
| $25,000 to $34,999 | 0 (0.0%) | 0 (0.0%) |
| $35,000 to $49,999 | 0 (0.0%) | 53 (21.6%) |
| $50,000 to $74,999 | 33 (19.6%) | 26 (10.6%) |
| $75,000 to $99,999 | 56 (33.3%) | 13 (5.3%) |
| $100,000 to $149,999 | 0 (0.0%) | 66 (26.9%) |
| $150,000 or more | 25 (14.9%) | 60 (24.5%) |
| Total | 168 (100.0%) | 245 (100.0%) |
Property Value to Household Income Ratio in Green Valley
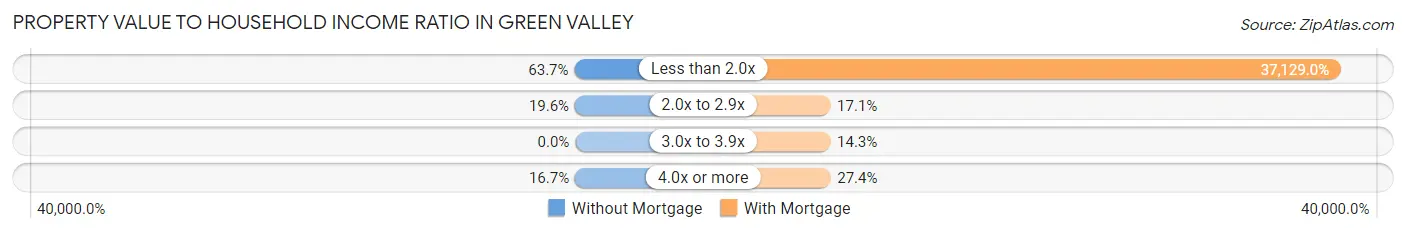
| Value-to-Income Ratio | Without Mortgage | With Mortgage |
| Less than 2.0x | 107 (63.7%) | 90,966 (37,129.0%) |
| 2.0x to 2.9x | 33 (19.6%) | 42 (17.1%) |
| 3.0x to 3.9x | 0 (0.0%) | 35 (14.3%) |
| 4.0x or more | 28 (16.7%) | 67 (27.4%) |
| Total | 168 (100.0%) | 245 (100.0%) |
Real Estate Taxes by Mortgage Status in Green Valley
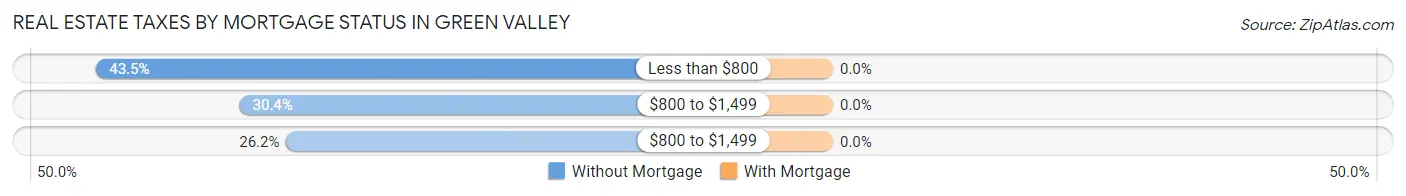
| Property Taxes | Without Mortgage | With Mortgage |
| Less than $800 | 73 (43.4%) | 0 (0.0%) |
| $800 to $1,499 | 51 (30.4%) | 0 (0.0%) |
| $800 to $1,499 | 44 (26.2%) | 0 (0.0%) |
| Total | 168 (100.0%) | 245 (100.0%) |
Health & Disability in Green Valley
Health Insurance Coverage by Age in Green Valley
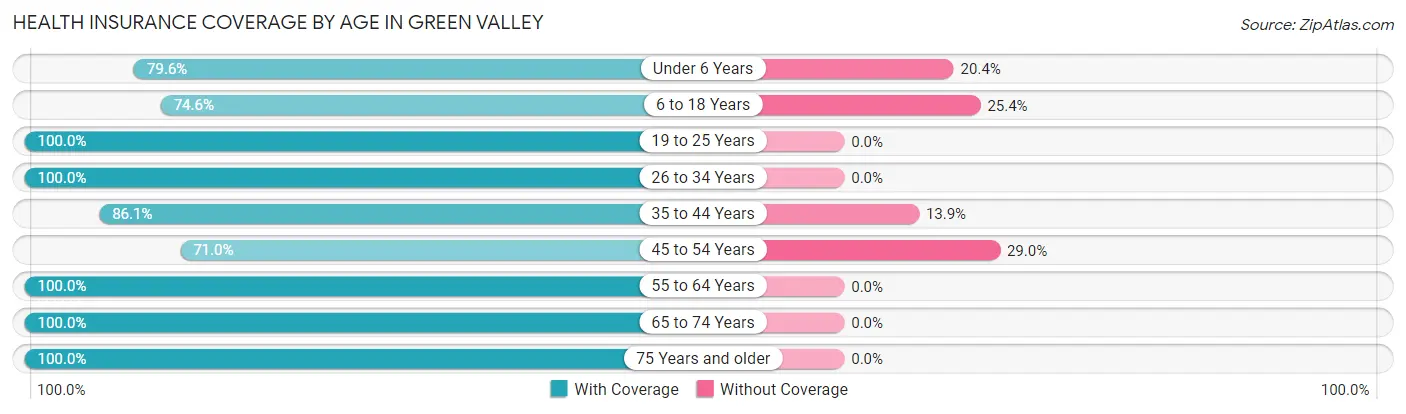
| Age Bracket | With Coverage | Without Coverage |
| Under 6 Years | 121 (79.6%) | 31 (20.4%) |
| 6 to 18 Years | 241 (74.6%) | 82 (25.4%) |
| 19 to 25 Years | 42 (100.0%) | 0 (0.0%) |
| 26 to 34 Years | 133 (100.0%) | 0 (0.0%) |
| 35 to 44 Years | 136 (86.1%) | 22 (13.9%) |
| 45 to 54 Years | 66 (71.0%) | 27 (29.0%) |
| 55 to 64 Years | 240 (100.0%) | 0 (0.0%) |
| 65 to 74 Years | 81 (100.0%) | 0 (0.0%) |
| 75 Years and older | 79 (100.0%) | 0 (0.0%) |
| Total | 1,139 (87.5%) | 162 (12.4%) |
Health Insurance Coverage by Citizenship Status in Green Valley
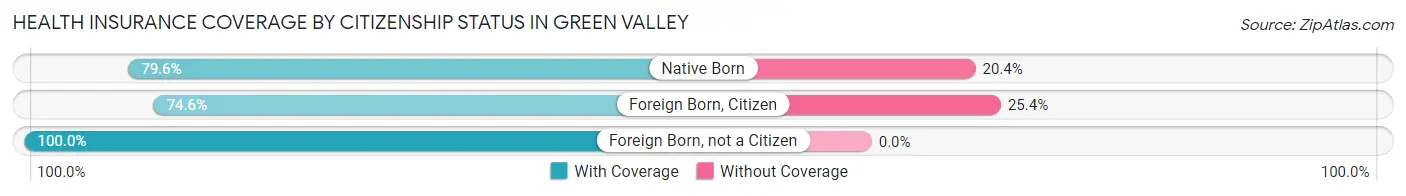
| Citizenship Status | With Coverage | Without Coverage |
| Native Born | 121 (79.6%) | 31 (20.4%) |
| Foreign Born, Citizen | 241 (74.6%) | 82 (25.4%) |
| Foreign Born, not a Citizen | 42 (100.0%) | 0 (0.0%) |
Health Insurance Coverage by Household Income in Green Valley
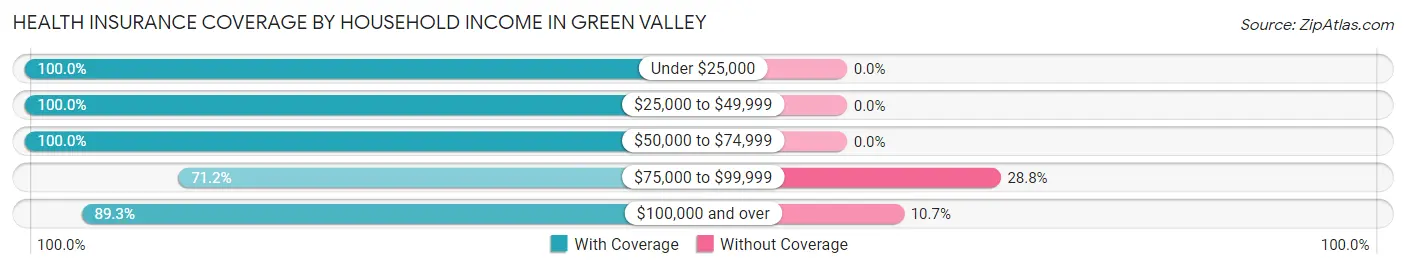
| Household Income | With Coverage | Without Coverage |
| Under $25,000 | 65 (100.0%) | 0 (0.0%) |
| $25,000 to $49,999 | 262 (100.0%) | 0 (0.0%) |
| $50,000 to $74,999 | 128 (100.0%) | 0 (0.0%) |
| $75,000 to $99,999 | 282 (71.2%) | 114 (28.8%) |
| $100,000 and over | 402 (89.3%) | 48 (10.7%) |
Public vs Private Health Insurance Coverage by Age in Green Valley
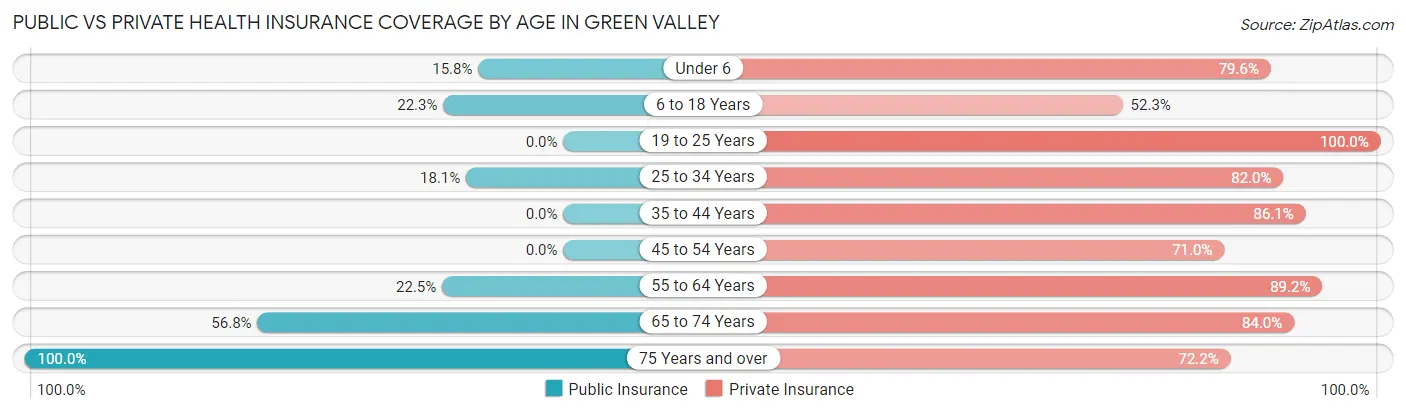
| Age Bracket | Public Insurance | Private Insurance |
| Under 6 | 24 (15.8%) | 121 (79.6%) |
| 6 to 18 Years | 72 (22.3%) | 169 (52.3%) |
| 19 to 25 Years | 0 (0.0%) | 42 (100.0%) |
| 25 to 34 Years | 24 (18.0%) | 109 (82.0%) |
| 35 to 44 Years | 0 (0.0%) | 136 (86.1%) |
| 45 to 54 Years | 0 (0.0%) | 66 (71.0%) |
| 55 to 64 Years | 54 (22.5%) | 214 (89.2%) |
| 65 to 74 Years | 46 (56.8%) | 68 (84.0%) |
| 75 Years and over | 79 (100.0%) | 57 (72.2%) |
| Total | 299 (23.0%) | 982 (75.5%) |
Disability Status by Sex by Age in Green Valley
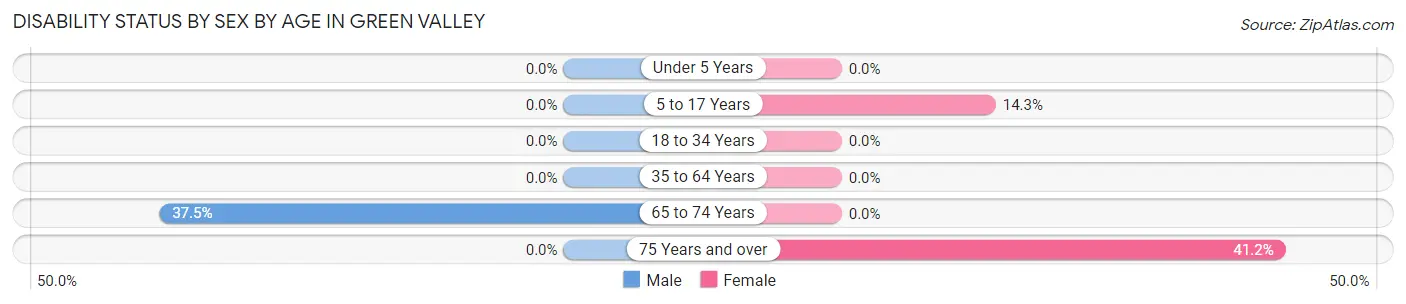
| Age Bracket | Male | Female |
| Under 5 Years | 0 (0.0%) | 0 (0.0%) |
| 5 to 17 Years | 0 (0.0%) | 26 (14.3%) |
| 18 to 34 Years | 0 (0.0%) | 0 (0.0%) |
| 35 to 64 Years | 0 (0.0%) | 0 (0.0%) |
| 65 to 74 Years | 9 (37.5%) | 0 (0.0%) |
| 75 Years and over | 0 (0.0%) | 28 (41.2%) |
Disability Class by Sex by Age in Green Valley
Disability Class: Hearing Difficulty
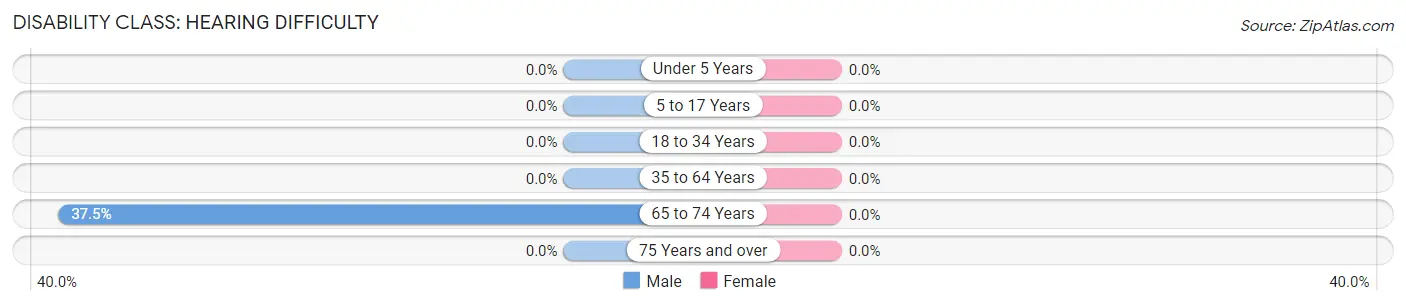
| Age Bracket | Male | Female |
| Under 5 Years | 0 (0.0%) | 0 (0.0%) |
| 5 to 17 Years | 0 (0.0%) | 0 (0.0%) |
| 18 to 34 Years | 0 (0.0%) | 0 (0.0%) |
| 35 to 64 Years | 0 (0.0%) | 0 (0.0%) |
| 65 to 74 Years | 9 (37.5%) | 0 (0.0%) |
| 75 Years and over | 0 (0.0%) | 0 (0.0%) |
Disability Class: Vision Difficulty
| Age Bracket | Male | Female |
| Under 5 Years | 0 (0.0%) | 0 (0.0%) |
| 5 to 17 Years | 0 (0.0%) | 0 (0.0%) |
| 18 to 34 Years | 0 (0.0%) | 0 (0.0%) |
| 35 to 64 Years | 0 (0.0%) | 0 (0.0%) |
| 65 to 74 Years | 0 (0.0%) | 0 (0.0%) |
| 75 Years and over | 0 (0.0%) | 0 (0.0%) |
Disability Class: Cognitive Difficulty
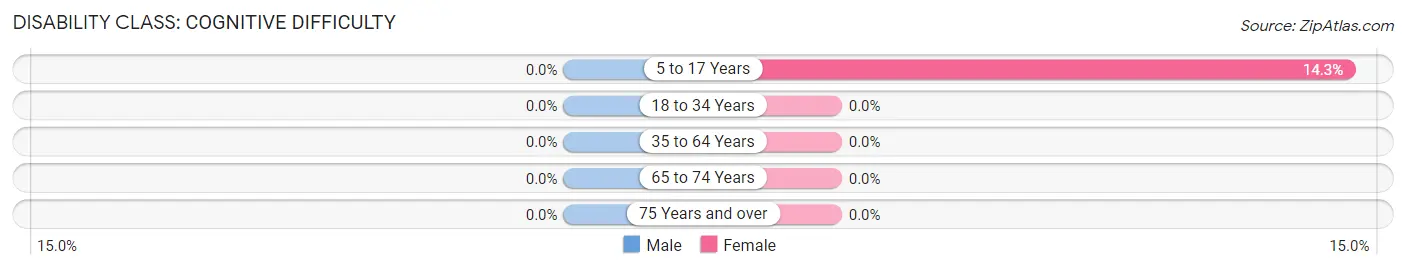
| Age Bracket | Male | Female |
| 5 to 17 Years | 0 (0.0%) | 26 (14.3%) |
| 18 to 34 Years | 0 (0.0%) | 0 (0.0%) |
| 35 to 64 Years | 0 (0.0%) | 0 (0.0%) |
| 65 to 74 Years | 0 (0.0%) | 0 (0.0%) |
| 75 Years and over | 0 (0.0%) | 0 (0.0%) |
Disability Class: Ambulatory Difficulty
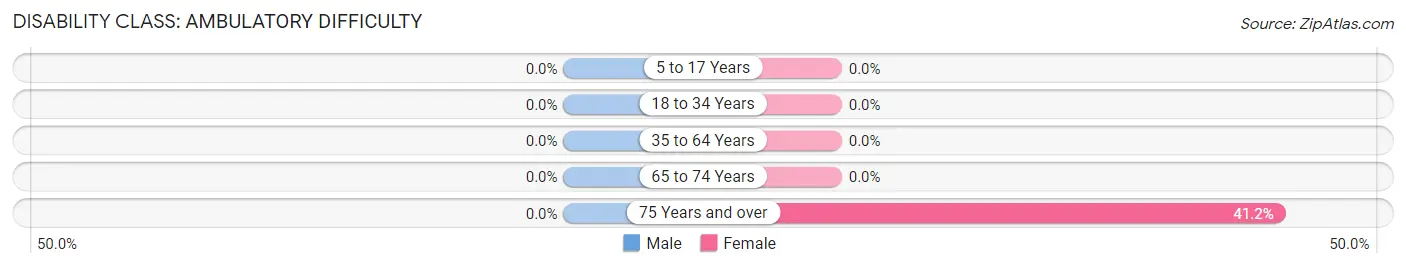
| Age Bracket | Male | Female |
| 5 to 17 Years | 0 (0.0%) | 0 (0.0%) |
| 18 to 34 Years | 0 (0.0%) | 0 (0.0%) |
| 35 to 64 Years | 0 (0.0%) | 0 (0.0%) |
| 65 to 74 Years | 0 (0.0%) | 0 (0.0%) |
| 75 Years and over | 0 (0.0%) | 28 (41.2%) |
Disability Class: Self-Care Difficulty
| Age Bracket | Male | Female |
| 5 to 17 Years | 0 (0.0%) | 0 (0.0%) |
| 18 to 34 Years | 0 (0.0%) | 0 (0.0%) |
| 35 to 64 Years | 0 (0.0%) | 0 (0.0%) |
| 65 to 74 Years | 0 (0.0%) | 0 (0.0%) |
| 75 Years and over | 0 (0.0%) | 0 (0.0%) |
Technology Access in Green Valley
Computing Device Access in Green Valley
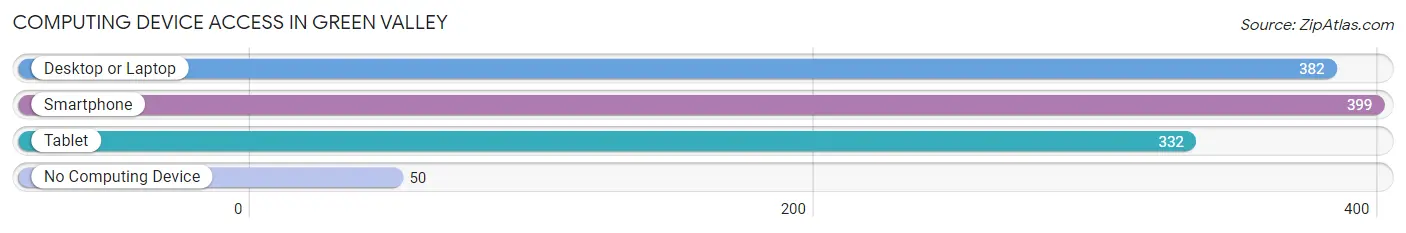
| Device Type | # Households | % Households |
| Desktop or Laptop | 382 | 83.0% |
| Smartphone | 399 | 86.7% |
| Tablet | 332 | 72.2% |
| No Computing Device | 50 | 10.9% |
| Total | 460 | 100.0% |
Internet Access in Green Valley
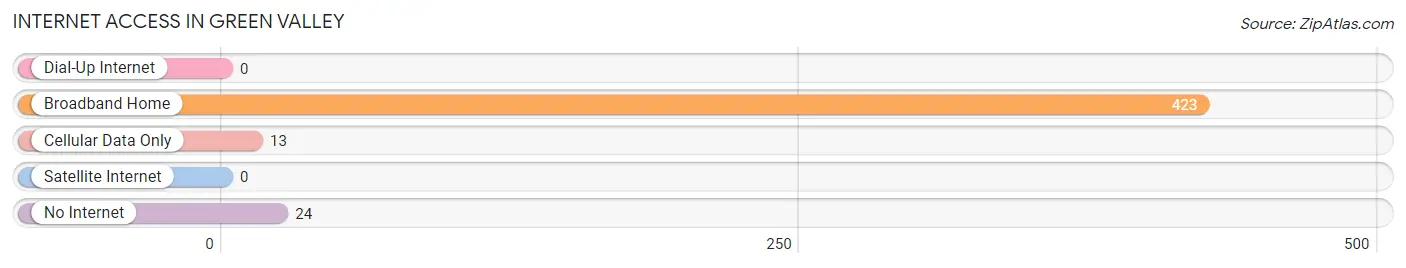
| Internet Type | # Households | % Households |
| Dial-Up Internet | 0 | 0.0% |
| Broadband Home | 423 | 92.0% |
| Cellular Data Only | 13 | 2.8% |
| Satellite Internet | 0 | 0.0% |
| No Internet | 24 | 5.2% |
| Total | 460 | 100.0% |
Green Valley Summary
History
The area now known as Green Valley, South Dakota was first inhabited by the Sioux Indians. The Sioux were a nomadic tribe that moved around the area, hunting and gathering food. They were eventually pushed out of the area by the United States government in the late 1800s.
The first settlers to the area were homesteaders who arrived in the late 1800s. These settlers were mostly of German and Scandinavian descent. They established farms and ranches in the area and began to build a community.
The town of Green Valley was officially founded in 1891. It was named after the lush green valley that surrounded the town. The town quickly grew and by the early 1900s it had a population of over 500 people.
The town was a thriving agricultural community and was home to several businesses, including a bank, a hotel, a general store, and a post office. The town also had a school, a church, and a newspaper.
The town continued to grow and by the 1950s it had a population of over 1,000 people. The town was home to several businesses, including a grocery store, a hardware store, and a movie theater.
Geography
Green Valley is located in the southeastern corner of South Dakota, in the Black Hills region. The town is situated in a valley surrounded by rolling hills and is located at an elevation of 4,000 feet.
The town is located near the Cheyenne River, which is a tributary of the Missouri River. The town is also located near the Badlands National Park, which is a popular tourist destination.
The climate in Green Valley is semi-arid, with hot summers and cold winters. The average annual temperature is around 50 degrees Fahrenheit. The average annual precipitation is around 16 inches.
Economy
The economy of Green Valley is largely based on agriculture. The town is home to several farms and ranches, which produce a variety of crops, including wheat, corn, and hay.
The town is also home to several businesses, including a grocery store, a hardware store, and a movie theater. The town is also home to several restaurants, bars, and other businesses.
The town is also home to several tourist attractions, including the Badlands National Park and the Cheyenne River. These attractions bring in tourists from all over the country, which helps to boost the local economy.
Demographics
As of the 2010 census, the population of Green Valley was 1,093. The population is mostly white, with a small percentage of Native American and African American residents. The median age of the population is 44.
The median household income in Green Valley is $41,250. The median home value is $117,000. The town has a poverty rate of 11.3%.
Conclusion
Green Valley, South Dakota is a small town located in the Black Hills region of South Dakota. The town has a long history, dating back to the late 1800s when it was first settled by homesteaders. The town is largely based on agriculture, with several farms and ranches in the area. The town is also home to several tourist attractions, which help to boost the local economy. The population of Green Valley is mostly white, with a small percentage of Native American and African American residents. The median household income in Green Valley is $41,250 and the median home value is $117,000.
Common Questions
What is Per Capita Income in Green Valley?
Per Capita income in Green Valley is $29,105.
What is the Median Family Income in Green Valley?
Median Family Income in Green Valley is $89,830.
What is the Median Household income in Green Valley?
Median Household Income in Green Valley is $87,955.
What is Income or Wage Gap in Green Valley?
Income or Wage Gap in Green Valley is 57.3%.
Women in Green Valley earn 42.7 cents for every dollar earned by a man.
What is Inequality or Gini Index in Green Valley?
Inequality or Gini Index in Green Valley is 0.32.
What is the Total Population of Green Valley?
Total Population of Green Valley is 1,353.
What is the Total Male Population of Green Valley?
Total Male Population of Green Valley is 621.
What is the Total Female Population of Green Valley?
Total Female Population of Green Valley is 732.
What is the Ratio of Males per 100 Females in Green Valley?
There are 84.84 Males per 100 Females in Green Valley.
What is the Ratio of Females per 100 Males in Green Valley?
There are 117.87 Females per 100 Males in Green Valley.
What is the Median Population Age in Green Valley?
Median Population Age in Green Valley is 35.0 Years.
What is the Average Family Size in Green Valley
Average Family Size in Green Valley is 3.2 People.
What is the Average Household Size in Green Valley
Average Household Size in Green Valley is 2.9 People.
How Large is the Labor Force in Green Valley?
There are 765 People in the Labor Forcein in Green Valley.
What is the Percentage of People in the Labor Force in Green Valley?
80.4% of People are in the Labor Force in Green Valley.