Zip Codes with the Highest Percentage of Population with a Degree in Liberal Arts and History in Greenwood, SC
RELATED REPORTS & OPTIONS
Liberal Arts and History
Greenwood
Compare Zip Codes
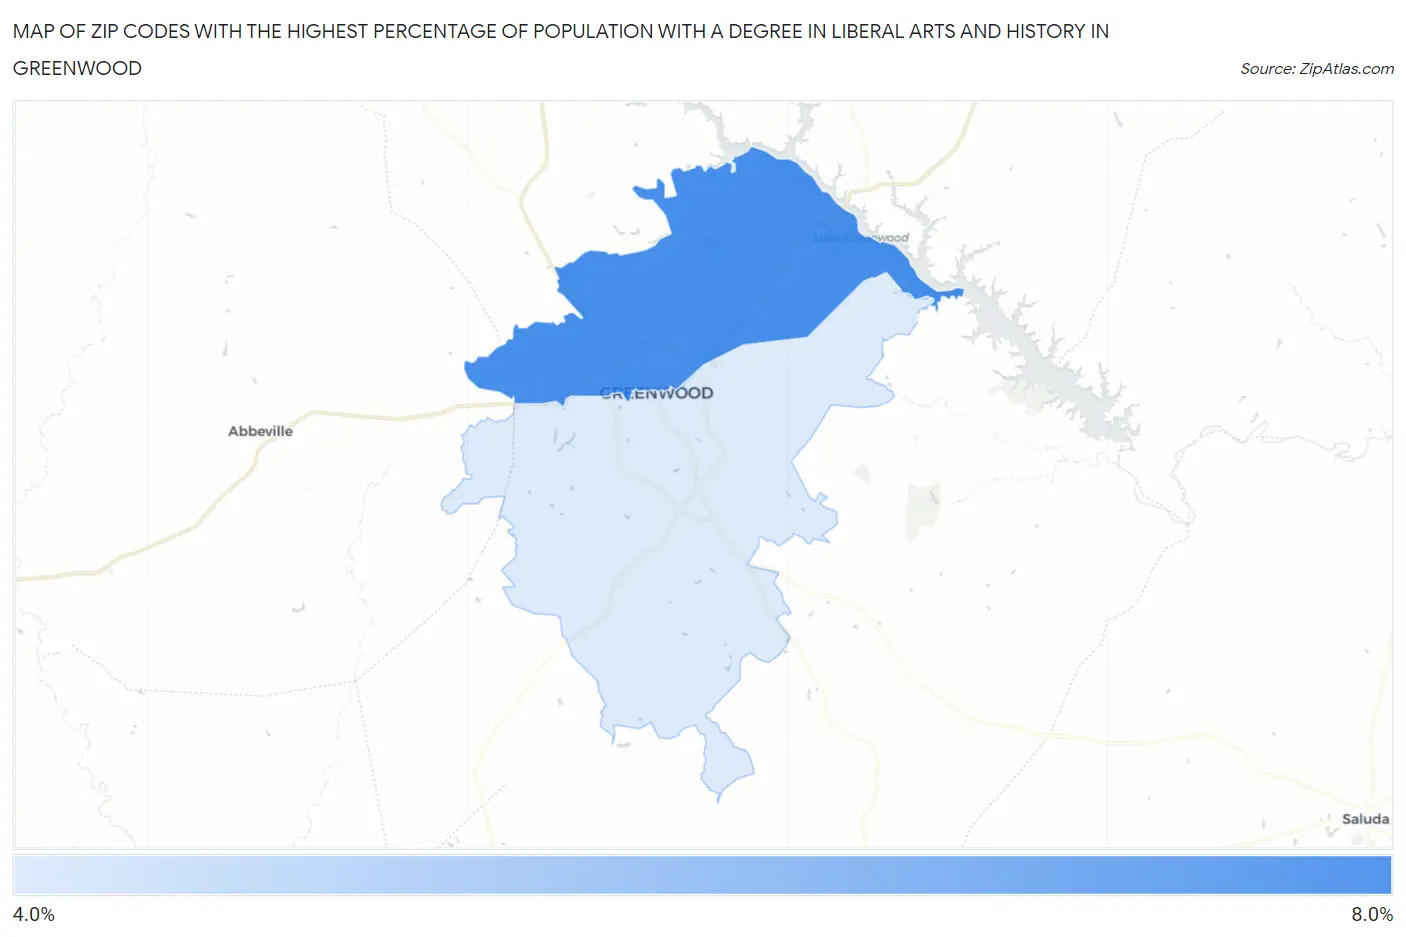
Map of Zip Codes with the Highest Percentage of Population with a Degree in Liberal Arts and History in Greenwood
4.4%
7.2%
Zip Codes with the Highest Percentage of Population with a Degree in Liberal Arts and History in Greenwood, SC
| Zip Code | % Graduates | vs State | vs National | |
| 1. | 29649 | 7.2% | 5.2%(+1.98)#99 | 4.9%(+2.31)#6,085 |
| 2. | 29646 | 4.4% | 5.2%(-0.792)#205 | 4.9%(-0.466)#13,267 |
1
Common Questions
What are the Top Zip Codes with the Highest Percentage of Population with a Degree in Liberal Arts and History in Greenwood, SC?
Top Zip Codes with the Highest Percentage of Population with a Degree in Liberal Arts and History in Greenwood, SC are:
What zip code has the Highest Percentage of Population with a Degree in Liberal Arts and History in Greenwood, SC?
29649 has the Highest Percentage of Population with a Degree in Liberal Arts and History in Greenwood, SC with 7.2%.
What is the Percentage of Population with a Degree in Liberal Arts and History in Greenwood, SC?
Percentage of Population with a Degree in Liberal Arts and History in Greenwood is 3.1%.
What is the Percentage of Population with a Degree in Liberal Arts and History in South Carolina?
Percentage of Population with a Degree in Liberal Arts and History in South Carolina is 5.2%.
What is the Percentage of Population with a Degree in Liberal Arts and History in the United States?
Percentage of Population with a Degree in Liberal Arts and History in the United States is 4.9%.