Zip Codes with the Highest Percentage of Population with a Degree in Liberal Arts and History in Seneca, SC
RELATED REPORTS & OPTIONS
Liberal Arts and History
Seneca
Compare Zip Codes
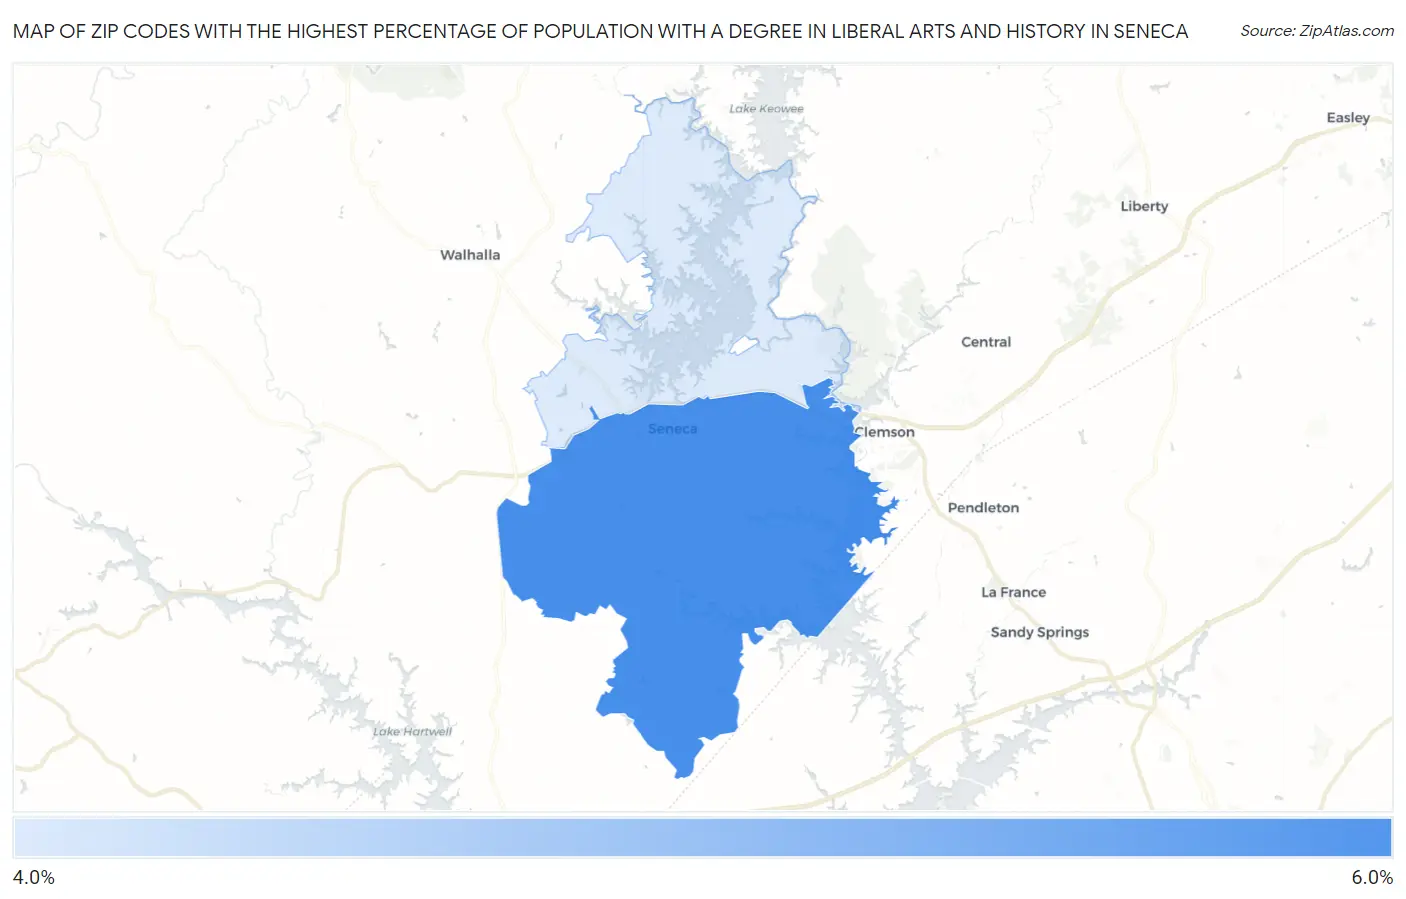
Map of Zip Codes with the Highest Percentage of Population with a Degree in Liberal Arts and History in Seneca
4.5%
5.9%
Zip Codes with the Highest Percentage of Population with a Degree in Liberal Arts and History in Seneca, SC
| Zip Code | % Graduates | vs State | vs National | |
| 1. | 29678 | 5.9% | 5.2%(+0.708)#134 | 4.9%(+1.03)#8,760 |
| 2. | 29672 | 4.5% | 5.2%(-0.655)#198 | 4.9%(-0.329)#12,846 |
1
Common Questions
What are the Top Zip Codes with the Highest Percentage of Population with a Degree in Liberal Arts and History in Seneca, SC?
Top Zip Codes with the Highest Percentage of Population with a Degree in Liberal Arts and History in Seneca, SC are:
What zip code has the Highest Percentage of Population with a Degree in Liberal Arts and History in Seneca, SC?
29678 has the Highest Percentage of Population with a Degree in Liberal Arts and History in Seneca, SC with 5.9%.
What is the Percentage of Population with a Degree in Liberal Arts and History in Seneca, SC?
Percentage of Population with a Degree in Liberal Arts and History in Seneca is 9.8%.
What is the Percentage of Population with a Degree in Liberal Arts and History in South Carolina?
Percentage of Population with a Degree in Liberal Arts and History in South Carolina is 5.2%.
What is the Percentage of Population with a Degree in Liberal Arts and History in the United States?
Percentage of Population with a Degree in Liberal Arts and History in the United States is 4.9%.