Zip Codes with the Highest Percentage of Population with a Degree in Liberal Arts and History in North Augusta, SC
RELATED REPORTS & OPTIONS
Liberal Arts and History
North Augusta
Compare Zip Codes
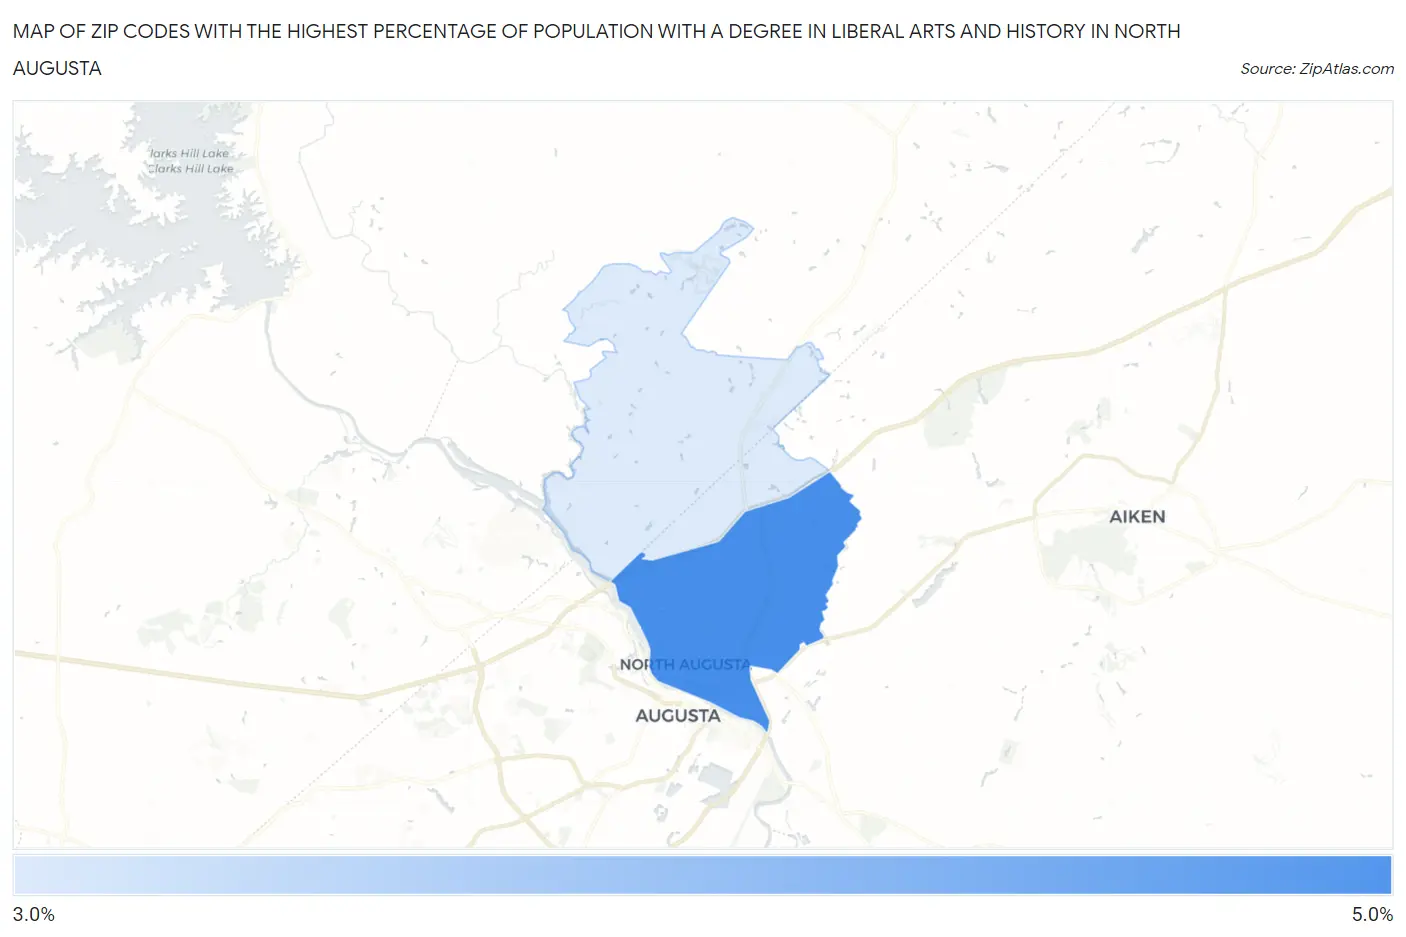
Map of Zip Codes with the Highest Percentage of Population with a Degree in Liberal Arts and History in North Augusta
3.6%
4.9%
Zip Codes with the Highest Percentage of Population with a Degree in Liberal Arts and History in North Augusta, SC
| Zip Code | % Graduates | vs State | vs National | |
| 1. | 29841 | 4.9% | 5.2%(-0.264)#181 | 4.9%(+0.062)#11,543 |
| 2. | 29860 | 3.6% | 5.2%(-1.57)#239 | 4.9%(-1.24)#16,129 |
1
Common Questions
What are the Top Zip Codes with the Highest Percentage of Population with a Degree in Liberal Arts and History in North Augusta, SC?
Top Zip Codes with the Highest Percentage of Population with a Degree in Liberal Arts and History in North Augusta, SC are:
What zip code has the Highest Percentage of Population with a Degree in Liberal Arts and History in North Augusta, SC?
29841 has the Highest Percentage of Population with a Degree in Liberal Arts and History in North Augusta, SC with 4.9%.
What is the Percentage of Population with a Degree in Liberal Arts and History in North Augusta, SC?
Percentage of Population with a Degree in Liberal Arts and History in North Augusta is 3.9%.
What is the Percentage of Population with a Degree in Liberal Arts and History in South Carolina?
Percentage of Population with a Degree in Liberal Arts and History in South Carolina is 5.2%.
What is the Percentage of Population with a Degree in Liberal Arts and History in the United States?
Percentage of Population with a Degree in Liberal Arts and History in the United States is 4.9%.