Zip Codes with the Highest Percentage of Population with a Degree in Liberal Arts and History in North Charleston, SC
RELATED REPORTS & OPTIONS
Liberal Arts and History
North Charleston
Compare Zip Codes
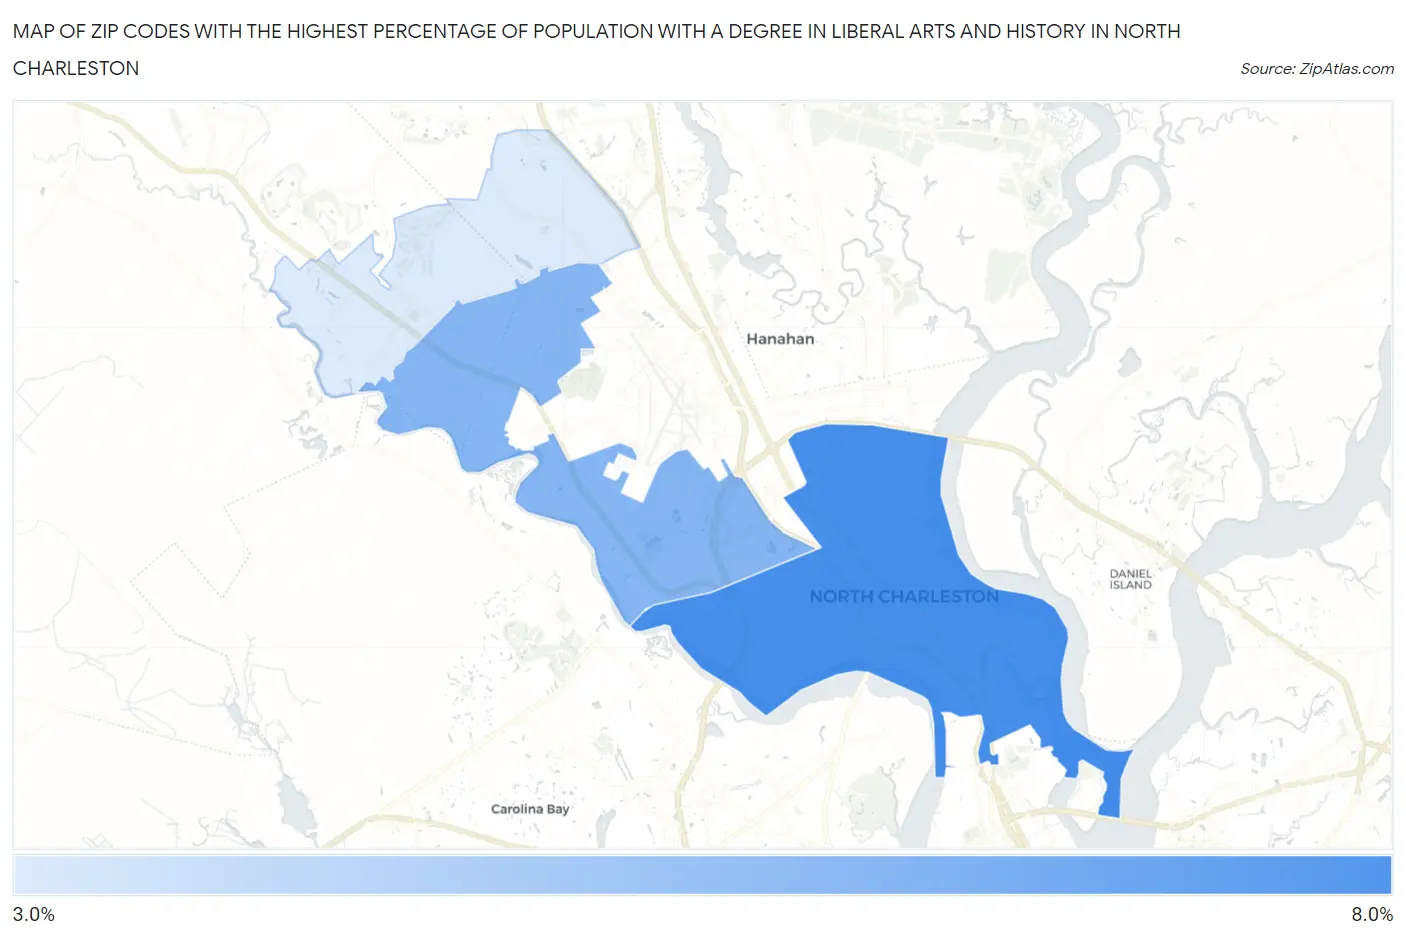
Map of Zip Codes with the Highest Percentage of Population with a Degree in Liberal Arts and History in North Charleston
3.8%
7.1%
Zip Codes with the Highest Percentage of Population with a Degree in Liberal Arts and History in North Charleston, SC
| Zip Code | % Graduates | vs State | vs National | |
| 1. | 29405 | 7.1% | 5.2%(+1.93)#100 | 4.9%(+2.26)#6,189 |
| 2. | 29418 | 5.7% | 5.2%(+0.514)#143 | 4.9%(+0.841)#9,275 |
| 3. | 29420 | 3.8% | 5.2%(-1.43)#233 | 4.9%(-1.10)#15,638 |
1
Common Questions
What are the Top Zip Codes with the Highest Percentage of Population with a Degree in Liberal Arts and History in North Charleston, SC?
Top Zip Codes with the Highest Percentage of Population with a Degree in Liberal Arts and History in North Charleston, SC are:
What zip code has the Highest Percentage of Population with a Degree in Liberal Arts and History in North Charleston, SC?
29405 has the Highest Percentage of Population with a Degree in Liberal Arts and History in North Charleston, SC with 7.1%.
What is the Percentage of Population with a Degree in Liberal Arts and History in North Charleston, SC?
Percentage of Population with a Degree in Liberal Arts and History in North Charleston is 4.8%.
What is the Percentage of Population with a Degree in Liberal Arts and History in South Carolina?
Percentage of Population with a Degree in Liberal Arts and History in South Carolina is 5.2%.
What is the Percentage of Population with a Degree in Liberal Arts and History in the United States?
Percentage of Population with a Degree in Liberal Arts and History in the United States is 4.9%.