Zip Codes with the Highest Percentage of Population with a Degree in Liberal Arts and History in Summerville, SC
RELATED REPORTS & OPTIONS
Liberal Arts and History
Summerville
Compare Zip Codes
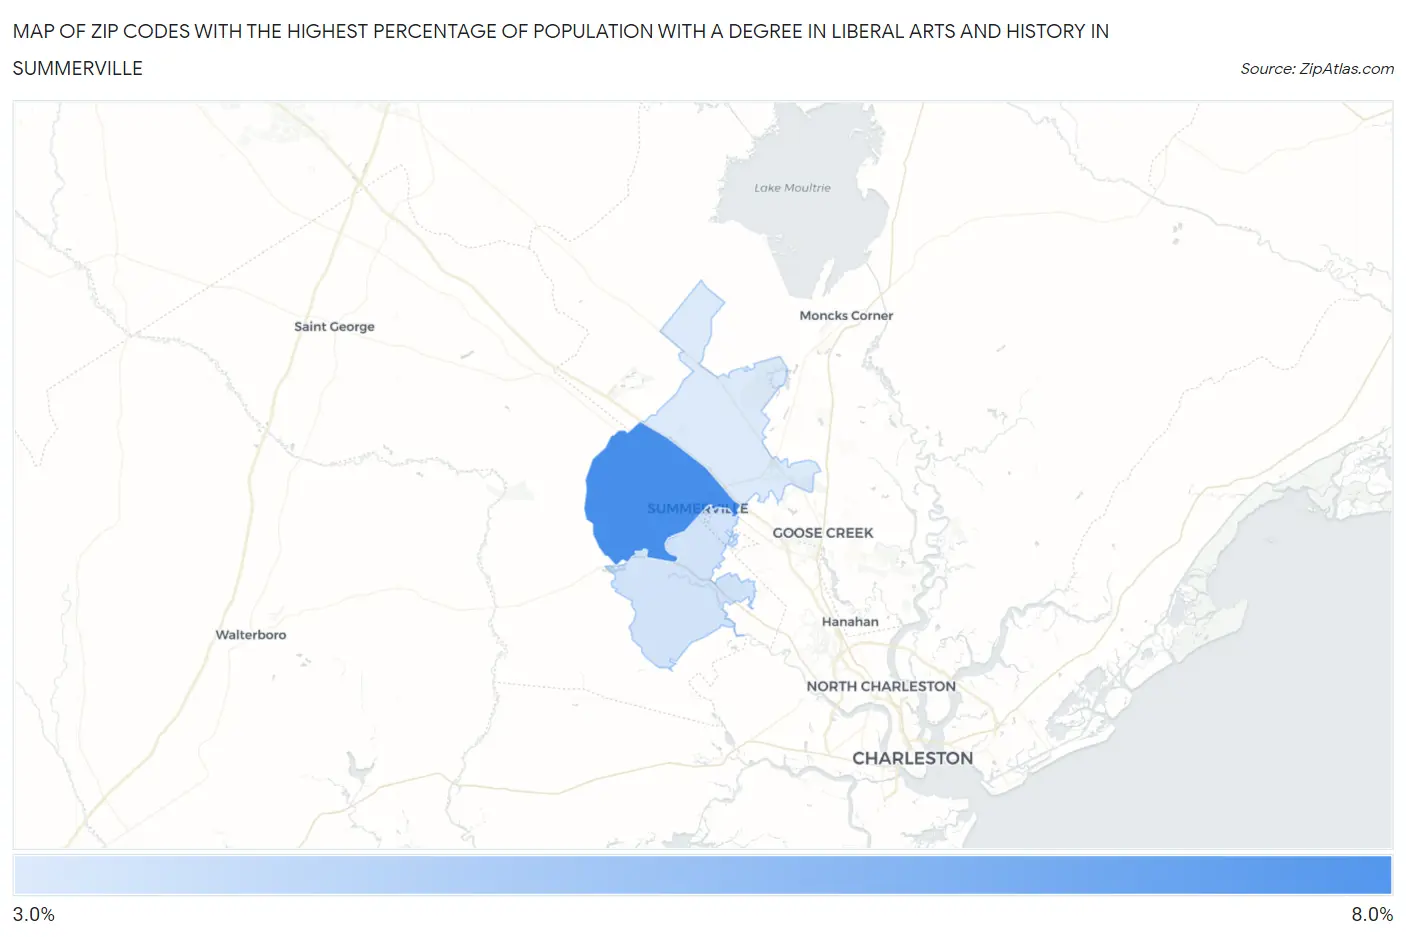
Map of Zip Codes with the Highest Percentage of Population with a Degree in Liberal Arts and History in Summerville
3.2%
6.2%
Zip Codes with the Highest Percentage of Population with a Degree in Liberal Arts and History in Summerville, SC
| Zip Code | % Graduates | vs State | vs National | |
| 1. | 29483 | 6.2% | 5.2%(+1.01)#121 | 4.9%(+1.34)#7,995 |
| 2. | 29485 | 3.4% | 5.2%(-1.81)#252 | 4.9%(-1.48)#16,992 |
| 3. | 29486 | 3.2% | 5.2%(-2.02)#261 | 4.9%(-1.69)#17,733 |
1
Common Questions
What are the Top Zip Codes with the Highest Percentage of Population with a Degree in Liberal Arts and History in Summerville, SC?
Top Zip Codes with the Highest Percentage of Population with a Degree in Liberal Arts and History in Summerville, SC are:
What zip code has the Highest Percentage of Population with a Degree in Liberal Arts and History in Summerville, SC?
29483 has the Highest Percentage of Population with a Degree in Liberal Arts and History in Summerville, SC with 6.2%.
What is the Percentage of Population with a Degree in Liberal Arts and History in Summerville, SC?
Percentage of Population with a Degree in Liberal Arts and History in Summerville is 4.5%.
What is the Percentage of Population with a Degree in Liberal Arts and History in South Carolina?
Percentage of Population with a Degree in Liberal Arts and History in South Carolina is 5.2%.
What is the Percentage of Population with a Degree in Liberal Arts and History in the United States?
Percentage of Population with a Degree in Liberal Arts and History in the United States is 4.9%.