Powers, OR Map & Demographics
Powers Map
Powers Overview
$21,628
PER CAPITA INCOME
$59,018
AVG FAMILY INCOME
$37,000
AVG HOUSEHOLD INCOME
60.6%
WAGE / INCOME GAP [ % ]
39.4¢/ $1
WAGE / INCOME GAP [ $ ]
0.45
INEQUALITY / GINI INDEX
756
TOTAL POPULATION
398
MALE POPULATION
358
FEMALE POPULATION
111.17
MALES / 100 FEMALES
89.95
FEMALES / 100 MALES
43.4
MEDIAN AGE
3.2
AVG FAMILY SIZE
2.2
AVG HOUSEHOLD SIZE
264
LABOR FORCE [ PEOPLE ]
43.1%
PERCENT IN LABOR FORCE
12.9%
UNEMPLOYMENT RATE
Powers Zip Codes
Powers Area Codes
Income in Powers
Income Overview in Powers
Per Capita Income in Powers is $21,628, while median incomes of families and households are $59,018 and $37,000 respectively.
| Characteristic | Number | Measure |
| Per Capita Income | 756 | $21,628 |
| Median Family Income | 179 | $59,018 |
| Mean Family Income | 179 | $66,098 |
| Median Household Income | 346 | $37,000 |
| Mean Household Income | 346 | $46,805 |
| Income Deficit | 179 | $0 |
| Wage / Income Gap (%) | 756 | 60.62% |
| Wage / Income Gap ($) | 756 | 39.38¢ per $1 |
| Gini / Inequality Index | 756 | 0.45 |
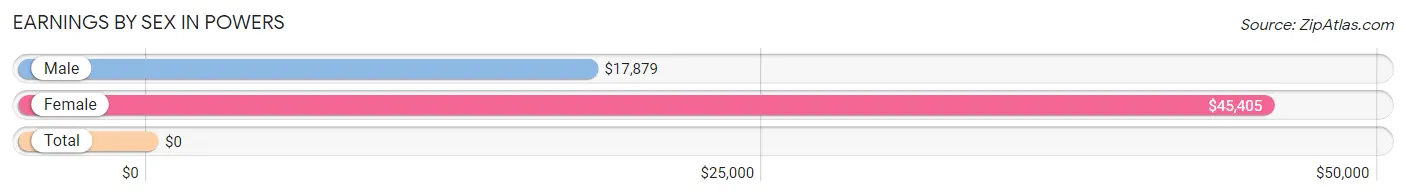
Earnings by Sex in Powers
| Sex | Number | Average Earnings |
| Male | 160 (61.5%) | $17,879 |
| Female | 100 (38.5%) | $45,405 |
| Total | 260 (100.0%) | $0 |
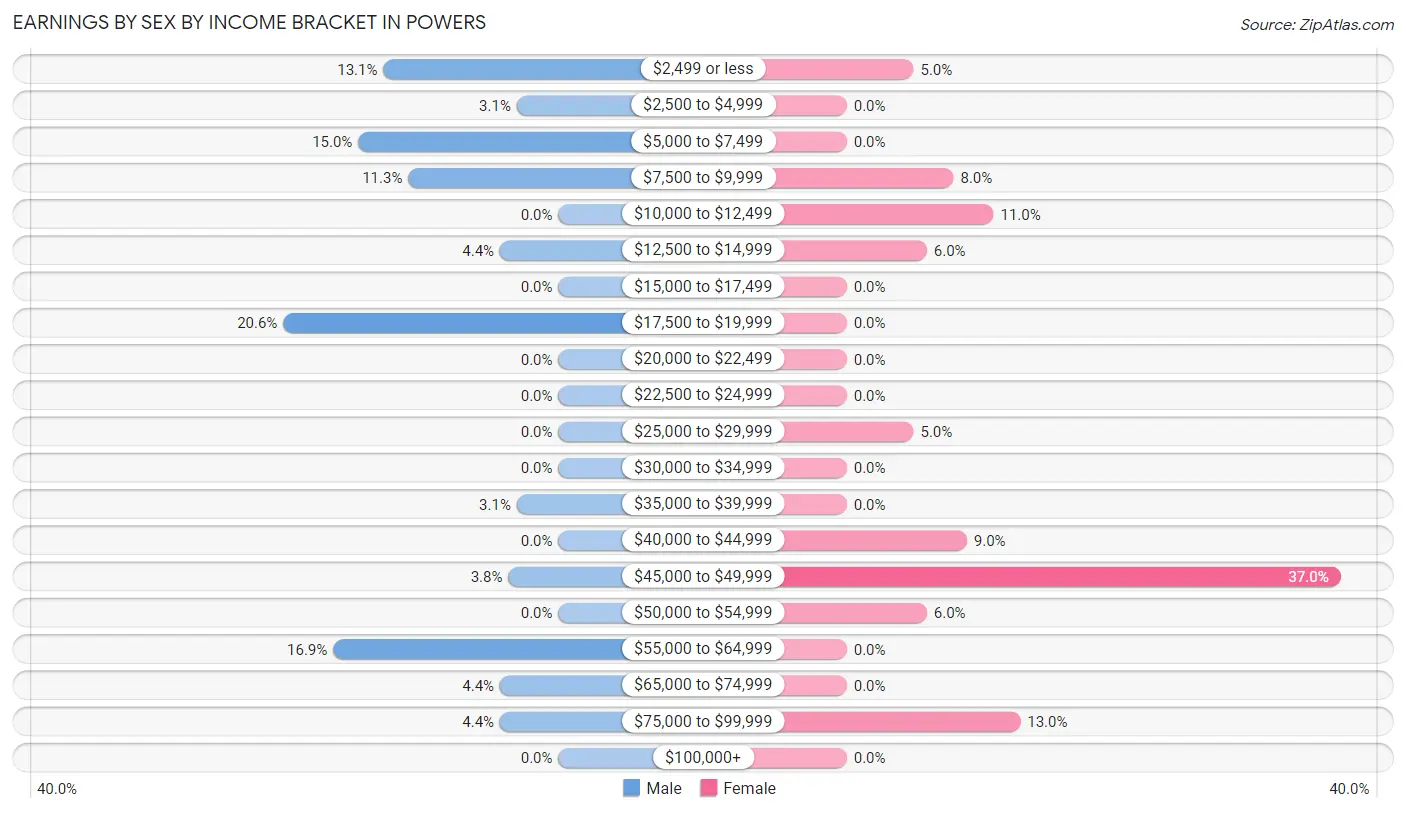
Earnings by Sex by Income Bracket in Powers
The most common earnings brackets in Powers are $17,500 to $19,999 for men (33 | 20.6%) and $45,000 to $49,999 for women (37 | 37.0%).
| Income | Male | Female |
| $2,499 or less | 21 (13.1%) | 5 (5.0%) |
| $2,500 to $4,999 | 5 (3.1%) | 0 (0.0%) |
| $5,000 to $7,499 | 24 (15.0%) | 0 (0.0%) |
| $7,500 to $9,999 | 18 (11.3%) | 8 (8.0%) |
| $10,000 to $12,499 | 0 (0.0%) | 11 (11.0%) |
| $12,500 to $14,999 | 7 (4.4%) | 6 (6.0%) |
| $15,000 to $17,499 | 0 (0.0%) | 0 (0.0%) |
| $17,500 to $19,999 | 33 (20.6%) | 0 (0.0%) |
| $20,000 to $22,499 | 0 (0.0%) | 0 (0.0%) |
| $22,500 to $24,999 | 0 (0.0%) | 0 (0.0%) |
| $25,000 to $29,999 | 0 (0.0%) | 5 (5.0%) |
| $30,000 to $34,999 | 0 (0.0%) | 0 (0.0%) |
| $35,000 to $39,999 | 5 (3.1%) | 0 (0.0%) |
| $40,000 to $44,999 | 0 (0.0%) | 9 (9.0%) |
| $45,000 to $49,999 | 6 (3.7%) | 37 (37.0%) |
| $50,000 to $54,999 | 0 (0.0%) | 6 (6.0%) |
| $55,000 to $64,999 | 27 (16.9%) | 0 (0.0%) |
| $65,000 to $74,999 | 7 (4.4%) | 0 (0.0%) |
| $75,000 to $99,999 | 7 (4.4%) | 13 (13.0%) |
| $100,000+ | 0 (0.0%) | 0 (0.0%) |
| Total | 160 (100.0%) | 100 (100.0%) |
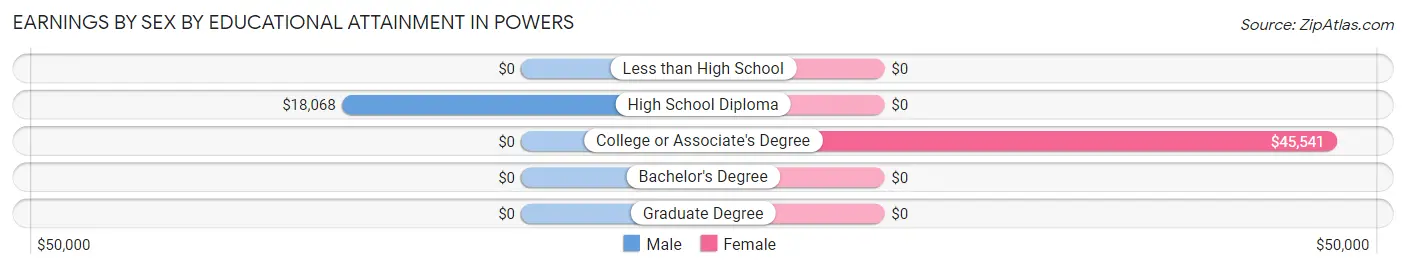
Earnings by Sex by Educational Attainment in Powers
| Educational Attainment | Male Income | Female Income |
| Less than High School | - | - |
| High School Diploma | $18,068 | $0 |
| College or Associate's Degree | - | - |
| Bachelor's Degree | - | - |
| Graduate Degree | - | - |
| Total | - | - |
Family Income in Powers
Family Income Brackets in Powers
According to the Powers family income data, there are 39 families falling into the $75,000 to $99,999 income range, which is the most common income bracket and makes up 21.8% of all families.
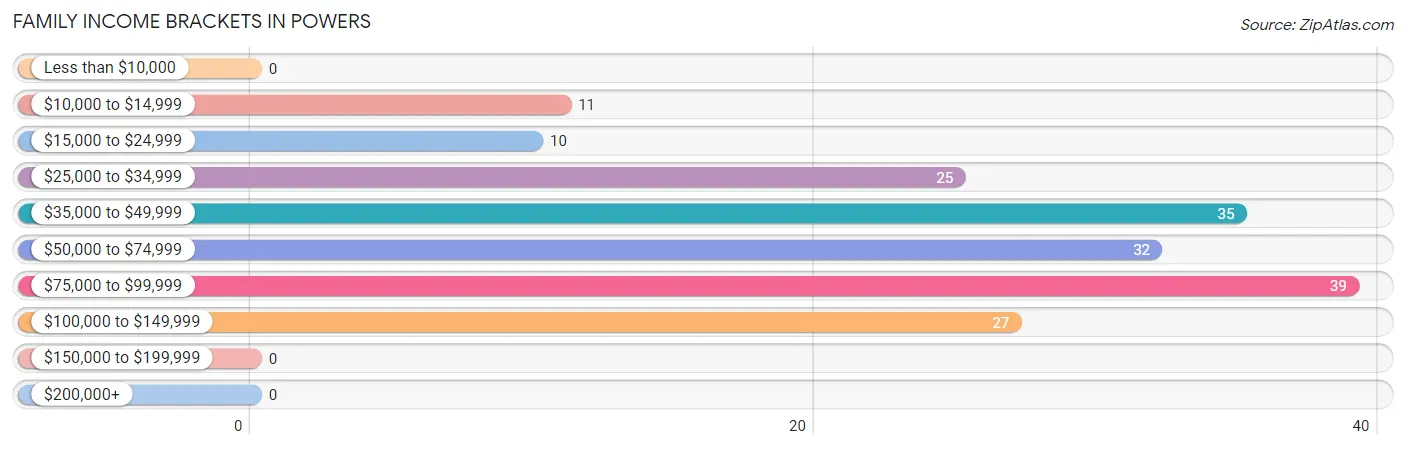
| Income Bracket | # Families | % Families |
| Less than $10,000 | 0 | 0.0% |
| $10,000 to $14,999 | 11 | 6.1% |
| $15,000 to $24,999 | 10 | 5.6% |
| $25,000 to $34,999 | 25 | 14.0% |
| $35,000 to $49,999 | 35 | 19.6% |
| $50,000 to $74,999 | 32 | 17.9% |
| $75,000 to $99,999 | 39 | 21.8% |
| $100,000 to $149,999 | 27 | 15.1% |
| $150,000 to $199,999 | 0 | 0.0% |
| $200,000+ | 0 | 0.0% |
Family Income by Famaliy Size in Powers
3-person families (47 | 26.3%) account for the highest median family income in Powers with $64,063 per family, while 3-person families (47 | 26.3%) have the highest median income of $21,354 per family member.
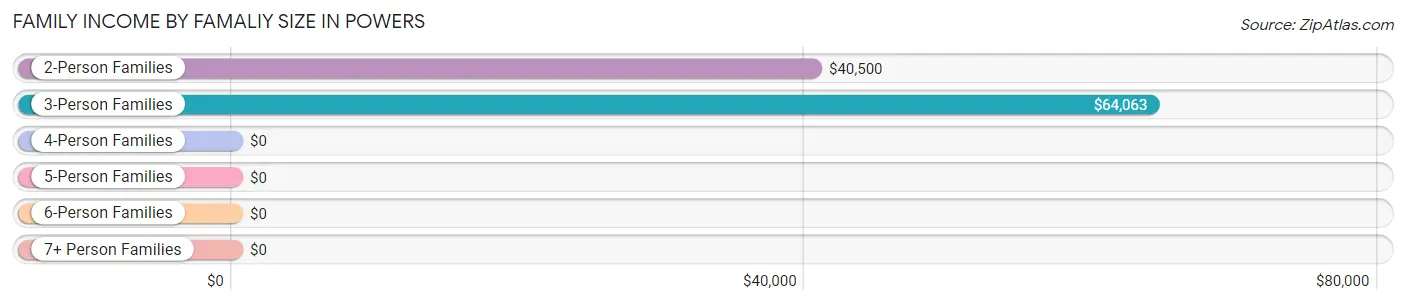
| Income Bracket | # Families | Median Income |
| 2-Person Families | 82 (45.8%) | $40,500 |
| 3-Person Families | 47 (26.3%) | $64,063 |
| 4-Person Families | 5 (2.8%) | $0 |
| 5-Person Families | 39 (21.8%) | $0 |
| 6-Person Families | 6 (3.4%) | $0 |
| 7+ Person Families | 0 (0.0%) | $0 |
| Total | 179 (100.0%) | $59,018 |
Family Income by Number of Earners in Powers
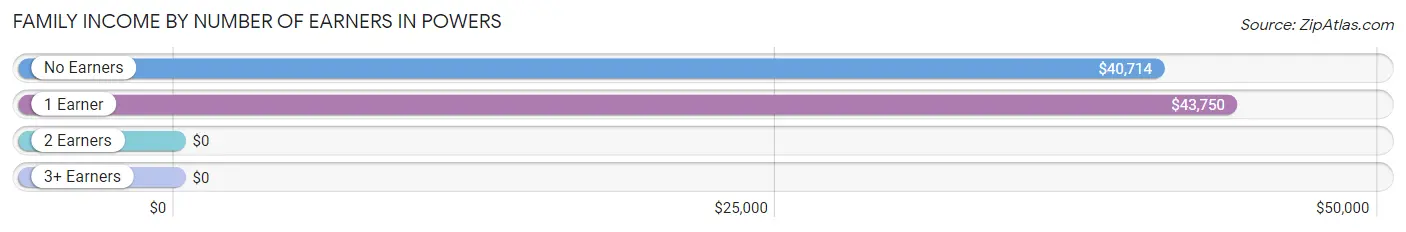
| Number of Earners | # Families | Median Income |
| No Earners | 54 (30.2%) | $40,714 |
| 1 Earner | 67 (37.4%) | $43,750 |
| 2 Earners | 19 (10.6%) | $0 |
| 3+ Earners | 39 (21.8%) | $0 |
| Total | 179 (100.0%) | $59,018 |
Household Income in Powers
Household Income Brackets in Powers
With 71 households falling in the category, the $50,000 to $74,999 income range is the most frequent in Powers, accounting for 20.5% of all households.
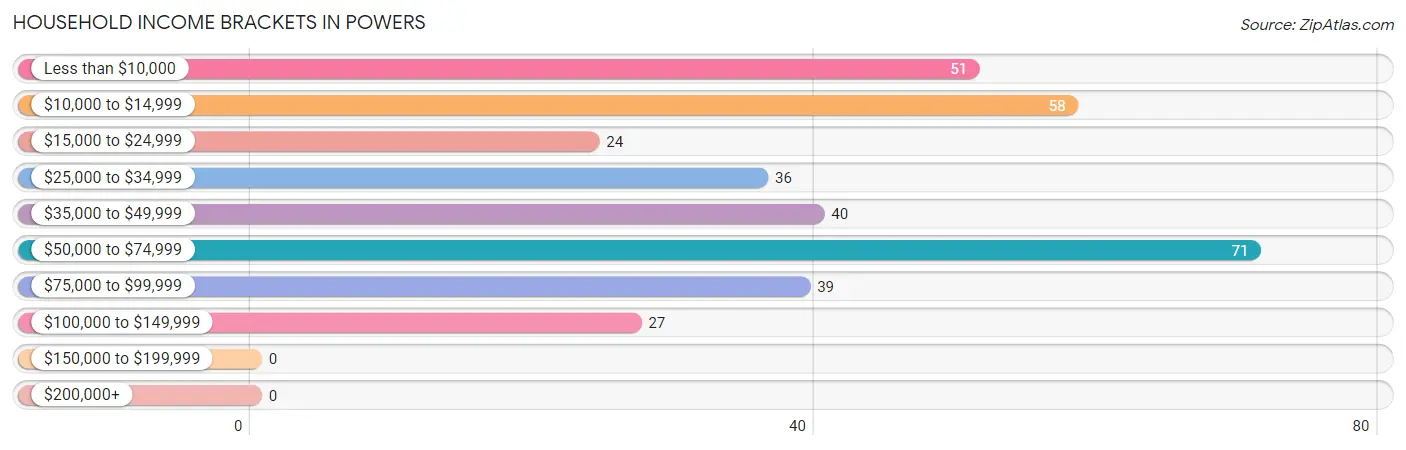
| Income Bracket | # Households | % Households |
| Less than $10,000 | 51 | 14.7% |
| $10,000 to $14,999 | 58 | 16.8% |
| $15,000 to $24,999 | 24 | 6.9% |
| $25,000 to $34,999 | 36 | 10.4% |
| $35,000 to $49,999 | 40 | 11.6% |
| $50,000 to $74,999 | 71 | 20.5% |
| $75,000 to $99,999 | 39 | 11.3% |
| $100,000 to $149,999 | 27 | 7.8% |
| $150,000 to $199,999 | 0 | 0.0% |
| $200,000+ | 0 | 0.0% |
Household Income by Householder Age in Powers
| Income Bracket | # Households | Median Income |
| 15 to 24 Years | 11 (3.2%) | $0 |
| 25 to 44 Years | 79 (22.8%) | $0 |
| 45 to 64 Years | 114 (33.0%) | $0 |
| 65+ Years | 142 (41.0%) | $0 |
| Total | 346 (100.0%) | $37,000 |
Poverty in Powers
Income Below Poverty by Sex and Age in Powers
With 17.3% poverty level for males and 16.2% for females among the residents of Powers, 25 to 34 year old males and 55 to 64 year old females are the most vulnerable to poverty, with 31 males (100.0%) and 25 females (44.6%) in their respective age groups living below the poverty level.
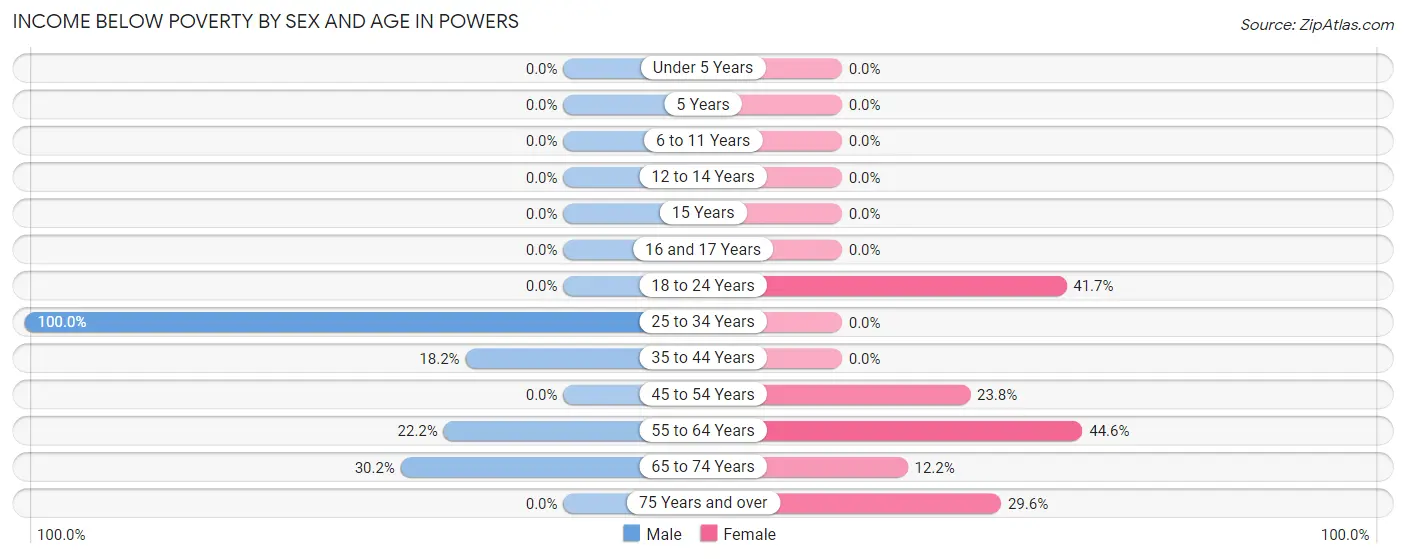
| Age Bracket | Male | Female |
| Under 5 Years | 0 (0.0%) | 0 (0.0%) |
| 5 Years | 0 (0.0%) | 0 (0.0%) |
| 6 to 11 Years | 0 (0.0%) | 0 (0.0%) |
| 12 to 14 Years | 0 (0.0%) | 0 (0.0%) |
| 15 Years | 0 (0.0%) | 0 (0.0%) |
| 16 and 17 Years | 0 (0.0%) | 0 (0.0%) |
| 18 to 24 Years | 0 (0.0%) | 5 (41.7%) |
| 25 to 34 Years | 31 (100.0%) | 0 (0.0%) |
| 35 to 44 Years | 14 (18.2%) | 0 (0.0%) |
| 45 to 54 Years | 0 (0.0%) | 10 (23.8%) |
| 55 to 64 Years | 8 (22.2%) | 25 (44.6%) |
| 65 to 74 Years | 16 (30.2%) | 5 (12.2%) |
| 75 Years and over | 0 (0.0%) | 13 (29.5%) |
| Total | 69 (17.3%) | 58 (16.2%) |
Income Above Poverty by Sex and Age in Powers
According to the poverty statistics in Powers, males aged under 5 years and females aged under 5 years are the age groups that are most secure financially, with 100.0% of males and 100.0% of females in these age groups living above the poverty line.
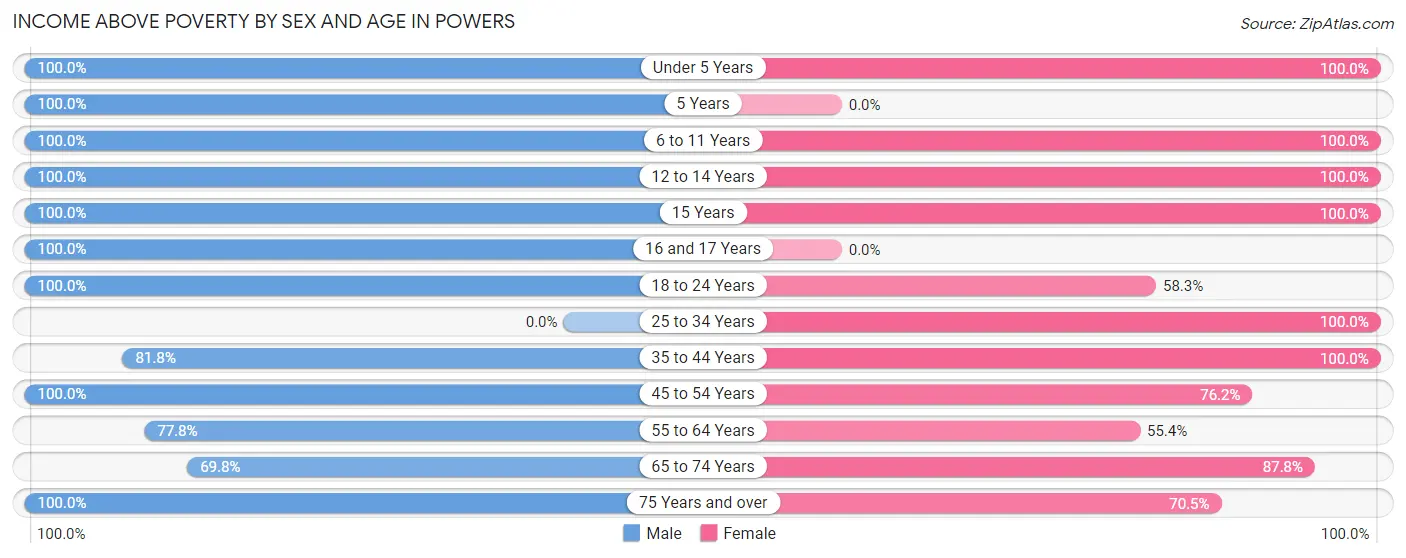
| Age Bracket | Male | Female |
| Under 5 Years | 24 (100.0%) | 10 (100.0%) |
| 5 Years | 7 (100.0%) | 0 (0.0%) |
| 6 to 11 Years | 17 (100.0%) | 56 (100.0%) |
| 12 to 14 Years | 6 (100.0%) | 3 (100.0%) |
| 15 Years | 6 (100.0%) | 14 (100.0%) |
| 16 and 17 Years | 7 (100.0%) | 0 (0.0%) |
| 18 to 24 Years | 44 (100.0%) | 7 (58.3%) |
| 25 to 34 Years | 0 (0.0%) | 8 (100.0%) |
| 35 to 44 Years | 63 (81.8%) | 72 (100.0%) |
| 45 to 54 Years | 22 (100.0%) | 32 (76.2%) |
| 55 to 64 Years | 28 (77.8%) | 31 (55.4%) |
| 65 to 74 Years | 37 (69.8%) | 36 (87.8%) |
| 75 Years and over | 68 (100.0%) | 31 (70.5%) |
| Total | 329 (82.7%) | 300 (83.8%) |
Income Below Poverty Among Married-Couple Families in Powers
| Children | Above Poverty | Below Poverty |
| No Children | 66 (100.0%) | 0 (0.0%) |
| 1 or 2 Children | 42 (100.0%) | 0 (0.0%) |
| 3 or 4 Children | 12 (100.0%) | 0 (0.0%) |
| 5 or more Children | 0 (0.0%) | 0 (0.0%) |
| Total | 120 (100.0%) | 0 (0.0%) |
Income Below Poverty Among Single-Parent Households in Powers
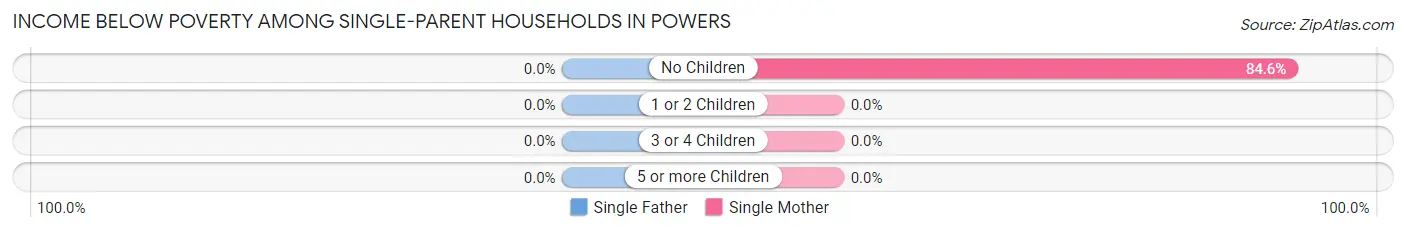
| Children | Single Father | Single Mother |
| No Children | 0 (0.0%) | 11 (84.6%) |
| 1 or 2 Children | 0 (0.0%) | 0 (0.0%) |
| 3 or 4 Children | 0 (0.0%) | 0 (0.0%) |
| 5 or more Children | 0 (0.0%) | 0 (0.0%) |
| Total | 0 (0.0%) | 11 (28.9%) |
Income Below Poverty Among Married-Couple vs Single-Parent Households in Powers
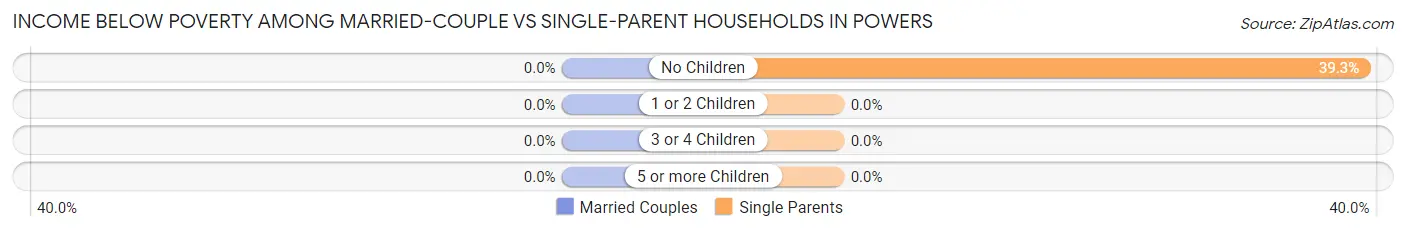
| Children | Married-Couple Families | Single-Parent Households |
| No Children | 0 (0.0%) | 11 (39.3%) |
| 1 or 2 Children | 0 (0.0%) | 0 (0.0%) |
| 3 or 4 Children | 0 (0.0%) | 0 (0.0%) |
| 5 or more Children | 0 (0.0%) | 0 (0.0%) |
| Total | 0 (0.0%) | 11 (18.6%) |
Race in Powers
The most populous races in Powers are White / Caucasian (607 | 80.3%), Two or more Races (118 | 15.6%), and Hispanic or Latino (70 | 9.3%).
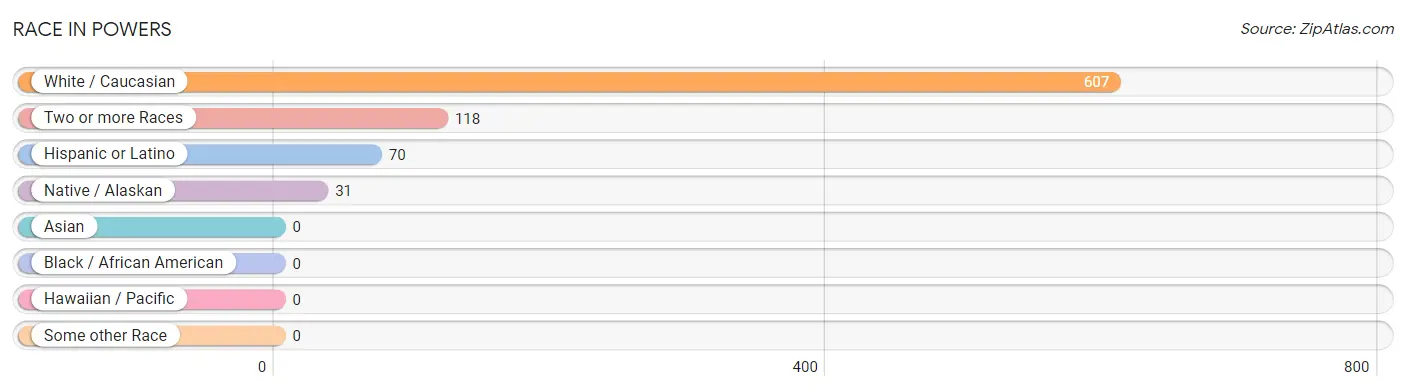
| Race | # Population | % Population |
| Asian | 0 | 0.0% |
| Black / African American | 0 | 0.0% |
| Hawaiian / Pacific | 0 | 0.0% |
| Hispanic or Latino | 70 | 9.3% |
| Native / Alaskan | 31 | 4.1% |
| White / Caucasian | 607 | 80.3% |
| Two or more Races | 118 | 15.6% |
| Some other Race | 0 | 0.0% |
| Total | 756 | 100.0% |
Ancestry in Powers
The most populous ancestries reported in Powers are German (255 | 33.7%), Dutch (140 | 18.5%), Irish (108 | 14.3%), English (64 | 8.5%), and American (56 | 7.4%), together accounting for 82.4% of all Powers residents.
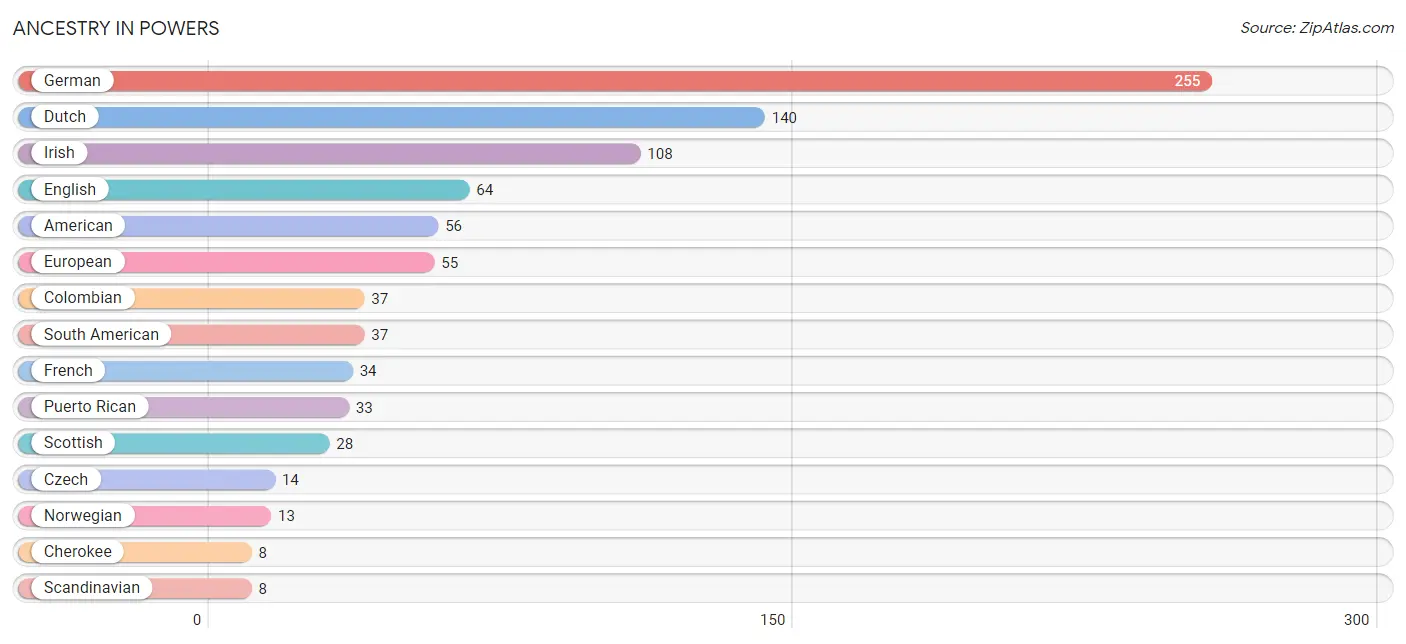
| Ancestry | # Population | % Population |
| American | 56 | 7.4% |
| Cherokee | 8 | 1.1% |
| Colombian | 37 | 4.9% |
| Czech | 14 | 1.8% |
| Dutch | 140 | 18.5% |
| English | 64 | 8.5% |
| European | 55 | 7.3% |
| French | 34 | 4.5% |
| German | 255 | 33.7% |
| Irish | 108 | 14.3% |
| Norwegian | 13 | 1.7% |
| Puerto Rican | 33 | 4.4% |
| Scandinavian | 8 | 1.1% |
| Scotch-Irish | 8 | 1.1% |
| Scottish | 28 | 3.7% |
| South American | 37 | 4.9% |
| Swedish | 6 | 0.8% | View All 17 Rows |
Immigrants in Powers
The most numerous immigrant groups reported in Powers came from , and Canada (8 | 1.1%), together accounting for 1.1% of all Powers residents.

| Immigration Origin | # Population | % Population |
| Canada | 8 | 1.1% | View All 1 Rows |
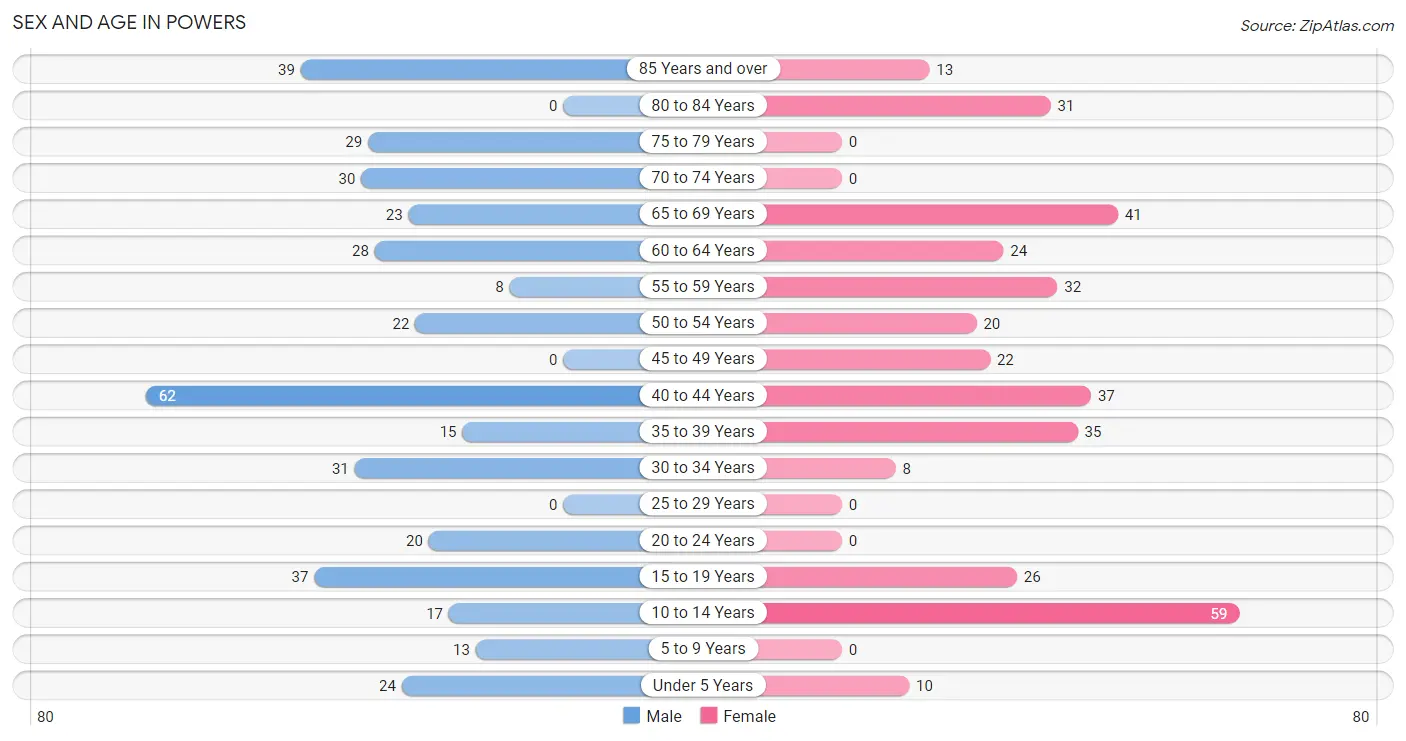
Sex and Age in Powers
Sex and Age in Powers
The most populous age groups in Powers are 40 to 44 Years (62 | 15.6%) for men and 10 to 14 Years (59 | 16.5%) for women.
| Age Bracket | Male | Female |
| Under 5 Years | 24 (6.0%) | 10 (2.8%) |
| 5 to 9 Years | 13 (3.3%) | 0 (0.0%) |
| 10 to 14 Years | 17 (4.3%) | 59 (16.5%) |
| 15 to 19 Years | 37 (9.3%) | 26 (7.3%) |
| 20 to 24 Years | 20 (5.0%) | 0 (0.0%) |
| 25 to 29 Years | 0 (0.0%) | 0 (0.0%) |
| 30 to 34 Years | 31 (7.8%) | 8 (2.2%) |
| 35 to 39 Years | 15 (3.8%) | 35 (9.8%) |
| 40 to 44 Years | 62 (15.6%) | 37 (10.3%) |
| 45 to 49 Years | 0 (0.0%) | 22 (6.1%) |
| 50 to 54 Years | 22 (5.5%) | 20 (5.6%) |
| 55 to 59 Years | 8 (2.0%) | 32 (8.9%) |
| 60 to 64 Years | 28 (7.0%) | 24 (6.7%) |
| 65 to 69 Years | 23 (5.8%) | 41 (11.5%) |
| 70 to 74 Years | 30 (7.5%) | 0 (0.0%) |
| 75 to 79 Years | 29 (7.3%) | 0 (0.0%) |
| 80 to 84 Years | 0 (0.0%) | 31 (8.7%) |
| 85 Years and over | 39 (9.8%) | 13 (3.6%) |
| Total | 398 (100.0%) | 358 (100.0%) |
Families and Households in Powers
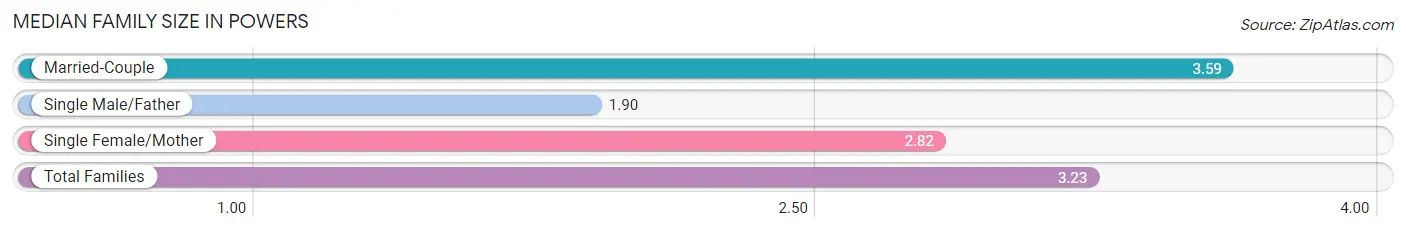
Median Family Size in Powers
The median family size in Powers is 3.23 persons per family, with married-couple families (120 | 67.0%) accounting for the largest median family size of 3.59 persons per family. On the other hand, single male/father families (21 | 11.7%) represent the smallest median family size with 1.90 persons per family.
| Family Type | # Families | Family Size |
| Married-Couple | 120 (67.0%) | 3.59 |
| Single Male/Father | 21 (11.7%) | 1.90 |
| Single Female/Mother | 38 (21.2%) | 2.82 |
| Total Families | 179 (100.0%) | 3.23 |
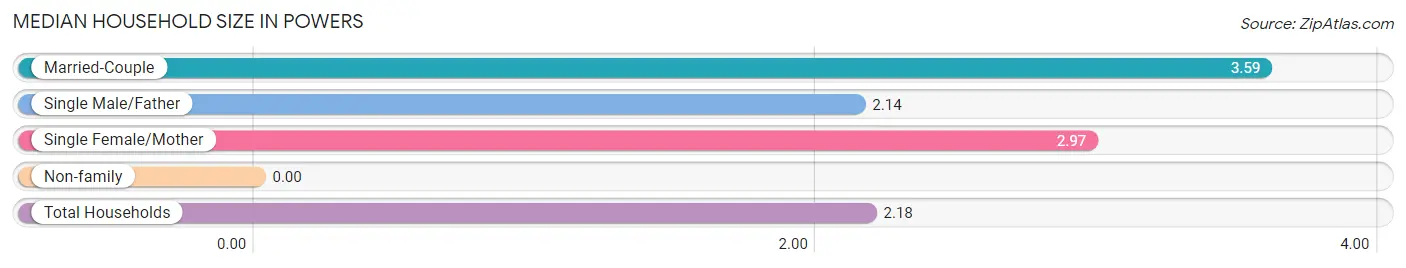
Median Household Size in Powers
| Household Type | # Households | Household Size |
| Married-Couple | 120 (34.7%) | 3.59 |
| Single Male/Father | 21 (6.1%) | 2.14 |
| Single Female/Mother | 38 (11.0%) | 2.97 |
| Non-family | 167 (48.3%) | - |
| Total Households | 346 (100.0%) | 2.18 |
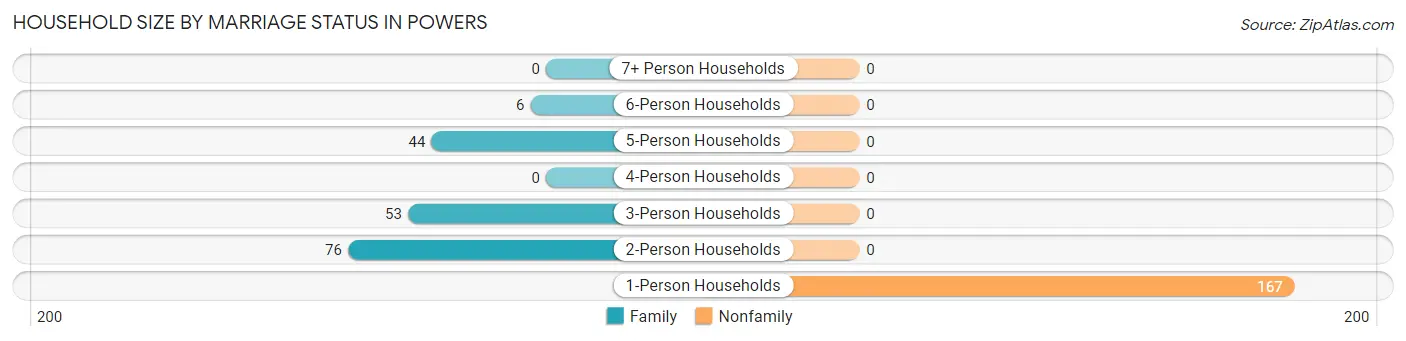
Household Size by Marriage Status in Powers
Out of a total of 346 households in Powers, 179 (51.7%) are family households, while 167 (48.3%) are nonfamily households. The most numerous type of family households are 2-person households, comprising 76, and the most common type of nonfamily households are 1-person households, comprising 167.
| Household Size | Family Households | Nonfamily Households |
| 1-Person Households | - | 167 (48.3%) |
| 2-Person Households | 76 (22.0%) | 0 (0.0%) |
| 3-Person Households | 53 (15.3%) | 0 (0.0%) |
| 4-Person Households | 0 (0.0%) | 0 (0.0%) |
| 5-Person Households | 44 (12.7%) | 0 (0.0%) |
| 6-Person Households | 6 (1.7%) | 0 (0.0%) |
| 7+ Person Households | 0 (0.0%) | 0 (0.0%) |
| Total | 179 (51.7%) | 167 (48.3%) |
Female Fertility in Powers
Fertility by Age in Powers
| Age Bracket | Women with Births | Births / 1,000 Women |
| 15 to 19 years | 0 (0.0%) | 0.0 |
| 20 to 34 years | 0 (0.0%) | 0.0 |
| 35 to 50 years | 0 (0.0%) | 0.0 |
| Total | 0 (0.0%) | 0.0 |
Fertility by Age by Marriage Status in Powers
| Age Bracket | Married | Unmarried |
| 15 to 19 years | 0 (0.0%) | 0 (0.0%) |
| 20 to 34 years | 0 (0.0%) | 0 (0.0%) |
| 35 to 50 years | 0 (0.0%) | 0 (0.0%) |
| Total | 0 (0.0%) | 0 (0.0%) |
Fertility by Education in Powers
| Educational Attainment | Women with Births | Births / 1,000 Women |
| Less than High School | 0 (0.0%) | 0.0 |
| High School Diploma | 0 (0.0%) | 0.0 |
| College or Associate's Degree | 0 (0.0%) | 0.0 |
| Bachelor's Degree | 0 (0.0%) | 0.0 |
| Graduate Degree | 0 (0.0%) | 0.0 |
| Total | 0 (0.0%) | 0.0 |
Fertility by Education by Marriage Status in Powers
| Educational Attainment | Married | Unmarried |
| Less than High School | 0 (0.0%) | 0 (0.0%) |
| High School Diploma | 0 (0.0%) | 0 (0.0%) |
| College or Associate's Degree | 0 (0.0%) | 0 (0.0%) |
| Bachelor's Degree | 0 (0.0%) | 0 (0.0%) |
| Graduate Degree | 0 (0.0%) | 0 (0.0%) |
| Total | 0 (0.0%) | 0 (0.0%) |
Employment Characteristics in Powers
Employment by Class of Employer in Powers
Among the 169 employed individuals in Powers, private company employees (98 | 58.0%), self-employed (not incorporated) (32 | 18.9%), and state government employees (21 | 12.4%) make up the most common classes of employment.
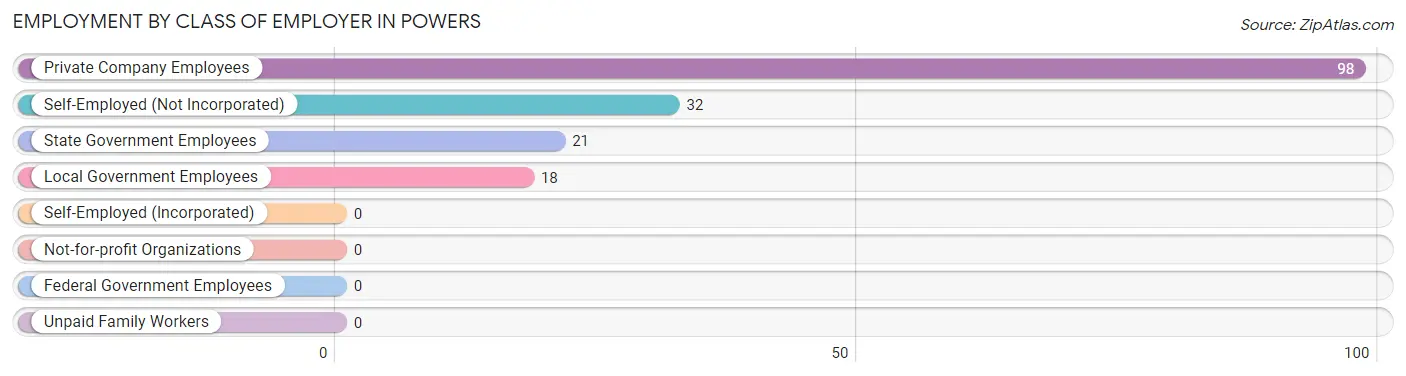
| Employer Class | # Employees | % Employees |
| Private Company Employees | 98 | 58.0% |
| Self-Employed (Incorporated) | 0 | 0.0% |
| Self-Employed (Not Incorporated) | 32 | 18.9% |
| Not-for-profit Organizations | 0 | 0.0% |
| Local Government Employees | 18 | 10.6% |
| State Government Employees | 21 | 12.4% |
| Federal Government Employees | 0 | 0.0% |
| Unpaid Family Workers | 0 | 0.0% |
| Total | 169 | 100.0% |
Employment Status by Age in Powers
According to the labor force statistics for Powers, out of the total population over 16 years of age (613), 43.1% or 264 individuals are in the labor force, with 12.9% or 34 of them unemployed. The age group with the highest labor force participation rate is 20 to 24 years, with 100.0% or 20 individuals in the labor force. Within the labor force, the 30 to 34 years age range has the highest percentage of unemployed individuals, with 100.0% or 18 of them being unemployed.
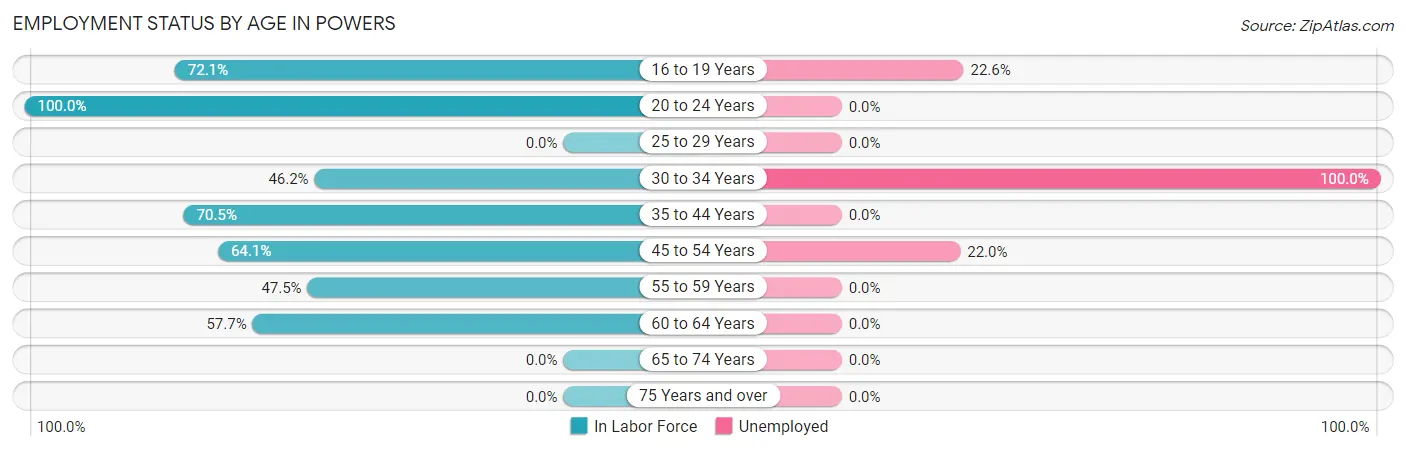
| Age Bracket | In Labor Force | Unemployed |
| 16 to 19 Years | 31 (72.1%) | 7 (22.6%) |
| 20 to 24 Years | 20 (100.0%) | 0 (0.0%) |
| 25 to 29 Years | 0 (0.0%) | 0 (0.0%) |
| 30 to 34 Years | 18 (46.2%) | 18 (100.0%) |
| 35 to 44 Years | 105 (70.5%) | 0 (0.0%) |
| 45 to 54 Years | 41 (64.1%) | 9 (22.0%) |
| 55 to 59 Years | 19 (47.5%) | 0 (0.0%) |
| 60 to 64 Years | 30 (57.7%) | 0 (0.0%) |
| 65 to 74 Years | 0 (0.0%) | 0 (0.0%) |
| 75 Years and over | 0 (0.0%) | 0 (0.0%) |
| Total | 264 (43.1%) | 34 (12.9%) |
Employment Status by Educational Attainment in Powers
According to labor force statistics for Powers, 61.9% of individuals (213) out of the total population between 25 and 64 years of age (344) are in the labor force, with 12.7% or 27 of them being unemployed. The group with the highest labor force participation rate are those with the educational attainment of college / associate degree, with 66.0% or 93 individuals in the labor force. Within the labor force, individuals with high school diploma education have the highest percentage of unemployment, with 18.8% or 18 of them being unemployed.
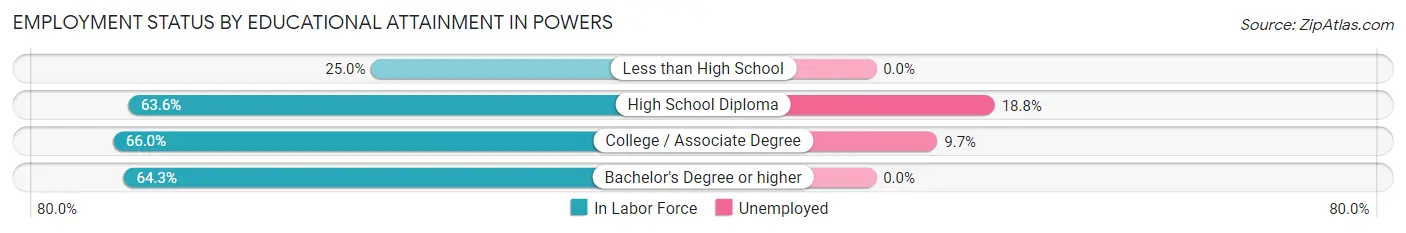
| Educational Attainment | In Labor Force | Unemployed |
| Less than High School | 6 (25.0%) | 0 (0.0%) |
| High School Diploma | 96 (63.6%) | 28 (18.8%) |
| College / Associate Degree | 93 (66.0%) | 14 (9.7%) |
| Bachelor's Degree or higher | 18 (64.3%) | 0 (0.0%) |
| Total | 213 (61.9%) | 44 (12.7%) |
Employment Occupations by Sex in Powers
Management, Business, Science and Arts Occupations
The most common Management, Business, Science and Arts occupations in Powers are Community & Social Service (66 | 28.7%), Education Instruction & Library (55 | 23.9%), Health Diagnosing & Treating (13 | 5.7%), Health Technologists (13 | 5.7%), and Arts, Media & Entertainment (11 | 4.8%).
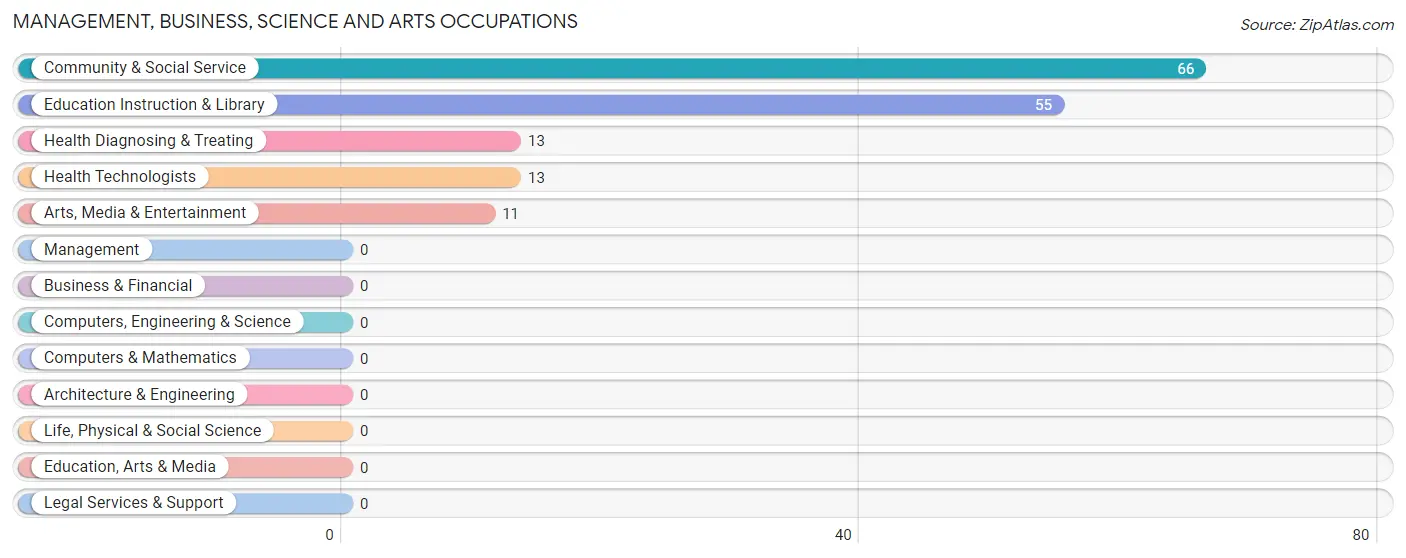
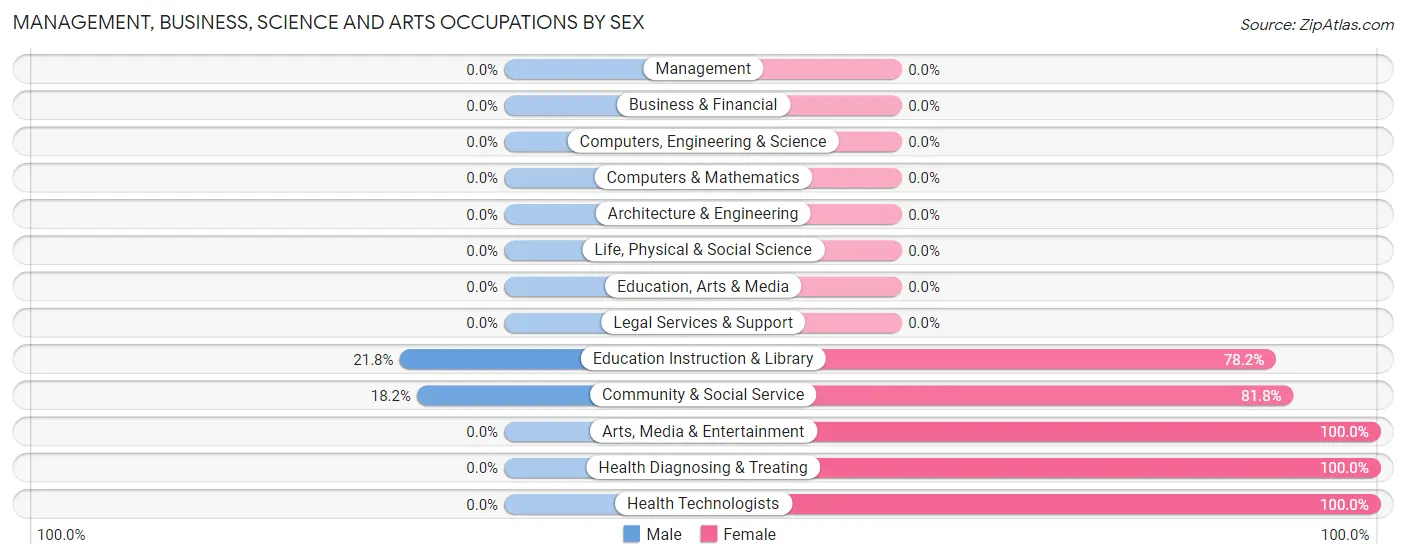
Management, Business, Science and Arts Occupations by Sex
Within the Management, Business, Science and Arts occupations in Powers, the most male-oriented occupations are Education Instruction & Library (21.8%), and Community & Social Service (18.2%), while the most female-oriented occupations are Arts, Media & Entertainment (100.0%), Health Diagnosing & Treating (100.0%), and Health Technologists (100.0%).
| Occupation | Male | Female |
| Management | 0 (0.0%) | 0 (0.0%) |
| Business & Financial | 0 (0.0%) | 0 (0.0%) |
| Computers, Engineering & Science | 0 (0.0%) | 0 (0.0%) |
| Computers & Mathematics | 0 (0.0%) | 0 (0.0%) |
| Architecture & Engineering | 0 (0.0%) | 0 (0.0%) |
| Life, Physical & Social Science | 0 (0.0%) | 0 (0.0%) |
| Community & Social Service | 12 (18.2%) | 54 (81.8%) |
| Education, Arts & Media | 0 (0.0%) | 0 (0.0%) |
| Legal Services & Support | 0 (0.0%) | 0 (0.0%) |
| Education Instruction & Library | 12 (21.8%) | 43 (78.2%) |
| Arts, Media & Entertainment | 0 (0.0%) | 11 (100.0%) |
| Health Diagnosing & Treating | 0 (0.0%) | 13 (100.0%) |
| Health Technologists | 0 (0.0%) | 13 (100.0%) |
| Total (Category) | 12 (15.2%) | 67 (84.8%) |
| Total (Overall) | 135 (58.7%) | 95 (41.3%) |
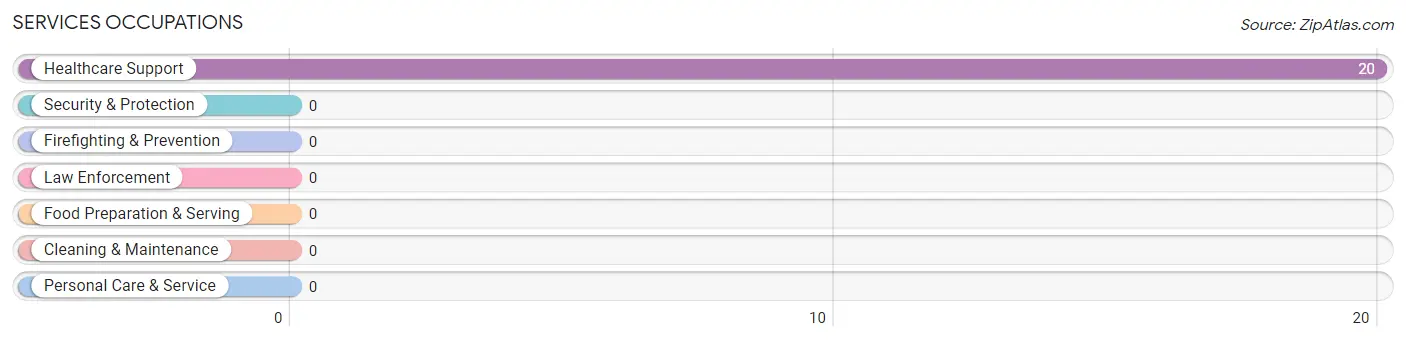
Services Occupations
The most common Services occupations in Powers are , and Healthcare Support (20 | 8.7%).
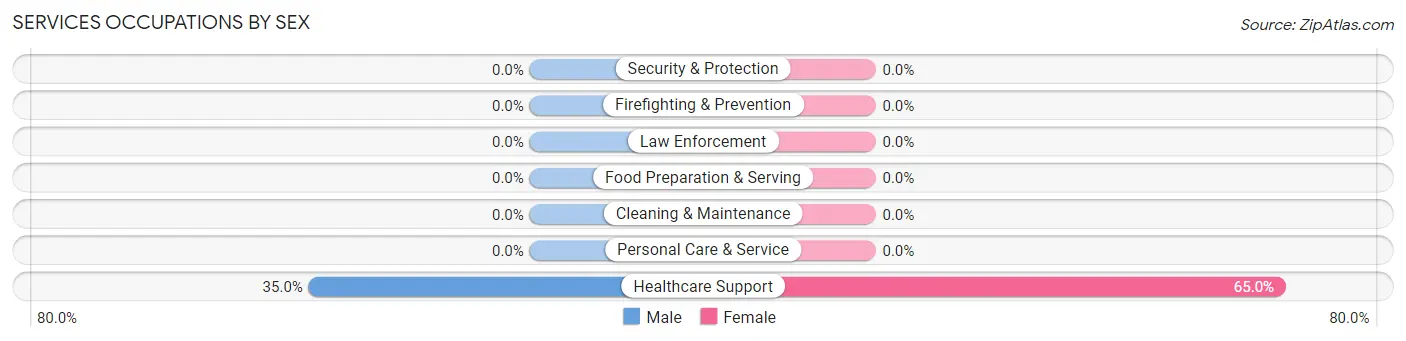
Services Occupations by Sex
| Occupation | Male | Female |
| Healthcare Support | 7 (35.0%) | 13 (65.0%) |
| Security & Protection | 0 (0.0%) | 0 (0.0%) |
| Firefighting & Prevention | 0 (0.0%) | 0 (0.0%) |
| Law Enforcement | 0 (0.0%) | 0 (0.0%) |
| Food Preparation & Serving | 0 (0.0%) | 0 (0.0%) |
| Cleaning & Maintenance | 0 (0.0%) | 0 (0.0%) |
| Personal Care & Service | 0 (0.0%) | 0 (0.0%) |
| Total (Category) | 7 (35.0%) | 13 (65.0%) |
| Total (Overall) | 135 (58.7%) | 95 (41.3%) |
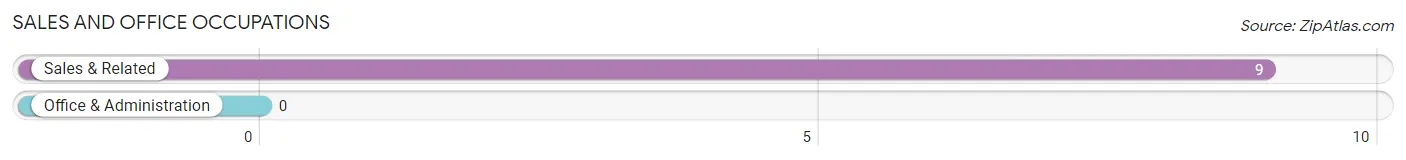
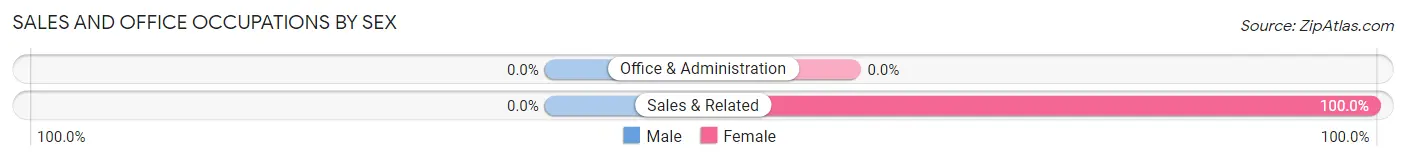
Sales and Office Occupations
The most common Sales and Office occupations in Powers are , and Sales & Related (9 | 3.9%).
Sales and Office Occupations by Sex
| Occupation | Male | Female |
| Sales & Related | 0 (0.0%) | 9 (100.0%) |
| Office & Administration | 0 (0.0%) | 0 (0.0%) |
| Total (Category) | 0 (0.0%) | 9 (100.0%) |
| Total (Overall) | 135 (58.7%) | 95 (41.3%) |
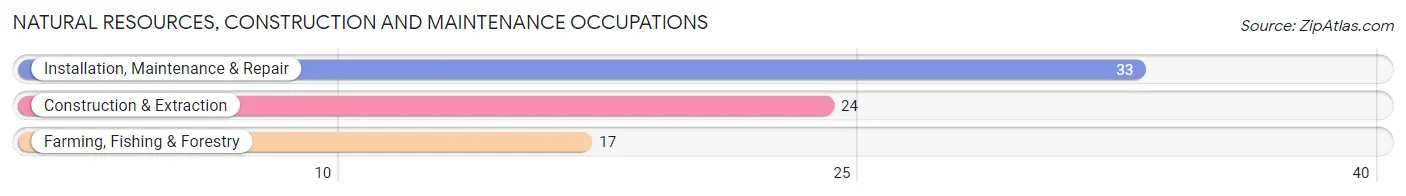
Natural Resources, Construction and Maintenance Occupations
The most common Natural Resources, Construction and Maintenance occupations in Powers are Installation, Maintenance & Repair (33 | 14.3%), Construction & Extraction (24 | 10.4%), and Farming, Fishing & Forestry (17 | 7.4%).
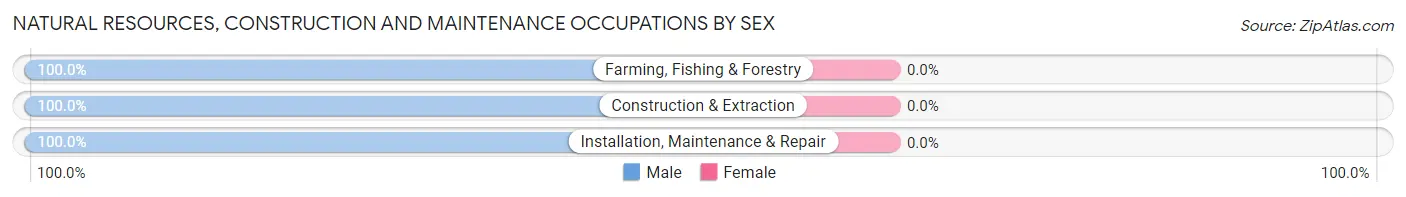
Natural Resources, Construction and Maintenance Occupations by Sex
| Occupation | Male | Female |
| Farming, Fishing & Forestry | 17 (100.0%) | 0 (0.0%) |
| Construction & Extraction | 24 (100.0%) | 0 (0.0%) |
| Installation, Maintenance & Repair | 33 (100.0%) | 0 (0.0%) |
| Total (Category) | 74 (100.0%) | 0 (0.0%) |
| Total (Overall) | 135 (58.7%) | 95 (41.3%) |
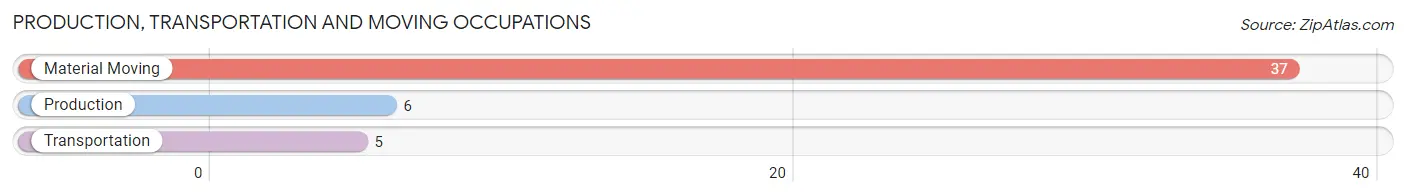
Production, Transportation and Moving Occupations
The most common Production, Transportation and Moving occupations in Powers are Material Moving (37 | 16.1%), Production (6 | 2.6%), and Transportation (5 | 2.2%).
Production, Transportation and Moving Occupations by Sex
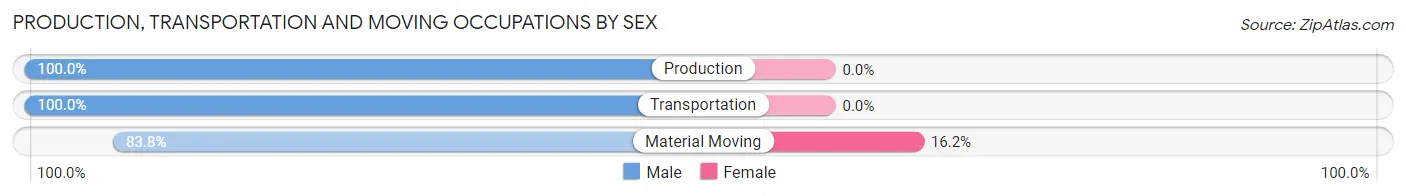
| Occupation | Male | Female |
| Production | 6 (100.0%) | 0 (0.0%) |
| Transportation | 5 (100.0%) | 0 (0.0%) |
| Material Moving | 31 (83.8%) | 6 (16.2%) |
| Total (Category) | 42 (87.5%) | 6 (12.5%) |
| Total (Overall) | 135 (58.7%) | 95 (41.3%) |
Employment Industries by Sex in Powers
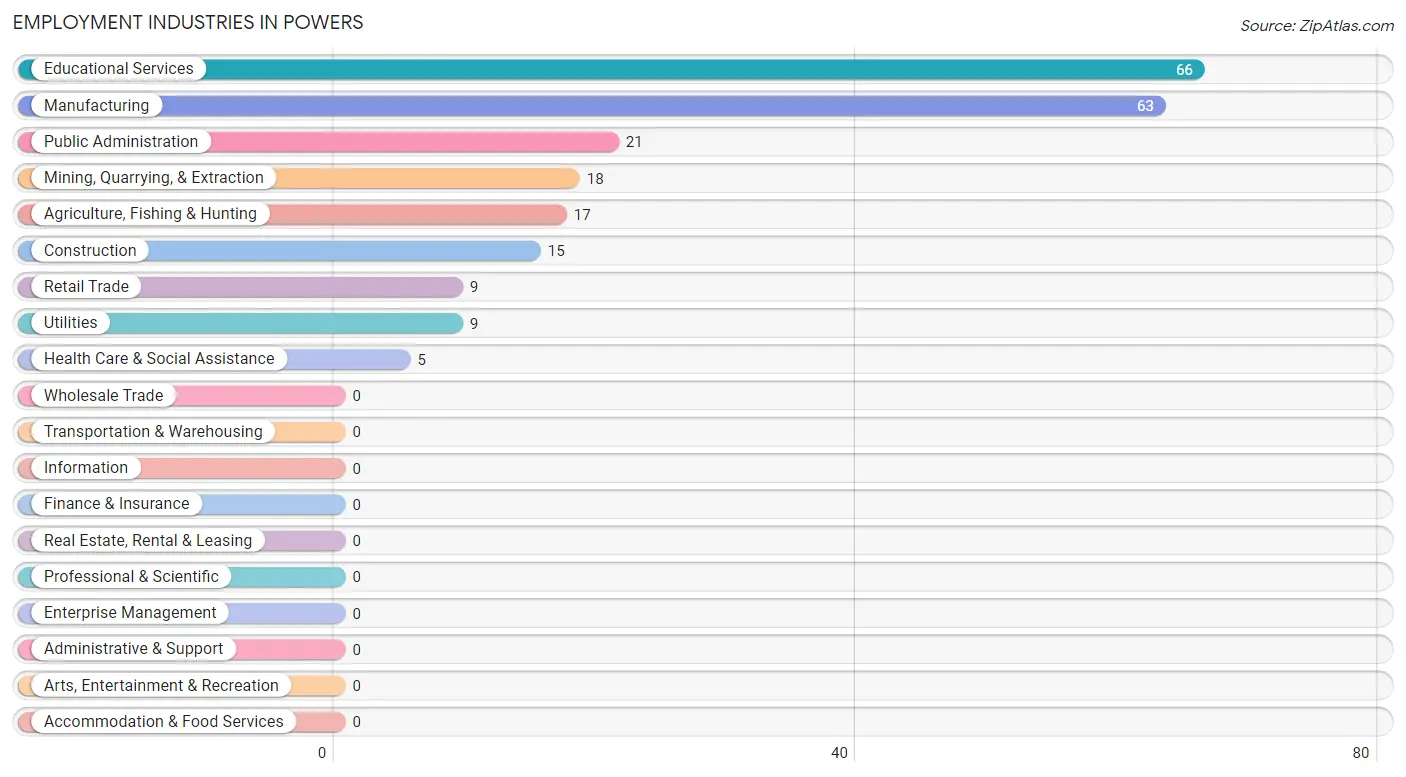
Employment Industries in Powers
The major employment industries in Powers include Educational Services (66 | 28.7%), Manufacturing (63 | 27.4%), Public Administration (21 | 9.1%), Mining, Quarrying, & Extraction (18 | 7.8%), and Agriculture, Fishing & Hunting (17 | 7.4%).
Employment Industries by Sex in Powers
The Powers industries that see more men than women are Agriculture, Fishing & Hunting (100.0%), Construction (100.0%), and Manufacturing (100.0%), whereas the industries that tend to have a higher number of women are Retail Trade (100.0%), Health Care & Social Assistance (100.0%), and Public Administration (100.0%).
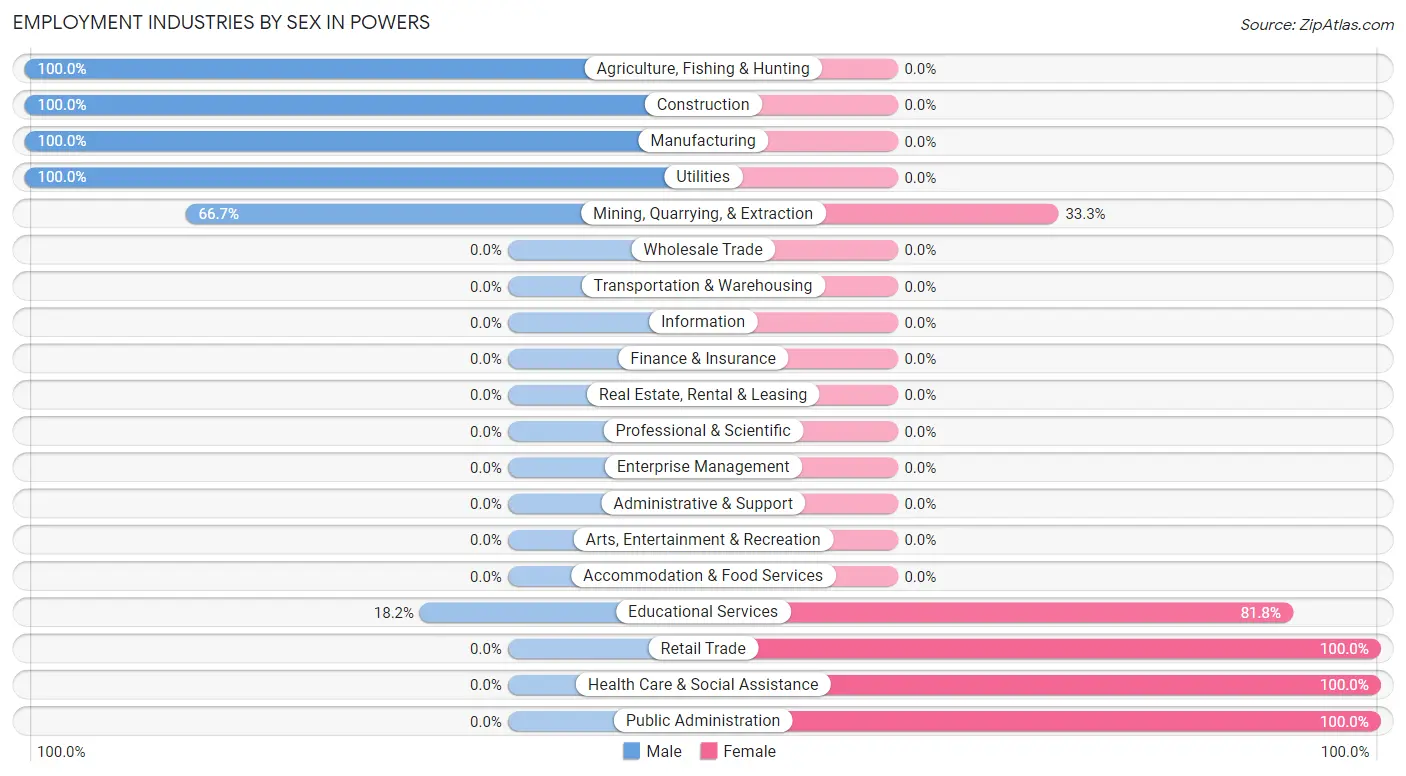
| Industry | Male | Female |
| Agriculture, Fishing & Hunting | 17 (100.0%) | 0 (0.0%) |
| Mining, Quarrying, & Extraction | 12 (66.7%) | 6 (33.3%) |
| Construction | 15 (100.0%) | 0 (0.0%) |
| Manufacturing | 63 (100.0%) | 0 (0.0%) |
| Wholesale Trade | 0 (0.0%) | 0 (0.0%) |
| Retail Trade | 0 (0.0%) | 9 (100.0%) |
| Transportation & Warehousing | 0 (0.0%) | 0 (0.0%) |
| Utilities | 9 (100.0%) | 0 (0.0%) |
| Information | 0 (0.0%) | 0 (0.0%) |
| Finance & Insurance | 0 (0.0%) | 0 (0.0%) |
| Real Estate, Rental & Leasing | 0 (0.0%) | 0 (0.0%) |
| Professional & Scientific | 0 (0.0%) | 0 (0.0%) |
| Enterprise Management | 0 (0.0%) | 0 (0.0%) |
| Administrative & Support | 0 (0.0%) | 0 (0.0%) |
| Educational Services | 12 (18.2%) | 54 (81.8%) |
| Health Care & Social Assistance | 0 (0.0%) | 5 (100.0%) |
| Arts, Entertainment & Recreation | 0 (0.0%) | 0 (0.0%) |
| Accommodation & Food Services | 0 (0.0%) | 0 (0.0%) |
| Public Administration | 0 (0.0%) | 21 (100.0%) |
| Total | 135 (58.7%) | 95 (41.3%) |
Education in Powers
School Enrollment in Powers
The most common levels of schooling among the 152 students in Powers are elementary school (65 | 42.8%), college / undergraduate (31 | 20.4%), and middle school (23 | 15.1%).
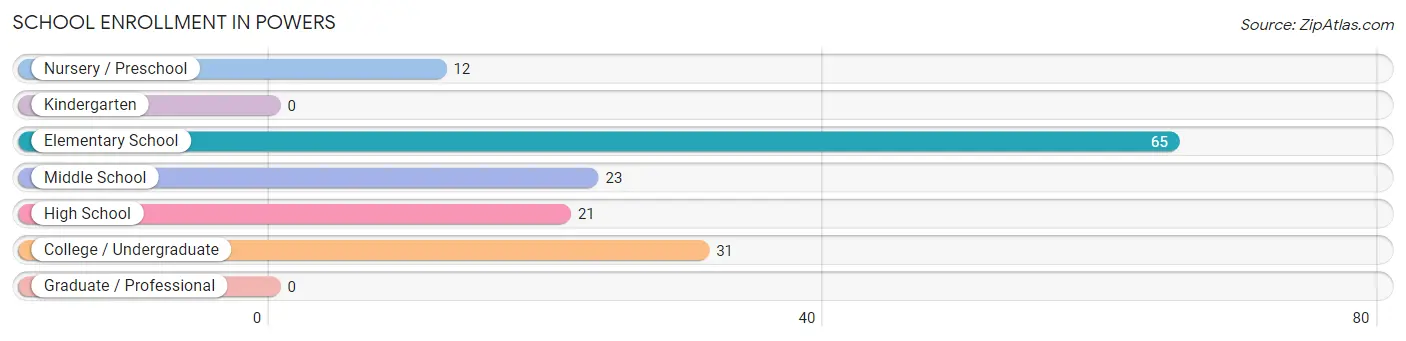
| School Level | # Students | % Students |
| Nursery / Preschool | 12 | 7.9% |
| Kindergarten | 0 | 0.0% |
| Elementary School | 65 | 42.8% |
| Middle School | 23 | 15.1% |
| High School | 21 | 13.8% |
| College / Undergraduate | 31 | 20.4% |
| Graduate / Professional | 0 | 0.0% |
| Total | 152 | 100.0% |
School Enrollment by Age by Funding Source in Powers
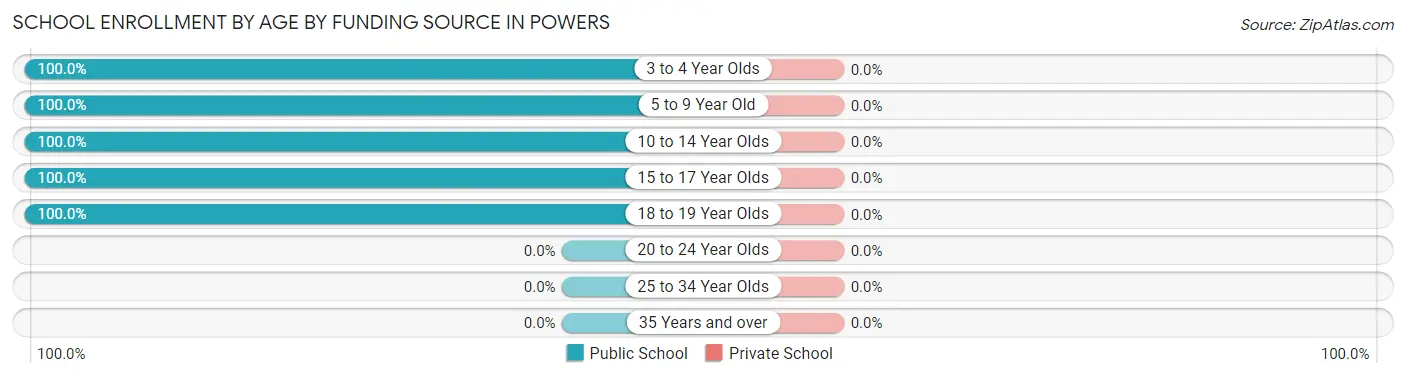
| Age Bracket | Public School | Private School |
| 3 to 4 Year Olds | 5 (100.0%) | 0 (0.0%) |
| 5 to 9 Year Old | 13 (100.0%) | 0 (0.0%) |
| 10 to 14 Year Olds | 76 (100.0%) | 0 (0.0%) |
| 15 to 17 Year Olds | 27 (100.0%) | 0 (0.0%) |
| 18 to 19 Year Olds | 31 (100.0%) | 0 (0.0%) |
| 20 to 24 Year Olds | 0 (0.0%) | 0 (0.0%) |
| 25 to 34 Year Olds | 0 (0.0%) | 0 (0.0%) |
| 35 Years and over | 0 (0.0%) | 0 (0.0%) |
| Total | 152 (100.0%) | 0 (0.0%) |
Educational Attainment by Field of Study in Powers
Computers & mathematics (18 | 29.0%), education (16 | 25.8%), literature & languages (12 | 19.4%), engineering (8 | 12.9%), and business (8 | 12.9%) are the most common fields of study among 62 individuals in Powers who have obtained a bachelor's degree or higher.
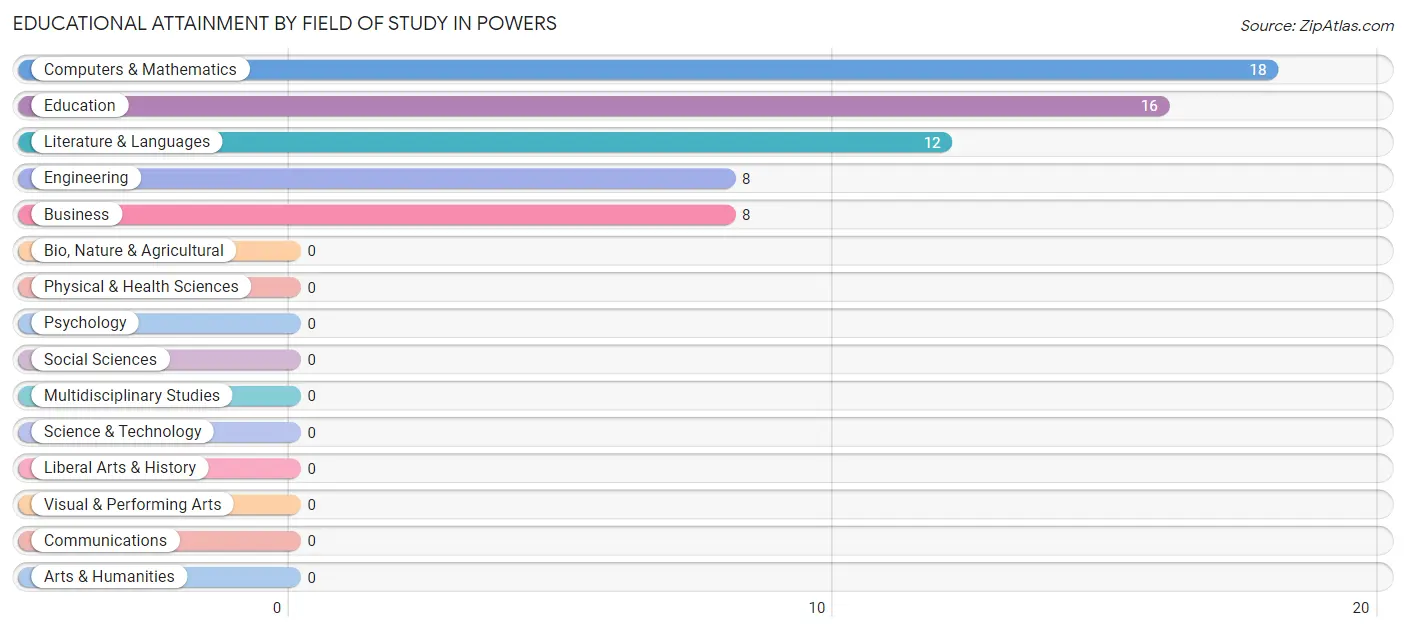
| Field of Study | # Graduates | % Graduates |
| Computers & Mathematics | 18 | 29.0% |
| Bio, Nature & Agricultural | 0 | 0.0% |
| Physical & Health Sciences | 0 | 0.0% |
| Psychology | 0 | 0.0% |
| Social Sciences | 0 | 0.0% |
| Engineering | 8 | 12.9% |
| Multidisciplinary Studies | 0 | 0.0% |
| Science & Technology | 0 | 0.0% |
| Business | 8 | 12.9% |
| Education | 16 | 25.8% |
| Literature & Languages | 12 | 19.4% |
| Liberal Arts & History | 0 | 0.0% |
| Visual & Performing Arts | 0 | 0.0% |
| Communications | 0 | 0.0% |
| Arts & Humanities | 0 | 0.0% |
| Total | 62 | 100.0% |
Transportation & Commute in Powers
Vehicle Availability by Sex in Powers
The most prevalent vehicle ownership categories in Powers are males with 4 vehicles (39, accounting for 35.1%) and females with 4 vehicles (0, making up 67.2%).
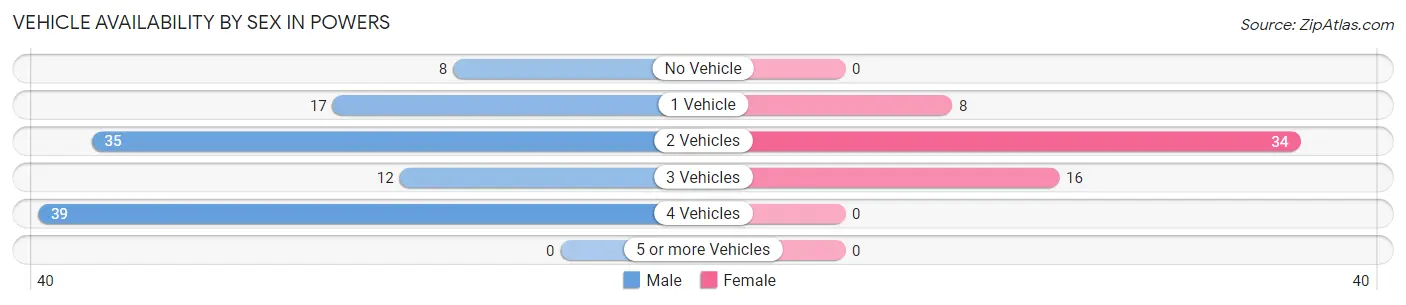
| Vehicles Available | Male | Female |
| No Vehicle | 8 (7.2%) | 0 (0.0%) |
| 1 Vehicle | 17 (15.3%) | 8 (13.8%) |
| 2 Vehicles | 35 (31.5%) | 34 (58.6%) |
| 3 Vehicles | 12 (10.8%) | 16 (27.6%) |
| 4 Vehicles | 39 (35.1%) | 0 (0.0%) |
| 5 or more Vehicles | 0 (0.0%) | 0 (0.0%) |
| Total | 111 (100.0%) | 58 (100.0%) |
Commute Time in Powers
The most frequently occuring commute durations in Powers are 60 to 89 minutes (33 commuters, 22.8%), 45 to 59 minutes (27 commuters, 18.6%), and 10 to 14 minutes (20 commuters, 13.8%).
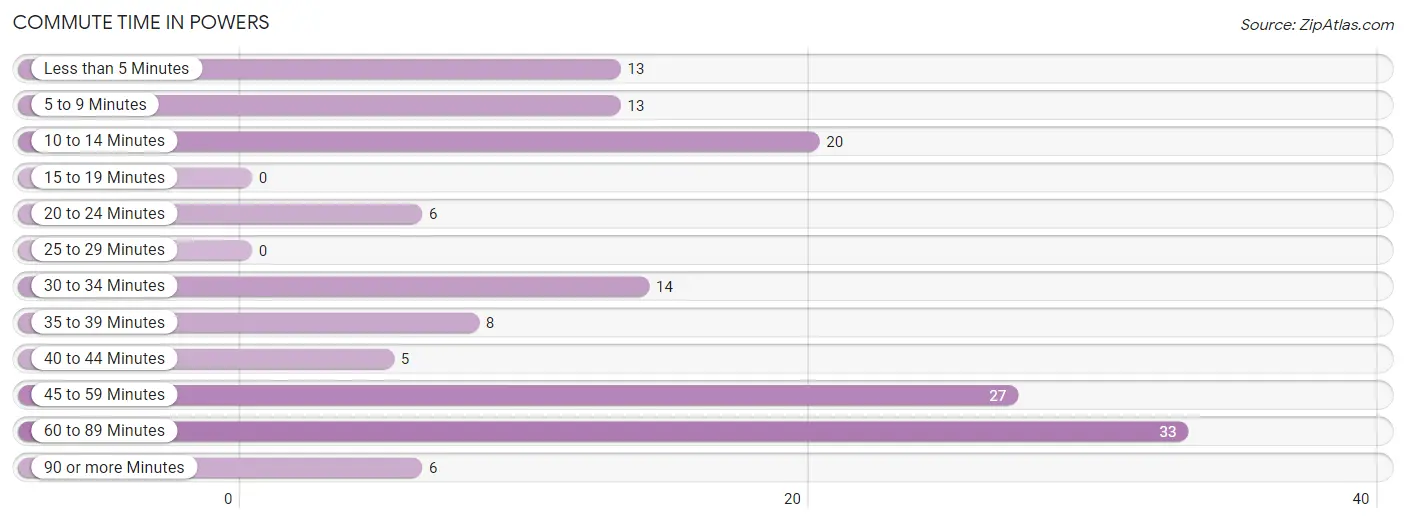
| Commute Time | # Commuters | % Commuters |
| Less than 5 Minutes | 13 | 9.0% |
| 5 to 9 Minutes | 13 | 9.0% |
| 10 to 14 Minutes | 20 | 13.8% |
| 15 to 19 Minutes | 0 | 0.0% |
| 20 to 24 Minutes | 6 | 4.1% |
| 25 to 29 Minutes | 0 | 0.0% |
| 30 to 34 Minutes | 14 | 9.7% |
| 35 to 39 Minutes | 8 | 5.5% |
| 40 to 44 Minutes | 5 | 3.5% |
| 45 to 59 Minutes | 27 | 18.6% |
| 60 to 89 Minutes | 33 | 22.8% |
| 90 or more Minutes | 6 | 4.1% |
Commute Time by Sex in Powers
The most common commute times in Powers are 60 to 89 minutes (33 commuters, 33.7%) for males and 45 to 59 minutes (22 commuters, 46.8%) for females.
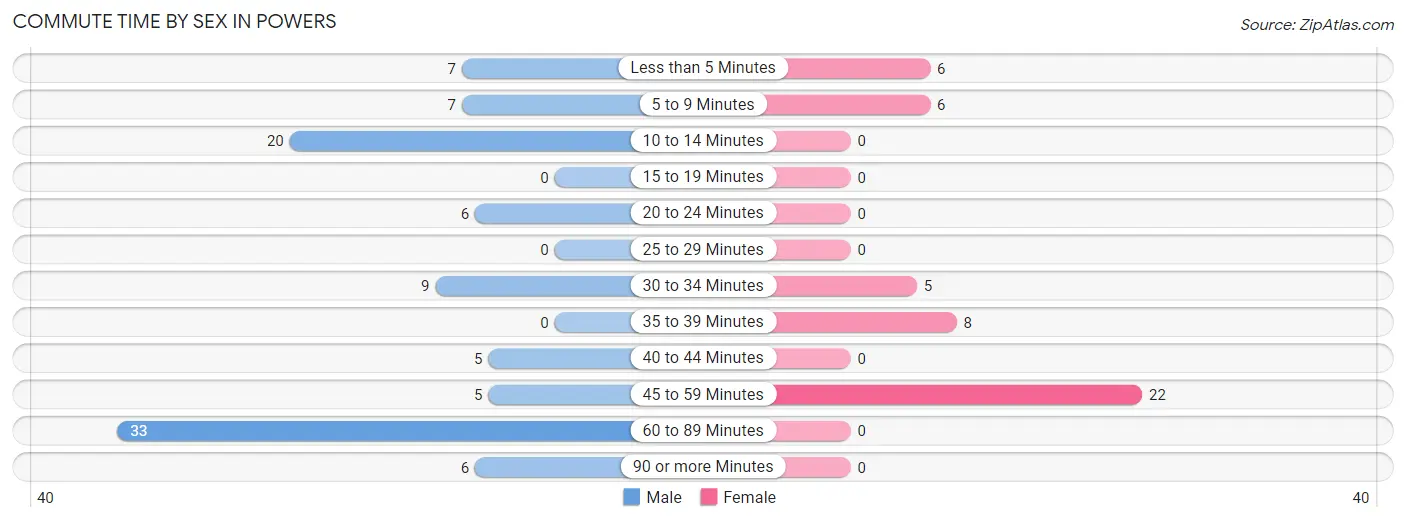
| Commute Time | Male | Female |
| Less than 5 Minutes | 7 (7.1%) | 6 (12.8%) |
| 5 to 9 Minutes | 7 (7.1%) | 6 (12.8%) |
| 10 to 14 Minutes | 20 (20.4%) | 0 (0.0%) |
| 15 to 19 Minutes | 0 (0.0%) | 0 (0.0%) |
| 20 to 24 Minutes | 6 (6.1%) | 0 (0.0%) |
| 25 to 29 Minutes | 0 (0.0%) | 0 (0.0%) |
| 30 to 34 Minutes | 9 (9.2%) | 5 (10.6%) |
| 35 to 39 Minutes | 0 (0.0%) | 8 (17.0%) |
| 40 to 44 Minutes | 5 (5.1%) | 0 (0.0%) |
| 45 to 59 Minutes | 5 (5.1%) | 22 (46.8%) |
| 60 to 89 Minutes | 33 (33.7%) | 0 (0.0%) |
| 90 or more Minutes | 6 (6.1%) | 0 (0.0%) |
Time of Departure to Work by Sex in Powers
The most frequent times of departure to work in Powers are 12:00 AM to 4:59 AM (50, 51.0%) for males and 10:00 AM to 10:59 AM (13, 27.7%) for females.
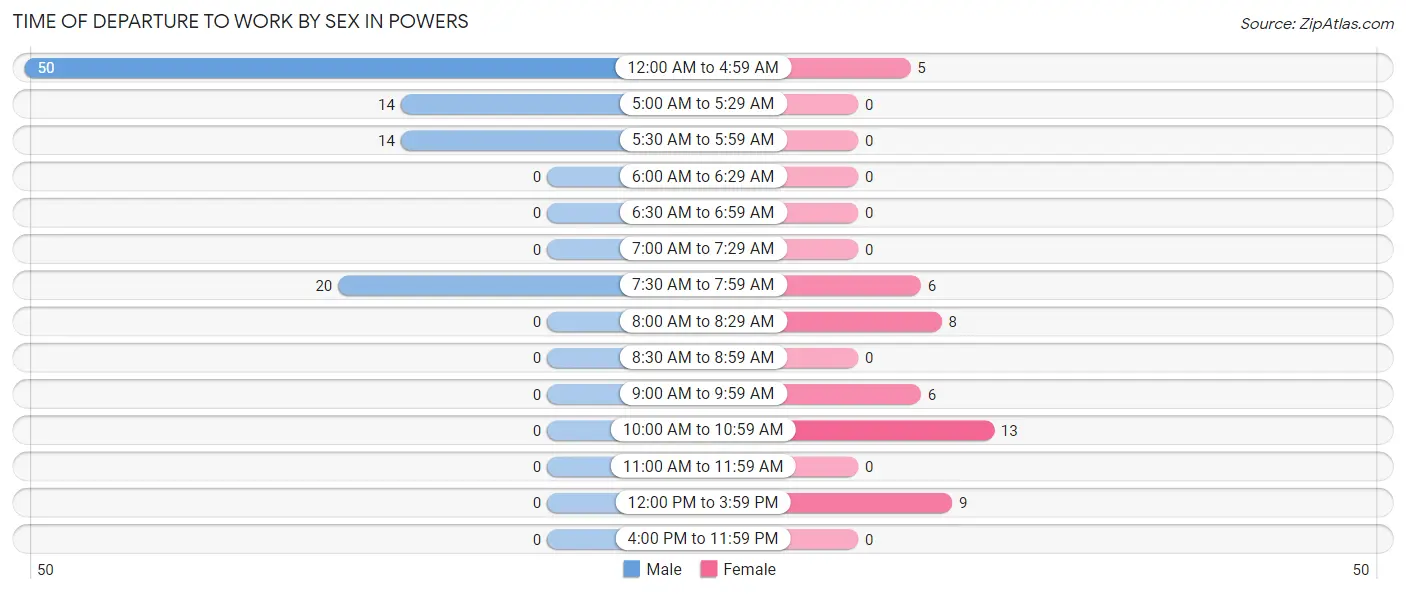
| Time of Departure | Male | Female |
| 12:00 AM to 4:59 AM | 50 (51.0%) | 5 (10.6%) |
| 5:00 AM to 5:29 AM | 14 (14.3%) | 0 (0.0%) |
| 5:30 AM to 5:59 AM | 14 (14.3%) | 0 (0.0%) |
| 6:00 AM to 6:29 AM | 0 (0.0%) | 0 (0.0%) |
| 6:30 AM to 6:59 AM | 0 (0.0%) | 0 (0.0%) |
| 7:00 AM to 7:29 AM | 0 (0.0%) | 0 (0.0%) |
| 7:30 AM to 7:59 AM | 20 (20.4%) | 6 (12.8%) |
| 8:00 AM to 8:29 AM | 0 (0.0%) | 8 (17.0%) |
| 8:30 AM to 8:59 AM | 0 (0.0%) | 0 (0.0%) |
| 9:00 AM to 9:59 AM | 0 (0.0%) | 6 (12.8%) |
| 10:00 AM to 10:59 AM | 0 (0.0%) | 13 (27.7%) |
| 11:00 AM to 11:59 AM | 0 (0.0%) | 0 (0.0%) |
| 12:00 PM to 3:59 PM | 0 (0.0%) | 9 (19.2%) |
| 4:00 PM to 11:59 PM | 0 (0.0%) | 0 (0.0%) |
| Total | 98 (100.0%) | 47 (100.0%) |
Housing Occupancy in Powers
Occupancy by Ownership in Powers
Of the total 346 dwellings in Powers, owner-occupied units account for 257 (74.3%), while renter-occupied units make up 89 (25.7%).
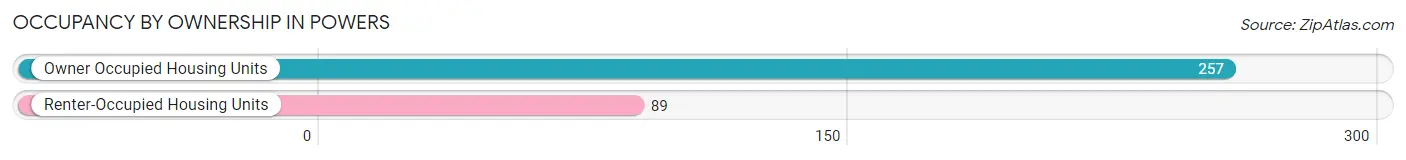
| Occupancy | # Housing Units | % Housing Units |
| Owner Occupied Housing Units | 257 | 74.3% |
| Renter-Occupied Housing Units | 89 | 25.7% |
| Total Occupied Housing Units | 346 | 100.0% |
Occupancy by Household Size in Powers
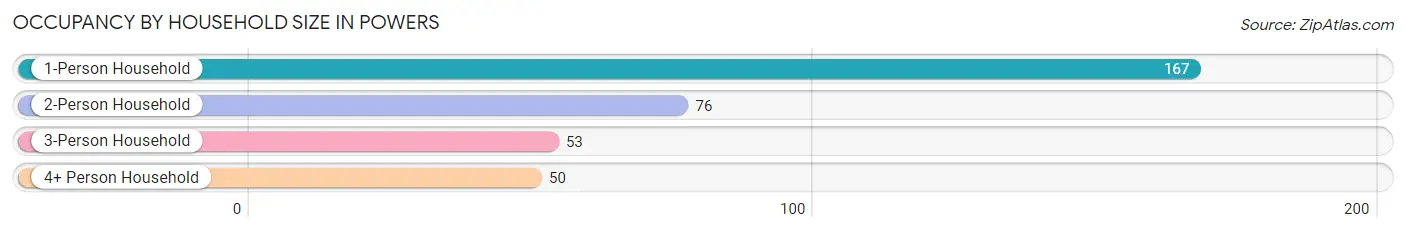
| Household Size | # Housing Units | % Housing Units |
| 1-Person Household | 167 | 48.3% |
| 2-Person Household | 76 | 22.0% |
| 3-Person Household | 53 | 15.3% |
| 4+ Person Household | 50 | 14.4% |
| Total Housing Units | 346 | 100.0% |
Occupancy by Ownership by Household Size in Powers
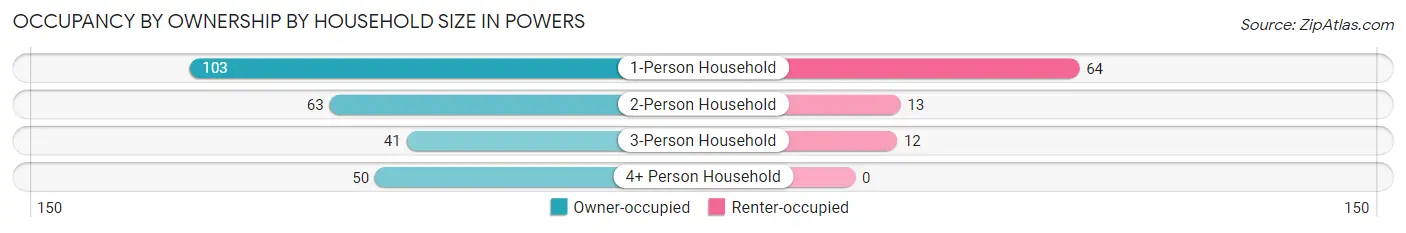
| Household Size | Owner-occupied | Renter-occupied |
| 1-Person Household | 103 (61.7%) | 64 (38.3%) |
| 2-Person Household | 63 (82.9%) | 13 (17.1%) |
| 3-Person Household | 41 (77.4%) | 12 (22.6%) |
| 4+ Person Household | 50 (100.0%) | 0 (0.0%) |
| Total Housing Units | 257 (74.3%) | 89 (25.7%) |
Occupancy by Educational Attainment in Powers
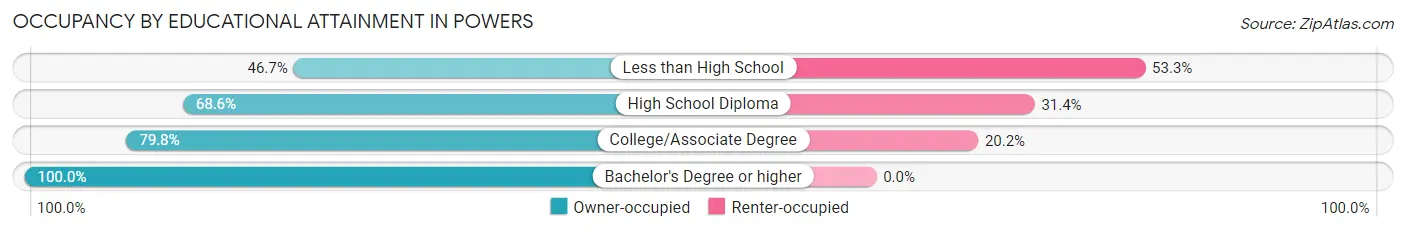
| Household Size | Owner-occupied | Renter-occupied |
| Less than High School | 7 (46.7%) | 8 (53.3%) |
| High School Diploma | 129 (68.6%) | 59 (31.4%) |
| College/Associate Degree | 87 (79.8%) | 22 (20.2%) |
| Bachelor's Degree or higher | 34 (100.0%) | 0 (0.0%) |
Occupancy by Age of Householder in Powers
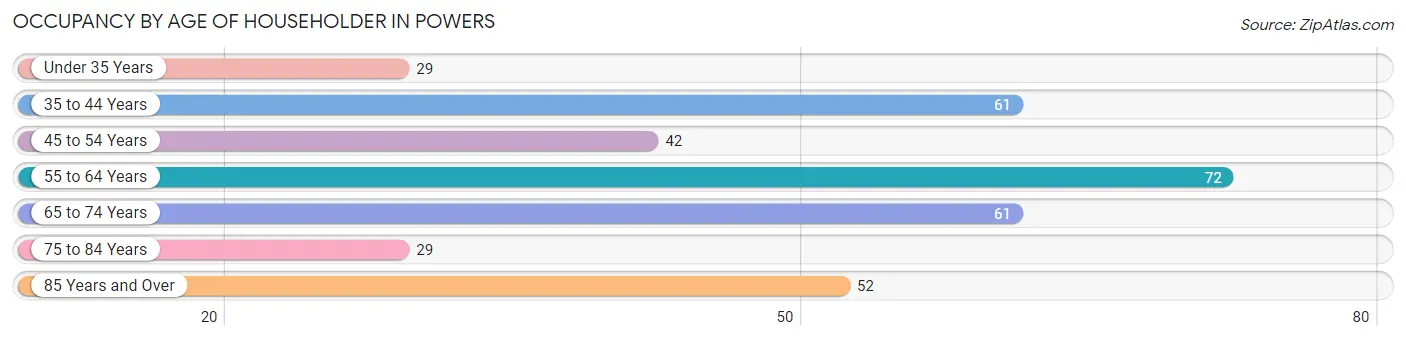
| Age Bracket | # Households | % Households |
| Under 35 Years | 29 | 8.4% |
| 35 to 44 Years | 61 | 17.6% |
| 45 to 54 Years | 42 | 12.1% |
| 55 to 64 Years | 72 | 20.8% |
| 65 to 74 Years | 61 | 17.6% |
| 75 to 84 Years | 29 | 8.4% |
| 85 Years and Over | 52 | 15.0% |
| Total | 346 | 100.0% |
Housing Finances in Powers
Median Income by Occupancy in Powers
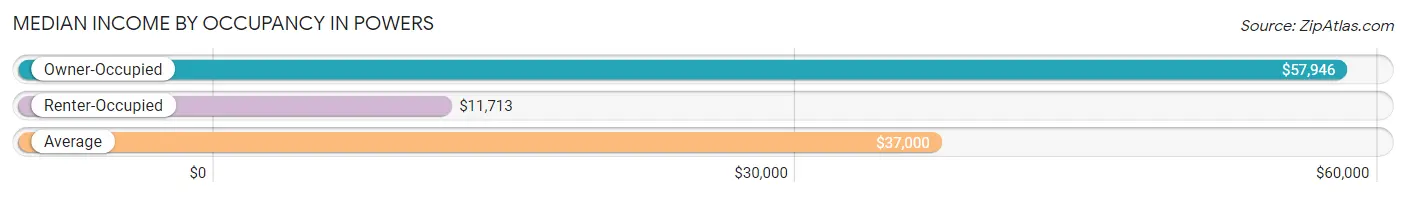
| Occupancy Type | # Households | Median Income |
| Owner-Occupied | 257 (74.3%) | $57,946 |
| Renter-Occupied | 89 (25.7%) | $11,713 |
| Average | 346 (100.0%) | $37,000 |
Occupancy by Householder Income Bracket in Powers
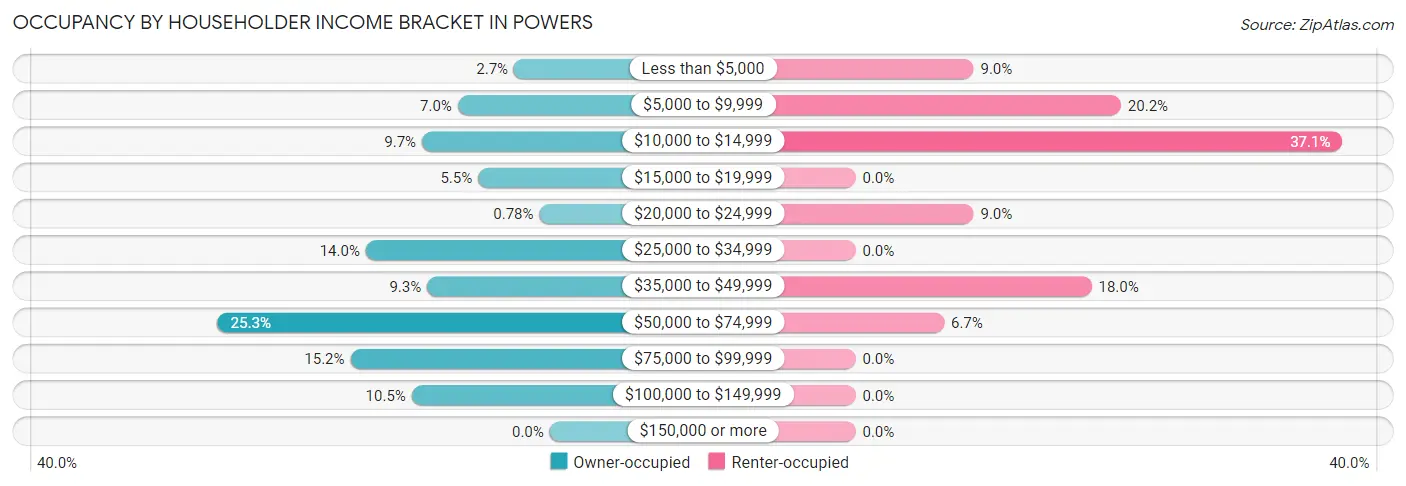
| Income Bracket | Owner-occupied | Renter-occupied |
| Less than $5,000 | 7 (2.7%) | 8 (9.0%) |
| $5,000 to $9,999 | 18 (7.0%) | 18 (20.2%) |
| $10,000 to $14,999 | 25 (9.7%) | 33 (37.1%) |
| $15,000 to $19,999 | 14 (5.4%) | 0 (0.0%) |
| $20,000 to $24,999 | 2 (0.8%) | 8 (9.0%) |
| $25,000 to $34,999 | 36 (14.0%) | 0 (0.0%) |
| $35,000 to $49,999 | 24 (9.3%) | 16 (18.0%) |
| $50,000 to $74,999 | 65 (25.3%) | 6 (6.7%) |
| $75,000 to $99,999 | 39 (15.2%) | 0 (0.0%) |
| $100,000 to $149,999 | 27 (10.5%) | 0 (0.0%) |
| $150,000 or more | 0 (0.0%) | 0 (0.0%) |
| Total | 257 (100.0%) | 89 (100.0%) |
Monthly Housing Cost Tiers in Powers
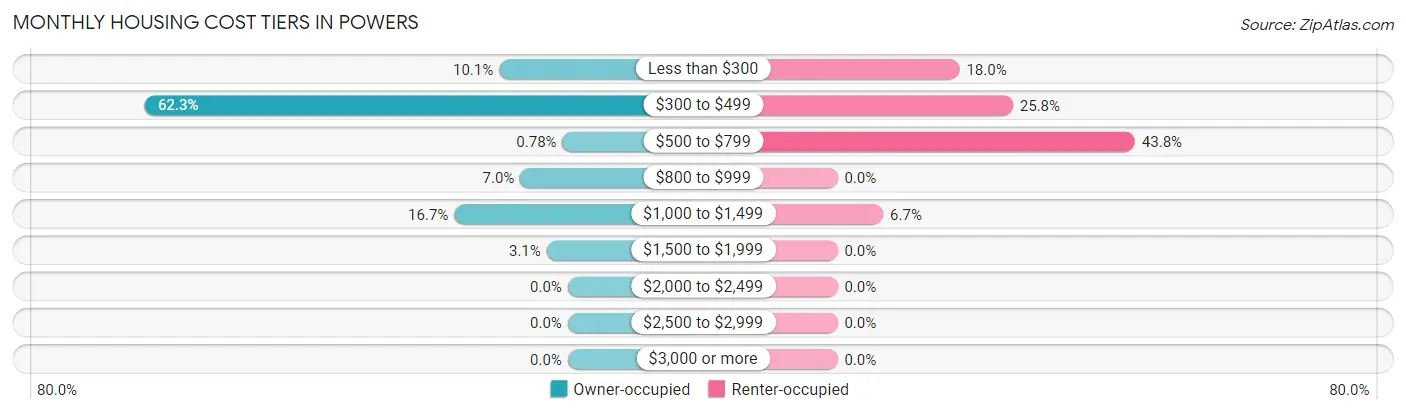
| Monthly Cost | Owner-occupied | Renter-occupied |
| Less than $300 | 26 (10.1%) | 16 (18.0%) |
| $300 to $499 | 160 (62.3%) | 23 (25.8%) |
| $500 to $799 | 2 (0.8%) | 39 (43.8%) |
| $800 to $999 | 18 (7.0%) | 0 (0.0%) |
| $1,000 to $1,499 | 43 (16.7%) | 6 (6.7%) |
| $1,500 to $1,999 | 8 (3.1%) | 0 (0.0%) |
| $2,000 to $2,499 | 0 (0.0%) | 0 (0.0%) |
| $2,500 to $2,999 | 0 (0.0%) | 0 (0.0%) |
| $3,000 or more | 0 (0.0%) | 0 (0.0%) |
| Total | 257 (100.0%) | 89 (100.0%) |
Physical Housing Characteristics in Powers
Housing Structures in Powers
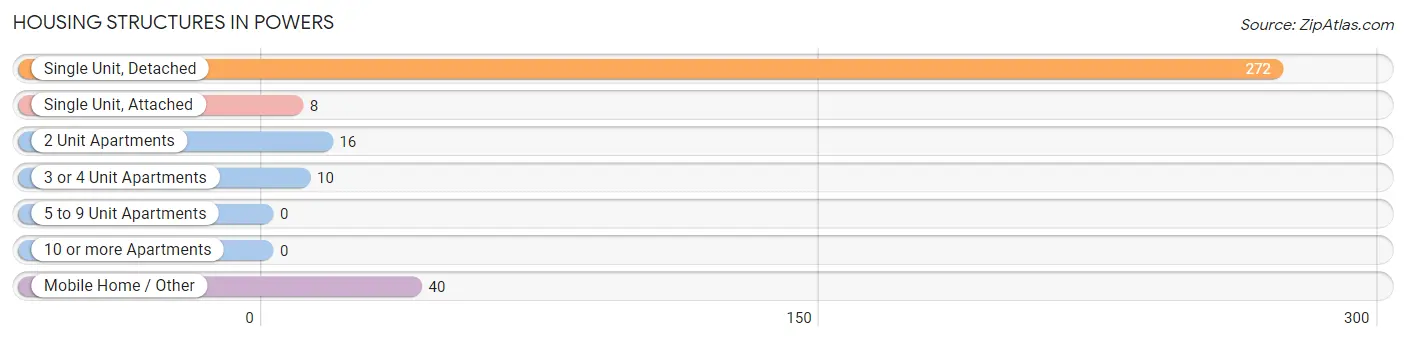
| Structure Type | # Housing Units | % Housing Units |
| Single Unit, Detached | 272 | 78.6% |
| Single Unit, Attached | 8 | 2.3% |
| 2 Unit Apartments | 16 | 4.6% |
| 3 or 4 Unit Apartments | 10 | 2.9% |
| 5 to 9 Unit Apartments | 0 | 0.0% |
| 10 or more Apartments | 0 | 0.0% |
| Mobile Home / Other | 40 | 11.6% |
| Total | 346 | 100.0% |
Housing Structures by Occupancy in Powers
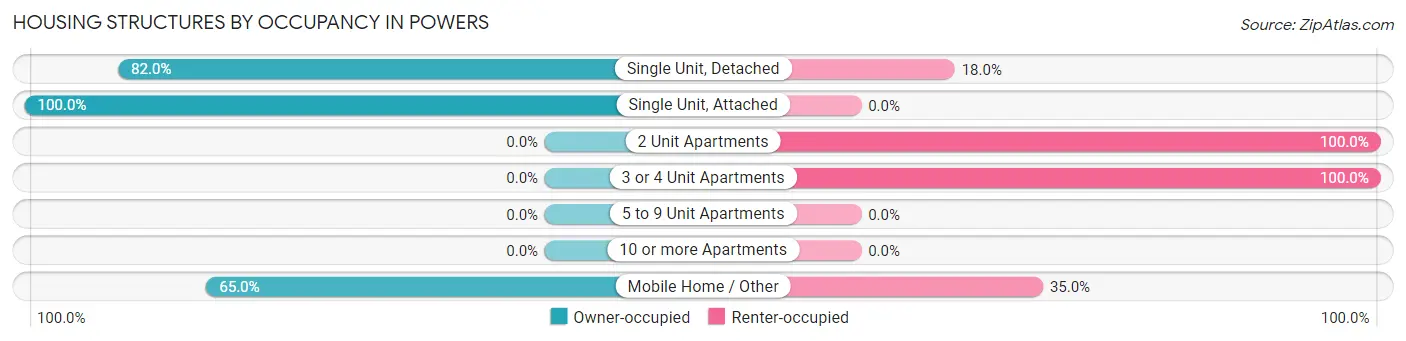
| Structure Type | Owner-occupied | Renter-occupied |
| Single Unit, Detached | 223 (82.0%) | 49 (18.0%) |
| Single Unit, Attached | 8 (100.0%) | 0 (0.0%) |
| 2 Unit Apartments | 0 (0.0%) | 16 (100.0%) |
| 3 or 4 Unit Apartments | 0 (0.0%) | 10 (100.0%) |
| 5 to 9 Unit Apartments | 0 (0.0%) | 0 (0.0%) |
| 10 or more Apartments | 0 (0.0%) | 0 (0.0%) |
| Mobile Home / Other | 26 (65.0%) | 14 (35.0%) |
| Total | 257 (74.3%) | 89 (25.7%) |
Housing Structures by Number of Rooms in Powers
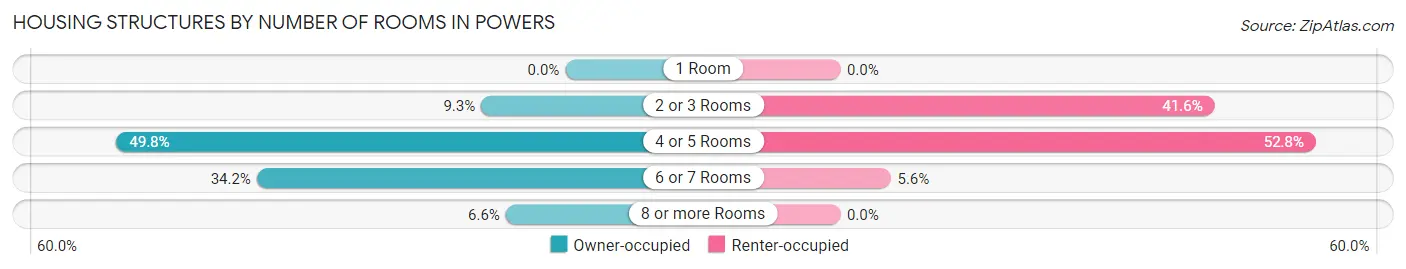
| Number of Rooms | Owner-occupied | Renter-occupied |
| 1 Room | 0 (0.0%) | 0 (0.0%) |
| 2 or 3 Rooms | 24 (9.3%) | 37 (41.6%) |
| 4 or 5 Rooms | 128 (49.8%) | 47 (52.8%) |
| 6 or 7 Rooms | 88 (34.2%) | 5 (5.6%) |
| 8 or more Rooms | 17 (6.6%) | 0 (0.0%) |
| Total | 257 (100.0%) | 89 (100.0%) |
Housing Structure by Heating Type in Powers
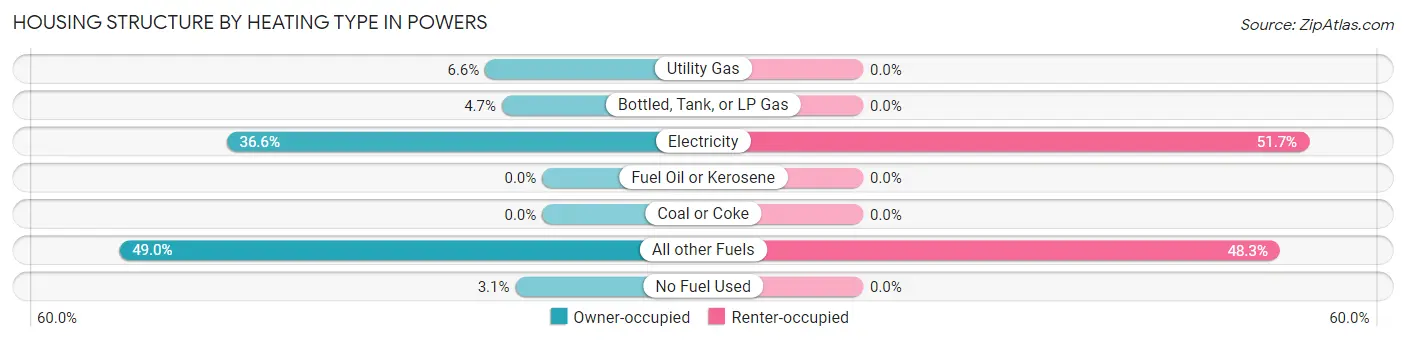
| Heating Type | Owner-occupied | Renter-occupied |
| Utility Gas | 17 (6.6%) | 0 (0.0%) |
| Bottled, Tank, or LP Gas | 12 (4.7%) | 0 (0.0%) |
| Electricity | 94 (36.6%) | 46 (51.7%) |
| Fuel Oil or Kerosene | 0 (0.0%) | 0 (0.0%) |
| Coal or Coke | 0 (0.0%) | 0 (0.0%) |
| All other Fuels | 126 (49.0%) | 43 (48.3%) |
| No Fuel Used | 8 (3.1%) | 0 (0.0%) |
| Total | 257 (100.0%) | 89 (100.0%) |
Household Vehicle Usage in Powers
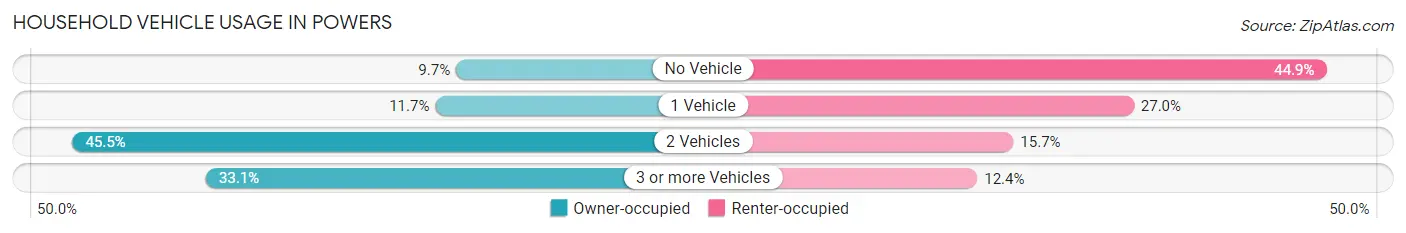
| Vehicles per Household | Owner-occupied | Renter-occupied |
| No Vehicle | 25 (9.7%) | 40 (44.9%) |
| 1 Vehicle | 30 (11.7%) | 24 (27.0%) |
| 2 Vehicles | 117 (45.5%) | 14 (15.7%) |
| 3 or more Vehicles | 85 (33.1%) | 11 (12.4%) |
| Total | 257 (100.0%) | 89 (100.0%) |
Real Estate & Mortgages in Powers
Real Estate and Mortgage Overview in Powers
| Characteristic | Without Mortgage | With Mortgage |
| Housing Units | 185 | 72 |
| Median Property Value | $97,200 | $169,400 |
| Median Household Income | $59,844 | $0 |
| Monthly Housing Costs | $413 | $0 |
| Real Estate Taxes | $1,174 | $0 |
Property Value by Mortgage Status in Powers
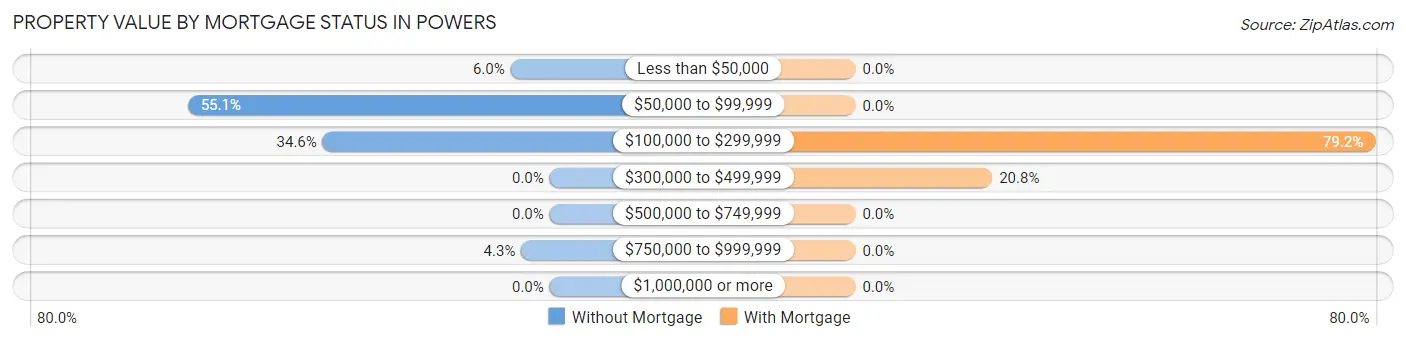
| Property Value | Without Mortgage | With Mortgage |
| Less than $50,000 | 11 (5.9%) | 0 (0.0%) |
| $50,000 to $99,999 | 102 (55.1%) | 0 (0.0%) |
| $100,000 to $299,999 | 64 (34.6%) | 57 (79.2%) |
| $300,000 to $499,999 | 0 (0.0%) | 15 (20.8%) |
| $500,000 to $749,999 | 0 (0.0%) | 0 (0.0%) |
| $750,000 to $999,999 | 8 (4.3%) | 0 (0.0%) |
| $1,000,000 or more | 0 (0.0%) | 0 (0.0%) |
| Total | 185 (100.0%) | 72 (100.0%) |
Household Income by Mortgage Status in Powers
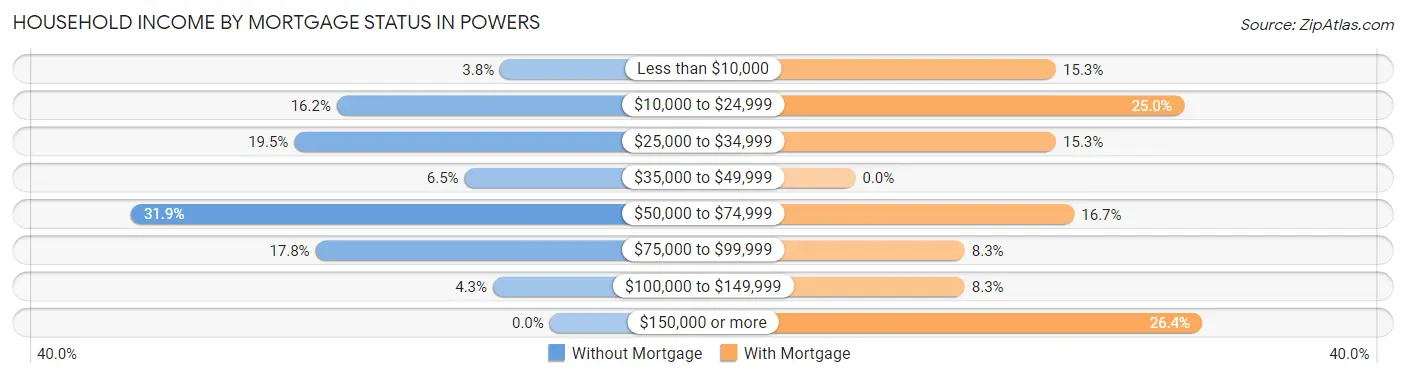
| Household Income | Without Mortgage | With Mortgage |
| Less than $10,000 | 7 (3.8%) | 11 (15.3%) |
| $10,000 to $24,999 | 30 (16.2%) | 18 (25.0%) |
| $25,000 to $34,999 | 36 (19.5%) | 11 (15.3%) |
| $35,000 to $49,999 | 12 (6.5%) | 0 (0.0%) |
| $50,000 to $74,999 | 59 (31.9%) | 12 (16.7%) |
| $75,000 to $99,999 | 33 (17.8%) | 6 (8.3%) |
| $100,000 to $149,999 | 8 (4.3%) | 6 (8.3%) |
| $150,000 or more | 0 (0.0%) | 19 (26.4%) |
| Total | 185 (100.0%) | 72 (100.0%) |
Property Value to Household Income Ratio in Powers
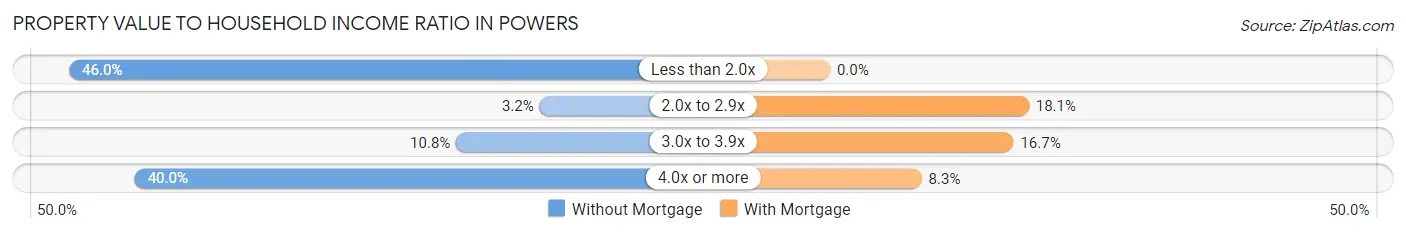
| Value-to-Income Ratio | Without Mortgage | With Mortgage |
| Less than 2.0x | 85 (46.0%) | 0 (0.0%) |
| 2.0x to 2.9x | 6 (3.2%) | 13 (18.1%) |
| 3.0x to 3.9x | 20 (10.8%) | 12 (16.7%) |
| 4.0x or more | 74 (40.0%) | 6 (8.3%) |
| Total | 185 (100.0%) | 72 (100.0%) |
Real Estate Taxes by Mortgage Status in Powers
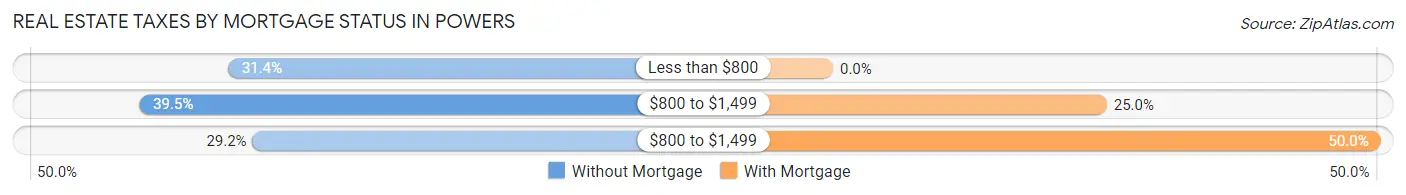
| Property Taxes | Without Mortgage | With Mortgage |
| Less than $800 | 58 (31.4%) | 0 (0.0%) |
| $800 to $1,499 | 73 (39.5%) | 18 (25.0%) |
| $800 to $1,499 | 54 (29.2%) | 36 (50.0%) |
| Total | 185 (100.0%) | 72 (100.0%) |
Health & Disability in Powers
Health Insurance Coverage by Age in Powers
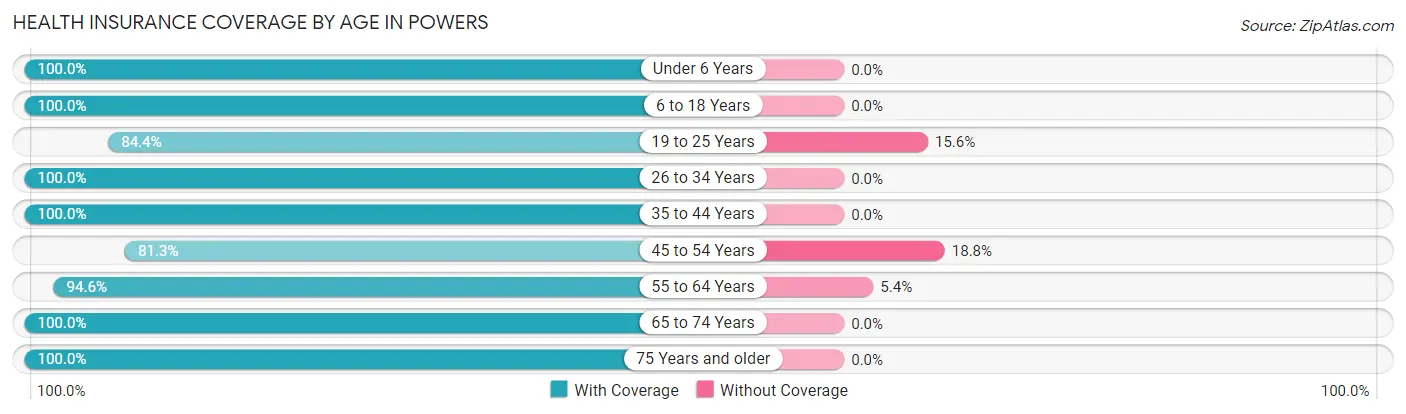
| Age Bracket | With Coverage | Without Coverage |
| Under 6 Years | 41 (100.0%) | 0 (0.0%) |
| 6 to 18 Years | 133 (100.0%) | 0 (0.0%) |
| 19 to 25 Years | 27 (84.4%) | 5 (15.6%) |
| 26 to 34 Years | 39 (100.0%) | 0 (0.0%) |
| 35 to 44 Years | 149 (100.0%) | 0 (0.0%) |
| 45 to 54 Years | 52 (81.2%) | 12 (18.8%) |
| 55 to 64 Years | 87 (94.6%) | 5 (5.4%) |
| 65 to 74 Years | 94 (100.0%) | 0 (0.0%) |
| 75 Years and older | 112 (100.0%) | 0 (0.0%) |
| Total | 734 (97.1%) | 22 (2.9%) |
Health Insurance Coverage by Citizenship Status in Powers
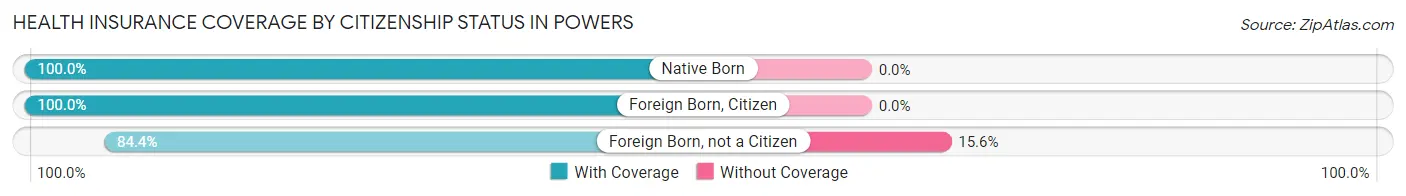
| Citizenship Status | With Coverage | Without Coverage |
| Native Born | 41 (100.0%) | 0 (0.0%) |
| Foreign Born, Citizen | 133 (100.0%) | 0 (0.0%) |
| Foreign Born, not a Citizen | 27 (84.4%) | 5 (15.6%) |
Health Insurance Coverage by Household Income in Powers
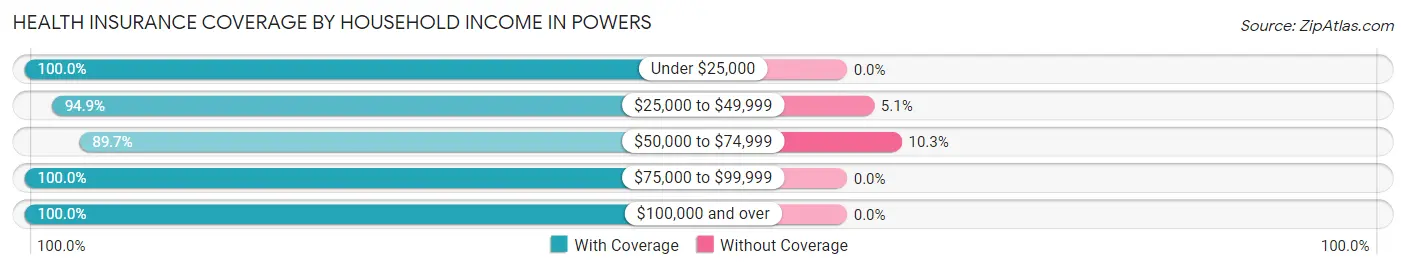
| Household Income | With Coverage | Without Coverage |
| Under $25,000 | 153 (100.0%) | 0 (0.0%) |
| $25,000 to $49,999 | 187 (94.9%) | 10 (5.1%) |
| $50,000 to $74,999 | 105 (89.7%) | 12 (10.3%) |
| $75,000 to $99,999 | 207 (100.0%) | 0 (0.0%) |
| $100,000 and over | 82 (100.0%) | 0 (0.0%) |
Public vs Private Health Insurance Coverage by Age in Powers
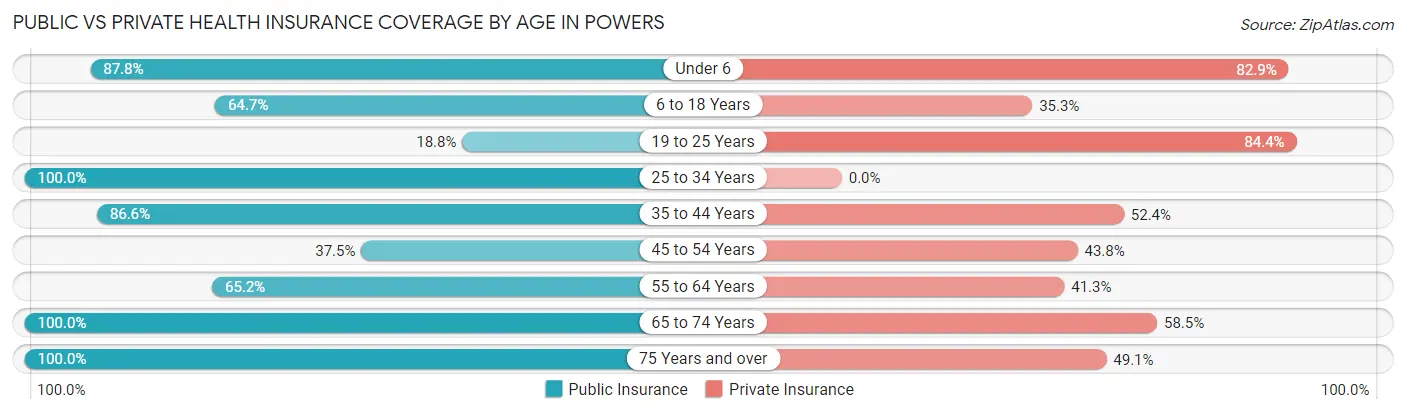
| Age Bracket | Public Insurance | Private Insurance |
| Under 6 | 36 (87.8%) | 34 (82.9%) |
| 6 to 18 Years | 86 (64.7%) | 47 (35.3%) |
| 19 to 25 Years | 6 (18.8%) | 27 (84.4%) |
| 25 to 34 Years | 39 (100.0%) | 0 (0.0%) |
| 35 to 44 Years | 129 (86.6%) | 78 (52.3%) |
| 45 to 54 Years | 24 (37.5%) | 28 (43.8%) |
| 55 to 64 Years | 60 (65.2%) | 38 (41.3%) |
| 65 to 74 Years | 94 (100.0%) | 55 (58.5%) |
| 75 Years and over | 112 (100.0%) | 55 (49.1%) |
| Total | 586 (77.5%) | 362 (47.9%) |
Disability Status by Sex by Age in Powers
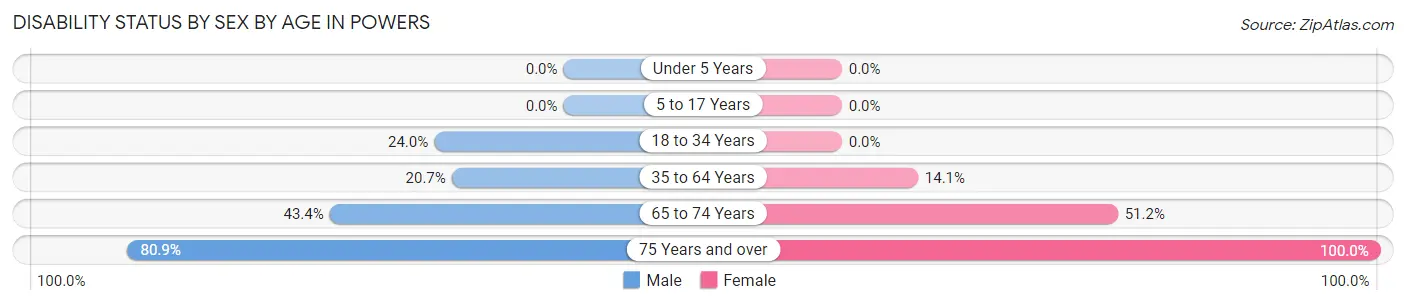
| Age Bracket | Male | Female |
| Under 5 Years | 0 (0.0%) | 0 (0.0%) |
| 5 to 17 Years | 0 (0.0%) | 0 (0.0%) |
| 18 to 34 Years | 18 (24.0%) | 0 (0.0%) |
| 35 to 64 Years | 28 (20.7%) | 24 (14.1%) |
| 65 to 74 Years | 23 (43.4%) | 21 (51.2%) |
| 75 Years and over | 55 (80.9%) | 44 (100.0%) |
Disability Class by Sex by Age in Powers
Disability Class: Hearing Difficulty
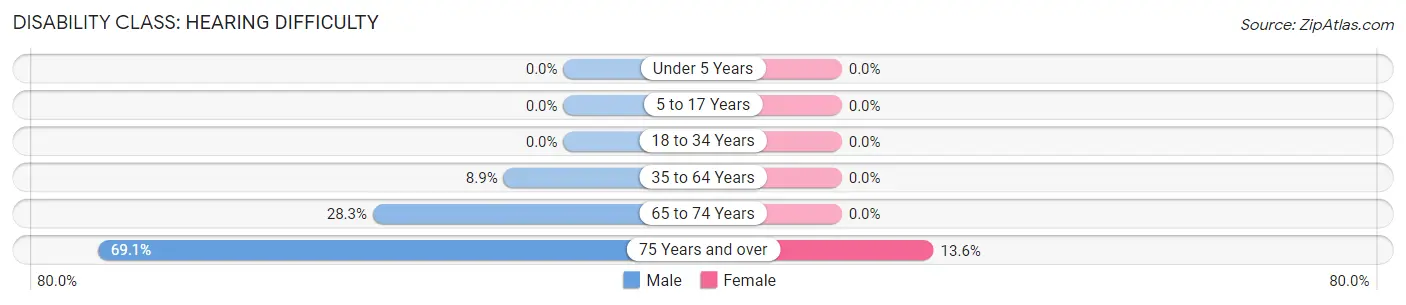
| Age Bracket | Male | Female |
| Under 5 Years | 0 (0.0%) | 0 (0.0%) |
| 5 to 17 Years | 0 (0.0%) | 0 (0.0%) |
| 18 to 34 Years | 0 (0.0%) | 0 (0.0%) |
| 35 to 64 Years | 12 (8.9%) | 0 (0.0%) |
| 65 to 74 Years | 15 (28.3%) | 0 (0.0%) |
| 75 Years and over | 47 (69.1%) | 6 (13.6%) |
Disability Class: Vision Difficulty
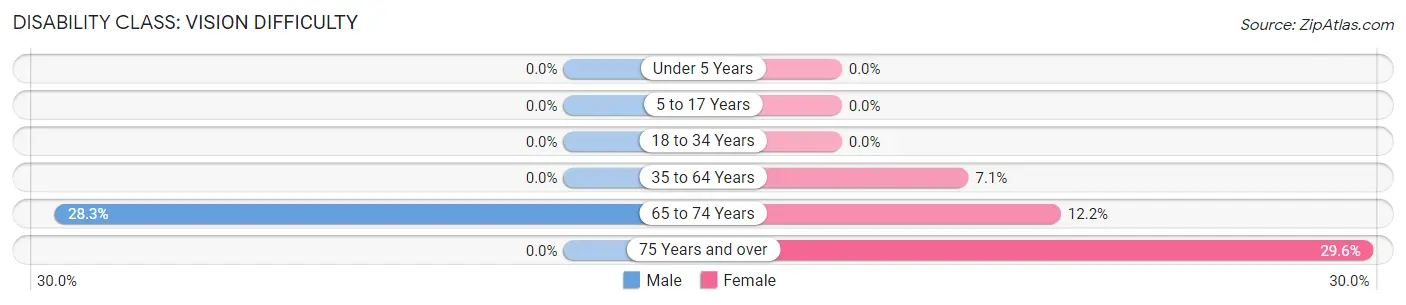
| Age Bracket | Male | Female |
| Under 5 Years | 0 (0.0%) | 0 (0.0%) |
| 5 to 17 Years | 0 (0.0%) | 0 (0.0%) |
| 18 to 34 Years | 0 (0.0%) | 0 (0.0%) |
| 35 to 64 Years | 0 (0.0%) | 12 (7.1%) |
| 65 to 74 Years | 15 (28.3%) | 5 (12.2%) |
| 75 Years and over | 0 (0.0%) | 13 (29.5%) |
Disability Class: Cognitive Difficulty
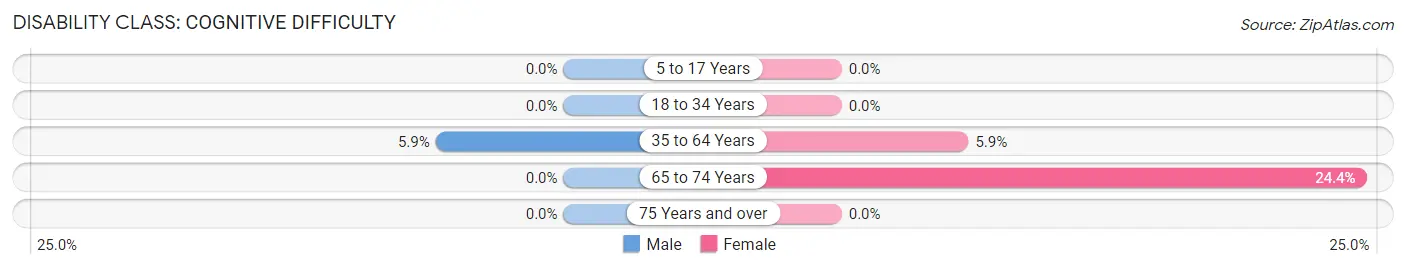
| Age Bracket | Male | Female |
| 5 to 17 Years | 0 (0.0%) | 0 (0.0%) |
| 18 to 34 Years | 0 (0.0%) | 0 (0.0%) |
| 35 to 64 Years | 8 (5.9%) | 10 (5.9%) |
| 65 to 74 Years | 0 (0.0%) | 10 (24.4%) |
| 75 Years and over | 0 (0.0%) | 0 (0.0%) |
Disability Class: Ambulatory Difficulty
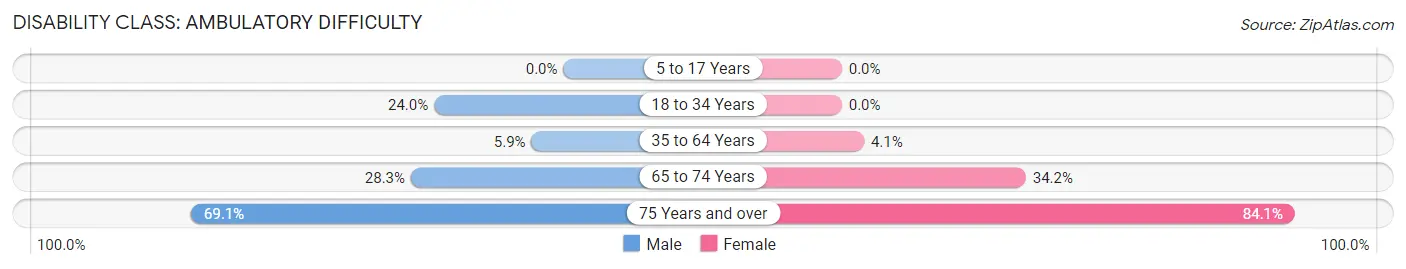
| Age Bracket | Male | Female |
| 5 to 17 Years | 0 (0.0%) | 0 (0.0%) |
| 18 to 34 Years | 18 (24.0%) | 0 (0.0%) |
| 35 to 64 Years | 8 (5.9%) | 7 (4.1%) |
| 65 to 74 Years | 15 (28.3%) | 14 (34.2%) |
| 75 Years and over | 47 (69.1%) | 37 (84.1%) |
Disability Class: Self-Care Difficulty
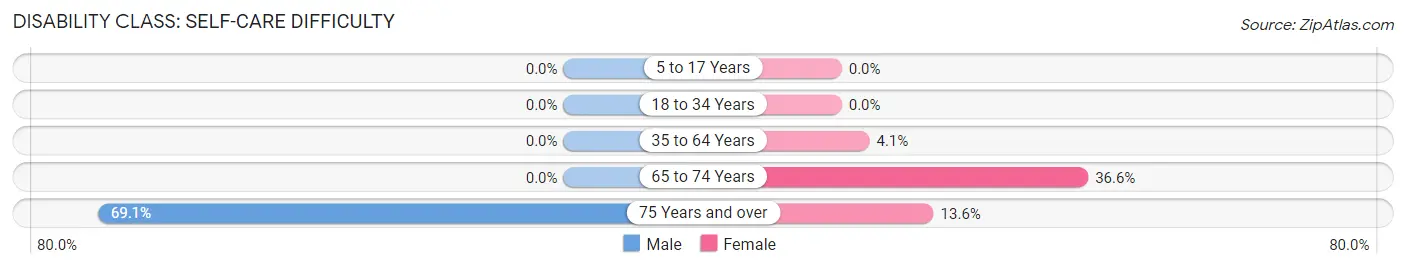
| Age Bracket | Male | Female |
| 5 to 17 Years | 0 (0.0%) | 0 (0.0%) |
| 18 to 34 Years | 0 (0.0%) | 0 (0.0%) |
| 35 to 64 Years | 0 (0.0%) | 7 (4.1%) |
| 65 to 74 Years | 0 (0.0%) | 15 (36.6%) |
| 75 Years and over | 47 (69.1%) | 6 (13.6%) |
Technology Access in Powers
Computing Device Access in Powers
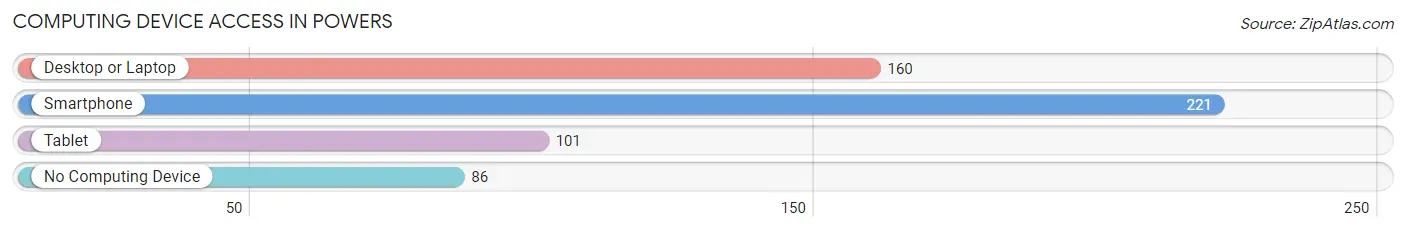
| Device Type | # Households | % Households |
| Desktop or Laptop | 160 | 46.2% |
| Smartphone | 221 | 63.9% |
| Tablet | 101 | 29.2% |
| No Computing Device | 86 | 24.9% |
| Total | 346 | 100.0% |
Internet Access in Powers
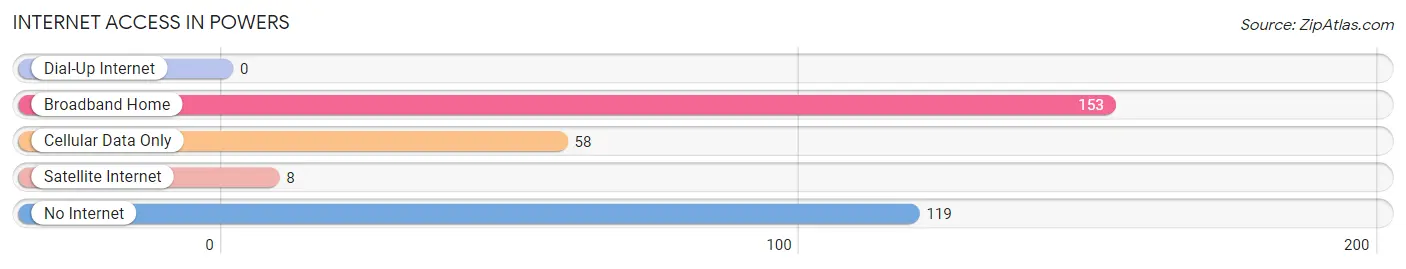
| Internet Type | # Households | % Households |
| Dial-Up Internet | 0 | 0.0% |
| Broadband Home | 153 | 44.2% |
| Cellular Data Only | 58 | 16.8% |
| Satellite Internet | 8 | 2.3% |
| No Internet | 119 | 34.4% |
| Total | 346 | 100.0% |
Powers Summary
Powers, Oregon is a small unincorporated community located in Coos County, Oregon. It is situated on the Coos River, approximately 10 miles east of Coquille. The population of Powers was estimated to be 1,093 in 2019.
History
Powers was founded in 1891 by William Powers, a lumberman from Coquille. He purchased a large tract of land along the Coos River and began to build a sawmill. The mill was completed in 1892 and the town of Powers was established. The town was named after William Powers and was incorporated in 1895.
The town grew rapidly in the early 1900s, with the sawmill providing employment for many of the residents. The town also had a general store, a post office, a hotel, and a school. In the 1920s, the sawmill was replaced by a pulp mill, which provided employment for many of the town’s residents.
Geography
Powers is located in the Coos River Valley, approximately 10 miles east of Coquille. The town is situated on the banks of the Coos River, which flows through the town. The surrounding area is mostly forested, with the nearby hills providing a scenic backdrop.
Economy
The economy of Powers is largely based on the timber industry. The town is home to several sawmills and pulp mills, which provide employment for many of the town’s residents. The town also has a few small businesses, including a general store, a post office, and a hotel.
Demographics
As of 2019, the population of Powers was estimated to be 1,093. The town is predominantly white, with the majority of the population being of European descent. The median household income in Powers is $37,941, which is lower than the national average. The town has a poverty rate of 16.3%, which is higher than the national average.
Conclusion
Powers, Oregon is a small unincorporated community located in Coos County, Oregon. It is situated on the Coos River, approximately 10 miles east of Coquille. The town was founded in 1891 by William Powers and has a population of 1,093 as of 2019. The economy of Powers is largely based on the timber industry, with several sawmills and pulp mills providing employment for many of the town’s residents. The town is predominantly white, with the majority of the population being of European descent. The median household income in Powers is $37,941, which is lower than the national average.
Common Questions
What is Per Capita Income in Powers?
Per Capita income in Powers is $21,628.
What is the Median Family Income in Powers?
Median Family Income in Powers is $59,018.
What is the Median Household income in Powers?
Median Household Income in Powers is $37,000.
What is Income or Wage Gap in Powers?
Income or Wage Gap in Powers is 60.6%.
Women in Powers earn 39.4 cents for every dollar earned by a man.
What is Inequality or Gini Index in Powers?
Inequality or Gini Index in Powers is 0.45.
What is the Total Population of Powers?
Total Population of Powers is 756.
What is the Total Male Population of Powers?
Total Male Population of Powers is 398.
What is the Total Female Population of Powers?
Total Female Population of Powers is 358.
What is the Ratio of Males per 100 Females in Powers?
There are 111.17 Males per 100 Females in Powers.
What is the Ratio of Females per 100 Males in Powers?
There are 89.95 Females per 100 Males in Powers.
What is the Median Population Age in Powers?
Median Population Age in Powers is 43.4 Years.
What is the Average Family Size in Powers
Average Family Size in Powers is 3.2 People.
What is the Average Household Size in Powers
Average Household Size in Powers is 2.2 People.
How Large is the Labor Force in Powers?
There are 264 People in the Labor Forcein in Powers.
What is the Percentage of People in the Labor Force in Powers?
43.1% of People are in the Labor Force in Powers.
What is the Unemployment Rate in Powers?
Unemployment Rate in Powers is 12.9%.