Zip Codes with the Highest Percentage of Population with a Degree in Engineering in Oregon
RELATED REPORTS & OPTIONS
Engineering
Oregon
Compare Zip Codes
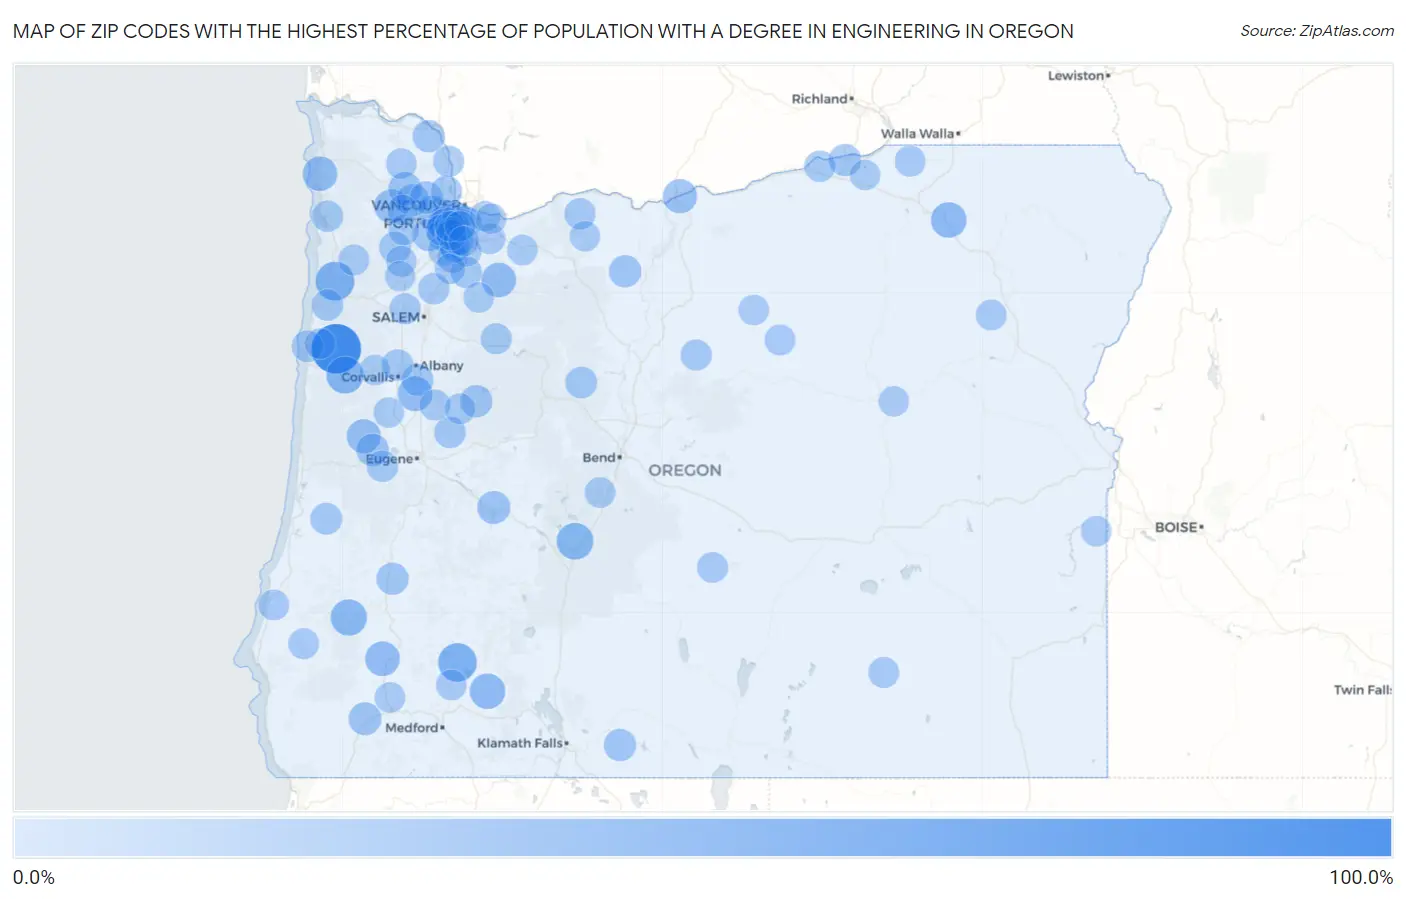
Map of Zip Codes with the Highest Percentage of Population with a Degree in Engineering in Oregon
0.0%
100.0%
Zip Codes with the Highest Percentage of Population with a Degree in Engineering in Oregon
| Zip Code | % Graduates | vs State | vs National | |
| 1. | 97357 | 100.0% | 7.0%(+93.0)#1 | 7.6%(+92.4)#24 |
| 2. | 97122 | 47.1% | 7.0%(+40.0)#2 | 7.6%(+39.4)#155 |
| 3. | 97541 | 46.4% | 7.0%(+39.4)#3 | 7.6%(+38.8)#160 |
| 4. | 97343 | 38.9% | 7.0%(+31.9)#4 | 7.6%(+31.2)#224 |
| 5. | 97737 | 37.3% | 7.0%(+30.3)#5 | 7.6%(+29.7)#247 |
| 6. | 97416 | 35.2% | 7.0%(+28.2)#6 | 7.6%(+27.6)#270 |
| 7. | 97859 | 31.4% | 7.0%(+24.4)#7 | 7.6%(+23.8)#341 |
| 8. | 97522 | 31.2% | 7.0%(+24.2)#8 | 7.6%(+23.6)#346 |
| 9. | 97377 | 28.4% | 7.0%(+21.4)#9 | 7.6%(+20.8)#419 |
| 10. | 97442 | 27.4% | 7.0%(+20.4)#10 | 7.6%(+19.8)#447 |
| 11. | 97102 | 27.1% | 7.0%(+20.0)#11 | 7.6%(+19.4)#457 |
| 12. | 97017 | 27.0% | 7.0%(+20.0)#12 | 7.6%(+19.4)#459 |
| 13. | 97050 | 25.0% | 7.0%(+18.0)#13 | 7.6%(+17.4)#557 |
| 14. | 97117 | 24.5% | 7.0%(+17.5)#14 | 7.6%(+16.9)#578 |
| 15. | 97412 | 24.2% | 7.0%(+17.2)#15 | 7.6%(+16.6)#591 |
| 16. | 97124 | 22.1% | 7.0%(+15.1)#16 | 7.6%(+14.4)#716 |
| 17. | 97109 | 20.0% | 7.0%(+13.0)#17 | 7.6%(+12.4)#913 |
| 18. | 97463 | 19.7% | 7.0%(+12.7)#18 | 7.6%(+12.1)#944 |
| 19. | 97543 | 19.4% | 7.0%(+12.4)#19 | 7.6%(+11.8)#978 |
| 20. | 97229 | 19.4% | 7.0%(+12.4)#20 | 7.6%(+11.7)#981 |
| 21. | 97006 | 19.1% | 7.0%(+12.0)#21 | 7.6%(+11.4)#1,013 |
| 22. | 97106 | 17.6% | 7.0%(+10.5)#22 | 7.6%(+9.92)#1,213 |
| 23. | 97133 | 17.4% | 7.0%(+10.4)#23 | 7.6%(+9.75)#1,234 |
| 24. | 97461 | 17.4% | 7.0%(+10.3)#24 | 7.6%(+9.72)#1,247 |
| 25. | 97345 | 17.3% | 7.0%(+10.3)#25 | 7.6%(+9.66)#1,258 |
| 26. | 97204 | 17.1% | 7.0%(+10.1)#26 | 7.6%(+9.50)#1,290 |
| 27. | 97623 | 16.6% | 7.0%(+9.60)#27 | 7.6%(+8.98)#1,386 |
| 28. | 97063 | 16.0% | 7.0%(+8.94)#28 | 7.6%(+8.32)#1,507 |
| 29. | 97048 | 15.9% | 7.0%(+8.86)#29 | 7.6%(+8.24)#1,525 |
| 30. | 97882 | 15.8% | 7.0%(+8.77)#30 | 7.6%(+8.15)#1,543 |
| 31. | 97495 | 15.7% | 7.0%(+8.66)#31 | 7.6%(+8.03)#1,568 |
| 32. | 97123 | 15.7% | 7.0%(+8.65)#32 | 7.6%(+8.02)#1,572 |
| 33. | 97389 | 15.0% | 7.0%(+8.00)#33 | 7.6%(+7.37)#1,745 |
| 34. | 97003 | 14.6% | 7.0%(+7.55)#34 | 7.6%(+6.93)#1,847 |
| 35. | 97148 | 13.9% | 7.0%(+6.86)#35 | 7.6%(+6.23)#2,068 |
| 36. | 97473 | 13.8% | 7.0%(+6.77)#36 | 7.6%(+6.15)#2,101 |
| 37. | 97730 | 13.8% | 7.0%(+6.73)#37 | 7.6%(+6.10)#2,120 |
| 38. | 97454 | 12.9% | 7.0%(+5.91)#38 | 7.6%(+5.28)#2,433 |
| 39. | 97369 | 12.8% | 7.0%(+5.80)#39 | 7.6%(+5.17)#2,486 |
| 40. | 97368 | 12.4% | 7.0%(+5.36)#40 | 7.6%(+4.73)#2,691 |
| 41. | 97330 | 12.3% | 7.0%(+5.28)#41 | 7.6%(+4.65)#2,749 |
| 42. | 97026 | 12.2% | 7.0%(+5.16)#42 | 7.6%(+4.54)#2,805 |
| 43. | 97107 | 11.8% | 7.0%(+4.82)#43 | 7.6%(+4.19)#2,978 |
| 44. | 97224 | 11.7% | 7.0%(+4.69)#44 | 7.6%(+4.07)#3,045 |
| 45. | 97371 | 11.6% | 7.0%(+4.59)#45 | 7.6%(+3.97)#3,105 |
| 46. | 97844 | 11.6% | 7.0%(+4.56)#46 | 7.6%(+3.93)#3,121 |
| 47. | 97487 | 11.4% | 7.0%(+4.40)#47 | 7.6%(+3.77)#3,236 |
| 48. | 97031 | 11.3% | 7.0%(+4.30)#48 | 7.6%(+3.68)#3,304 |
| 49. | 97007 | 11.3% | 7.0%(+4.30)#49 | 7.6%(+3.68)#3,305 |
| 50. | 97140 | 11.3% | 7.0%(+4.30)#50 | 7.6%(+3.67)#3,314 |
| 51. | 97078 | 11.3% | 7.0%(+4.29)#51 | 7.6%(+3.66)#3,317 |
| 52. | 97013 | 11.2% | 7.0%(+4.23)#52 | 7.6%(+3.60)#3,363 |
| 53. | 97231 | 11.2% | 7.0%(+4.21)#53 | 7.6%(+3.59)#3,374 |
| 54. | 97201 | 11.1% | 7.0%(+4.10)#54 | 7.6%(+3.48)#3,445 |
| 55. | 97711 | 11.1% | 7.0%(+4.09)#55 | 7.6%(+3.46)#3,488 |
| 56. | 97018 | 10.8% | 7.0%(+3.78)#56 | 7.6%(+3.15)#3,699 |
| 57. | 97358 | 10.4% | 7.0%(+3.36)#57 | 7.6%(+2.74)#4,096 |
| 58. | 97108 | 10.3% | 7.0%(+3.32)#58 | 7.6%(+2.70)#4,135 |
| 59. | 97327 | 10.0% | 7.0%(+3.02)#59 | 7.6%(+2.39)#4,407 |
| 60. | 97466 | 10.0% | 7.0%(+2.98)#60 | 7.6%(+2.35)#4,446 |
| 61. | 97736 | 10.0% | 7.0%(+2.98)#61 | 7.6%(+2.35)#4,471 |
| 62. | 97119 | 9.6% | 7.0%(+2.61)#62 | 7.6%(+1.98)#4,827 |
| 63. | 97111 | 9.6% | 7.0%(+2.53)#63 | 7.6%(+1.90)#4,920 |
| 64. | 97835 | 9.5% | 7.0%(+2.50)#64 | 7.6%(+1.88)#4,948 |
| 65. | 97641 | 9.5% | 7.0%(+2.47)#65 | 7.6%(+1.84)#4,985 |
| 66. | 97089 | 9.5% | 7.0%(+2.43)#66 | 7.6%(+1.81)#5,021 |
| 67. | 97064 | 9.3% | 7.0%(+2.33)#67 | 7.6%(+1.70)#5,147 |
| 68. | 97386 | 9.3% | 7.0%(+2.29)#68 | 7.6%(+1.67)#5,184 |
| 69. | 97874 | 9.3% | 7.0%(+2.28)#69 | 7.6%(+1.65)#5,201 |
| 70. | 97070 | 9.3% | 7.0%(+2.23)#70 | 7.6%(+1.61)#5,253 |
| 71. | 97225 | 9.1% | 7.0%(+2.08)#71 | 7.6%(+1.45)#5,442 |
| 72. | 97833 | 9.0% | 7.0%(+2.00)#72 | 7.6%(+1.38)#5,561 |
| 73. | 97210 | 9.0% | 7.0%(+1.93)#73 | 7.6%(+1.31)#5,680 |
| 74. | 97707 | 8.9% | 7.0%(+1.91)#74 | 7.6%(+1.29)#5,695 |
| 75. | 97411 | 8.9% | 7.0%(+1.87)#75 | 7.6%(+1.24)#5,749 |
| 76. | 97380 | 8.9% | 7.0%(+1.87)#76 | 7.6%(+1.24)#5,752 |
| 77. | 97539 | 8.8% | 7.0%(+1.78)#77 | 7.6%(+1.15)#5,875 |
| 78. | 97116 | 8.7% | 7.0%(+1.66)#78 | 7.6%(+1.04)#6,030 |
| 79. | 97055 | 8.6% | 7.0%(+1.62)#79 | 7.6%(+0.998)#6,092 |
| 80. | 97068 | 8.6% | 7.0%(+1.57)#80 | 7.6%(+0.941)#6,161 |
| 81. | 97526 | 8.5% | 7.0%(+1.47)#81 | 7.6%(+0.850)#6,283 |
| 82. | 97008 | 8.4% | 7.0%(+1.39)#82 | 7.6%(+0.761)#6,408 |
| 83. | 97830 | 8.4% | 7.0%(+1.37)#83 | 7.6%(+0.744)#6,434 |
| 84. | 97230 | 8.4% | 7.0%(+1.33)#84 | 7.6%(+0.706)#6,492 |
| 85. | 97062 | 8.3% | 7.0%(+1.31)#85 | 7.6%(+0.684)#6,546 |
| 86. | 97035 | 8.3% | 7.0%(+1.26)#86 | 7.6%(+0.630)#6,617 |
| 87. | 97223 | 8.2% | 7.0%(+1.21)#87 | 7.6%(+0.582)#6,702 |
| 88. | 97901 | 8.2% | 7.0%(+1.21)#88 | 7.6%(+0.580)#6,706 |
| 89. | 97875 | 8.2% | 7.0%(+1.14)#89 | 7.6%(+0.516)#6,809 |
| 90. | 97370 | 8.2% | 7.0%(+1.13)#90 | 7.6%(+0.508)#6,834 |
| 91. | 97038 | 8.0% | 7.0%(+0.981)#91 | 7.6%(+0.356)#7,080 |
| 92. | 97002 | 8.0% | 7.0%(+0.943)#92 | 7.6%(+0.319)#7,153 |
| 93. | 97845 | 7.9% | 7.0%(+0.919)#93 | 7.6%(+0.295)#7,194 |
| 94. | 97005 | 7.9% | 7.0%(+0.889)#94 | 7.6%(+0.264)#7,253 |
| 95. | 97456 | 7.8% | 7.0%(+0.820)#95 | 7.6%(+0.196)#7,373 |
| 96. | 97128 | 7.7% | 7.0%(+0.720)#96 | 7.6%(+0.095)#7,537 |
| 97. | 97221 | 7.7% | 7.0%(+0.699)#97 | 7.6%(+0.074)#7,591 |
| 98. | 97024 | 7.7% | 7.0%(+0.663)#98 | 7.6%(+0.038)#7,678 |
| 99. | 97041 | 7.7% | 7.0%(+0.649)#99 | 7.6%(+0.024)#7,703 |
| 100. | 97034 | 7.6% | 7.0%(+0.563)#100 | 7.6%(-0.062)#7,859 |
Common Questions
What are the Top 10 Zip Codes with the Highest Percentage of Population with a Degree in Engineering in Oregon?
Top 10 Zip Codes with the Highest Percentage of Population with a Degree in Engineering in Oregon are:
What zip code has the Highest Percentage of Population with a Degree in Engineering in Oregon?
97357 has the Highest Percentage of Population with a Degree in Engineering in Oregon with 100.0%.
What is the Percentage of Population with a Degree in Engineering in the State of Oregon?
Percentage of Population with a Degree in Engineering in Oregon is 7.0%.
What is the Percentage of Population with a Degree in Engineering in the United States?
Percentage of Population with a Degree in Engineering in the United States is 7.6%.