Oak Grove, OR Map & Demographics
Oak Grove Map
Oak Grove Overview
$40,925
PER CAPITA INCOME
$90,000
AVG FAMILY INCOME
$79,066
AVG HOUSEHOLD INCOME
9.9%
WAGE / INCOME GAP [ % ]
90.1¢/ $1
WAGE / INCOME GAP [ $ ]
0.40
INEQUALITY / GINI INDEX
17,535
TOTAL POPULATION
8,837
MALE POPULATION
8,698
FEMALE POPULATION
101.60
MALES / 100 FEMALES
98.43
FEMALES / 100 MALES
43.5
MEDIAN AGE
3.0
AVG FAMILY SIZE
2.4
AVG HOUSEHOLD SIZE
9,103
LABOR FORCE [ PEOPLE ]
60.6%
PERCENT IN LABOR FORCE
8.0%
UNEMPLOYMENT RATE
Income in Oak Grove
Income Overview in Oak Grove
Per Capita Income in Oak Grove is $40,925, while median incomes of families and households are $90,000 and $79,066 respectively.
| Characteristic | Number | Measure |
| Per Capita Income | 17,535 | $40,925 |
| Median Family Income | 4,284 | $90,000 |
| Mean Family Income | 4,284 | $110,282 |
| Median Household Income | 7,278 | $79,066 |
| Mean Household Income | 7,278 | $96,276 |
| Income Deficit | 4,284 | $0 |
| Wage / Income Gap (%) | 17,535 | 9.94% |
| Wage / Income Gap ($) | 17,535 | 90.06¢ per $1 |
| Gini / Inequality Index | 17,535 | 0.40 |
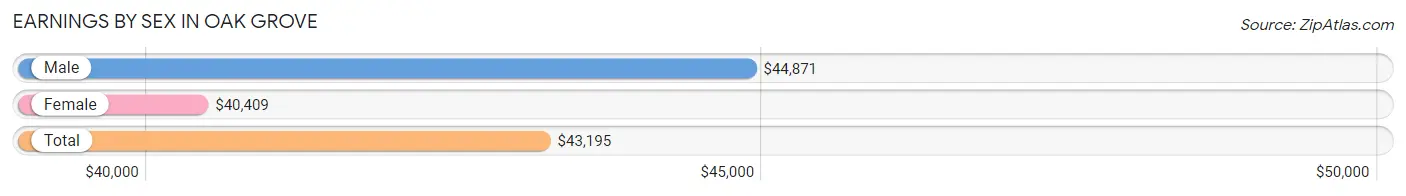
Earnings by Sex in Oak Grove
Average Earnings in Oak Grove are $43,195, $44,871 for men and $40,409 for women, a difference of 9.9%.
| Sex | Number | Average Earnings |
| Male | 4,691 (50.6%) | $44,871 |
| Female | 4,571 (49.3%) | $40,409 |
| Total | 9,262 (100.0%) | $43,195 |
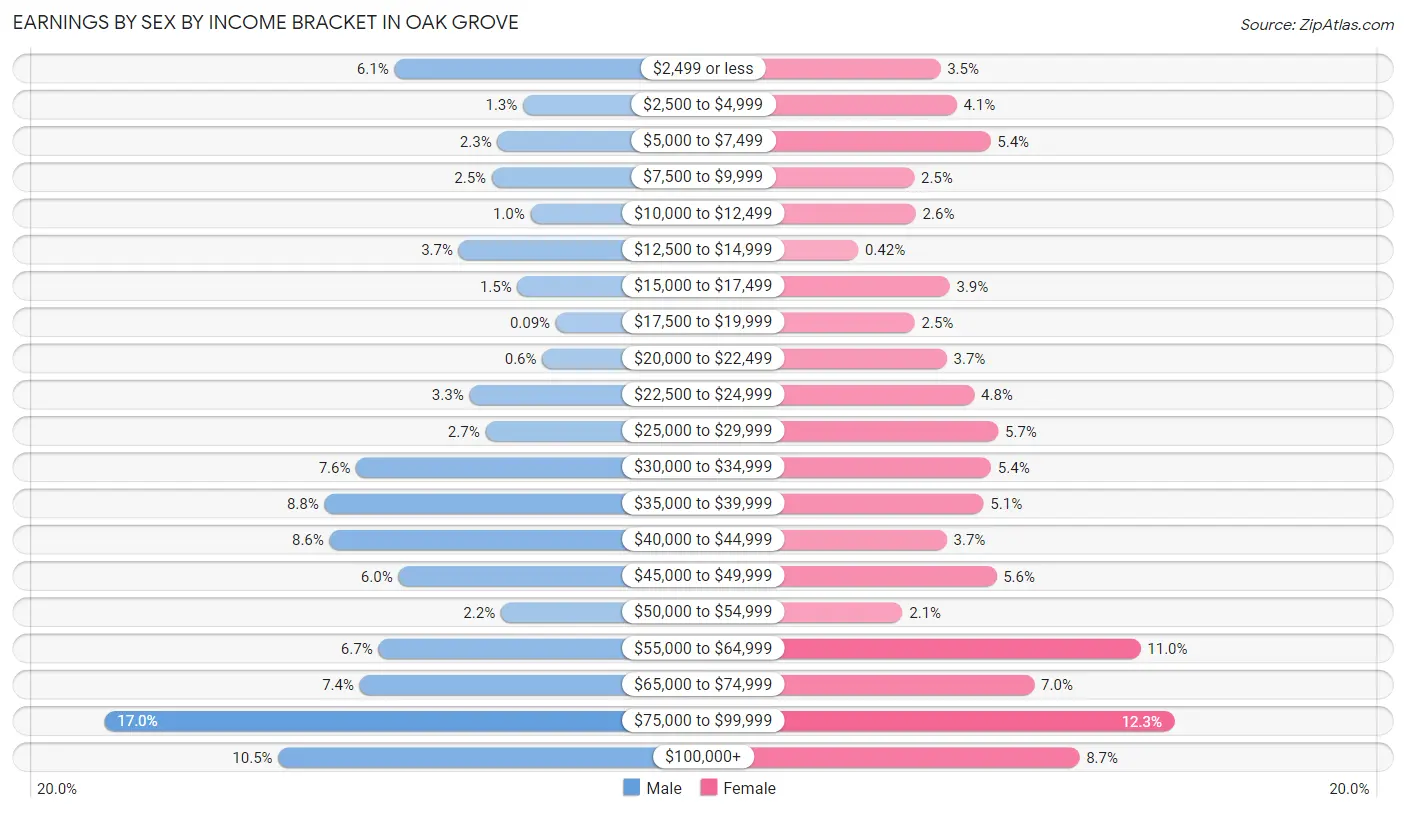
Earnings by Sex by Income Bracket in Oak Grove
The most common earnings brackets in Oak Grove are $75,000 to $99,999 for men (798 | 17.0%) and $75,000 to $99,999 for women (560 | 12.2%).
| Income | Male | Female |
| $2,499 or less | 288 (6.1%) | 160 (3.5%) |
| $2,500 to $4,999 | 62 (1.3%) | 188 (4.1%) |
| $5,000 to $7,499 | 107 (2.3%) | 246 (5.4%) |
| $7,500 to $9,999 | 117 (2.5%) | 115 (2.5%) |
| $10,000 to $12,499 | 49 (1.0%) | 118 (2.6%) |
| $12,500 to $14,999 | 175 (3.7%) | 19 (0.4%) |
| $15,000 to $17,499 | 72 (1.5%) | 176 (3.8%) |
| $17,500 to $19,999 | 4 (0.1%) | 116 (2.5%) |
| $20,000 to $22,499 | 28 (0.6%) | 171 (3.7%) |
| $22,500 to $24,999 | 156 (3.3%) | 218 (4.8%) |
| $25,000 to $29,999 | 128 (2.7%) | 259 (5.7%) |
| $30,000 to $34,999 | 355 (7.6%) | 247 (5.4%) |
| $35,000 to $39,999 | 411 (8.8%) | 234 (5.1%) |
| $40,000 to $44,999 | 402 (8.6%) | 171 (3.7%) |
| $45,000 to $49,999 | 281 (6.0%) | 256 (5.6%) |
| $50,000 to $54,999 | 101 (2.1%) | 95 (2.1%) |
| $55,000 to $64,999 | 316 (6.7%) | 503 (11.0%) |
| $65,000 to $74,999 | 349 (7.4%) | 321 (7.0%) |
| $75,000 to $99,999 | 798 (17.0%) | 560 (12.2%) |
| $100,000+ | 492 (10.5%) | 398 (8.7%) |
| Total | 4,691 (100.0%) | 4,571 (100.0%) |
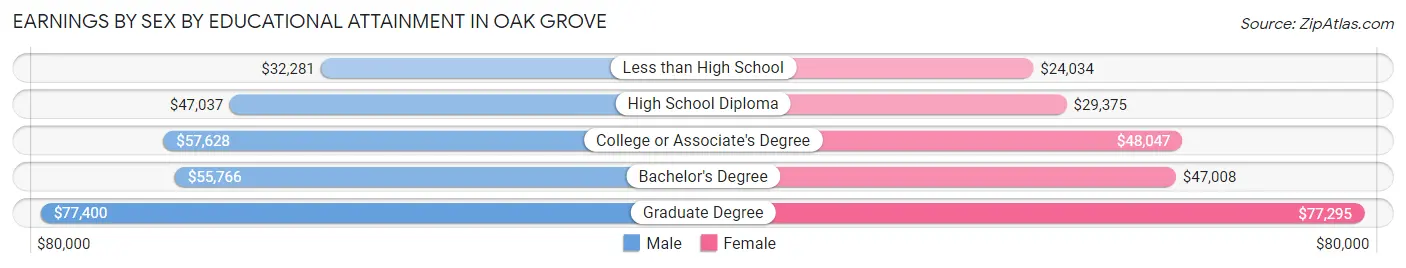
Earnings by Sex by Educational Attainment in Oak Grove
Average earnings in Oak Grove are $50,106 for men and $47,167 for women, a difference of 5.9%. Men with an educational attainment of graduate degree enjoy the highest average annual earnings of $77,400, while those with less than high school education earn the least with $32,281. Women with an educational attainment of graduate degree earn the most with the average annual earnings of $77,295, while those with less than high school education have the smallest earnings of $24,034.
| Educational Attainment | Male Income | Female Income |
| Less than High School | $32,281 | $24,034 |
| High School Diploma | $47,037 | $29,375 |
| College or Associate's Degree | $57,628 | $48,047 |
| Bachelor's Degree | $55,766 | $47,008 |
| Graduate Degree | $77,400 | $77,295 |
| Total | $50,106 | $47,167 |
Family Income in Oak Grove
Family Income Brackets in Oak Grove
According to the Oak Grove family income data, there are 900 families falling into the $100,000 to $149,999 income range, which is the most common income bracket and makes up 21.0% of all families. Conversely, the $10,000 to $14,999 income bracket is the least frequent group with only 51 families (1.2%) belonging to this category.
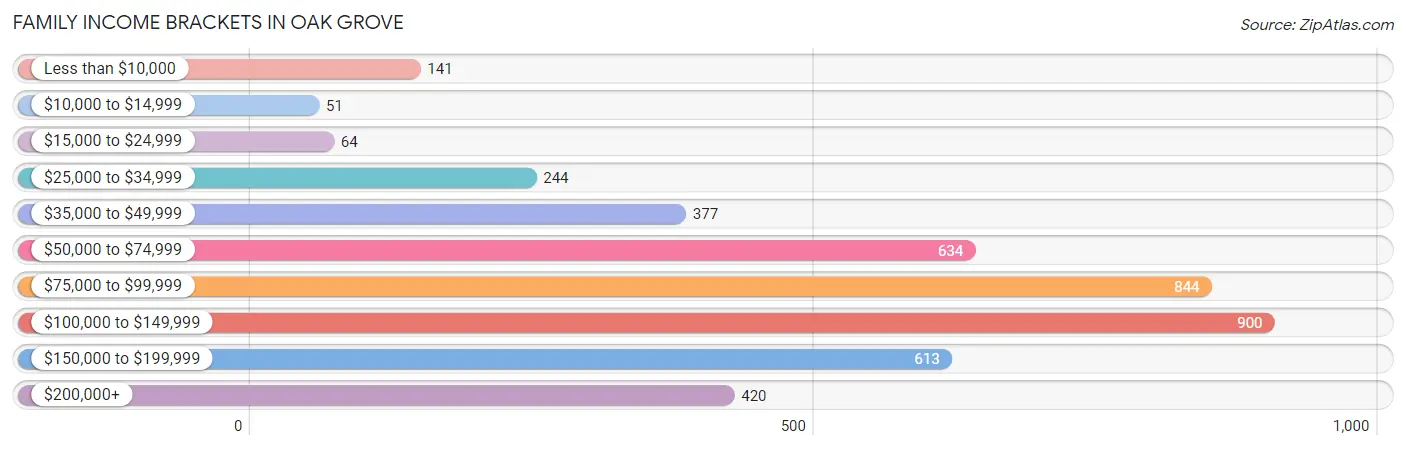
| Income Bracket | # Families | % Families |
| Less than $10,000 | 141 | 3.3% |
| $10,000 to $14,999 | 51 | 1.2% |
| $15,000 to $24,999 | 64 | 1.5% |
| $25,000 to $34,999 | 244 | 5.7% |
| $35,000 to $49,999 | 377 | 8.8% |
| $50,000 to $74,999 | 634 | 14.8% |
| $75,000 to $99,999 | 844 | 19.7% |
| $100,000 to $149,999 | 900 | 21.0% |
| $150,000 to $199,999 | 613 | 14.3% |
| $200,000+ | 420 | 9.8% |
Family Income by Famaliy Size in Oak Grove
5-person families (191 | 4.5%) account for the highest median family income in Oak Grove with $140,268 per family, while 2-person families (2,357 | 55.0%) have the highest median income of $39,155 per family member.
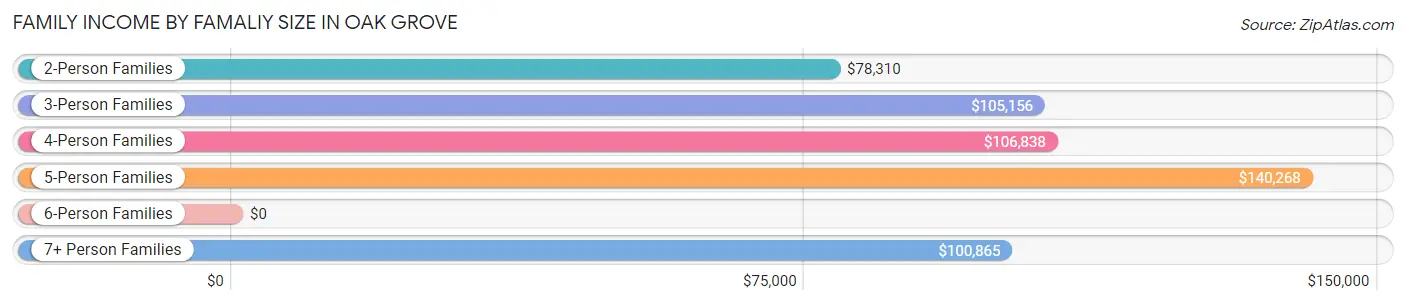
| Income Bracket | # Families | Median Income |
| 2-Person Families | 2,357 (55.0%) | $78,310 |
| 3-Person Families | 1,014 (23.7%) | $105,156 |
| 4-Person Families | 479 (11.2%) | $106,838 |
| 5-Person Families | 191 (4.5%) | $140,268 |
| 6-Person Families | 105 (2.5%) | $0 |
| 7+ Person Families | 138 (3.2%) | $100,865 |
| Total | 4,284 (100.0%) | $90,000 |
Family Income by Number of Earners in Oak Grove
The median family income in Oak Grove is $90,000, with families comprising 3+ earners (683) having the highest median family income of $137,297, while families with no earners (976) have the lowest median family income of $61,900, accounting for 15.9% and 22.8% of families, respectively.
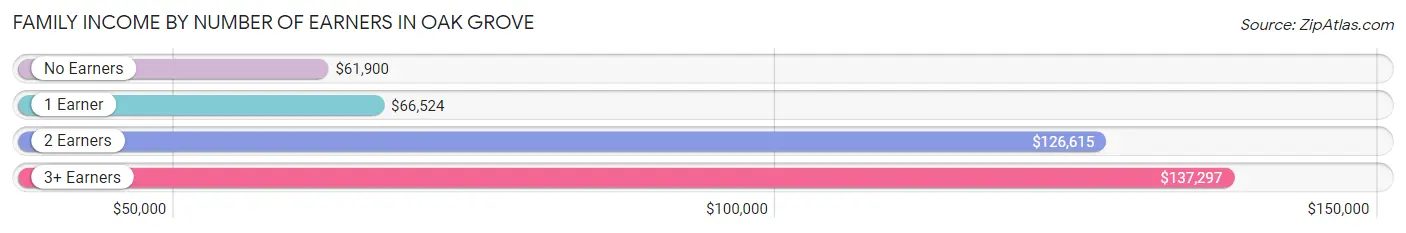
| Number of Earners | # Families | Median Income |
| No Earners | 976 (22.8%) | $61,900 |
| 1 Earner | 1,292 (30.2%) | $66,524 |
| 2 Earners | 1,333 (31.1%) | $126,615 |
| 3+ Earners | 683 (15.9%) | $137,297 |
| Total | 4,284 (100.0%) | $90,000 |
Household Income in Oak Grove
Household Income Brackets in Oak Grove
With 1,346 households falling in the category, the $75,000 to $99,999 income range is the most frequent in Oak Grove, accounting for 18.5% of all households. In contrast, only 66 households (0.9%) fall into the $10,000 to $14,999 income bracket, making it the least populous group.
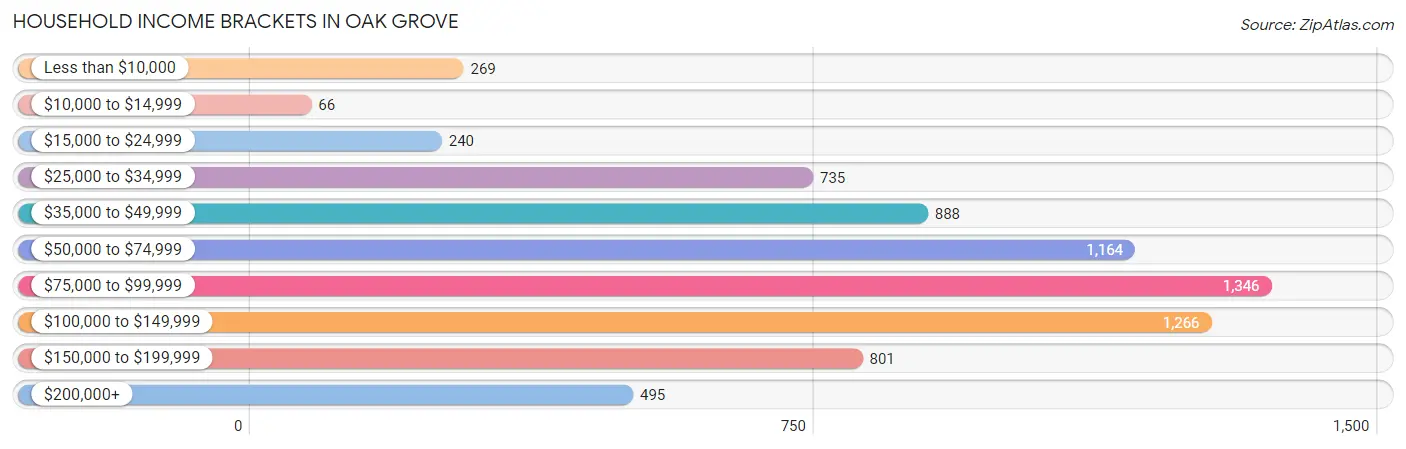
| Income Bracket | # Households | % Households |
| Less than $10,000 | 269 | 3.7% |
| $10,000 to $14,999 | 66 | 0.9% |
| $15,000 to $24,999 | 240 | 3.3% |
| $25,000 to $34,999 | 735 | 10.1% |
| $35,000 to $49,999 | 888 | 12.2% |
| $50,000 to $74,999 | 1,164 | 16.0% |
| $75,000 to $99,999 | 1,346 | 18.5% |
| $100,000 to $149,999 | 1,266 | 17.4% |
| $150,000 to $199,999 | 801 | 11.0% |
| $200,000+ | 495 | 6.8% |
Household Income by Householder Age in Oak Grove
The median household income in Oak Grove is $79,066, with the highest median household income of $95,869 found in the 25 to 44 years age bracket for the primary householder. A total of 2,296 households (31.6%) fall into this category. Meanwhile, the 15 to 24 years age bracket for the primary householder has the lowest median household income of $42,394, with 242 households (3.3%) in this group.
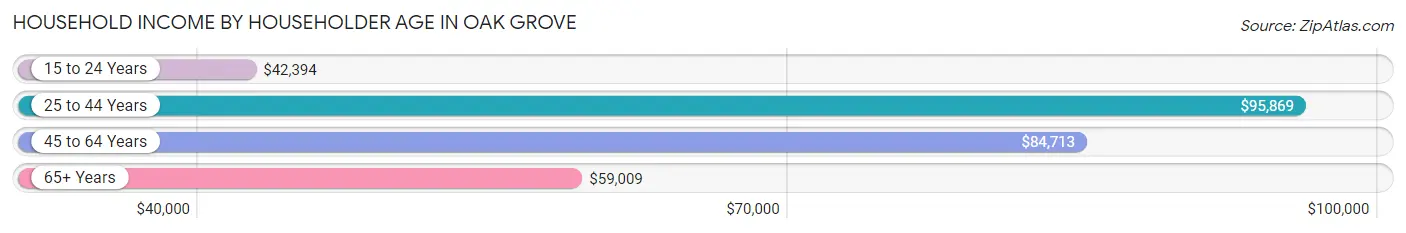
| Income Bracket | # Households | Median Income |
| 15 to 24 Years | 242 (3.3%) | $42,394 |
| 25 to 44 Years | 2,296 (31.6%) | $95,869 |
| 45 to 64 Years | 2,088 (28.7%) | $84,713 |
| 65+ Years | 2,652 (36.4%) | $59,009 |
| Total | 7,278 (100.0%) | $79,066 |
Poverty in Oak Grove
Income Below Poverty by Sex and Age in Oak Grove
With 10.0% poverty level for males and 8.3% for females among the residents of Oak Grove, 55 to 64 year old males and 18 to 24 year old females are the most vulnerable to poverty, with 185 males (18.3%) and 221 females (30.9%) in their respective age groups living below the poverty level.
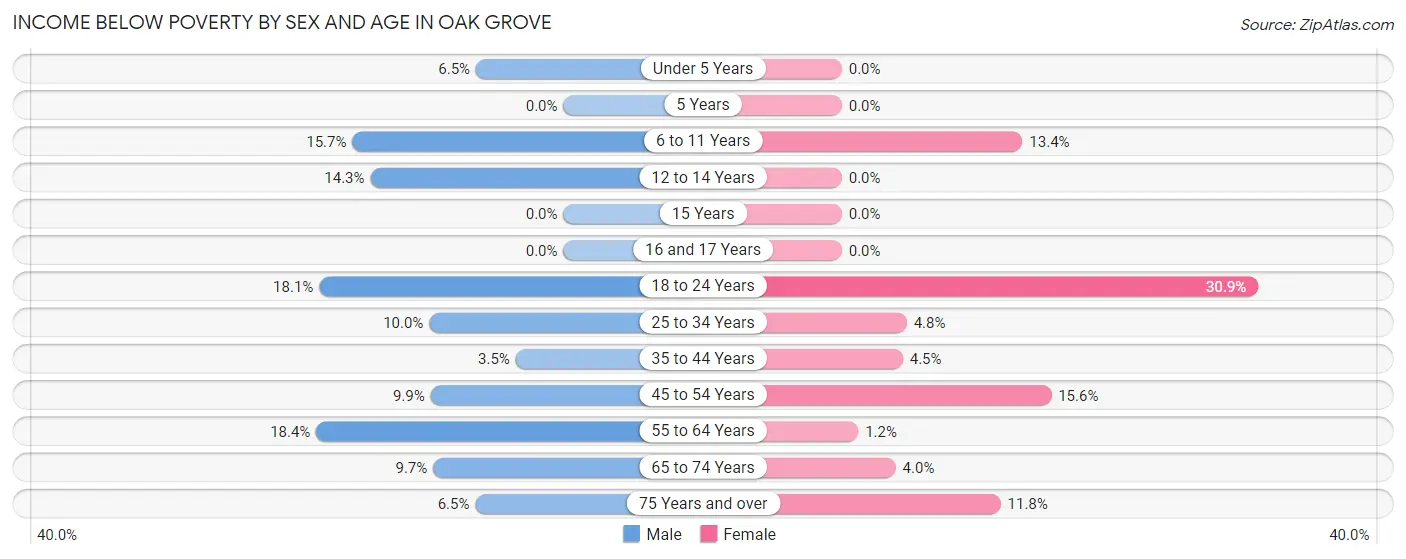
| Age Bracket | Male | Female |
| Under 5 Years | 29 (6.5%) | 0 (0.0%) |
| 5 Years | 0 (0.0%) | 0 (0.0%) |
| 6 to 11 Years | 60 (15.7%) | 59 (13.4%) |
| 12 to 14 Years | 45 (14.3%) | 0 (0.0%) |
| 15 Years | 0 (0.0%) | 0 (0.0%) |
| 16 and 17 Years | 0 (0.0%) | 0 (0.0%) |
| 18 to 24 Years | 126 (18.1%) | 221 (30.9%) |
| 25 to 34 Years | 124 (10.0%) | 45 (4.8%) |
| 35 to 44 Years | 47 (3.5%) | 70 (4.5%) |
| 45 to 54 Years | 96 (9.9%) | 148 (15.5%) |
| 55 to 64 Years | 185 (18.3%) | 12 (1.2%) |
| 65 to 74 Years | 111 (9.7%) | 47 (4.0%) |
| 75 Years and over | 54 (6.5%) | 119 (11.8%) |
| Total | 877 (10.0%) | 721 (8.3%) |
Income Above Poverty by Sex and Age in Oak Grove
According to the poverty statistics in Oak Grove, males aged 5 years and females aged under 5 years are the age groups that are most secure financially, with 100.0% of males and 100.0% of females in these age groups living above the poverty line.
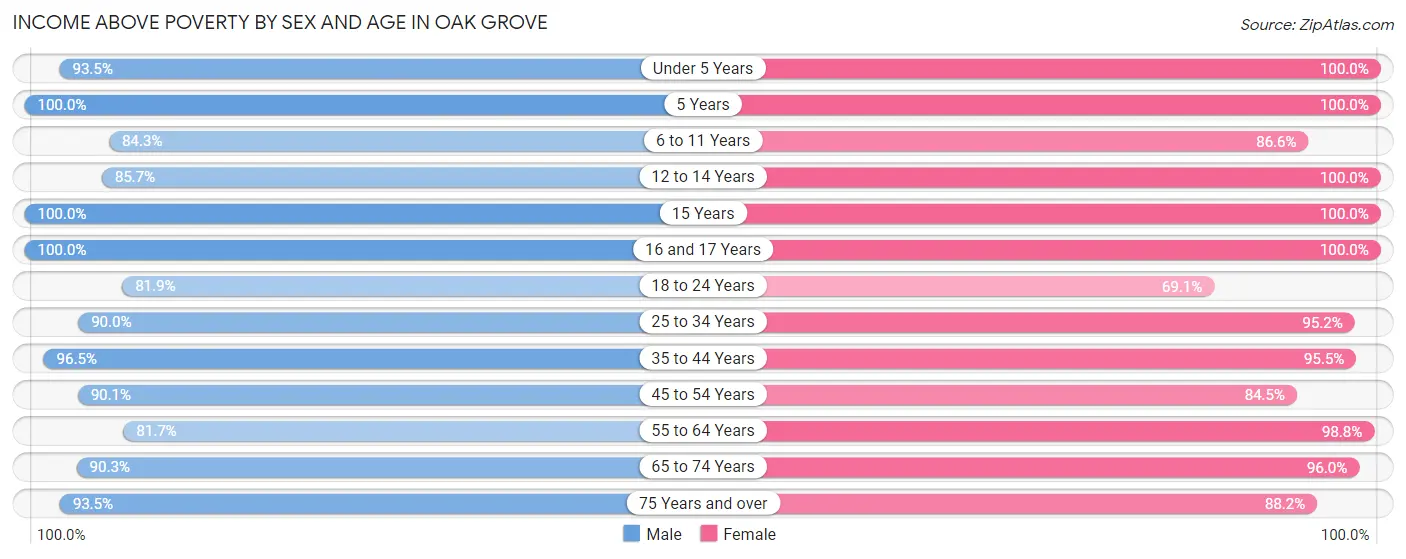
| Age Bracket | Male | Female |
| Under 5 Years | 418 (93.5%) | 328 (100.0%) |
| 5 Years | 106 (100.0%) | 82 (100.0%) |
| 6 to 11 Years | 323 (84.3%) | 381 (86.6%) |
| 12 to 14 Years | 269 (85.7%) | 224 (100.0%) |
| 15 Years | 117 (100.0%) | 67 (100.0%) |
| 16 and 17 Years | 223 (100.0%) | 202 (100.0%) |
| 18 to 24 Years | 569 (81.9%) | 494 (69.1%) |
| 25 to 34 Years | 1,121 (90.0%) | 888 (95.2%) |
| 35 to 44 Years | 1,282 (96.5%) | 1,476 (95.5%) |
| 45 to 54 Years | 878 (90.1%) | 804 (84.5%) |
| 55 to 64 Years | 823 (81.7%) | 969 (98.8%) |
| 65 to 74 Years | 1,037 (90.3%) | 1,127 (96.0%) |
| 75 Years and over | 772 (93.5%) | 890 (88.2%) |
| Total | 7,938 (90.0%) | 7,932 (91.7%) |
Income Below Poverty Among Married-Couple Families in Oak Grove
The poverty statistics for married-couple families in Oak Grove show that 1.0% or 30 of the total 3,048 families live below the poverty line. Families with no children have the highest poverty rate of 1.5%, comprising of 30 families. On the other hand, families with 1 or 2 children have the lowest poverty rate of 0.0%, which includes 0 families.
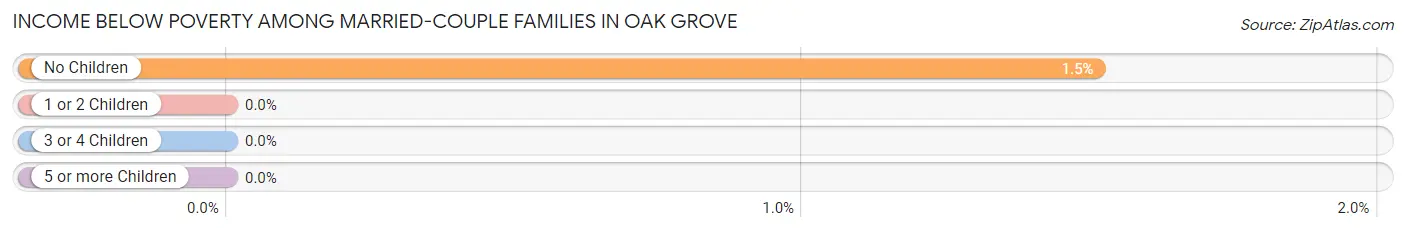
| Children | Above Poverty | Below Poverty |
| No Children | 1,952 (98.5%) | 30 (1.5%) |
| 1 or 2 Children | 780 (100.0%) | 0 (0.0%) |
| 3 or 4 Children | 180 (100.0%) | 0 (0.0%) |
| 5 or more Children | 106 (100.0%) | 0 (0.0%) |
| Total | 3,018 (99.0%) | 30 (1.0%) |
Income Below Poverty Among Single-Parent Households in Oak Grove
According to the poverty data in Oak Grove, 20.4% or 76 single-father households and 13.8% or 119 single-mother households are living below the poverty line. Among single-father households, those with no children have the highest poverty rate, with 52 households (22.1%) experiencing poverty. Likewise, among single-mother households, those with 1 or 2 children have the highest poverty rate, with 119 households (24.5%) falling below the poverty line.
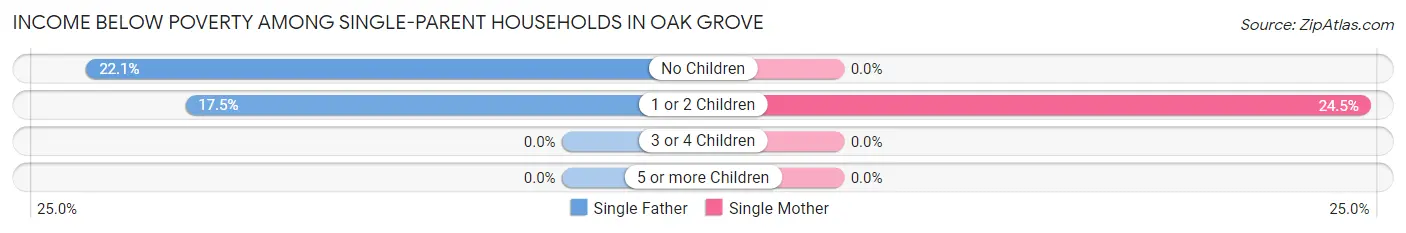
| Children | Single Father | Single Mother |
| No Children | 52 (22.1%) | 0 (0.0%) |
| 1 or 2 Children | 24 (17.5%) | 119 (24.5%) |
| 3 or 4 Children | 0 (0.0%) | 0 (0.0%) |
| 5 or more Children | 0 (0.0%) | 0 (0.0%) |
| Total | 76 (20.4%) | 119 (13.8%) |
Income Below Poverty Among Married-Couple vs Single-Parent Households in Oak Grove
The poverty data for Oak Grove shows that 30 of the married-couple family households (1.0%) and 195 of the single-parent households (15.8%) are living below the poverty level. Within the married-couple family households, those with no children have the highest poverty rate, with 30 households (1.5%) falling below the poverty line. Among the single-parent households, those with 1 or 2 children have the highest poverty rate, with 143 household (23.0%) living below poverty.
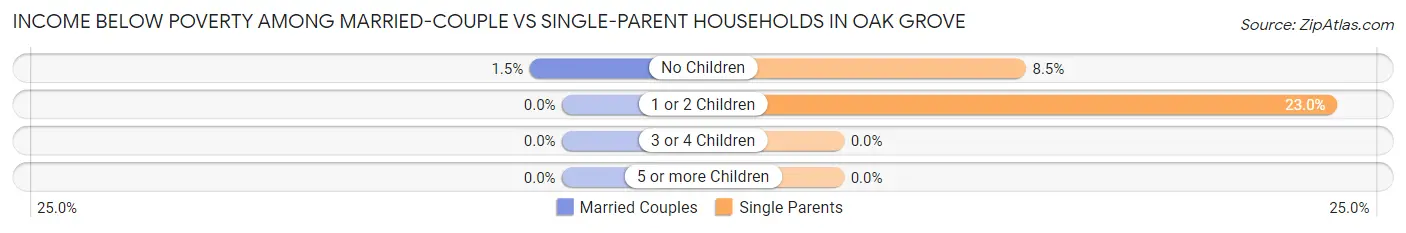
| Children | Married-Couple Families | Single-Parent Households |
| No Children | 30 (1.5%) | 52 (8.5%) |
| 1 or 2 Children | 0 (0.0%) | 143 (23.0%) |
| 3 or 4 Children | 0 (0.0%) | 0 (0.0%) |
| 5 or more Children | 0 (0.0%) | 0 (0.0%) |
| Total | 30 (1.0%) | 195 (15.8%) |
Race in Oak Grove
The most populous races in Oak Grove are White / Caucasian (14,859 | 84.7%), Hispanic or Latino (1,779 | 10.2%), and Two or more Races (1,292 | 7.4%).
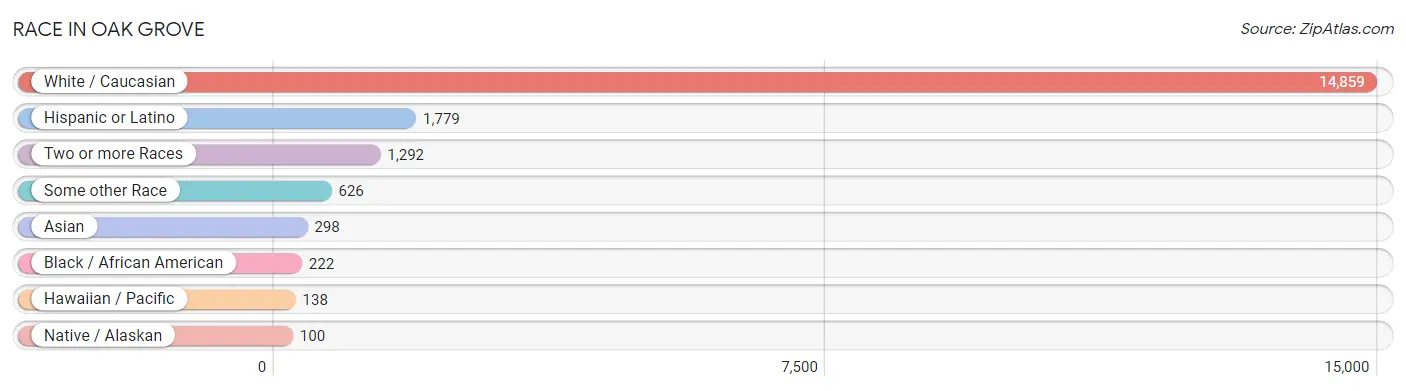
| Race | # Population | % Population |
| Asian | 298 | 1.7% |
| Black / African American | 222 | 1.3% |
| Hawaiian / Pacific | 138 | 0.8% |
| Hispanic or Latino | 1,779 | 10.2% |
| Native / Alaskan | 100 | 0.6% |
| White / Caucasian | 14,859 | 84.7% |
| Two or more Races | 1,292 | 7.4% |
| Some other Race | 626 | 3.6% |
| Total | 17,535 | 100.0% |
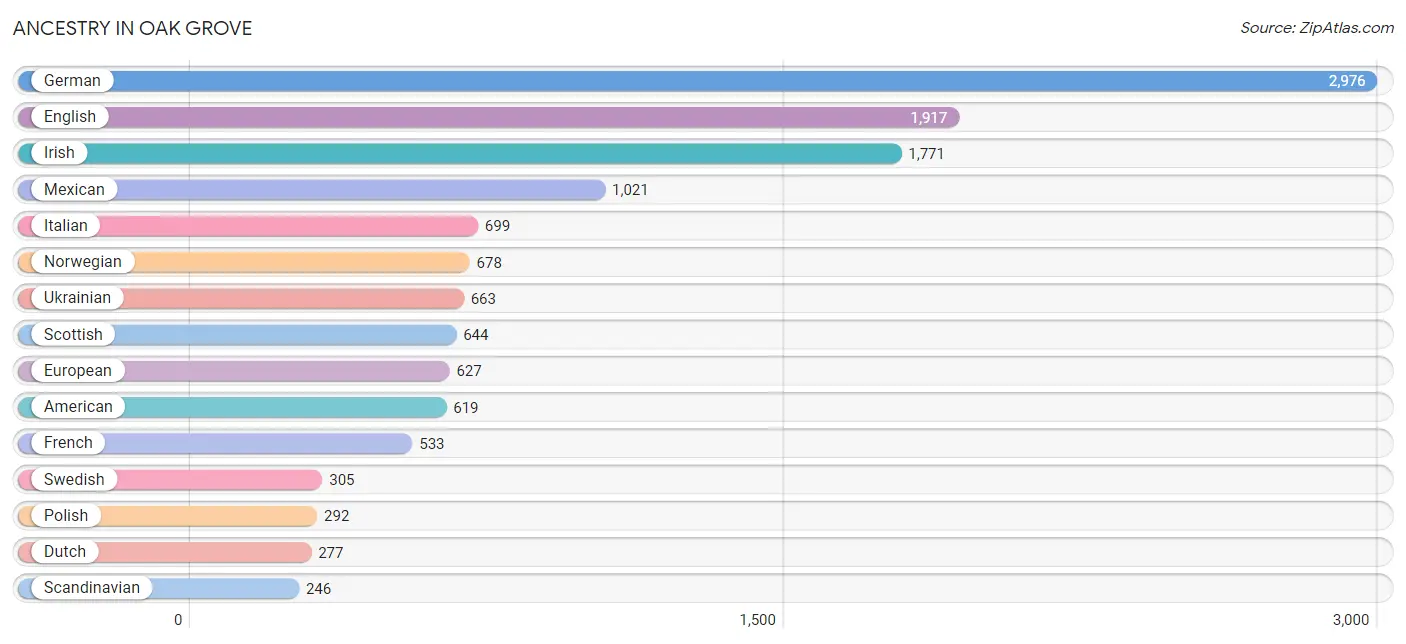
Ancestry in Oak Grove
The most populous ancestries reported in Oak Grove are German (2,976 | 17.0%), English (1,917 | 10.9%), Irish (1,771 | 10.1%), Mexican (1,021 | 5.8%), and Italian (699 | 4.0%), together accounting for 47.8% of all Oak Grove residents.
| Ancestry | # Population | % Population |
| African | 4 | 0.0% |
| American | 619 | 3.5% |
| Arab | 206 | 1.2% |
| Argentinean | 11 | 0.1% |
| Armenian | 82 | 0.5% |
| Austrian | 87 | 0.5% |
| Belgian | 37 | 0.2% |
| Bhutanese | 25 | 0.1% |
| Blackfeet | 17 | 0.1% |
| British | 153 | 0.9% |
| Burmese | 85 | 0.5% |
| Canadian | 10 | 0.1% |
| Central American | 196 | 1.1% |
| Cherokee | 130 | 0.7% |
| Chippewa | 15 | 0.1% |
| Choctaw | 25 | 0.1% |
| Colville | 4 | 0.0% |
| Costa Rican | 77 | 0.4% |
| Croatian | 16 | 0.1% |
| Czech | 70 | 0.4% |
| Danish | 123 | 0.7% |
| Dutch | 277 | 1.6% |
| Eastern European | 149 | 0.9% |
| Egyptian | 6 | 0.0% |
| English | 1,917 | 10.9% |
| Estonian | 7 | 0.0% |
| Ethiopian | 15 | 0.1% |
| European | 627 | 3.6% |
| Finnish | 139 | 0.8% |
| French | 533 | 3.0% |
| French Canadian | 113 | 0.6% |
| German | 2,976 | 17.0% |
| Greek | 50 | 0.3% |
| Guamanian / Chamorro | 8 | 0.1% |
| Honduran | 45 | 0.3% |
| Hungarian | 178 | 1.0% |
| Indian (Asian) | 163 | 0.9% |
| Inupiat | 19 | 0.1% |
| Iranian | 140 | 0.8% |
| Irish | 1,771 | 10.1% |
| Italian | 699 | 4.0% |
| Korean | 162 | 0.9% |
| Laotian | 12 | 0.1% |
| Lithuanian | 47 | 0.3% |
| Luxembourger | 11 | 0.1% |
| Mexican | 1,021 | 5.8% |
| Moroccan | 200 | 1.1% |
| Native Hawaiian | 159 | 0.9% |
| Nicaraguan | 5 | 0.0% |
| Nigerian | 16 | 0.1% |
| Northern European | 120 | 0.7% |
| Norwegian | 678 | 3.9% |
| Pennsylvania German | 19 | 0.1% |
| Peruvian | 33 | 0.2% |
| Polish | 292 | 1.7% |
| Portuguese | 46 | 0.3% |
| Puerto Rican | 122 | 0.7% |
| Romanian | 69 | 0.4% |
| Russian | 104 | 0.6% |
| Salvadoran | 69 | 0.4% |
| Scandinavian | 246 | 1.4% |
| Scotch-Irish | 223 | 1.3% |
| Scottish | 644 | 3.7% |
| Sierra Leonean | 5 | 0.0% |
| South American | 44 | 0.3% |
| Spaniard | 58 | 0.3% |
| Spanish | 91 | 0.5% |
| Sri Lankan | 51 | 0.3% |
| Subsaharan African | 40 | 0.2% |
| Swedish | 305 | 1.7% |
| Swiss | 74 | 0.4% |
| Thai | 52 | 0.3% |
| Tlingit-Haida | 52 | 0.3% |
| Ukrainian | 663 | 3.8% |
| Welsh | 194 | 1.1% |
| Yugoslavian | 38 | 0.2% | View All 76 Rows |
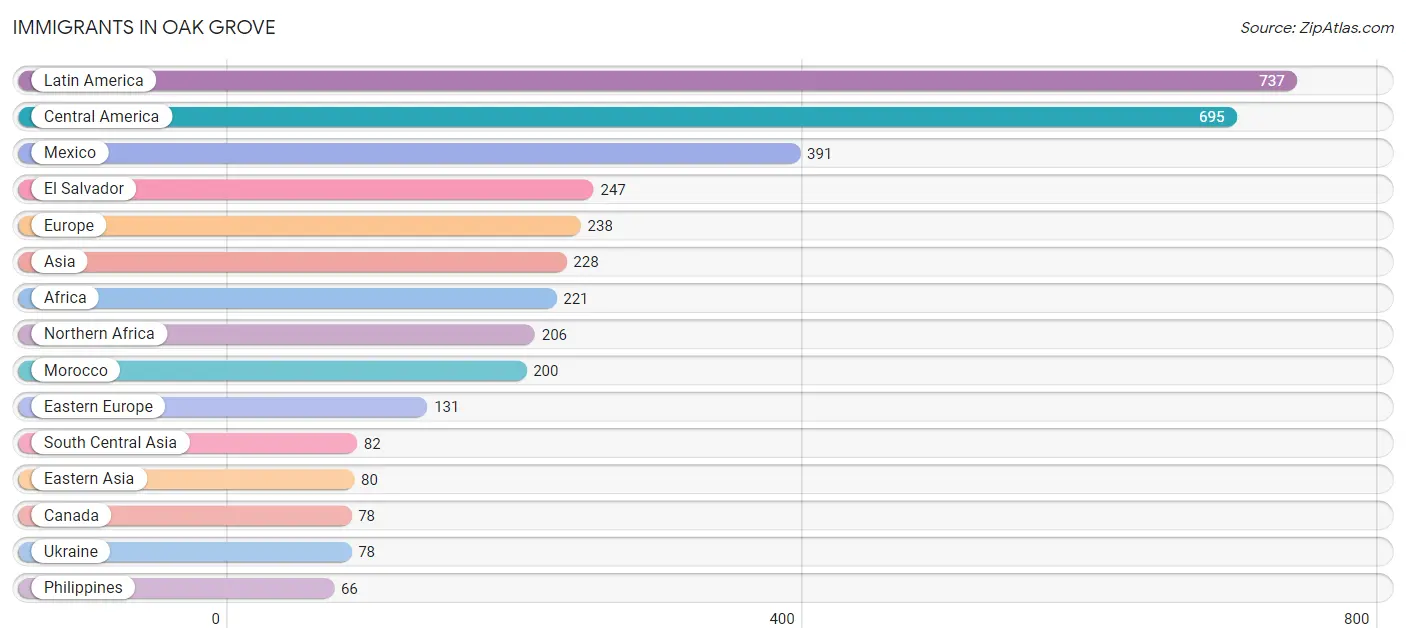
Immigrants in Oak Grove
The most numerous immigrant groups reported in Oak Grove came from Latin America (737 | 4.2%), Central America (695 | 4.0%), Mexico (391 | 2.2%), El Salvador (247 | 1.4%), and Europe (238 | 1.4%), together accounting for 13.2% of all Oak Grove residents.
| Immigration Origin | # Population | % Population |
| Africa | 221 | 1.3% |
| Asia | 228 | 1.3% |
| Australia | 10 | 0.1% |
| Belgium | 6 | 0.0% |
| Brazil | 9 | 0.1% |
| Canada | 78 | 0.4% |
| Central America | 695 | 4.0% |
| China | 40 | 0.2% |
| Eastern Asia | 80 | 0.5% |
| Eastern Europe | 131 | 0.7% |
| Egypt | 6 | 0.0% |
| El Salvador | 247 | 1.4% |
| Europe | 238 | 1.4% |
| Fiji | 21 | 0.1% |
| Germany | 22 | 0.1% |
| Greece | 11 | 0.1% |
| Honduras | 57 | 0.3% |
| Hong Kong | 36 | 0.2% |
| India | 27 | 0.2% |
| Iran | 55 | 0.3% |
| Italy | 5 | 0.0% |
| Korea | 40 | 0.2% |
| Latin America | 737 | 4.2% |
| Mexico | 391 | 2.2% |
| Moldova | 25 | 0.1% |
| Morocco | 200 | 1.1% |
| Northern Africa | 206 | 1.2% |
| Northern Europe | 63 | 0.4% |
| Oceania | 31 | 0.2% |
| Peru | 33 | 0.2% |
| Philippines | 66 | 0.4% |
| Poland | 1 | 0.0% |
| Romania | 27 | 0.2% |
| South America | 42 | 0.2% |
| South Central Asia | 82 | 0.5% |
| South Eastern Asia | 66 | 0.4% |
| Southern Europe | 16 | 0.1% |
| Ukraine | 78 | 0.4% |
| Western Europe | 28 | 0.2% | View All 39 Rows |
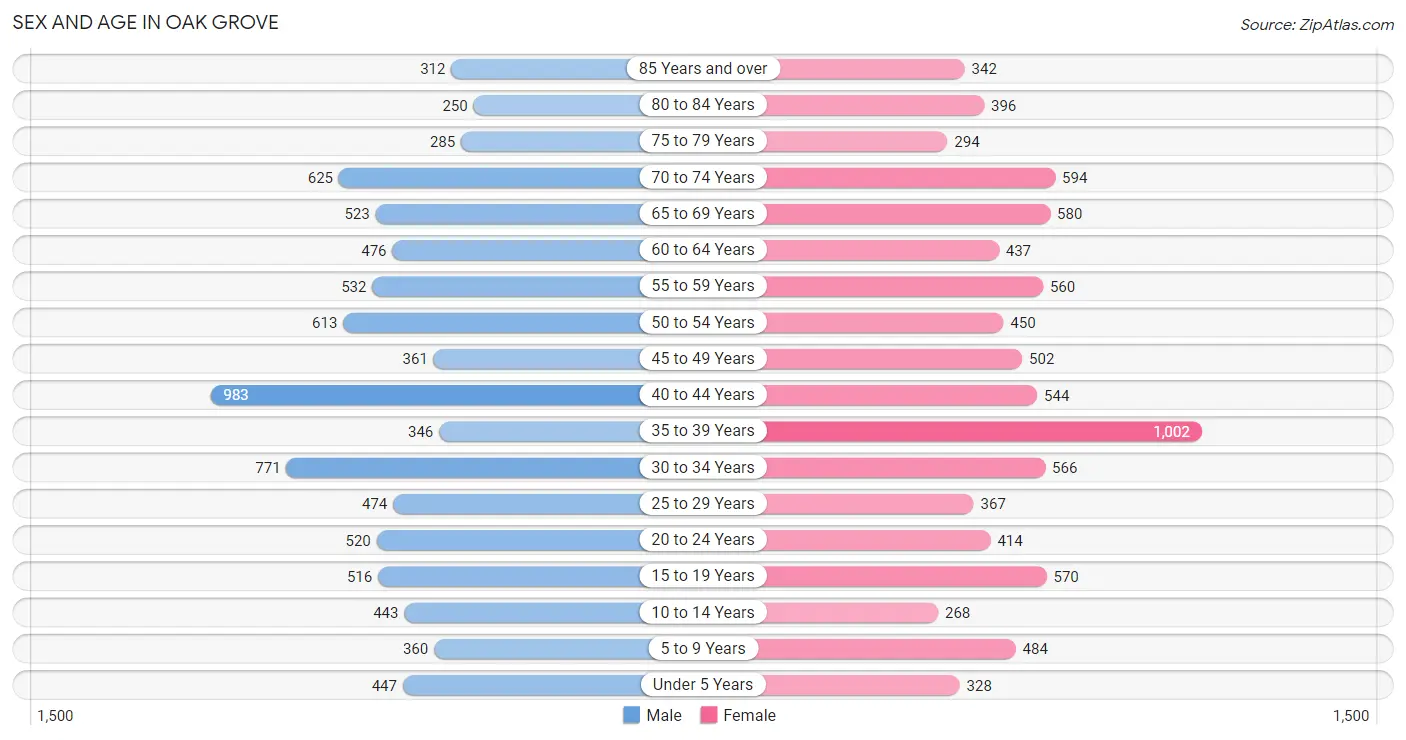
Sex and Age in Oak Grove
Sex and Age in Oak Grove
The most populous age groups in Oak Grove are 40 to 44 Years (983 | 11.1%) for men and 35 to 39 Years (1,002 | 11.5%) for women.
| Age Bracket | Male | Female |
| Under 5 Years | 447 (5.1%) | 328 (3.8%) |
| 5 to 9 Years | 360 (4.1%) | 484 (5.6%) |
| 10 to 14 Years | 443 (5.0%) | 268 (3.1%) |
| 15 to 19 Years | 516 (5.8%) | 570 (6.6%) |
| 20 to 24 Years | 520 (5.9%) | 414 (4.8%) |
| 25 to 29 Years | 474 (5.4%) | 367 (4.2%) |
| 30 to 34 Years | 771 (8.7%) | 566 (6.5%) |
| 35 to 39 Years | 346 (3.9%) | 1,002 (11.5%) |
| 40 to 44 Years | 983 (11.1%) | 544 (6.2%) |
| 45 to 49 Years | 361 (4.1%) | 502 (5.8%) |
| 50 to 54 Years | 613 (6.9%) | 450 (5.2%) |
| 55 to 59 Years | 532 (6.0%) | 560 (6.4%) |
| 60 to 64 Years | 476 (5.4%) | 437 (5.0%) |
| 65 to 69 Years | 523 (5.9%) | 580 (6.7%) |
| 70 to 74 Years | 625 (7.1%) | 594 (6.8%) |
| 75 to 79 Years | 285 (3.2%) | 294 (3.4%) |
| 80 to 84 Years | 250 (2.8%) | 396 (4.5%) |
| 85 Years and over | 312 (3.5%) | 342 (3.9%) |
| Total | 8,837 (100.0%) | 8,698 (100.0%) |
Families and Households in Oak Grove
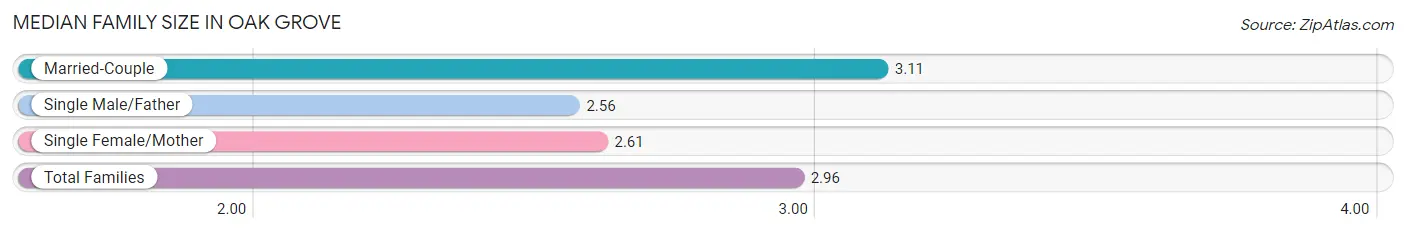
Median Family Size in Oak Grove
The median family size in Oak Grove is 2.96 persons per family, with married-couple families (3,048 | 71.2%) accounting for the largest median family size of 3.11 persons per family. On the other hand, single male/father families (372 | 8.7%) represent the smallest median family size with 2.56 persons per family.
| Family Type | # Families | Family Size |
| Married-Couple | 3,048 (71.2%) | 3.11 |
| Single Male/Father | 372 (8.7%) | 2.56 |
| Single Female/Mother | 864 (20.2%) | 2.61 |
| Total Families | 4,284 (100.0%) | 2.96 |
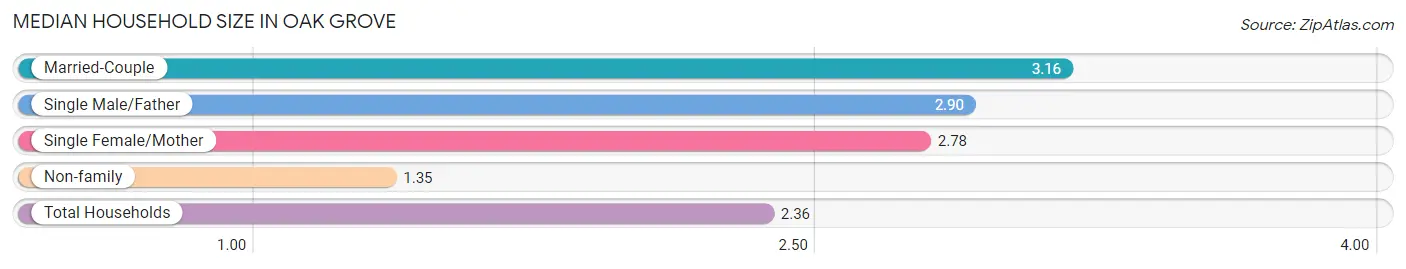
Median Household Size in Oak Grove
The median household size in Oak Grove is 2.36 persons per household, with married-couple households (3,048 | 41.9%) accounting for the largest median household size of 3.16 persons per household. non-family households (2,994 | 41.1%) represent the smallest median household size with 1.35 persons per household.
| Household Type | # Households | Household Size |
| Married-Couple | 3,048 (41.9%) | 3.16 |
| Single Male/Father | 372 (5.1%) | 2.90 |
| Single Female/Mother | 864 (11.9%) | 2.78 |
| Non-family | 2,994 (41.1%) | 1.35 |
| Total Households | 7,278 (100.0%) | 2.36 |
Household Size by Marriage Status in Oak Grove
Out of a total of 7,278 households in Oak Grove, 4,284 (58.9%) are family households, while 2,994 (41.1%) are nonfamily households. The most numerous type of family households are 2-person households, comprising 2,099, and the most common type of nonfamily households are 1-person households, comprising 2,218.
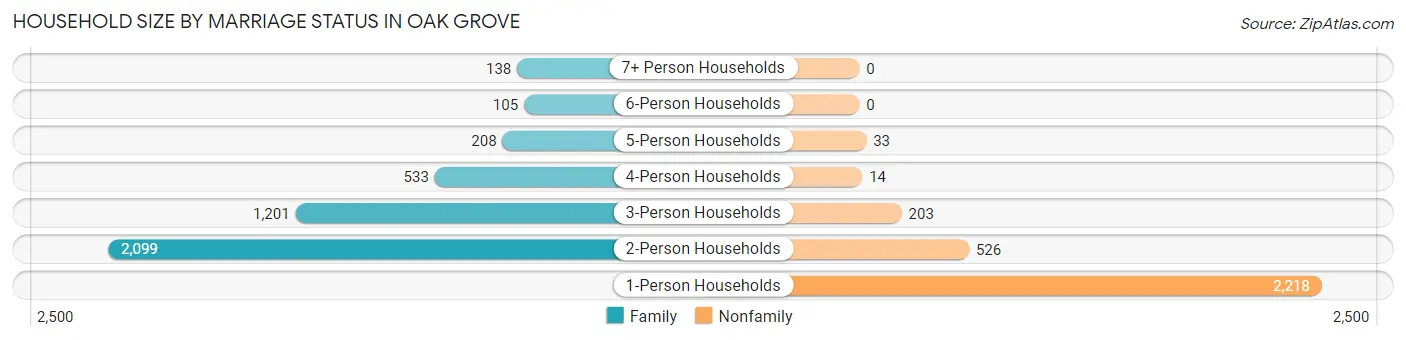
| Household Size | Family Households | Nonfamily Households |
| 1-Person Households | - | 2,218 (30.5%) |
| 2-Person Households | 2,099 (28.8%) | 526 (7.2%) |
| 3-Person Households | 1,201 (16.5%) | 203 (2.8%) |
| 4-Person Households | 533 (7.3%) | 14 (0.2%) |
| 5-Person Households | 208 (2.9%) | 33 (0.4%) |
| 6-Person Households | 105 (1.4%) | 0 (0.0%) |
| 7+ Person Households | 138 (1.9%) | 0 (0.0%) |
| Total | 4,284 (58.9%) | 2,994 (41.1%) |
Female Fertility in Oak Grove
Fertility by Age in Oak Grove
Average fertility rate in Oak Grove is 42.0 births per 1,000 women. Women in the age bracket of 15 to 19 years have the highest fertility rate with 60.0 births per 1,000 women. Women in the age bracket of 35 to 50 years acount for 69.4% of all women with births.
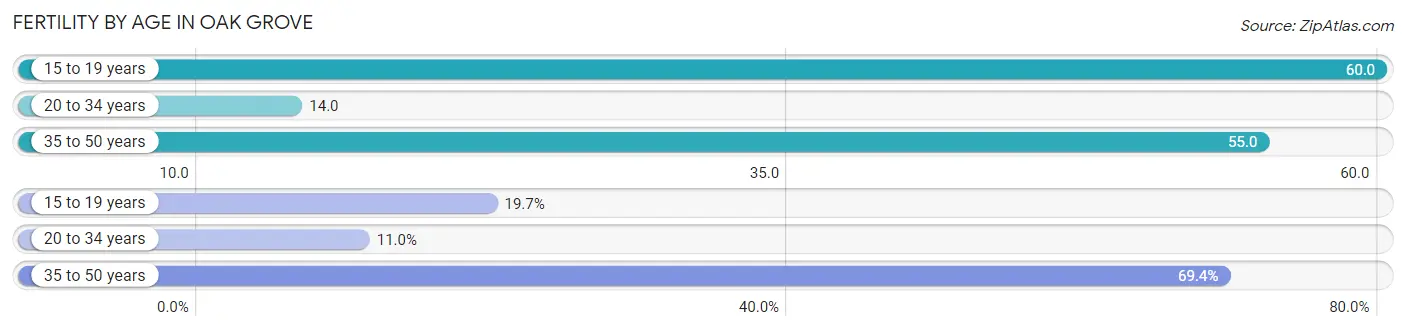
| Age Bracket | Women with Births | Births / 1,000 Women |
| 15 to 19 years | 34 (19.7%) | 60.0 |
| 20 to 34 years | 19 (11.0%) | 14.0 |
| 35 to 50 years | 120 (69.4%) | 55.0 |
| Total | 173 (100.0%) | 42.0 |
Fertility by Age by Marriage Status in Oak Grove
69.4% of women with births (173) in Oak Grove are married. The highest percentage of unmarried women with births falls into 15 to 19 years age bracket with 100.0% of them unmarried at the time of birth, while the lowest percentage of unmarried women with births belong to 35 to 50 years age bracket with 0.0% of them unmarried.
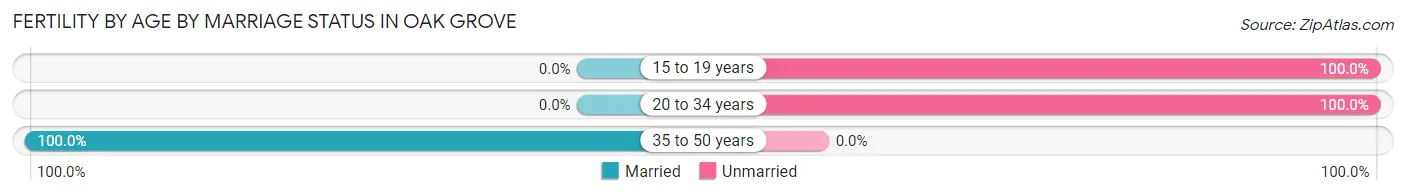
| Age Bracket | Married | Unmarried |
| 15 to 19 years | 0 (0.0%) | 34 (100.0%) |
| 20 to 34 years | 0 (0.0%) | 19 (100.0%) |
| 35 to 50 years | 120 (100.0%) | 0 (0.0%) |
| Total | 120 (69.4%) | 53 (30.6%) |
Fertility by Education in Oak Grove
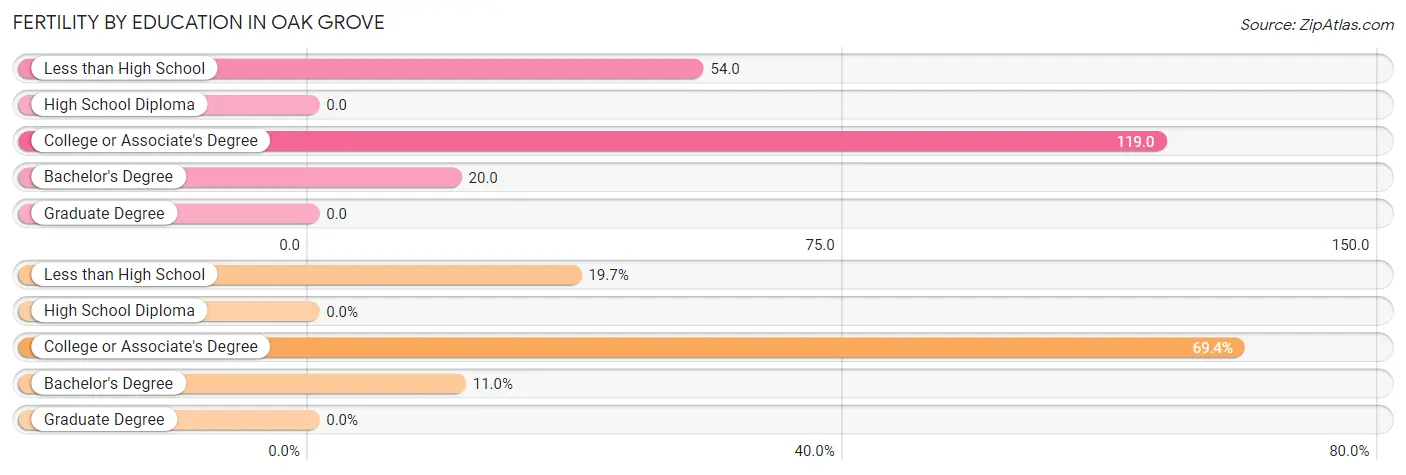
| Educational Attainment | Women with Births | Births / 1,000 Women |
| Less than High School | 34 (19.7%) | 54.0 |
| High School Diploma | 0 (0.0%) | 0.0 |
| College or Associate's Degree | 120 (69.4%) | 119.0 |
| Bachelor's Degree | 19 (11.0%) | 20.0 |
| Graduate Degree | 0 (0.0%) | 0.0 |
| Total | 173 (100.0%) | 42.0 |
Fertility by Education by Marriage Status in Oak Grove
30.6% of women with births in Oak Grove are unmarried. Women with the educational attainment of college or associate's degree are most likely to be married with 100.0% of them married at childbirth, while women with the educational attainment of less than high school are least likely to be married with 100.0% of them unmarried at childbirth.
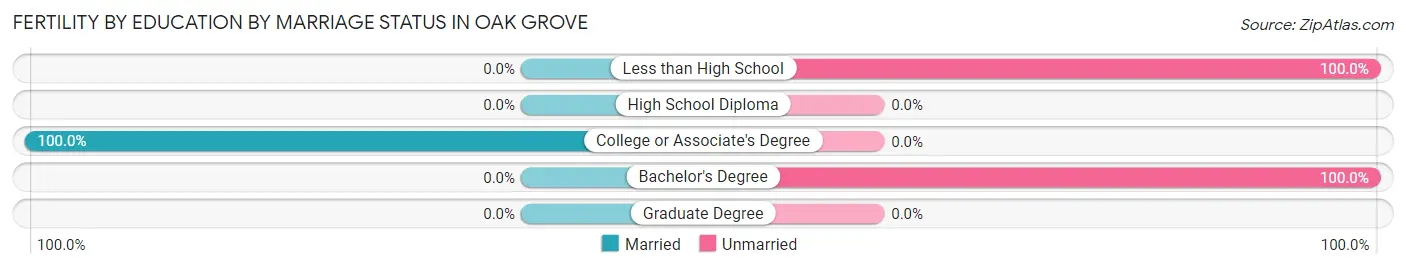
| Educational Attainment | Married | Unmarried |
| Less than High School | 0 (0.0%) | 34 (100.0%) |
| High School Diploma | 0 (0.0%) | 0 (0.0%) |
| College or Associate's Degree | 120 (100.0%) | 0 (0.0%) |
| Bachelor's Degree | 0 (0.0%) | 19 (100.0%) |
| Graduate Degree | 0 (0.0%) | 0 (0.0%) |
| Total | 120 (69.4%) | 53 (30.6%) |
Employment Characteristics in Oak Grove
Employment by Class of Employer in Oak Grove
Among the 8,258 employed individuals in Oak Grove, private company employees (5,729 | 69.4%), not-for-profit organizations (969 | 11.7%), and self-employed (not incorporated) (517 | 6.3%) make up the most common classes of employment.
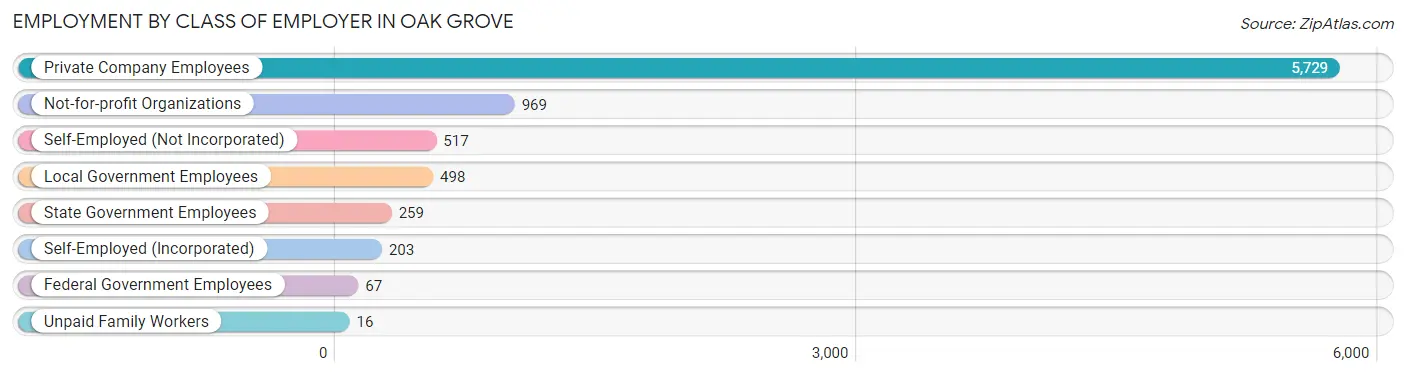
| Employer Class | # Employees | % Employees |
| Private Company Employees | 5,729 | 69.4% |
| Self-Employed (Incorporated) | 203 | 2.5% |
| Self-Employed (Not Incorporated) | 517 | 6.3% |
| Not-for-profit Organizations | 969 | 11.7% |
| Local Government Employees | 498 | 6.0% |
| State Government Employees | 259 | 3.1% |
| Federal Government Employees | 67 | 0.8% |
| Unpaid Family Workers | 16 | 0.2% |
| Total | 8,258 | 100.0% |
Employment Status by Age in Oak Grove
According to the labor force statistics for Oak Grove, out of the total population over 16 years of age (15,021), 60.6% or 9,103 individuals are in the labor force, with 8.0% or 728 of them unemployed. The age group with the highest labor force participation rate is 30 to 34 years, with 93.1% or 1,245 individuals in the labor force. Within the labor force, the 25 to 29 years age range has the highest percentage of unemployed individuals, with 14.1% or 109 of them being unemployed.
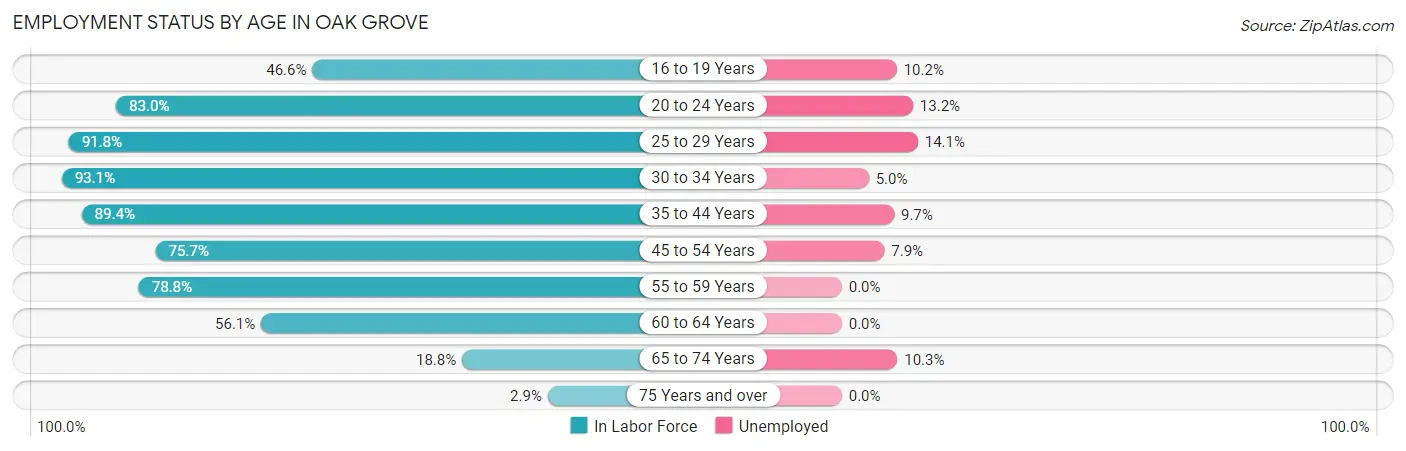
| Age Bracket | In Labor Force | Unemployed |
| 16 to 19 Years | 420 (46.6%) | 43 (10.2%) |
| 20 to 24 Years | 775 (83.0%) | 102 (13.2%) |
| 25 to 29 Years | 772 (91.8%) | 109 (14.1%) |
| 30 to 34 Years | 1,245 (93.1%) | 62 (5.0%) |
| 35 to 44 Years | 2,570 (89.4%) | 249 (9.7%) |
| 45 to 54 Years | 1,458 (75.7%) | 115 (7.9%) |
| 55 to 59 Years | 860 (78.8%) | 0 (0.0%) |
| 60 to 64 Years | 512 (56.1%) | 0 (0.0%) |
| 65 to 74 Years | 437 (18.8%) | 45 (10.3%) |
| 75 Years and over | 54 (2.9%) | 0 (0.0%) |
| Total | 9,103 (60.6%) | 728 (8.0%) |
Employment Status by Educational Attainment in Oak Grove
According to labor force statistics for Oak Grove, 82.6% of individuals (7,421) out of the total population between 25 and 64 years of age (8,984) are in the labor force, with 7.2% or 534 of them being unemployed. The group with the highest labor force participation rate are those with the educational attainment of bachelor's degree or higher, with 91.7% or 3,090 individuals in the labor force. Within the labor force, individuals with less than high school education have the highest percentage of unemployment, with 12.3% or 66 of them being unemployed.
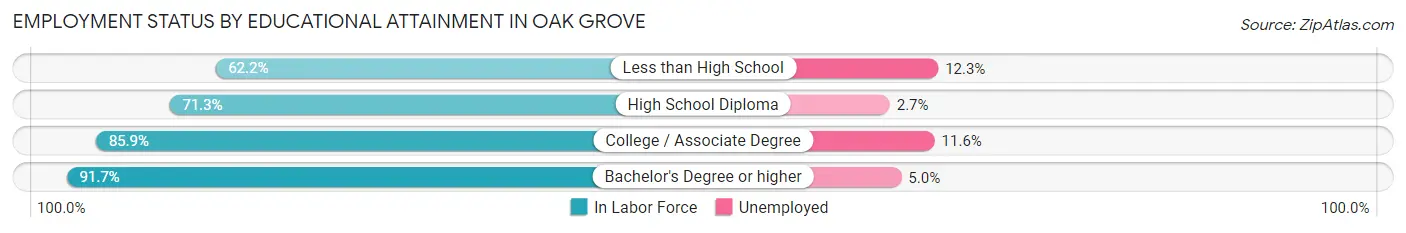
| Educational Attainment | In Labor Force | Unemployed |
| Less than High School | 538 (62.2%) | 106 (12.3%) |
| High School Diploma | 1,405 (71.3%) | 53 (2.7%) |
| College / Associate Degree | 2,386 (85.9%) | 322 (11.6%) |
| Bachelor's Degree or higher | 3,090 (91.7%) | 168 (5.0%) |
| Total | 7,421 (82.6%) | 647 (7.2%) |
Employment Occupations by Sex in Oak Grove
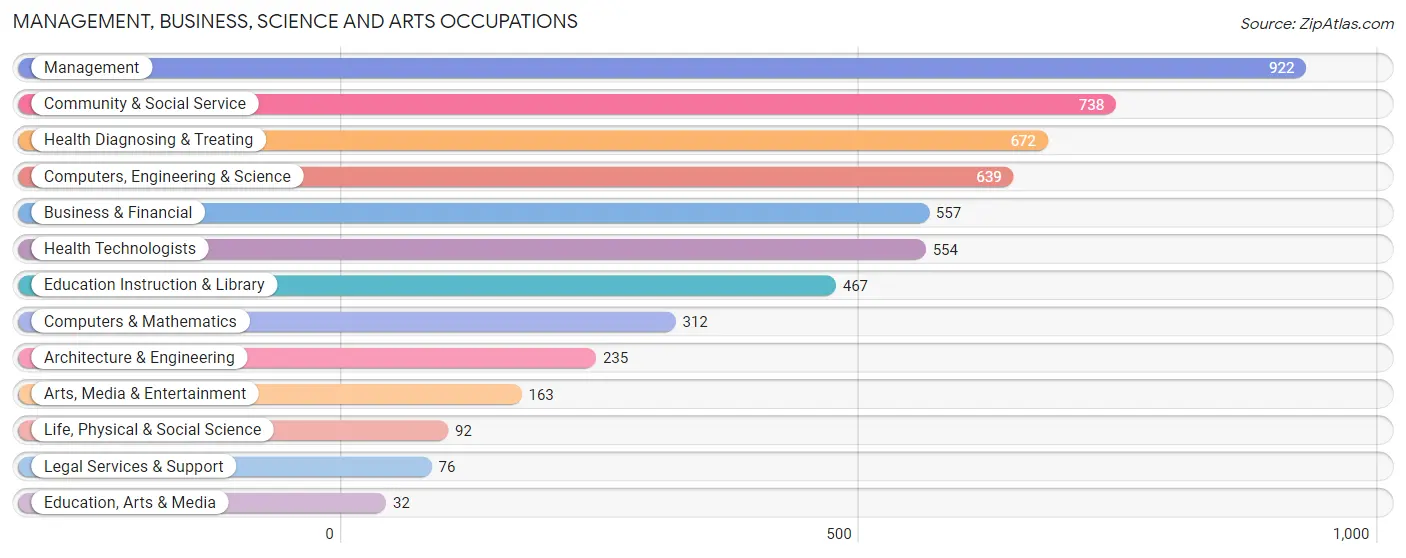
Management, Business, Science and Arts Occupations
The most common Management, Business, Science and Arts occupations in Oak Grove are Management (922 | 11.0%), Community & Social Service (738 | 8.8%), Health Diagnosing & Treating (672 | 8.0%), Computers, Engineering & Science (639 | 7.6%), and Business & Financial (557 | 6.7%).
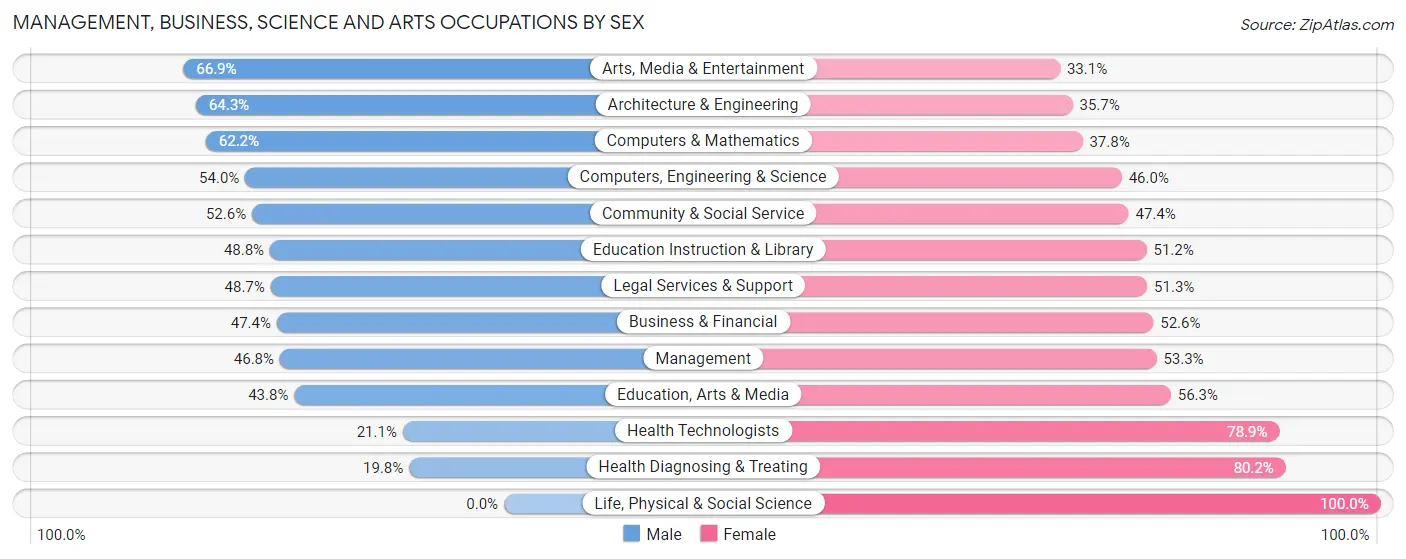
Management, Business, Science and Arts Occupations by Sex
Within the Management, Business, Science and Arts occupations in Oak Grove, the most male-oriented occupations are Arts, Media & Entertainment (66.9%), Architecture & Engineering (64.3%), and Computers & Mathematics (62.2%), while the most female-oriented occupations are Life, Physical & Social Science (100.0%), Health Diagnosing & Treating (80.2%), and Health Technologists (78.9%).
| Occupation | Male | Female |
| Management | 431 (46.8%) | 491 (53.2%) |
| Business & Financial | 264 (47.4%) | 293 (52.6%) |
| Computers, Engineering & Science | 345 (54.0%) | 294 (46.0%) |
| Computers & Mathematics | 194 (62.2%) | 118 (37.8%) |
| Architecture & Engineering | 151 (64.3%) | 84 (35.7%) |
| Life, Physical & Social Science | 0 (0.0%) | 92 (100.0%) |
| Community & Social Service | 388 (52.6%) | 350 (47.4%) |
| Education, Arts & Media | 14 (43.8%) | 18 (56.2%) |
| Legal Services & Support | 37 (48.7%) | 39 (51.3%) |
| Education Instruction & Library | 228 (48.8%) | 239 (51.2%) |
| Arts, Media & Entertainment | 109 (66.9%) | 54 (33.1%) |
| Health Diagnosing & Treating | 133 (19.8%) | 539 (80.2%) |
| Health Technologists | 117 (21.1%) | 437 (78.9%) |
| Total (Category) | 1,561 (44.3%) | 1,967 (55.7%) |
| Total (Overall) | 4,122 (49.2%) | 4,255 (50.8%) |
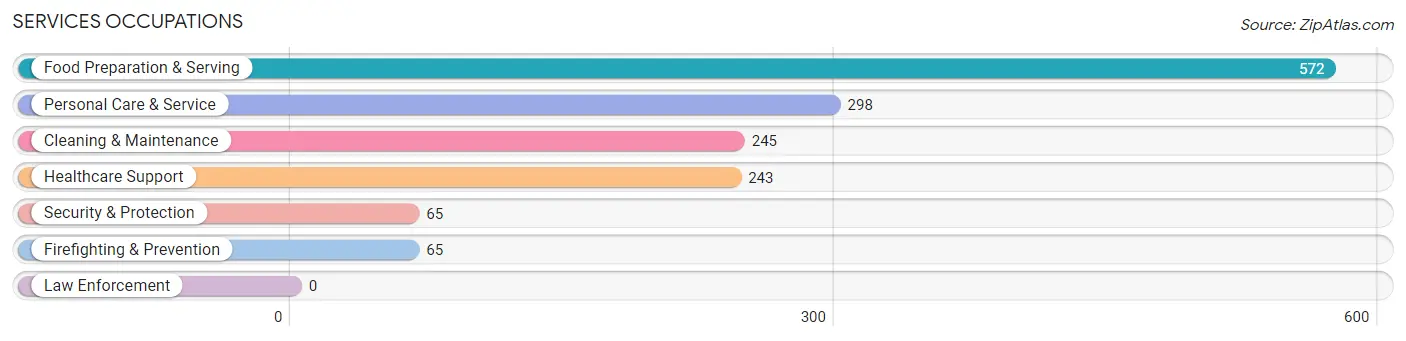
Services Occupations
The most common Services occupations in Oak Grove are Food Preparation & Serving (572 | 6.8%), Personal Care & Service (298 | 3.6%), Cleaning & Maintenance (245 | 2.9%), Healthcare Support (243 | 2.9%), and Security & Protection (65 | 0.8%).
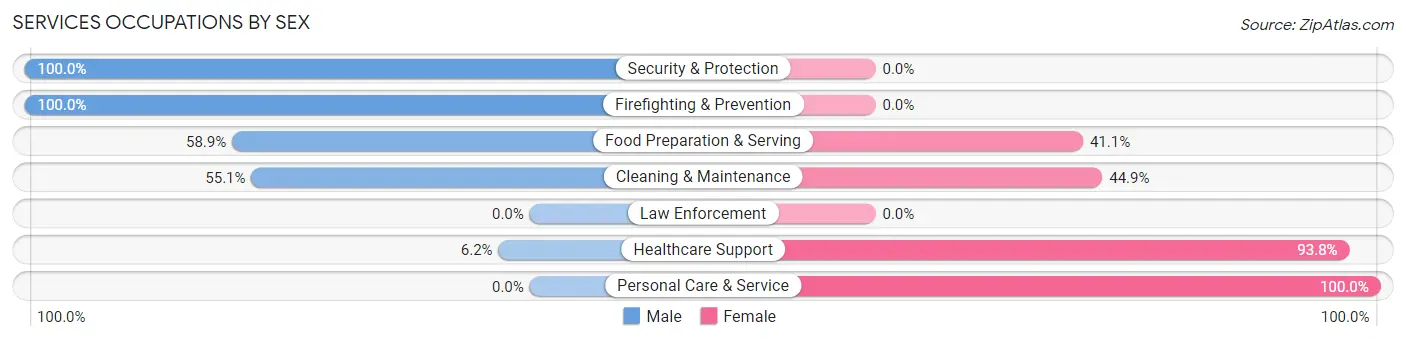
Services Occupations by Sex
Within the Services occupations in Oak Grove, the most male-oriented occupations are Security & Protection (100.0%), Firefighting & Prevention (100.0%), and Food Preparation & Serving (58.9%), while the most female-oriented occupations are Personal Care & Service (100.0%), Healthcare Support (93.8%), and Cleaning & Maintenance (44.9%).
| Occupation | Male | Female |
| Healthcare Support | 15 (6.2%) | 228 (93.8%) |
| Security & Protection | 65 (100.0%) | 0 (0.0%) |
| Firefighting & Prevention | 65 (100.0%) | 0 (0.0%) |
| Law Enforcement | 0 (0.0%) | 0 (0.0%) |
| Food Preparation & Serving | 337 (58.9%) | 235 (41.1%) |
| Cleaning & Maintenance | 135 (55.1%) | 110 (44.9%) |
| Personal Care & Service | 0 (0.0%) | 298 (100.0%) |
| Total (Category) | 552 (38.8%) | 871 (61.2%) |
| Total (Overall) | 4,122 (49.2%) | 4,255 (50.8%) |
Sales and Office Occupations
The most common Sales and Office occupations in Oak Grove are Sales & Related (845 | 10.1%), and Office & Administration (782 | 9.3%).

Sales and Office Occupations by Sex

| Occupation | Male | Female |
| Sales & Related | 455 (53.8%) | 390 (46.2%) |
| Office & Administration | 124 (15.9%) | 658 (84.1%) |
| Total (Category) | 579 (35.6%) | 1,048 (64.4%) |
| Total (Overall) | 4,122 (49.2%) | 4,255 (50.8%) |
Natural Resources, Construction and Maintenance Occupations
The most common Natural Resources, Construction and Maintenance occupations in Oak Grove are Installation, Maintenance & Repair (372 | 4.4%), and Construction & Extraction (228 | 2.7%).

Natural Resources, Construction and Maintenance Occupations by Sex

| Occupation | Male | Female |
| Farming, Fishing & Forestry | 0 (0.0%) | 0 (0.0%) |
| Construction & Extraction | 213 (93.4%) | 15 (6.6%) |
| Installation, Maintenance & Repair | 286 (76.9%) | 86 (23.1%) |
| Total (Category) | 499 (83.2%) | 101 (16.8%) |
| Total (Overall) | 4,122 (49.2%) | 4,255 (50.8%) |
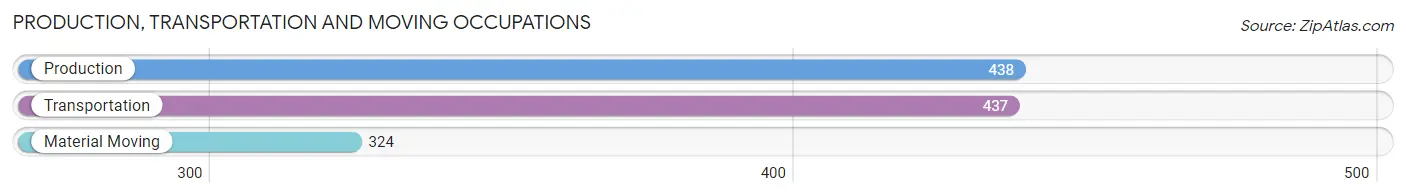
Production, Transportation and Moving Occupations
The most common Production, Transportation and Moving occupations in Oak Grove are Production (438 | 5.2%), Transportation (437 | 5.2%), and Material Moving (324 | 3.9%).
Production, Transportation and Moving Occupations by Sex
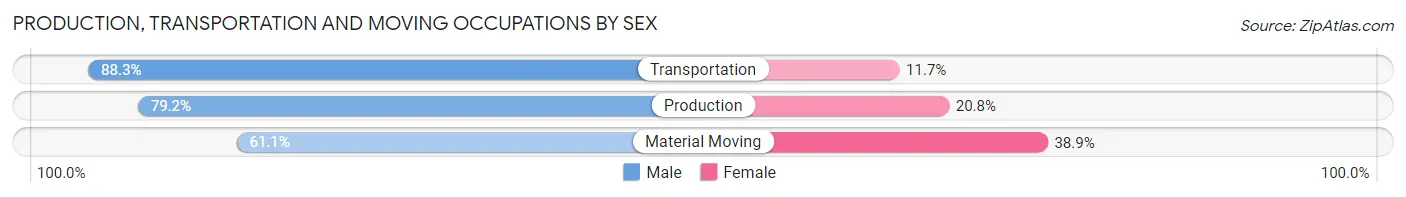
| Occupation | Male | Female |
| Production | 347 (79.2%) | 91 (20.8%) |
| Transportation | 386 (88.3%) | 51 (11.7%) |
| Material Moving | 198 (61.1%) | 126 (38.9%) |
| Total (Category) | 931 (77.6%) | 268 (22.4%) |
| Total (Overall) | 4,122 (49.2%) | 4,255 (50.8%) |
Employment Industries by Sex in Oak Grove
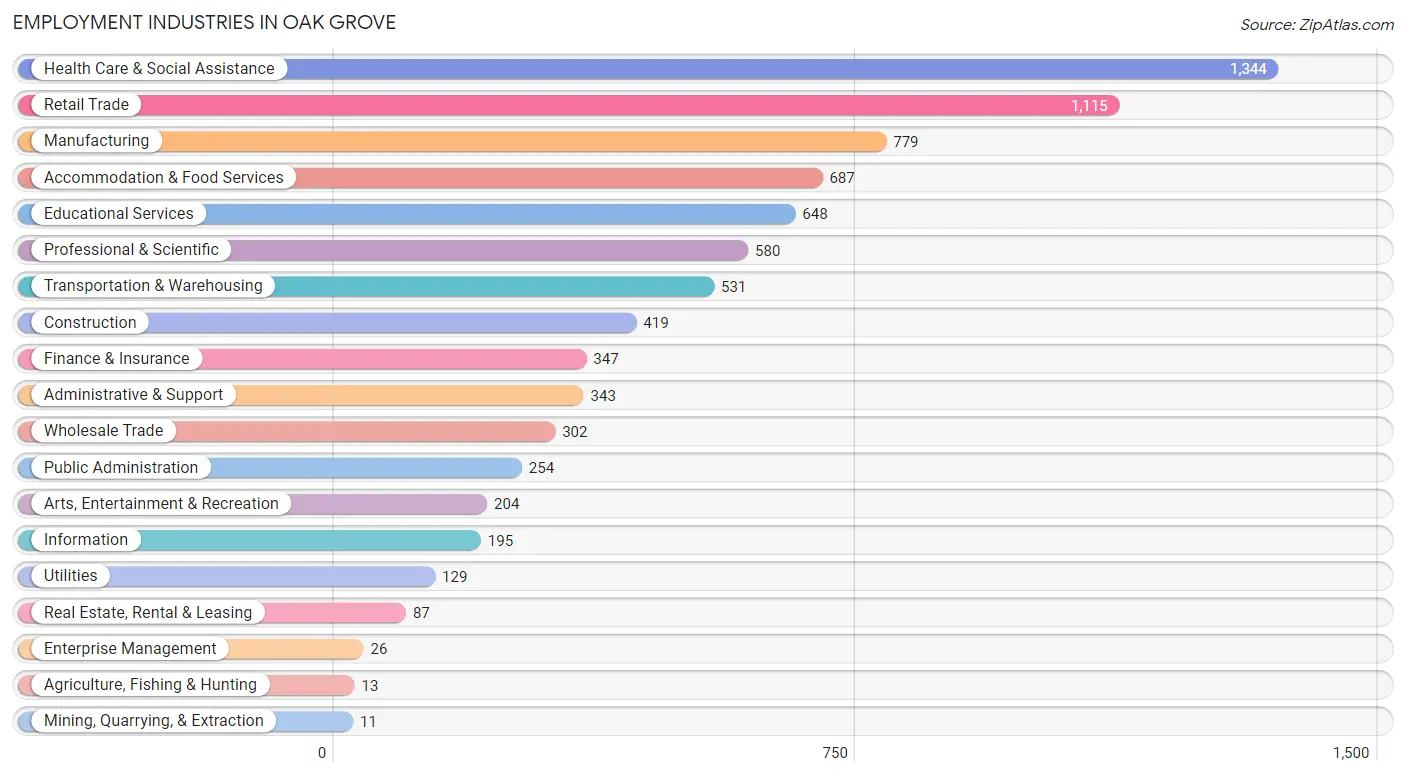
Employment Industries in Oak Grove
The major employment industries in Oak Grove include Health Care & Social Assistance (1,344 | 16.0%), Retail Trade (1,115 | 13.3%), Manufacturing (779 | 9.3%), Accommodation & Food Services (687 | 8.2%), and Educational Services (648 | 7.7%).
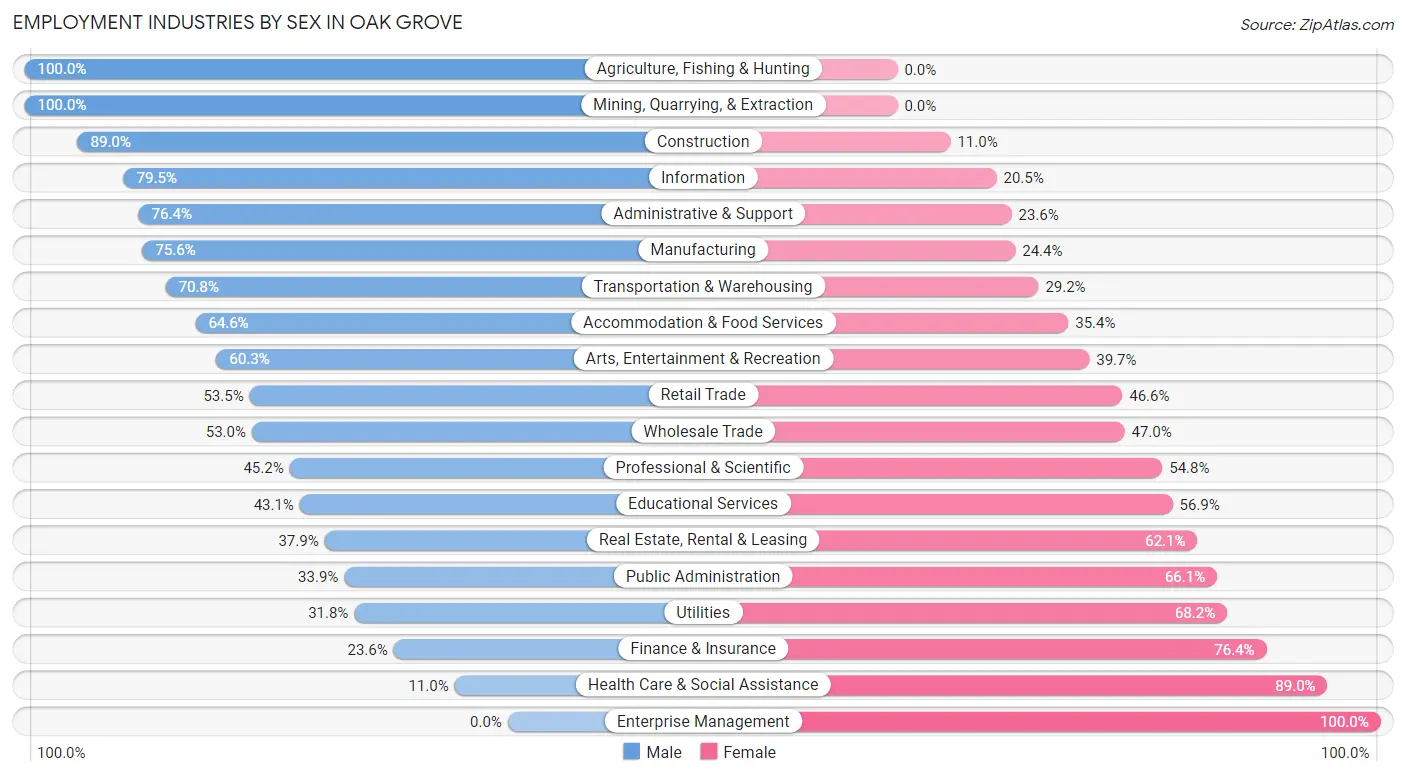
Employment Industries by Sex in Oak Grove
The Oak Grove industries that see more men than women are Agriculture, Fishing & Hunting (100.0%), Mining, Quarrying, & Extraction (100.0%), and Construction (89.0%), whereas the industries that tend to have a higher number of women are Enterprise Management (100.0%), Health Care & Social Assistance (89.0%), and Finance & Insurance (76.4%).
| Industry | Male | Female |
| Agriculture, Fishing & Hunting | 13 (100.0%) | 0 (0.0%) |
| Mining, Quarrying, & Extraction | 11 (100.0%) | 0 (0.0%) |
| Construction | 373 (89.0%) | 46 (11.0%) |
| Manufacturing | 589 (75.6%) | 190 (24.4%) |
| Wholesale Trade | 160 (53.0%) | 142 (47.0%) |
| Retail Trade | 596 (53.4%) | 519 (46.6%) |
| Transportation & Warehousing | 376 (70.8%) | 155 (29.2%) |
| Utilities | 41 (31.8%) | 88 (68.2%) |
| Information | 155 (79.5%) | 40 (20.5%) |
| Finance & Insurance | 82 (23.6%) | 265 (76.4%) |
| Real Estate, Rental & Leasing | 33 (37.9%) | 54 (62.1%) |
| Professional & Scientific | 262 (45.2%) | 318 (54.8%) |
| Enterprise Management | 0 (0.0%) | 26 (100.0%) |
| Administrative & Support | 262 (76.4%) | 81 (23.6%) |
| Educational Services | 279 (43.1%) | 369 (56.9%) |
| Health Care & Social Assistance | 148 (11.0%) | 1,196 (89.0%) |
| Arts, Entertainment & Recreation | 123 (60.3%) | 81 (39.7%) |
| Accommodation & Food Services | 444 (64.6%) | 243 (35.4%) |
| Public Administration | 86 (33.9%) | 168 (66.1%) |
| Total | 4,122 (49.2%) | 4,255 (50.8%) |
Education in Oak Grove
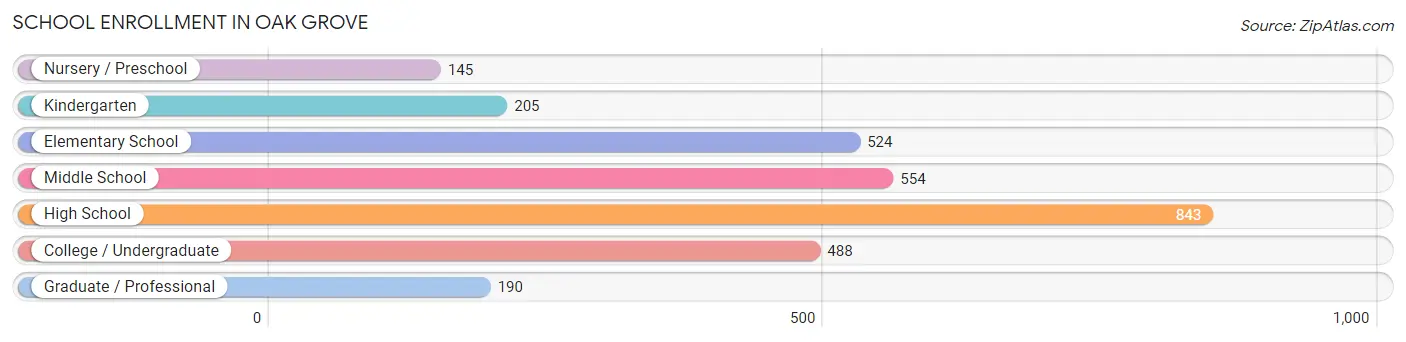
School Enrollment in Oak Grove
The most common levels of schooling among the 2,949 students in Oak Grove are high school (843 | 28.6%), middle school (554 | 18.8%), and elementary school (524 | 17.8%).
| School Level | # Students | % Students |
| Nursery / Preschool | 145 | 4.9% |
| Kindergarten | 205 | 7.0% |
| Elementary School | 524 | 17.8% |
| Middle School | 554 | 18.8% |
| High School | 843 | 28.6% |
| College / Undergraduate | 488 | 16.6% |
| Graduate / Professional | 190 | 6.4% |
| Total | 2,949 | 100.0% |
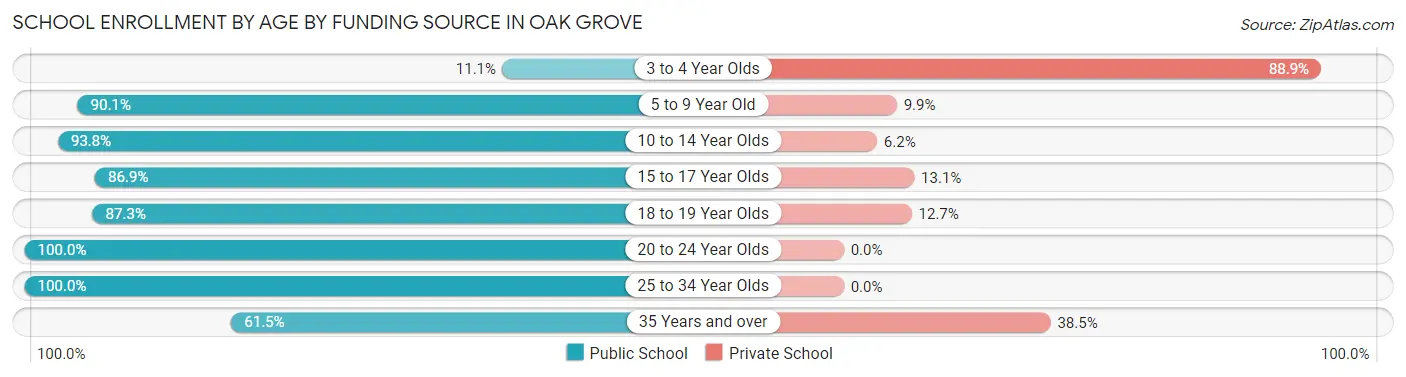
School Enrollment by Age by Funding Source in Oak Grove
Out of a total of 2,949 students who are enrolled in schools in Oak Grove, 392 (13.3%) attend a private institution, while the remaining 2,557 (86.7%) are enrolled in public schools. The age group of 3 to 4 year olds has the highest likelihood of being enrolled in private schools, with 112 (88.9% in the age bracket) enrolled. Conversely, the age group of 20 to 24 year olds has the lowest likelihood of being enrolled in a private school, with 212 (100.0% in the age bracket) attending a public institution.
| Age Bracket | Public School | Private School |
| 3 to 4 Year Olds | 14 (11.1%) | 112 (88.9%) |
| 5 to 9 Year Old | 657 (90.1%) | 72 (9.9%) |
| 10 to 14 Year Olds | 667 (93.8%) | 44 (6.2%) |
| 15 to 17 Year Olds | 516 (86.9%) | 78 (13.1%) |
| 18 to 19 Year Olds | 269 (87.3%) | 39 (12.7%) |
| 20 to 24 Year Olds | 212 (100.0%) | 0 (0.0%) |
| 25 to 34 Year Olds | 147 (100.0%) | 0 (0.0%) |
| 35 Years and over | 75 (61.5%) | 47 (38.5%) |
| Total | 2,557 (86.7%) | 392 (13.3%) |
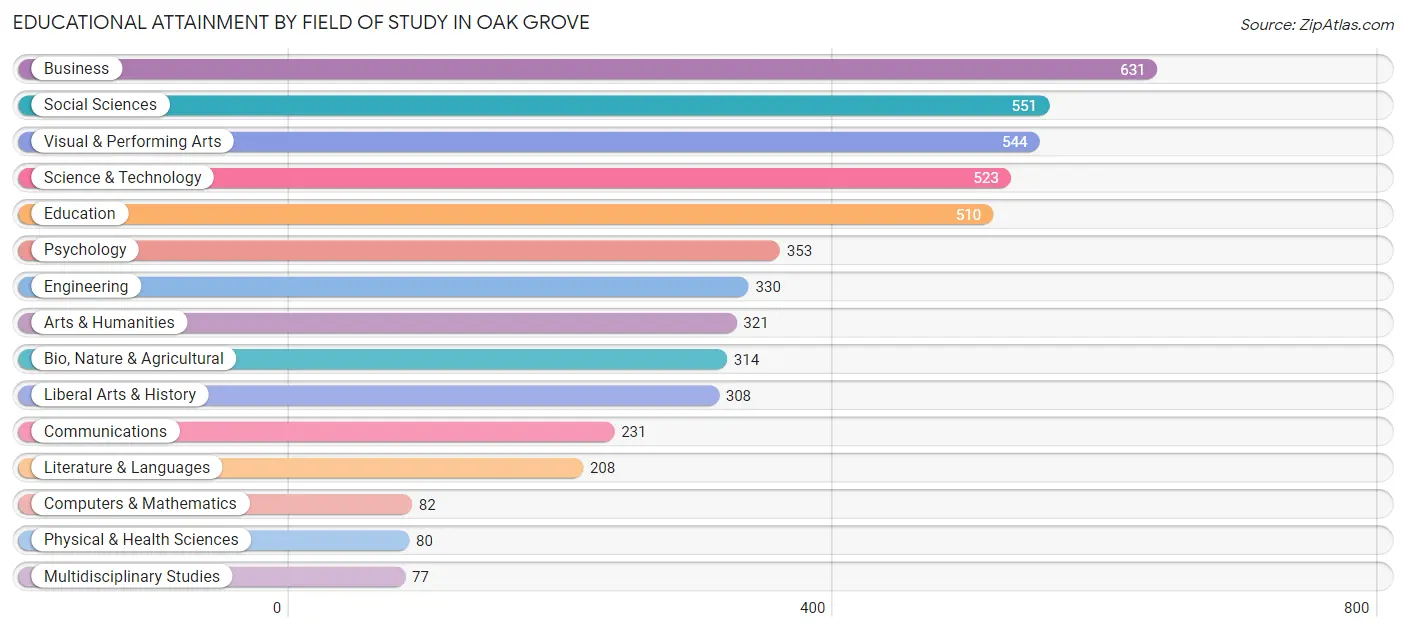
Educational Attainment by Field of Study in Oak Grove
Business (631 | 12.5%), social sciences (551 | 10.9%), visual & performing arts (544 | 10.7%), science & technology (523 | 10.3%), and education (510 | 10.1%) are the most common fields of study among 5,063 individuals in Oak Grove who have obtained a bachelor's degree or higher.
| Field of Study | # Graduates | % Graduates |
| Computers & Mathematics | 82 | 1.6% |
| Bio, Nature & Agricultural | 314 | 6.2% |
| Physical & Health Sciences | 80 | 1.6% |
| Psychology | 353 | 7.0% |
| Social Sciences | 551 | 10.9% |
| Engineering | 330 | 6.5% |
| Multidisciplinary Studies | 77 | 1.5% |
| Science & Technology | 523 | 10.3% |
| Business | 631 | 12.5% |
| Education | 510 | 10.1% |
| Literature & Languages | 208 | 4.1% |
| Liberal Arts & History | 308 | 6.1% |
| Visual & Performing Arts | 544 | 10.7% |
| Communications | 231 | 4.6% |
| Arts & Humanities | 321 | 6.3% |
| Total | 5,063 | 100.0% |
Transportation & Commute in Oak Grove
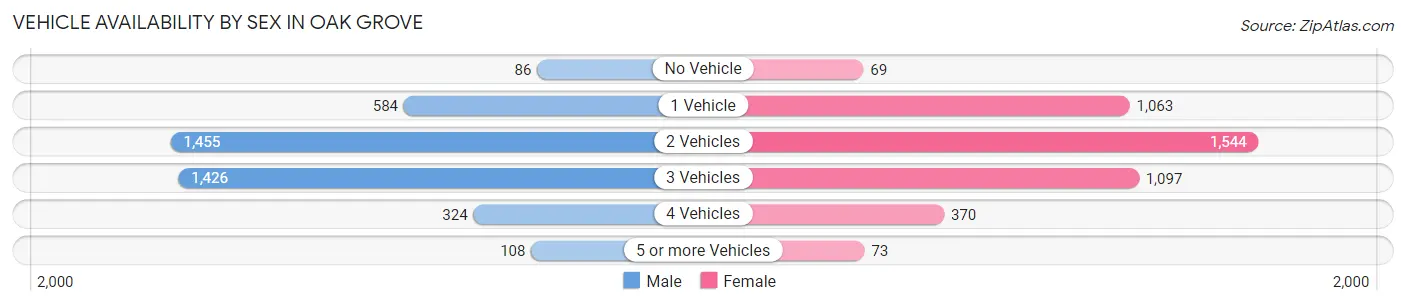
Vehicle Availability by Sex in Oak Grove
The most prevalent vehicle ownership categories in Oak Grove are males with 2 vehicles (1,455, accounting for 36.5%) and females with 2 vehicles (1,544, making up 34.5%).
| Vehicles Available | Male | Female |
| No Vehicle | 86 (2.2%) | 69 (1.6%) |
| 1 Vehicle | 584 (14.7%) | 1,063 (25.2%) |
| 2 Vehicles | 1,455 (36.5%) | 1,544 (36.6%) |
| 3 Vehicles | 1,426 (35.8%) | 1,097 (26.0%) |
| 4 Vehicles | 324 (8.1%) | 370 (8.8%) |
| 5 or more Vehicles | 108 (2.7%) | 73 (1.7%) |
| Total | 3,983 (100.0%) | 4,216 (100.0%) |
Commute Time in Oak Grove
The most frequently occuring commute durations in Oak Grove are 15 to 19 minutes (1,110 commuters, 16.5%), 30 to 34 minutes (972 commuters, 14.5%), and 20 to 24 minutes (901 commuters, 13.4%).
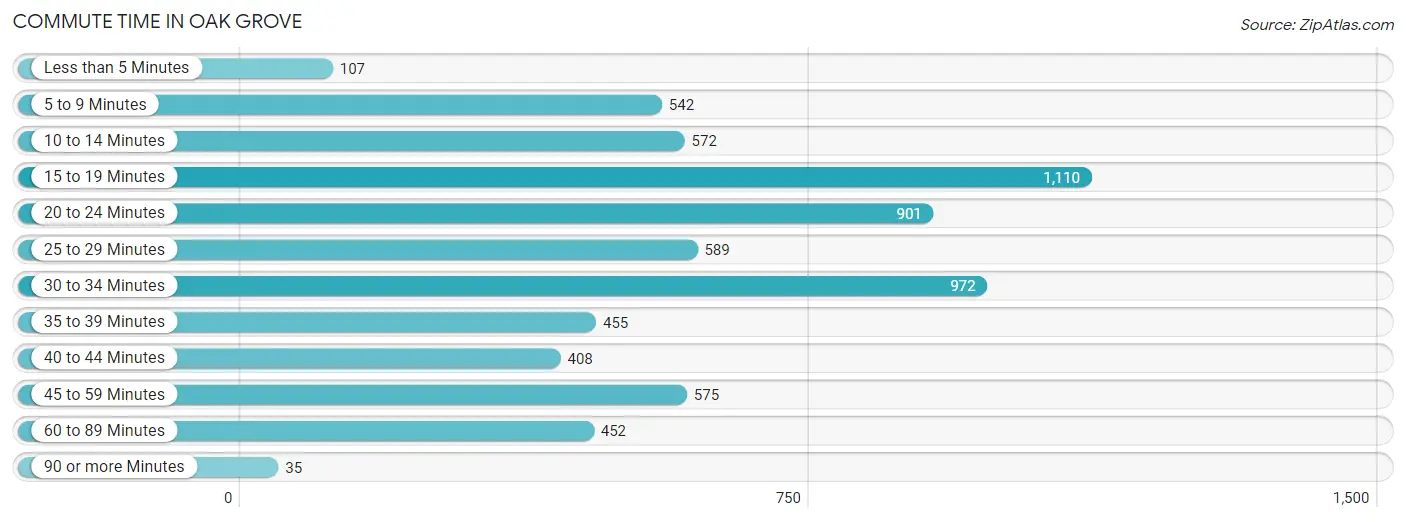
| Commute Time | # Commuters | % Commuters |
| Less than 5 Minutes | 107 | 1.6% |
| 5 to 9 Minutes | 542 | 8.1% |
| 10 to 14 Minutes | 572 | 8.5% |
| 15 to 19 Minutes | 1,110 | 16.5% |
| 20 to 24 Minutes | 901 | 13.4% |
| 25 to 29 Minutes | 589 | 8.8% |
| 30 to 34 Minutes | 972 | 14.5% |
| 35 to 39 Minutes | 455 | 6.8% |
| 40 to 44 Minutes | 408 | 6.1% |
| 45 to 59 Minutes | 575 | 8.6% |
| 60 to 89 Minutes | 452 | 6.7% |
| 90 or more Minutes | 35 | 0.5% |
Commute Time by Sex in Oak Grove
The most common commute times in Oak Grove are 15 to 19 minutes (559 commuters, 16.1%) for males and 15 to 19 minutes (551 commuters, 17.0%) for females.
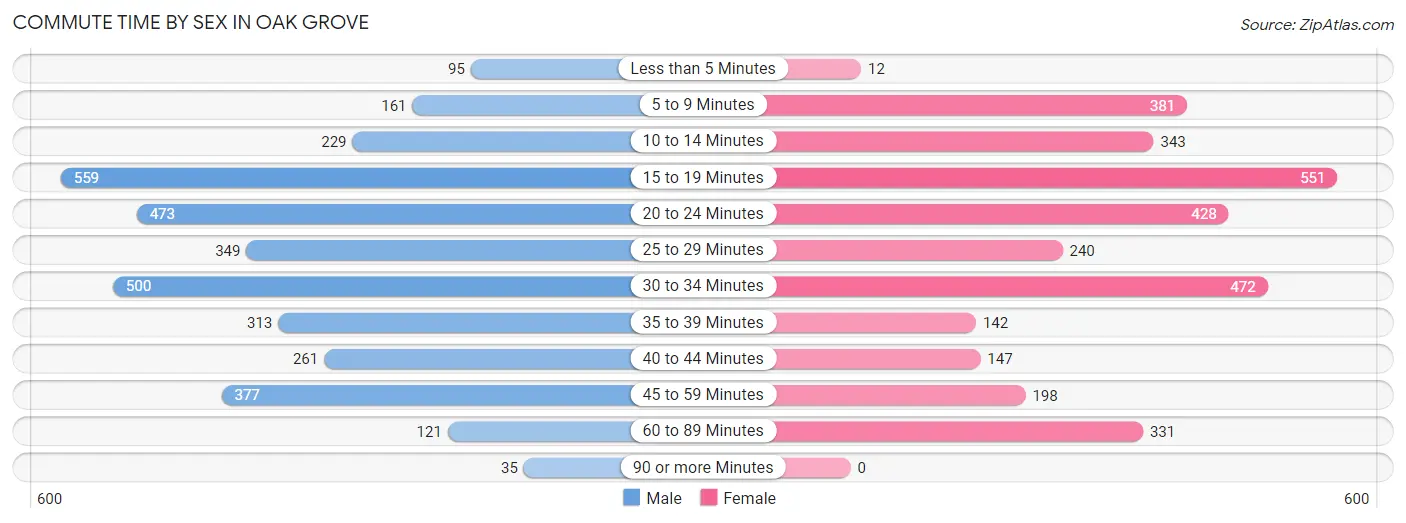
| Commute Time | Male | Female |
| Less than 5 Minutes | 95 (2.7%) | 12 (0.4%) |
| 5 to 9 Minutes | 161 (4.6%) | 381 (11.7%) |
| 10 to 14 Minutes | 229 (6.6%) | 343 (10.6%) |
| 15 to 19 Minutes | 559 (16.1%) | 551 (17.0%) |
| 20 to 24 Minutes | 473 (13.6%) | 428 (13.2%) |
| 25 to 29 Minutes | 349 (10.1%) | 240 (7.4%) |
| 30 to 34 Minutes | 500 (14.4%) | 472 (14.5%) |
| 35 to 39 Minutes | 313 (9.0%) | 142 (4.4%) |
| 40 to 44 Minutes | 261 (7.5%) | 147 (4.5%) |
| 45 to 59 Minutes | 377 (10.9%) | 198 (6.1%) |
| 60 to 89 Minutes | 121 (3.5%) | 331 (10.2%) |
| 90 or more Minutes | 35 (1.0%) | 0 (0.0%) |
Time of Departure to Work by Sex in Oak Grove
The most frequent times of departure to work in Oak Grove are 7:00 AM to 7:29 AM (538, 15.5%) for males and 7:30 AM to 7:59 AM (573, 17.7%) for females.
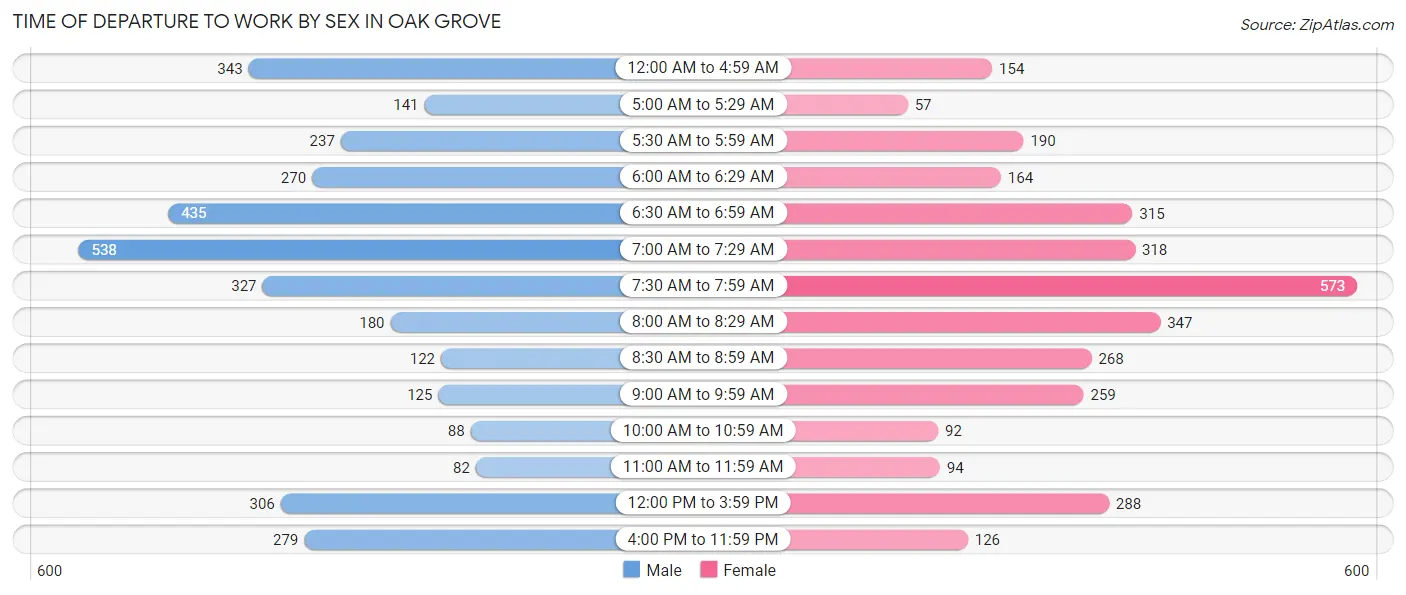
| Time of Departure | Male | Female |
| 12:00 AM to 4:59 AM | 343 (9.9%) | 154 (4.8%) |
| 5:00 AM to 5:29 AM | 141 (4.1%) | 57 (1.8%) |
| 5:30 AM to 5:59 AM | 237 (6.8%) | 190 (5.9%) |
| 6:00 AM to 6:29 AM | 270 (7.8%) | 164 (5.1%) |
| 6:30 AM to 6:59 AM | 435 (12.5%) | 315 (9.7%) |
| 7:00 AM to 7:29 AM | 538 (15.5%) | 318 (9.8%) |
| 7:30 AM to 7:59 AM | 327 (9.4%) | 573 (17.7%) |
| 8:00 AM to 8:29 AM | 180 (5.2%) | 347 (10.7%) |
| 8:30 AM to 8:59 AM | 122 (3.5%) | 268 (8.3%) |
| 9:00 AM to 9:59 AM | 125 (3.6%) | 259 (8.0%) |
| 10:00 AM to 10:59 AM | 88 (2.5%) | 92 (2.8%) |
| 11:00 AM to 11:59 AM | 82 (2.4%) | 94 (2.9%) |
| 12:00 PM to 3:59 PM | 306 (8.8%) | 288 (8.9%) |
| 4:00 PM to 11:59 PM | 279 (8.0%) | 126 (3.9%) |
| Total | 3,473 (100.0%) | 3,245 (100.0%) |
Housing Occupancy in Oak Grove
Occupancy by Ownership in Oak Grove
Of the total 7,278 dwellings in Oak Grove, owner-occupied units account for 4,734 (65.0%), while renter-occupied units make up 2,544 (34.9%).
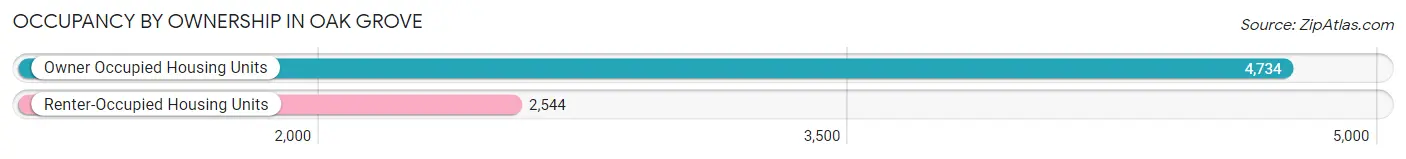
| Occupancy | # Housing Units | % Housing Units |
| Owner Occupied Housing Units | 4,734 | 65.0% |
| Renter-Occupied Housing Units | 2,544 | 34.9% |
| Total Occupied Housing Units | 7,278 | 100.0% |
Occupancy by Household Size in Oak Grove
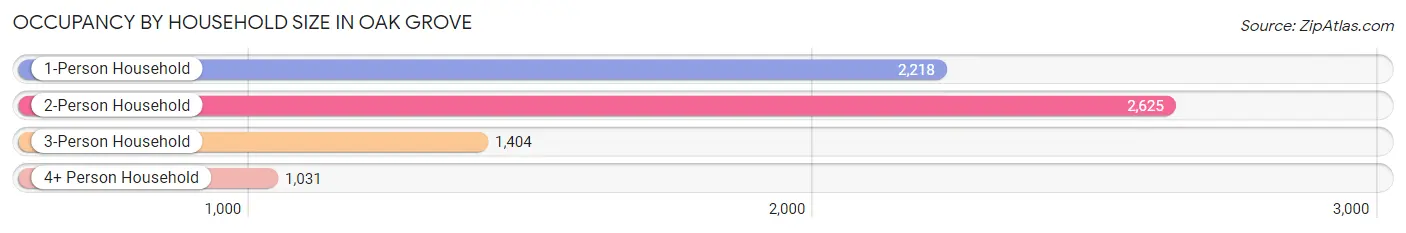
| Household Size | # Housing Units | % Housing Units |
| 1-Person Household | 2,218 | 30.5% |
| 2-Person Household | 2,625 | 36.1% |
| 3-Person Household | 1,404 | 19.3% |
| 4+ Person Household | 1,031 | 14.2% |
| Total Housing Units | 7,278 | 100.0% |
Occupancy by Ownership by Household Size in Oak Grove
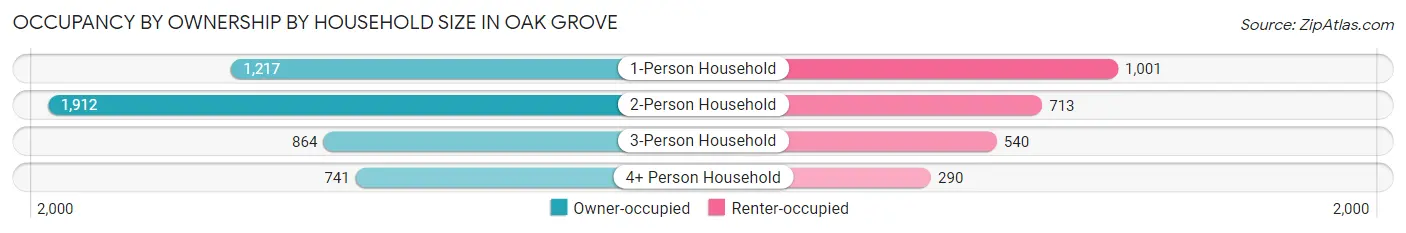
| Household Size | Owner-occupied | Renter-occupied |
| 1-Person Household | 1,217 (54.9%) | 1,001 (45.1%) |
| 2-Person Household | 1,912 (72.8%) | 713 (27.2%) |
| 3-Person Household | 864 (61.5%) | 540 (38.5%) |
| 4+ Person Household | 741 (71.9%) | 290 (28.1%) |
| Total Housing Units | 4,734 (65.0%) | 2,544 (34.9%) |
Occupancy by Educational Attainment in Oak Grove
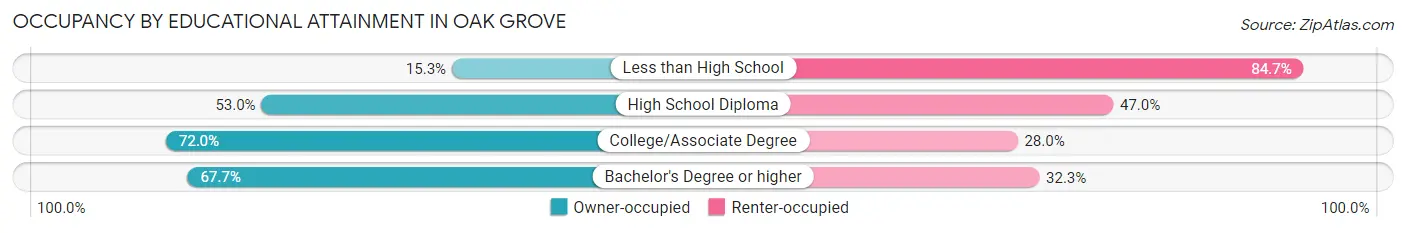
| Household Size | Owner-occupied | Renter-occupied |
| Less than High School | 35 (15.3%) | 194 (84.7%) |
| High School Diploma | 689 (53.0%) | 610 (47.0%) |
| College/Associate Degree | 1,975 (72.0%) | 769 (28.0%) |
| Bachelor's Degree or higher | 2,035 (67.7%) | 971 (32.3%) |
Occupancy by Age of Householder in Oak Grove
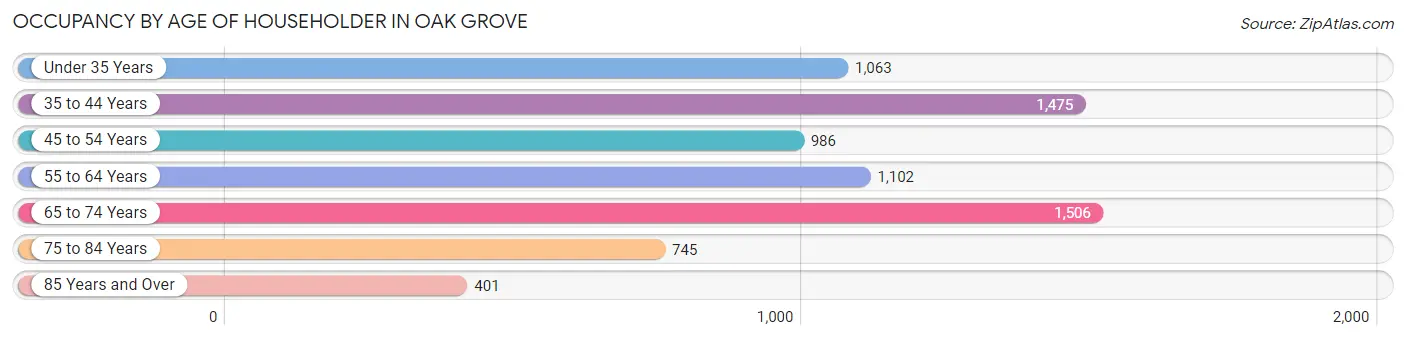
| Age Bracket | # Households | % Households |
| Under 35 Years | 1,063 | 14.6% |
| 35 to 44 Years | 1,475 | 20.3% |
| 45 to 54 Years | 986 | 13.6% |
| 55 to 64 Years | 1,102 | 15.1% |
| 65 to 74 Years | 1,506 | 20.7% |
| 75 to 84 Years | 745 | 10.2% |
| 85 Years and Over | 401 | 5.5% |
| Total | 7,278 | 100.0% |
Housing Finances in Oak Grove
Median Income by Occupancy in Oak Grove
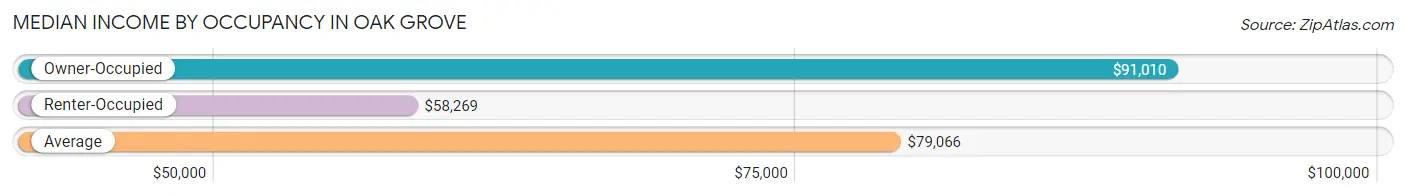
| Occupancy Type | # Households | Median Income |
| Owner-Occupied | 4,734 (65.0%) | $91,010 |
| Renter-Occupied | 2,544 (34.9%) | $58,269 |
| Average | 7,278 (100.0%) | $79,066 |
Occupancy by Householder Income Bracket in Oak Grove
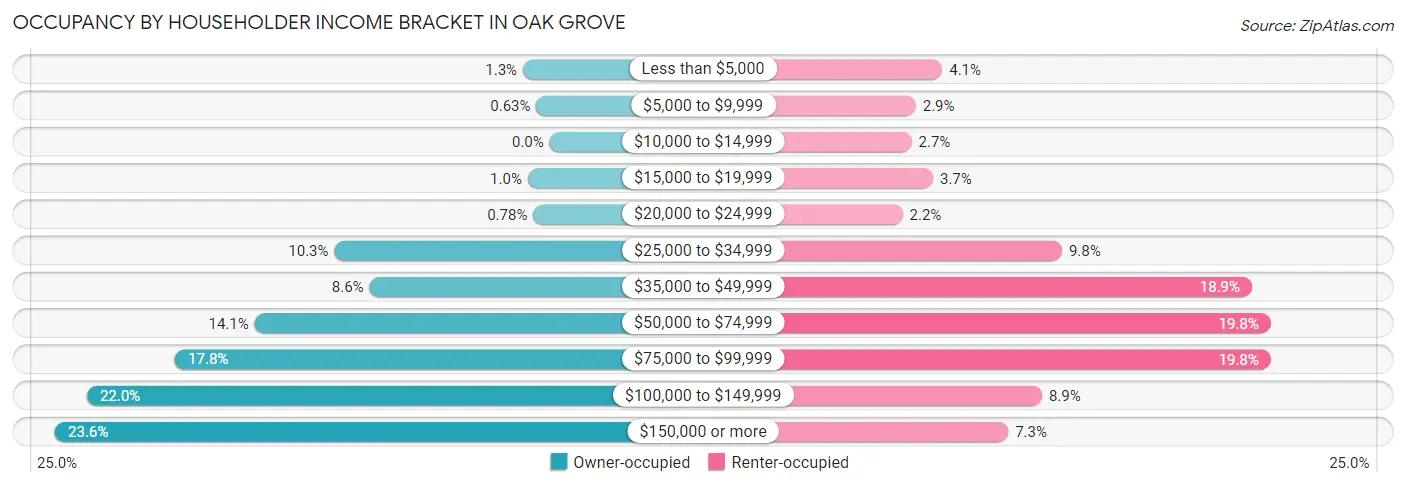
| Income Bracket | Owner-occupied | Renter-occupied |
| Less than $5,000 | 60 (1.3%) | 105 (4.1%) |
| $5,000 to $9,999 | 30 (0.6%) | 73 (2.9%) |
| $10,000 to $14,999 | 0 (0.0%) | 68 (2.7%) |
| $15,000 to $19,999 | 49 (1.0%) | 94 (3.7%) |
| $20,000 to $24,999 | 37 (0.8%) | 57 (2.2%) |
| $25,000 to $34,999 | 485 (10.2%) | 250 (9.8%) |
| $35,000 to $49,999 | 406 (8.6%) | 480 (18.9%) |
| $50,000 to $74,999 | 665 (14.1%) | 503 (19.8%) |
| $75,000 to $99,999 | 844 (17.8%) | 503 (19.8%) |
| $100,000 to $149,999 | 1,043 (22.0%) | 226 (8.9%) |
| $150,000 or more | 1,115 (23.5%) | 185 (7.3%) |
| Total | 4,734 (100.0%) | 2,544 (100.0%) |
Monthly Housing Cost Tiers in Oak Grove
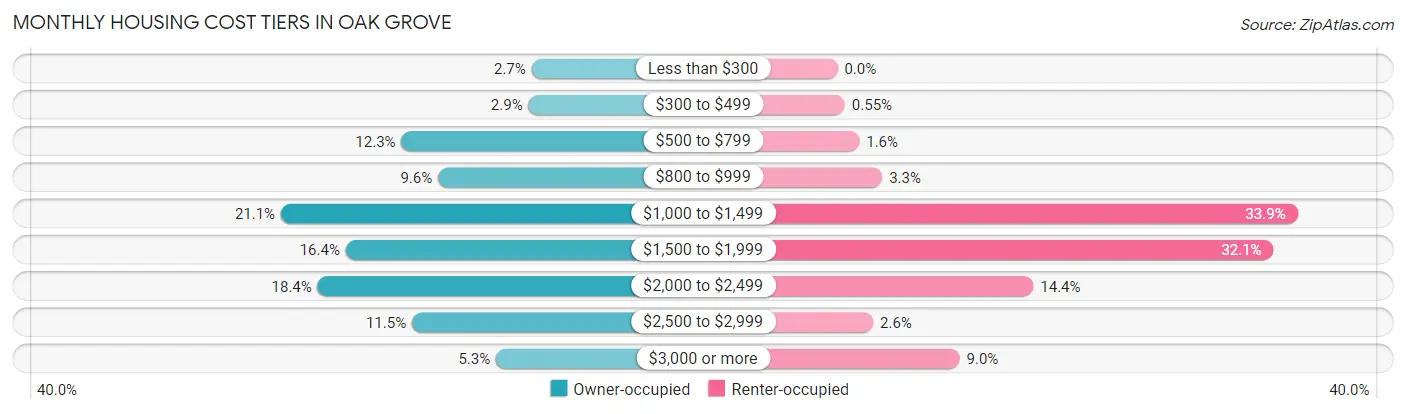
| Monthly Cost | Owner-occupied | Renter-occupied |
| Less than $300 | 126 (2.7%) | 0 (0.0%) |
| $300 to $499 | 137 (2.9%) | 14 (0.5%) |
| $500 to $799 | 580 (12.2%) | 41 (1.6%) |
| $800 to $999 | 452 (9.6%) | 84 (3.3%) |
| $1,000 to $1,499 | 1,000 (21.1%) | 862 (33.9%) |
| $1,500 to $1,999 | 774 (16.4%) | 817 (32.1%) |
| $2,000 to $2,499 | 872 (18.4%) | 367 (14.4%) |
| $2,500 to $2,999 | 543 (11.5%) | 67 (2.6%) |
| $3,000 or more | 250 (5.3%) | 229 (9.0%) |
| Total | 4,734 (100.0%) | 2,544 (100.0%) |
Physical Housing Characteristics in Oak Grove
Housing Structures in Oak Grove
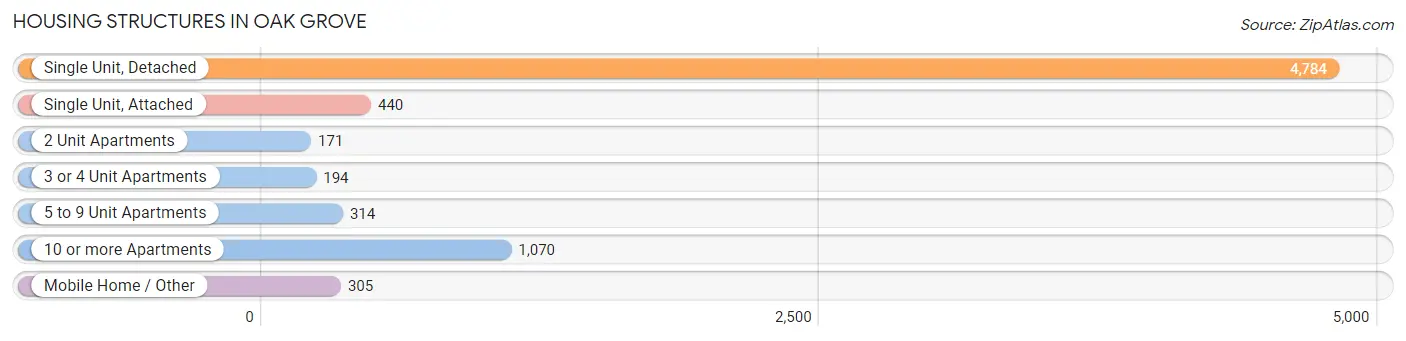
| Structure Type | # Housing Units | % Housing Units |
| Single Unit, Detached | 4,784 | 65.7% |
| Single Unit, Attached | 440 | 6.0% |
| 2 Unit Apartments | 171 | 2.4% |
| 3 or 4 Unit Apartments | 194 | 2.7% |
| 5 to 9 Unit Apartments | 314 | 4.3% |
| 10 or more Apartments | 1,070 | 14.7% |
| Mobile Home / Other | 305 | 4.2% |
| Total | 7,278 | 100.0% |
Housing Structures by Occupancy in Oak Grove
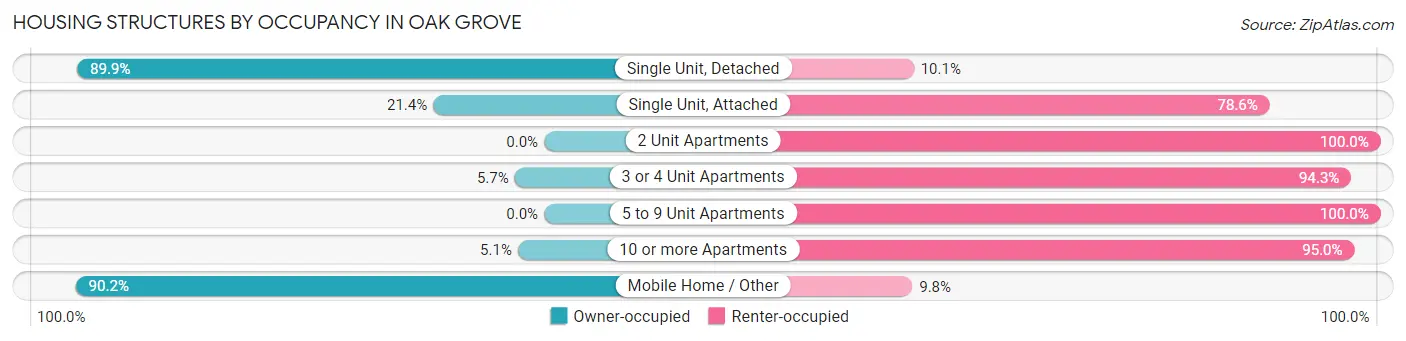
| Structure Type | Owner-occupied | Renter-occupied |
| Single Unit, Detached | 4,300 (89.9%) | 484 (10.1%) |
| Single Unit, Attached | 94 (21.4%) | 346 (78.6%) |
| 2 Unit Apartments | 0 (0.0%) | 171 (100.0%) |
| 3 or 4 Unit Apartments | 11 (5.7%) | 183 (94.3%) |
| 5 to 9 Unit Apartments | 0 (0.0%) | 314 (100.0%) |
| 10 or more Apartments | 54 (5.1%) | 1,016 (95.0%) |
| Mobile Home / Other | 275 (90.2%) | 30 (9.8%) |
| Total | 4,734 (65.0%) | 2,544 (34.9%) |
Housing Structures by Number of Rooms in Oak Grove
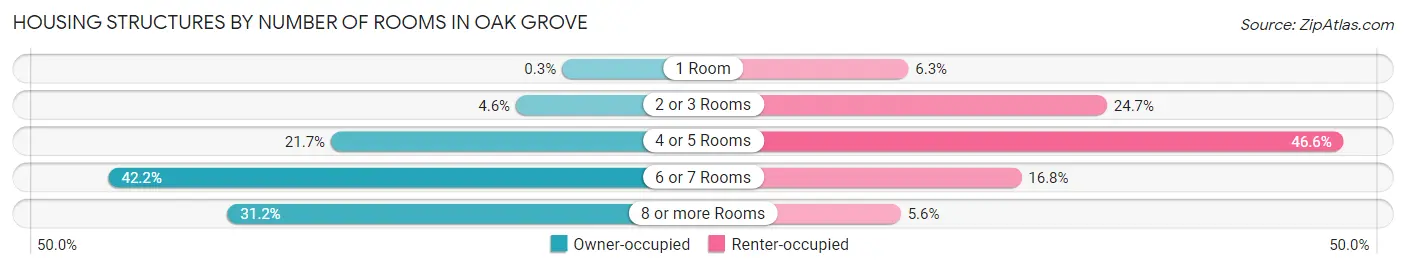
| Number of Rooms | Owner-occupied | Renter-occupied |
| 1 Room | 14 (0.3%) | 161 (6.3%) |
| 2 or 3 Rooms | 216 (4.6%) | 628 (24.7%) |
| 4 or 5 Rooms | 1,026 (21.7%) | 1,185 (46.6%) |
| 6 or 7 Rooms | 1,999 (42.2%) | 427 (16.8%) |
| 8 or more Rooms | 1,479 (31.2%) | 143 (5.6%) |
| Total | 4,734 (100.0%) | 2,544 (100.0%) |
Housing Structure by Heating Type in Oak Grove
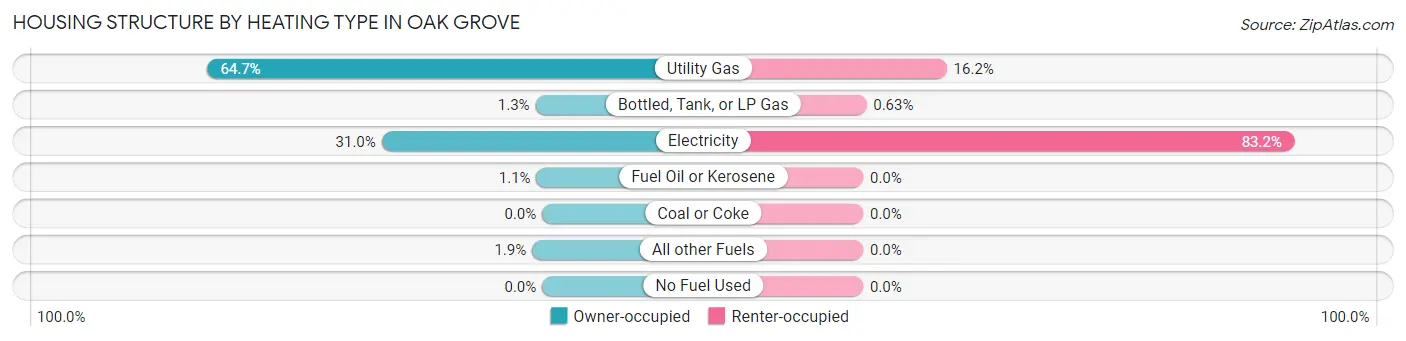
| Heating Type | Owner-occupied | Renter-occupied |
| Utility Gas | 3,061 (64.7%) | 411 (16.2%) |
| Bottled, Tank, or LP Gas | 61 (1.3%) | 16 (0.6%) |
| Electricity | 1,468 (31.0%) | 2,117 (83.2%) |
| Fuel Oil or Kerosene | 52 (1.1%) | 0 (0.0%) |
| Coal or Coke | 0 (0.0%) | 0 (0.0%) |
| All other Fuels | 92 (1.9%) | 0 (0.0%) |
| No Fuel Used | 0 (0.0%) | 0 (0.0%) |
| Total | 4,734 (100.0%) | 2,544 (100.0%) |
Household Vehicle Usage in Oak Grove
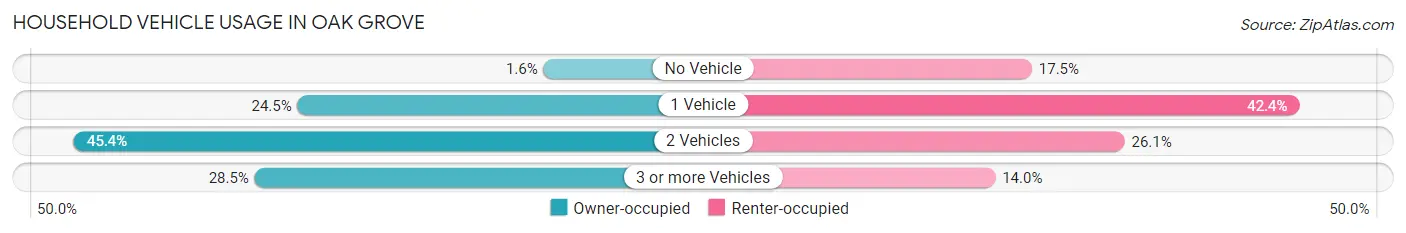
| Vehicles per Household | Owner-occupied | Renter-occupied |
| No Vehicle | 74 (1.6%) | 444 (17.4%) |
| 1 Vehicle | 1,161 (24.5%) | 1,079 (42.4%) |
| 2 Vehicles | 2,149 (45.4%) | 664 (26.1%) |
| 3 or more Vehicles | 1,350 (28.5%) | 357 (14.0%) |
| Total | 4,734 (100.0%) | 2,544 (100.0%) |
Real Estate & Mortgages in Oak Grove
Real Estate and Mortgage Overview in Oak Grove
| Characteristic | Without Mortgage | With Mortgage |
| Housing Units | 1,384 | 3,350 |
| Median Property Value | $427,400 | $458,600 |
| Median Household Income | $58,047 | $927 |
| Monthly Housing Costs | $748 | $250 |
| Real Estate Taxes | $4,494 | $20 |
Property Value by Mortgage Status in Oak Grove
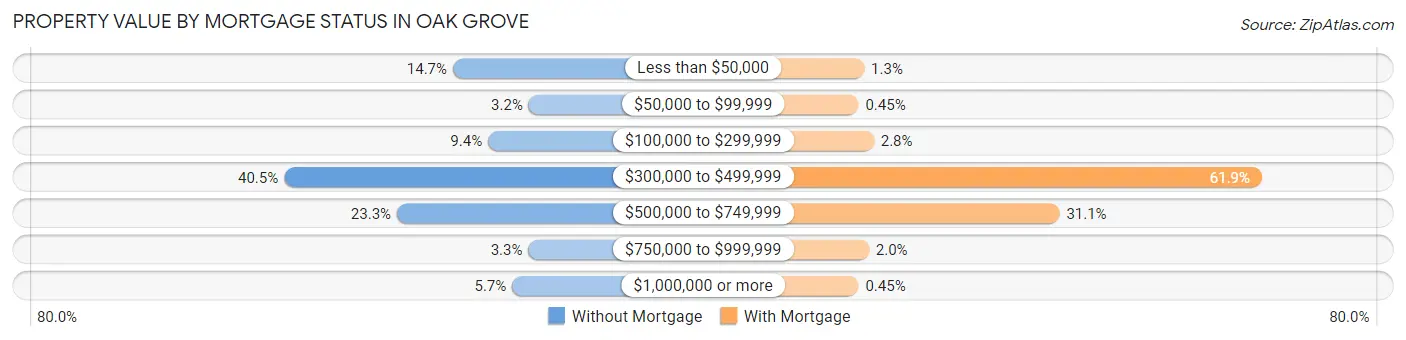
| Property Value | Without Mortgage | With Mortgage |
| Less than $50,000 | 204 (14.7%) | 44 (1.3%) |
| $50,000 to $99,999 | 44 (3.2%) | 15 (0.4%) |
| $100,000 to $299,999 | 130 (9.4%) | 93 (2.8%) |
| $300,000 to $499,999 | 560 (40.5%) | 2,074 (61.9%) |
| $500,000 to $749,999 | 322 (23.3%) | 1,041 (31.1%) |
| $750,000 to $999,999 | 45 (3.3%) | 68 (2.0%) |
| $1,000,000 or more | 79 (5.7%) | 15 (0.4%) |
| Total | 1,384 (100.0%) | 3,350 (100.0%) |
Household Income by Mortgage Status in Oak Grove
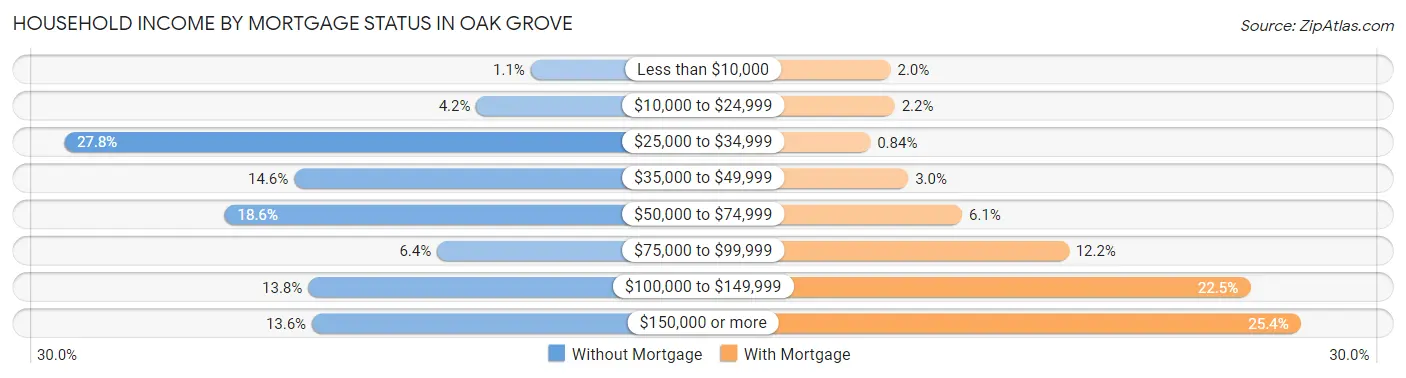
| Household Income | Without Mortgage | With Mortgage |
| Less than $10,000 | 15 (1.1%) | 67 (2.0%) |
| $10,000 to $24,999 | 58 (4.2%) | 75 (2.2%) |
| $25,000 to $34,999 | 384 (27.8%) | 28 (0.8%) |
| $35,000 to $49,999 | 202 (14.6%) | 101 (3.0%) |
| $50,000 to $74,999 | 257 (18.6%) | 204 (6.1%) |
| $75,000 to $99,999 | 89 (6.4%) | 408 (12.2%) |
| $100,000 to $149,999 | 191 (13.8%) | 755 (22.5%) |
| $150,000 or more | 188 (13.6%) | 852 (25.4%) |
| Total | 1,384 (100.0%) | 3,350 (100.0%) |
Property Value to Household Income Ratio in Oak Grove
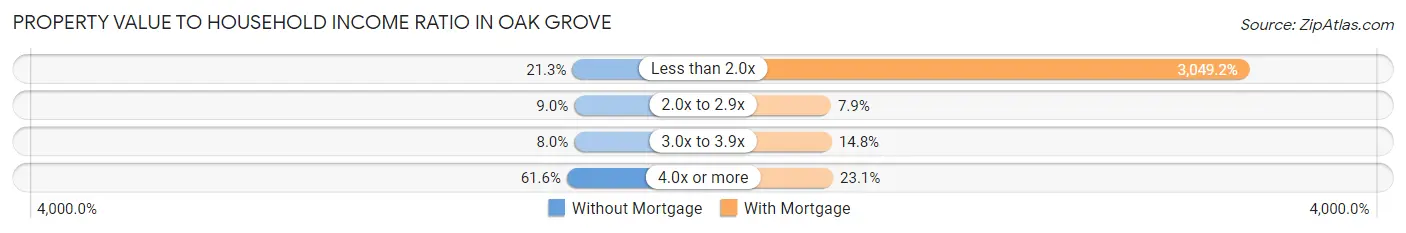
| Value-to-Income Ratio | Without Mortgage | With Mortgage |
| Less than 2.0x | 295 (21.3%) | 102,149 (3,049.2%) |
| 2.0x to 2.9x | 125 (9.0%) | 263 (7.9%) |
| 3.0x to 3.9x | 111 (8.0%) | 496 (14.8%) |
| 4.0x or more | 853 (61.6%) | 774 (23.1%) |
| Total | 1,384 (100.0%) | 3,350 (100.0%) |
Real Estate Taxes by Mortgage Status in Oak Grove
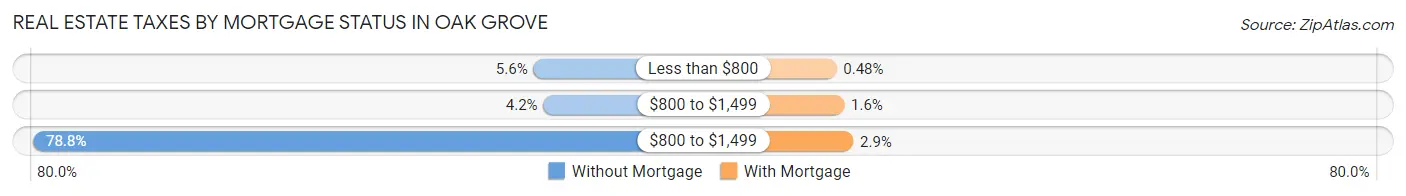
| Property Taxes | Without Mortgage | With Mortgage |
| Less than $800 | 78 (5.6%) | 16 (0.5%) |
| $800 to $1,499 | 58 (4.2%) | 54 (1.6%) |
| $800 to $1,499 | 1,090 (78.8%) | 98 (2.9%) |
| Total | 1,384 (100.0%) | 3,350 (100.0%) |
Health & Disability in Oak Grove
Health Insurance Coverage by Age in Oak Grove
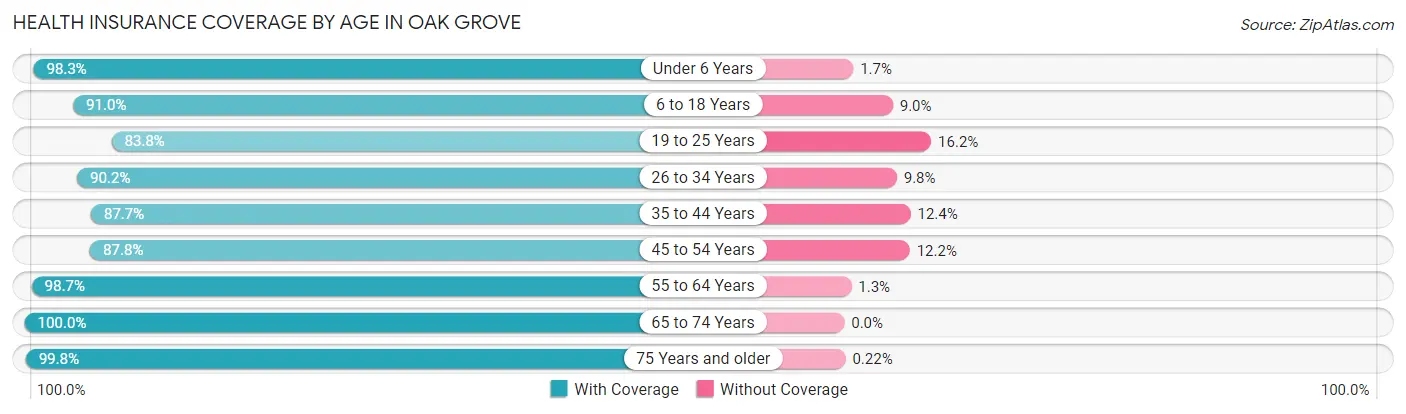
| Age Bracket | With Coverage | Without Coverage |
| Under 6 Years | 947 (98.3%) | 16 (1.7%) |
| 6 to 18 Years | 1,973 (91.0%) | 196 (9.0%) |
| 19 to 25 Years | 1,081 (83.8%) | 209 (16.2%) |
| 26 to 34 Years | 1,899 (90.2%) | 206 (9.8%) |
| 35 to 44 Years | 2,520 (87.6%) | 355 (12.3%) |
| 45 to 54 Years | 1,691 (87.8%) | 235 (12.2%) |
| 55 to 64 Years | 1,963 (98.7%) | 26 (1.3%) |
| 65 to 74 Years | 2,322 (100.0%) | 0 (0.0%) |
| 75 Years and older | 1,831 (99.8%) | 4 (0.2%) |
| Total | 16,227 (92.9%) | 1,247 (7.1%) |
Health Insurance Coverage by Citizenship Status in Oak Grove

| Citizenship Status | With Coverage | Without Coverage |
| Native Born | 947 (98.3%) | 16 (1.7%) |
| Foreign Born, Citizen | 1,973 (91.0%) | 196 (9.0%) |
| Foreign Born, not a Citizen | 1,081 (83.8%) | 209 (16.2%) |
Health Insurance Coverage by Household Income in Oak Grove
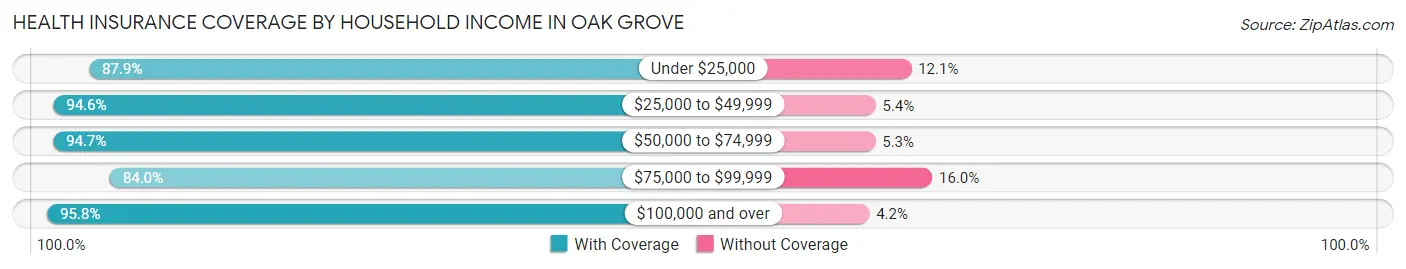
| Household Income | With Coverage | Without Coverage |
| Under $25,000 | 896 (87.9%) | 123 (12.1%) |
| $25,000 to $49,999 | 2,690 (94.6%) | 153 (5.4%) |
| $50,000 to $74,999 | 2,200 (94.7%) | 124 (5.3%) |
| $75,000 to $99,999 | 2,729 (84.0%) | 519 (16.0%) |
| $100,000 and over | 7,387 (95.8%) | 324 (4.2%) |
Public vs Private Health Insurance Coverage by Age in Oak Grove
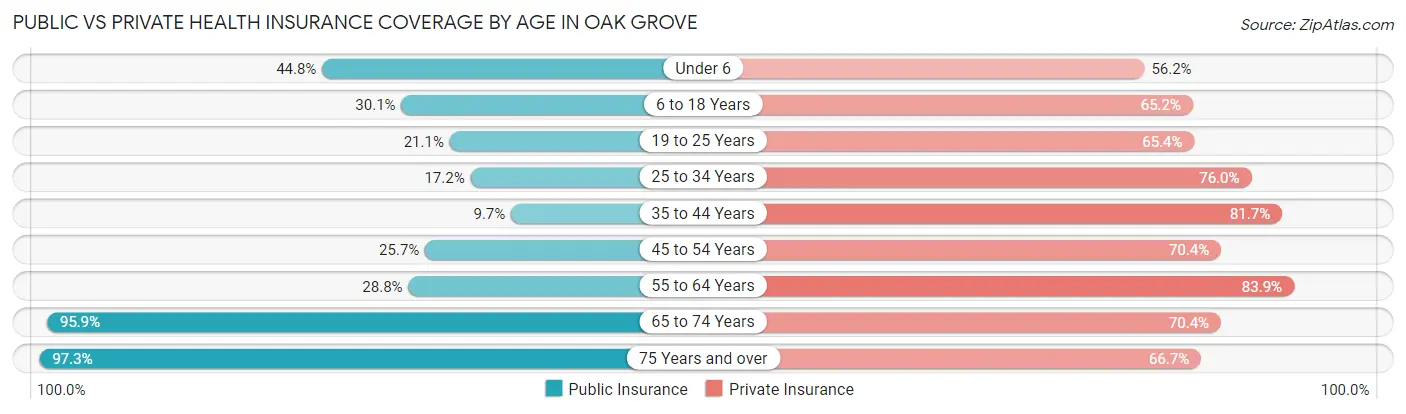
| Age Bracket | Public Insurance | Private Insurance |
| Under 6 | 431 (44.8%) | 541 (56.2%) |
| 6 to 18 Years | 652 (30.1%) | 1,413 (65.1%) |
| 19 to 25 Years | 272 (21.1%) | 844 (65.4%) |
| 25 to 34 Years | 363 (17.2%) | 1,600 (76.0%) |
| 35 to 44 Years | 279 (9.7%) | 2,349 (81.7%) |
| 45 to 54 Years | 494 (25.7%) | 1,356 (70.4%) |
| 55 to 64 Years | 572 (28.8%) | 1,669 (83.9%) |
| 65 to 74 Years | 2,226 (95.9%) | 1,634 (70.4%) |
| 75 Years and over | 1,785 (97.3%) | 1,224 (66.7%) |
| Total | 7,074 (40.5%) | 12,630 (72.3%) |
Disability Status by Sex by Age in Oak Grove
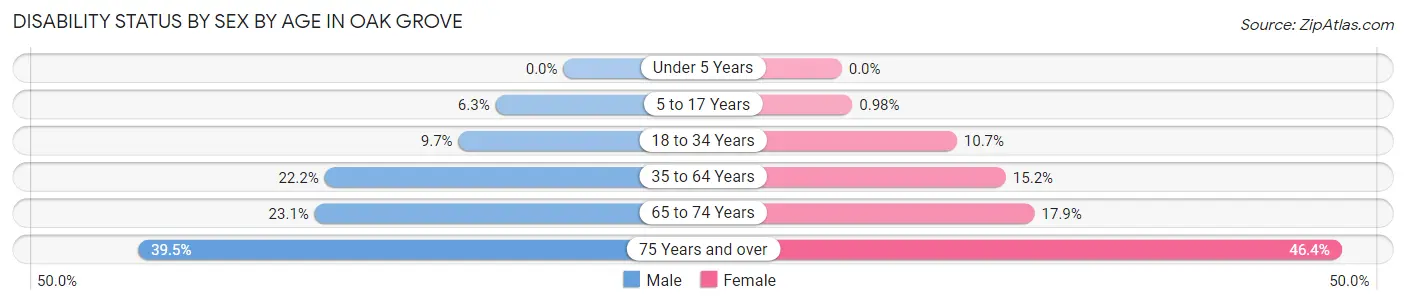
| Age Bracket | Male | Female |
| Under 5 Years | 0 (0.0%) | 0 (0.0%) |
| 5 to 17 Years | 72 (6.3%) | 10 (1.0%) |
| 18 to 34 Years | 189 (9.7%) | 176 (10.7%) |
| 35 to 64 Years | 734 (22.2%) | 530 (15.2%) |
| 65 to 74 Years | 265 (23.1%) | 210 (17.9%) |
| 75 Years and over | 326 (39.5%) | 468 (46.4%) |
Disability Class by Sex by Age in Oak Grove
Disability Class: Hearing Difficulty
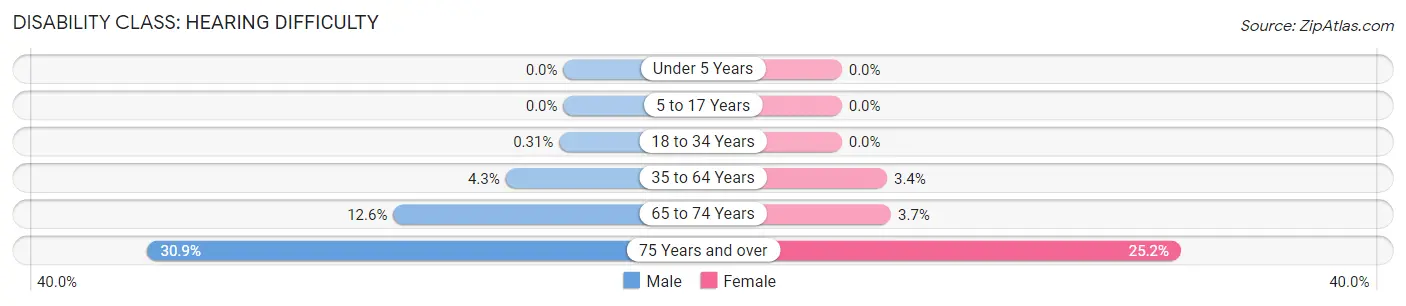
| Age Bracket | Male | Female |
| Under 5 Years | 0 (0.0%) | 0 (0.0%) |
| 5 to 17 Years | 0 (0.0%) | 0 (0.0%) |
| 18 to 34 Years | 6 (0.3%) | 0 (0.0%) |
| 35 to 64 Years | 142 (4.3%) | 117 (3.4%) |
| 65 to 74 Years | 145 (12.6%) | 43 (3.7%) |
| 75 Years and over | 255 (30.9%) | 254 (25.2%) |
Disability Class: Vision Difficulty
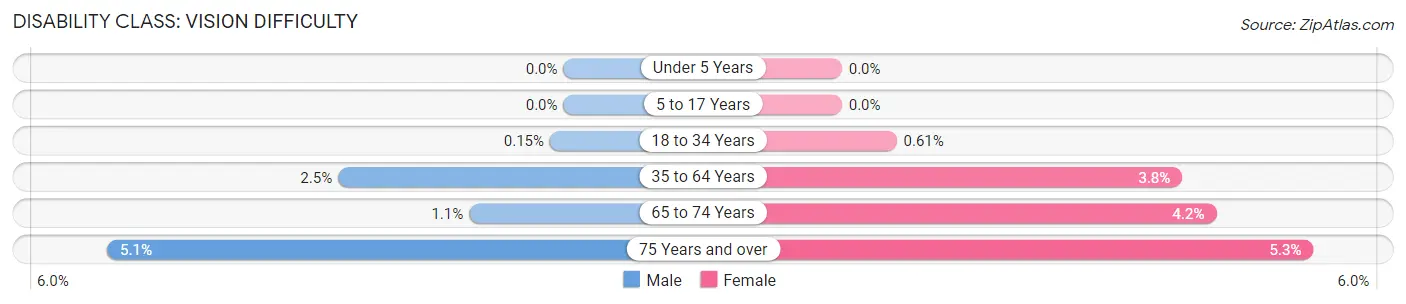
| Age Bracket | Male | Female |
| Under 5 Years | 0 (0.0%) | 0 (0.0%) |
| 5 to 17 Years | 0 (0.0%) | 0 (0.0%) |
| 18 to 34 Years | 3 (0.2%) | 10 (0.6%) |
| 35 to 64 Years | 83 (2.5%) | 132 (3.8%) |
| 65 to 74 Years | 12 (1.1%) | 49 (4.2%) |
| 75 Years and over | 42 (5.1%) | 53 (5.2%) |
Disability Class: Cognitive Difficulty
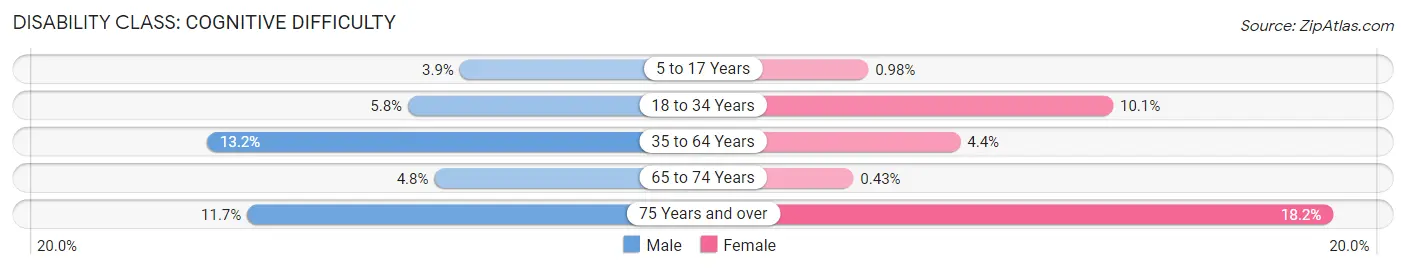
| Age Bracket | Male | Female |
| 5 to 17 Years | 44 (3.8%) | 10 (1.0%) |
| 18 to 34 Years | 112 (5.8%) | 166 (10.1%) |
| 35 to 64 Years | 438 (13.2%) | 153 (4.4%) |
| 65 to 74 Years | 55 (4.8%) | 5 (0.4%) |
| 75 Years and over | 97 (11.7%) | 184 (18.2%) |
Disability Class: Ambulatory Difficulty
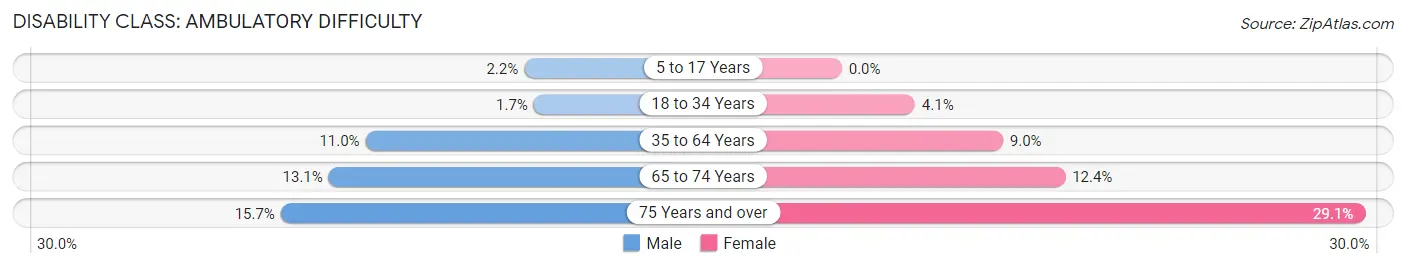
| Age Bracket | Male | Female |
| 5 to 17 Years | 25 (2.2%) | 0 (0.0%) |
| 18 to 34 Years | 32 (1.7%) | 67 (4.1%) |
| 35 to 64 Years | 365 (11.0%) | 312 (9.0%) |
| 65 to 74 Years | 150 (13.1%) | 146 (12.4%) |
| 75 Years and over | 130 (15.7%) | 294 (29.1%) |
Disability Class: Self-Care Difficulty
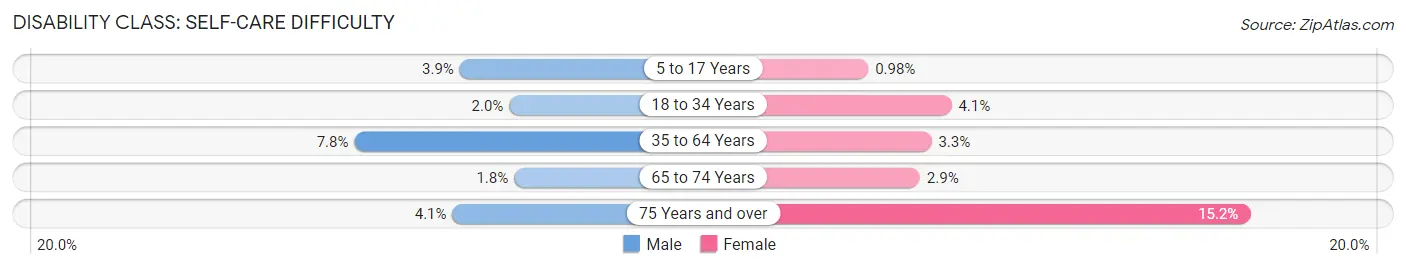
| Age Bracket | Male | Female |
| 5 to 17 Years | 44 (3.8%) | 10 (1.0%) |
| 18 to 34 Years | 39 (2.0%) | 67 (4.1%) |
| 35 to 64 Years | 257 (7.8%) | 116 (3.3%) |
| 65 to 74 Years | 21 (1.8%) | 34 (2.9%) |
| 75 Years and over | 34 (4.1%) | 153 (15.2%) |
Technology Access in Oak Grove
Computing Device Access in Oak Grove
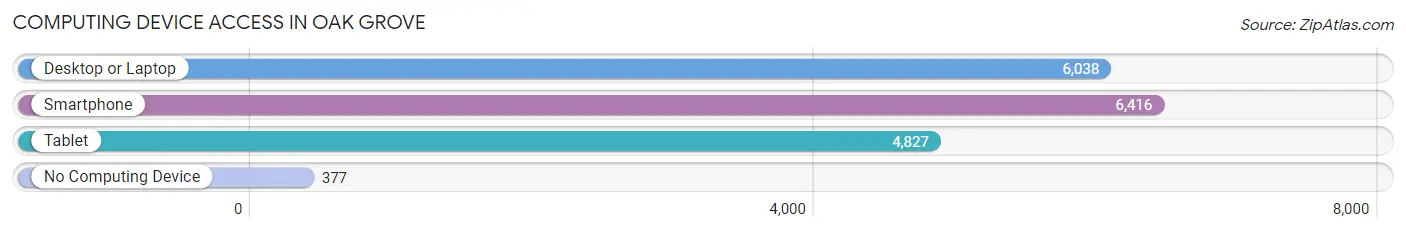
| Device Type | # Households | % Households |
| Desktop or Laptop | 6,038 | 83.0% |
| Smartphone | 6,416 | 88.2% |
| Tablet | 4,827 | 66.3% |
| No Computing Device | 377 | 5.2% |
| Total | 7,278 | 100.0% |
Internet Access in Oak Grove
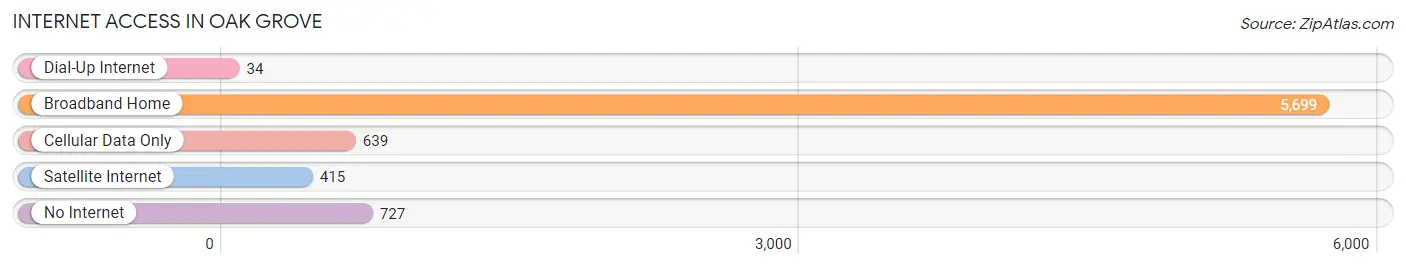
| Internet Type | # Households | % Households |
| Dial-Up Internet | 34 | 0.5% |
| Broadband Home | 5,699 | 78.3% |
| Cellular Data Only | 639 | 8.8% |
| Satellite Internet | 415 | 5.7% |
| No Internet | 727 | 10.0% |
| Total | 7,278 | 100.0% |
Oak Grove Summary
Oak Grove is a small unincorporated community located in Clackamas County, Oregon, United States. It is located on the east side of the Willamette River, just south of Portland. The population was estimated to be 8,845 in 2019.
History
Oak Grove was first settled in the late 1800s by a group of German immigrants. The area was originally known as Oak Grove Station, as it was a stop on the Oregon and California Railroad. The name was changed to Oak Grove in 1891.
The area was primarily agricultural, with dairy farms and orchards. In the early 1900s, the area began to develop as a residential community. The first school was built in 1910, and the first post office opened in 1911.
In the 1950s, Oak Grove began to experience rapid growth as Portland's suburbs expanded. The area was annexed by the city of Milwaukie in 1966.
Geography
Oak Grove is located in Clackamas County, Oregon, on the east side of the Willamette River, just south of Portland. It is bordered by the cities of Milwaukie to the north, Gladstone to the east, and Jennings Lodge to the south.
The terrain is mostly flat, with some hills in the northern part of the community. The climate is mild, with warm summers and cool winters.
Economy
Oak Grove is primarily a residential community, with most of its residents commuting to Portland for work. The area is home to several small businesses, including restaurants, retail stores, and professional services.
Oak Grove is also home to several industrial parks, which provide employment for many of the area's residents. The largest employers in the area include Intel, Oregon Steel Mills, and the Clackamas County government.
Demographics
As of 2019, the population of Oak Grove was estimated to be 8,845. The racial makeup of the community was 79.3% White, 8.2% Hispanic or Latino, 6.2% Asian, and 4.3% African American.
The median household income in Oak Grove was $60,945 in 2019, and the median home value was $360,000. The unemployment rate was 3.7%.
Conclusion
Oak Grove is a small unincorporated community located in Clackamas County, Oregon, just south of Portland. It was first settled in the late 1800s by a group of German immigrants, and has since grown into a residential community. The area is home to several small businesses, as well as industrial parks that provide employment for many of the area's residents. The population of Oak Grove was estimated to be 8,845 in 2019, with a median household income of $60,945 and a median home value of $360,000.
Common Questions
What is Per Capita Income in Oak Grove?
Per Capita income in Oak Grove is $40,925.
What is the Median Family Income in Oak Grove?
Median Family Income in Oak Grove is $90,000.
What is the Median Household income in Oak Grove?
Median Household Income in Oak Grove is $79,066.
What is Income or Wage Gap in Oak Grove?
Income or Wage Gap in Oak Grove is 9.9%.
Women in Oak Grove earn 90.1 cents for every dollar earned by a man.
What is Inequality or Gini Index in Oak Grove?
Inequality or Gini Index in Oak Grove is 0.40.
What is the Total Population of Oak Grove?
Total Population of Oak Grove is 17,535.
What is the Total Male Population of Oak Grove?
Total Male Population of Oak Grove is 8,837.
What is the Total Female Population of Oak Grove?
Total Female Population of Oak Grove is 8,698.
What is the Ratio of Males per 100 Females in Oak Grove?
There are 101.60 Males per 100 Females in Oak Grove.
What is the Ratio of Females per 100 Males in Oak Grove?
There are 98.43 Females per 100 Males in Oak Grove.
What is the Median Population Age in Oak Grove?
Median Population Age in Oak Grove is 43.5 Years.
What is the Average Family Size in Oak Grove
Average Family Size in Oak Grove is 3.0 People.
What is the Average Household Size in Oak Grove
Average Household Size in Oak Grove is 2.4 People.
How Large is the Labor Force in Oak Grove?
There are 9,103 People in the Labor Forcein in Oak Grove.
What is the Percentage of People in the Labor Force in Oak Grove?
60.6% of People are in the Labor Force in Oak Grove.
What is the Unemployment Rate in Oak Grove?
Unemployment Rate in Oak Grove is 8.0%.