El Cerro Mission, NM Map & Demographics
El Cerro Mission Map
El Cerro Mission Overview
$16,380
PER CAPITA INCOME
$47,070
AVG FAMILY INCOME
$45,264
AVG HOUSEHOLD INCOME
41.7%
WAGE / INCOME GAP [ % ]
58.3¢/ $1
WAGE / INCOME GAP [ $ ]
0.40
INEQUALITY / GINI INDEX
4,999
TOTAL POPULATION
2,687
MALE POPULATION
2,312
FEMALE POPULATION
116.22
MALES / 100 FEMALES
86.04
FEMALES / 100 MALES
34.2
MEDIAN AGE
4.2
AVG FAMILY SIZE
3.5
AVG HOUSEHOLD SIZE
2,085
LABOR FORCE [ PEOPLE ]
56.5%
PERCENT IN LABOR FORCE
15.9%
UNEMPLOYMENT RATE
Income in El Cerro Mission
Income Overview in El Cerro Mission
Per Capita Income in El Cerro Mission is $16,380, while median incomes of families and households are $47,070 and $45,264 respectively.
| Characteristic | Number | Measure |
| Per Capita Income | 4,999 | $16,380 |
| Median Family Income | 1,100 | $47,070 |
| Mean Family Income | 1,100 | $58,915 |
| Median Household Income | 1,427 | $45,264 |
| Mean Household Income | 1,427 | $52,915 |
| Income Deficit | 1,100 | $0 |
| Wage / Income Gap (%) | 4,999 | 41.75% |
| Wage / Income Gap ($) | 4,999 | 58.25¢ per $1 |
| Gini / Inequality Index | 4,999 | 0.40 |
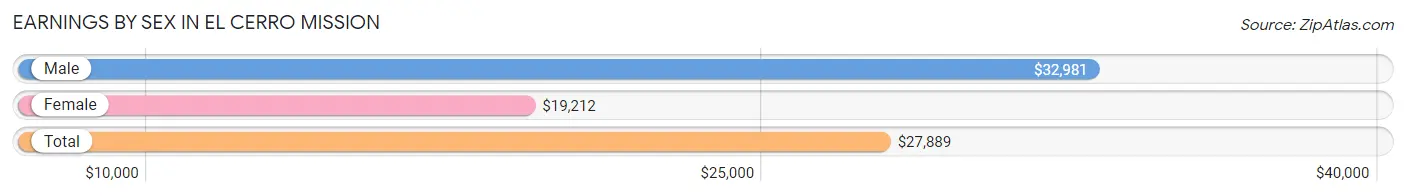
Earnings by Sex in El Cerro Mission
Average Earnings in El Cerro Mission are $27,889, $32,981 for men and $19,212 for women, a difference of 41.7%.
| Sex | Number | Average Earnings |
| Male | 1,228 (61.6%) | $32,981 |
| Female | 766 (38.4%) | $19,212 |
| Total | 1,994 (100.0%) | $27,889 |
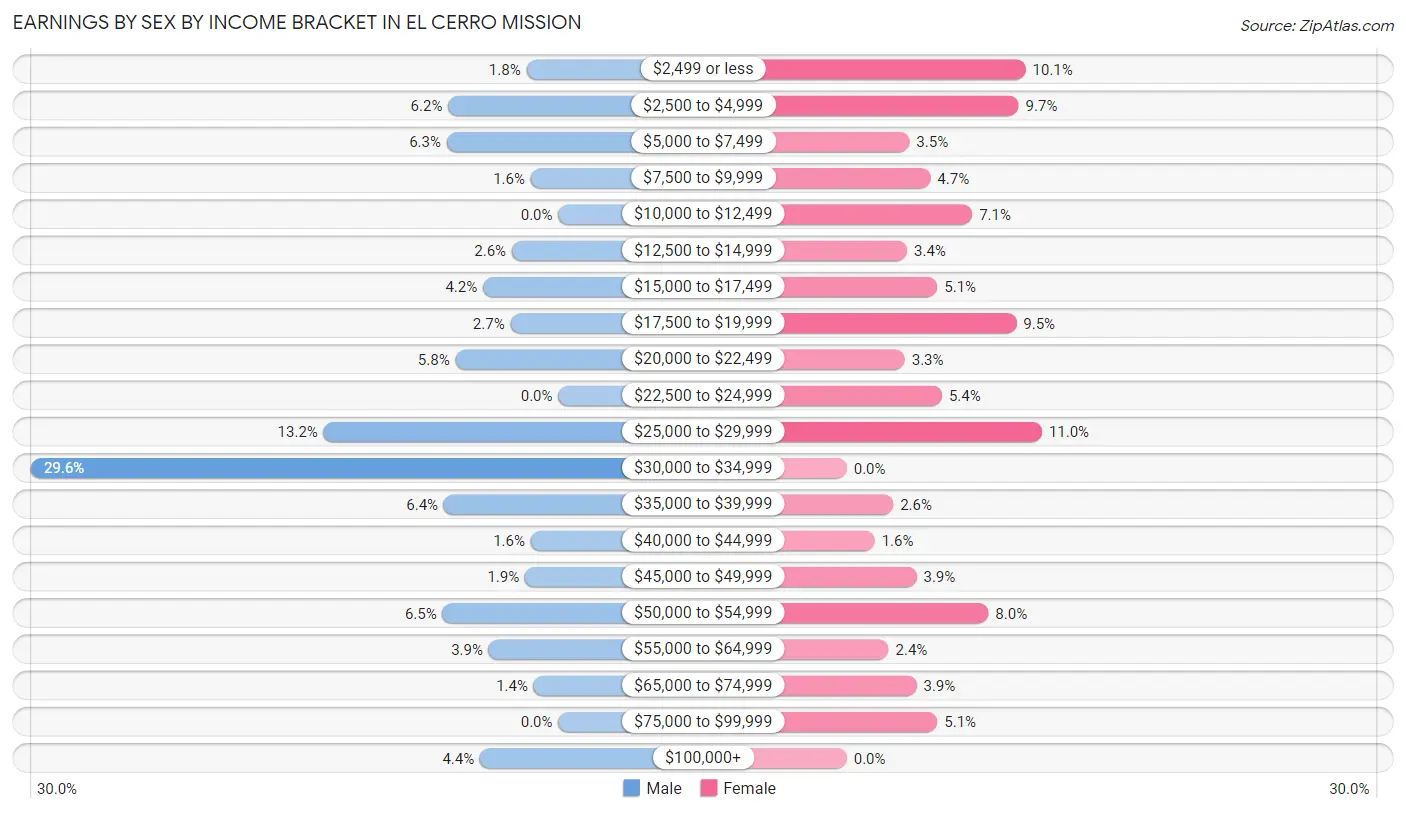
Earnings by Sex by Income Bracket in El Cerro Mission
The most common earnings brackets in El Cerro Mission are $30,000 to $34,999 for men (364 | 29.6%) and $25,000 to $29,999 for women (84 | 11.0%).
| Income | Male | Female |
| $2,499 or less | 22 (1.8%) | 77 (10.1%) |
| $2,500 to $4,999 | 76 (6.2%) | 74 (9.7%) |
| $5,000 to $7,499 | 77 (6.3%) | 27 (3.5%) |
| $7,500 to $9,999 | 19 (1.5%) | 36 (4.7%) |
| $10,000 to $12,499 | 0 (0.0%) | 54 (7.0%) |
| $12,500 to $14,999 | 32 (2.6%) | 26 (3.4%) |
| $15,000 to $17,499 | 52 (4.2%) | 39 (5.1%) |
| $17,500 to $19,999 | 33 (2.7%) | 73 (9.5%) |
| $20,000 to $22,499 | 71 (5.8%) | 25 (3.3%) |
| $22,500 to $24,999 | 0 (0.0%) | 41 (5.3%) |
| $25,000 to $29,999 | 162 (13.2%) | 84 (11.0%) |
| $30,000 to $34,999 | 364 (29.6%) | 0 (0.0%) |
| $35,000 to $39,999 | 79 (6.4%) | 20 (2.6%) |
| $40,000 to $44,999 | 19 (1.5%) | 12 (1.6%) |
| $45,000 to $49,999 | 23 (1.9%) | 30 (3.9%) |
| $50,000 to $54,999 | 80 (6.5%) | 61 (8.0%) |
| $55,000 to $64,999 | 48 (3.9%) | 18 (2.4%) |
| $65,000 to $74,999 | 17 (1.4%) | 30 (3.9%) |
| $75,000 to $99,999 | 0 (0.0%) | 39 (5.1%) |
| $100,000+ | 54 (4.4%) | 0 (0.0%) |
| Total | 1,228 (100.0%) | 766 (100.0%) |
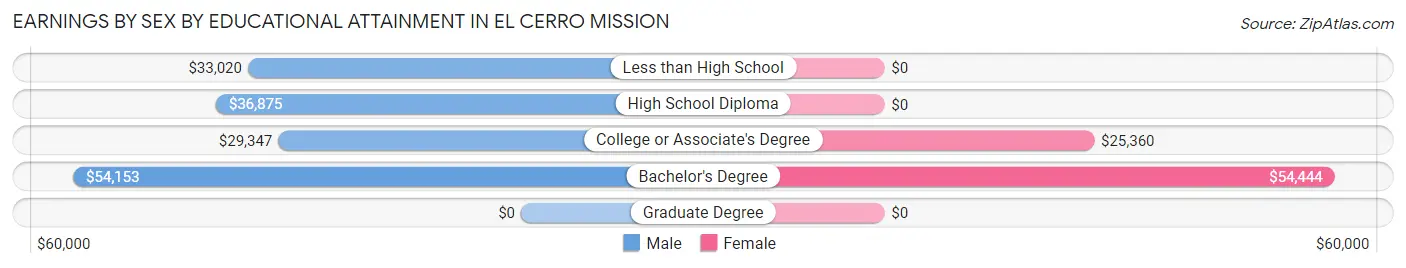
Earnings by Sex by Educational Attainment in El Cerro Mission
Average earnings in El Cerro Mission are $33,414 for men and $21,800 for women, a difference of 34.8%. Men with an educational attainment of bachelor's degree enjoy the highest average annual earnings of $54,153, while those with college or associate's degree education earn the least with $29,347. Women with an educational attainment of bachelor's degree earn the most with the average annual earnings of $54,444, while those with college or associate's degree education have the smallest earnings of $25,360.
| Educational Attainment | Male Income | Female Income |
| Less than High School | $33,020 | $0 |
| High School Diploma | $36,875 | $0 |
| College or Associate's Degree | $29,347 | $25,360 |
| Bachelor's Degree | $54,153 | $54,444 |
| Graduate Degree | - | - |
| Total | $33,414 | $21,800 |
Family Income in El Cerro Mission
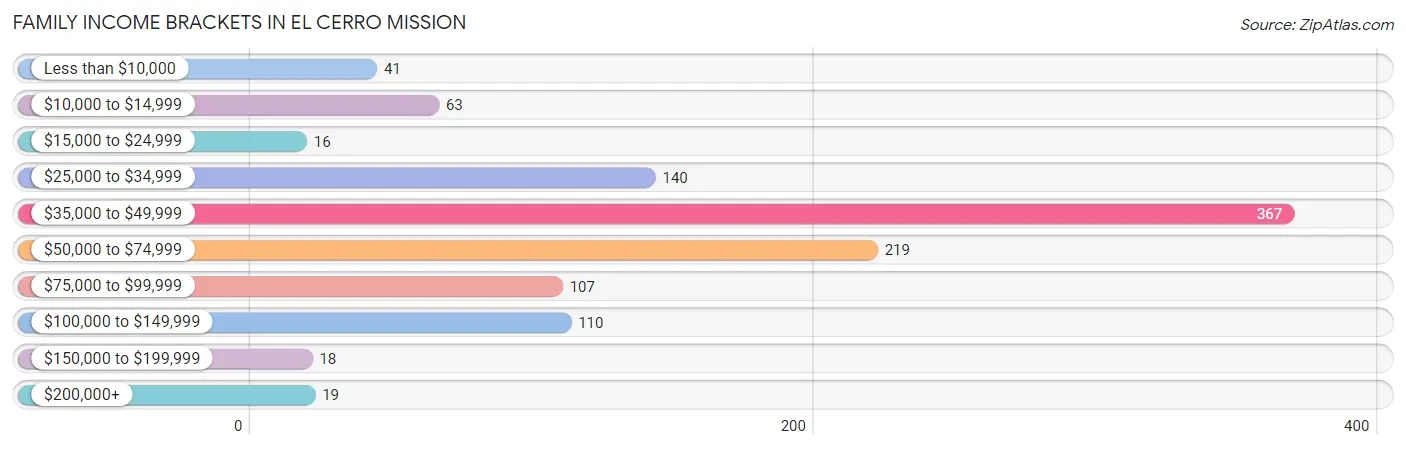
Family Income Brackets in El Cerro Mission
According to the El Cerro Mission family income data, there are 367 families falling into the $35,000 to $49,999 income range, which is the most common income bracket and makes up 33.4% of all families. Conversely, the $15,000 to $24,999 income bracket is the least frequent group with only 16 families (1.5%) belonging to this category.
| Income Bracket | # Families | % Families |
| Less than $10,000 | 41 | 3.7% |
| $10,000 to $14,999 | 63 | 5.7% |
| $15,000 to $24,999 | 16 | 1.5% |
| $25,000 to $34,999 | 140 | 12.7% |
| $35,000 to $49,999 | 367 | 33.4% |
| $50,000 to $74,999 | 219 | 19.9% |
| $75,000 to $99,999 | 107 | 9.7% |
| $100,000 to $149,999 | 110 | 10.0% |
| $150,000 to $199,999 | 18 | 1.6% |
| $200,000+ | 19 | 1.7% |
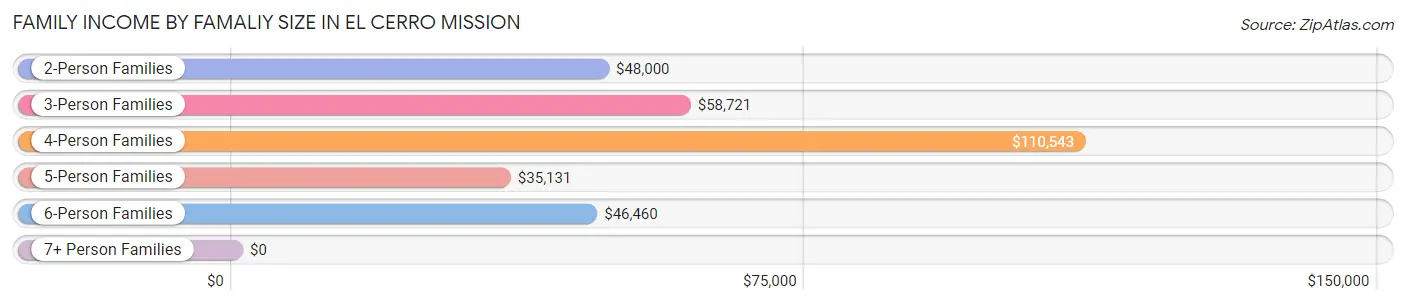
Family Income by Famaliy Size in El Cerro Mission
4-person families (150 | 13.6%) account for the highest median family income in El Cerro Mission with $110,543 per family, while 4-person families (150 | 13.6%) have the highest median income of $27,636 per family member.
| Income Bracket | # Families | Median Income |
| 2-Person Families | 376 (34.2%) | $48,000 |
| 3-Person Families | 154 (14.0%) | $58,721 |
| 4-Person Families | 150 (13.6%) | $110,543 |
| 5-Person Families | 207 (18.8%) | $35,131 |
| 6-Person Families | 208 (18.9%) | $46,460 |
| 7+ Person Families | 5 (0.4%) | $0 |
| Total | 1,100 (100.0%) | $47,070 |
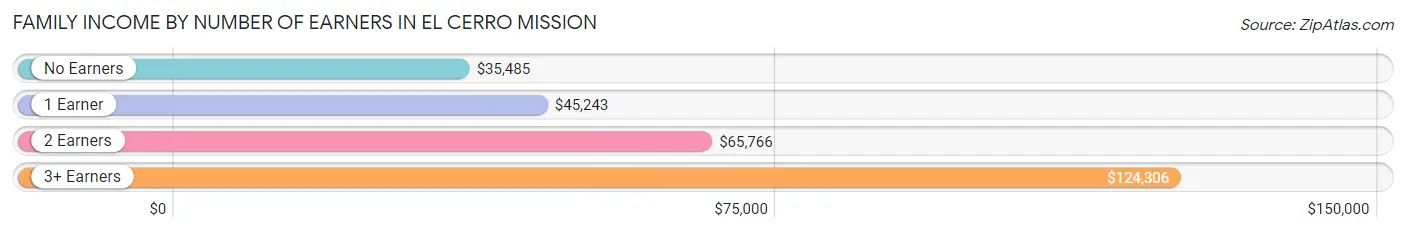
Family Income by Number of Earners in El Cerro Mission
The median family income in El Cerro Mission is $47,070, with families comprising 3+ earners (124) having the highest median family income of $124,306, while families with no earners (190) have the lowest median family income of $35,485, accounting for 11.3% and 17.3% of families, respectively.
| Number of Earners | # Families | Median Income |
| No Earners | 190 (17.3%) | $35,485 |
| 1 Earner | 492 (44.7%) | $45,243 |
| 2 Earners | 294 (26.7%) | $65,766 |
| 3+ Earners | 124 (11.3%) | $124,306 |
| Total | 1,100 (100.0%) | $47,070 |
Household Income in El Cerro Mission
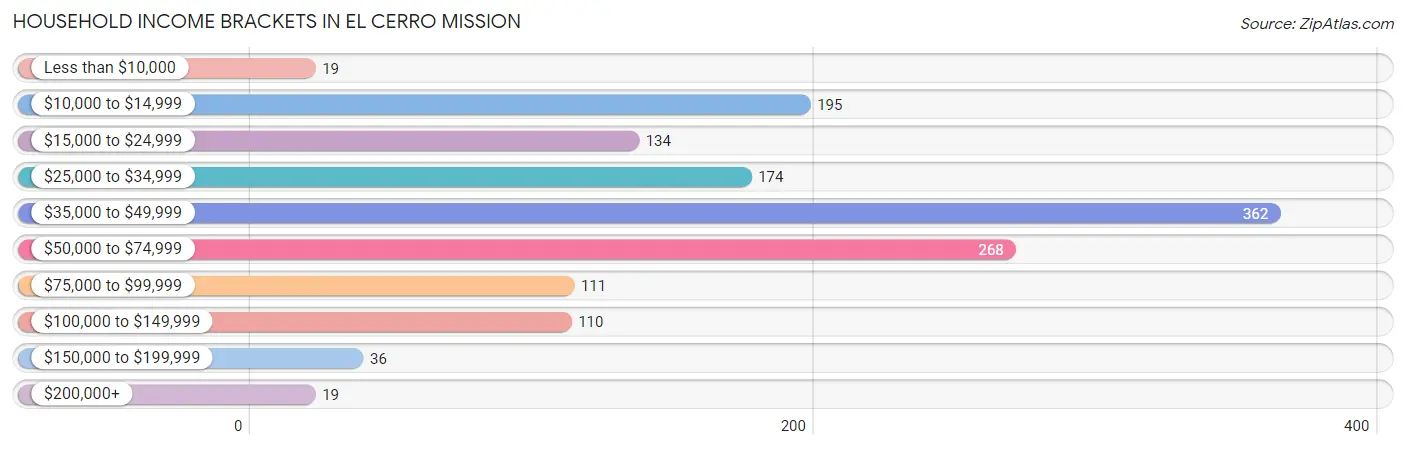
Household Income Brackets in El Cerro Mission
With 362 households falling in the category, the $35,000 to $49,999 income range is the most frequent in El Cerro Mission, accounting for 25.4% of all households. In contrast, only 19 households (1.3%) fall into the less than $10,000 income bracket, making it the least populous group.
| Income Bracket | # Households | % Households |
| Less than $10,000 | 19 | 1.3% |
| $10,000 to $14,999 | 195 | 13.7% |
| $15,000 to $24,999 | 134 | 9.4% |
| $25,000 to $34,999 | 174 | 12.2% |
| $35,000 to $49,999 | 362 | 25.4% |
| $50,000 to $74,999 | 268 | 18.8% |
| $75,000 to $99,999 | 111 | 7.8% |
| $100,000 to $149,999 | 110 | 7.7% |
| $150,000 to $199,999 | 36 | 2.5% |
| $200,000+ | 19 | 1.3% |
Household Income by Householder Age in El Cerro Mission
The median household income in El Cerro Mission is $45,264, with the highest median household income of $46,493 found in the 25 to 44 years age bracket for the primary householder. A total of 547 households (38.3%) fall into this category.
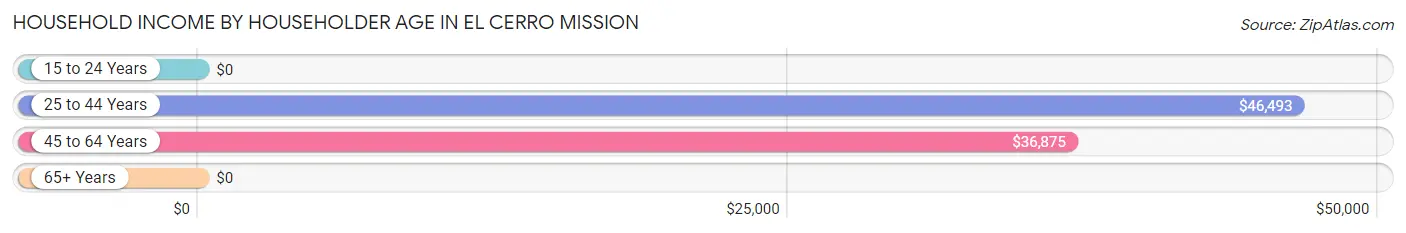
| Income Bracket | # Households | Median Income |
| 15 to 24 Years | 0 (0.0%) | $0 |
| 25 to 44 Years | 547 (38.3%) | $46,493 |
| 45 to 64 Years | 647 (45.3%) | $36,875 |
| 65+ Years | 233 (16.3%) | $0 |
| Total | 1,427 (100.0%) | $45,264 |
Poverty in El Cerro Mission
Income Below Poverty by Sex and Age in El Cerro Mission
With 28.0% poverty level for males and 36.2% for females among the residents of El Cerro Mission, under 5 year old males and 5 year old females are the most vulnerable to poverty, with 223 males (83.8%) and 37 females (100.0%) in their respective age groups living below the poverty level.
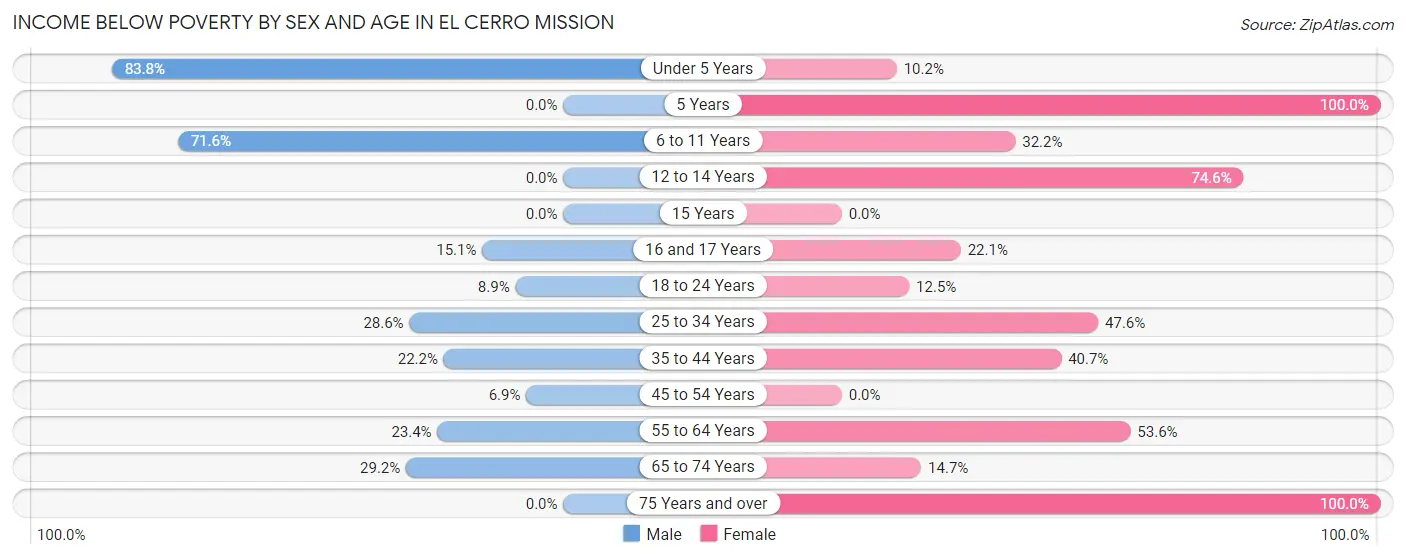
| Age Bracket | Male | Female |
| Under 5 Years | 223 (83.8%) | 5 (10.2%) |
| 5 Years | 0 (0.0%) | 37 (100.0%) |
| 6 to 11 Years | 141 (71.6%) | 104 (32.2%) |
| 12 to 14 Years | 0 (0.0%) | 129 (74.6%) |
| 15 Years | 0 (0.0%) | 0 (0.0%) |
| 16 and 17 Years | 14 (15.0%) | 17 (22.1%) |
| 18 to 24 Years | 27 (8.9%) | 20 (12.5%) |
| 25 to 34 Years | 100 (28.6%) | 177 (47.6%) |
| 35 to 44 Years | 85 (22.2%) | 169 (40.7%) |
| 45 to 54 Years | 25 (6.9%) | 0 (0.0%) |
| 55 to 64 Years | 61 (23.4%) | 150 (53.6%) |
| 65 to 74 Years | 75 (29.2%) | 19 (14.7%) |
| 75 Years and over | 0 (0.0%) | 10 (100.0%) |
| Total | 751 (28.0%) | 837 (36.2%) |
Income Above Poverty by Sex and Age in El Cerro Mission
According to the poverty statistics in El Cerro Mission, males aged 12 to 14 years and females aged 15 years are the age groups that are most secure financially, with 100.0% of males and 100.0% of females in these age groups living above the poverty line.
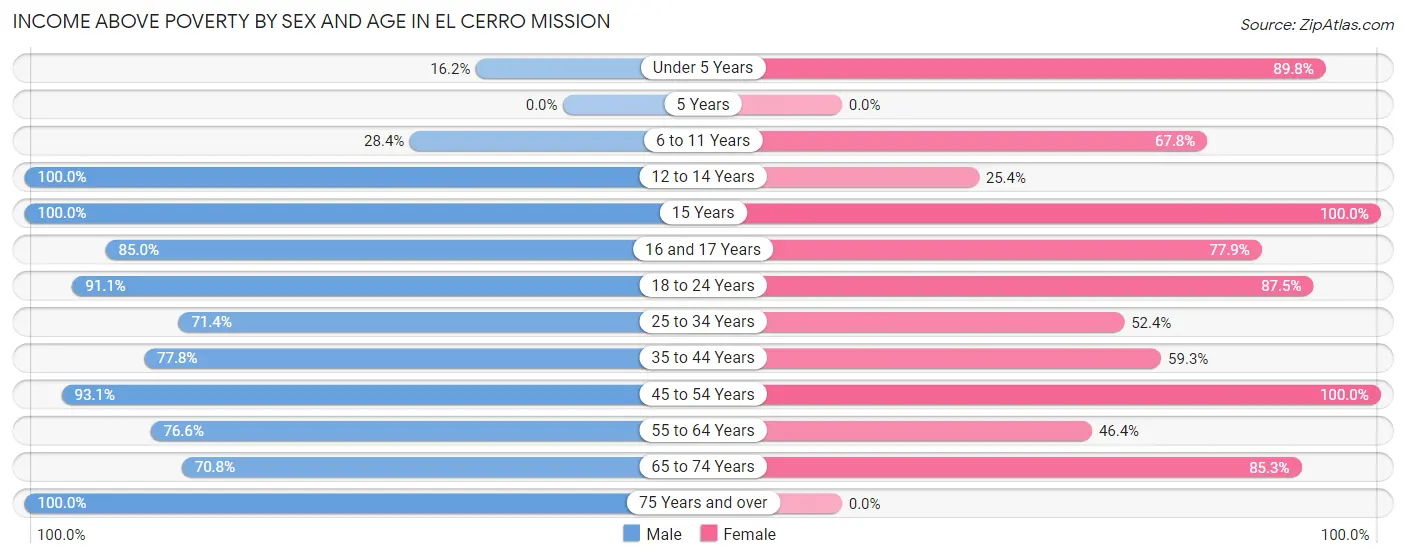
| Age Bracket | Male | Female |
| Under 5 Years | 43 (16.2%) | 44 (89.8%) |
| 5 Years | 0 (0.0%) | 0 (0.0%) |
| 6 to 11 Years | 56 (28.4%) | 219 (67.8%) |
| 12 to 14 Years | 191 (100.0%) | 44 (25.4%) |
| 15 Years | 7 (100.0%) | 65 (100.0%) |
| 16 and 17 Years | 79 (85.0%) | 60 (77.9%) |
| 18 to 24 Years | 277 (91.1%) | 140 (87.5%) |
| 25 to 34 Years | 250 (71.4%) | 195 (52.4%) |
| 35 to 44 Years | 298 (77.8%) | 246 (59.3%) |
| 45 to 54 Years | 339 (93.1%) | 222 (100.0%) |
| 55 to 64 Years | 200 (76.6%) | 130 (46.4%) |
| 65 to 74 Years | 182 (70.8%) | 110 (85.3%) |
| 75 Years and over | 14 (100.0%) | 0 (0.0%) |
| Total | 1,936 (72.1%) | 1,475 (63.8%) |
Income Below Poverty Among Married-Couple Families in El Cerro Mission
The poverty statistics for married-couple families in El Cerro Mission show that 23.7% or 194 of the total 818 families live below the poverty line. Families with 1 or 2 children have the highest poverty rate of 39.8%, comprising of 72 families. On the other hand, families with no children have the lowest poverty rate of 14.9%, which includes 63 families.
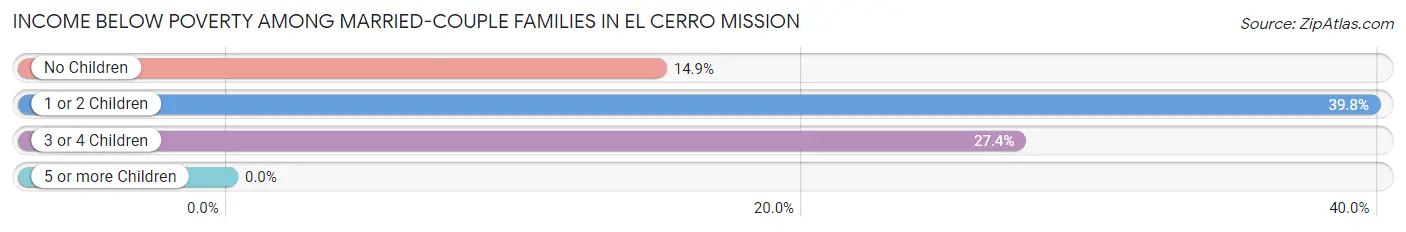
| Children | Above Poverty | Below Poverty |
| No Children | 359 (85.1%) | 63 (14.9%) |
| 1 or 2 Children | 109 (60.2%) | 72 (39.8%) |
| 3 or 4 Children | 156 (72.6%) | 59 (27.4%) |
| 5 or more Children | 0 (0.0%) | 0 (0.0%) |
| Total | 624 (76.3%) | 194 (23.7%) |
Income Below Poverty Among Single-Parent Households in El Cerro Mission
According to the poverty data in El Cerro Mission, 26.1% or 46 single-father households and 31.1% or 33 single-mother households are living below the poverty line. Among single-father households, those with 3 or 4 children have the highest poverty rate, with 46 households (100.0%) experiencing poverty. Likewise, among single-mother households, those with 3 or 4 children have the highest poverty rate, with 33 households (100.0%) falling below the poverty line.
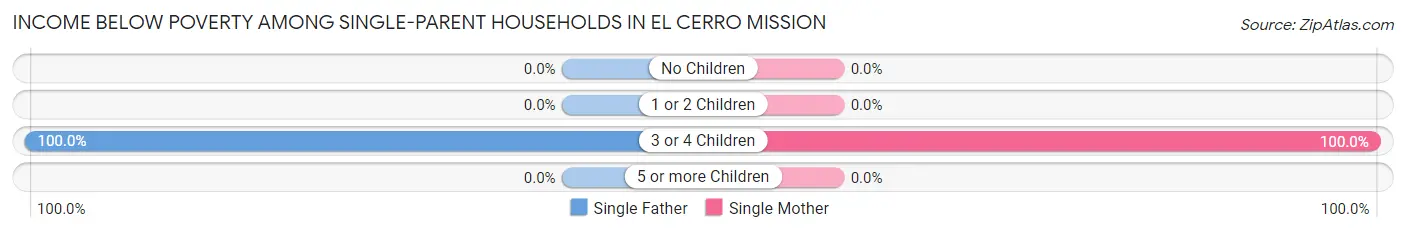
| Children | Single Father | Single Mother |
| No Children | 0 (0.0%) | 0 (0.0%) |
| 1 or 2 Children | 0 (0.0%) | 0 (0.0%) |
| 3 or 4 Children | 46 (100.0%) | 33 (100.0%) |
| 5 or more Children | 0 (0.0%) | 0 (0.0%) |
| Total | 46 (26.1%) | 33 (31.1%) |
Income Below Poverty Among Married-Couple vs Single-Parent Households in El Cerro Mission
The poverty data for El Cerro Mission shows that 194 of the married-couple family households (23.7%) and 79 of the single-parent households (28.0%) are living below the poverty level. Within the married-couple family households, those with 1 or 2 children have the highest poverty rate, with 72 households (39.8%) falling below the poverty line. Among the single-parent households, those with 3 or 4 children have the highest poverty rate, with 79 household (100.0%) living below poverty.
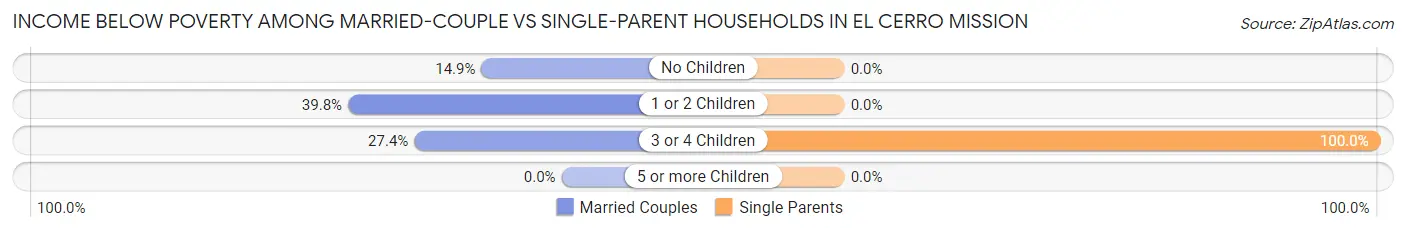
| Children | Married-Couple Families | Single-Parent Households |
| No Children | 63 (14.9%) | 0 (0.0%) |
| 1 or 2 Children | 72 (39.8%) | 0 (0.0%) |
| 3 or 4 Children | 59 (27.4%) | 79 (100.0%) |
| 5 or more Children | 0 (0.0%) | 0 (0.0%) |
| Total | 194 (23.7%) | 79 (28.0%) |
Race in El Cerro Mission
The most populous races in El Cerro Mission are Hispanic or Latino (4,114 | 82.3%), White / Caucasian (2,248 | 45.0%), and Two or more Races (2,025 | 40.5%).
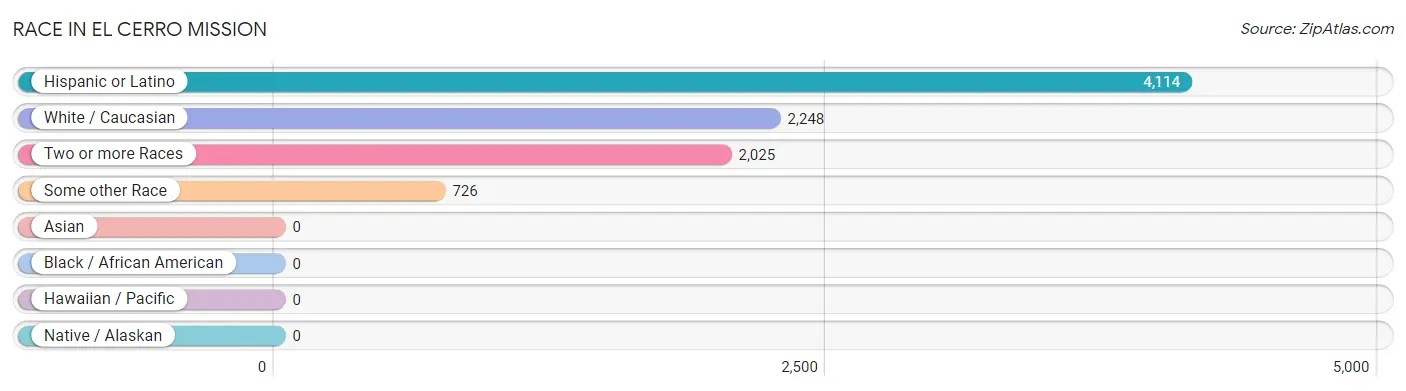
| Race | # Population | % Population |
| Asian | 0 | 0.0% |
| Black / African American | 0 | 0.0% |
| Hawaiian / Pacific | 0 | 0.0% |
| Hispanic or Latino | 4,114 | 82.3% |
| Native / Alaskan | 0 | 0.0% |
| White / Caucasian | 2,248 | 45.0% |
| Two or more Races | 2,025 | 40.5% |
| Some other Race | 726 | 14.5% |
| Total | 4,999 | 100.0% |
Ancestry in El Cerro Mission
The most populous ancestries reported in El Cerro Mission are Mexican (3,583 | 71.7%), Spanish (221 | 4.4%), German (186 | 3.7%), Irish (170 | 3.4%), and Spaniard (127 | 2.5%), together accounting for 85.8% of all El Cerro Mission residents.
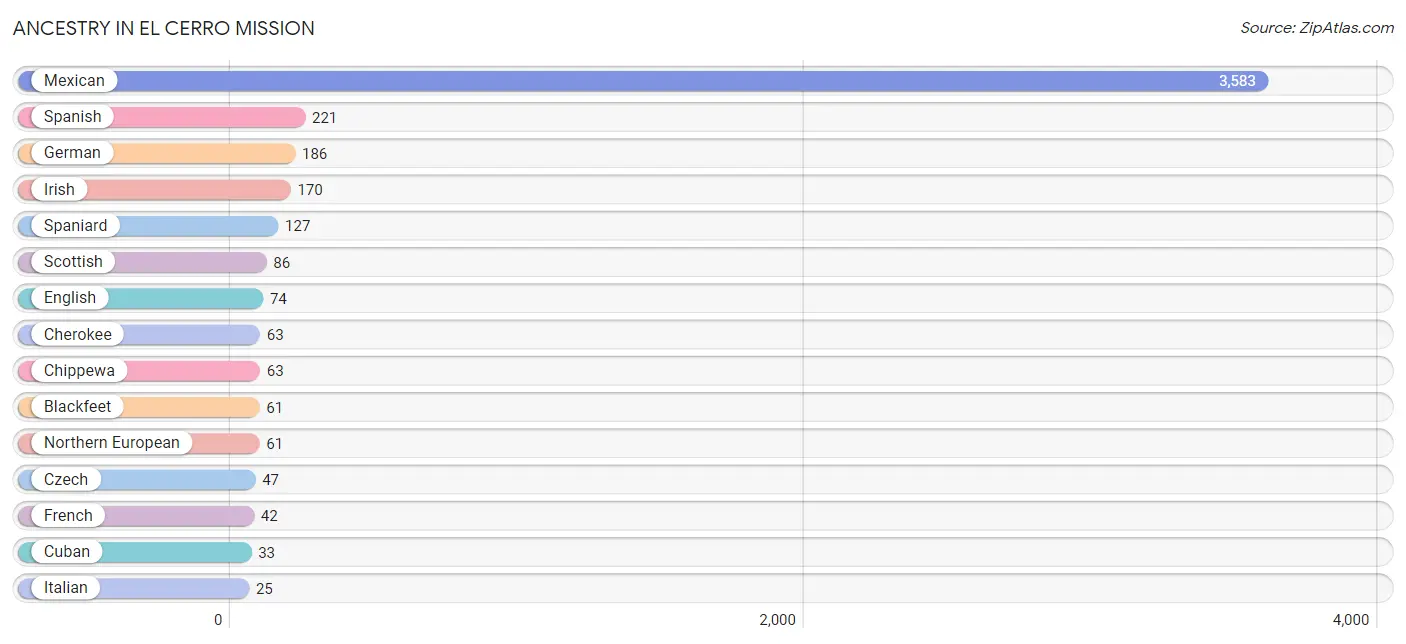
| Ancestry | # Population | % Population |
| Blackfeet | 61 | 1.2% |
| Cherokee | 63 | 1.3% |
| Chippewa | 63 | 1.3% |
| Cuban | 33 | 0.7% |
| Czech | 47 | 0.9% |
| Dutch West Indian | 19 | 0.4% |
| Eastern European | 14 | 0.3% |
| English | 74 | 1.5% |
| French | 42 | 0.8% |
| German | 186 | 3.7% |
| Irish | 170 | 3.4% |
| Italian | 25 | 0.5% |
| Mexican | 3,583 | 71.7% |
| Northern European | 61 | 1.2% |
| Polish | 14 | 0.3% |
| Russian | 14 | 0.3% |
| Scotch-Irish | 13 | 0.3% |
| Scottish | 86 | 1.7% |
| Spaniard | 127 | 2.5% |
| Spanish | 221 | 4.4% |
| Swedish | 13 | 0.3% | View All 21 Rows |
Immigrants in El Cerro Mission
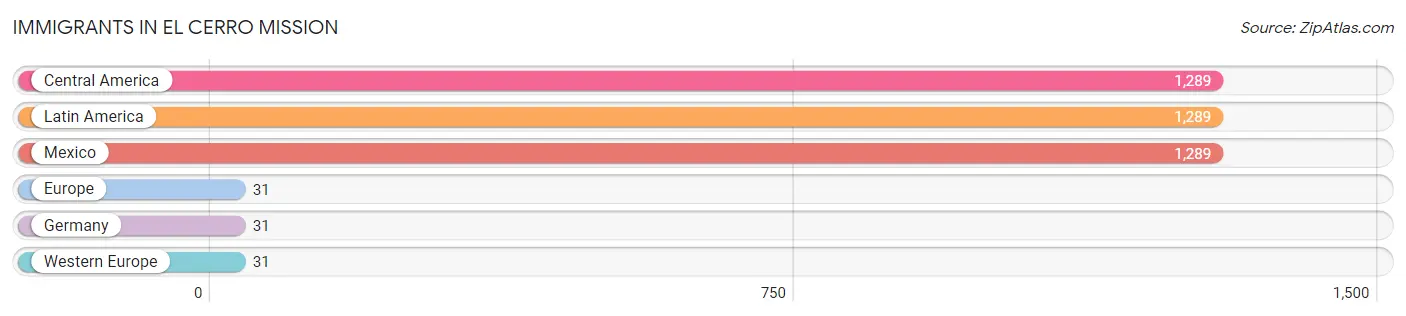
The most numerous immigrant groups reported in El Cerro Mission came from Central America (1,289 | 25.8%), Latin America (1,289 | 25.8%), Mexico (1,289 | 25.8%), Europe (31 | 0.6%), and Germany (31 | 0.6%), together accounting for 78.6% of all El Cerro Mission residents.
| Immigration Origin | # Population | % Population |
| Central America | 1,289 | 25.8% |
| Europe | 31 | 0.6% |
| Germany | 31 | 0.6% |
| Latin America | 1,289 | 25.8% |
| Mexico | 1,289 | 25.8% |
| Western Europe | 31 | 0.6% | View All 6 Rows |
Sex and Age in El Cerro Mission
Sex and Age in El Cerro Mission
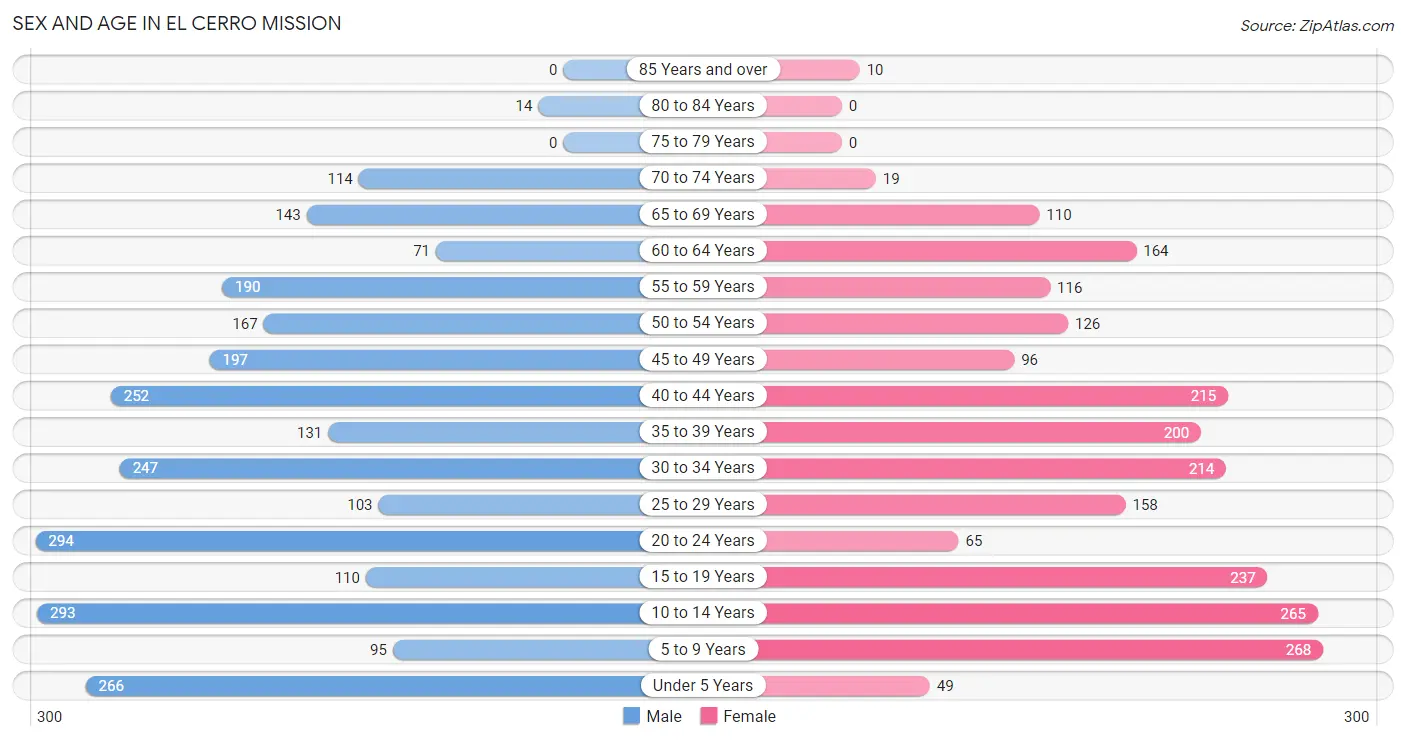
The most populous age groups in El Cerro Mission are 20 to 24 Years (294 | 10.9%) for men and 5 to 9 Years (268 | 11.6%) for women.
| Age Bracket | Male | Female |
| Under 5 Years | 266 (9.9%) | 49 (2.1%) |
| 5 to 9 Years | 95 (3.5%) | 268 (11.6%) |
| 10 to 14 Years | 293 (10.9%) | 265 (11.5%) |
| 15 to 19 Years | 110 (4.1%) | 237 (10.2%) |
| 20 to 24 Years | 294 (10.9%) | 65 (2.8%) |
| 25 to 29 Years | 103 (3.8%) | 158 (6.8%) |
| 30 to 34 Years | 247 (9.2%) | 214 (9.3%) |
| 35 to 39 Years | 131 (4.9%) | 200 (8.6%) |
| 40 to 44 Years | 252 (9.4%) | 215 (9.3%) |
| 45 to 49 Years | 197 (7.3%) | 96 (4.2%) |
| 50 to 54 Years | 167 (6.2%) | 126 (5.4%) |
| 55 to 59 Years | 190 (7.1%) | 116 (5.0%) |
| 60 to 64 Years | 71 (2.6%) | 164 (7.1%) |
| 65 to 69 Years | 143 (5.3%) | 110 (4.8%) |
| 70 to 74 Years | 114 (4.2%) | 19 (0.8%) |
| 75 to 79 Years | 0 (0.0%) | 0 (0.0%) |
| 80 to 84 Years | 14 (0.5%) | 0 (0.0%) |
| 85 Years and over | 0 (0.0%) | 10 (0.4%) |
| Total | 2,687 (100.0%) | 2,312 (100.0%) |
Families and Households in El Cerro Mission
Median Family Size in El Cerro Mission
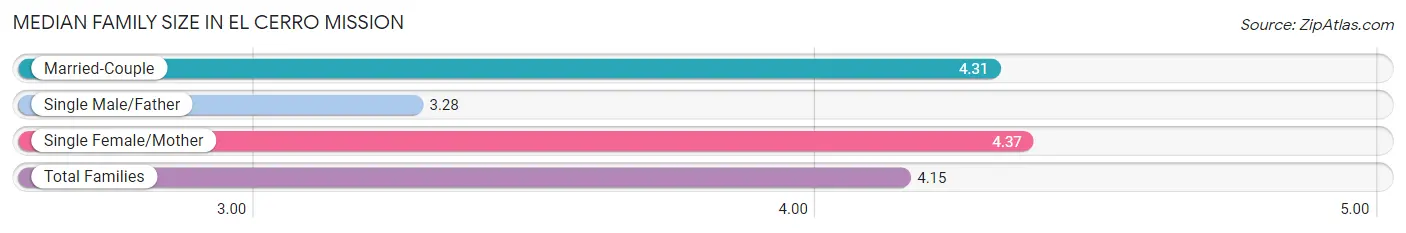
The median family size in El Cerro Mission is 4.15 persons per family, with single female/mother families (106 | 9.6%) accounting for the largest median family size of 4.37 persons per family. On the other hand, single male/father families (176 | 16.0%) represent the smallest median family size with 3.28 persons per family.
| Family Type | # Families | Family Size |
| Married-Couple | 818 (74.4%) | 4.31 |
| Single Male/Father | 176 (16.0%) | 3.28 |
| Single Female/Mother | 106 (9.6%) | 4.37 |
| Total Families | 1,100 (100.0%) | 4.15 |
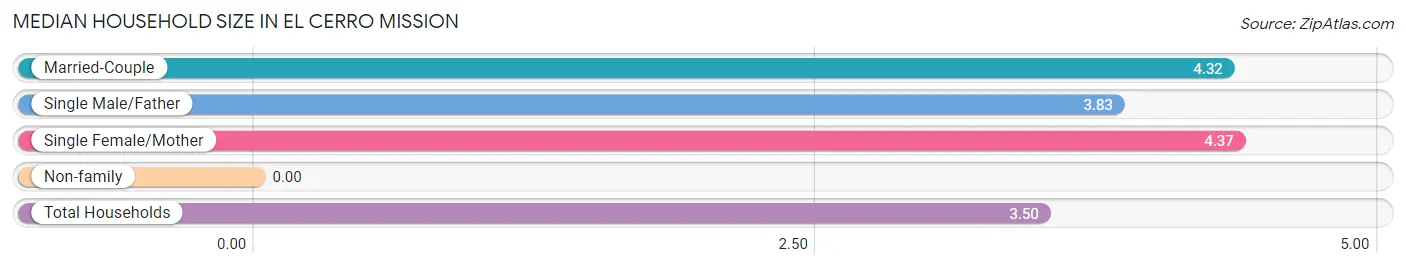
Median Household Size in El Cerro Mission
| Household Type | # Households | Household Size |
| Married-Couple | 818 (57.3%) | 4.32 |
| Single Male/Father | 176 (12.3%) | 3.83 |
| Single Female/Mother | 106 (7.4%) | 4.37 |
| Non-family | 327 (22.9%) | - |
| Total Households | 1,427 (100.0%) | 3.50 |
Household Size by Marriage Status in El Cerro Mission
Out of a total of 1,427 households in El Cerro Mission, 1,100 (77.1%) are family households, while 327 (22.9%) are nonfamily households. The most numerous type of family households are 2-person households, comprising 314, and the most common type of nonfamily households are 1-person households, comprising 327.
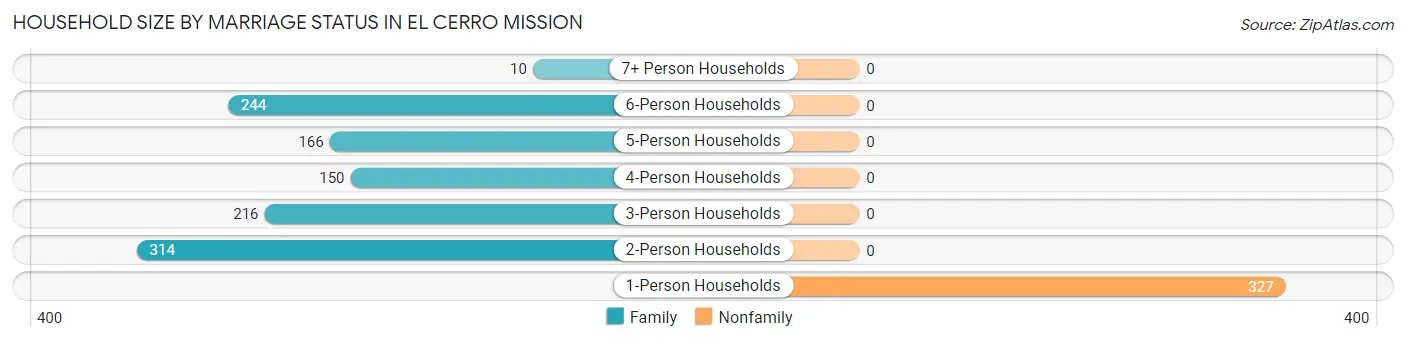
| Household Size | Family Households | Nonfamily Households |
| 1-Person Households | - | 327 (22.9%) |
| 2-Person Households | 314 (22.0%) | 0 (0.0%) |
| 3-Person Households | 216 (15.1%) | 0 (0.0%) |
| 4-Person Households | 150 (10.5%) | 0 (0.0%) |
| 5-Person Households | 166 (11.6%) | 0 (0.0%) |
| 6-Person Households | 244 (17.1%) | 0 (0.0%) |
| 7+ Person Households | 10 (0.7%) | 0 (0.0%) |
| Total | 1,100 (77.1%) | 327 (22.9%) |
Female Fertility in El Cerro Mission
Fertility by Age in El Cerro Mission
Average fertility rate in El Cerro Mission is 86.0 births per 1,000 women. Women in the age bracket of 35 to 50 years have the highest fertility rate with 115.0 births per 1,000 women. Women in the age bracket of 35 to 50 years acount for 59.6% of all women with births.
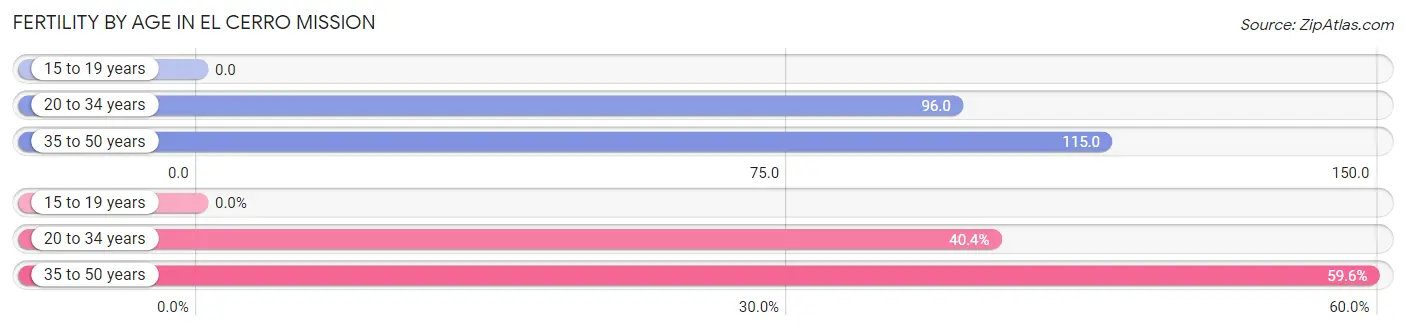
| Age Bracket | Women with Births | Births / 1,000 Women |
| 15 to 19 years | 0 (0.0%) | 0.0 |
| 20 to 34 years | 42 (40.4%) | 96.0 |
| 35 to 50 years | 62 (59.6%) | 115.0 |
| Total | 104 (100.0%) | 86.0 |
Fertility by Age by Marriage Status in El Cerro Mission
70.2% of women with births (104) in El Cerro Mission are married. The highest percentage of unmarried women with births falls into 20 to 34 years age bracket with 73.8% of them unmarried at the time of birth, while the lowest percentage of unmarried women with births belong to 35 to 50 years age bracket with 0.0% of them unmarried.
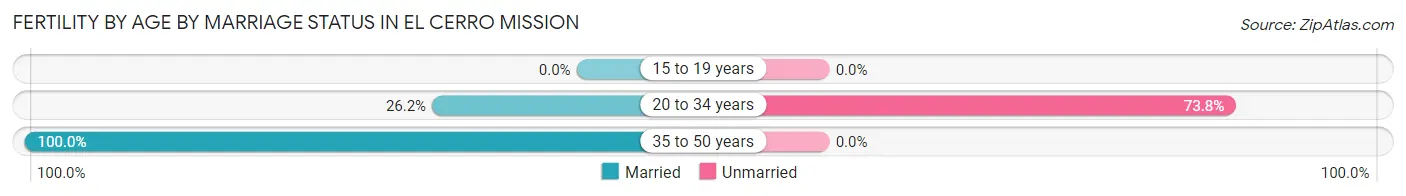
| Age Bracket | Married | Unmarried |
| 15 to 19 years | 0 (0.0%) | 0 (0.0%) |
| 20 to 34 years | 11 (26.2%) | 31 (73.8%) |
| 35 to 50 years | 62 (100.0%) | 0 (0.0%) |
| Total | 73 (70.2%) | 31 (29.8%) |
Fertility by Education in El Cerro Mission
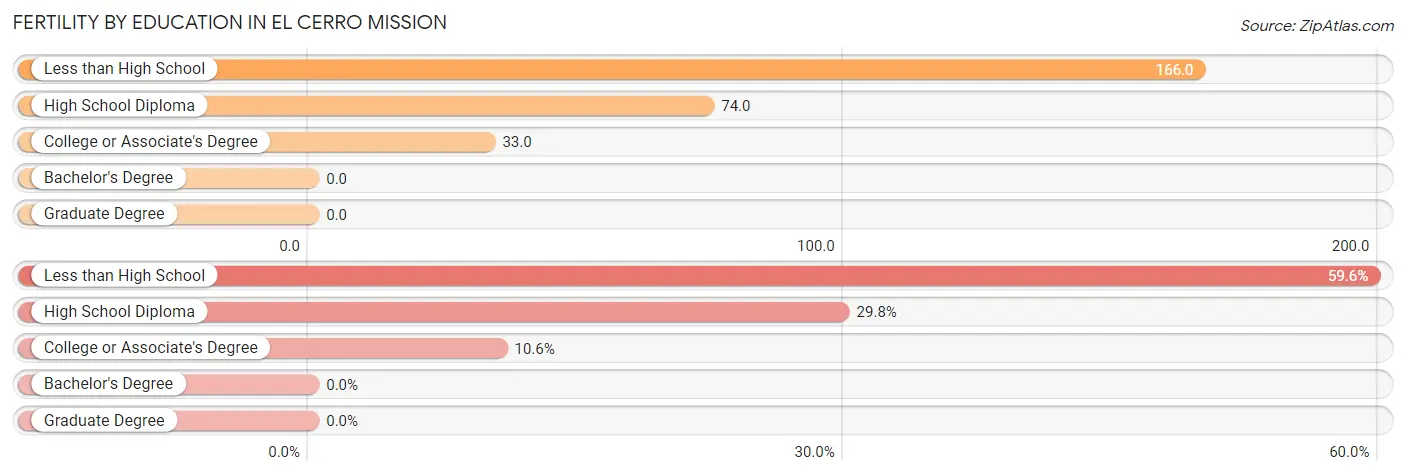
| Educational Attainment | Women with Births | Births / 1,000 Women |
| Less than High School | 62 (59.6%) | 166.0 |
| High School Diploma | 31 (29.8%) | 74.0 |
| College or Associate's Degree | 11 (10.6%) | 33.0 |
| Bachelor's Degree | 0 (0.0%) | 0.0 |
| Graduate Degree | 0 (0.0%) | 0.0 |
| Total | 104 (100.0%) | 86.0 |
Fertility by Education by Marriage Status in El Cerro Mission
29.8% of women with births in El Cerro Mission are unmarried. Women with the educational attainment of less than high school are most likely to be married with 100.0% of them married at childbirth, while women with the educational attainment of high school diploma are least likely to be married with 100.0% of them unmarried at childbirth.
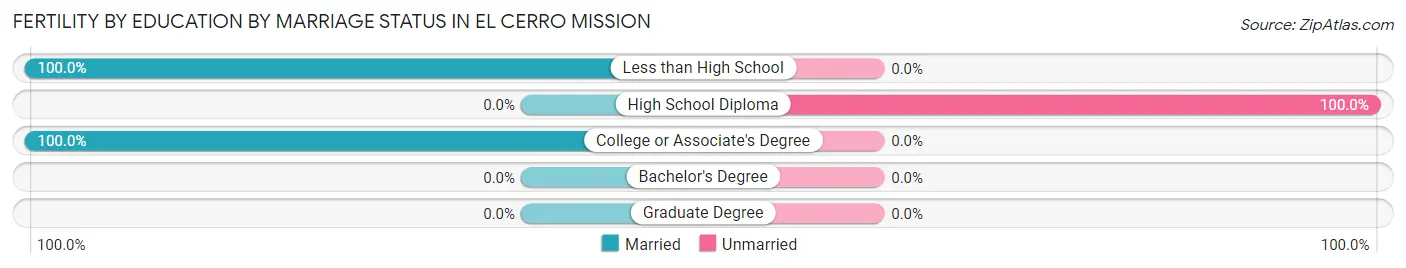
| Educational Attainment | Married | Unmarried |
| Less than High School | 62 (100.0%) | 0 (0.0%) |
| High School Diploma | 0 (0.0%) | 31 (100.0%) |
| College or Associate's Degree | 11 (100.0%) | 0 (0.0%) |
| Bachelor's Degree | 0 (0.0%) | 0 (0.0%) |
| Graduate Degree | 0 (0.0%) | 0 (0.0%) |
| Total | 73 (70.2%) | 31 (29.8%) |
Employment Characteristics in El Cerro Mission
Employment by Class of Employer in El Cerro Mission
Among the 1,710 employed individuals in El Cerro Mission, private company employees (1,367 | 79.9%), local government employees (109 | 6.4%), and not-for-profit organizations (89 | 5.2%) make up the most common classes of employment.
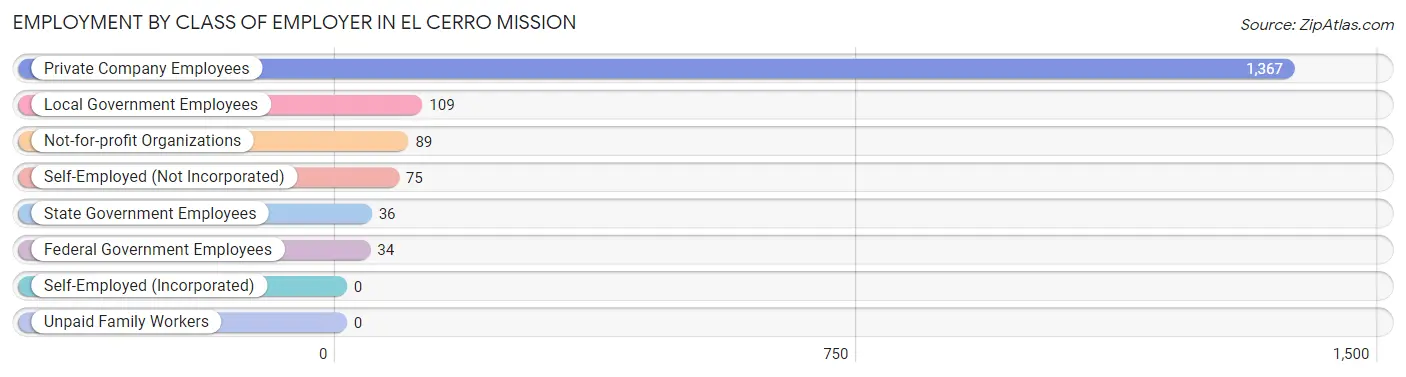
| Employer Class | # Employees | % Employees |
| Private Company Employees | 1,367 | 79.9% |
| Self-Employed (Incorporated) | 0 | 0.0% |
| Self-Employed (Not Incorporated) | 75 | 4.4% |
| Not-for-profit Organizations | 89 | 5.2% |
| Local Government Employees | 109 | 6.4% |
| State Government Employees | 36 | 2.1% |
| Federal Government Employees | 34 | 2.0% |
| Unpaid Family Workers | 0 | 0.0% |
| Total | 1,710 | 100.0% |
Employment Status by Age in El Cerro Mission
According to the labor force statistics for El Cerro Mission, out of the total population over 16 years of age (3,691), 56.5% or 2,085 individuals are in the labor force, with 15.9% or 332 of them unemployed. The age group with the highest labor force participation rate is 30 to 34 years, with 95.4% or 440 individuals in the labor force. Within the labor force, the 30 to 34 years age range has the highest percentage of unemployed individuals, with 42.0% or 185 of them being unemployed.
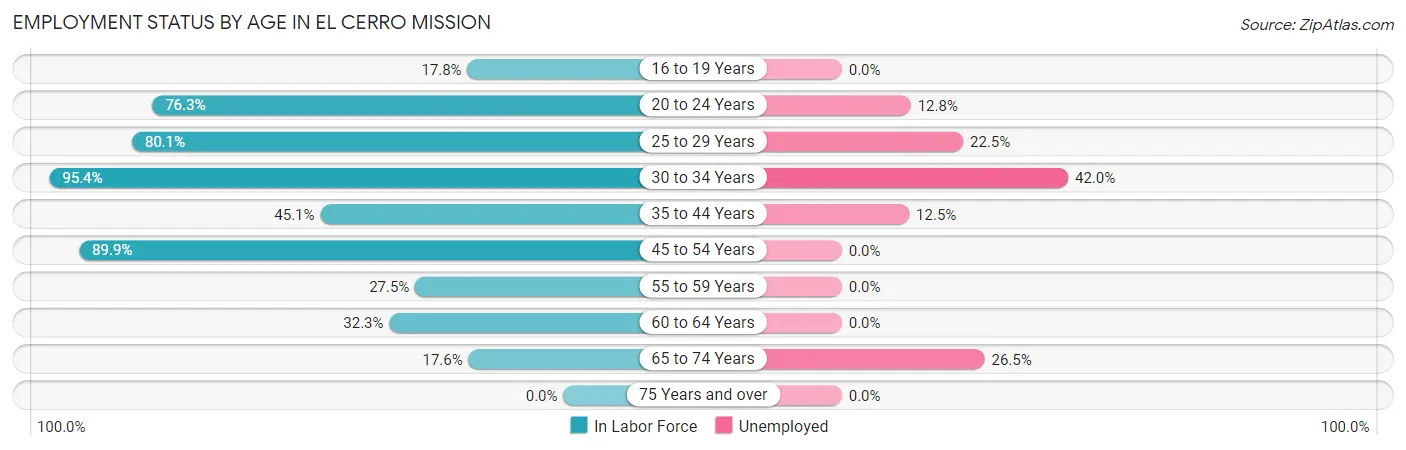
| Age Bracket | In Labor Force | Unemployed |
| 16 to 19 Years | 49 (17.8%) | 0 (0.0%) |
| 20 to 24 Years | 274 (76.3%) | 35 (12.8%) |
| 25 to 29 Years | 209 (80.1%) | 47 (22.5%) |
| 30 to 34 Years | 440 (95.4%) | 185 (42.0%) |
| 35 to 44 Years | 360 (45.1%) | 45 (12.5%) |
| 45 to 54 Years | 527 (89.9%) | 0 (0.0%) |
| 55 to 59 Years | 84 (27.5%) | 0 (0.0%) |
| 60 to 64 Years | 76 (32.3%) | 0 (0.0%) |
| 65 to 74 Years | 68 (17.6%) | 18 (26.5%) |
| 75 Years and over | 0 (0.0%) | 0 (0.0%) |
| Total | 2,085 (56.5%) | 332 (15.9%) |
Employment Status by Educational Attainment in El Cerro Mission
According to labor force statistics for El Cerro Mission, 64.1% of individuals (1,697) out of the total population between 25 and 64 years of age (2,647) are in the labor force, with 16.5% or 280 of them being unemployed. The group with the highest labor force participation rate are those with the educational attainment of college / associate degree, with 79.9% or 628 individuals in the labor force. Within the labor force, individuals with high school diploma education have the highest percentage of unemployment, with 43.7% or 190 of them being unemployed.
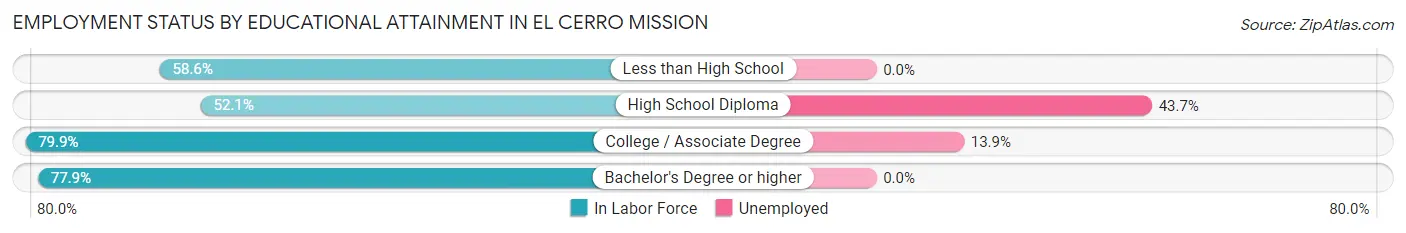
| Educational Attainment | In Labor Force | Unemployed |
| Less than High School | 506 (58.6%) | 0 (0.0%) |
| High School Diploma | 435 (52.1%) | 365 (43.7%) |
| College / Associate Degree | 628 (79.9%) | 109 (13.9%) |
| Bachelor's Degree or higher | 127 (77.9%) | 0 (0.0%) |
| Total | 1,697 (64.1%) | 437 (16.5%) |
Employment Occupations by Sex in El Cerro Mission
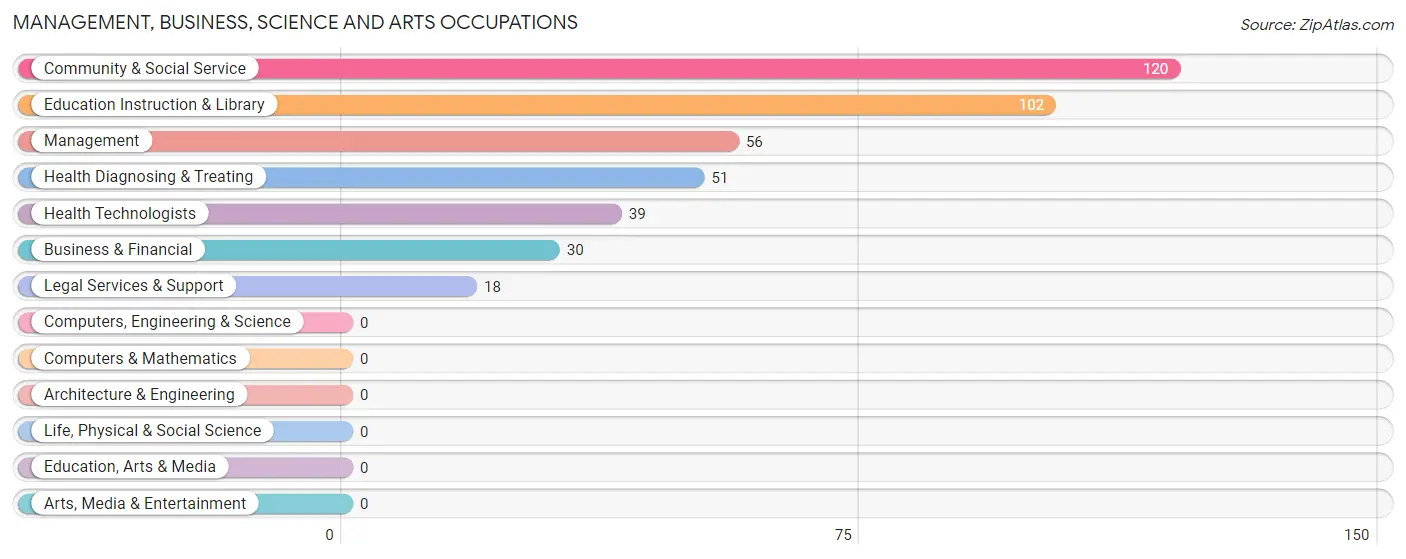
Management, Business, Science and Arts Occupations
The most common Management, Business, Science and Arts occupations in El Cerro Mission are Community & Social Service (120 | 6.9%), Education Instruction & Library (102 | 5.9%), Management (56 | 3.2%), Health Diagnosing & Treating (51 | 2.9%), and Health Technologists (39 | 2.2%).
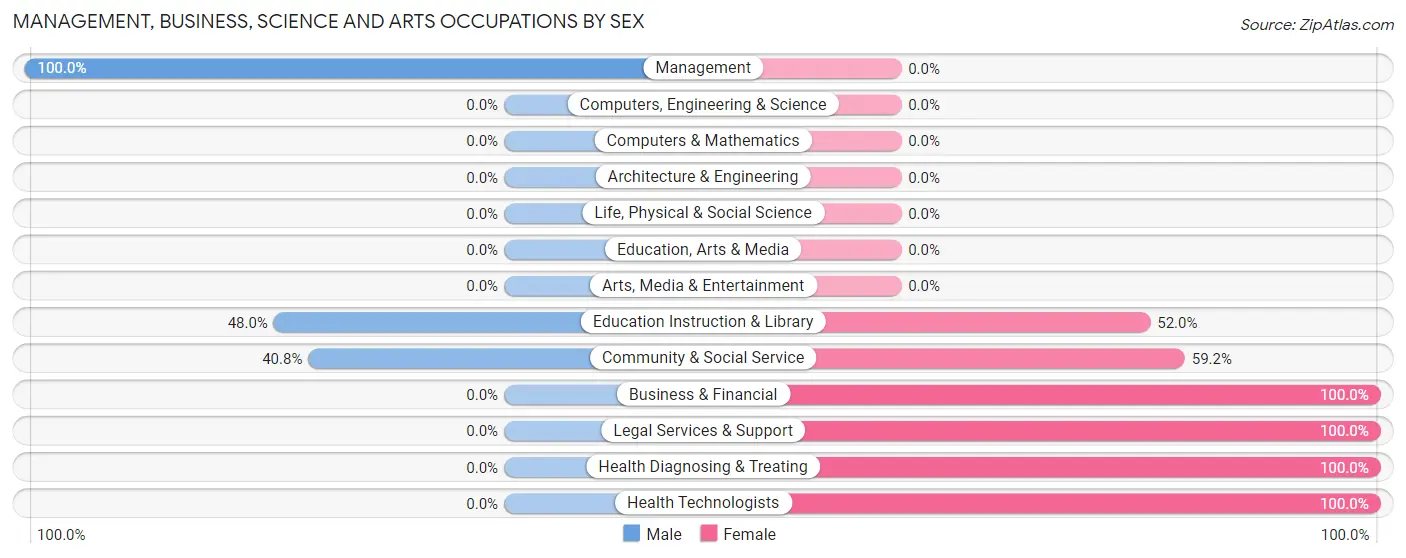
Management, Business, Science and Arts Occupations by Sex
Within the Management, Business, Science and Arts occupations in El Cerro Mission, the most male-oriented occupations are Management (100.0%), Education Instruction & Library (48.0%), and Community & Social Service (40.8%), while the most female-oriented occupations are Business & Financial (100.0%), Legal Services & Support (100.0%), and Health Diagnosing & Treating (100.0%).
| Occupation | Male | Female |
| Management | 56 (100.0%) | 0 (0.0%) |
| Business & Financial | 0 (0.0%) | 30 (100.0%) |
| Computers, Engineering & Science | 0 (0.0%) | 0 (0.0%) |
| Computers & Mathematics | 0 (0.0%) | 0 (0.0%) |
| Architecture & Engineering | 0 (0.0%) | 0 (0.0%) |
| Life, Physical & Social Science | 0 (0.0%) | 0 (0.0%) |
| Community & Social Service | 49 (40.8%) | 71 (59.2%) |
| Education, Arts & Media | 0 (0.0%) | 0 (0.0%) |
| Legal Services & Support | 0 (0.0%) | 18 (100.0%) |
| Education Instruction & Library | 49 (48.0%) | 53 (52.0%) |
| Arts, Media & Entertainment | 0 (0.0%) | 0 (0.0%) |
| Health Diagnosing & Treating | 0 (0.0%) | 51 (100.0%) |
| Health Technologists | 0 (0.0%) | 39 (100.0%) |
| Total (Category) | 105 (40.9%) | 152 (59.1%) |
| Total (Overall) | 1,065 (61.2%) | 675 (38.8%) |
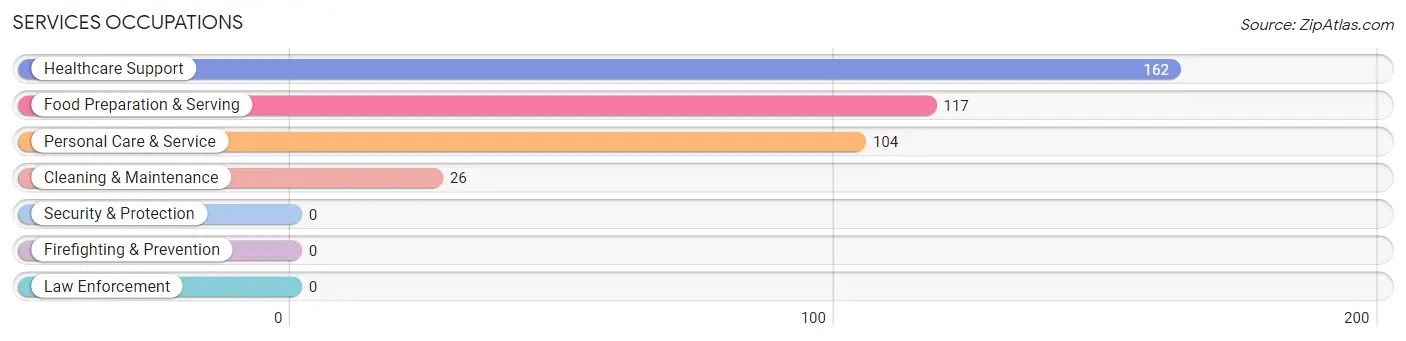
Services Occupations
The most common Services occupations in El Cerro Mission are Healthcare Support (162 | 9.3%), Food Preparation & Serving (117 | 6.7%), Personal Care & Service (104 | 6.0%), and Cleaning & Maintenance (26 | 1.5%).
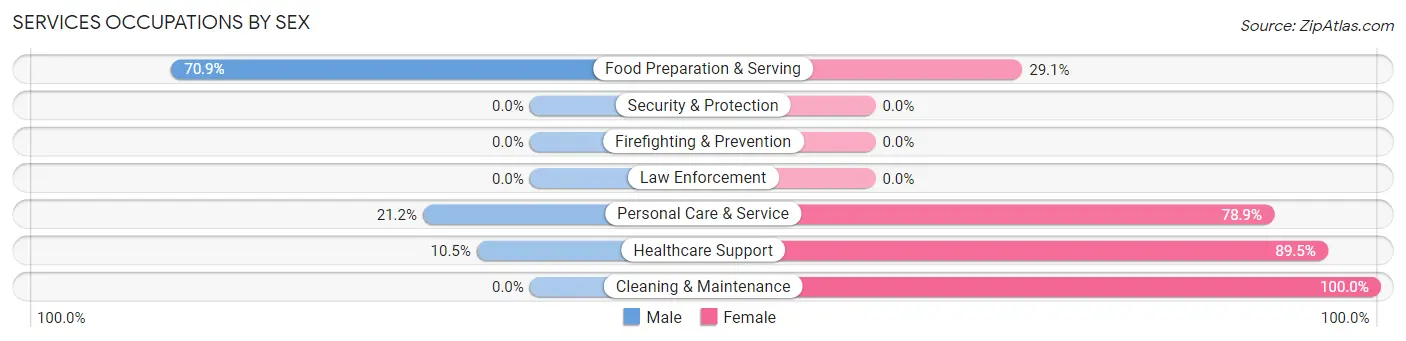
Services Occupations by Sex
Within the Services occupations in El Cerro Mission, the most male-oriented occupations are Food Preparation & Serving (70.9%), Personal Care & Service (21.1%), and Healthcare Support (10.5%), while the most female-oriented occupations are Cleaning & Maintenance (100.0%), Healthcare Support (89.5%), and Personal Care & Service (78.8%).
| Occupation | Male | Female |
| Healthcare Support | 17 (10.5%) | 145 (89.5%) |
| Security & Protection | 0 (0.0%) | 0 (0.0%) |
| Firefighting & Prevention | 0 (0.0%) | 0 (0.0%) |
| Law Enforcement | 0 (0.0%) | 0 (0.0%) |
| Food Preparation & Serving | 83 (70.9%) | 34 (29.1%) |
| Cleaning & Maintenance | 0 (0.0%) | 26 (100.0%) |
| Personal Care & Service | 22 (21.1%) | 82 (78.8%) |
| Total (Category) | 122 (29.8%) | 287 (70.2%) |
| Total (Overall) | 1,065 (61.2%) | 675 (38.8%) |
Sales and Office Occupations
The most common Sales and Office occupations in El Cerro Mission are Office & Administration (289 | 16.6%), and Sales & Related (159 | 9.1%).
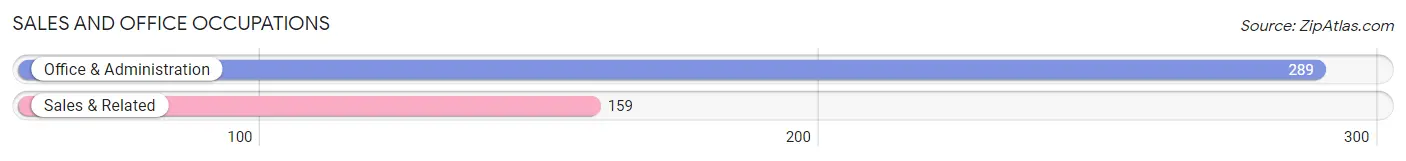
Sales and Office Occupations by Sex
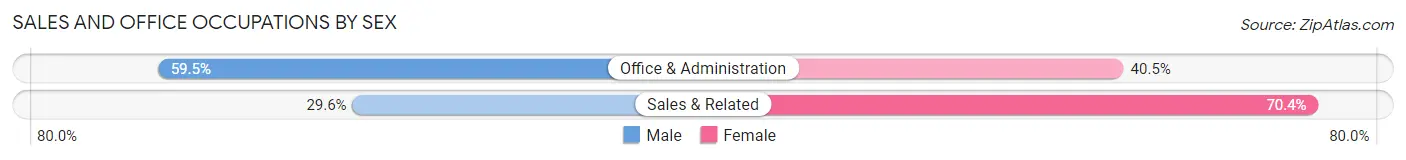
| Occupation | Male | Female |
| Sales & Related | 47 (29.6%) | 112 (70.4%) |
| Office & Administration | 172 (59.5%) | 117 (40.5%) |
| Total (Category) | 219 (48.9%) | 229 (51.1%) |
| Total (Overall) | 1,065 (61.2%) | 675 (38.8%) |
Natural Resources, Construction and Maintenance Occupations
The most common Natural Resources, Construction and Maintenance occupations in El Cerro Mission are Construction & Extraction (439 | 25.2%), and Installation, Maintenance & Repair (52 | 3.0%).
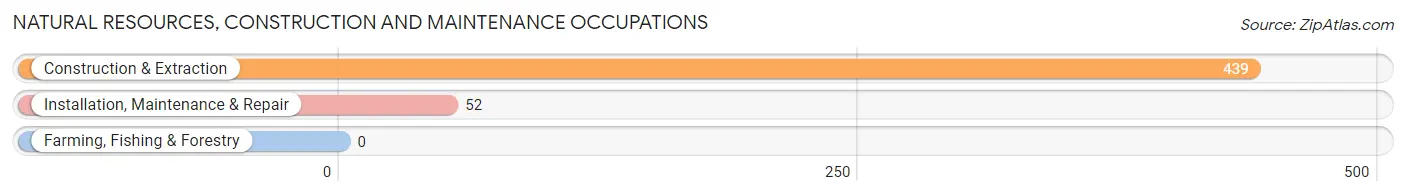
Natural Resources, Construction and Maintenance Occupations by Sex
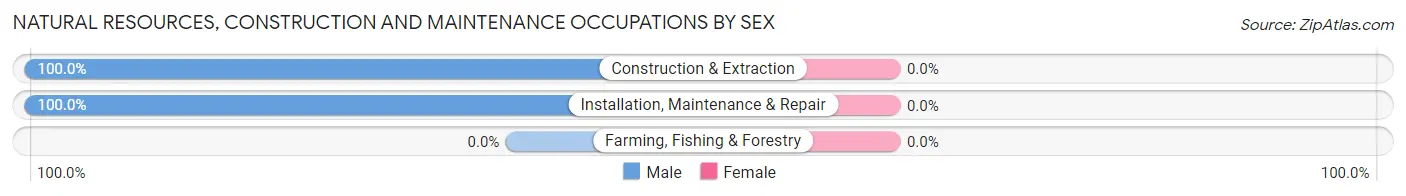
| Occupation | Male | Female |
| Farming, Fishing & Forestry | 0 (0.0%) | 0 (0.0%) |
| Construction & Extraction | 439 (100.0%) | 0 (0.0%) |
| Installation, Maintenance & Repair | 52 (100.0%) | 0 (0.0%) |
| Total (Category) | 491 (100.0%) | 0 (0.0%) |
| Total (Overall) | 1,065 (61.2%) | 675 (38.8%) |
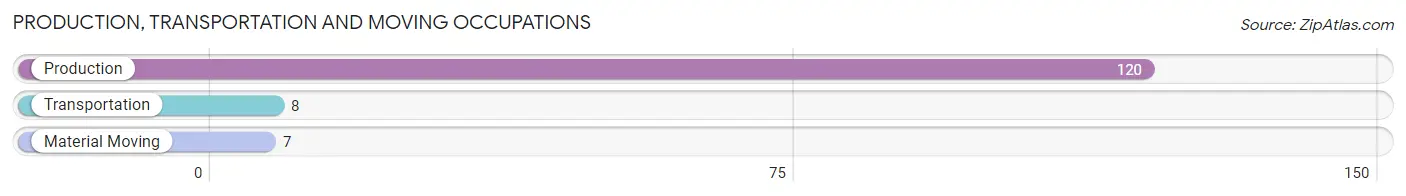
Production, Transportation and Moving Occupations
The most common Production, Transportation and Moving occupations in El Cerro Mission are Production (120 | 6.9%), Transportation (8 | 0.5%), and Material Moving (7 | 0.4%).
Production, Transportation and Moving Occupations by Sex
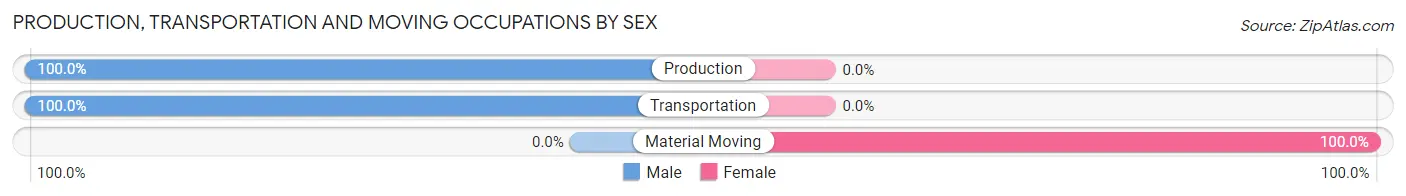
| Occupation | Male | Female |
| Production | 120 (100.0%) | 0 (0.0%) |
| Transportation | 8 (100.0%) | 0 (0.0%) |
| Material Moving | 0 (0.0%) | 7 (100.0%) |
| Total (Category) | 128 (94.8%) | 7 (5.2%) |
| Total (Overall) | 1,065 (61.2%) | 675 (38.8%) |
Employment Industries by Sex in El Cerro Mission
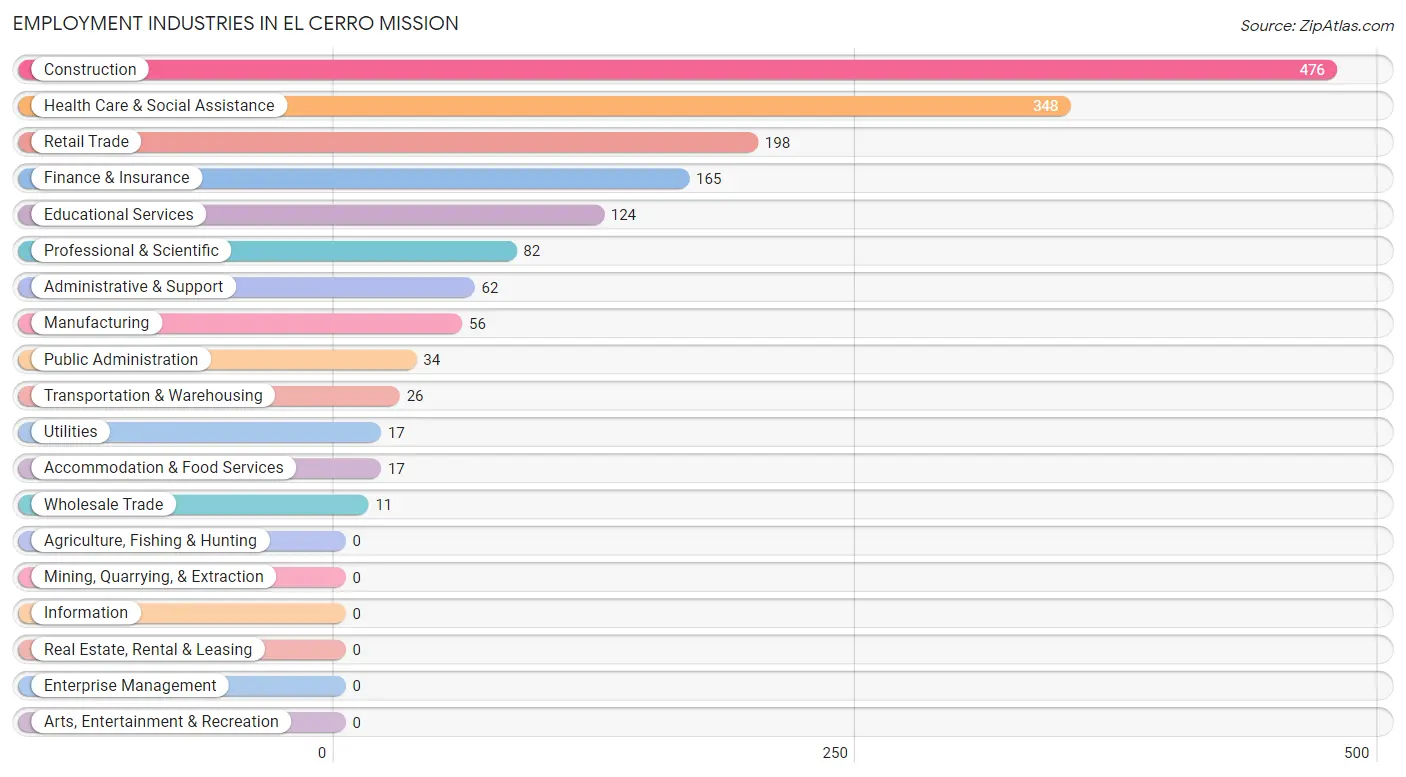
Employment Industries in El Cerro Mission
The major employment industries in El Cerro Mission include Construction (476 | 27.4%), Health Care & Social Assistance (348 | 20.0%), Retail Trade (198 | 11.4%), Finance & Insurance (165 | 9.5%), and Educational Services (124 | 7.1%).
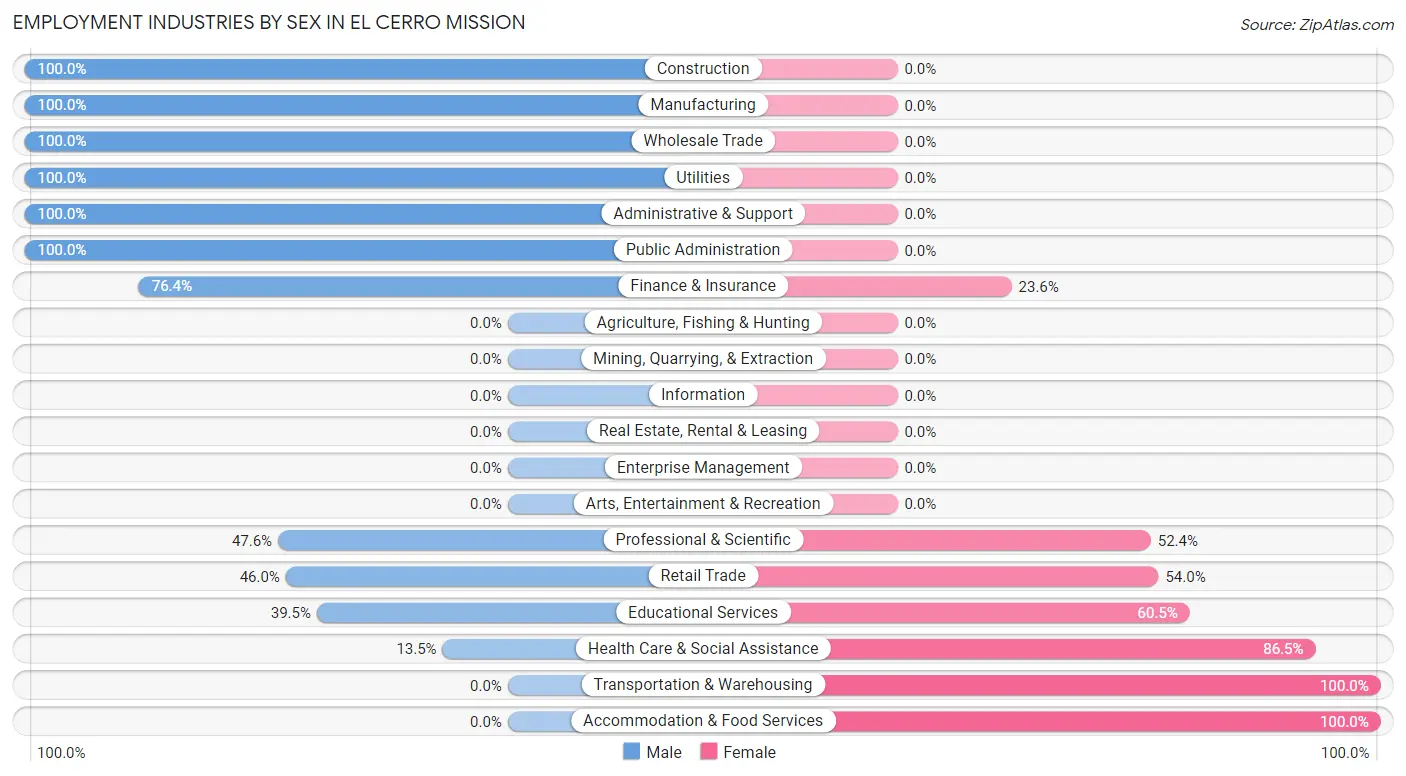
Employment Industries by Sex in El Cerro Mission
The El Cerro Mission industries that see more men than women are Construction (100.0%), Manufacturing (100.0%), and Wholesale Trade (100.0%), whereas the industries that tend to have a higher number of women are Transportation & Warehousing (100.0%), Accommodation & Food Services (100.0%), and Health Care & Social Assistance (86.5%).
| Industry | Male | Female |
| Agriculture, Fishing & Hunting | 0 (0.0%) | 0 (0.0%) |
| Mining, Quarrying, & Extraction | 0 (0.0%) | 0 (0.0%) |
| Construction | 476 (100.0%) | 0 (0.0%) |
| Manufacturing | 56 (100.0%) | 0 (0.0%) |
| Wholesale Trade | 11 (100.0%) | 0 (0.0%) |
| Retail Trade | 91 (46.0%) | 107 (54.0%) |
| Transportation & Warehousing | 0 (0.0%) | 26 (100.0%) |
| Utilities | 17 (100.0%) | 0 (0.0%) |
| Information | 0 (0.0%) | 0 (0.0%) |
| Finance & Insurance | 126 (76.4%) | 39 (23.6%) |
| Real Estate, Rental & Leasing | 0 (0.0%) | 0 (0.0%) |
| Professional & Scientific | 39 (47.6%) | 43 (52.4%) |
| Enterprise Management | 0 (0.0%) | 0 (0.0%) |
| Administrative & Support | 62 (100.0%) | 0 (0.0%) |
| Educational Services | 49 (39.5%) | 75 (60.5%) |
| Health Care & Social Assistance | 47 (13.5%) | 301 (86.5%) |
| Arts, Entertainment & Recreation | 0 (0.0%) | 0 (0.0%) |
| Accommodation & Food Services | 0 (0.0%) | 17 (100.0%) |
| Public Administration | 34 (100.0%) | 0 (0.0%) |
| Total | 1,065 (61.2%) | 675 (38.8%) |
Education in El Cerro Mission
School Enrollment in El Cerro Mission
The most common levels of schooling among the 1,397 students in El Cerro Mission are middle school (440 | 31.5%), high school (394 | 28.2%), and college / undergraduate (220 | 15.8%).
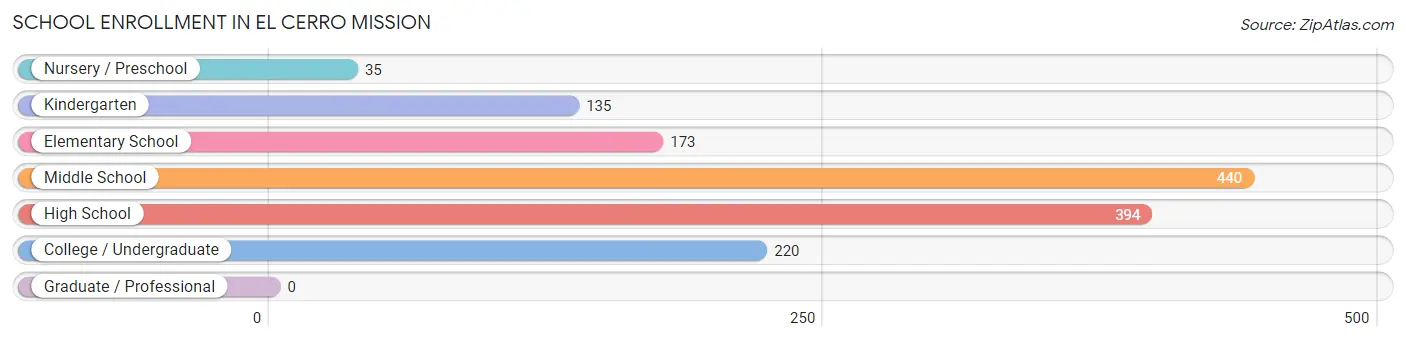
| School Level | # Students | % Students |
| Nursery / Preschool | 35 | 2.5% |
| Kindergarten | 135 | 9.7% |
| Elementary School | 173 | 12.4% |
| Middle School | 440 | 31.5% |
| High School | 394 | 28.2% |
| College / Undergraduate | 220 | 15.8% |
| Graduate / Professional | 0 | 0.0% |
| Total | 1,397 | 100.0% |
School Enrollment by Age by Funding Source in El Cerro Mission
Out of a total of 1,397 students who are enrolled in schools in El Cerro Mission, 122 (8.7%) attend a private institution, while the remaining 1,275 (91.3%) are enrolled in public schools. The age group of 15 to 17 year olds has the highest likelihood of being enrolled in private schools, with 77 (31.8% in the age bracket) enrolled. Conversely, the age group of 3 to 4 year olds has the lowest likelihood of being enrolled in a private school, with 35 (100.0% in the age bracket) attending a public institution.
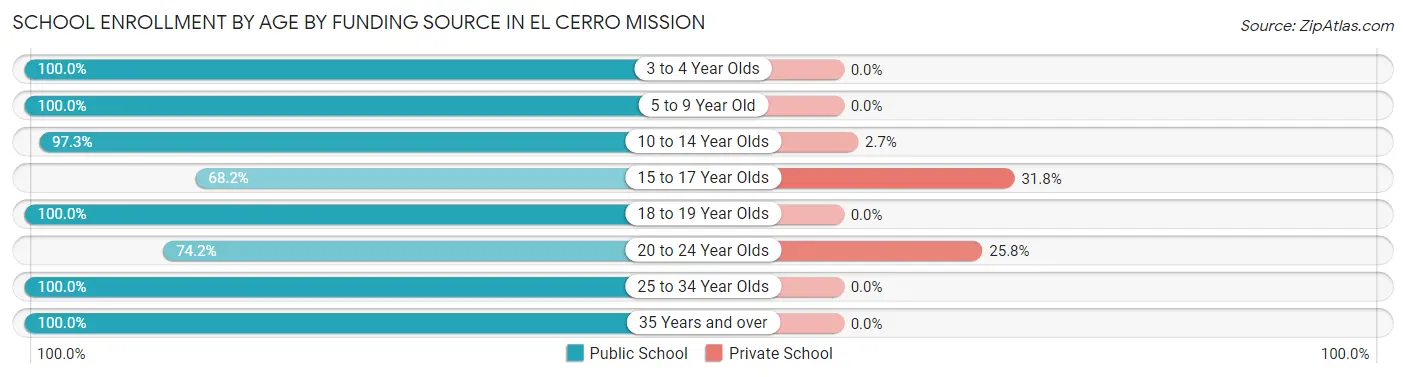
| Age Bracket | Public School | Private School |
| 3 to 4 Year Olds | 35 (100.0%) | 0 (0.0%) |
| 5 to 9 Year Old | 289 (100.0%) | 0 (0.0%) |
| 10 to 14 Year Olds | 507 (97.3%) | 14 (2.7%) |
| 15 to 17 Year Olds | 165 (68.2%) | 77 (31.8%) |
| 18 to 19 Year Olds | 89 (100.0%) | 0 (0.0%) |
| 20 to 24 Year Olds | 89 (74.2%) | 31 (25.8%) |
| 25 to 34 Year Olds | 79 (100.0%) | 0 (0.0%) |
| 35 Years and over | 22 (100.0%) | 0 (0.0%) |
| Total | 1,275 (91.3%) | 122 (8.7%) |
Educational Attainment by Field of Study in El Cerro Mission
Business (53 | 27.0%), social sciences (38 | 19.4%), education (32 | 16.3%), bio, nature & agricultural (26 | 13.3%), and psychology (20 | 10.2%) are the most common fields of study among 196 individuals in El Cerro Mission who have obtained a bachelor's degree or higher.
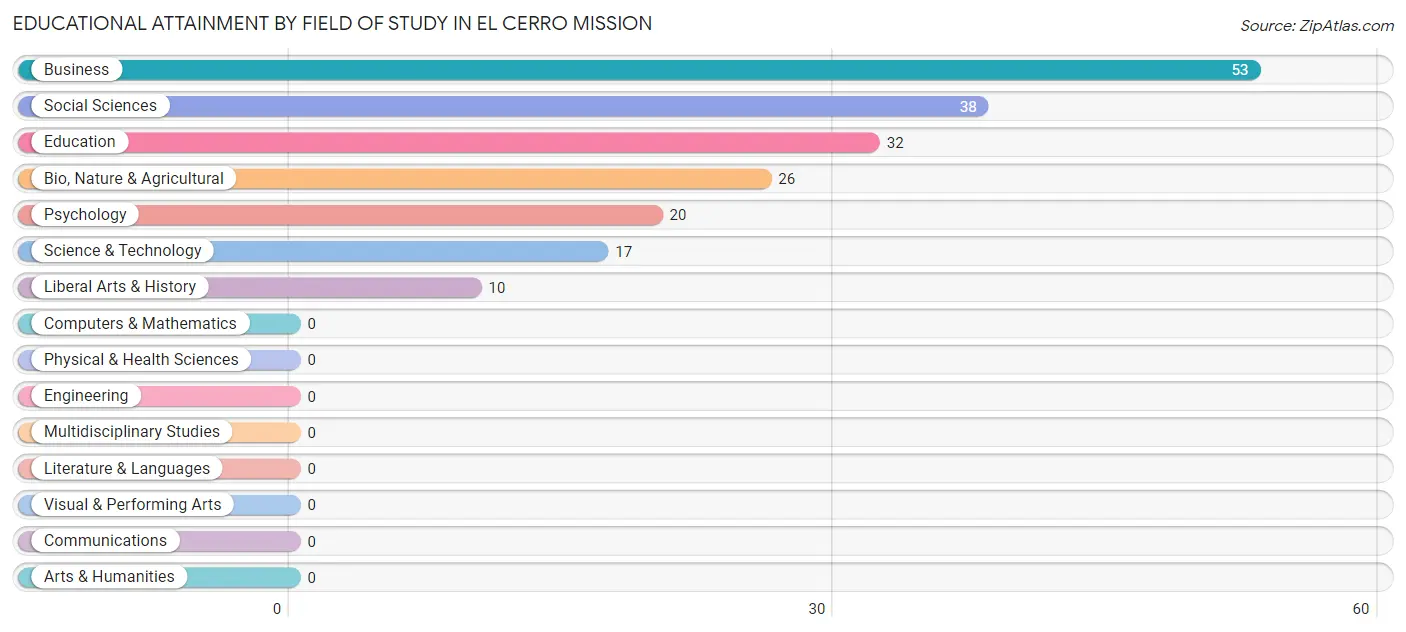
| Field of Study | # Graduates | % Graduates |
| Computers & Mathematics | 0 | 0.0% |
| Bio, Nature & Agricultural | 26 | 13.3% |
| Physical & Health Sciences | 0 | 0.0% |
| Psychology | 20 | 10.2% |
| Social Sciences | 38 | 19.4% |
| Engineering | 0 | 0.0% |
| Multidisciplinary Studies | 0 | 0.0% |
| Science & Technology | 17 | 8.7% |
| Business | 53 | 27.0% |
| Education | 32 | 16.3% |
| Literature & Languages | 0 | 0.0% |
| Liberal Arts & History | 10 | 5.1% |
| Visual & Performing Arts | 0 | 0.0% |
| Communications | 0 | 0.0% |
| Arts & Humanities | 0 | 0.0% |
| Total | 196 | 100.0% |
Transportation & Commute in El Cerro Mission
Vehicle Availability by Sex in El Cerro Mission
The most prevalent vehicle ownership categories in El Cerro Mission are males with 3 vehicles (463, accounting for 43.3%) and females with 3 vehicles (182, making up 72.1%).
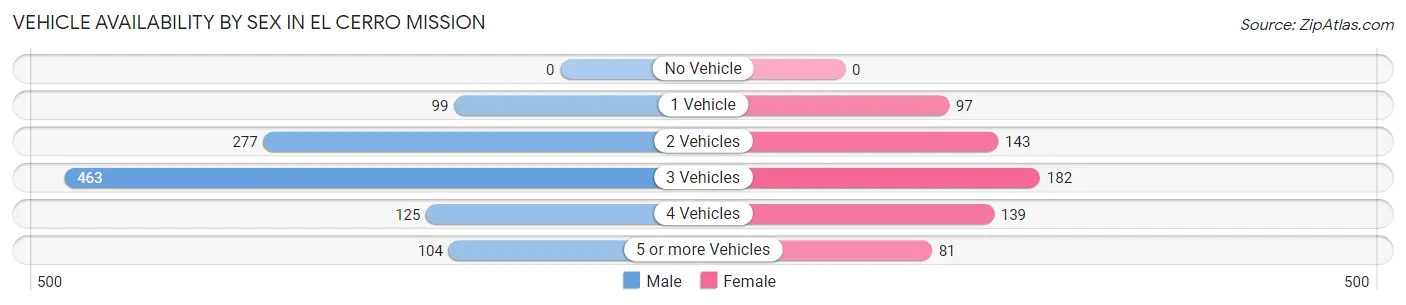
| Vehicles Available | Male | Female |
| No Vehicle | 0 (0.0%) | 0 (0.0%) |
| 1 Vehicle | 99 (9.3%) | 97 (15.1%) |
| 2 Vehicles | 277 (25.9%) | 143 (22.3%) |
| 3 Vehicles | 463 (43.3%) | 182 (28.3%) |
| 4 Vehicles | 125 (11.7%) | 139 (21.6%) |
| 5 or more Vehicles | 104 (9.7%) | 81 (12.6%) |
| Total | 1,068 (100.0%) | 642 (100.0%) |
Commute Time in El Cerro Mission
The most frequently occuring commute durations in El Cerro Mission are 45 to 59 minutes (387 commuters, 24.3%), 60 to 89 minutes (325 commuters, 20.4%), and 30 to 34 minutes (239 commuters, 15.0%).
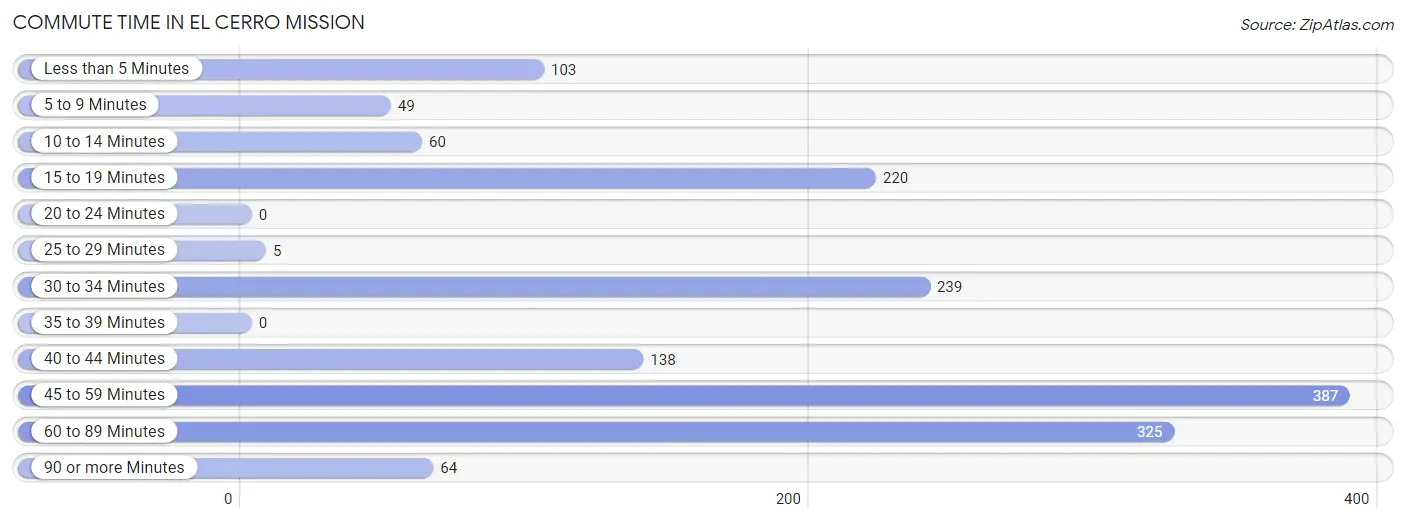
| Commute Time | # Commuters | % Commuters |
| Less than 5 Minutes | 103 | 6.5% |
| 5 to 9 Minutes | 49 | 3.1% |
| 10 to 14 Minutes | 60 | 3.8% |
| 15 to 19 Minutes | 220 | 13.8% |
| 20 to 24 Minutes | 0 | 0.0% |
| 25 to 29 Minutes | 5 | 0.3% |
| 30 to 34 Minutes | 239 | 15.0% |
| 35 to 39 Minutes | 0 | 0.0% |
| 40 to 44 Minutes | 138 | 8.7% |
| 45 to 59 Minutes | 387 | 24.3% |
| 60 to 89 Minutes | 325 | 20.4% |
| 90 or more Minutes | 64 | 4.0% |
Commute Time by Sex in El Cerro Mission
The most common commute times in El Cerro Mission are 45 to 59 minutes (267 commuters, 26.3%) for males and 15 to 19 minutes (127 commuters, 22.1%) for females.
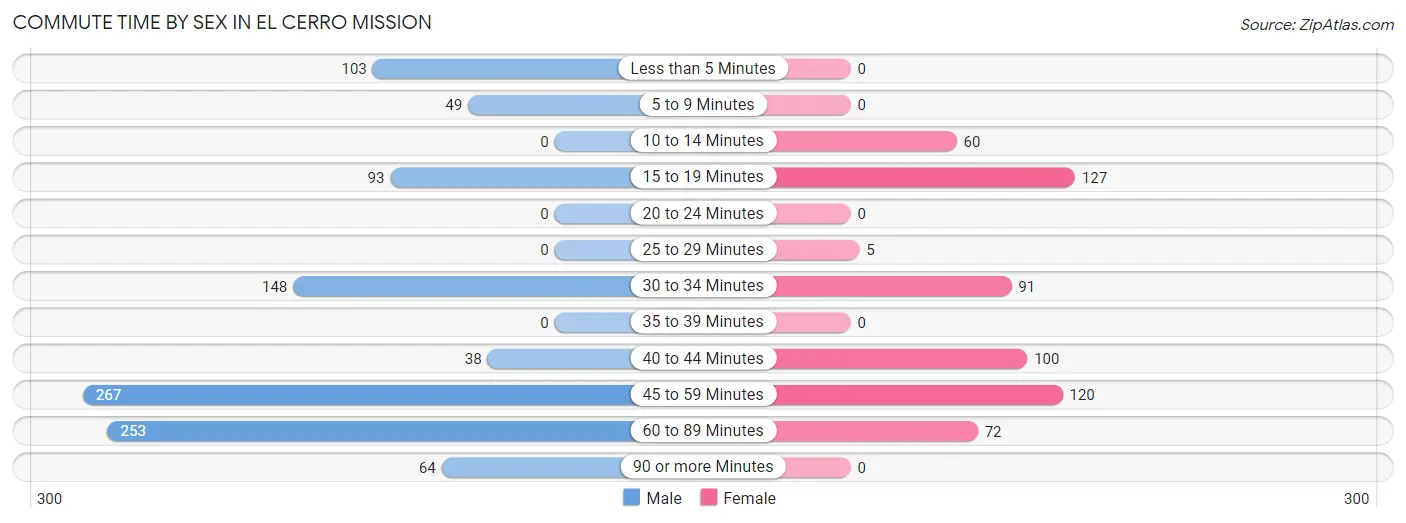
| Commute Time | Male | Female |
| Less than 5 Minutes | 103 (10.2%) | 0 (0.0%) |
| 5 to 9 Minutes | 49 (4.8%) | 0 (0.0%) |
| 10 to 14 Minutes | 0 (0.0%) | 60 (10.4%) |
| 15 to 19 Minutes | 93 (9.2%) | 127 (22.1%) |
| 20 to 24 Minutes | 0 (0.0%) | 0 (0.0%) |
| 25 to 29 Minutes | 0 (0.0%) | 5 (0.9%) |
| 30 to 34 Minutes | 148 (14.6%) | 91 (15.8%) |
| 35 to 39 Minutes | 0 (0.0%) | 0 (0.0%) |
| 40 to 44 Minutes | 38 (3.7%) | 100 (17.4%) |
| 45 to 59 Minutes | 267 (26.3%) | 120 (20.9%) |
| 60 to 89 Minutes | 253 (24.9%) | 72 (12.5%) |
| 90 or more Minutes | 64 (6.3%) | 0 (0.0%) |
Time of Departure to Work by Sex in El Cerro Mission
The most frequent times of departure to work in El Cerro Mission are 5:00 AM to 5:29 AM (339, 33.4%) for males and 6:30 AM to 6:59 AM (132, 23.0%) for females.
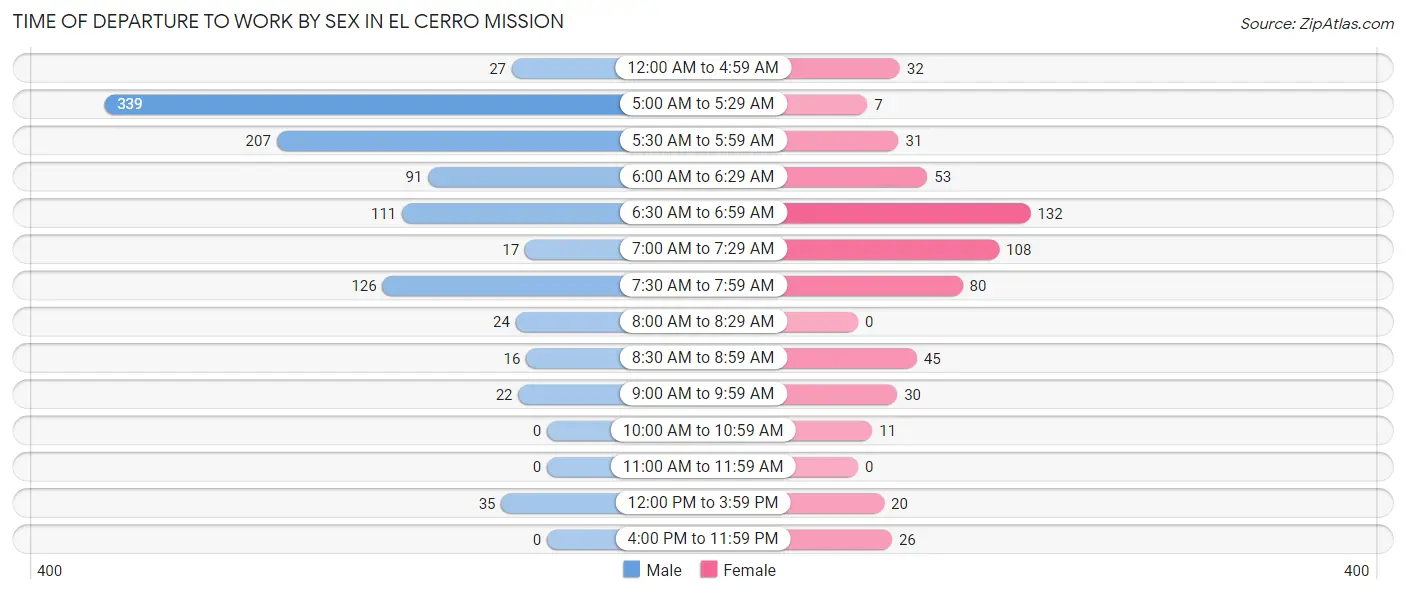
| Time of Departure | Male | Female |
| 12:00 AM to 4:59 AM | 27 (2.7%) | 32 (5.6%) |
| 5:00 AM to 5:29 AM | 339 (33.4%) | 7 (1.2%) |
| 5:30 AM to 5:59 AM | 207 (20.4%) | 31 (5.4%) |
| 6:00 AM to 6:29 AM | 91 (9.0%) | 53 (9.2%) |
| 6:30 AM to 6:59 AM | 111 (10.9%) | 132 (23.0%) |
| 7:00 AM to 7:29 AM | 17 (1.7%) | 108 (18.8%) |
| 7:30 AM to 7:59 AM | 126 (12.4%) | 80 (13.9%) |
| 8:00 AM to 8:29 AM | 24 (2.4%) | 0 (0.0%) |
| 8:30 AM to 8:59 AM | 16 (1.6%) | 45 (7.8%) |
| 9:00 AM to 9:59 AM | 22 (2.2%) | 30 (5.2%) |
| 10:00 AM to 10:59 AM | 0 (0.0%) | 11 (1.9%) |
| 11:00 AM to 11:59 AM | 0 (0.0%) | 0 (0.0%) |
| 12:00 PM to 3:59 PM | 35 (3.5%) | 20 (3.5%) |
| 4:00 PM to 11:59 PM | 0 (0.0%) | 26 (4.5%) |
| Total | 1,015 (100.0%) | 575 (100.0%) |
Housing Occupancy in El Cerro Mission
Occupancy by Ownership in El Cerro Mission
Of the total 1,427 dwellings in El Cerro Mission, owner-occupied units account for 1,252 (87.7%), while renter-occupied units make up 175 (12.3%).
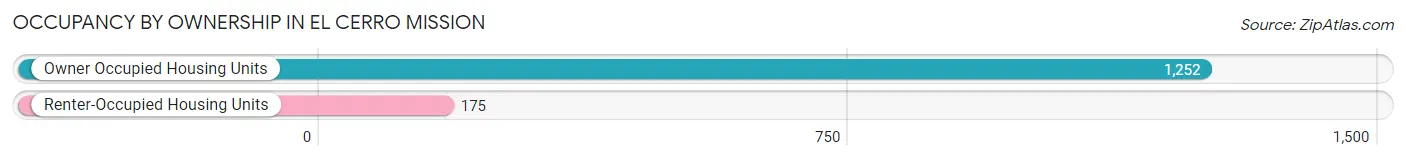
| Occupancy | # Housing Units | % Housing Units |
| Owner Occupied Housing Units | 1,252 | 87.7% |
| Renter-Occupied Housing Units | 175 | 12.3% |
| Total Occupied Housing Units | 1,427 | 100.0% |
Occupancy by Household Size in El Cerro Mission
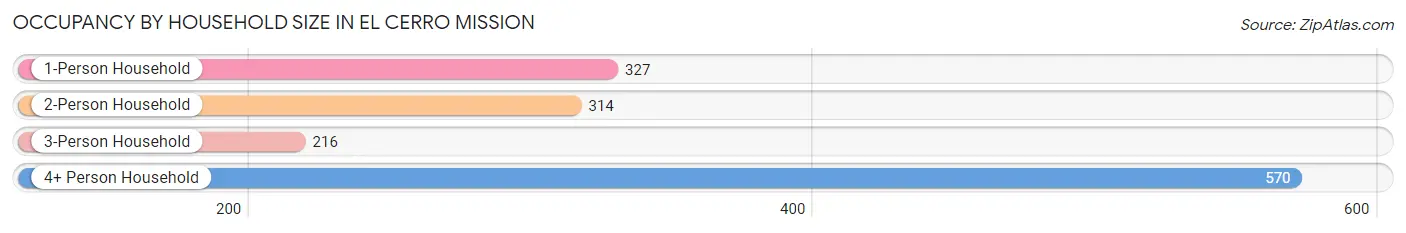
| Household Size | # Housing Units | % Housing Units |
| 1-Person Household | 327 | 22.9% |
| 2-Person Household | 314 | 22.0% |
| 3-Person Household | 216 | 15.1% |
| 4+ Person Household | 570 | 39.9% |
| Total Housing Units | 1,427 | 100.0% |
Occupancy by Ownership by Household Size in El Cerro Mission
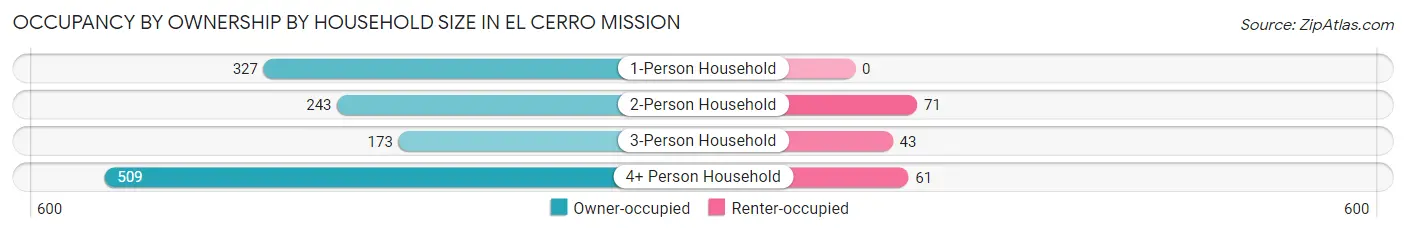
| Household Size | Owner-occupied | Renter-occupied |
| 1-Person Household | 327 (100.0%) | 0 (0.0%) |
| 2-Person Household | 243 (77.4%) | 71 (22.6%) |
| 3-Person Household | 173 (80.1%) | 43 (19.9%) |
| 4+ Person Household | 509 (89.3%) | 61 (10.7%) |
| Total Housing Units | 1,252 (87.7%) | 175 (12.3%) |
Occupancy by Educational Attainment in El Cerro Mission
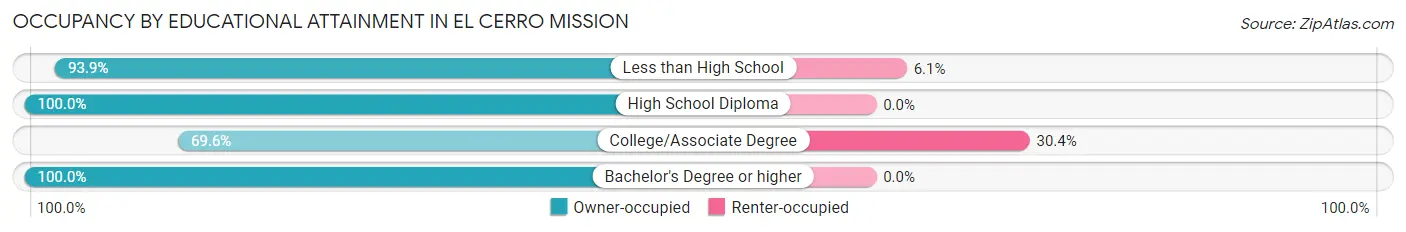
| Household Size | Owner-occupied | Renter-occupied |
| Less than High School | 620 (93.9%) | 40 (6.1%) |
| High School Diploma | 237 (100.0%) | 0 (0.0%) |
| College/Associate Degree | 309 (69.6%) | 135 (30.4%) |
| Bachelor's Degree or higher | 86 (100.0%) | 0 (0.0%) |
Occupancy by Age of Householder in El Cerro Mission
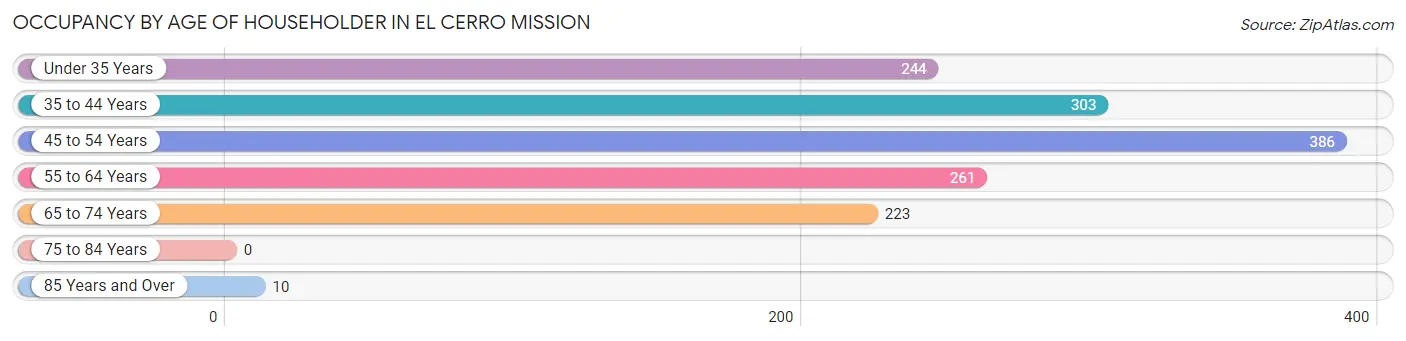
| Age Bracket | # Households | % Households |
| Under 35 Years | 244 | 17.1% |
| 35 to 44 Years | 303 | 21.2% |
| 45 to 54 Years | 386 | 27.1% |
| 55 to 64 Years | 261 | 18.3% |
| 65 to 74 Years | 223 | 15.6% |
| 75 to 84 Years | 0 | 0.0% |
| 85 Years and Over | 10 | 0.7% |
| Total | 1,427 | 100.0% |
Housing Finances in El Cerro Mission
Median Income by Occupancy in El Cerro Mission
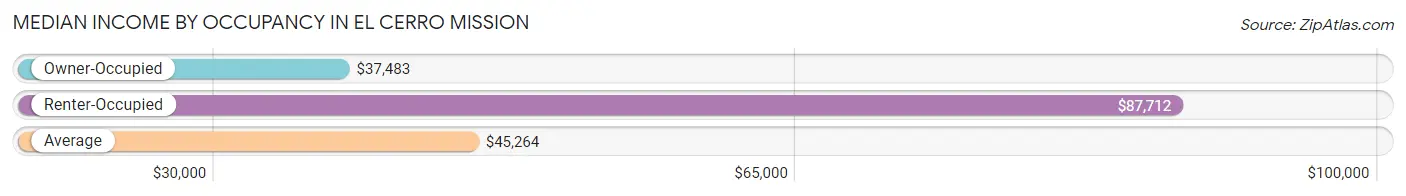
| Occupancy Type | # Households | Median Income |
| Owner-Occupied | 1,252 (87.7%) | $37,483 |
| Renter-Occupied | 175 (12.3%) | $87,712 |
| Average | 1,427 (100.0%) | $45,264 |
Occupancy by Householder Income Bracket in El Cerro Mission
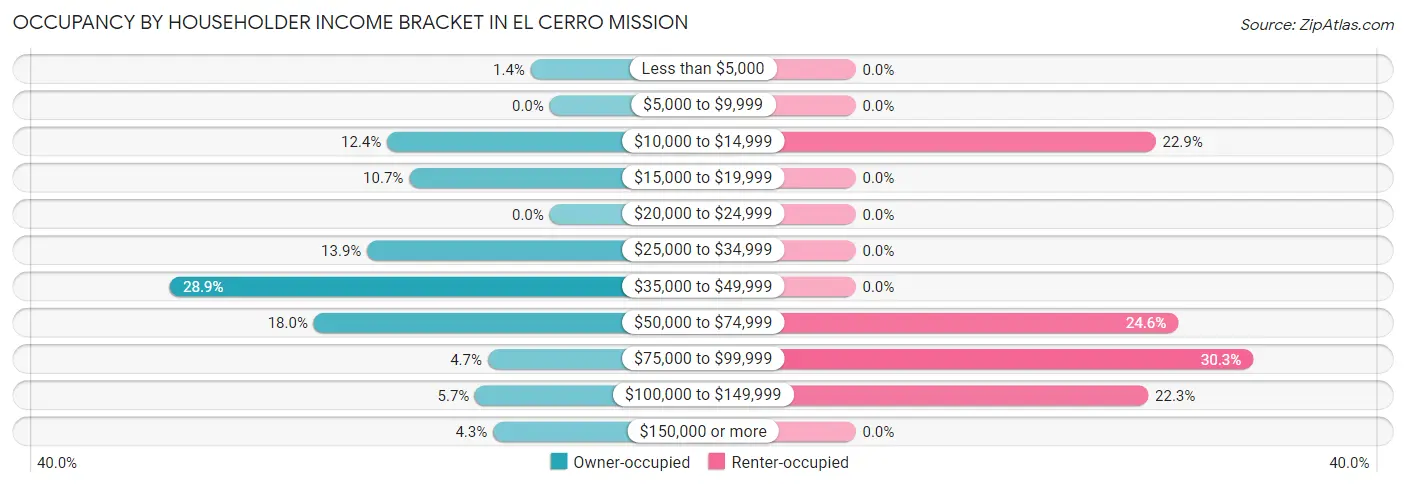
| Income Bracket | Owner-occupied | Renter-occupied |
| Less than $5,000 | 18 (1.4%) | 0 (0.0%) |
| $5,000 to $9,999 | 0 (0.0%) | 0 (0.0%) |
| $10,000 to $14,999 | 155 (12.4%) | 40 (22.9%) |
| $15,000 to $19,999 | 134 (10.7%) | 0 (0.0%) |
| $20,000 to $24,999 | 0 (0.0%) | 0 (0.0%) |
| $25,000 to $34,999 | 174 (13.9%) | 0 (0.0%) |
| $35,000 to $49,999 | 362 (28.9%) | 0 (0.0%) |
| $50,000 to $74,999 | 225 (18.0%) | 43 (24.6%) |
| $75,000 to $99,999 | 59 (4.7%) | 53 (30.3%) |
| $100,000 to $149,999 | 71 (5.7%) | 39 (22.3%) |
| $150,000 or more | 54 (4.3%) | 0 (0.0%) |
| Total | 1,252 (100.0%) | 175 (100.0%) |
Monthly Housing Cost Tiers in El Cerro Mission
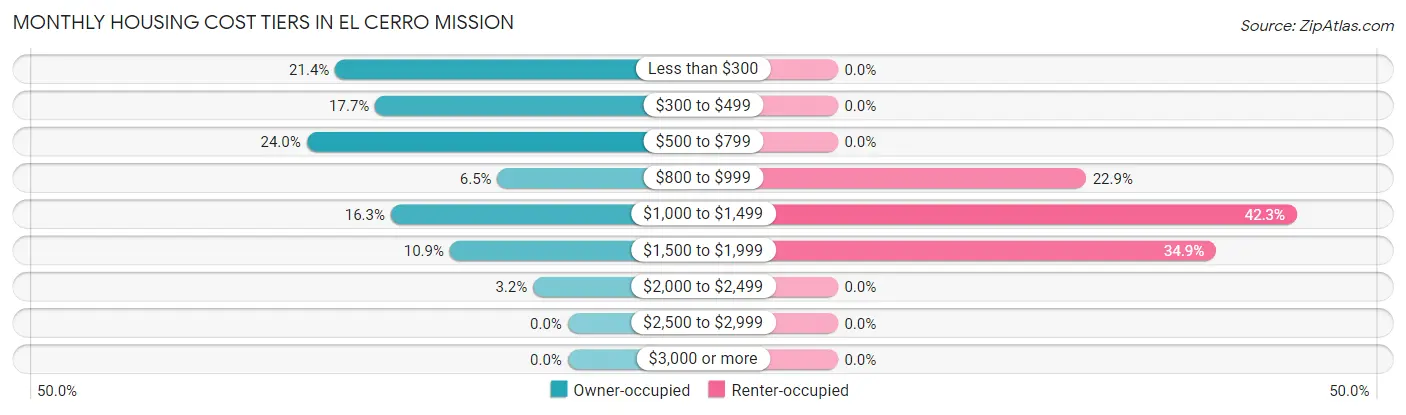
| Monthly Cost | Owner-occupied | Renter-occupied |
| Less than $300 | 268 (21.4%) | 0 (0.0%) |
| $300 to $499 | 222 (17.7%) | 0 (0.0%) |
| $500 to $799 | 301 (24.0%) | 0 (0.0%) |
| $800 to $999 | 81 (6.5%) | 40 (22.9%) |
| $1,000 to $1,499 | 204 (16.3%) | 74 (42.3%) |
| $1,500 to $1,999 | 136 (10.9%) | 61 (34.9%) |
| $2,000 to $2,499 | 40 (3.2%) | 0 (0.0%) |
| $2,500 to $2,999 | 0 (0.0%) | 0 (0.0%) |
| $3,000 or more | 0 (0.0%) | 0 (0.0%) |
| Total | 1,252 (100.0%) | 175 (100.0%) |
Physical Housing Characteristics in El Cerro Mission
Housing Structures in El Cerro Mission
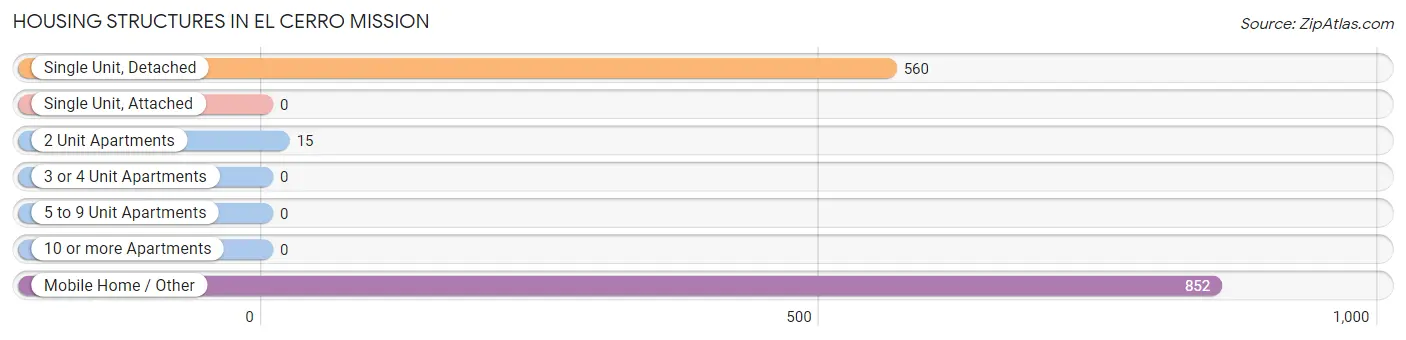
| Structure Type | # Housing Units | % Housing Units |
| Single Unit, Detached | 560 | 39.2% |
| Single Unit, Attached | 0 | 0.0% |
| 2 Unit Apartments | 15 | 1.1% |
| 3 or 4 Unit Apartments | 0 | 0.0% |
| 5 to 9 Unit Apartments | 0 | 0.0% |
| 10 or more Apartments | 0 | 0.0% |
| Mobile Home / Other | 852 | 59.7% |
| Total | 1,427 | 100.0% |
Housing Structures by Occupancy in El Cerro Mission
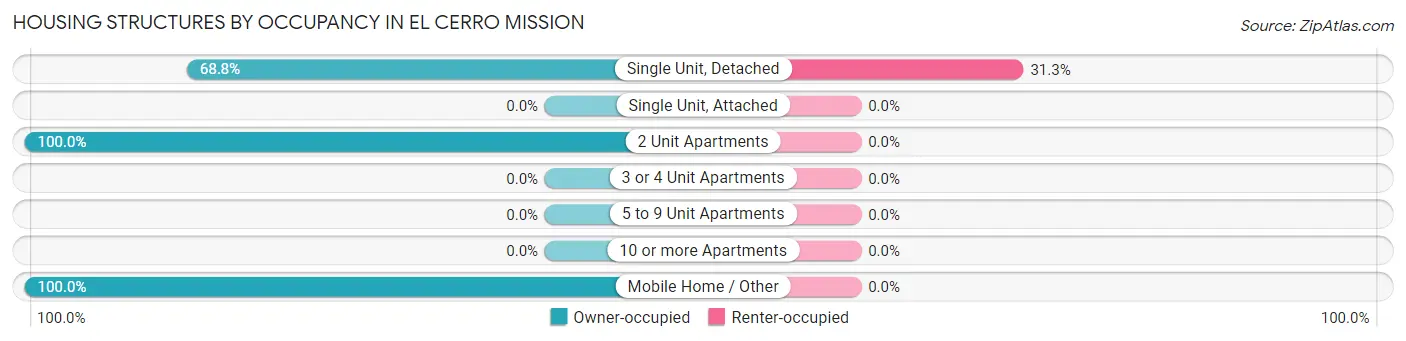
| Structure Type | Owner-occupied | Renter-occupied |
| Single Unit, Detached | 385 (68.8%) | 175 (31.2%) |
| Single Unit, Attached | 0 (0.0%) | 0 (0.0%) |
| 2 Unit Apartments | 15 (100.0%) | 0 (0.0%) |
| 3 or 4 Unit Apartments | 0 (0.0%) | 0 (0.0%) |
| 5 to 9 Unit Apartments | 0 (0.0%) | 0 (0.0%) |
| 10 or more Apartments | 0 (0.0%) | 0 (0.0%) |
| Mobile Home / Other | 852 (100.0%) | 0 (0.0%) |
| Total | 1,252 (87.7%) | 175 (12.3%) |
Housing Structures by Number of Rooms in El Cerro Mission
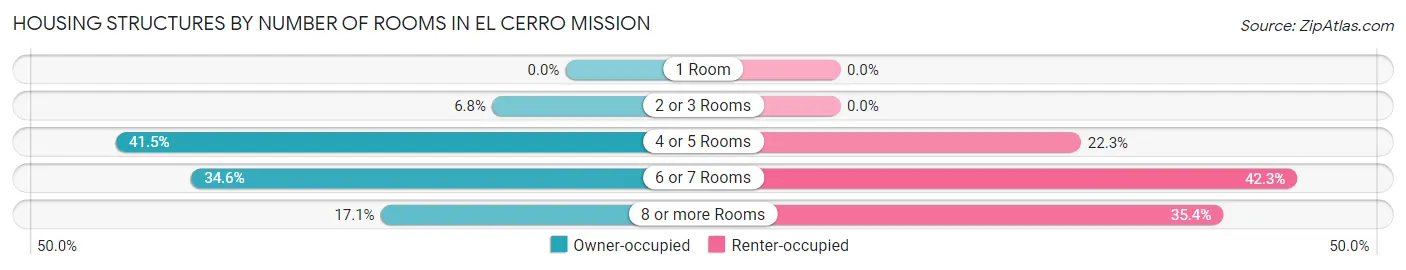
| Number of Rooms | Owner-occupied | Renter-occupied |
| 1 Room | 0 (0.0%) | 0 (0.0%) |
| 2 or 3 Rooms | 85 (6.8%) | 0 (0.0%) |
| 4 or 5 Rooms | 520 (41.5%) | 39 (22.3%) |
| 6 or 7 Rooms | 433 (34.6%) | 74 (42.3%) |
| 8 or more Rooms | 214 (17.1%) | 62 (35.4%) |
| Total | 1,252 (100.0%) | 175 (100.0%) |
Housing Structure by Heating Type in El Cerro Mission
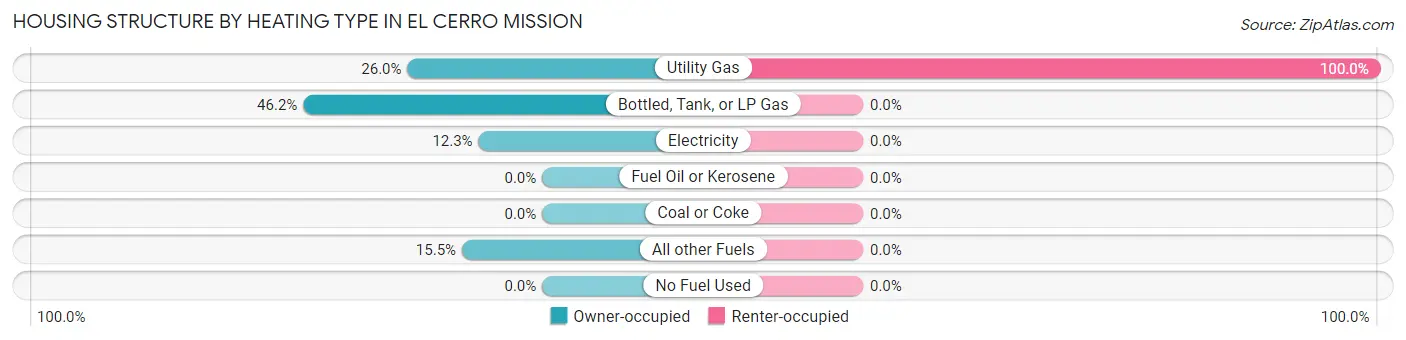
| Heating Type | Owner-occupied | Renter-occupied |
| Utility Gas | 326 (26.0%) | 175 (100.0%) |
| Bottled, Tank, or LP Gas | 578 (46.2%) | 0 (0.0%) |
| Electricity | 154 (12.3%) | 0 (0.0%) |
| Fuel Oil or Kerosene | 0 (0.0%) | 0 (0.0%) |
| Coal or Coke | 0 (0.0%) | 0 (0.0%) |
| All other Fuels | 194 (15.5%) | 0 (0.0%) |
| No Fuel Used | 0 (0.0%) | 0 (0.0%) |
| Total | 1,252 (100.0%) | 175 (100.0%) |
Household Vehicle Usage in El Cerro Mission
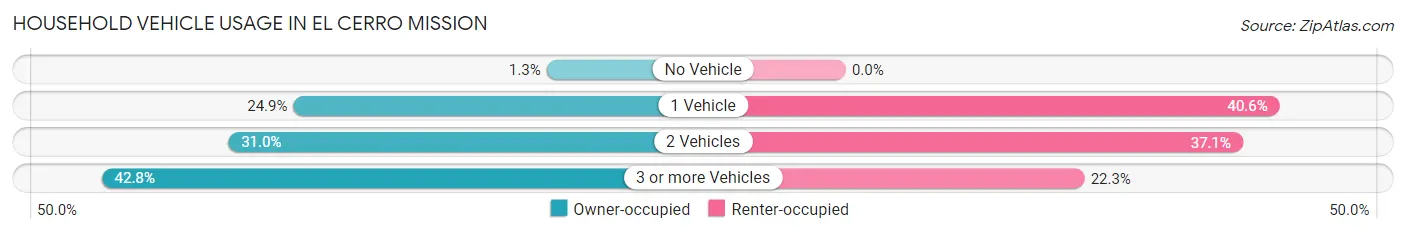
| Vehicles per Household | Owner-occupied | Renter-occupied |
| No Vehicle | 16 (1.3%) | 0 (0.0%) |
| 1 Vehicle | 312 (24.9%) | 71 (40.6%) |
| 2 Vehicles | 388 (31.0%) | 65 (37.1%) |
| 3 or more Vehicles | 536 (42.8%) | 39 (22.3%) |
| Total | 1,252 (100.0%) | 175 (100.0%) |
Real Estate & Mortgages in El Cerro Mission
Real Estate and Mortgage Overview in El Cerro Mission
| Characteristic | Without Mortgage | With Mortgage |
| Housing Units | 708 | 544 |
| Median Property Value | $76,000 | $120,600 |
| Median Household Income | $45,117 | $35 |
| Monthly Housing Costs | $436 | $0 |
| Real Estate Taxes | $511 | $33 |
Property Value by Mortgage Status in El Cerro Mission
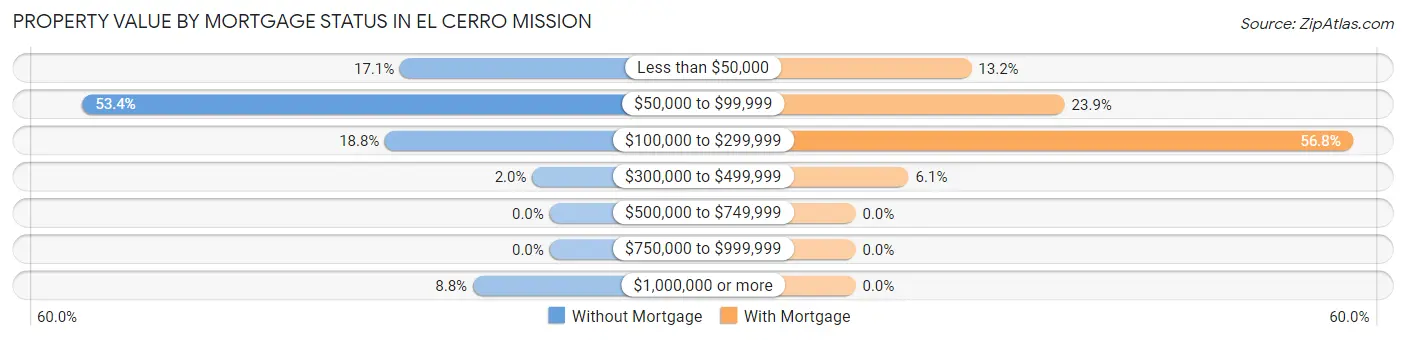
| Property Value | Without Mortgage | With Mortgage |
| Less than $50,000 | 121 (17.1%) | 72 (13.2%) |
| $50,000 to $99,999 | 378 (53.4%) | 130 (23.9%) |
| $100,000 to $299,999 | 133 (18.8%) | 309 (56.8%) |
| $300,000 to $499,999 | 14 (2.0%) | 33 (6.1%) |
| $500,000 to $749,999 | 0 (0.0%) | 0 (0.0%) |
| $750,000 to $999,999 | 0 (0.0%) | 0 (0.0%) |
| $1,000,000 or more | 62 (8.8%) | 0 (0.0%) |
| Total | 708 (100.0%) | 544 (100.0%) |
Household Income by Mortgage Status in El Cerro Mission
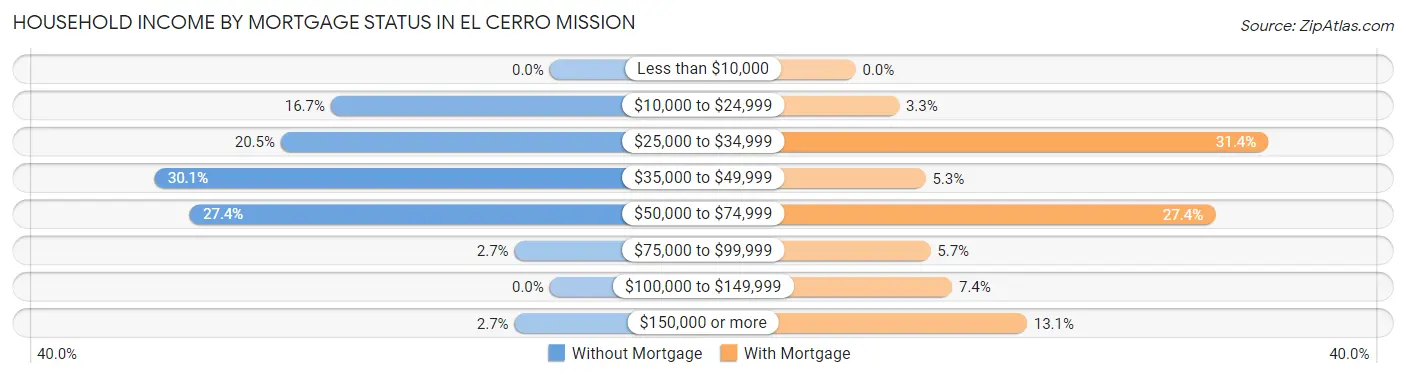
| Household Income | Without Mortgage | With Mortgage |
| Less than $10,000 | 0 (0.0%) | 0 (0.0%) |
| $10,000 to $24,999 | 118 (16.7%) | 18 (3.3%) |
| $25,000 to $34,999 | 145 (20.5%) | 171 (31.4%) |
| $35,000 to $49,999 | 213 (30.1%) | 29 (5.3%) |
| $50,000 to $74,999 | 194 (27.4%) | 149 (27.4%) |
| $75,000 to $99,999 | 19 (2.7%) | 31 (5.7%) |
| $100,000 to $149,999 | 0 (0.0%) | 40 (7.3%) |
| $150,000 or more | 19 (2.7%) | 71 (13.1%) |
| Total | 708 (100.0%) | 544 (100.0%) |
Property Value to Household Income Ratio in El Cerro Mission
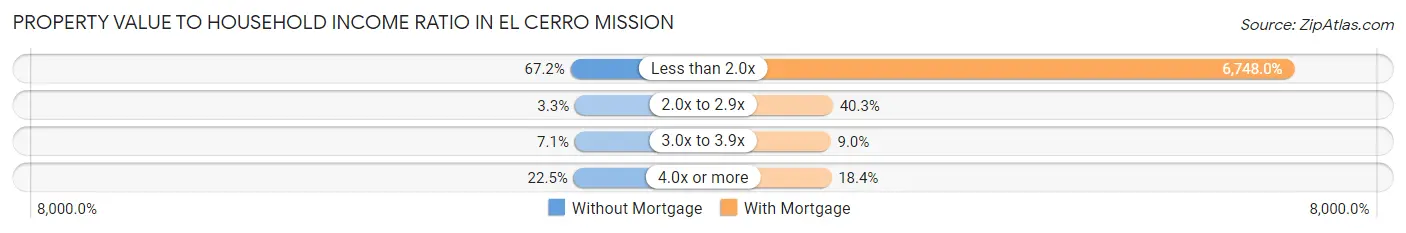
| Value-to-Income Ratio | Without Mortgage | With Mortgage |
| Less than 2.0x | 476 (67.2%) | 36,709 (6,748.0%) |
| 2.0x to 2.9x | 23 (3.3%) | 219 (40.3%) |
| 3.0x to 3.9x | 50 (7.1%) | 49 (9.0%) |
| 4.0x or more | 159 (22.5%) | 100 (18.4%) |
| Total | 708 (100.0%) | 544 (100.0%) |
Real Estate Taxes by Mortgage Status in El Cerro Mission
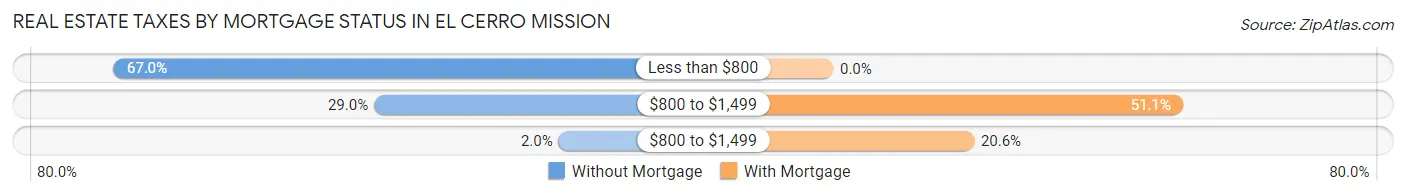
| Property Taxes | Without Mortgage | With Mortgage |
| Less than $800 | 474 (66.9%) | 0 (0.0%) |
| $800 to $1,499 | 205 (28.9%) | 278 (51.1%) |
| $800 to $1,499 | 14 (2.0%) | 112 (20.6%) |
| Total | 708 (100.0%) | 544 (100.0%) |
Health & Disability in El Cerro Mission
Health Insurance Coverage by Age in El Cerro Mission
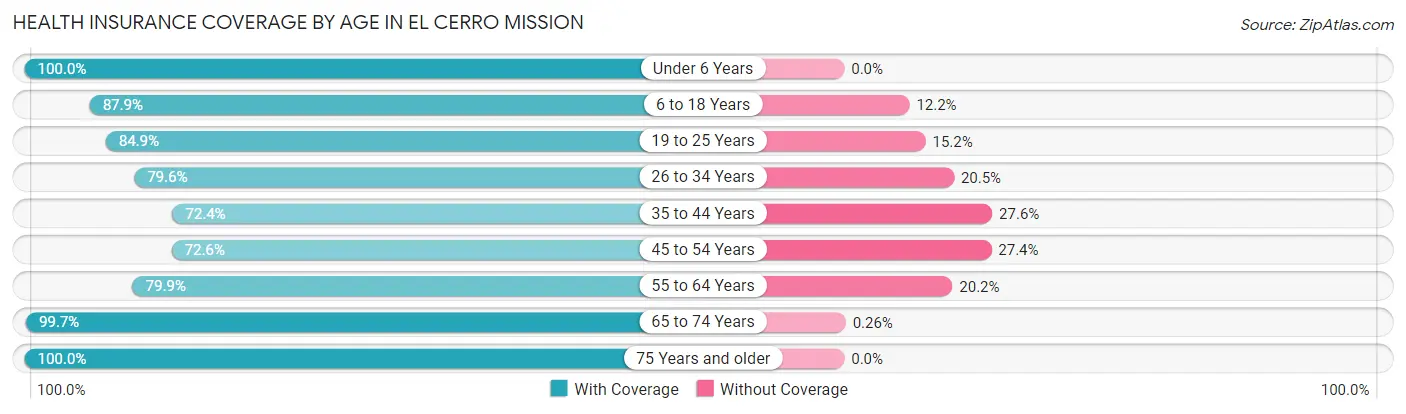
| Age Bracket | With Coverage | Without Coverage |
| Under 6 Years | 352 (100.0%) | 0 (0.0%) |
| 6 to 18 Years | 1,041 (87.8%) | 144 (12.1%) |
| 19 to 25 Years | 392 (84.9%) | 70 (15.1%) |
| 26 to 34 Years | 529 (79.5%) | 136 (20.4%) |
| 35 to 44 Years | 578 (72.4%) | 220 (27.6%) |
| 45 to 54 Years | 413 (72.6%) | 156 (27.4%) |
| 55 to 64 Years | 432 (79.8%) | 109 (20.2%) |
| 65 to 74 Years | 385 (99.7%) | 1 (0.3%) |
| 75 Years and older | 24 (100.0%) | 0 (0.0%) |
| Total | 4,146 (83.2%) | 836 (16.8%) |
Health Insurance Coverage by Citizenship Status in El Cerro Mission
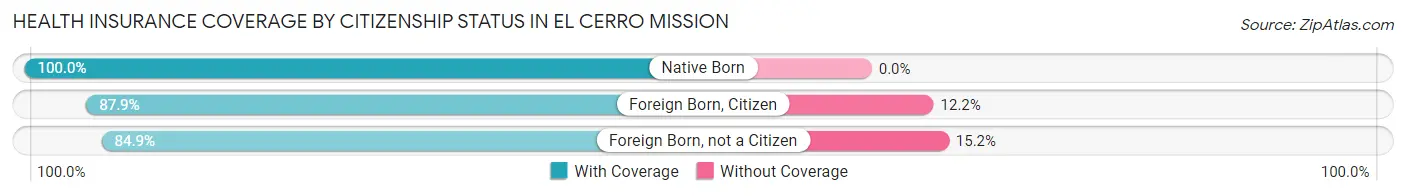
| Citizenship Status | With Coverage | Without Coverage |
| Native Born | 352 (100.0%) | 0 (0.0%) |
| Foreign Born, Citizen | 1,041 (87.8%) | 144 (12.1%) |
| Foreign Born, not a Citizen | 392 (84.9%) | 70 (15.1%) |
Health Insurance Coverage by Household Income in El Cerro Mission
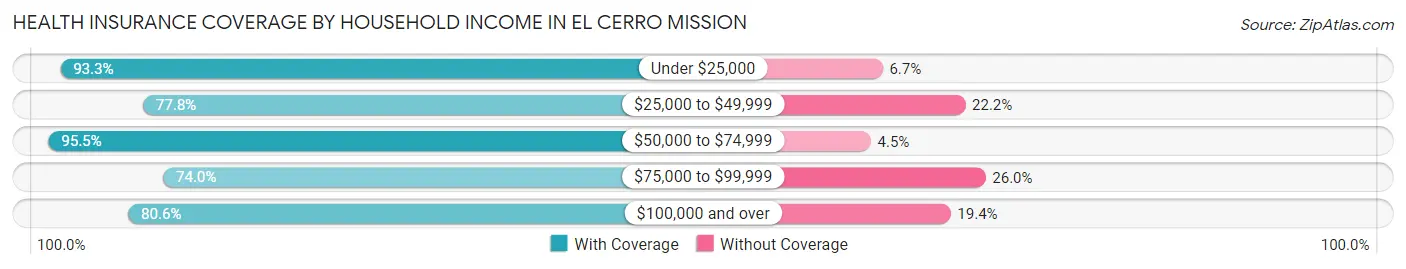
| Household Income | With Coverage | Without Coverage |
| Under $25,000 | 573 (93.3%) | 41 (6.7%) |
| $25,000 to $49,999 | 1,899 (77.8%) | 541 (22.2%) |
| $50,000 to $74,999 | 899 (95.5%) | 42 (4.5%) |
| $75,000 to $99,999 | 231 (74.0%) | 81 (26.0%) |
| $100,000 and over | 544 (80.6%) | 131 (19.4%) |
Public vs Private Health Insurance Coverage by Age in El Cerro Mission
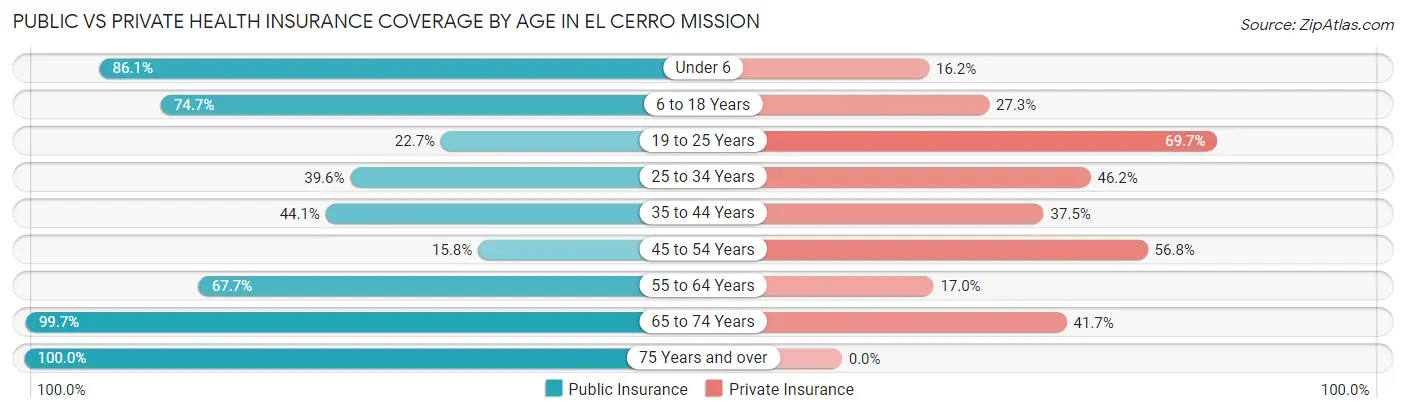
| Age Bracket | Public Insurance | Private Insurance |
| Under 6 | 303 (86.1%) | 57 (16.2%) |
| 6 to 18 Years | 885 (74.7%) | 324 (27.3%) |
| 19 to 25 Years | 105 (22.7%) | 322 (69.7%) |
| 25 to 34 Years | 263 (39.6%) | 307 (46.2%) |
| 35 to 44 Years | 352 (44.1%) | 299 (37.5%) |
| 45 to 54 Years | 90 (15.8%) | 323 (56.8%) |
| 55 to 64 Years | 366 (67.6%) | 92 (17.0%) |
| 65 to 74 Years | 385 (99.7%) | 161 (41.7%) |
| 75 Years and over | 24 (100.0%) | 0 (0.0%) |
| Total | 2,773 (55.7%) | 1,885 (37.8%) |
Disability Status by Sex by Age in El Cerro Mission
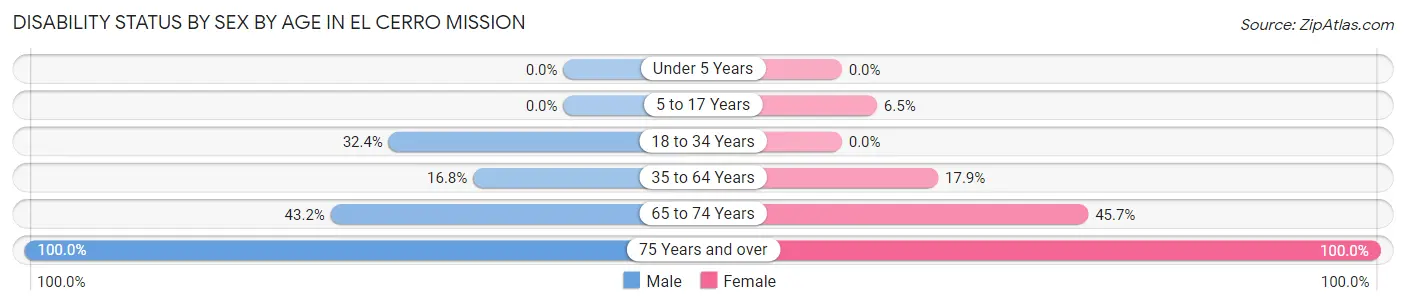
| Age Bracket | Male | Female |
| Under 5 Years | 0 (0.0%) | 0 (0.0%) |
| 5 to 17 Years | 0 (0.0%) | 44 (6.5%) |
| 18 to 34 Years | 212 (32.4%) | 0 (0.0%) |
| 35 to 64 Years | 166 (16.8%) | 164 (17.9%) |
| 65 to 74 Years | 111 (43.2%) | 59 (45.7%) |
| 75 Years and over | 14 (100.0%) | 10 (100.0%) |
Disability Class by Sex by Age in El Cerro Mission
Disability Class: Hearing Difficulty
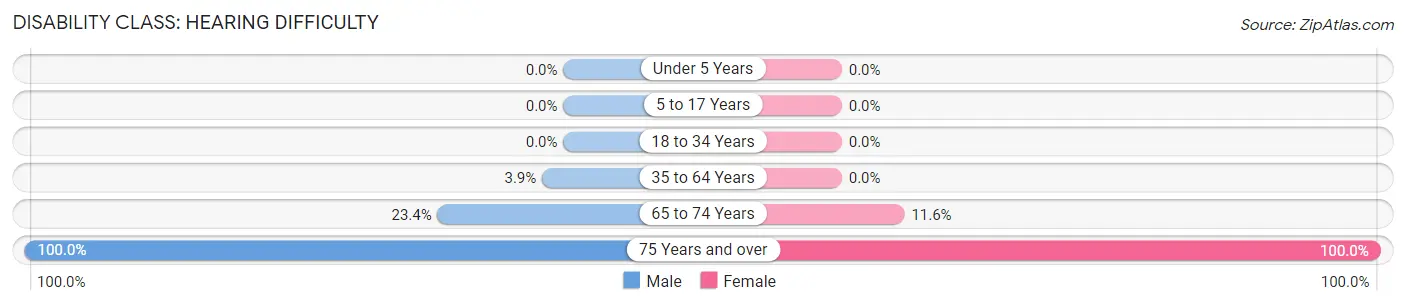
| Age Bracket | Male | Female |
| Under 5 Years | 0 (0.0%) | 0 (0.0%) |
| 5 to 17 Years | 0 (0.0%) | 0 (0.0%) |
| 18 to 34 Years | 0 (0.0%) | 0 (0.0%) |
| 35 to 64 Years | 39 (3.9%) | 0 (0.0%) |
| 65 to 74 Years | 60 (23.4%) | 15 (11.6%) |
| 75 Years and over | 14 (100.0%) | 10 (100.0%) |
Disability Class: Vision Difficulty
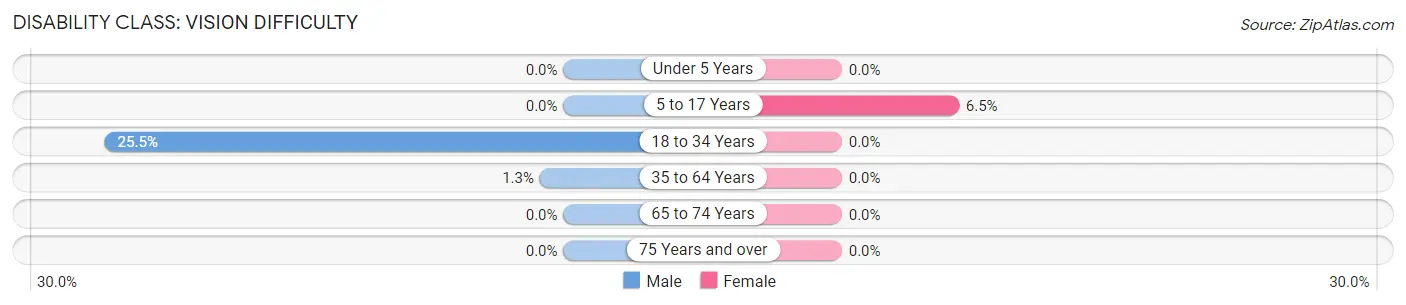
| Age Bracket | Male | Female |
| Under 5 Years | 0 (0.0%) | 0 (0.0%) |
| 5 to 17 Years | 0 (0.0%) | 44 (6.5%) |
| 18 to 34 Years | 167 (25.5%) | 0 (0.0%) |
| 35 to 64 Years | 13 (1.3%) | 0 (0.0%) |
| 65 to 74 Years | 0 (0.0%) | 0 (0.0%) |
| 75 Years and over | 0 (0.0%) | 0 (0.0%) |
Disability Class: Cognitive Difficulty
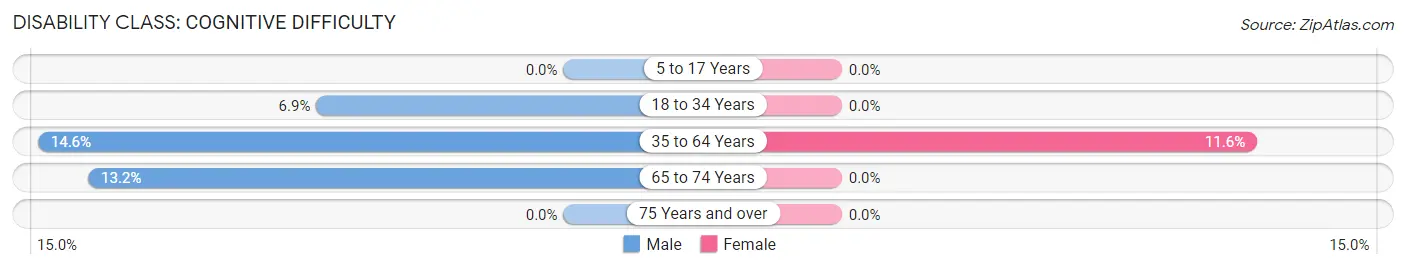
| Age Bracket | Male | Female |
| 5 to 17 Years | 0 (0.0%) | 0 (0.0%) |
| 18 to 34 Years | 45 (6.9%) | 0 (0.0%) |
| 35 to 64 Years | 145 (14.6%) | 106 (11.6%) |
| 65 to 74 Years | 34 (13.2%) | 0 (0.0%) |
| 75 Years and over | 0 (0.0%) | 0 (0.0%) |
Disability Class: Ambulatory Difficulty
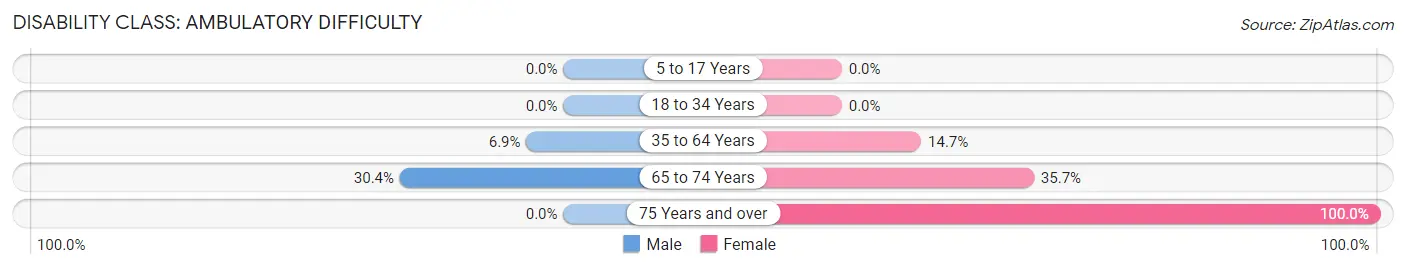
| Age Bracket | Male | Female |
| 5 to 17 Years | 0 (0.0%) | 0 (0.0%) |
| 18 to 34 Years | 0 (0.0%) | 0 (0.0%) |
| 35 to 64 Years | 68 (6.9%) | 135 (14.7%) |
| 65 to 74 Years | 78 (30.3%) | 46 (35.7%) |
| 75 Years and over | 0 (0.0%) | 10 (100.0%) |
Disability Class: Self-Care Difficulty
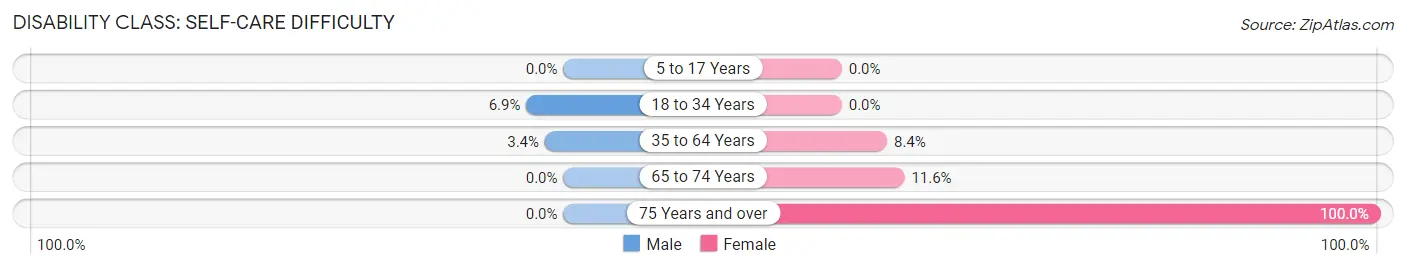
| Age Bracket | Male | Female |
| 5 to 17 Years | 0 (0.0%) | 0 (0.0%) |
| 18 to 34 Years | 45 (6.9%) | 0 (0.0%) |
| 35 to 64 Years | 34 (3.4%) | 77 (8.4%) |
| 65 to 74 Years | 0 (0.0%) | 15 (11.6%) |
| 75 Years and over | 0 (0.0%) | 10 (100.0%) |
Technology Access in El Cerro Mission
Computing Device Access in El Cerro Mission
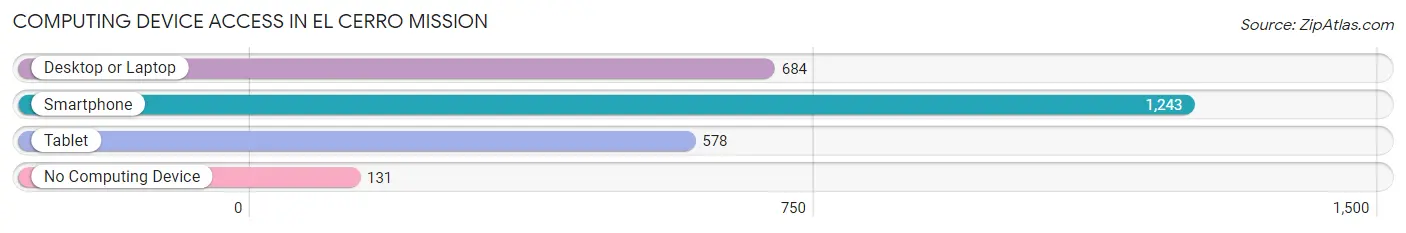
| Device Type | # Households | % Households |
| Desktop or Laptop | 684 | 47.9% |
| Smartphone | 1,243 | 87.1% |
| Tablet | 578 | 40.5% |
| No Computing Device | 131 | 9.2% |
| Total | 1,427 | 100.0% |
Internet Access in El Cerro Mission
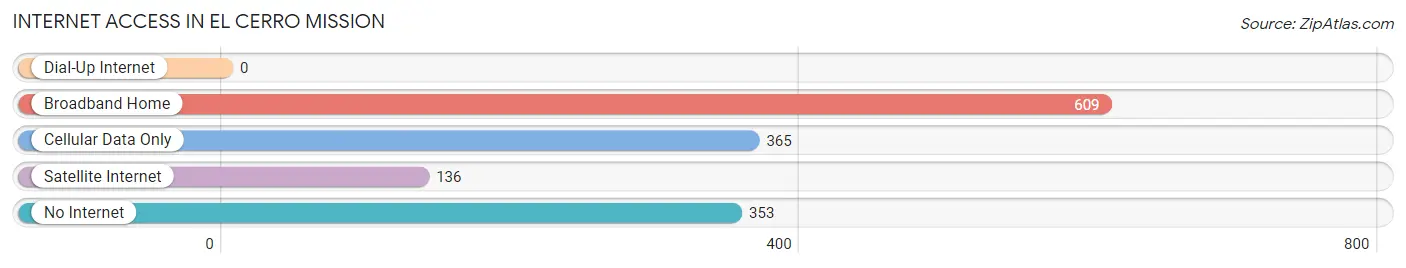
| Internet Type | # Households | % Households |
| Dial-Up Internet | 0 | 0.0% |
| Broadband Home | 609 | 42.7% |
| Cellular Data Only | 365 | 25.6% |
| Satellite Internet | 136 | 9.5% |
| No Internet | 353 | 24.7% |
| Total | 1,427 | 100.0% |
El Cerro Mission Summary
Cerro Mission, New Mexico is a small unincorporated community located in the San Miguel County of the state of New Mexico. It is situated in the foothills of the Sangre de Cristo Mountains, approximately 25 miles south of Las Vegas, New Mexico. The community is located on the banks of the Cerro Mission Creek, which is a tributary of the Gallinas River.
Geography
Cerro Mission is located in the foothills of the Sangre de Cristo Mountains, at an elevation of 6,400 feet. The area is characterized by rolling hills, with the highest point in the area being Cerro Mission Peak, which rises to an elevation of 8,400 feet. The climate in the area is semi-arid, with hot summers and cold winters. The average annual precipitation is approximately 12 inches, with most of the precipitation occurring in the form of snow during the winter months.
The Cerro Mission Creek runs through the area, and is a tributary of the Gallinas River. The creek is a popular spot for fishing, and is home to a variety of fish species, including rainbow trout, brown trout, and cutthroat trout.
Economy
The economy of Cerro Mission is largely based on agriculture and ranching. The area is home to a number of small farms and ranches, which produce a variety of crops, including alfalfa, hay, and corn. The area is also home to a number of small businesses, including a general store, a gas station, and a restaurant.
Demographics
As of the 2010 census, the population of Cerro Mission was 545. The racial makeup of the community was 94.2% White, 0.2% African American, 0.7% Native American, 0.2% Asian, 0.2% Pacific Islander, 2.7% from other races, and 1.9% from two or more races. Hispanic or Latino of any race were 8.2% of the population.
The median household income in Cerro Mission was $30,000, and the median family income was $35,000. The per capita income for the community was $14,000.
History
The area that is now Cerro Mission was originally inhabited by the Tewa Indians, who were a nomadic tribe that lived in the area for centuries. The first European settlers arrived in the area in the late 1800s, and the community was officially established in 1891. The community was named after the nearby Cerro Mission Peak, which was named after a Spanish mission that was located in the area in the 1700s.
In the early 1900s, the area was home to a number of small farms and ranches, and the community was largely self-sufficient. The area was also home to a number of small businesses, including a general store, a gas station, and a restaurant.
In the 1950s, the area began to experience a population decline, as many of the residents moved away in search of better economic opportunities. The population of the community has remained relatively stable since then, and the area is still largely rural and agricultural.
Common Questions
What is Per Capita Income in El Cerro Mission?
Per Capita income in El Cerro Mission is $16,380.
What is the Median Family Income in El Cerro Mission?
Median Family Income in El Cerro Mission is $47,070.
What is the Median Household income in El Cerro Mission?
Median Household Income in El Cerro Mission is $45,264.
What is Income or Wage Gap in El Cerro Mission?
Income or Wage Gap in El Cerro Mission is 41.7%.
Women in El Cerro Mission earn 58.3 cents for every dollar earned by a man.
What is Inequality or Gini Index in El Cerro Mission?
Inequality or Gini Index in El Cerro Mission is 0.40.
What is the Total Population of El Cerro Mission?
Total Population of El Cerro Mission is 4,999.
What is the Total Male Population of El Cerro Mission?
Total Male Population of El Cerro Mission is 2,687.
What is the Total Female Population of El Cerro Mission?
Total Female Population of El Cerro Mission is 2,312.
What is the Ratio of Males per 100 Females in El Cerro Mission?
There are 116.22 Males per 100 Females in El Cerro Mission.
What is the Ratio of Females per 100 Males in El Cerro Mission?
There are 86.04 Females per 100 Males in El Cerro Mission.
What is the Median Population Age in El Cerro Mission?
Median Population Age in El Cerro Mission is 34.2 Years.
What is the Average Family Size in El Cerro Mission
Average Family Size in El Cerro Mission is 4.2 People.
What is the Average Household Size in El Cerro Mission
Average Household Size in El Cerro Mission is 3.5 People.
How Large is the Labor Force in El Cerro Mission?
There are 2,085 People in the Labor Forcein in El Cerro Mission.
What is the Percentage of People in the Labor Force in El Cerro Mission?
56.5% of People are in the Labor Force in El Cerro Mission.
What is the Unemployment Rate in El Cerro Mission?
Unemployment Rate in El Cerro Mission is 15.9%.