Enochville, NC Map & Demographics
Enochville Map
Enochville Overview
$29,783
PER CAPITA INCOME
$54,110
AVG FAMILY INCOME
$57,328
AVG HOUSEHOLD INCOME
45.3%
WAGE / INCOME GAP [ % ]
54.7¢/ $1
WAGE / INCOME GAP [ $ ]
0.44
INEQUALITY / GINI INDEX
3,446
TOTAL POPULATION
1,697
MALE POPULATION
1,749
FEMALE POPULATION
97.03
MALES / 100 FEMALES
103.06
FEMALES / 100 MALES
38.4
MEDIAN AGE
2.8
AVG FAMILY SIZE
2.7
AVG HOUSEHOLD SIZE
1,536
LABOR FORCE [ PEOPLE ]
56.6%
PERCENT IN LABOR FORCE
7.5%
UNEMPLOYMENT RATE
Income in Enochville
Income Overview in Enochville
Per Capita Income in Enochville is $29,783, while median incomes of families and households are $54,110 and $57,328 respectively.
| Characteristic | Number | Measure |
| Per Capita Income | 3,446 | $29,783 |
| Median Family Income | 1,000 | $54,110 |
| Mean Family Income | 1,000 | $84,279 |
| Median Household Income | 1,282 | $57,328 |
| Mean Household Income | 1,282 | $80,858 |
| Income Deficit | 1,000 | $0 |
| Wage / Income Gap (%) | 3,446 | 45.34% |
| Wage / Income Gap ($) | 3,446 | 54.66¢ per $1 |
| Gini / Inequality Index | 3,446 | 0.44 |
Earnings by Sex in Enochville
Average Earnings in Enochville are $38,790, $51,250 for men and $28,015 for women, a difference of 45.3%.
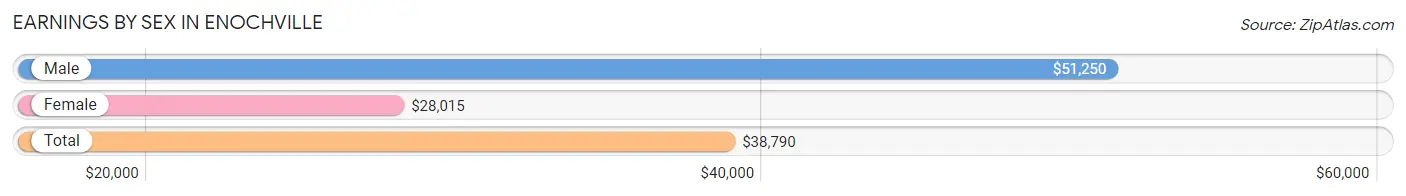
| Sex | Number | Average Earnings |
| Male | 709 (46.5%) | $51,250 |
| Female | 816 (53.5%) | $28,015 |
| Total | 1,525 (100.0%) | $38,790 |
Earnings by Sex by Income Bracket in Enochville
The most common earnings brackets in Enochville are $75,000 to $99,999 for men (102 | 14.4%) and $25,000 to $29,999 for women (165 | 20.2%).
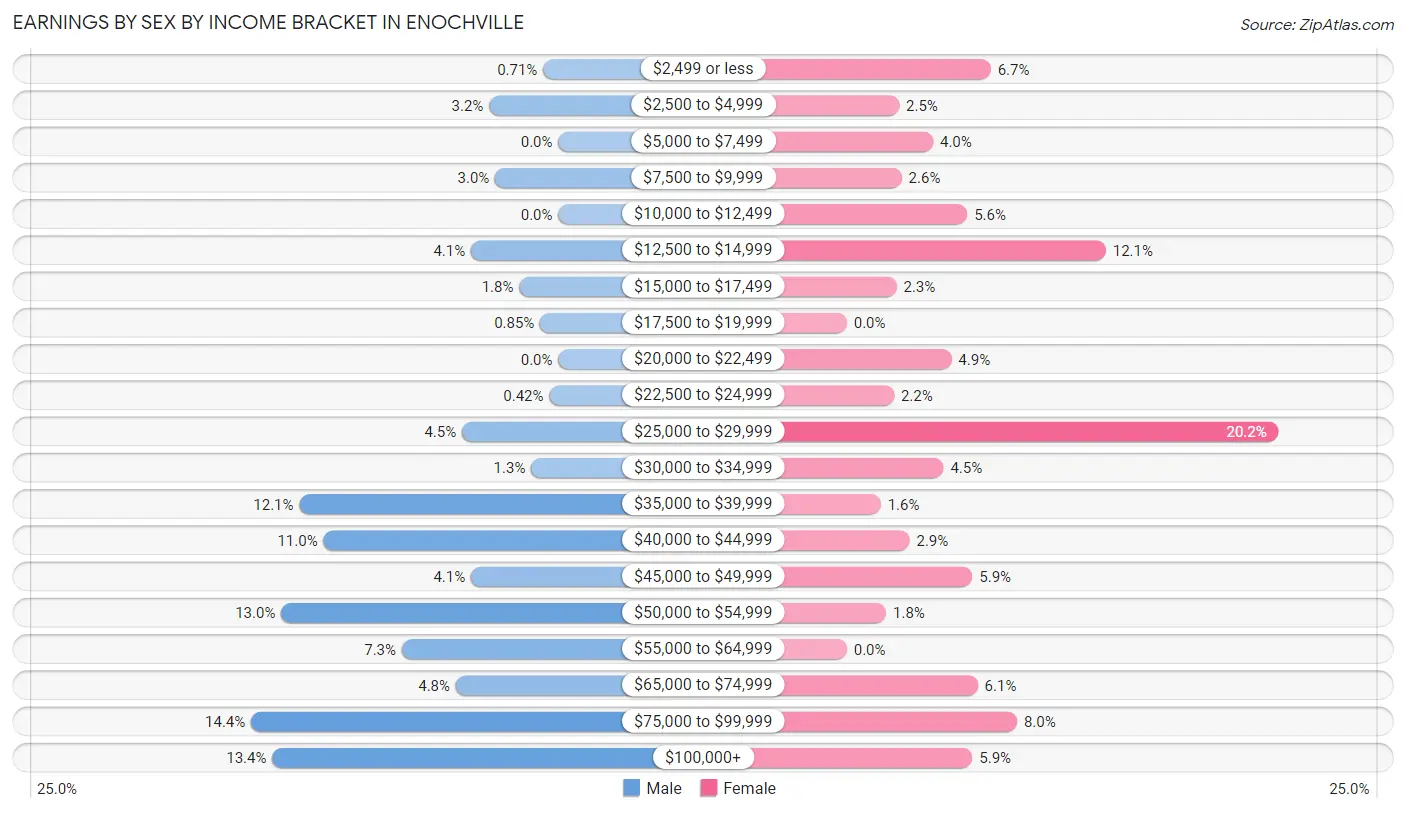
| Income | Male | Female |
| $2,499 or less | 5 (0.7%) | 55 (6.7%) |
| $2,500 to $4,999 | 23 (3.2%) | 20 (2.5%) |
| $5,000 to $7,499 | 0 (0.0%) | 33 (4.0%) |
| $7,500 to $9,999 | 21 (3.0%) | 21 (2.6%) |
| $10,000 to $12,499 | 0 (0.0%) | 46 (5.6%) |
| $12,500 to $14,999 | 29 (4.1%) | 99 (12.1%) |
| $15,000 to $17,499 | 13 (1.8%) | 19 (2.3%) |
| $17,500 to $19,999 | 6 (0.9%) | 0 (0.0%) |
| $20,000 to $22,499 | 0 (0.0%) | 40 (4.9%) |
| $22,500 to $24,999 | 3 (0.4%) | 18 (2.2%) |
| $25,000 to $29,999 | 32 (4.5%) | 165 (20.2%) |
| $30,000 to $34,999 | 9 (1.3%) | 37 (4.5%) |
| $35,000 to $39,999 | 86 (12.1%) | 13 (1.6%) |
| $40,000 to $44,999 | 78 (11.0%) | 24 (2.9%) |
| $45,000 to $49,999 | 29 (4.1%) | 48 (5.9%) |
| $50,000 to $54,999 | 92 (13.0%) | 15 (1.8%) |
| $55,000 to $64,999 | 52 (7.3%) | 0 (0.0%) |
| $65,000 to $74,999 | 34 (4.8%) | 50 (6.1%) |
| $75,000 to $99,999 | 102 (14.4%) | 65 (8.0%) |
| $100,000+ | 95 (13.4%) | 48 (5.9%) |
| Total | 709 (100.0%) | 816 (100.0%) |
Earnings by Sex by Educational Attainment in Enochville
Average earnings in Enochville are $53,456 for men and $28,355 for women, a difference of 47.0%. Men with an educational attainment of bachelor's degree enjoy the highest average annual earnings of $63,472, while those with college or associate's degree education earn the least with $45,302. Women with an educational attainment of bachelor's degree earn the most with the average annual earnings of $35,673, while those with less than high school education have the smallest earnings of $14,356.
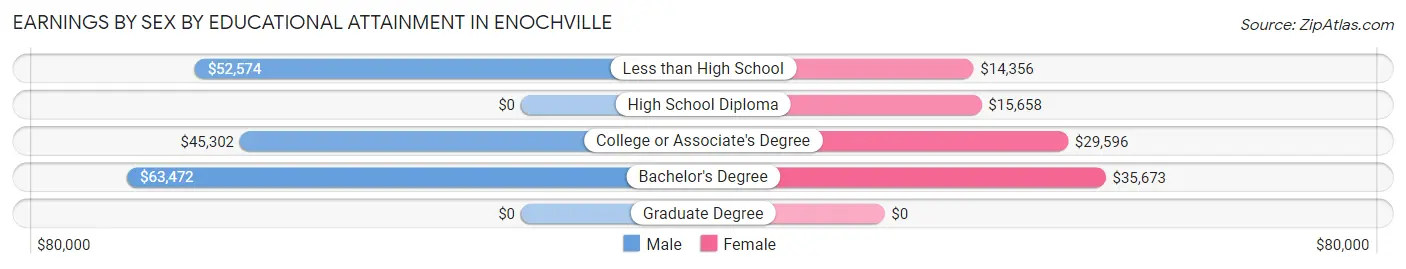
| Educational Attainment | Male Income | Female Income |
| Less than High School | $52,574 | $14,356 |
| High School Diploma | - | - |
| College or Associate's Degree | $45,302 | $29,596 |
| Bachelor's Degree | $63,472 | $35,673 |
| Graduate Degree | - | - |
| Total | $53,456 | $28,355 |
Family Income in Enochville
Family Income Brackets in Enochville
According to the Enochville family income data, there are 246 families falling into the $25,000 to $34,999 income range, which is the most common income bracket and makes up 24.6% of all families.
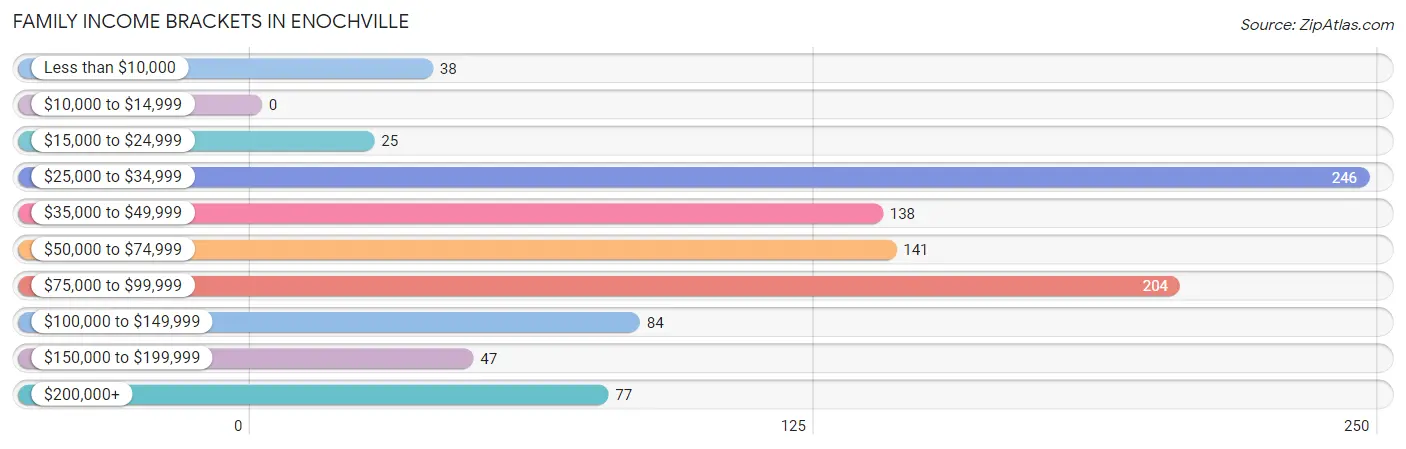
| Income Bracket | # Families | % Families |
| Less than $10,000 | 38 | 3.8% |
| $10,000 to $14,999 | 0 | 0.0% |
| $15,000 to $24,999 | 25 | 2.5% |
| $25,000 to $34,999 | 246 | 24.6% |
| $35,000 to $49,999 | 138 | 13.8% |
| $50,000 to $74,999 | 141 | 14.1% |
| $75,000 to $99,999 | 204 | 20.4% |
| $100,000 to $149,999 | 84 | 8.4% |
| $150,000 to $199,999 | 47 | 4.7% |
| $200,000+ | 77 | 7.7% |
Family Income by Famaliy Size in Enochville
3-person families (256 | 25.6%) account for the highest median family income in Enochville with $93,194 per family, while 3-person families (256 | 25.6%) have the highest median income of $31,065 per family member.
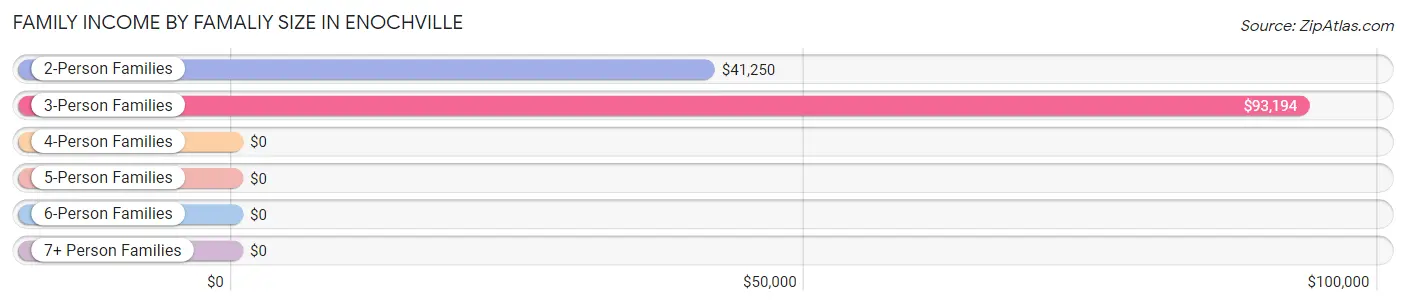
| Income Bracket | # Families | Median Income |
| 2-Person Families | 464 (46.4%) | $41,250 |
| 3-Person Families | 256 (25.6%) | $93,194 |
| 4-Person Families | 212 (21.2%) | $0 |
| 5-Person Families | 51 (5.1%) | $0 |
| 6-Person Families | 0 (0.0%) | $0 |
| 7+ Person Families | 17 (1.7%) | $0 |
| Total | 1,000 (100.0%) | $54,110 |
Family Income by Number of Earners in Enochville
The median family income in Enochville is $54,110, with families comprising 3+ earners (73) having the highest median family income of $138,393, while families with no earners (135) have the lowest median family income of $33,345, accounting for 7.3% and 13.5% of families, respectively.
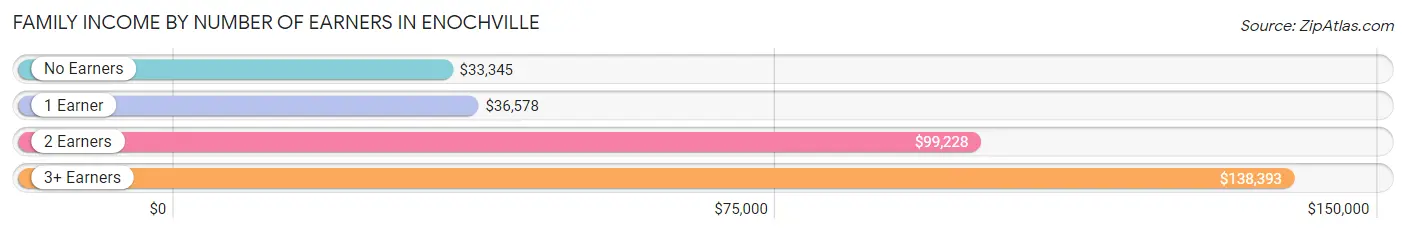
| Number of Earners | # Families | Median Income |
| No Earners | 135 (13.5%) | $33,345 |
| 1 Earner | 559 (55.9%) | $36,578 |
| 2 Earners | 233 (23.3%) | $99,228 |
| 3+ Earners | 73 (7.3%) | $138,393 |
| Total | 1,000 (100.0%) | $54,110 |
Household Income in Enochville
Household Income Brackets in Enochville
With 383 households falling in the category, the $50,000 to $74,999 income range is the most frequent in Enochville, accounting for 29.9% of all households. In contrast, only 27 households (2.1%) fall into the $10,000 to $14,999 income bracket, making it the least populous group.
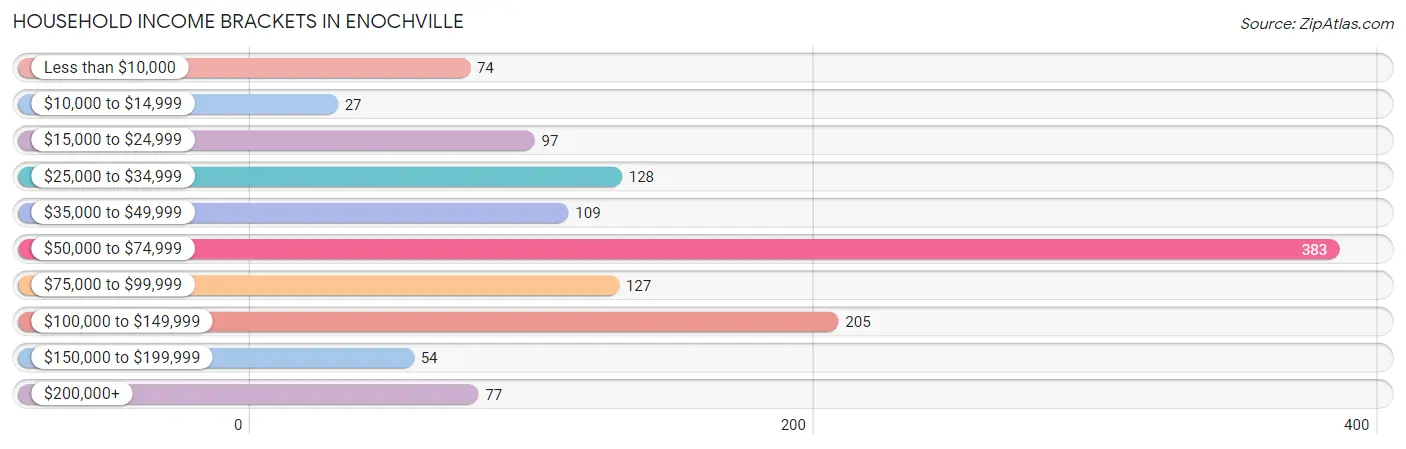
| Income Bracket | # Households | % Households |
| Less than $10,000 | 74 | 5.8% |
| $10,000 to $14,999 | 27 | 2.1% |
| $15,000 to $24,999 | 97 | 7.6% |
| $25,000 to $34,999 | 128 | 10.0% |
| $35,000 to $49,999 | 109 | 8.5% |
| $50,000 to $74,999 | 383 | 29.9% |
| $75,000 to $99,999 | 127 | 9.9% |
| $100,000 to $149,999 | 205 | 16.0% |
| $150,000 to $199,999 | 54 | 4.2% |
| $200,000+ | 77 | 6.0% |
Household Income by Householder Age in Enochville
The median household income in Enochville is $57,328, with the highest median household income of $73,500 found in the 45 to 64 years age bracket for the primary householder. A total of 504 households (39.3%) fall into this category. Meanwhile, the 15 to 24 years age bracket for the primary householder has the lowest median household income of $0, with 17 households (1.3%) in this group.
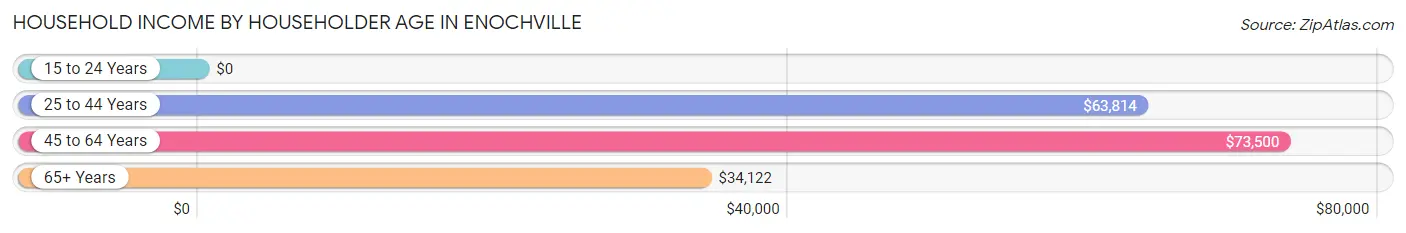
| Income Bracket | # Households | Median Income |
| 15 to 24 Years | 17 (1.3%) | $0 |
| 25 to 44 Years | 471 (36.7%) | $63,814 |
| 45 to 64 Years | 504 (39.3%) | $73,500 |
| 65+ Years | 290 (22.6%) | $34,122 |
| Total | 1,282 (100.0%) | $57,328 |
Poverty in Enochville
Income Below Poverty by Sex and Age in Enochville
With 15.4% poverty level for males and 27.1% for females among the residents of Enochville, under 5 year old males and 5 year old females are the most vulnerable to poverty, with 86 males (61.0%) and 41 females (100.0%) in their respective age groups living below the poverty level.
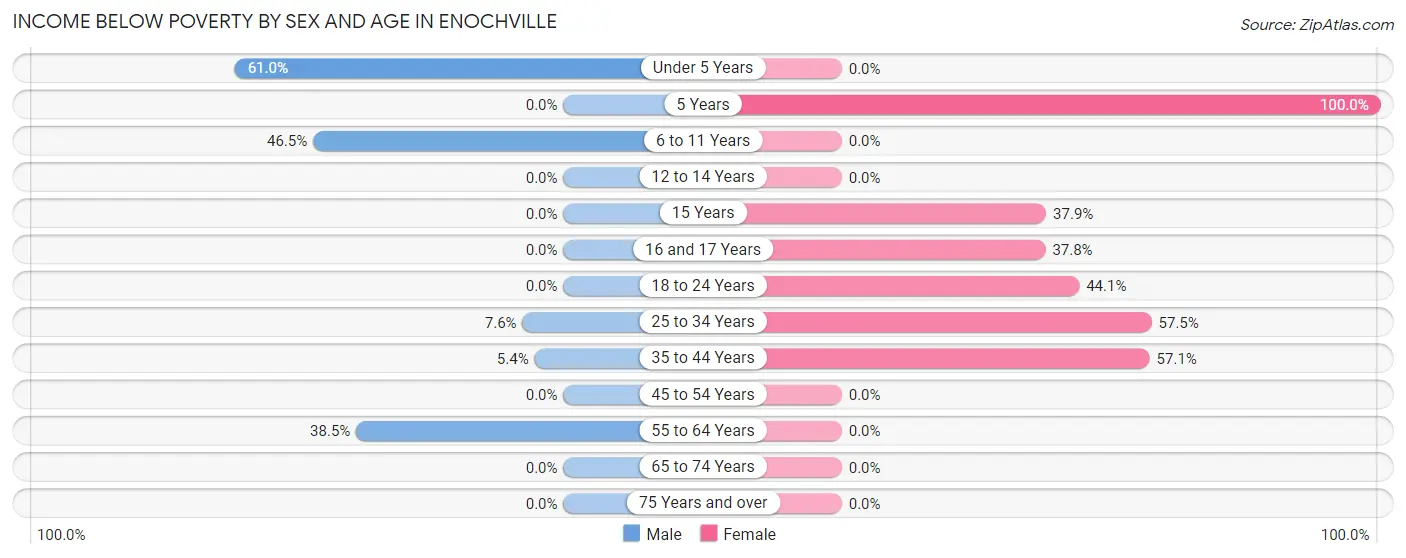
| Age Bracket | Male | Female |
| Under 5 Years | 86 (61.0%) | 0 (0.0%) |
| 5 Years | 0 (0.0%) | 41 (100.0%) |
| 6 to 11 Years | 59 (46.5%) | 0 (0.0%) |
| 12 to 14 Years | 0 (0.0%) | 0 (0.0%) |
| 15 Years | 0 (0.0%) | 11 (37.9%) |
| 16 and 17 Years | 0 (0.0%) | 31 (37.8%) |
| 18 to 24 Years | 0 (0.0%) | 26 (44.1%) |
| 25 to 34 Years | 20 (7.6%) | 180 (57.5%) |
| 35 to 44 Years | 12 (5.4%) | 180 (57.1%) |
| 45 to 54 Years | 0 (0.0%) | 0 (0.0%) |
| 55 to 64 Years | 85 (38.5%) | 0 (0.0%) |
| 65 to 74 Years | 0 (0.0%) | 0 (0.0%) |
| 75 Years and over | 0 (0.0%) | 0 (0.0%) |
| Total | 262 (15.4%) | 469 (27.1%) |
Income Above Poverty by Sex and Age in Enochville
According to the poverty statistics in Enochville, males aged 12 to 14 years and females aged under 5 years are the age groups that are most secure financially, with 100.0% of males and 100.0% of females in these age groups living above the poverty line.
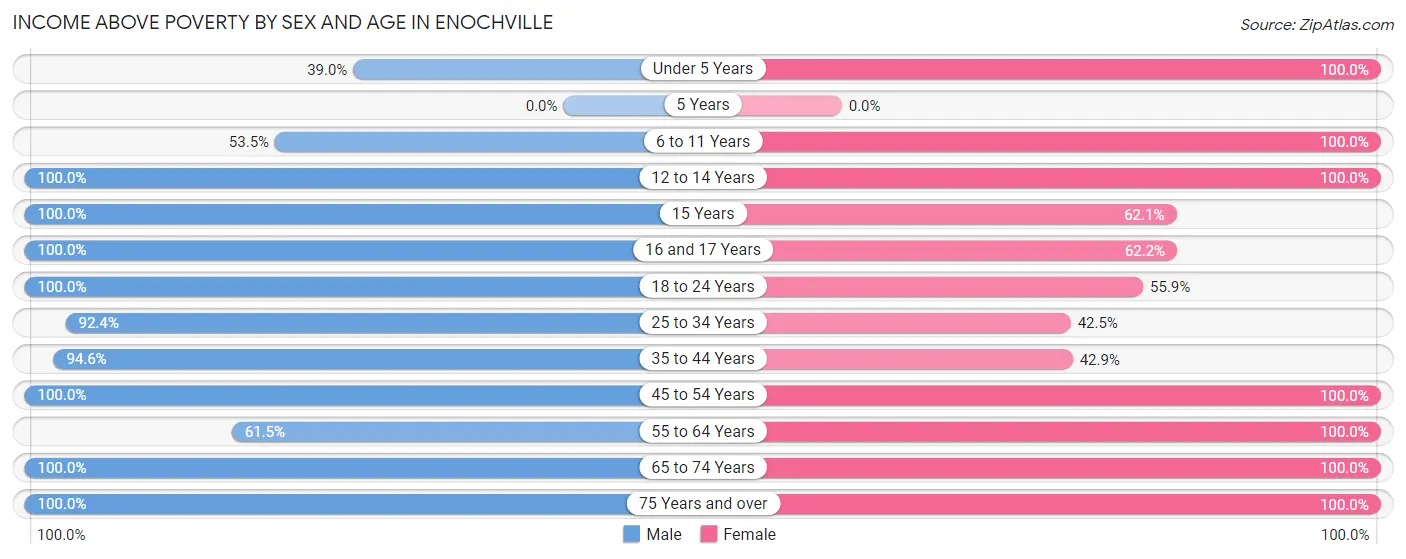
| Age Bracket | Male | Female |
| Under 5 Years | 55 (39.0%) | 38 (100.0%) |
| 5 Years | 0 (0.0%) | 0 (0.0%) |
| 6 to 11 Years | 68 (53.5%) | 124 (100.0%) |
| 12 to 14 Years | 107 (100.0%) | 54 (100.0%) |
| 15 Years | 50 (100.0%) | 18 (62.1%) |
| 16 and 17 Years | 67 (100.0%) | 51 (62.2%) |
| 18 to 24 Years | 80 (100.0%) | 33 (55.9%) |
| 25 to 34 Years | 243 (92.4%) | 133 (42.5%) |
| 35 to 44 Years | 212 (94.6%) | 135 (42.9%) |
| 45 to 54 Years | 197 (100.0%) | 161 (100.0%) |
| 55 to 64 Years | 136 (61.5%) | 262 (100.0%) |
| 65 to 74 Years | 166 (100.0%) | 149 (100.0%) |
| 75 Years and over | 54 (100.0%) | 101 (100.0%) |
| Total | 1,435 (84.6%) | 1,259 (72.9%) |
Income Below Poverty Among Married-Couple Families in Enochville
The poverty statistics for married-couple families in Enochville show that 2.9% or 14 of the total 485 families live below the poverty line. Families with 1 or 2 children have the highest poverty rate of 15.2%, comprising of 14 families. On the other hand, families with no children have the lowest poverty rate of 0.0%, which includes 0 families.
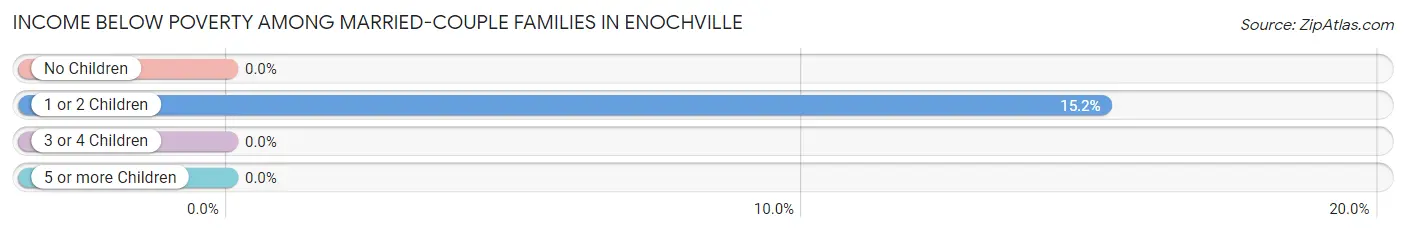
| Children | Above Poverty | Below Poverty |
| No Children | 325 (100.0%) | 0 (0.0%) |
| 1 or 2 Children | 78 (84.8%) | 14 (15.2%) |
| 3 or 4 Children | 68 (100.0%) | 0 (0.0%) |
| 5 or more Children | 0 (0.0%) | 0 (0.0%) |
| Total | 471 (97.1%) | 14 (2.9%) |
Income Below Poverty Among Single-Parent Households in Enochville
According to the poverty data in Enochville, 20.4% or 11 single-father households and 35.4% or 163 single-mother households are living below the poverty line. Among single-father households, those with 1 or 2 children have the highest poverty rate, with 11 households (20.4%) experiencing poverty. Likewise, among single-mother households, those with 3 or 4 children have the highest poverty rate, with 136 households (100.0%) falling below the poverty line.
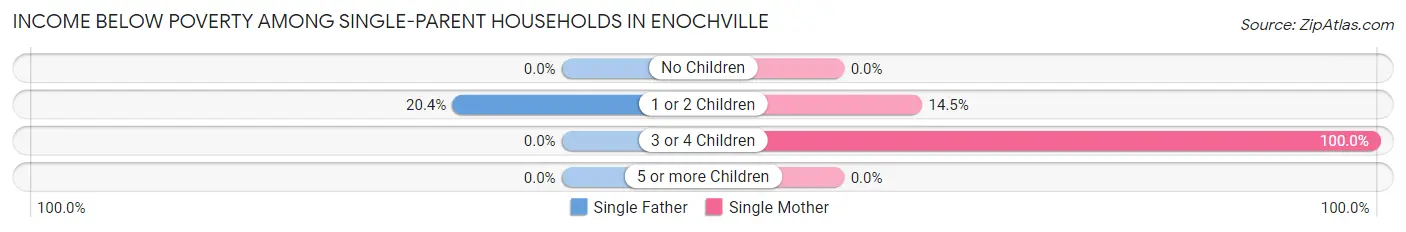
| Children | Single Father | Single Mother |
| No Children | 0 (0.0%) | 0 (0.0%) |
| 1 or 2 Children | 11 (20.4%) | 27 (14.5%) |
| 3 or 4 Children | 0 (0.0%) | 136 (100.0%) |
| 5 or more Children | 0 (0.0%) | 0 (0.0%) |
| Total | 11 (20.4%) | 163 (35.4%) |
Income Below Poverty Among Married-Couple vs Single-Parent Households in Enochville
The poverty data for Enochville shows that 14 of the married-couple family households (2.9%) and 174 of the single-parent households (33.8%) are living below the poverty level. Within the married-couple family households, those with 1 or 2 children have the highest poverty rate, with 14 households (15.2%) falling below the poverty line. Among the single-parent households, those with 3 or 4 children have the highest poverty rate, with 136 household (100.0%) living below poverty.
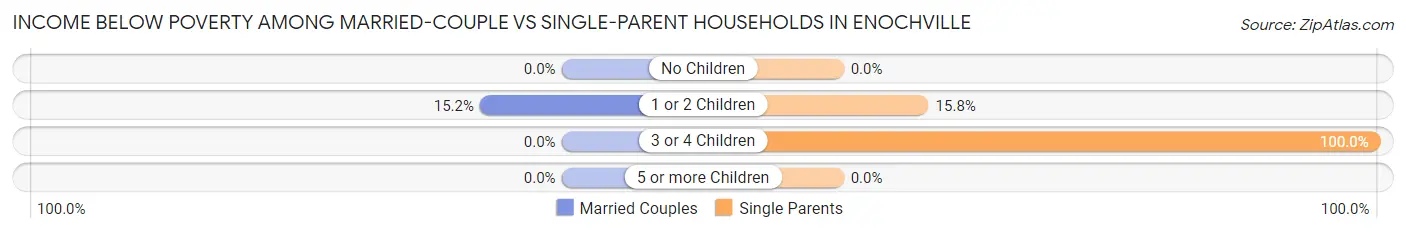
| Children | Married-Couple Families | Single-Parent Households |
| No Children | 0 (0.0%) | 0 (0.0%) |
| 1 or 2 Children | 14 (15.2%) | 38 (15.8%) |
| 3 or 4 Children | 0 (0.0%) | 136 (100.0%) |
| 5 or more Children | 0 (0.0%) | 0 (0.0%) |
| Total | 14 (2.9%) | 174 (33.8%) |
Race in Enochville
The most populous races in Enochville are White / Caucasian (2,785 | 80.8%), Black / African American (446 | 12.9%), and Hispanic or Latino (206 | 6.0%).
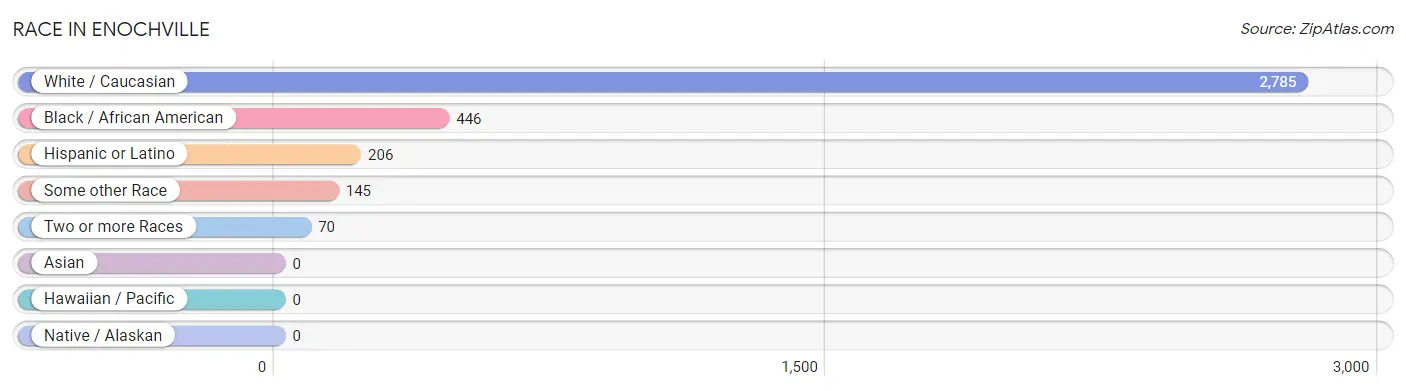
| Race | # Population | % Population |
| Asian | 0 | 0.0% |
| Black / African American | 446 | 12.9% |
| Hawaiian / Pacific | 0 | 0.0% |
| Hispanic or Latino | 206 | 6.0% |
| Native / Alaskan | 0 | 0.0% |
| White / Caucasian | 2,785 | 80.8% |
| Two or more Races | 70 | 2.0% |
| Some other Race | 145 | 4.2% |
| Total | 3,446 | 100.0% |
Ancestry in Enochville
The most populous ancestries reported in Enochville are American (431 | 12.5%), German (251 | 7.3%), Mexican (178 | 5.2%), Scottish (161 | 4.7%), and English (160 | 4.6%), together accounting for 34.3% of all Enochville residents.
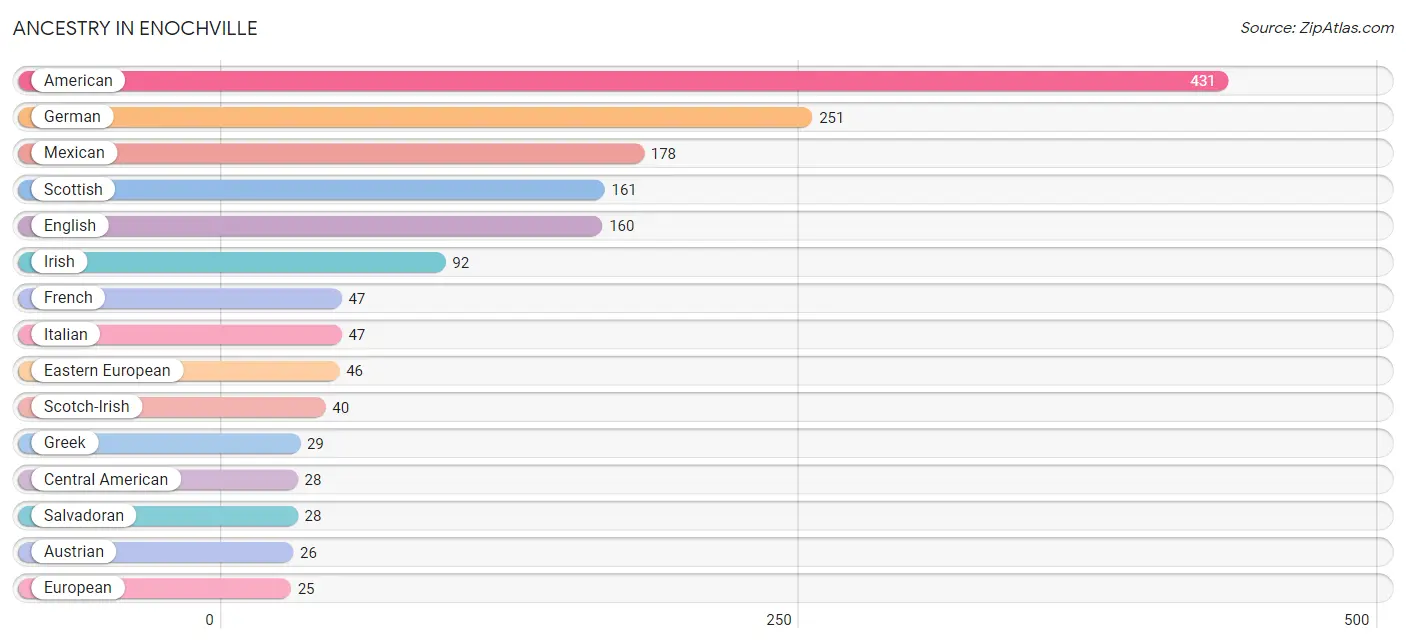
| Ancestry | # Population | % Population |
| African | 6 | 0.2% |
| American | 431 | 12.5% |
| Austrian | 26 | 0.7% |
| Canadian | 9 | 0.3% |
| Central American | 28 | 0.8% |
| Dutch | 24 | 0.7% |
| Eastern European | 46 | 1.3% |
| English | 160 | 4.6% |
| European | 25 | 0.7% |
| French | 47 | 1.4% |
| German | 251 | 7.3% |
| Greek | 29 | 0.8% |
| Irish | 92 | 2.7% |
| Italian | 47 | 1.4% |
| Lithuanian | 11 | 0.3% |
| Mexican | 178 | 5.2% |
| Polish | 6 | 0.2% |
| Salvadoran | 28 | 0.8% |
| Scotch-Irish | 40 | 1.2% |
| Scottish | 161 | 4.7% |
| Sioux | 2 | 0.1% |
| Slovak | 11 | 0.3% |
| Subsaharan African | 6 | 0.2% |
| Swedish | 6 | 0.2% |
| Welsh | 6 | 0.2% | View All 25 Rows |
Immigrants in Enochville
The most numerous immigrant groups reported in Enochville came from Central America (74 | 2.1%), Latin America (74 | 2.1%), Mexico (46 | 1.3%), El Salvador (28 | 0.8%), and Canada (9 | 0.3%), together accounting for 6.7% of all Enochville residents.
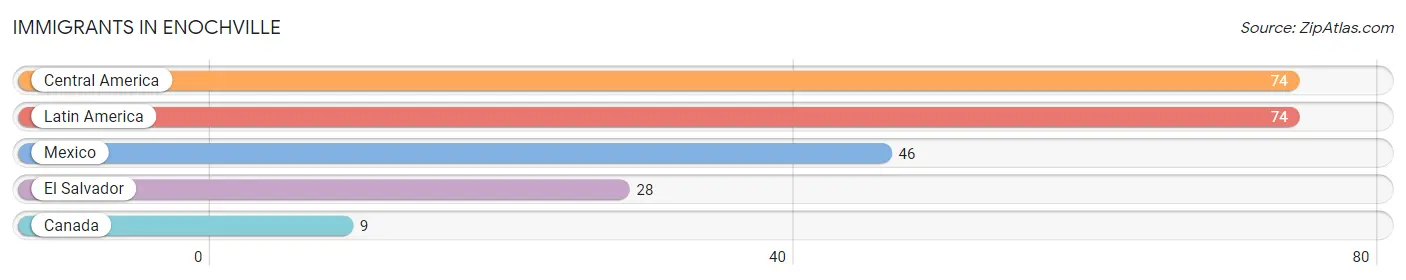
| Immigration Origin | # Population | % Population |
| Canada | 9 | 0.3% |
| Central America | 74 | 2.1% |
| El Salvador | 28 | 0.8% |
| Latin America | 74 | 2.1% |
| Mexico | 46 | 1.3% | View All 5 Rows |
Sex and Age in Enochville
Sex and Age in Enochville
The most populous age groups in Enochville are 35 to 39 Years (193 | 11.4%) for men and 40 to 44 Years (245 | 14.0%) for women.
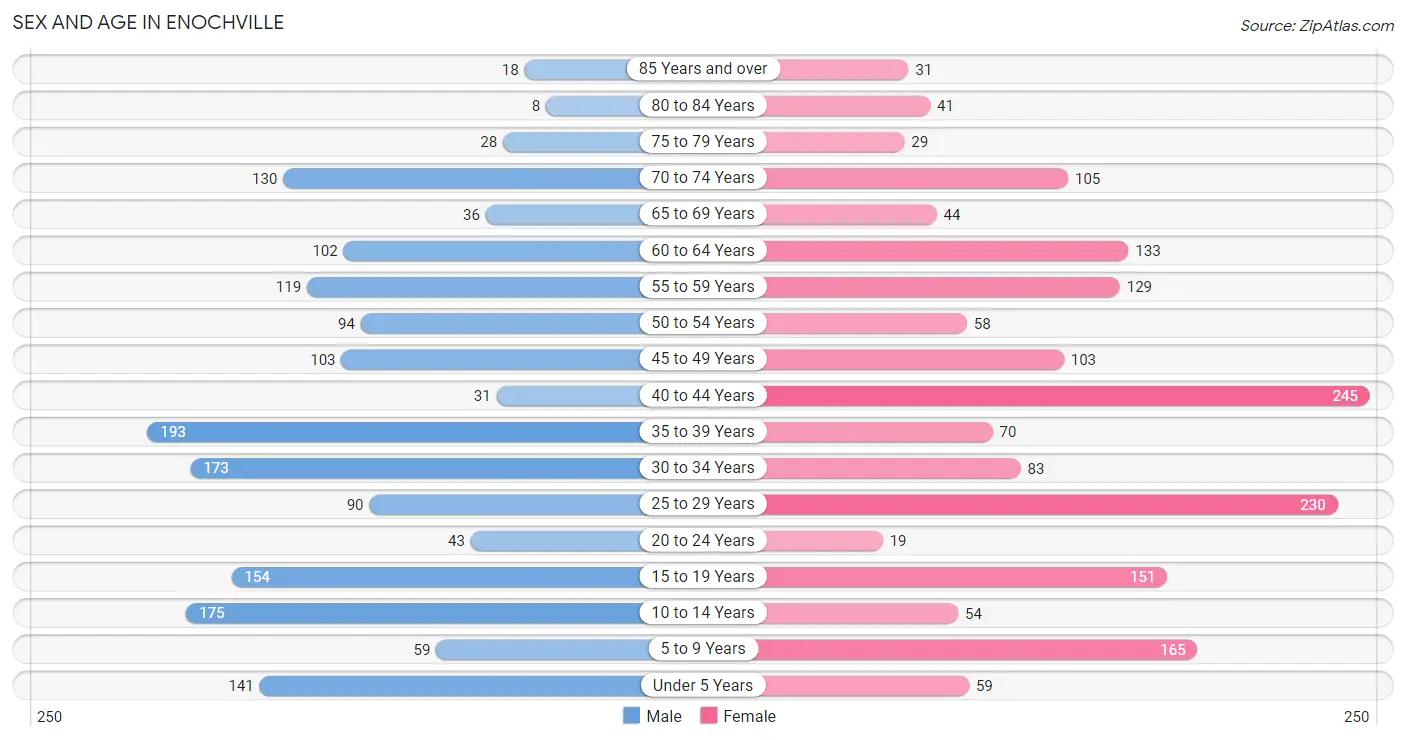
| Age Bracket | Male | Female |
| Under 5 Years | 141 (8.3%) | 59 (3.4%) |
| 5 to 9 Years | 59 (3.5%) | 165 (9.4%) |
| 10 to 14 Years | 175 (10.3%) | 54 (3.1%) |
| 15 to 19 Years | 154 (9.1%) | 151 (8.6%) |
| 20 to 24 Years | 43 (2.5%) | 19 (1.1%) |
| 25 to 29 Years | 90 (5.3%) | 230 (13.2%) |
| 30 to 34 Years | 173 (10.2%) | 83 (4.8%) |
| 35 to 39 Years | 193 (11.4%) | 70 (4.0%) |
| 40 to 44 Years | 31 (1.8%) | 245 (14.0%) |
| 45 to 49 Years | 103 (6.1%) | 103 (5.9%) |
| 50 to 54 Years | 94 (5.5%) | 58 (3.3%) |
| 55 to 59 Years | 119 (7.0%) | 129 (7.4%) |
| 60 to 64 Years | 102 (6.0%) | 133 (7.6%) |
| 65 to 69 Years | 36 (2.1%) | 44 (2.5%) |
| 70 to 74 Years | 130 (7.7%) | 105 (6.0%) |
| 75 to 79 Years | 28 (1.7%) | 29 (1.7%) |
| 80 to 84 Years | 8 (0.5%) | 41 (2.3%) |
| 85 Years and over | 18 (1.1%) | 31 (1.8%) |
| Total | 1,697 (100.0%) | 1,749 (100.0%) |
Families and Households in Enochville
Median Family Size in Enochville
The median family size in Enochville is 2.77 persons per family, with single male/father families (54 | 5.4%) accounting for the largest median family size of 3.06 persons per family. On the other hand, single female/mother families (461 | 46.1%) represent the smallest median family size with 2.56 persons per family.
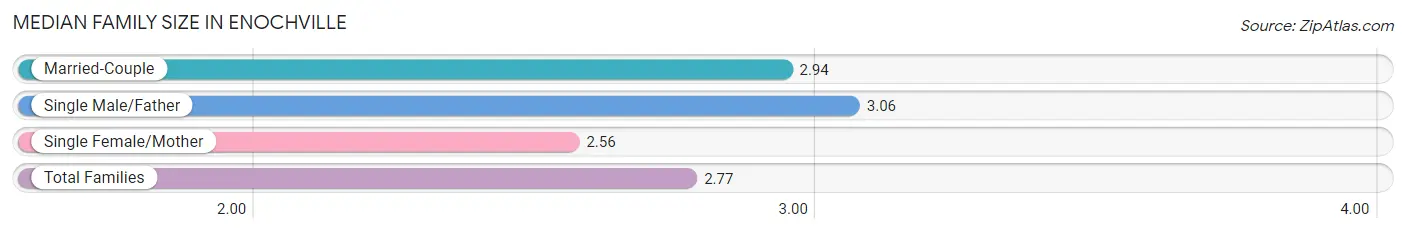
| Family Type | # Families | Family Size |
| Married-Couple | 485 (48.5%) | 2.94 |
| Single Male/Father | 54 (5.4%) | 3.06 |
| Single Female/Mother | 461 (46.1%) | 2.56 |
| Total Families | 1,000 (100.0%) | 2.77 |
Median Household Size in Enochville
The median household size in Enochville is 2.69 persons per household, with single male/father households (54 | 4.2%) accounting for the largest median household size of 3.44 persons per household. non-family households (282 | 22.0%) represent the smallest median household size with 1.13 persons per household.
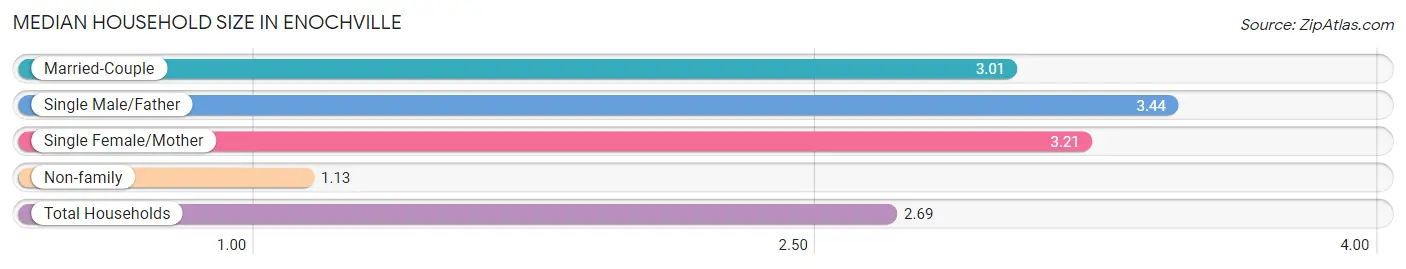
| Household Type | # Households | Household Size |
| Married-Couple | 485 (37.8%) | 3.01 |
| Single Male/Father | 54 (4.2%) | 3.44 |
| Single Female/Mother | 461 (36.0%) | 3.21 |
| Non-family | 282 (22.0%) | 1.13 |
| Total Households | 1,282 (100.0%) | 2.69 |
Household Size by Marriage Status in Enochville
Out of a total of 1,282 households in Enochville, 1,000 (78.0%) are family households, while 282 (22.0%) are nonfamily households. The most numerous type of family households are 2-person households, comprising 331, and the most common type of nonfamily households are 1-person households, comprising 246.
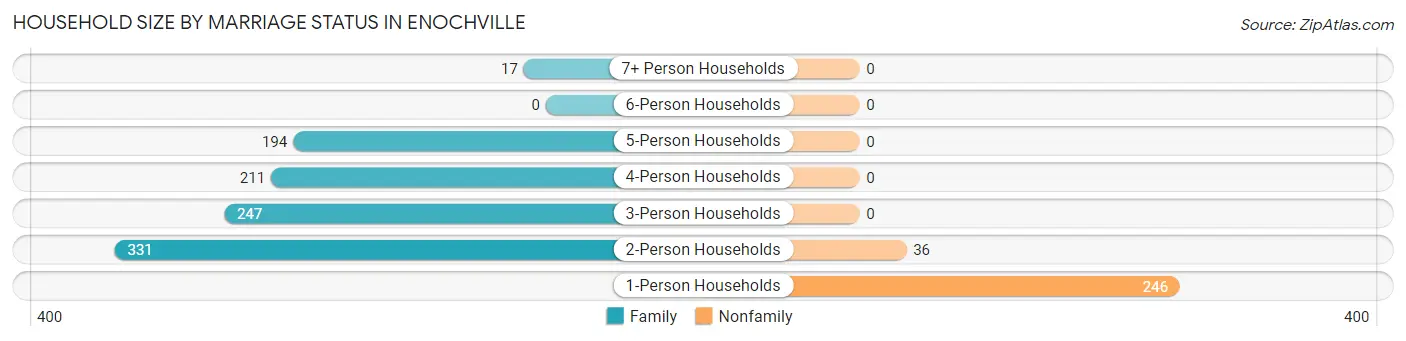
| Household Size | Family Households | Nonfamily Households |
| 1-Person Households | - | 246 (19.2%) |
| 2-Person Households | 331 (25.8%) | 36 (2.8%) |
| 3-Person Households | 247 (19.3%) | 0 (0.0%) |
| 4-Person Households | 211 (16.5%) | 0 (0.0%) |
| 5-Person Households | 194 (15.1%) | 0 (0.0%) |
| 6-Person Households | 0 (0.0%) | 0 (0.0%) |
| 7+ Person Households | 17 (1.3%) | 0 (0.0%) |
| Total | 1,000 (78.0%) | 282 (22.0%) |
Female Fertility in Enochville
Fertility by Age in Enochville
Average fertility rate in Enochville is 215.0 births per 1,000 women. Women in the age bracket of 20 to 34 years have the highest fertility rate with 590.0 births per 1,000 women. Women in the age bracket of 20 to 34 years acount for 100.0% of all women with births.
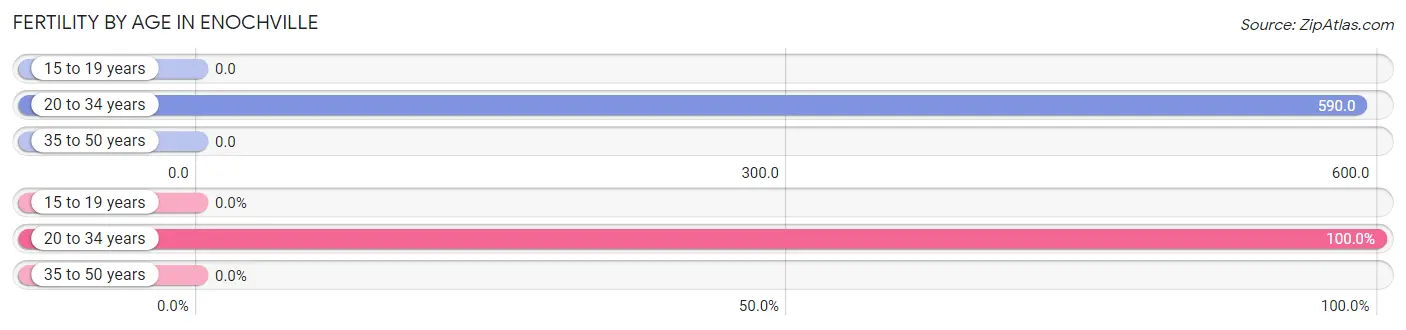
| Age Bracket | Women with Births | Births / 1,000 Women |
| 15 to 19 years | 0 (0.0%) | 0.0 |
| 20 to 34 years | 196 (100.0%) | 590.0 |
| 35 to 50 years | 0 (0.0%) | 0.0 |
| Total | 196 (100.0%) | 215.0 |
Fertility by Age by Marriage Status in Enochville
23.5% of women with births (196) in Enochville are married. The highest percentage of unmarried women with births falls into 20 to 34 years age bracket with 76.5% of them unmarried at the time of birth, while the lowest percentage of unmarried women with births belong to 20 to 34 years age bracket with 76.5% of them unmarried.
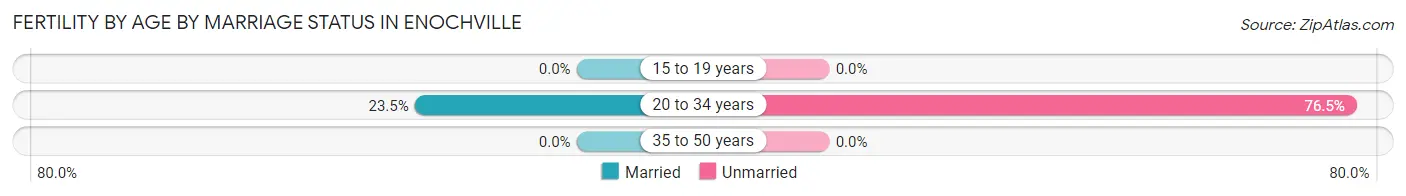
| Age Bracket | Married | Unmarried |
| 15 to 19 years | 0 (0.0%) | 0 (0.0%) |
| 20 to 34 years | 46 (23.5%) | 150 (76.5%) |
| 35 to 50 years | 0 (0.0%) | 0 (0.0%) |
| Total | 46 (23.5%) | 150 (76.5%) |
Fertility by Education in Enochville
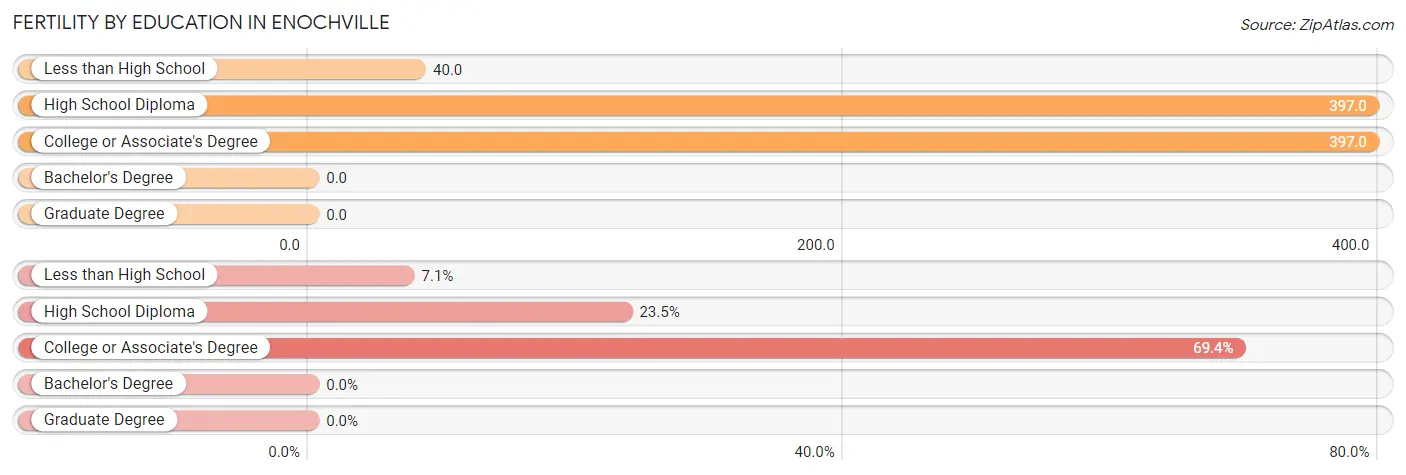
| Educational Attainment | Women with Births | Births / 1,000 Women |
| Less than High School | 14 (7.1%) | 40.0 |
| High School Diploma | 46 (23.5%) | 397.0 |
| College or Associate's Degree | 136 (69.4%) | 397.0 |
| Bachelor's Degree | 0 (0.0%) | 0.0 |
| Graduate Degree | 0 (0.0%) | 0.0 |
| Total | 196 (100.0%) | 215.0 |
Fertility by Education by Marriage Status in Enochville
76.5% of women with births in Enochville are unmarried. Women with the educational attainment of high school diploma are most likely to be married with 100.0% of them married at childbirth, while women with the educational attainment of less than high school are least likely to be married with 100.0% of them unmarried at childbirth.
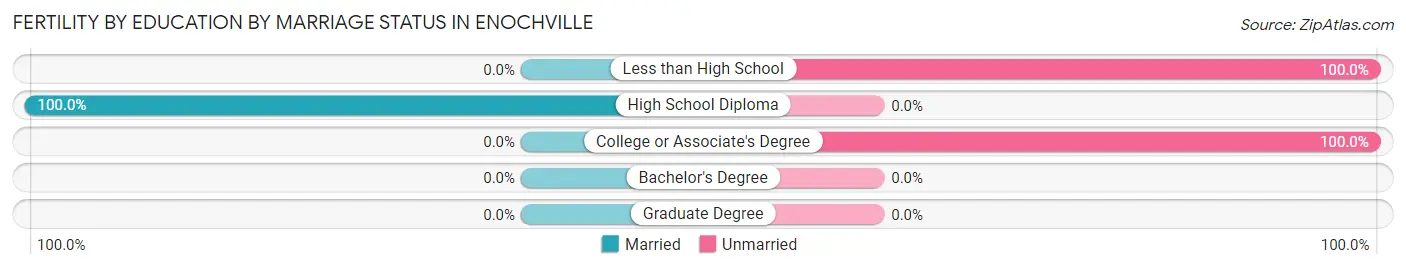
| Educational Attainment | Married | Unmarried |
| Less than High School | 0 (0.0%) | 14 (100.0%) |
| High School Diploma | 46 (100.0%) | 0 (0.0%) |
| College or Associate's Degree | 0 (0.0%) | 136 (100.0%) |
| Bachelor's Degree | 0 (0.0%) | 0 (0.0%) |
| Graduate Degree | 0 (0.0%) | 0 (0.0%) |
| Total | 46 (23.5%) | 150 (76.5%) |
Employment Characteristics in Enochville
Employment by Class of Employer in Enochville
Among the 1,396 employed individuals in Enochville, private company employees (1,051 | 75.3%), not-for-profit organizations (167 | 12.0%), and local government employees (109 | 7.8%) make up the most common classes of employment.
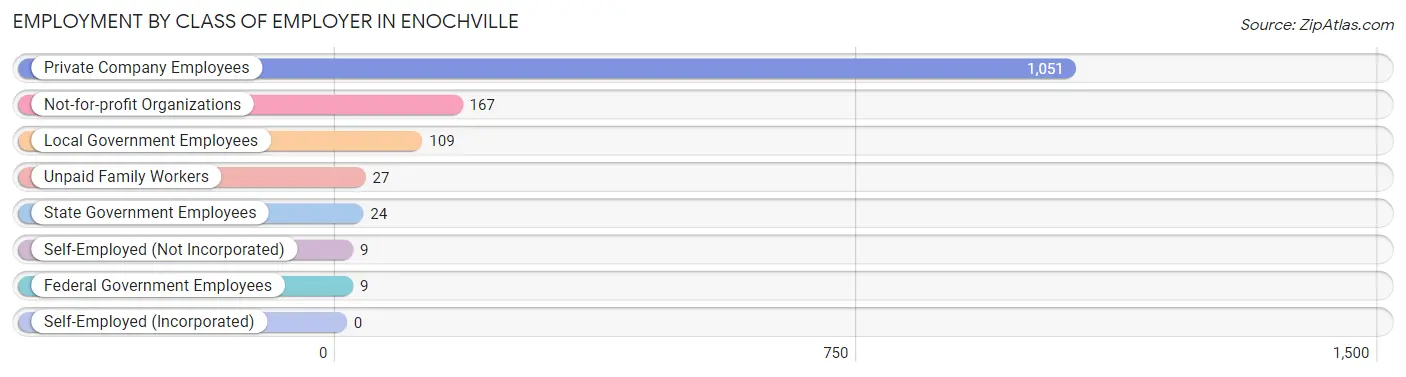
| Employer Class | # Employees | % Employees |
| Private Company Employees | 1,051 | 75.3% |
| Self-Employed (Incorporated) | 0 | 0.0% |
| Self-Employed (Not Incorporated) | 9 | 0.6% |
| Not-for-profit Organizations | 167 | 12.0% |
| Local Government Employees | 109 | 7.8% |
| State Government Employees | 24 | 1.7% |
| Federal Government Employees | 9 | 0.6% |
| Unpaid Family Workers | 27 | 1.9% |
| Total | 1,396 | 100.0% |
Employment Status by Age in Enochville
According to the labor force statistics for Enochville, out of the total population over 16 years of age (2,714), 56.6% or 1,536 individuals are in the labor force, with 7.5% or 115 of them unemployed. The age group with the highest labor force participation rate is 30 to 34 years, with 89.8% or 230 individuals in the labor force. Within the labor force, the 16 to 19 years age range has the highest percentage of unemployed individuals, with 74.4% or 116 of them being unemployed.
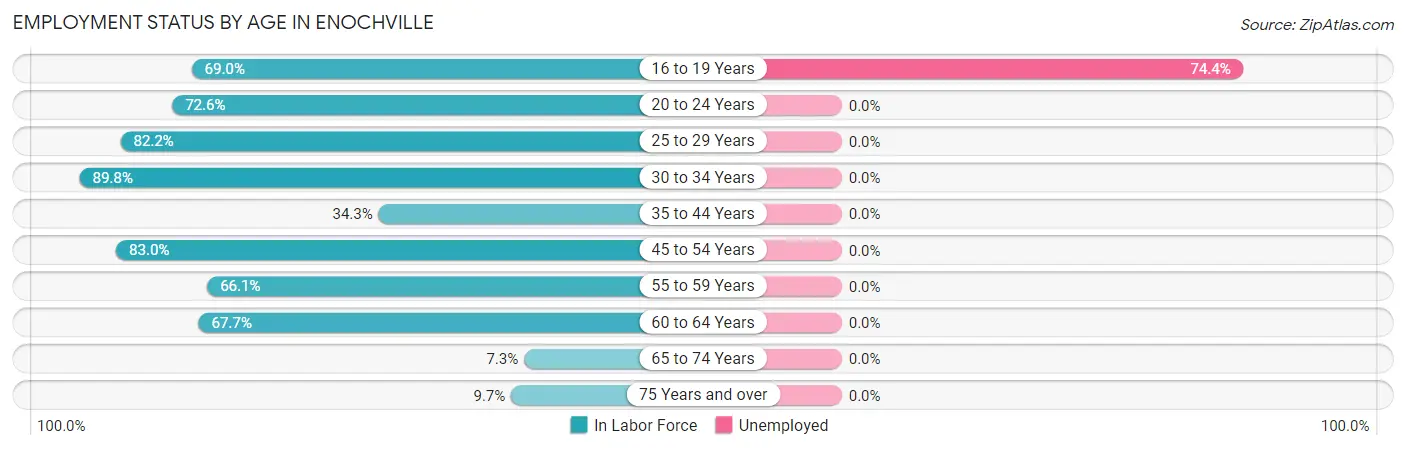
| Age Bracket | In Labor Force | Unemployed |
| 16 to 19 Years | 156 (69.0%) | 116 (74.4%) |
| 20 to 24 Years | 45 (72.6%) | 0 (0.0%) |
| 25 to 29 Years | 263 (82.2%) | 0 (0.0%) |
| 30 to 34 Years | 230 (89.8%) | 0 (0.0%) |
| 35 to 44 Years | 185 (34.3%) | 0 (0.0%) |
| 45 to 54 Years | 297 (83.0%) | 0 (0.0%) |
| 55 to 59 Years | 164 (66.1%) | 0 (0.0%) |
| 60 to 64 Years | 159 (67.7%) | 0 (0.0%) |
| 65 to 74 Years | 23 (7.3%) | 0 (0.0%) |
| 75 Years and over | 15 (9.7%) | 0 (0.0%) |
| Total | 1,536 (56.6%) | 115 (7.5%) |
Employment Status by Educational Attainment in Enochville
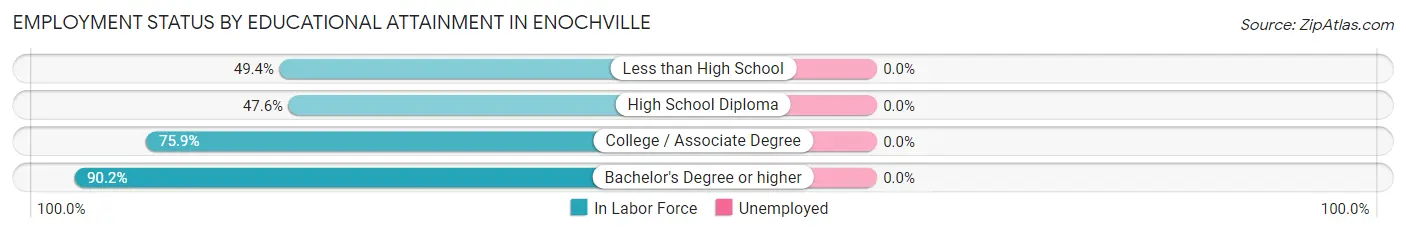
| Educational Attainment | In Labor Force | Unemployed |
| Less than High School | 298 (49.4%) | 0 (0.0%) |
| High School Diploma | 109 (47.6%) | 0 (0.0%) |
| College / Associate Degree | 652 (75.9%) | 0 (0.0%) |
| Bachelor's Degree or higher | 239 (90.2%) | 0 (0.0%) |
| Total | 1,299 (66.4%) | 0 (0.0%) |
Employment Occupations by Sex in Enochville
Management, Business, Science and Arts Occupations
The most common Management, Business, Science and Arts occupations in Enochville are Community & Social Service (131 | 9.2%), Health Diagnosing & Treating (119 | 8.4%), Health Technologists (119 | 8.4%), Education, Arts & Media (74 | 5.2%), and Management (59 | 4.2%).
Management, Business, Science and Arts Occupations by Sex
Within the Management, Business, Science and Arts occupations in Enochville, the most male-oriented occupations are Computers, Engineering & Science (100.0%), Computers & Mathematics (100.0%), and Architecture & Engineering (100.0%), while the most female-oriented occupations are Health Diagnosing & Treating (100.0%), Health Technologists (100.0%), and Education Instruction & Library (59.5%).
| Occupation | Male | Female |
| Management | 27 (45.8%) | 32 (54.2%) |
| Business & Financial | 6 (75.0%) | 2 (25.0%) |
| Computers, Engineering & Science | 35 (100.0%) | 0 (0.0%) |
| Computers & Mathematics | 20 (100.0%) | 0 (0.0%) |
| Architecture & Engineering | 15 (100.0%) | 0 (0.0%) |
| Life, Physical & Social Science | 0 (0.0%) | 0 (0.0%) |
| Community & Social Service | 96 (73.3%) | 35 (26.7%) |
| Education, Arts & Media | 61 (82.4%) | 13 (17.6%) |
| Legal Services & Support | 0 (0.0%) | 0 (0.0%) |
| Education Instruction & Library | 15 (40.5%) | 22 (59.5%) |
| Arts, Media & Entertainment | 20 (100.0%) | 0 (0.0%) |
| Health Diagnosing & Treating | 0 (0.0%) | 119 (100.0%) |
| Health Technologists | 0 (0.0%) | 119 (100.0%) |
| Total (Category) | 164 (46.6%) | 188 (53.4%) |
| Total (Overall) | 681 (47.9%) | 740 (52.1%) |
Services Occupations
The most common Services occupations in Enochville are Cleaning & Maintenance (104 | 7.3%), Food Preparation & Serving (76 | 5.3%), Security & Protection (65 | 4.6%), Healthcare Support (64 | 4.5%), and Law Enforcement (47 | 3.3%).
Services Occupations by Sex
Within the Services occupations in Enochville, the most male-oriented occupations are Firefighting & Prevention (100.0%), Cleaning & Maintenance (73.1%), and Security & Protection (64.6%), while the most female-oriented occupations are Healthcare Support (100.0%), Law Enforcement (48.9%), and Food Preparation & Serving (38.2%).
| Occupation | Male | Female |
| Healthcare Support | 0 (0.0%) | 64 (100.0%) |
| Security & Protection | 42 (64.6%) | 23 (35.4%) |
| Firefighting & Prevention | 18 (100.0%) | 0 (0.0%) |
| Law Enforcement | 24 (51.1%) | 23 (48.9%) |
| Food Preparation & Serving | 47 (61.8%) | 29 (38.2%) |
| Cleaning & Maintenance | 76 (73.1%) | 28 (26.9%) |
| Personal Care & Service | 0 (0.0%) | 0 (0.0%) |
| Total (Category) | 165 (53.4%) | 144 (46.6%) |
| Total (Overall) | 681 (47.9%) | 740 (52.1%) |
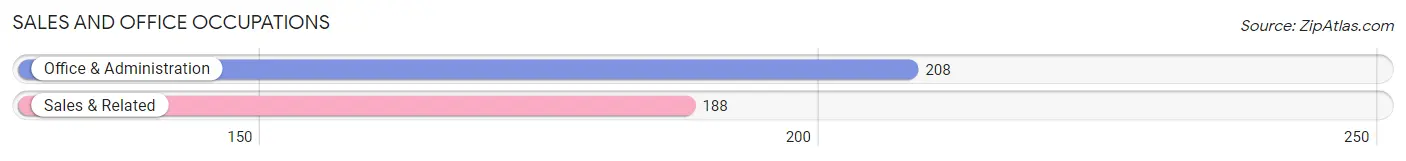
Sales and Office Occupations
The most common Sales and Office occupations in Enochville are Office & Administration (208 | 14.6%), and Sales & Related (188 | 13.2%).
Sales and Office Occupations by Sex
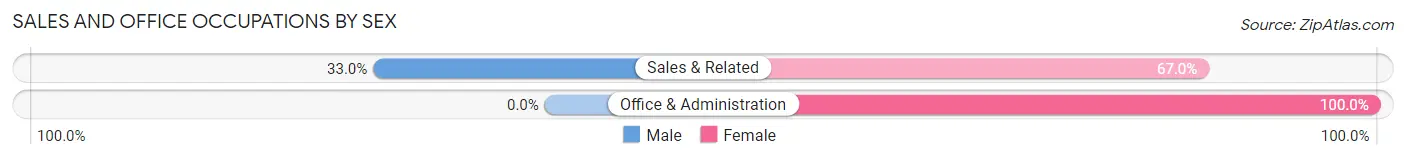
| Occupation | Male | Female |
| Sales & Related | 62 (33.0%) | 126 (67.0%) |
| Office & Administration | 0 (0.0%) | 208 (100.0%) |
| Total (Category) | 62 (15.7%) | 334 (84.3%) |
| Total (Overall) | 681 (47.9%) | 740 (52.1%) |
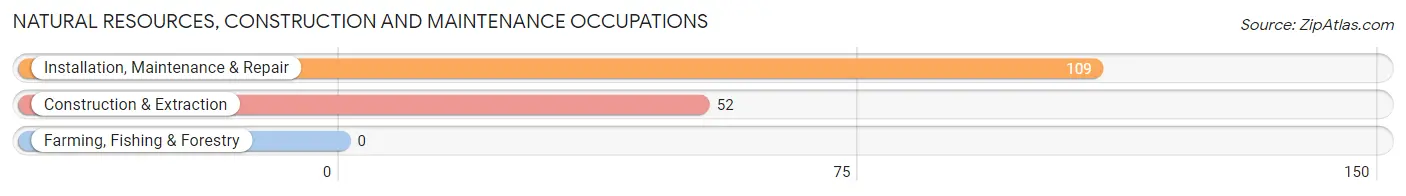
Natural Resources, Construction and Maintenance Occupations
The most common Natural Resources, Construction and Maintenance occupations in Enochville are Installation, Maintenance & Repair (109 | 7.7%), and Construction & Extraction (52 | 3.7%).
Natural Resources, Construction and Maintenance Occupations by Sex
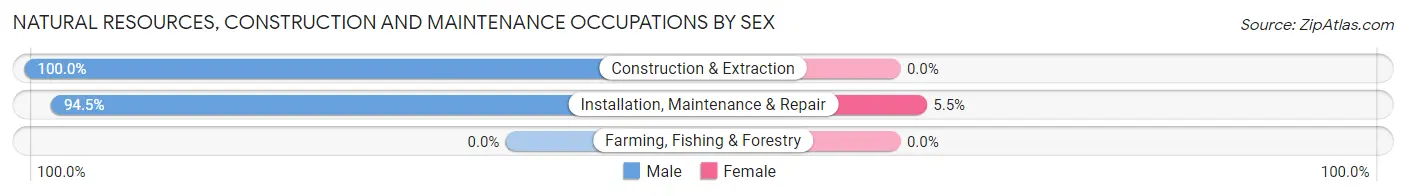
| Occupation | Male | Female |
| Farming, Fishing & Forestry | 0 (0.0%) | 0 (0.0%) |
| Construction & Extraction | 52 (100.0%) | 0 (0.0%) |
| Installation, Maintenance & Repair | 103 (94.5%) | 6 (5.5%) |
| Total (Category) | 155 (96.3%) | 6 (3.7%) |
| Total (Overall) | 681 (47.9%) | 740 (52.1%) |
Production, Transportation and Moving Occupations
The most common Production, Transportation and Moving occupations in Enochville are Material Moving (110 | 7.7%), Production (91 | 6.4%), and Transportation (2 | 0.1%).
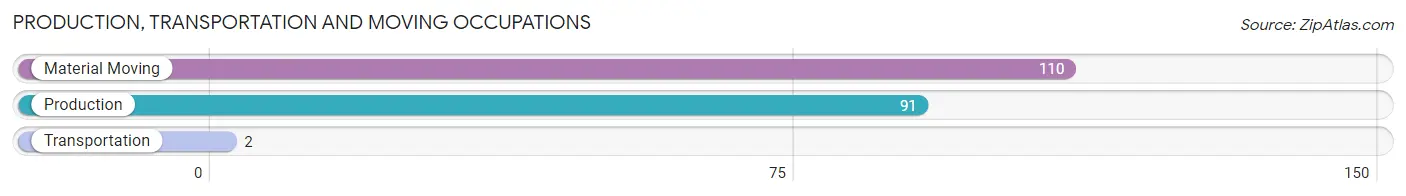
Production, Transportation and Moving Occupations by Sex
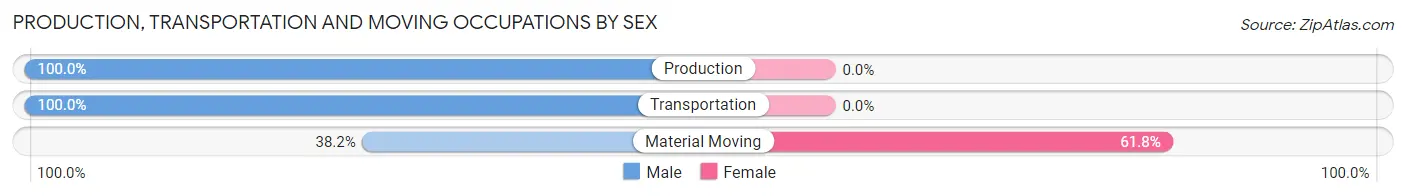
| Occupation | Male | Female |
| Production | 91 (100.0%) | 0 (0.0%) |
| Transportation | 2 (100.0%) | 0 (0.0%) |
| Material Moving | 42 (38.2%) | 68 (61.8%) |
| Total (Category) | 135 (66.5%) | 68 (33.5%) |
| Total (Overall) | 681 (47.9%) | 740 (52.1%) |
Employment Industries by Sex in Enochville
Employment Industries in Enochville
The major employment industries in Enochville include Health Care & Social Assistance (282 | 19.9%), Retail Trade (209 | 14.7%), Manufacturing (142 | 10.0%), Finance & Insurance (142 | 10.0%), and Construction (121 | 8.5%).
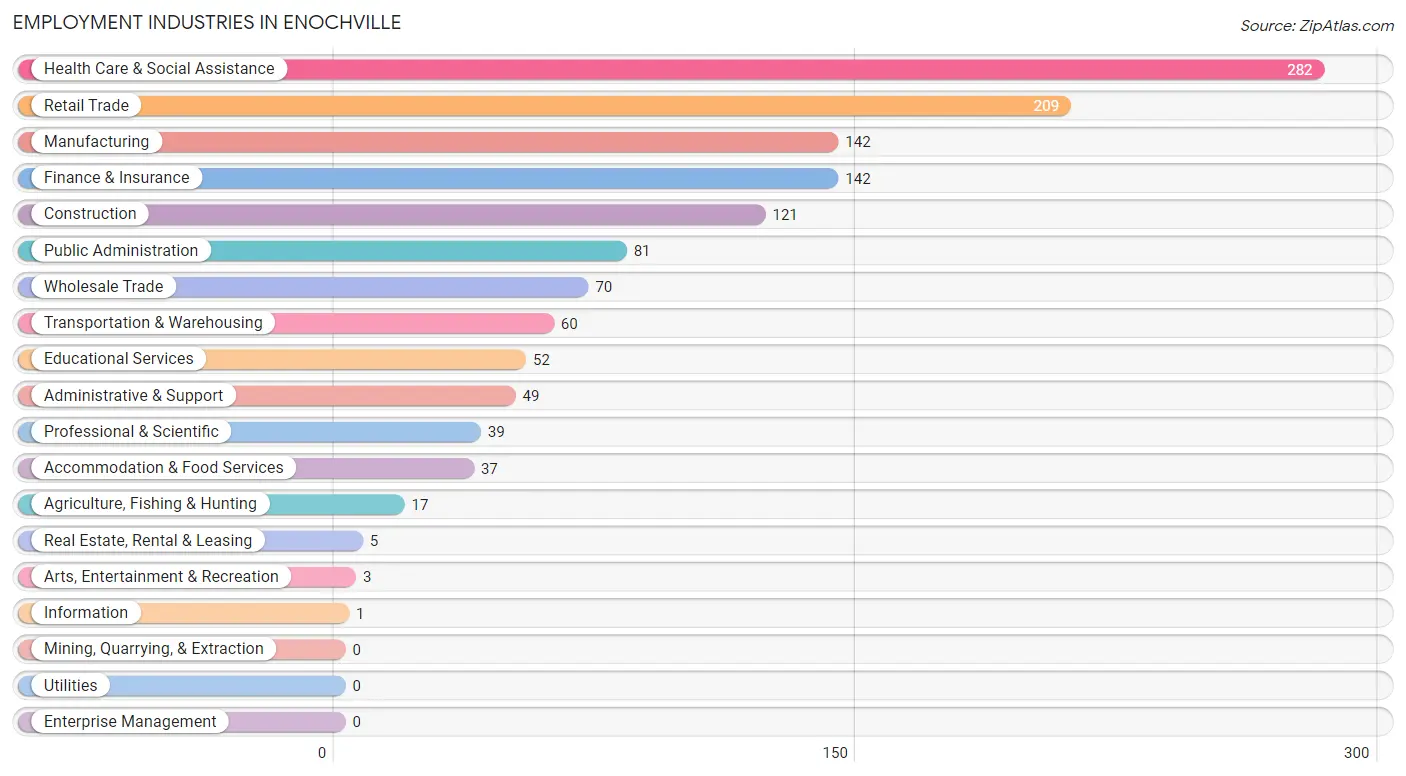
Employment Industries by Sex in Enochville
The Enochville industries that see more men than women are Agriculture, Fishing & Hunting (100.0%), Construction (100.0%), and Information (100.0%), whereas the industries that tend to have a higher number of women are Real Estate, Rental & Leasing (100.0%), Finance & Insurance (95.8%), and Health Care & Social Assistance (78.4%).
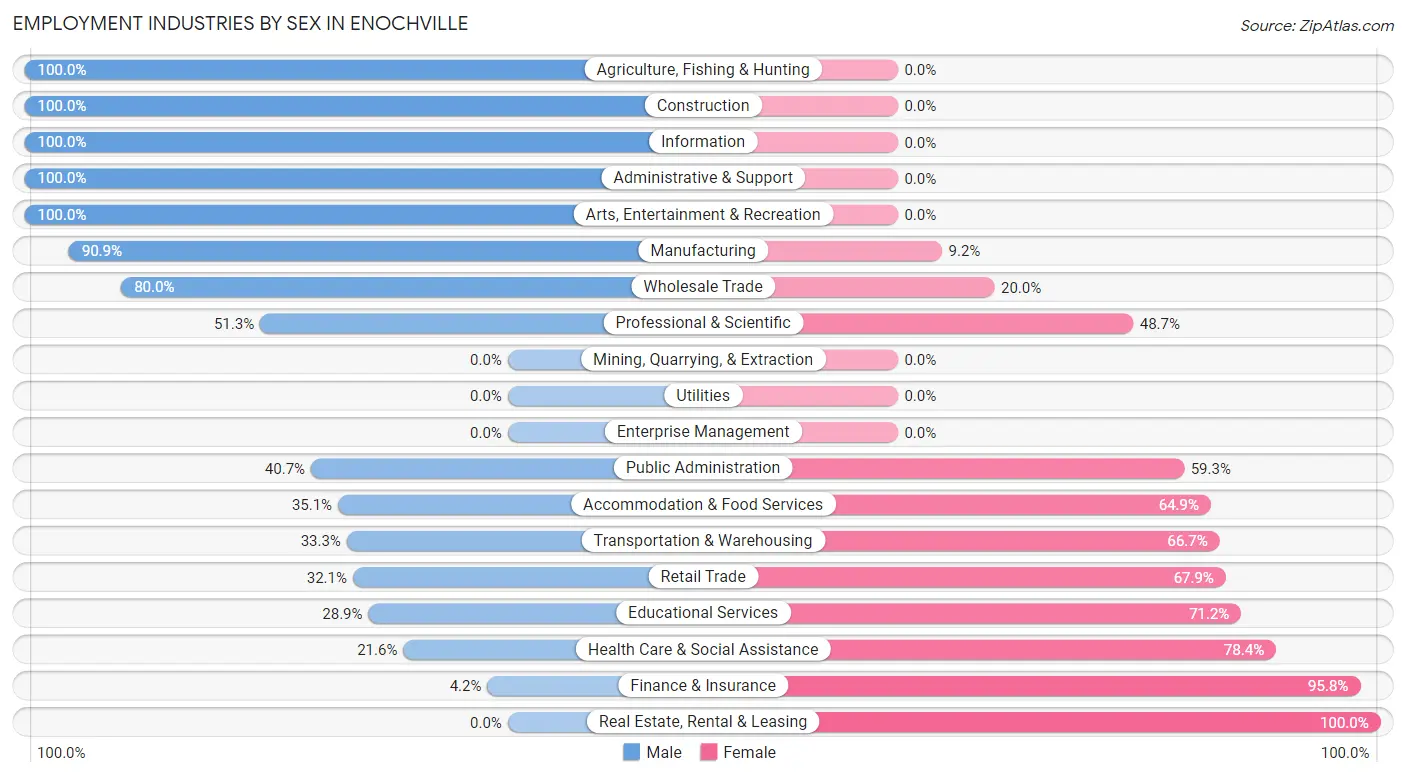
| Industry | Male | Female |
| Agriculture, Fishing & Hunting | 17 (100.0%) | 0 (0.0%) |
| Mining, Quarrying, & Extraction | 0 (0.0%) | 0 (0.0%) |
| Construction | 121 (100.0%) | 0 (0.0%) |
| Manufacturing | 129 (90.8%) | 13 (9.1%) |
| Wholesale Trade | 56 (80.0%) | 14 (20.0%) |
| Retail Trade | 67 (32.1%) | 142 (67.9%) |
| Transportation & Warehousing | 20 (33.3%) | 40 (66.7%) |
| Utilities | 0 (0.0%) | 0 (0.0%) |
| Information | 1 (100.0%) | 0 (0.0%) |
| Finance & Insurance | 6 (4.2%) | 136 (95.8%) |
| Real Estate, Rental & Leasing | 0 (0.0%) | 5 (100.0%) |
| Professional & Scientific | 20 (51.3%) | 19 (48.7%) |
| Enterprise Management | 0 (0.0%) | 0 (0.0%) |
| Administrative & Support | 49 (100.0%) | 0 (0.0%) |
| Educational Services | 15 (28.8%) | 37 (71.2%) |
| Health Care & Social Assistance | 61 (21.6%) | 221 (78.4%) |
| Arts, Entertainment & Recreation | 3 (100.0%) | 0 (0.0%) |
| Accommodation & Food Services | 13 (35.1%) | 24 (64.9%) |
| Public Administration | 33 (40.7%) | 48 (59.3%) |
| Total | 681 (47.9%) | 740 (52.1%) |
Education in Enochville
School Enrollment in Enochville
The most common levels of schooling among the 821 students in Enochville are high school (327 | 39.8%), elementary school (210 | 25.6%), and middle school (130 | 15.8%).
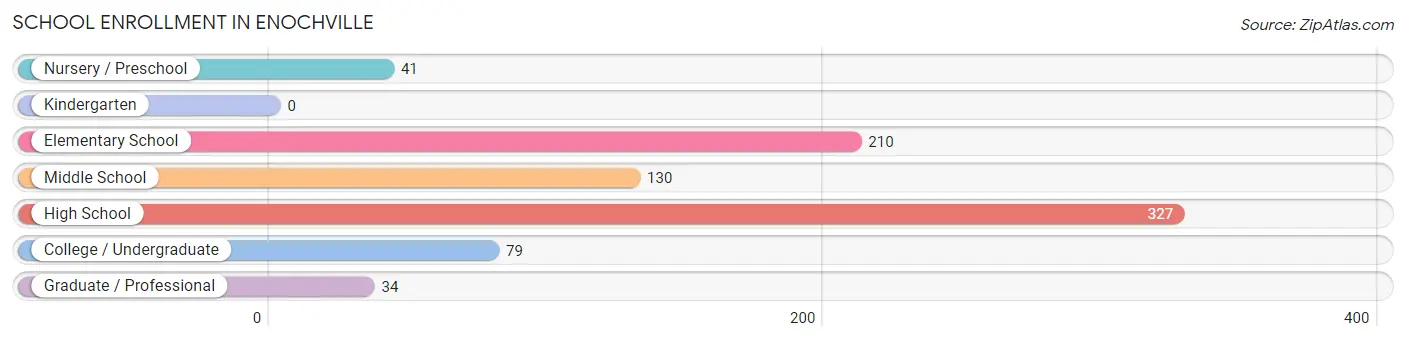
| School Level | # Students | % Students |
| Nursery / Preschool | 41 | 5.0% |
| Kindergarten | 0 | 0.0% |
| Elementary School | 210 | 25.6% |
| Middle School | 130 | 15.8% |
| High School | 327 | 39.8% |
| College / Undergraduate | 79 | 9.6% |
| Graduate / Professional | 34 | 4.1% |
| Total | 821 | 100.0% |
School Enrollment by Age by Funding Source in Enochville
Out of a total of 821 students who are enrolled in schools in Enochville, 93 (11.3%) attend a private institution, while the remaining 728 (88.7%) are enrolled in public schools. The age group of 35 years and over has the highest likelihood of being enrolled in private schools, with 41 (100.0% in the age bracket) enrolled. Conversely, the age group of 10 to 14 year olds has the lowest likelihood of being enrolled in a private school, with 229 (100.0% in the age bracket) attending a public institution.
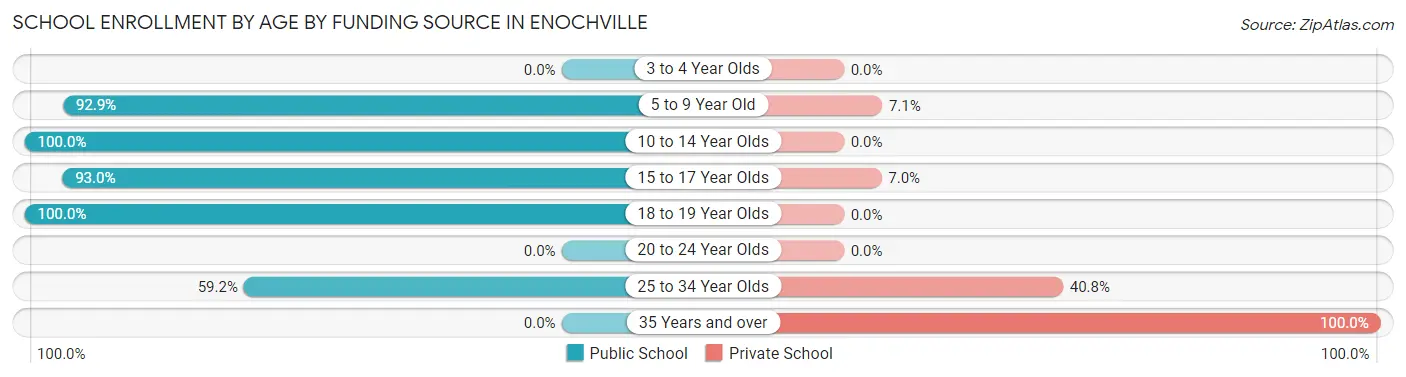
| Age Bracket | Public School | Private School |
| 3 to 4 Year Olds | 0 (0.0%) | 0 (0.0%) |
| 5 to 9 Year Old | 208 (92.9%) | 16 (7.1%) |
| 10 to 14 Year Olds | 229 (100.0%) | 0 (0.0%) |
| 15 to 17 Year Olds | 212 (93.0%) | 16 (7.0%) |
| 18 to 19 Year Olds | 50 (100.0%) | 0 (0.0%) |
| 20 to 24 Year Olds | 0 (0.0%) | 0 (0.0%) |
| 25 to 34 Year Olds | 29 (59.2%) | 20 (40.8%) |
| 35 Years and over | 0 (0.0%) | 41 (100.0%) |
| Total | 728 (88.7%) | 93 (11.3%) |
Educational Attainment by Field of Study in Enochville
Liberal arts & history (84 | 26.3%), science & technology (83 | 25.9%), business (37 | 11.6%), bio, nature & agricultural (28 | 8.7%), and communications (25 | 7.8%) are the most common fields of study among 320 individuals in Enochville who have obtained a bachelor's degree or higher.
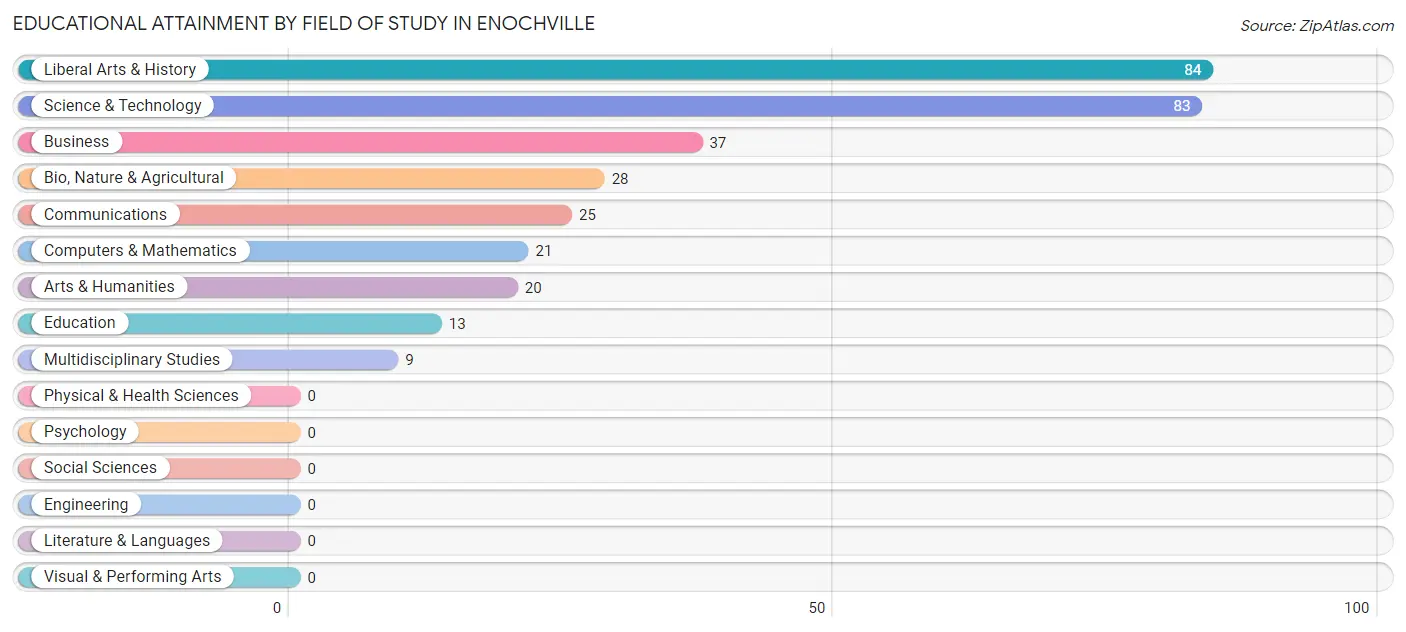
| Field of Study | # Graduates | % Graduates |
| Computers & Mathematics | 21 | 6.6% |
| Bio, Nature & Agricultural | 28 | 8.7% |
| Physical & Health Sciences | 0 | 0.0% |
| Psychology | 0 | 0.0% |
| Social Sciences | 0 | 0.0% |
| Engineering | 0 | 0.0% |
| Multidisciplinary Studies | 9 | 2.8% |
| Science & Technology | 83 | 25.9% |
| Business | 37 | 11.6% |
| Education | 13 | 4.1% |
| Literature & Languages | 0 | 0.0% |
| Liberal Arts & History | 84 | 26.3% |
| Visual & Performing Arts | 0 | 0.0% |
| Communications | 25 | 7.8% |
| Arts & Humanities | 20 | 6.2% |
| Total | 320 | 100.0% |
Transportation & Commute in Enochville
Vehicle Availability by Sex in Enochville
The most prevalent vehicle ownership categories in Enochville are males with 3 vehicles (287, accounting for 43.3%) and females with 3 vehicles (355, making up 39.2%).
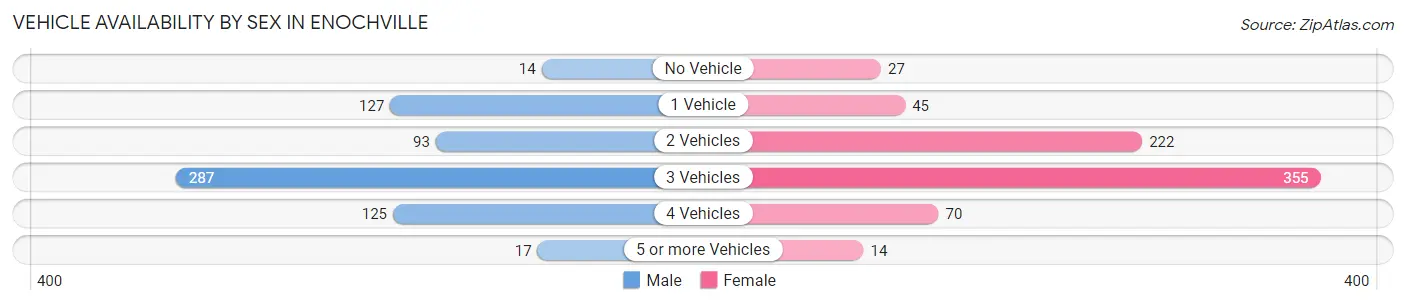
| Vehicles Available | Male | Female |
| No Vehicle | 14 (2.1%) | 27 (3.7%) |
| 1 Vehicle | 127 (19.2%) | 45 (6.1%) |
| 2 Vehicles | 93 (14.0%) | 222 (30.3%) |
| 3 Vehicles | 287 (43.3%) | 355 (48.4%) |
| 4 Vehicles | 125 (18.9%) | 70 (9.6%) |
| 5 or more Vehicles | 17 (2.6%) | 14 (1.9%) |
| Total | 663 (100.0%) | 733 (100.0%) |
Commute Time in Enochville
The most frequently occuring commute durations in Enochville are 20 to 24 minutes (382 commuters, 32.9%), 30 to 34 minutes (189 commuters, 16.3%), and 10 to 14 minutes (148 commuters, 12.8%).
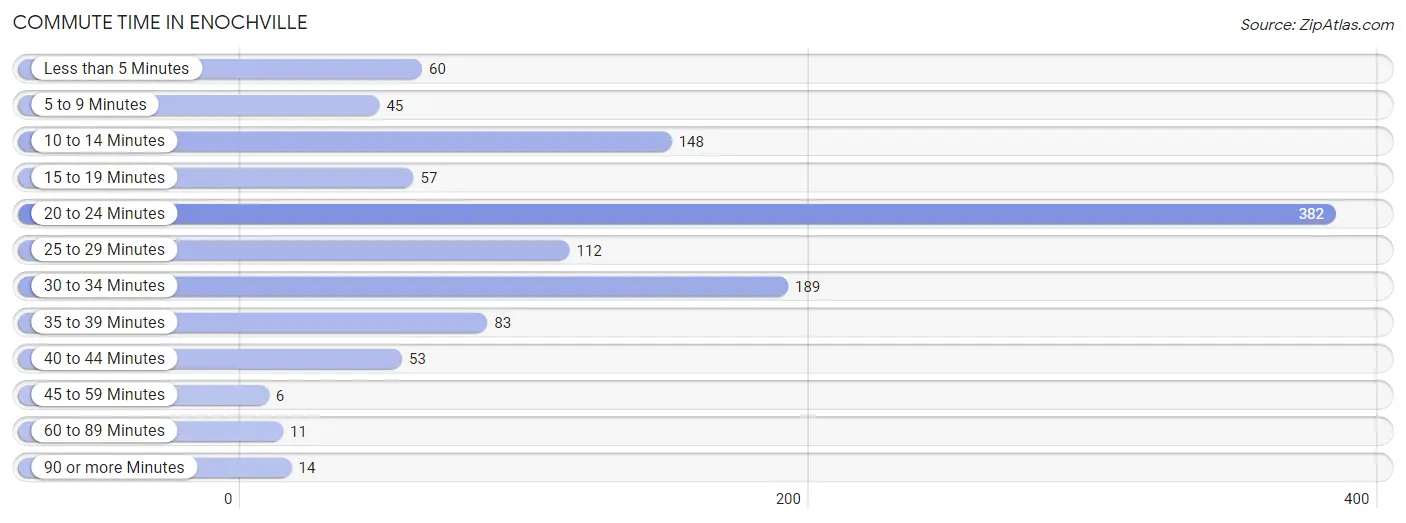
| Commute Time | # Commuters | % Commuters |
| Less than 5 Minutes | 60 | 5.2% |
| 5 to 9 Minutes | 45 | 3.9% |
| 10 to 14 Minutes | 148 | 12.8% |
| 15 to 19 Minutes | 57 | 4.9% |
| 20 to 24 Minutes | 382 | 32.9% |
| 25 to 29 Minutes | 112 | 9.7% |
| 30 to 34 Minutes | 189 | 16.3% |
| 35 to 39 Minutes | 83 | 7.2% |
| 40 to 44 Minutes | 53 | 4.6% |
| 45 to 59 Minutes | 6 | 0.5% |
| 60 to 89 Minutes | 11 | 0.9% |
| 90 or more Minutes | 14 | 1.2% |
Commute Time by Sex in Enochville
The most common commute times in Enochville are 20 to 24 minutes (145 commuters, 23.5%) for males and 20 to 24 minutes (237 commuters, 43.6%) for females.
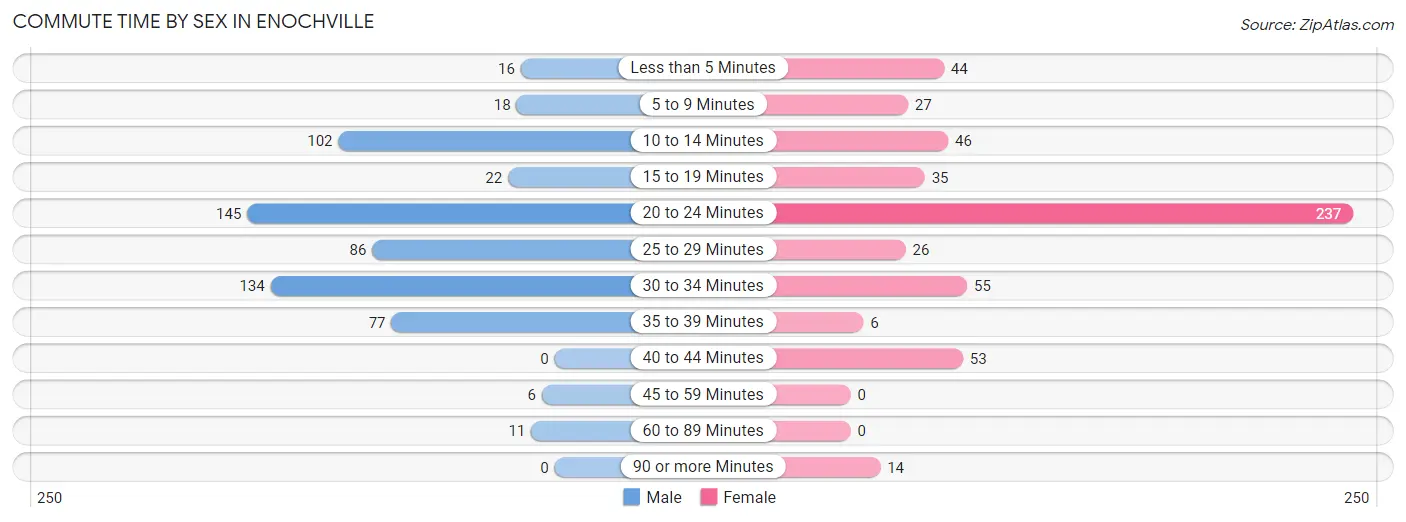
| Commute Time | Male | Female |
| Less than 5 Minutes | 16 (2.6%) | 44 (8.1%) |
| 5 to 9 Minutes | 18 (2.9%) | 27 (5.0%) |
| 10 to 14 Minutes | 102 (16.5%) | 46 (8.5%) |
| 15 to 19 Minutes | 22 (3.6%) | 35 (6.5%) |
| 20 to 24 Minutes | 145 (23.5%) | 237 (43.6%) |
| 25 to 29 Minutes | 86 (13.9%) | 26 (4.8%) |
| 30 to 34 Minutes | 134 (21.7%) | 55 (10.1%) |
| 35 to 39 Minutes | 77 (12.5%) | 6 (1.1%) |
| 40 to 44 Minutes | 0 (0.0%) | 53 (9.8%) |
| 45 to 59 Minutes | 6 (1.0%) | 0 (0.0%) |
| 60 to 89 Minutes | 11 (1.8%) | 0 (0.0%) |
| 90 or more Minutes | 0 (0.0%) | 14 (2.6%) |
Time of Departure to Work by Sex in Enochville
The most frequent times of departure to work in Enochville are 6:00 AM to 6:29 AM (158, 25.6%) for males and 7:00 AM to 7:29 AM (190, 35.0%) for females.
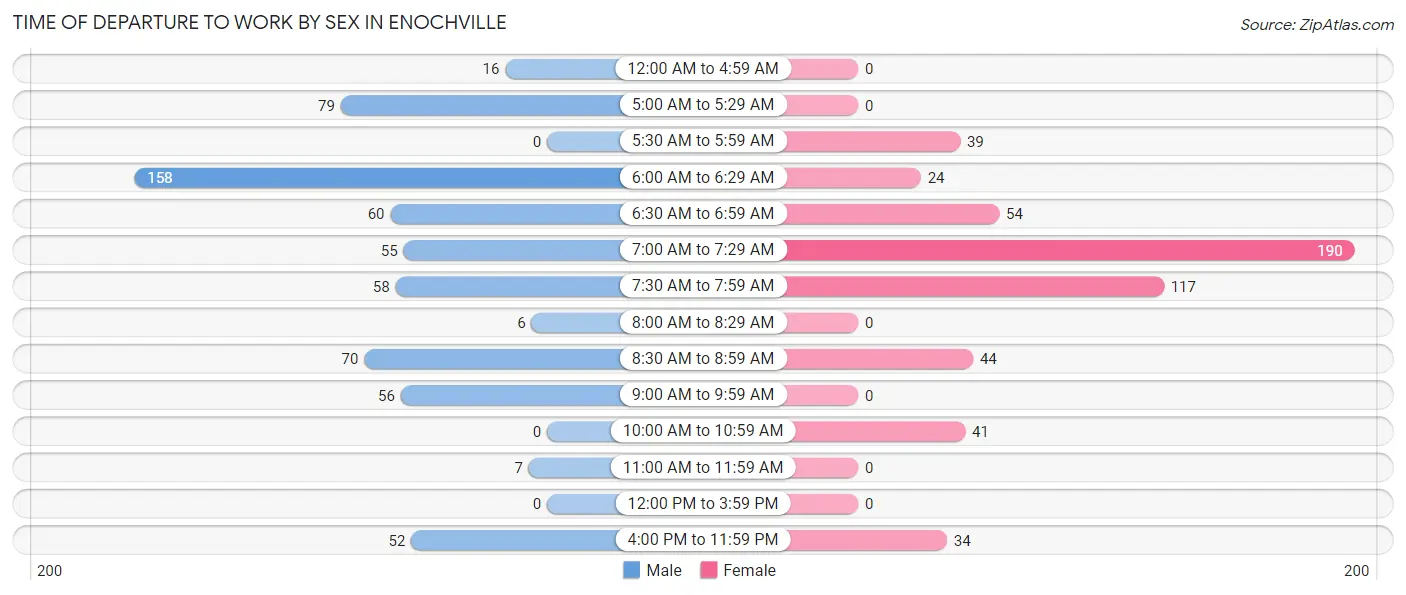
| Time of Departure | Male | Female |
| 12:00 AM to 4:59 AM | 16 (2.6%) | 0 (0.0%) |
| 5:00 AM to 5:29 AM | 79 (12.8%) | 0 (0.0%) |
| 5:30 AM to 5:59 AM | 0 (0.0%) | 39 (7.2%) |
| 6:00 AM to 6:29 AM | 158 (25.6%) | 24 (4.4%) |
| 6:30 AM to 6:59 AM | 60 (9.7%) | 54 (9.9%) |
| 7:00 AM to 7:29 AM | 55 (8.9%) | 190 (35.0%) |
| 7:30 AM to 7:59 AM | 58 (9.4%) | 117 (21.5%) |
| 8:00 AM to 8:29 AM | 6 (1.0%) | 0 (0.0%) |
| 8:30 AM to 8:59 AM | 70 (11.4%) | 44 (8.1%) |
| 9:00 AM to 9:59 AM | 56 (9.1%) | 0 (0.0%) |
| 10:00 AM to 10:59 AM | 0 (0.0%) | 41 (7.5%) |
| 11:00 AM to 11:59 AM | 7 (1.1%) | 0 (0.0%) |
| 12:00 PM to 3:59 PM | 0 (0.0%) | 0 (0.0%) |
| 4:00 PM to 11:59 PM | 52 (8.4%) | 34 (6.3%) |
| Total | 617 (100.0%) | 543 (100.0%) |
Housing Occupancy in Enochville
Occupancy by Ownership in Enochville
Of the total 1,282 dwellings in Enochville, owner-occupied units account for 745 (58.1%), while renter-occupied units make up 537 (41.9%).
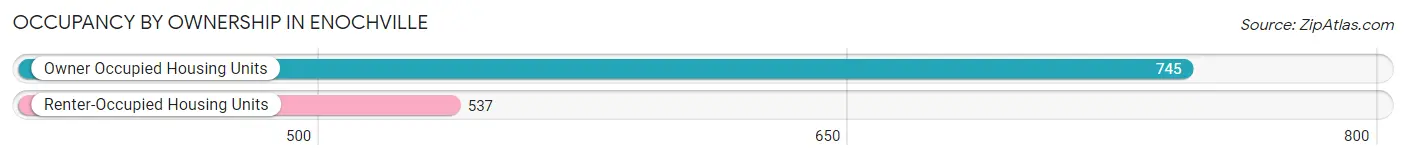
| Occupancy | # Housing Units | % Housing Units |
| Owner Occupied Housing Units | 745 | 58.1% |
| Renter-Occupied Housing Units | 537 | 41.9% |
| Total Occupied Housing Units | 1,282 | 100.0% |
Occupancy by Household Size in Enochville
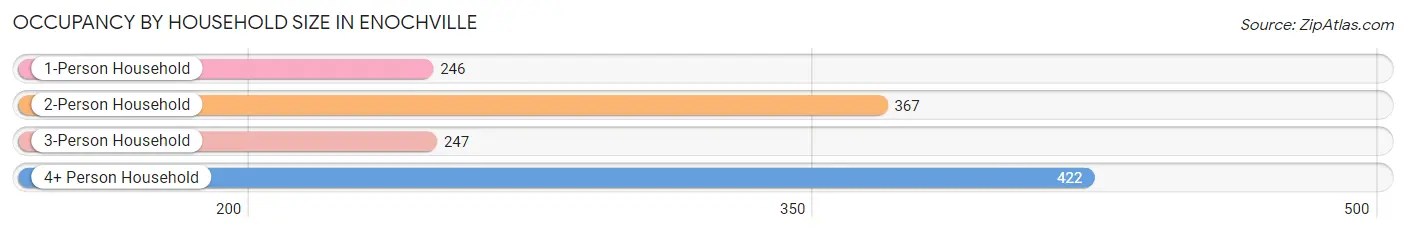
| Household Size | # Housing Units | % Housing Units |
| 1-Person Household | 246 | 19.2% |
| 2-Person Household | 367 | 28.6% |
| 3-Person Household | 247 | 19.3% |
| 4+ Person Household | 422 | 32.9% |
| Total Housing Units | 1,282 | 100.0% |
Occupancy by Ownership by Household Size in Enochville
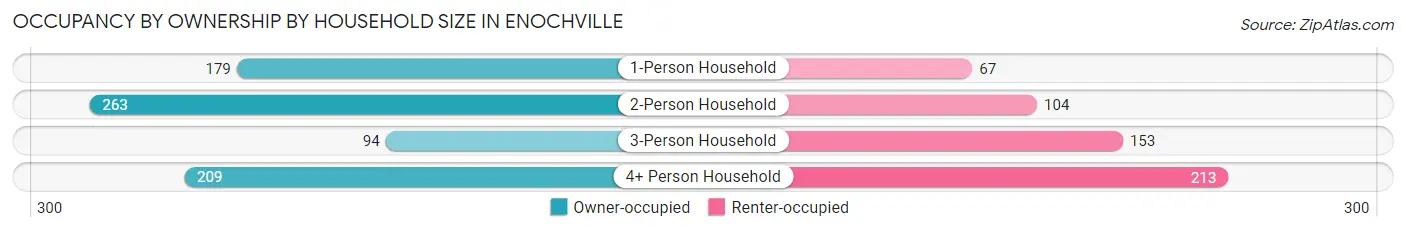
| Household Size | Owner-occupied | Renter-occupied |
| 1-Person Household | 179 (72.8%) | 67 (27.2%) |
| 2-Person Household | 263 (71.7%) | 104 (28.3%) |
| 3-Person Household | 94 (38.1%) | 153 (61.9%) |
| 4+ Person Household | 209 (49.5%) | 213 (50.5%) |
| Total Housing Units | 745 (58.1%) | 537 (41.9%) |
Occupancy by Educational Attainment in Enochville
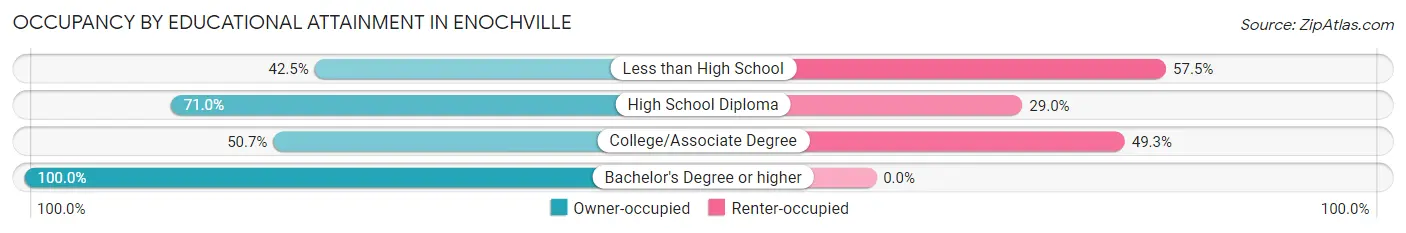
| Household Size | Owner-occupied | Renter-occupied |
| Less than High School | 142 (42.5%) | 192 (57.5%) |
| High School Diploma | 169 (71.0%) | 69 (29.0%) |
| College/Associate Degree | 284 (50.7%) | 276 (49.3%) |
| Bachelor's Degree or higher | 150 (100.0%) | 0 (0.0%) |
Occupancy by Age of Householder in Enochville
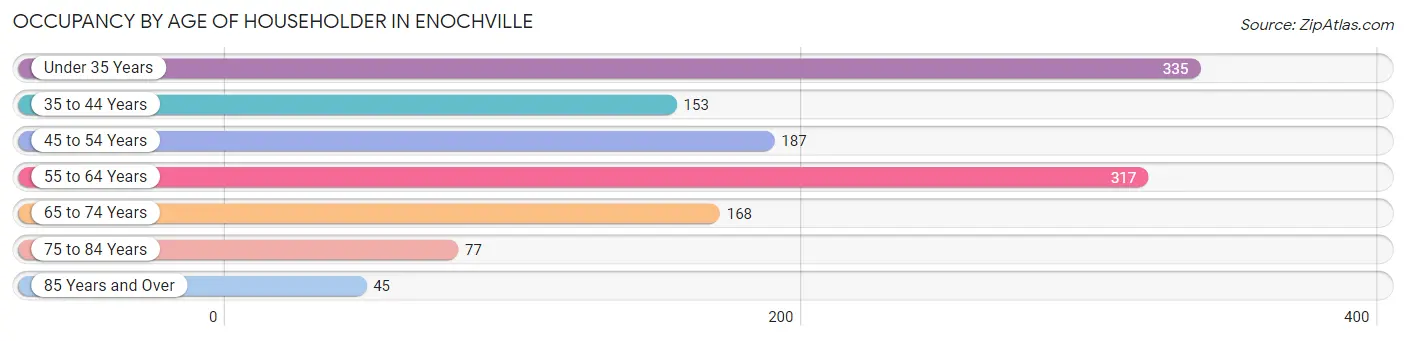
| Age Bracket | # Households | % Households |
| Under 35 Years | 335 | 26.1% |
| 35 to 44 Years | 153 | 11.9% |
| 45 to 54 Years | 187 | 14.6% |
| 55 to 64 Years | 317 | 24.7% |
| 65 to 74 Years | 168 | 13.1% |
| 75 to 84 Years | 77 | 6.0% |
| 85 Years and Over | 45 | 3.5% |
| Total | 1,282 | 100.0% |
Housing Finances in Enochville
Median Income by Occupancy in Enochville
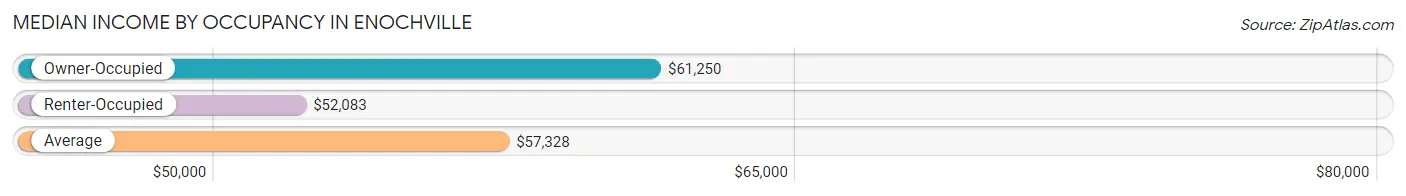
| Occupancy Type | # Households | Median Income |
| Owner-Occupied | 745 (58.1%) | $61,250 |
| Renter-Occupied | 537 (41.9%) | $52,083 |
| Average | 1,282 (100.0%) | $57,328 |
Occupancy by Householder Income Bracket in Enochville
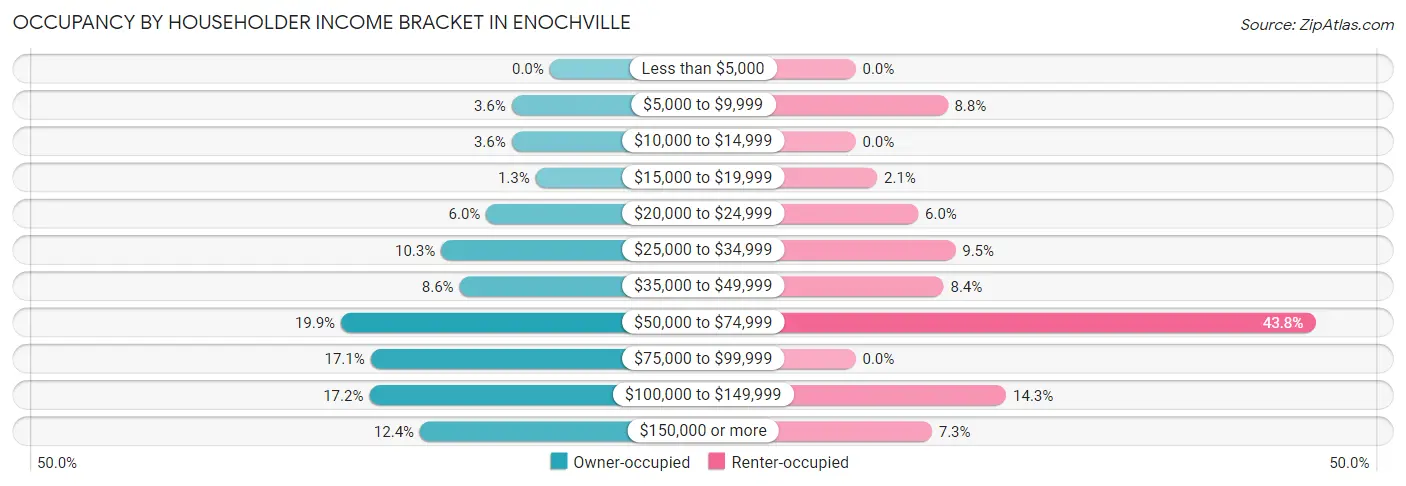
| Income Bracket | Owner-occupied | Renter-occupied |
| Less than $5,000 | 0 (0.0%) | 0 (0.0%) |
| $5,000 to $9,999 | 27 (3.6%) | 47 (8.7%) |
| $10,000 to $14,999 | 27 (3.6%) | 0 (0.0%) |
| $15,000 to $19,999 | 10 (1.3%) | 11 (2.1%) |
| $20,000 to $24,999 | 45 (6.0%) | 32 (6.0%) |
| $25,000 to $34,999 | 77 (10.3%) | 51 (9.5%) |
| $35,000 to $49,999 | 64 (8.6%) | 45 (8.4%) |
| $50,000 to $74,999 | 148 (19.9%) | 235 (43.8%) |
| $75,000 to $99,999 | 127 (17.1%) | 0 (0.0%) |
| $100,000 to $149,999 | 128 (17.2%) | 77 (14.3%) |
| $150,000 or more | 92 (12.3%) | 39 (7.3%) |
| Total | 745 (100.0%) | 537 (100.0%) |
Monthly Housing Cost Tiers in Enochville
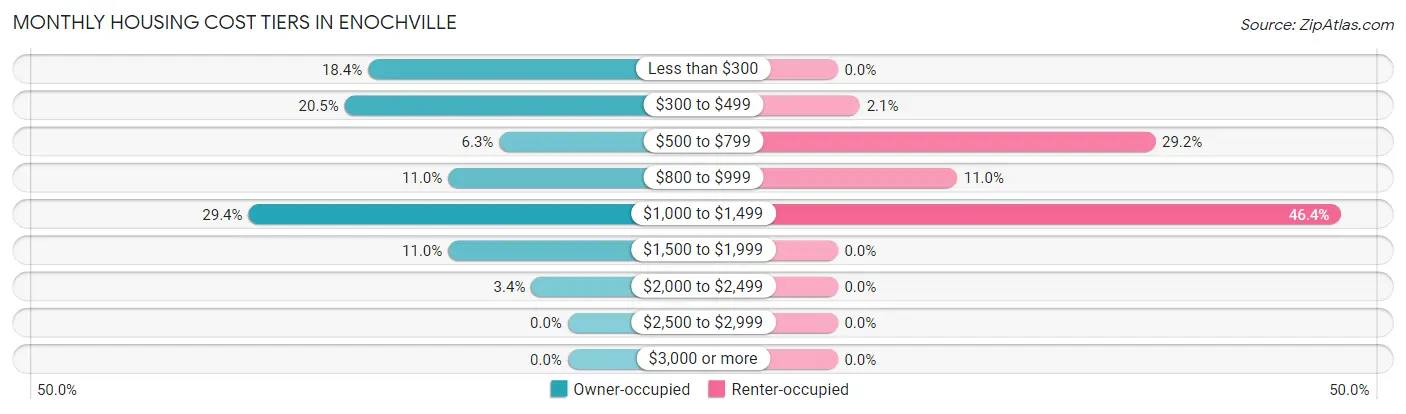
| Monthly Cost | Owner-occupied | Renter-occupied |
| Less than $300 | 137 (18.4%) | 0 (0.0%) |
| $300 to $499 | 153 (20.5%) | 11 (2.1%) |
| $500 to $799 | 47 (6.3%) | 157 (29.2%) |
| $800 to $999 | 82 (11.0%) | 59 (11.0%) |
| $1,000 to $1,499 | 219 (29.4%) | 249 (46.4%) |
| $1,500 to $1,999 | 82 (11.0%) | 0 (0.0%) |
| $2,000 to $2,499 | 25 (3.4%) | 0 (0.0%) |
| $2,500 to $2,999 | 0 (0.0%) | 0 (0.0%) |
| $3,000 or more | 0 (0.0%) | 0 (0.0%) |
| Total | 745 (100.0%) | 537 (100.0%) |
Physical Housing Characteristics in Enochville
Housing Structures in Enochville
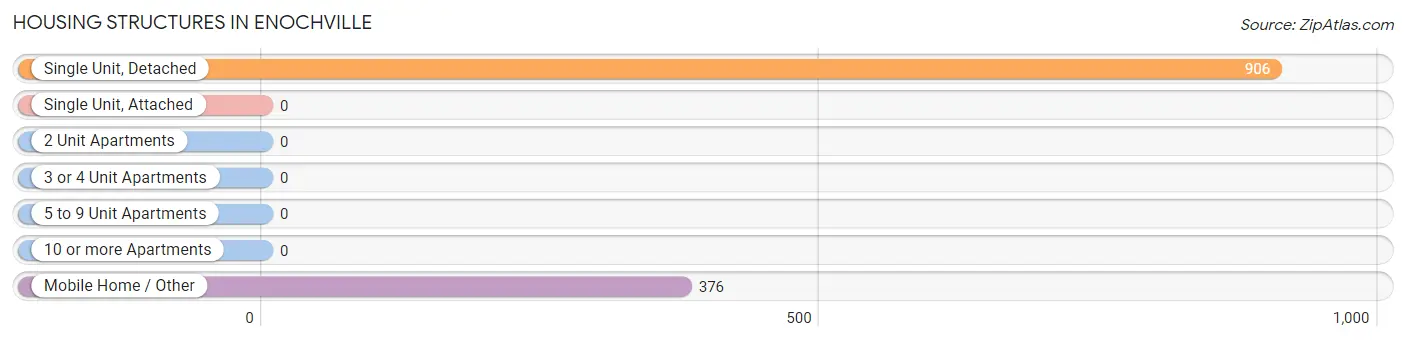
| Structure Type | # Housing Units | % Housing Units |
| Single Unit, Detached | 906 | 70.7% |
| Single Unit, Attached | 0 | 0.0% |
| 2 Unit Apartments | 0 | 0.0% |
| 3 or 4 Unit Apartments | 0 | 0.0% |
| 5 to 9 Unit Apartments | 0 | 0.0% |
| 10 or more Apartments | 0 | 0.0% |
| Mobile Home / Other | 376 | 29.3% |
| Total | 1,282 | 100.0% |
Housing Structures by Occupancy in Enochville
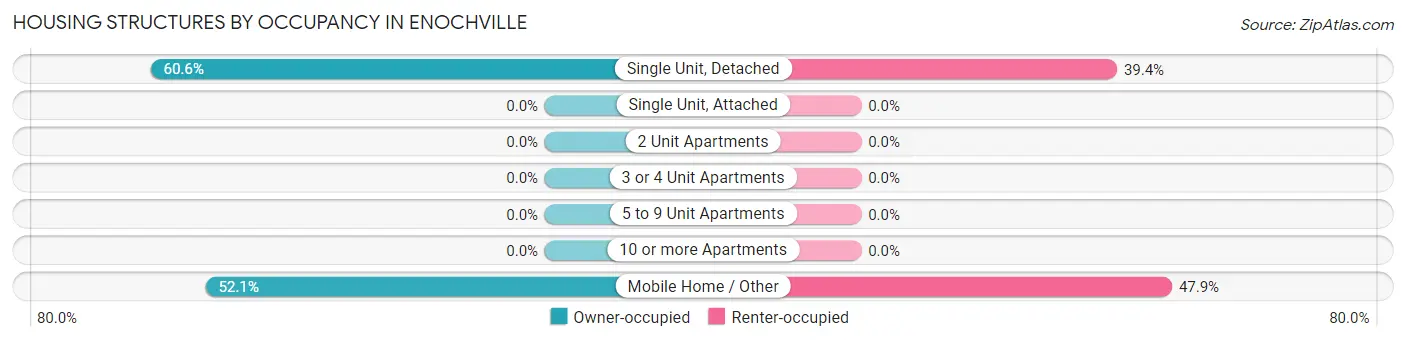
| Structure Type | Owner-occupied | Renter-occupied |
| Single Unit, Detached | 549 (60.6%) | 357 (39.4%) |
| Single Unit, Attached | 0 (0.0%) | 0 (0.0%) |
| 2 Unit Apartments | 0 (0.0%) | 0 (0.0%) |
| 3 or 4 Unit Apartments | 0 (0.0%) | 0 (0.0%) |
| 5 to 9 Unit Apartments | 0 (0.0%) | 0 (0.0%) |
| 10 or more Apartments | 0 (0.0%) | 0 (0.0%) |
| Mobile Home / Other | 196 (52.1%) | 180 (47.9%) |
| Total | 745 (58.1%) | 537 (41.9%) |
Housing Structures by Number of Rooms in Enochville
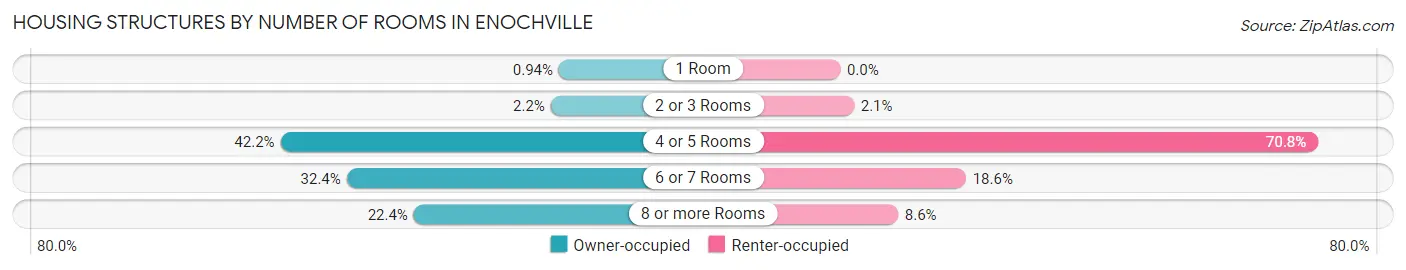
| Number of Rooms | Owner-occupied | Renter-occupied |
| 1 Room | 7 (0.9%) | 0 (0.0%) |
| 2 or 3 Rooms | 16 (2.1%) | 11 (2.1%) |
| 4 or 5 Rooms | 314 (42.1%) | 380 (70.8%) |
| 6 or 7 Rooms | 241 (32.4%) | 100 (18.6%) |
| 8 or more Rooms | 167 (22.4%) | 46 (8.6%) |
| Total | 745 (100.0%) | 537 (100.0%) |
Housing Structure by Heating Type in Enochville
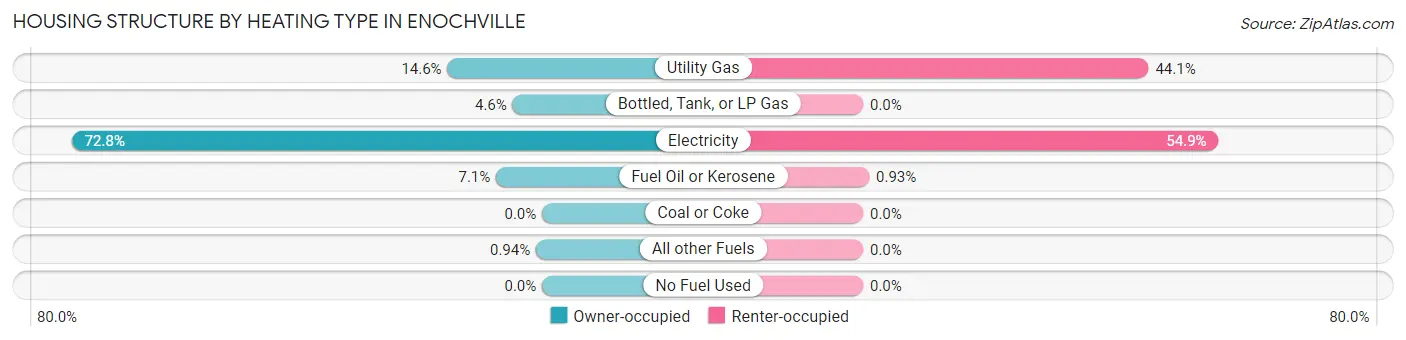
| Heating Type | Owner-occupied | Renter-occupied |
| Utility Gas | 109 (14.6%) | 237 (44.1%) |
| Bottled, Tank, or LP Gas | 34 (4.6%) | 0 (0.0%) |
| Electricity | 542 (72.8%) | 295 (54.9%) |
| Fuel Oil or Kerosene | 53 (7.1%) | 5 (0.9%) |
| Coal or Coke | 0 (0.0%) | 0 (0.0%) |
| All other Fuels | 7 (0.9%) | 0 (0.0%) |
| No Fuel Used | 0 (0.0%) | 0 (0.0%) |
| Total | 745 (100.0%) | 537 (100.0%) |
Household Vehicle Usage in Enochville
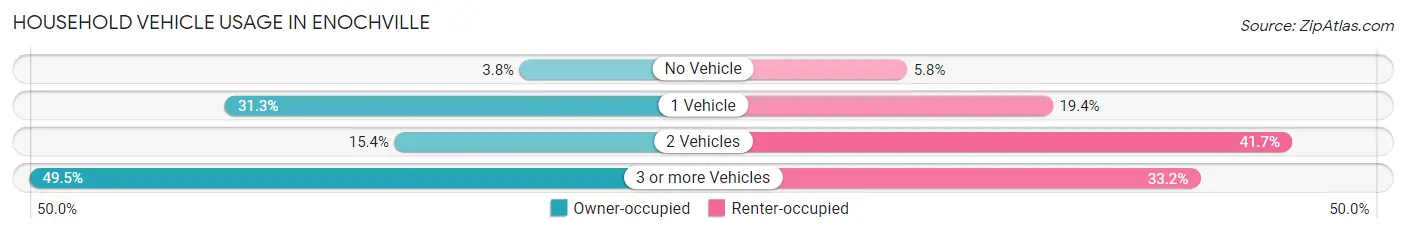
| Vehicles per Household | Owner-occupied | Renter-occupied |
| No Vehicle | 28 (3.8%) | 31 (5.8%) |
| 1 Vehicle | 233 (31.3%) | 104 (19.4%) |
| 2 Vehicles | 115 (15.4%) | 224 (41.7%) |
| 3 or more Vehicles | 369 (49.5%) | 178 (33.2%) |
| Total | 745 (100.0%) | 537 (100.0%) |
Real Estate & Mortgages in Enochville
Real Estate and Mortgage Overview in Enochville
| Characteristic | Without Mortgage | With Mortgage |
| Housing Units | 338 | 407 |
| Median Property Value | $121,300 | $219,300 |
| Median Household Income | $33,846 | $71 |
| Monthly Housing Costs | $328 | $0 |
| Real Estate Taxes | $835 | $17 |
Property Value by Mortgage Status in Enochville
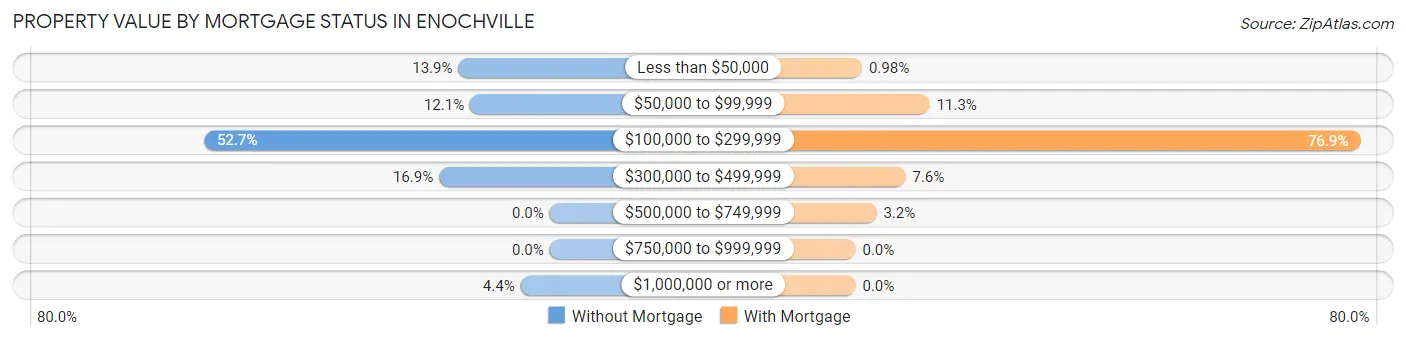
| Property Value | Without Mortgage | With Mortgage |
| Less than $50,000 | 47 (13.9%) | 4 (1.0%) |
| $50,000 to $99,999 | 41 (12.1%) | 46 (11.3%) |
| $100,000 to $299,999 | 178 (52.7%) | 313 (76.9%) |
| $300,000 to $499,999 | 57 (16.9%) | 31 (7.6%) |
| $500,000 to $749,999 | 0 (0.0%) | 13 (3.2%) |
| $750,000 to $999,999 | 0 (0.0%) | 0 (0.0%) |
| $1,000,000 or more | 15 (4.4%) | 0 (0.0%) |
| Total | 338 (100.0%) | 407 (100.0%) |
Household Income by Mortgage Status in Enochville
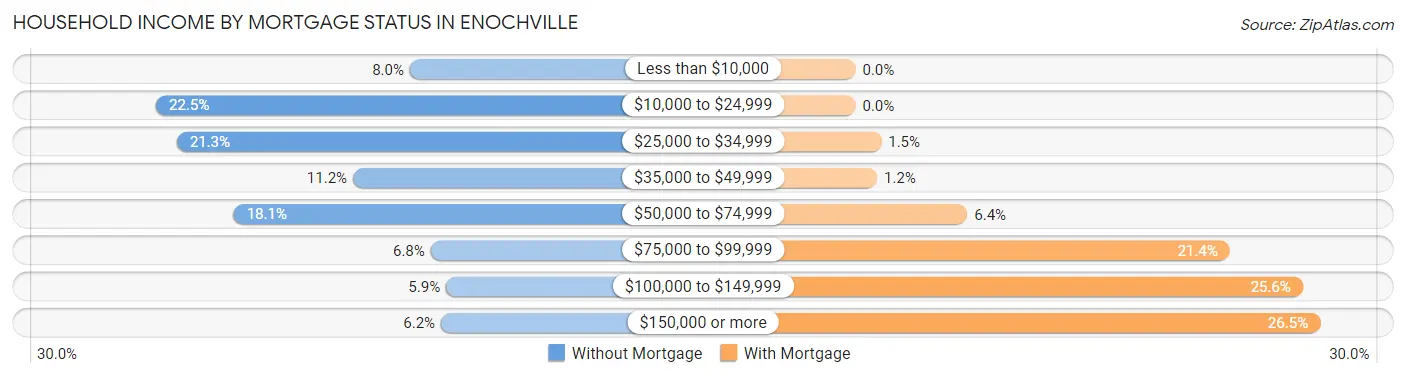
| Household Income | Without Mortgage | With Mortgage |
| Less than $10,000 | 27 (8.0%) | 0 (0.0%) |
| $10,000 to $24,999 | 76 (22.5%) | 0 (0.0%) |
| $25,000 to $34,999 | 72 (21.3%) | 6 (1.5%) |
| $35,000 to $49,999 | 38 (11.2%) | 5 (1.2%) |
| $50,000 to $74,999 | 61 (18.0%) | 26 (6.4%) |
| $75,000 to $99,999 | 23 (6.8%) | 87 (21.4%) |
| $100,000 to $149,999 | 20 (5.9%) | 104 (25.6%) |
| $150,000 or more | 21 (6.2%) | 108 (26.5%) |
| Total | 338 (100.0%) | 407 (100.0%) |
Property Value to Household Income Ratio in Enochville
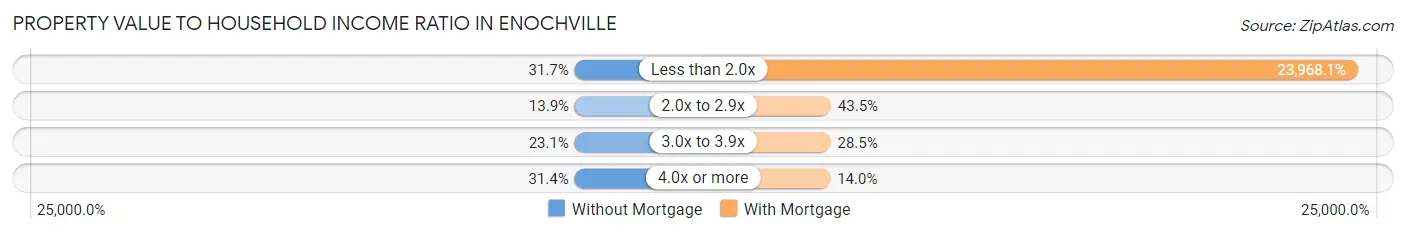
| Value-to-Income Ratio | Without Mortgage | With Mortgage |
| Less than 2.0x | 107 (31.7%) | 97,550 (23,968.1%) |
| 2.0x to 2.9x | 47 (13.9%) | 177 (43.5%) |
| 3.0x to 3.9x | 78 (23.1%) | 116 (28.5%) |
| 4.0x or more | 106 (31.4%) | 57 (14.0%) |
| Total | 338 (100.0%) | 407 (100.0%) |
Real Estate Taxes by Mortgage Status in Enochville
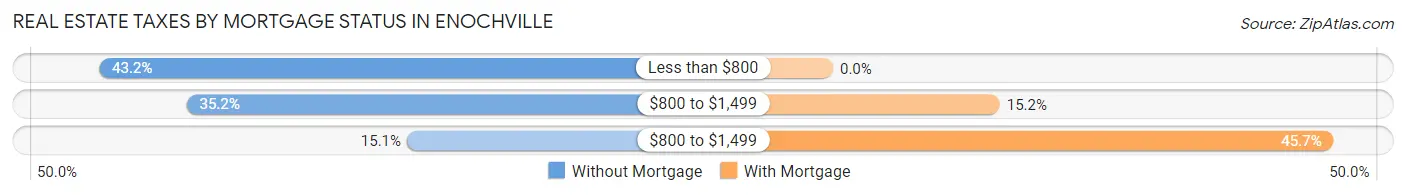
| Property Taxes | Without Mortgage | With Mortgage |
| Less than $800 | 146 (43.2%) | 0 (0.0%) |
| $800 to $1,499 | 119 (35.2%) | 62 (15.2%) |
| $800 to $1,499 | 51 (15.1%) | 186 (45.7%) |
| Total | 338 (100.0%) | 407 (100.0%) |
Health & Disability in Enochville
Health Insurance Coverage by Age in Enochville
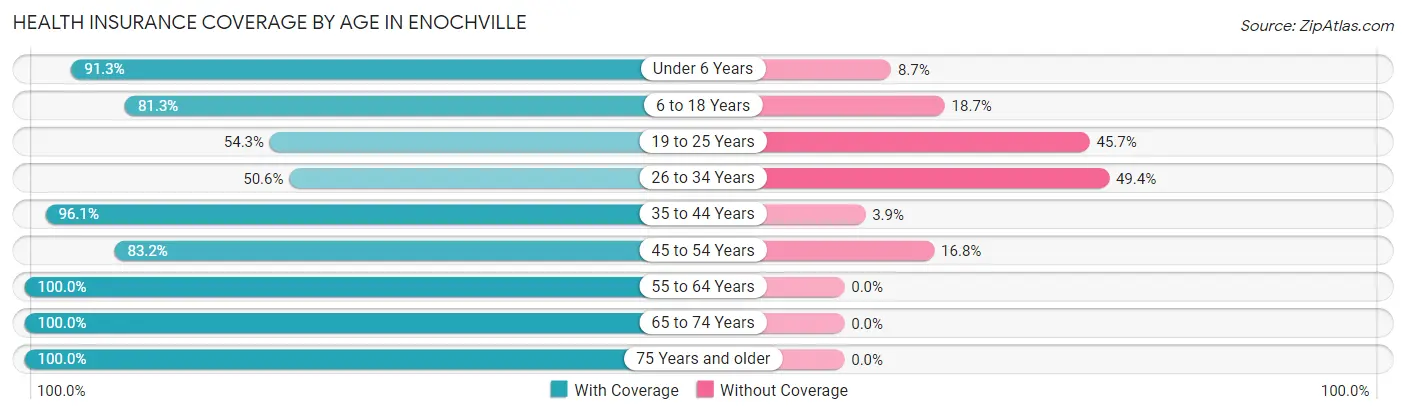
| Age Bracket | With Coverage | Without Coverage |
| Under 6 Years | 220 (91.3%) | 21 (8.7%) |
| 6 to 18 Years | 582 (81.3%) | 134 (18.7%) |
| 19 to 25 Years | 51 (54.3%) | 43 (45.7%) |
| 26 to 34 Years | 276 (50.6%) | 269 (49.4%) |
| 35 to 44 Years | 518 (96.1%) | 21 (3.9%) |
| 45 to 54 Years | 298 (83.2%) | 60 (16.8%) |
| 55 to 64 Years | 483 (100.0%) | 0 (0.0%) |
| 65 to 74 Years | 315 (100.0%) | 0 (0.0%) |
| 75 Years and older | 155 (100.0%) | 0 (0.0%) |
| Total | 2,898 (84.1%) | 548 (15.9%) |
Health Insurance Coverage by Citizenship Status in Enochville
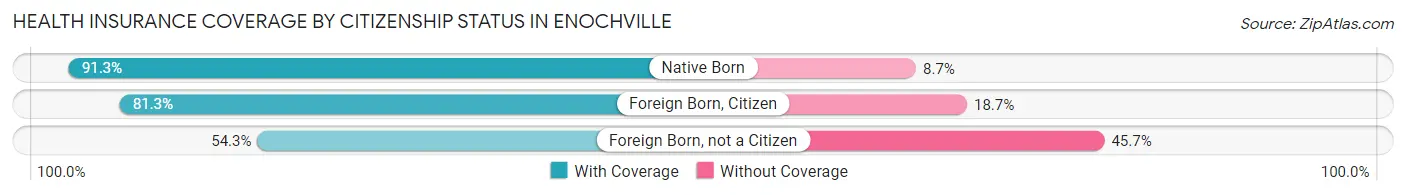
| Citizenship Status | With Coverage | Without Coverage |
| Native Born | 220 (91.3%) | 21 (8.7%) |
| Foreign Born, Citizen | 582 (81.3%) | 134 (18.7%) |
| Foreign Born, not a Citizen | 51 (54.3%) | 43 (45.7%) |
Health Insurance Coverage by Household Income in Enochville
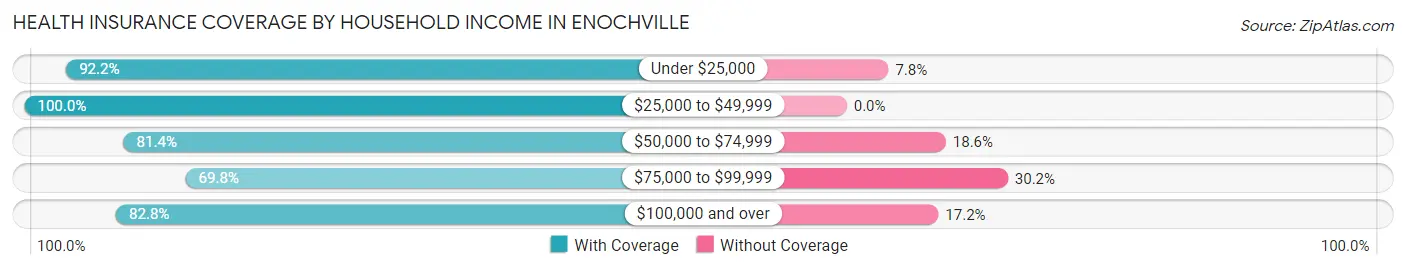
| Household Income | With Coverage | Without Coverage |
| Under $25,000 | 307 (92.2%) | 26 (7.8%) |
| $25,000 to $49,999 | 455 (100.0%) | 0 (0.0%) |
| $50,000 to $74,999 | 948 (81.4%) | 216 (18.6%) |
| $75,000 to $99,999 | 266 (69.8%) | 115 (30.2%) |
| $100,000 and over | 922 (82.8%) | 191 (17.2%) |
Public vs Private Health Insurance Coverage by Age in Enochville
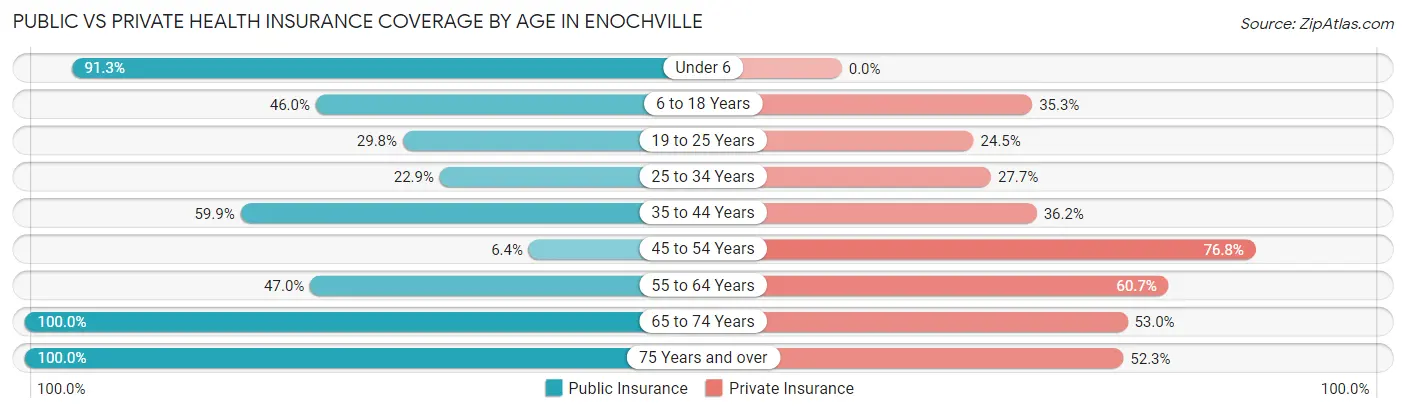
| Age Bracket | Public Insurance | Private Insurance |
| Under 6 | 220 (91.3%) | 0 (0.0%) |
| 6 to 18 Years | 329 (46.0%) | 253 (35.3%) |
| 19 to 25 Years | 28 (29.8%) | 23 (24.5%) |
| 25 to 34 Years | 125 (22.9%) | 151 (27.7%) |
| 35 to 44 Years | 323 (59.9%) | 195 (36.2%) |
| 45 to 54 Years | 23 (6.4%) | 275 (76.8%) |
| 55 to 64 Years | 227 (47.0%) | 293 (60.7%) |
| 65 to 74 Years | 315 (100.0%) | 167 (53.0%) |
| 75 Years and over | 155 (100.0%) | 81 (52.3%) |
| Total | 1,745 (50.6%) | 1,438 (41.7%) |
Disability Status by Sex by Age in Enochville
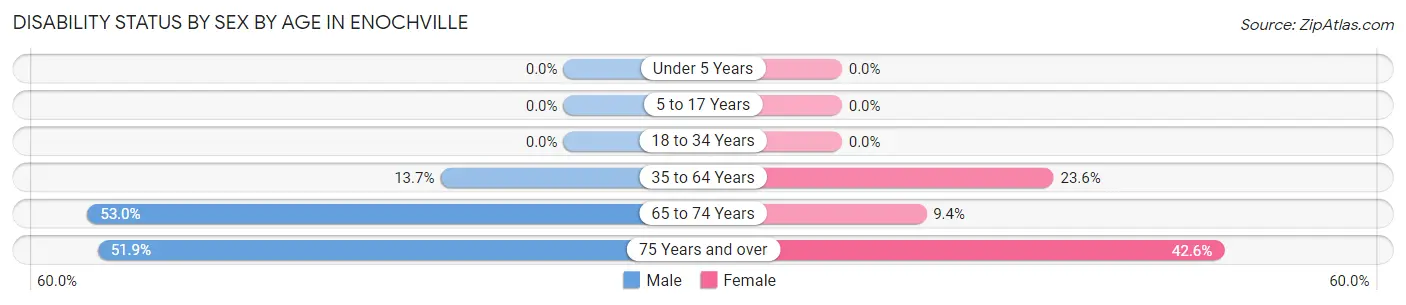
| Age Bracket | Male | Female |
| Under 5 Years | 0 (0.0%) | 0 (0.0%) |
| 5 to 17 Years | 0 (0.0%) | 0 (0.0%) |
| 18 to 34 Years | 0 (0.0%) | 0 (0.0%) |
| 35 to 64 Years | 88 (13.7%) | 174 (23.6%) |
| 65 to 74 Years | 88 (53.0%) | 14 (9.4%) |
| 75 Years and over | 28 (51.8%) | 43 (42.6%) |
Disability Class by Sex by Age in Enochville
Disability Class: Hearing Difficulty
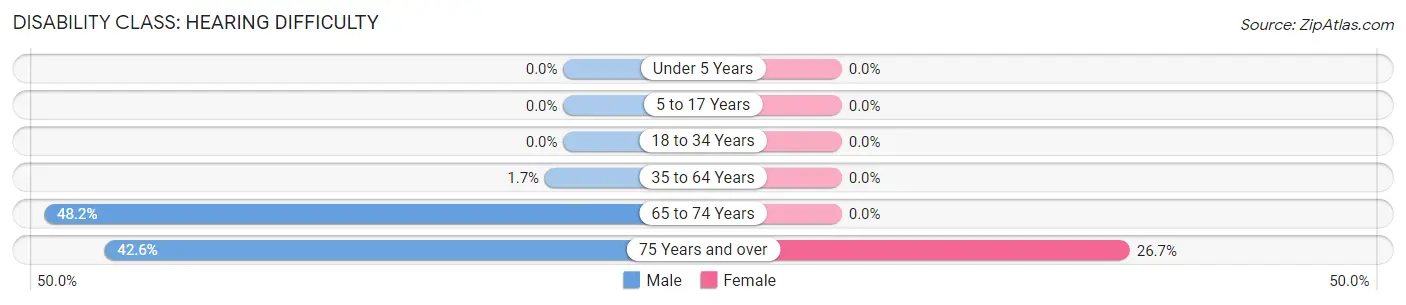
| Age Bracket | Male | Female |
| Under 5 Years | 0 (0.0%) | 0 (0.0%) |
| 5 to 17 Years | 0 (0.0%) | 0 (0.0%) |
| 18 to 34 Years | 0 (0.0%) | 0 (0.0%) |
| 35 to 64 Years | 11 (1.7%) | 0 (0.0%) |
| 65 to 74 Years | 80 (48.2%) | 0 (0.0%) |
| 75 Years and over | 23 (42.6%) | 27 (26.7%) |
Disability Class: Vision Difficulty
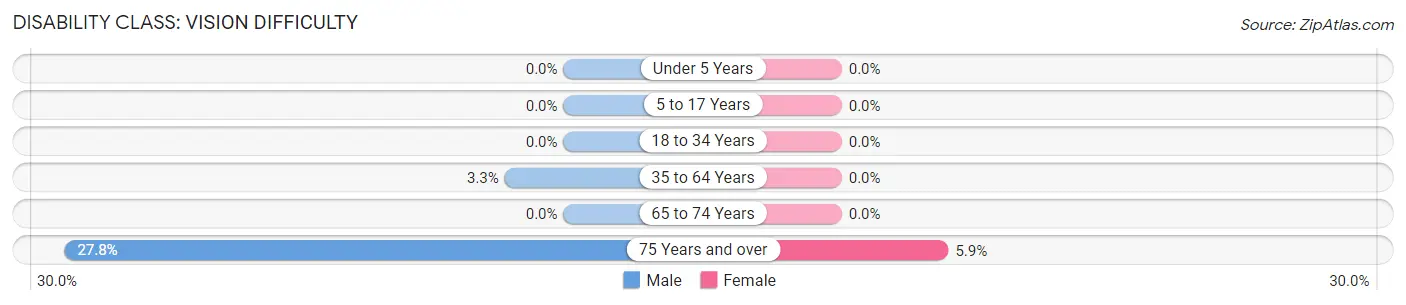
| Age Bracket | Male | Female |
| Under 5 Years | 0 (0.0%) | 0 (0.0%) |
| 5 to 17 Years | 0 (0.0%) | 0 (0.0%) |
| 18 to 34 Years | 0 (0.0%) | 0 (0.0%) |
| 35 to 64 Years | 21 (3.3%) | 0 (0.0%) |
| 65 to 74 Years | 0 (0.0%) | 0 (0.0%) |
| 75 Years and over | 15 (27.8%) | 6 (5.9%) |
Disability Class: Cognitive Difficulty
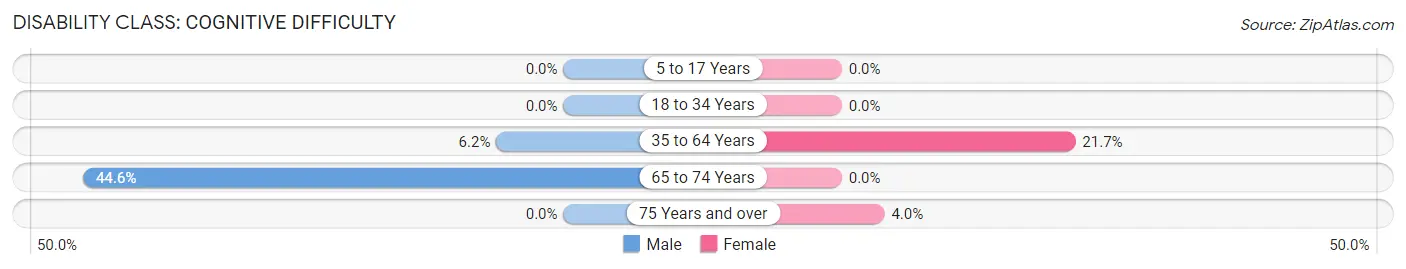
| Age Bracket | Male | Female |
| 5 to 17 Years | 0 (0.0%) | 0 (0.0%) |
| 18 to 34 Years | 0 (0.0%) | 0 (0.0%) |
| 35 to 64 Years | 40 (6.2%) | 160 (21.7%) |
| 65 to 74 Years | 74 (44.6%) | 0 (0.0%) |
| 75 Years and over | 0 (0.0%) | 4 (4.0%) |
Disability Class: Ambulatory Difficulty
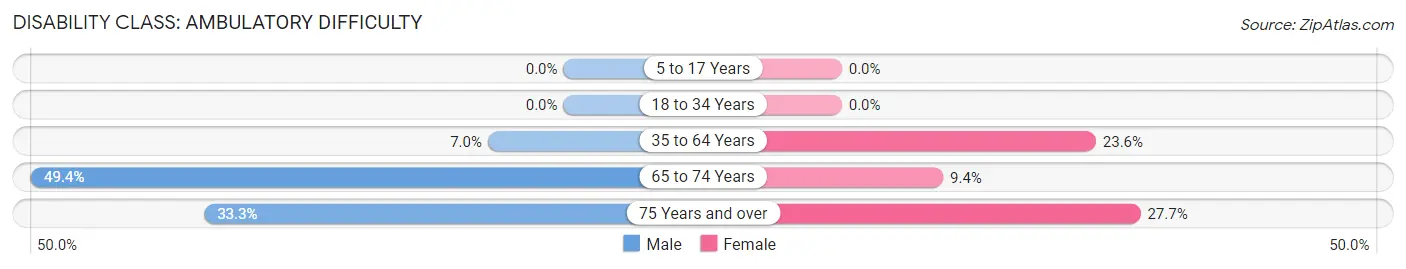
| Age Bracket | Male | Female |
| 5 to 17 Years | 0 (0.0%) | 0 (0.0%) |
| 18 to 34 Years | 0 (0.0%) | 0 (0.0%) |
| 35 to 64 Years | 45 (7.0%) | 174 (23.6%) |
| 65 to 74 Years | 82 (49.4%) | 14 (9.4%) |
| 75 Years and over | 18 (33.3%) | 28 (27.7%) |
Disability Class: Self-Care Difficulty
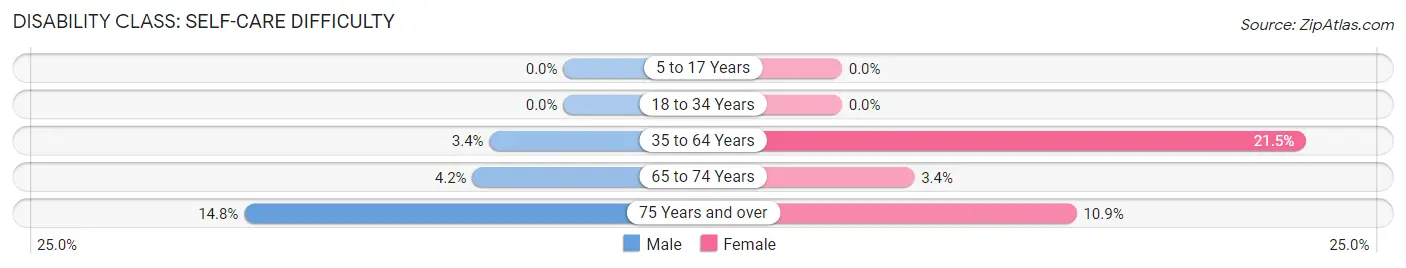
| Age Bracket | Male | Female |
| 5 to 17 Years | 0 (0.0%) | 0 (0.0%) |
| 18 to 34 Years | 0 (0.0%) | 0 (0.0%) |
| 35 to 64 Years | 22 (3.4%) | 159 (21.5%) |
| 65 to 74 Years | 7 (4.2%) | 5 (3.4%) |
| 75 Years and over | 8 (14.8%) | 11 (10.9%) |
Technology Access in Enochville
Computing Device Access in Enochville
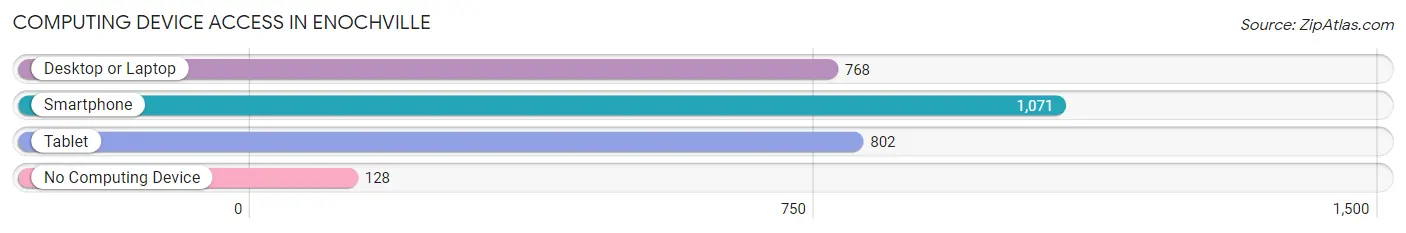
| Device Type | # Households | % Households |
| Desktop or Laptop | 768 | 59.9% |
| Smartphone | 1,071 | 83.5% |
| Tablet | 802 | 62.6% |
| No Computing Device | 128 | 10.0% |
| Total | 1,282 | 100.0% |
Internet Access in Enochville
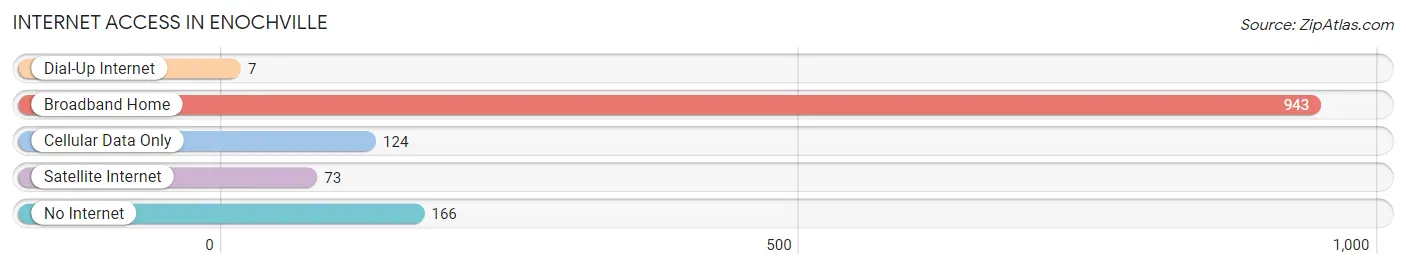
| Internet Type | # Households | % Households |
| Dial-Up Internet | 7 | 0.5% |
| Broadband Home | 943 | 73.6% |
| Cellular Data Only | 124 | 9.7% |
| Satellite Internet | 73 | 5.7% |
| No Internet | 166 | 13.0% |
| Total | 1,282 | 100.0% |
Enochville Summary
Enochville is a small unincorporated community located in Rowan County, North Carolina. It is situated in the foothills of the Blue Ridge Mountains, approximately 20 miles northeast of Charlotte. The community is named after the Enoch family, who settled in the area in the early 1800s.
History
The Enoch family first settled in the area in the early 1800s. The family was of German descent and had migrated from Pennsylvania. The family established a small farm and built a log cabin, which still stands today. The Enochs were among the first settlers in the area and helped to establish the community of Enochville.
In the late 1800s, the community began to grow and develop. A post office was established in 1887 and a school was built in 1895. The school was later replaced by a larger building in the early 1900s. The community also had a general store, a blacksmith shop, and a grist mill.
In the early 1900s, the community began to decline as many of the residents moved away in search of better economic opportunities. The post office closed in the 1930s and the school closed in the 1950s. The community has remained relatively small and rural since then.
Geography
Enochville is located in the foothills of the Blue Ridge Mountains in Rowan County, North Carolina. The community is situated approximately 20 miles northeast of Charlotte. The terrain is mostly hilly and wooded, with some open fields. The climate is mild, with hot summers and cold winters.
Economy
The economy of Enochville is largely based on agriculture. The community is home to several small farms, which produce a variety of crops, including corn, soybeans, and hay. There are also several small businesses in the area, including a general store, a gas station, and a few restaurants.
Demographics
As of the 2010 census, the population of Enochville was 1,093. The racial makeup of the community was 97.3% White, 0.9% African American, 0.3% Native American, 0.2% Asian, and 1.3% from other races. The median household income was $37,917, and the median family income was $45,625.
Conclusion
Enochville is a small unincorporated community located in Rowan County, North Carolina. It is situated in the foothills of the Blue Ridge Mountains, approximately 20 miles northeast of Charlotte. The community is named after the Enoch family, who settled in the area in the early 1800s. The economy of Enochville is largely based on agriculture, and the population of the community was 1,093 as of the 2010 census.
Common Questions
What is Per Capita Income in Enochville?
Per Capita income in Enochville is $29,783.
What is the Median Family Income in Enochville?
Median Family Income in Enochville is $54,110.
What is the Median Household income in Enochville?
Median Household Income in Enochville is $57,328.
What is Income or Wage Gap in Enochville?
Income or Wage Gap in Enochville is 45.3%.
Women in Enochville earn 54.7 cents for every dollar earned by a man.
What is Inequality or Gini Index in Enochville?
Inequality or Gini Index in Enochville is 0.44.
What is the Total Population of Enochville?
Total Population of Enochville is 3,446.
What is the Total Male Population of Enochville?
Total Male Population of Enochville is 1,697.
What is the Total Female Population of Enochville?
Total Female Population of Enochville is 1,749.
What is the Ratio of Males per 100 Females in Enochville?
There are 97.03 Males per 100 Females in Enochville.
What is the Ratio of Females per 100 Males in Enochville?
There are 103.06 Females per 100 Males in Enochville.
What is the Median Population Age in Enochville?
Median Population Age in Enochville is 38.4 Years.
What is the Average Family Size in Enochville
Average Family Size in Enochville is 2.8 People.
What is the Average Household Size in Enochville
Average Household Size in Enochville is 2.7 People.
How Large is the Labor Force in Enochville?
There are 1,536 People in the Labor Forcein in Enochville.
What is the Percentage of People in the Labor Force in Enochville?
56.6% of People are in the Labor Force in Enochville.
What is the Unemployment Rate in Enochville?
Unemployment Rate in Enochville is 7.5%.