Lanesboro, MN Map & Demographics
Lanesboro Map
Lanesboro Overview
$37,821
PER CAPITA INCOME
$93,000
AVG FAMILY INCOME
$71,750
AVG HOUSEHOLD INCOME
40.5%
WAGE / INCOME GAP [ % ]
59.5¢/ $1
WAGE / INCOME GAP [ $ ]
0.39
INEQUALITY / GINI INDEX
829
TOTAL POPULATION
416
MALE POPULATION
413
FEMALE POPULATION
100.73
MALES / 100 FEMALES
99.28
FEMALES / 100 MALES
46.6
MEDIAN AGE
2.8
AVG FAMILY SIZE
2.2
AVG HOUSEHOLD SIZE
422
LABOR FORCE [ PEOPLE ]
63.2%
PERCENT IN LABOR FORCE
1.2%
UNEMPLOYMENT RATE
Lanesboro Zip Codes
Lanesboro Area Codes
Income in Lanesboro
Income Overview in Lanesboro
Per Capita Income in Lanesboro is $37,821, while median incomes of families and households are $93,000 and $71,750 respectively.
| Characteristic | Number | Measure |
| Per Capita Income | 829 | $37,821 |
| Median Family Income | 230 | $93,000 |
| Mean Family Income | 230 | $109,174 |
| Median Household Income | 380 | $71,750 |
| Mean Household Income | 380 | $85,211 |
| Income Deficit | 230 | $0 |
| Wage / Income Gap (%) | 829 | 40.53% |
| Wage / Income Gap ($) | 829 | 59.47¢ per $1 |
| Gini / Inequality Index | 829 | 0.39 |
Earnings by Sex in Lanesboro
Average Earnings in Lanesboro are $42,019, $51,500 for men and $30,625 for women, a difference of 40.5%.
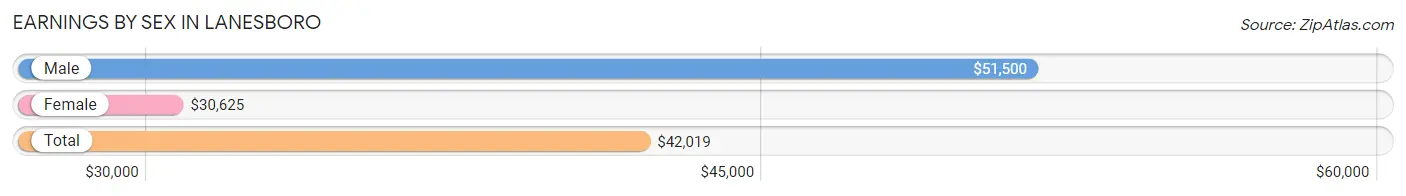
| Sex | Number | Average Earnings |
| Male | 244 (53.4%) | $51,500 |
| Female | 213 (46.6%) | $30,625 |
| Total | 457 (100.0%) | $42,019 |
Earnings by Sex by Income Bracket in Lanesboro
The most common earnings brackets in Lanesboro are $65,000 to $74,999 for men (43 | 17.6%) and $30,000 to $34,999 for women (20 | 9.4%).
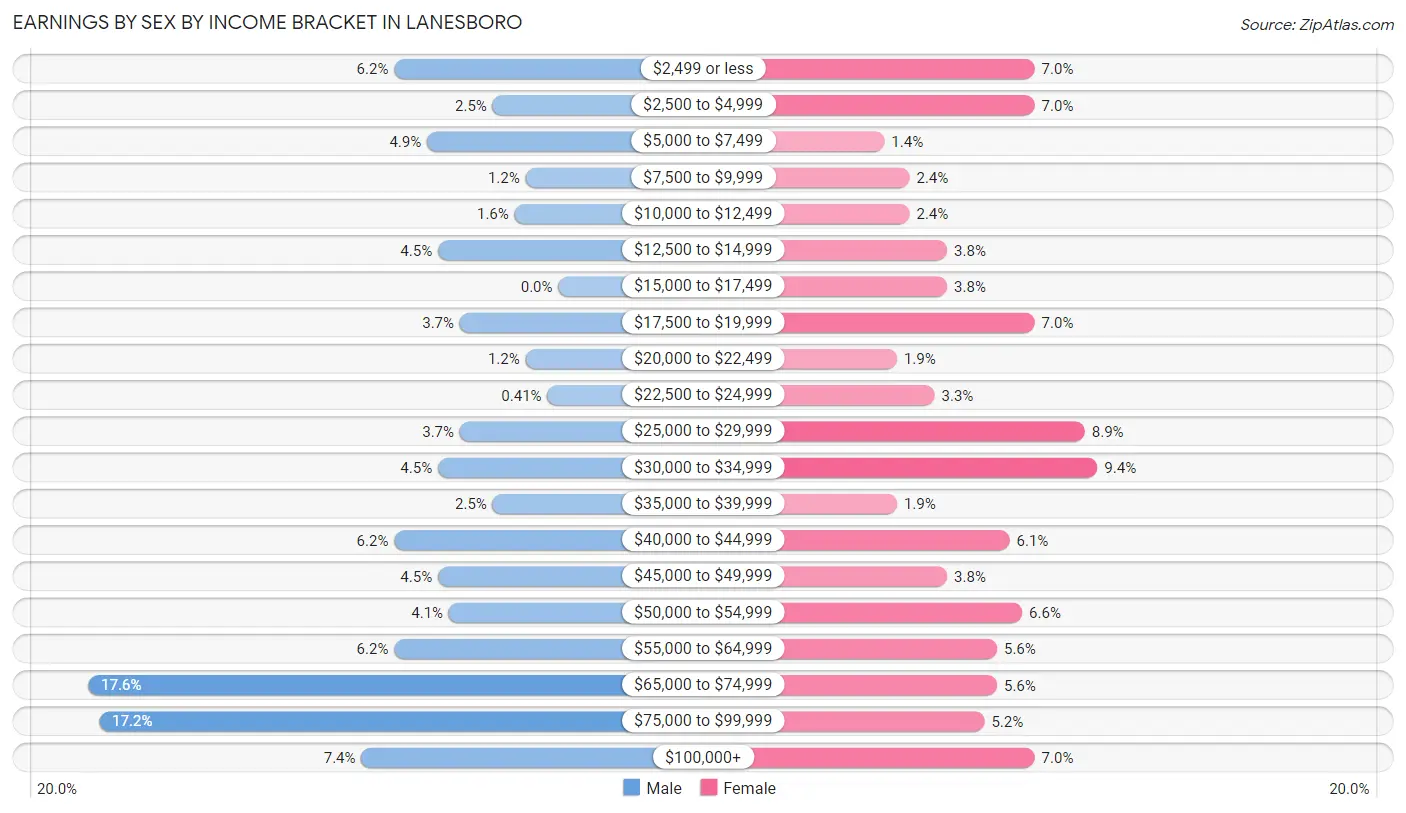
| Income | Male | Female |
| $2,499 or less | 15 (6.1%) | 15 (7.0%) |
| $2,500 to $4,999 | 6 (2.5%) | 15 (7.0%) |
| $5,000 to $7,499 | 12 (4.9%) | 3 (1.4%) |
| $7,500 to $9,999 | 3 (1.2%) | 5 (2.4%) |
| $10,000 to $12,499 | 4 (1.6%) | 5 (2.4%) |
| $12,500 to $14,999 | 11 (4.5%) | 8 (3.8%) |
| $15,000 to $17,499 | 0 (0.0%) | 8 (3.8%) |
| $17,500 to $19,999 | 9 (3.7%) | 15 (7.0%) |
| $20,000 to $22,499 | 3 (1.2%) | 4 (1.9%) |
| $22,500 to $24,999 | 1 (0.4%) | 7 (3.3%) |
| $25,000 to $29,999 | 9 (3.7%) | 19 (8.9%) |
| $30,000 to $34,999 | 11 (4.5%) | 20 (9.4%) |
| $35,000 to $39,999 | 6 (2.5%) | 4 (1.9%) |
| $40,000 to $44,999 | 15 (6.1%) | 13 (6.1%) |
| $45,000 to $49,999 | 11 (4.5%) | 8 (3.8%) |
| $50,000 to $54,999 | 10 (4.1%) | 14 (6.6%) |
| $55,000 to $64,999 | 15 (6.1%) | 12 (5.6%) |
| $65,000 to $74,999 | 43 (17.6%) | 12 (5.6%) |
| $75,000 to $99,999 | 42 (17.2%) | 11 (5.2%) |
| $100,000+ | 18 (7.4%) | 15 (7.0%) |
| Total | 244 (100.0%) | 213 (100.0%) |
Earnings by Sex by Educational Attainment in Lanesboro
Average earnings in Lanesboro are $55,625 for men and $32,625 for women, a difference of 41.3%. Men with an educational attainment of graduate degree enjoy the highest average annual earnings of $86,250, while those with high school diploma education earn the least with $41,250. Women with an educational attainment of graduate degree earn the most with the average annual earnings of $65,625, while those with college or associate's degree education have the smallest earnings of $24,464.
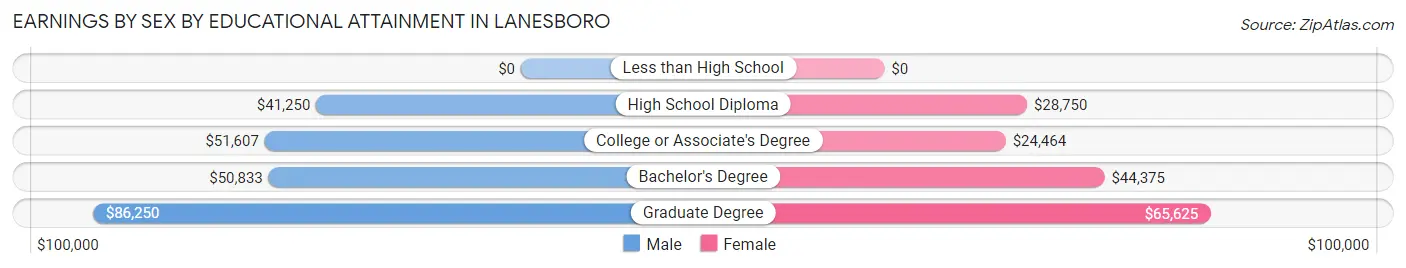
| Educational Attainment | Male Income | Female Income |
| Less than High School | - | - |
| High School Diploma | $41,250 | $28,750 |
| College or Associate's Degree | $51,607 | $24,464 |
| Bachelor's Degree | $50,833 | $44,375 |
| Graduate Degree | $86,250 | $65,625 |
| Total | $55,625 | $32,625 |
Family Income in Lanesboro
Family Income Brackets in Lanesboro
According to the Lanesboro family income data, there are 65 families falling into the $100,000 to $149,999 income range, which is the most common income bracket and makes up 28.3% of all families.
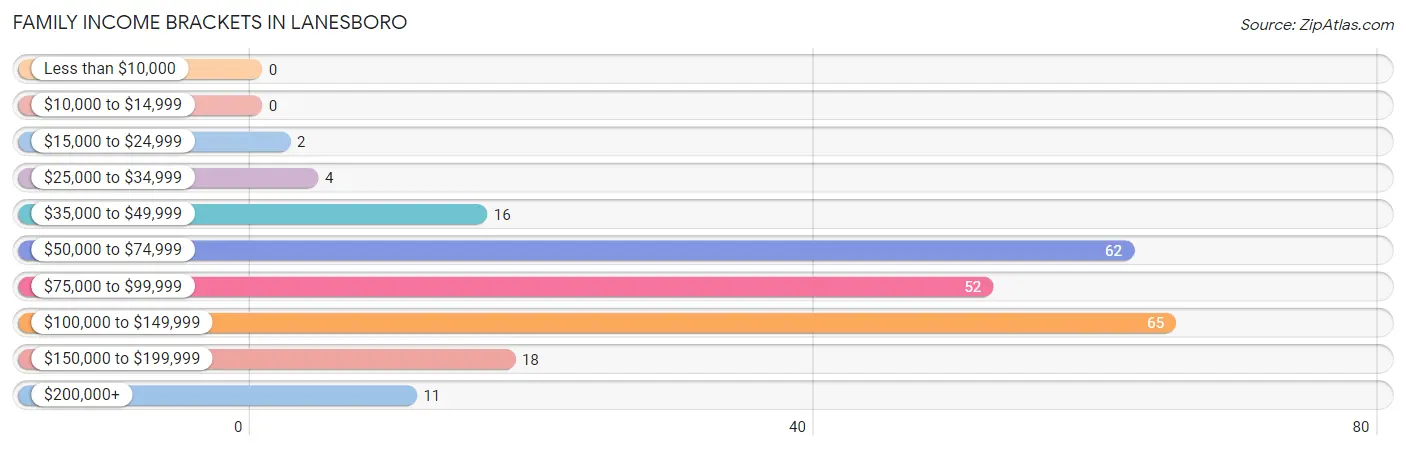
| Income Bracket | # Families | % Families |
| Less than $10,000 | 0 | 0.0% |
| $10,000 to $14,999 | 0 | 0.0% |
| $15,000 to $24,999 | 2 | 0.9% |
| $25,000 to $34,999 | 4 | 1.7% |
| $35,000 to $49,999 | 16 | 7.0% |
| $50,000 to $74,999 | 62 | 27.0% |
| $75,000 to $99,999 | 52 | 22.6% |
| $100,000 to $149,999 | 65 | 28.3% |
| $150,000 to $199,999 | 18 | 7.8% |
| $200,000+ | 11 | 4.8% |
Family Income by Famaliy Size in Lanesboro
5-person families (12 | 5.2%) account for the highest median family income in Lanesboro with $106,250 per family, while 2-person families (124 | 53.9%) have the highest median income of $47,125 per family member.
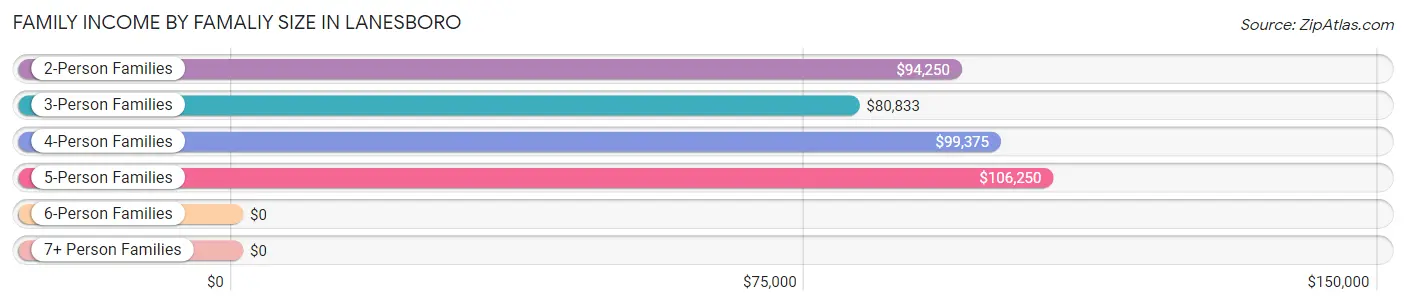
| Income Bracket | # Families | Median Income |
| 2-Person Families | 124 (53.9%) | $94,250 |
| 3-Person Families | 52 (22.6%) | $80,833 |
| 4-Person Families | 35 (15.2%) | $99,375 |
| 5-Person Families | 12 (5.2%) | $106,250 |
| 6-Person Families | 7 (3.0%) | $0 |
| 7+ Person Families | 0 (0.0%) | $0 |
| Total | 230 (100.0%) | $93,000 |
Family Income by Number of Earners in Lanesboro
The median family income in Lanesboro is $93,000, with families comprising 3+ earners (32) having the highest median family income of $125,385, while families with no earners (35) have the lowest median family income of $54,375, accounting for 13.9% and 15.2% of families, respectively.
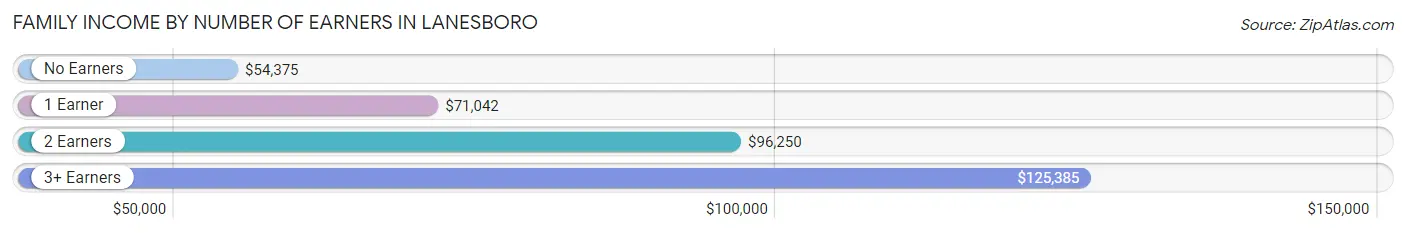
| Number of Earners | # Families | Median Income |
| No Earners | 35 (15.2%) | $54,375 |
| 1 Earner | 65 (28.3%) | $71,042 |
| 2 Earners | 98 (42.6%) | $96,250 |
| 3+ Earners | 32 (13.9%) | $125,385 |
| Total | 230 (100.0%) | $93,000 |
Household Income in Lanesboro
Household Income Brackets in Lanesboro
With 81 households falling in the category, the $100,000 to $149,999 income range is the most frequent in Lanesboro, accounting for 21.3% of all households. In contrast, only 10 households (2.6%) fall into the $10,000 to $14,999 income bracket, making it the least populous group.
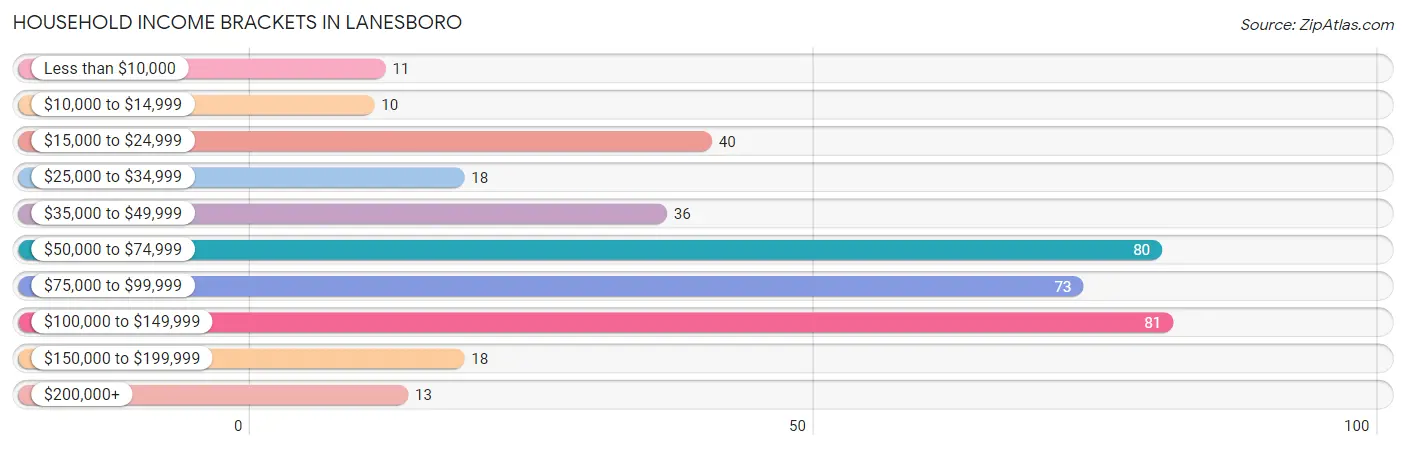
| Income Bracket | # Households | % Households |
| Less than $10,000 | 11 | 2.9% |
| $10,000 to $14,999 | 10 | 2.6% |
| $15,000 to $24,999 | 40 | 10.5% |
| $25,000 to $34,999 | 18 | 4.7% |
| $35,000 to $49,999 | 36 | 9.5% |
| $50,000 to $74,999 | 80 | 21.1% |
| $75,000 to $99,999 | 73 | 19.2% |
| $100,000 to $149,999 | 81 | 21.3% |
| $150,000 to $199,999 | 18 | 4.7% |
| $200,000+ | 13 | 3.4% |
Household Income by Householder Age in Lanesboro
The median household income in Lanesboro is $71,750, with the highest median household income of $92,500 found in the 45 to 64 years age bracket for the primary householder. A total of 126 households (33.2%) fall into this category. Meanwhile, the 15 to 24 years age bracket for the primary householder has the lowest median household income of $0, with 15 households (4.0%) in this group.
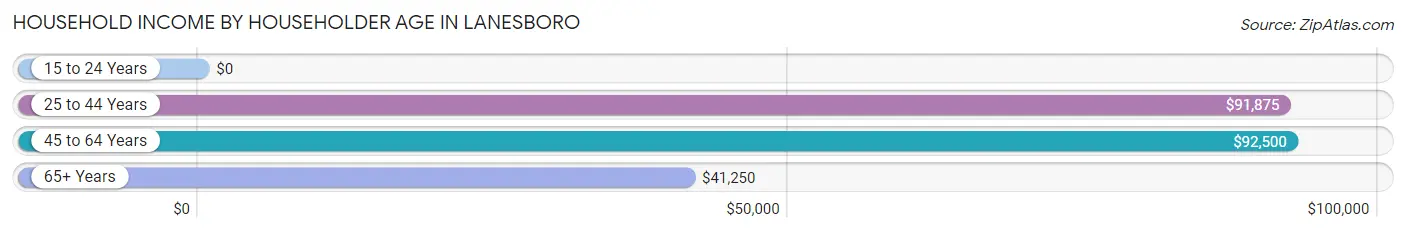
| Income Bracket | # Households | Median Income |
| 15 to 24 Years | 15 (4.0%) | $0 |
| 25 to 44 Years | 89 (23.4%) | $91,875 |
| 45 to 64 Years | 126 (33.2%) | $92,500 |
| 65+ Years | 150 (39.5%) | $41,250 |
| Total | 380 (100.0%) | $71,750 |
Poverty in Lanesboro
Income Below Poverty by Sex and Age in Lanesboro
With 2.9% poverty level for males and 7.5% for females among the residents of Lanesboro, 25 to 34 year old males and 75 year old and over females are the most vulnerable to poverty, with 4 males (13.3%) and 12 females (30.0%) in their respective age groups living below the poverty level.
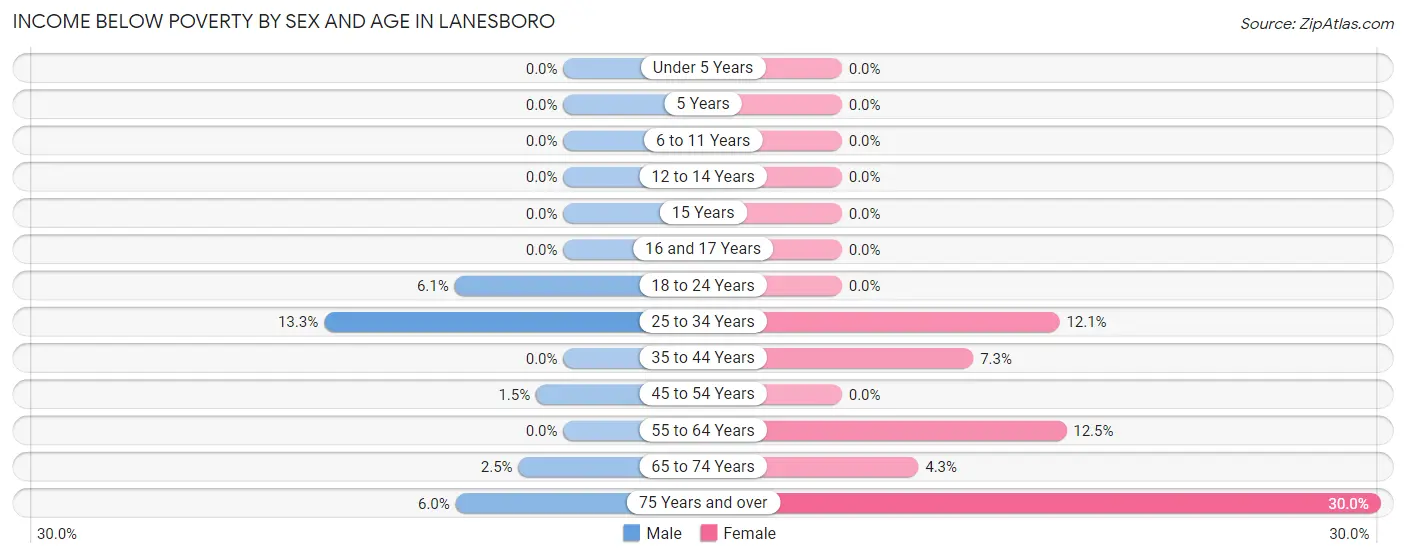
| Age Bracket | Male | Female |
| Under 5 Years | 0 (0.0%) | 0 (0.0%) |
| 5 Years | 0 (0.0%) | 0 (0.0%) |
| 6 to 11 Years | 0 (0.0%) | 0 (0.0%) |
| 12 to 14 Years | 0 (0.0%) | 0 (0.0%) |
| 15 Years | 0 (0.0%) | 0 (0.0%) |
| 16 and 17 Years | 0 (0.0%) | 0 (0.0%) |
| 18 to 24 Years | 2 (6.1%) | 0 (0.0%) |
| 25 to 34 Years | 4 (13.3%) | 4 (12.1%) |
| 35 to 44 Years | 0 (0.0%) | 3 (7.3%) |
| 45 to 54 Years | 1 (1.5%) | 0 (0.0%) |
| 55 to 64 Years | 0 (0.0%) | 10 (12.5%) |
| 65 to 74 Years | 2 (2.5%) | 2 (4.3%) |
| 75 Years and over | 3 (6.0%) | 12 (30.0%) |
| Total | 12 (2.9%) | 31 (7.5%) |
Income Above Poverty by Sex and Age in Lanesboro
According to the poverty statistics in Lanesboro, males aged under 5 years and females aged under 5 years are the age groups that are most secure financially, with 100.0% of males and 100.0% of females in these age groups living above the poverty line.

| Age Bracket | Male | Female |
| Under 5 Years | 2 (100.0%) | 13 (100.0%) |
| 5 Years | 10 (100.0%) | 2 (100.0%) |
| 6 to 11 Years | 31 (100.0%) | 64 (100.0%) |
| 12 to 14 Years | 14 (100.0%) | 23 (100.0%) |
| 15 Years | 0 (0.0%) | 2 (100.0%) |
| 16 and 17 Years | 12 (100.0%) | 9 (100.0%) |
| 18 to 24 Years | 31 (93.9%) | 9 (100.0%) |
| 25 to 34 Years | 26 (86.7%) | 29 (87.9%) |
| 35 to 44 Years | 60 (100.0%) | 38 (92.7%) |
| 45 to 54 Years | 65 (98.5%) | 50 (100.0%) |
| 55 to 64 Years | 28 (100.0%) | 70 (87.5%) |
| 65 to 74 Years | 78 (97.5%) | 45 (95.7%) |
| 75 Years and over | 47 (94.0%) | 28 (70.0%) |
| Total | 404 (97.1%) | 382 (92.5%) |
Income Below Poverty Among Married-Couple Families in Lanesboro
The poverty statistics for married-couple families in Lanesboro show that 1.1% or 2 of the total 179 families live below the poverty line. Families with no children have the highest poverty rate of 1.7%, comprising of 2 families. On the other hand, families with 1 or 2 children have the lowest poverty rate of 0.0%, which includes 0 families.
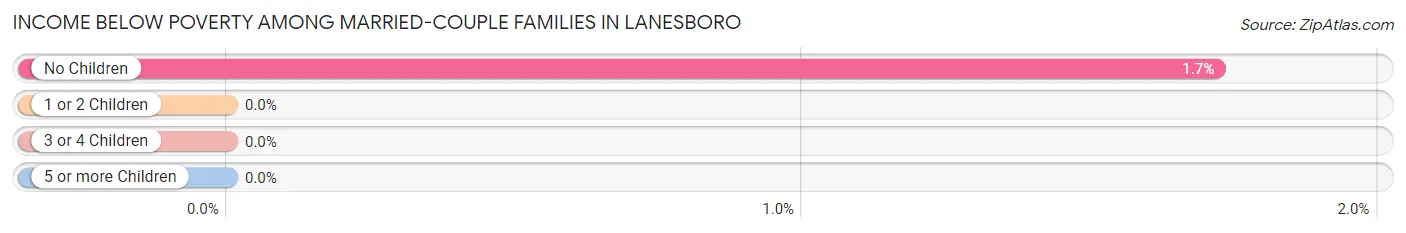
| Children | Above Poverty | Below Poverty |
| No Children | 114 (98.3%) | 2 (1.7%) |
| 1 or 2 Children | 50 (100.0%) | 0 (0.0%) |
| 3 or 4 Children | 13 (100.0%) | 0 (0.0%) |
| 5 or more Children | 0 (0.0%) | 0 (0.0%) |
| Total | 177 (98.9%) | 2 (1.1%) |
Income Below Poverty Among Single-Parent Households in Lanesboro
| Children | Single Father | Single Mother |
| No Children | 0 (0.0%) | 0 (0.0%) |
| 1 or 2 Children | 0 (0.0%) | 0 (0.0%) |
| 3 or 4 Children | 0 (0.0%) | 0 (0.0%) |
| 5 or more Children | 0 (0.0%) | 0 (0.0%) |
| Total | 0 (0.0%) | 0 (0.0%) |
Income Below Poverty Among Married-Couple vs Single-Parent Households in Lanesboro
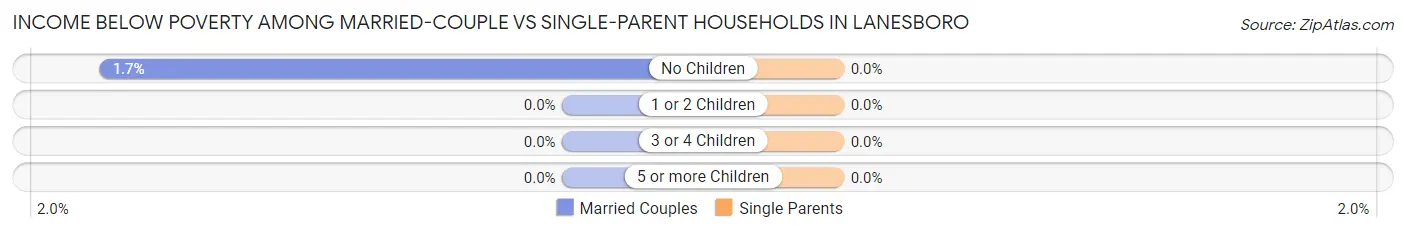
| Children | Married-Couple Families | Single-Parent Households |
| No Children | 2 (1.7%) | 0 (0.0%) |
| 1 or 2 Children | 0 (0.0%) | 0 (0.0%) |
| 3 or 4 Children | 0 (0.0%) | 0 (0.0%) |
| 5 or more Children | 0 (0.0%) | 0 (0.0%) |
| Total | 2 (1.1%) | 0 (0.0%) |
Race in Lanesboro
The most populous races in Lanesboro are White / Caucasian (787 | 94.9%), Two or more Races (42 | 5.1%), and Hispanic or Latino (22 | 2.6%).
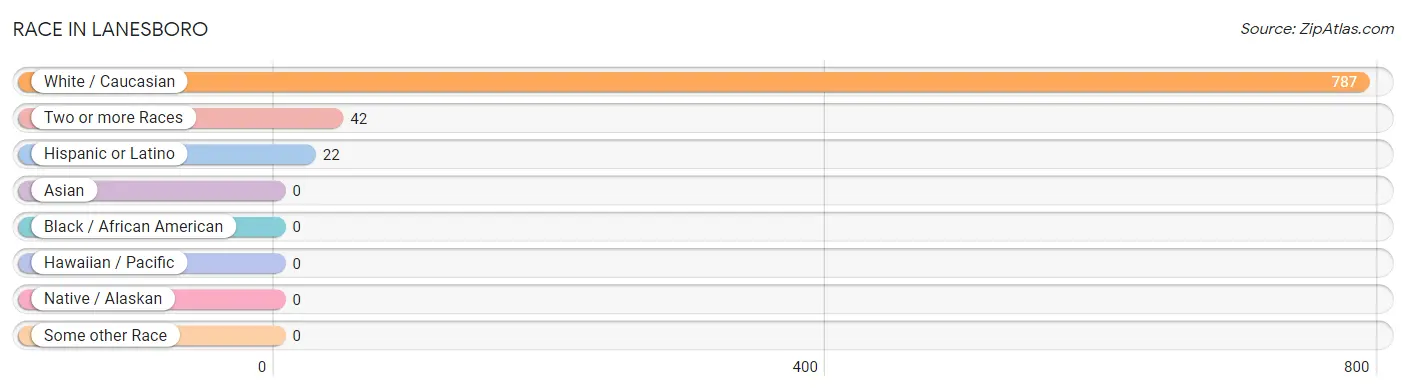
| Race | # Population | % Population |
| Asian | 0 | 0.0% |
| Black / African American | 0 | 0.0% |
| Hawaiian / Pacific | 0 | 0.0% |
| Hispanic or Latino | 22 | 2.6% |
| Native / Alaskan | 0 | 0.0% |
| White / Caucasian | 787 | 94.9% |
| Two or more Races | 42 | 5.1% |
| Some other Race | 0 | 0.0% |
| Total | 829 | 100.0% |
Ancestry in Lanesboro
The most populous ancestries reported in Lanesboro are Norwegian (317 | 38.2%), German (262 | 31.6%), Irish (134 | 16.2%), American (77 | 9.3%), and English (71 | 8.6%), together accounting for 103.8% of all Lanesboro residents.
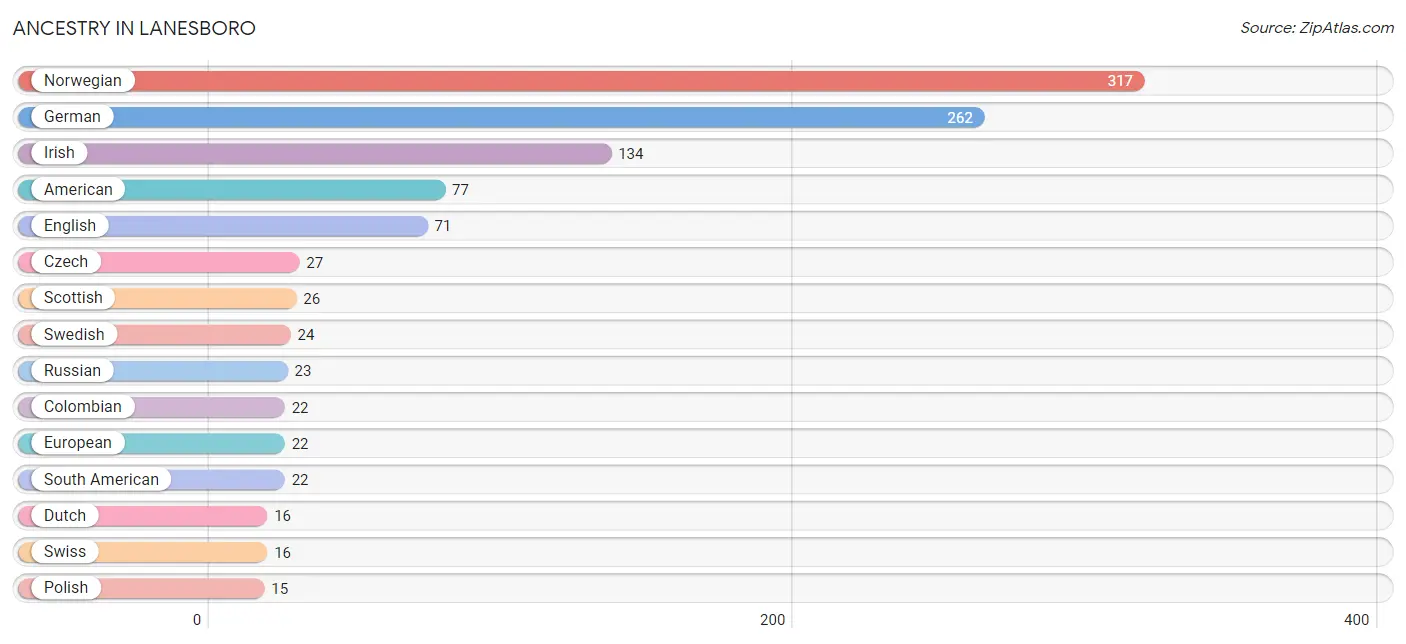
| Ancestry | # Population | % Population |
| American | 77 | 9.3% |
| Arab | 2 | 0.2% |
| Austrian | 1 | 0.1% |
| British | 3 | 0.4% |
| Colombian | 22 | 2.6% |
| Crow | 4 | 0.5% |
| Czech | 27 | 3.3% |
| Danish | 4 | 0.5% |
| Dutch | 16 | 1.9% |
| English | 71 | 8.6% |
| Estonian | 2 | 0.2% |
| European | 22 | 2.6% |
| Finnish | 4 | 0.5% |
| French | 8 | 1.0% |
| German | 262 | 31.6% |
| Iraqi | 2 | 0.2% |
| Irish | 134 | 16.2% |
| Italian | 8 | 1.0% |
| Norwegian | 317 | 38.2% |
| Polish | 15 | 1.8% |
| Russian | 23 | 2.8% |
| Scandinavian | 5 | 0.6% |
| Scotch-Irish | 10 | 1.2% |
| Scottish | 26 | 3.1% |
| South American | 22 | 2.6% |
| Swedish | 24 | 2.9% |
| Swiss | 16 | 1.9% |
| Ukrainian | 2 | 0.2% |
| Welsh | 5 | 0.6% | View All 29 Rows |
Immigrants in Lanesboro
The most numerous immigrant groups reported in Lanesboro came from Colombia (11 | 1.3%), Latin America (11 | 1.3%), South America (11 | 1.3%), Europe (7 | 0.8%), and Western Europe (7 | 0.8%), together accounting for 5.7% of all Lanesboro residents.
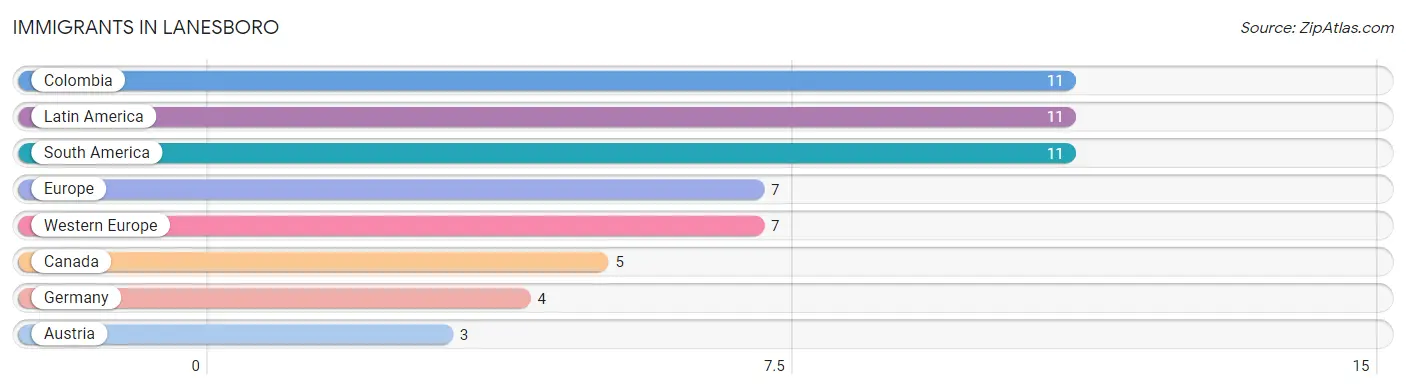
| Immigration Origin | # Population | % Population |
| Austria | 3 | 0.4% |
| Canada | 5 | 0.6% |
| Colombia | 11 | 1.3% |
| Europe | 7 | 0.8% |
| Germany | 4 | 0.5% |
| Latin America | 11 | 1.3% |
| South America | 11 | 1.3% |
| Western Europe | 7 | 0.8% | View All 8 Rows |
Sex and Age in Lanesboro
Sex and Age in Lanesboro
The most populous age groups in Lanesboro are 70 to 74 Years (45 | 10.8%) for men and 10 to 14 Years (60 | 14.5%) for women.
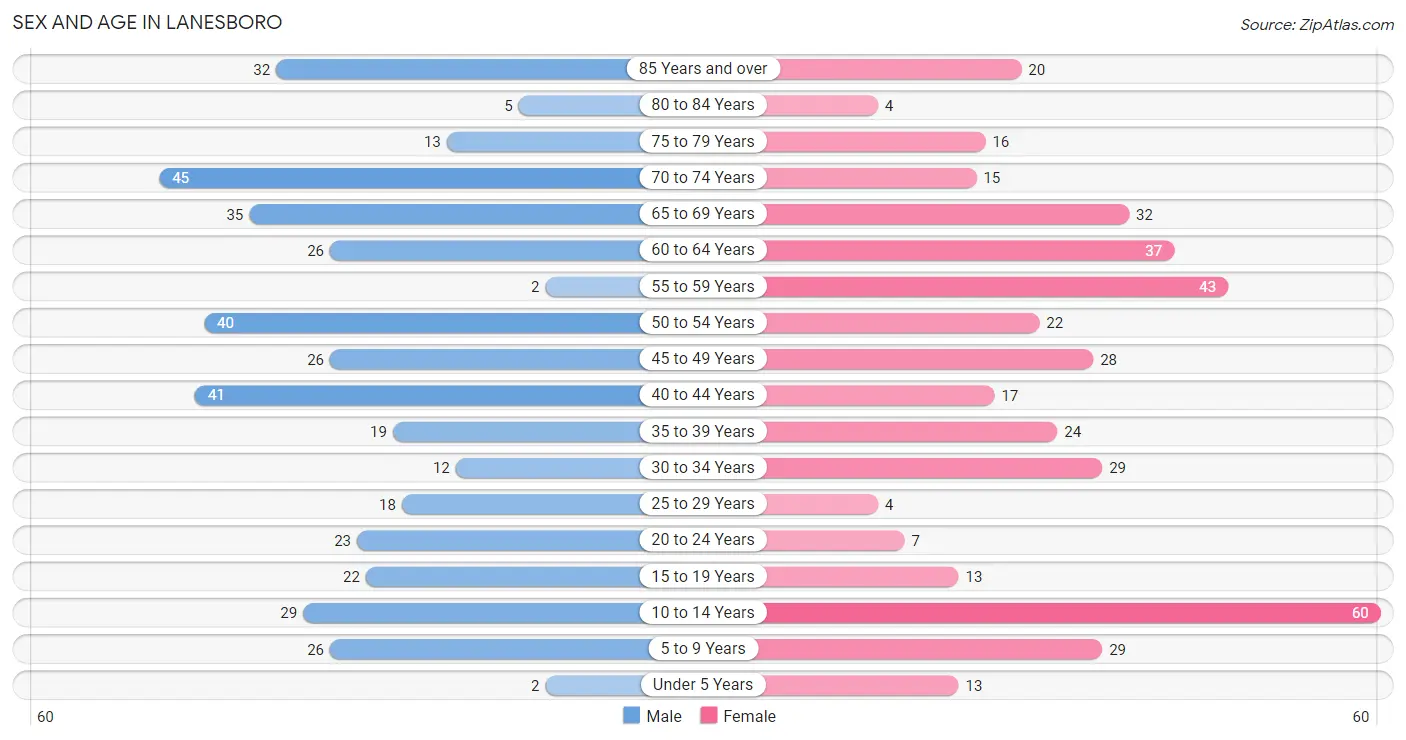
| Age Bracket | Male | Female |
| Under 5 Years | 2 (0.5%) | 13 (3.2%) |
| 5 to 9 Years | 26 (6.2%) | 29 (7.0%) |
| 10 to 14 Years | 29 (7.0%) | 60 (14.5%) |
| 15 to 19 Years | 22 (5.3%) | 13 (3.2%) |
| 20 to 24 Years | 23 (5.5%) | 7 (1.7%) |
| 25 to 29 Years | 18 (4.3%) | 4 (1.0%) |
| 30 to 34 Years | 12 (2.9%) | 29 (7.0%) |
| 35 to 39 Years | 19 (4.6%) | 24 (5.8%) |
| 40 to 44 Years | 41 (9.9%) | 17 (4.1%) |
| 45 to 49 Years | 26 (6.2%) | 28 (6.8%) |
| 50 to 54 Years | 40 (9.6%) | 22 (5.3%) |
| 55 to 59 Years | 2 (0.5%) | 43 (10.4%) |
| 60 to 64 Years | 26 (6.2%) | 37 (9.0%) |
| 65 to 69 Years | 35 (8.4%) | 32 (7.7%) |
| 70 to 74 Years | 45 (10.8%) | 15 (3.6%) |
| 75 to 79 Years | 13 (3.1%) | 16 (3.9%) |
| 80 to 84 Years | 5 (1.2%) | 4 (1.0%) |
| 85 Years and over | 32 (7.7%) | 20 (4.8%) |
| Total | 416 (100.0%) | 413 (100.0%) |
Families and Households in Lanesboro
Median Family Size in Lanesboro
The median family size in Lanesboro is 2.80 persons per family, with single female/mother families (15 | 6.5%) accounting for the largest median family size of 3.87 persons per family. On the other hand, single male/father families (36 | 15.7%) represent the smallest median family size with 1.75 persons per family.
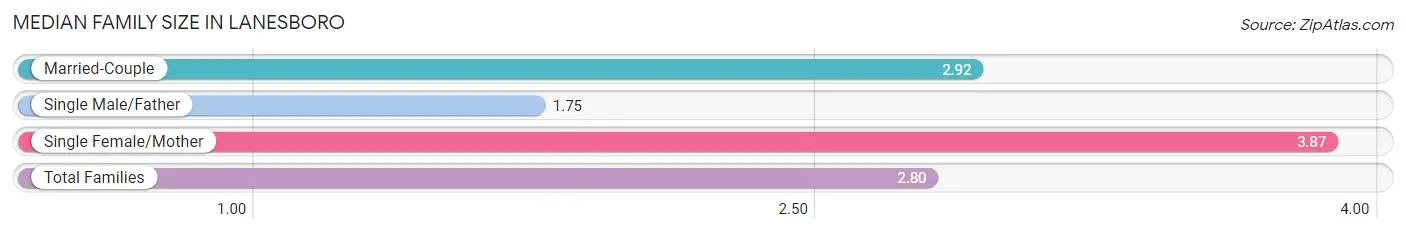
| Family Type | # Families | Family Size |
| Married-Couple | 179 (77.8%) | 2.92 |
| Single Male/Father | 36 (15.7%) | 1.75 |
| Single Female/Mother | 15 (6.5%) | 3.87 |
| Total Families | 230 (100.0%) | 2.80 |
Median Household Size in Lanesboro
The median household size in Lanesboro is 2.18 persons per household, with single female/mother households (15 | 4.0%) accounting for the largest median household size of 4.13 persons per household. non-family households (150 | 39.5%) represent the smallest median household size with 1.09 persons per household.
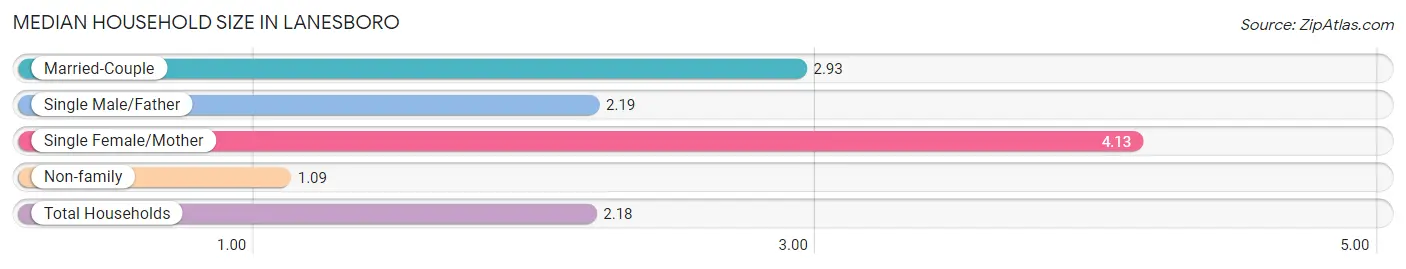
| Household Type | # Households | Household Size |
| Married-Couple | 179 (47.1%) | 2.93 |
| Single Male/Father | 36 (9.5%) | 2.19 |
| Single Female/Mother | 15 (4.0%) | 4.13 |
| Non-family | 150 (39.5%) | 1.09 |
| Total Households | 380 (100.0%) | 2.18 |
Household Size by Marriage Status in Lanesboro
Out of a total of 380 households in Lanesboro, 230 (60.5%) are family households, while 150 (39.5%) are nonfamily households. The most numerous type of family households are 2-person households, comprising 113, and the most common type of nonfamily households are 1-person households, comprising 129.
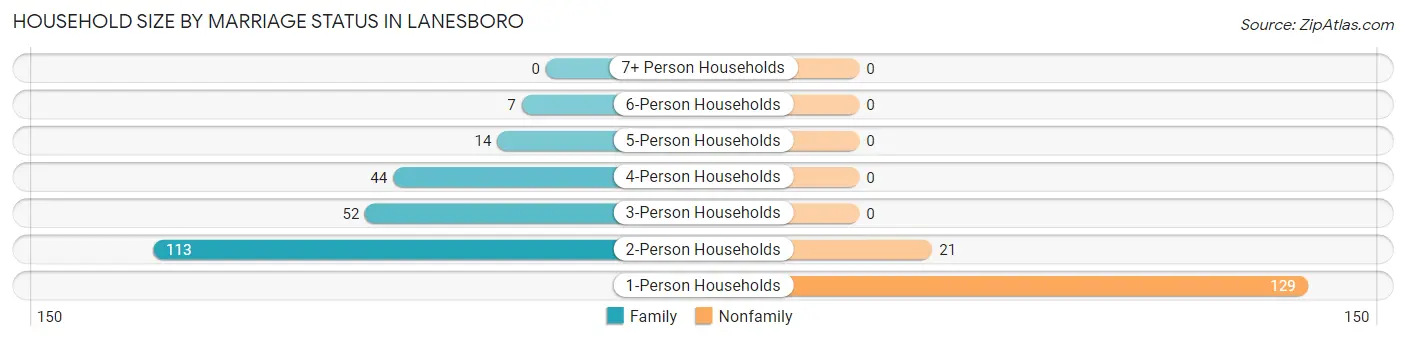
| Household Size | Family Households | Nonfamily Households |
| 1-Person Households | - | 129 (34.0%) |
| 2-Person Households | 113 (29.7%) | 21 (5.5%) |
| 3-Person Households | 52 (13.7%) | 0 (0.0%) |
| 4-Person Households | 44 (11.6%) | 0 (0.0%) |
| 5-Person Households | 14 (3.7%) | 0 (0.0%) |
| 6-Person Households | 7 (1.8%) | 0 (0.0%) |
| 7+ Person Households | 0 (0.0%) | 0 (0.0%) |
| Total | 230 (60.5%) | 150 (39.5%) |
Female Fertility in Lanesboro
Fertility by Age in Lanesboro
Average fertility rate in Lanesboro is 8.0 births per 1,000 women. Women in the age bracket of 20 to 34 years have the highest fertility rate with 25.0 births per 1,000 women. Women in the age bracket of 20 to 34 years acount for 100.0% of all women with births.
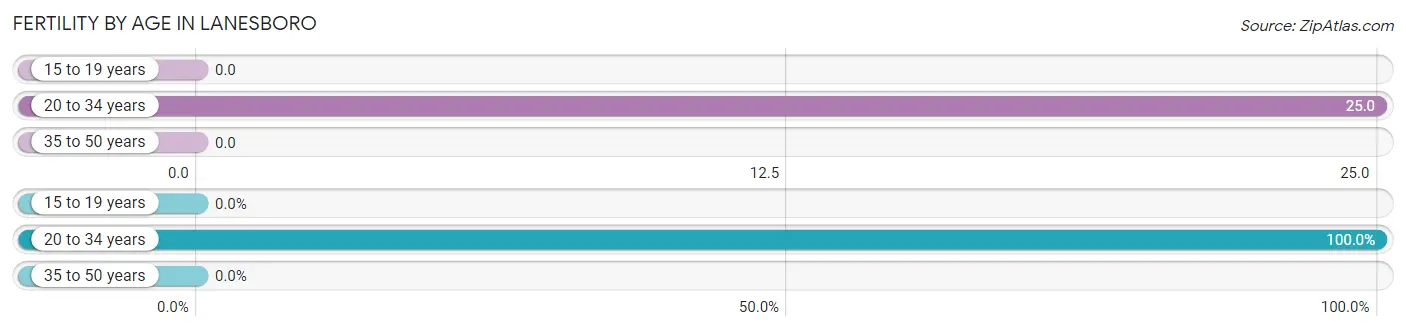
| Age Bracket | Women with Births | Births / 1,000 Women |
| 15 to 19 years | 0 (0.0%) | 0.0 |
| 20 to 34 years | 1 (100.0%) | 25.0 |
| 35 to 50 years | 0 (0.0%) | 0.0 |
| Total | 1 (100.0%) | 8.0 |
Fertility by Age by Marriage Status in Lanesboro

| Age Bracket | Married | Unmarried |
| 15 to 19 years | 0 (0.0%) | 0 (0.0%) |
| 20 to 34 years | 0 (0.0%) | 1 (100.0%) |
| 35 to 50 years | 0 (0.0%) | 0 (0.0%) |
| Total | 0 (0.0%) | 1 (100.0%) |
Fertility by Education in Lanesboro
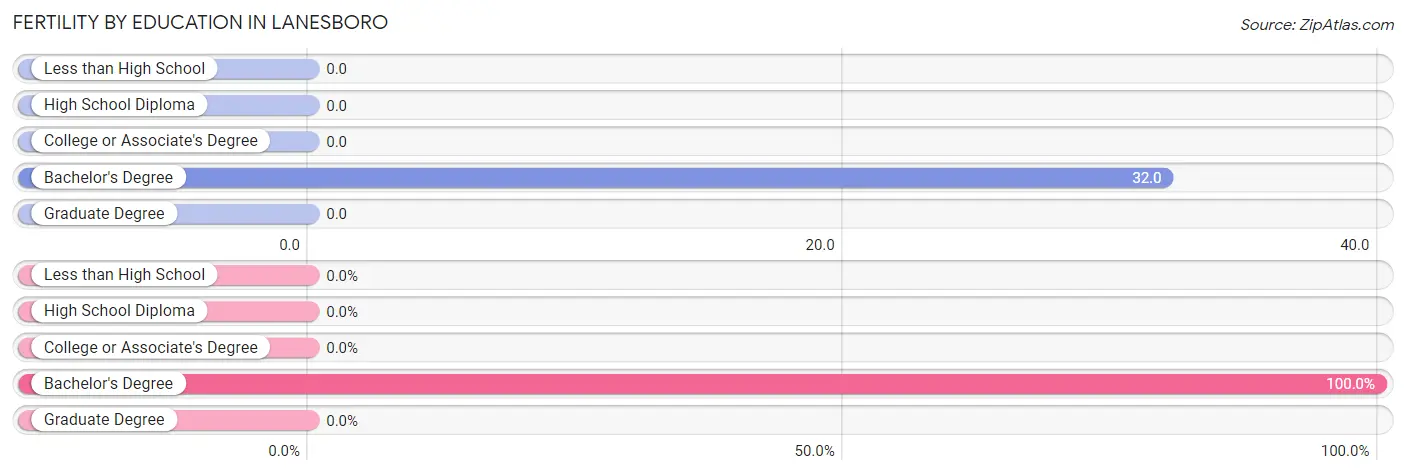
| Educational Attainment | Women with Births | Births / 1,000 Women |
| Less than High School | 0 (0.0%) | 0.0 |
| High School Diploma | 0 (0.0%) | 0.0 |
| College or Associate's Degree | 0 (0.0%) | 0.0 |
| Bachelor's Degree | 1 (100.0%) | 32.0 |
| Graduate Degree | 0 (0.0%) | 0.0 |
| Total | 1 (100.0%) | 8.0 |
Fertility by Education by Marriage Status in Lanesboro
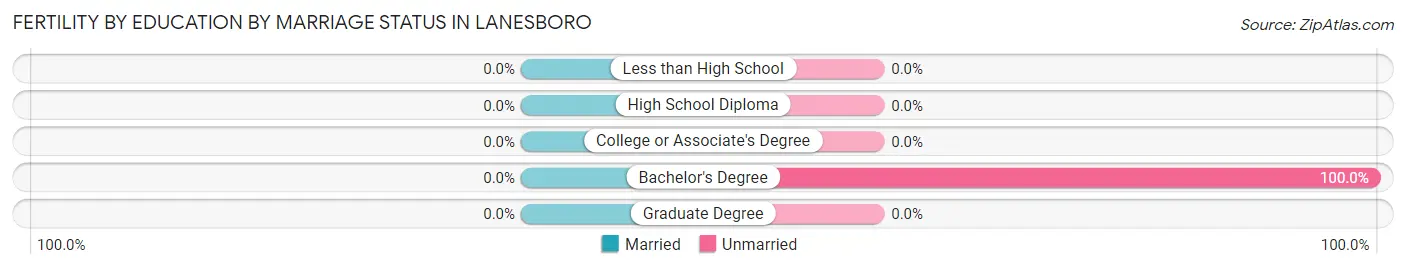
| Educational Attainment | Married | Unmarried |
| Less than High School | 0 (0.0%) | 0 (0.0%) |
| High School Diploma | 0 (0.0%) | 0 (0.0%) |
| College or Associate's Degree | 0 (0.0%) | 0 (0.0%) |
| Bachelor's Degree | 0 (0.0%) | 1 (100.0%) |
| Graduate Degree | 0 (0.0%) | 0 (0.0%) |
| Total | 0 (0.0%) | 1 (100.0%) |
Employment Characteristics in Lanesboro
Employment by Class of Employer in Lanesboro
Among the 416 employed individuals in Lanesboro, private company employees (165 | 39.7%), local government employees (85 | 20.4%), and not-for-profit organizations (83 | 20.0%) make up the most common classes of employment.
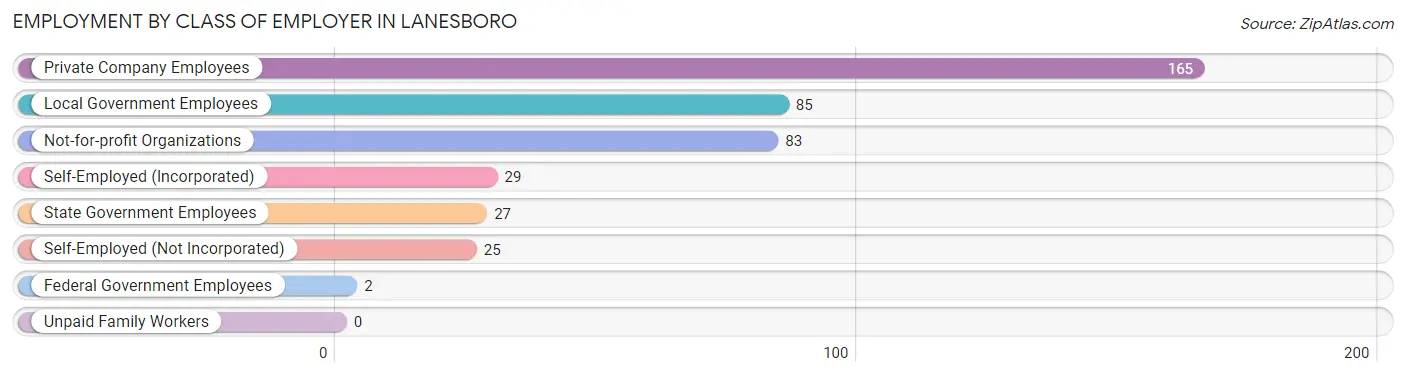
| Employer Class | # Employees | % Employees |
| Private Company Employees | 165 | 39.7% |
| Self-Employed (Incorporated) | 29 | 7.0% |
| Self-Employed (Not Incorporated) | 25 | 6.0% |
| Not-for-profit Organizations | 83 | 20.0% |
| Local Government Employees | 85 | 20.4% |
| State Government Employees | 27 | 6.5% |
| Federal Government Employees | 2 | 0.5% |
| Unpaid Family Workers | 0 | 0.0% |
| Total | 416 | 100.0% |
Employment Status by Age in Lanesboro
According to the labor force statistics for Lanesboro, out of the total population over 16 years of age (668), 63.2% or 422 individuals are in the labor force, with 1.2% or 5 of them unemployed. The age group with the highest labor force participation rate is 20 to 24 years, with 100.0% or 30 individuals in the labor force. Within the labor force, the 20 to 24 years age range has the highest percentage of unemployed individuals, with 10.0% or 3 of them being unemployed.
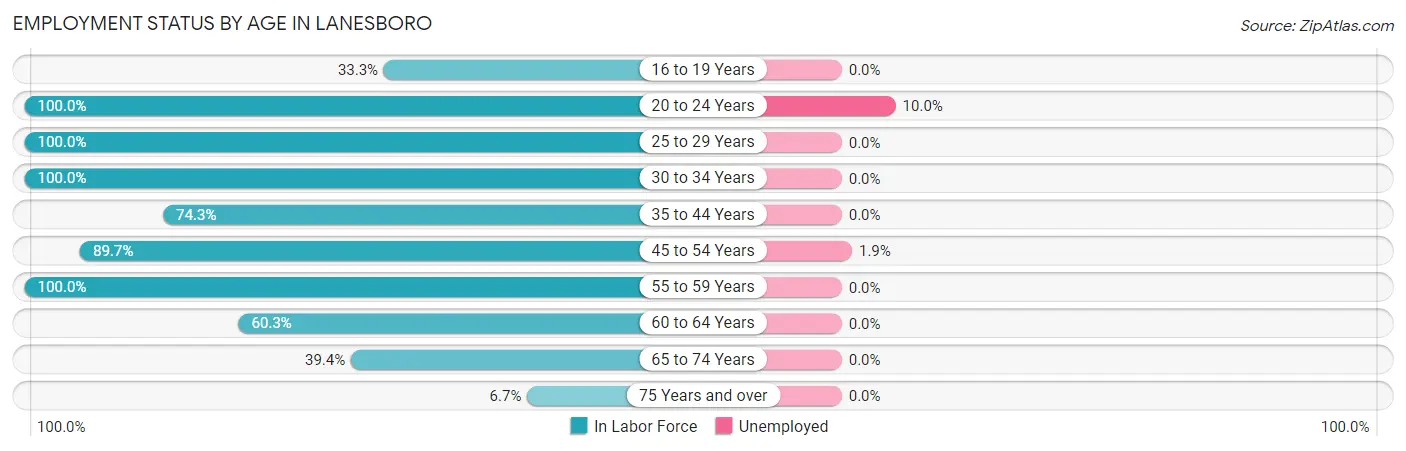
| Age Bracket | In Labor Force | Unemployed |
| 16 to 19 Years | 11 (33.3%) | 0 (0.0%) |
| 20 to 24 Years | 30 (100.0%) | 3 (10.0%) |
| 25 to 29 Years | 22 (100.0%) | 0 (0.0%) |
| 30 to 34 Years | 41 (100.0%) | 0 (0.0%) |
| 35 to 44 Years | 75 (74.3%) | 0 (0.0%) |
| 45 to 54 Years | 104 (89.7%) | 2 (1.9%) |
| 55 to 59 Years | 45 (100.0%) | 0 (0.0%) |
| 60 to 64 Years | 38 (60.3%) | 0 (0.0%) |
| 65 to 74 Years | 50 (39.4%) | 0 (0.0%) |
| 75 Years and over | 6 (6.7%) | 0 (0.0%) |
| Total | 422 (63.2%) | 5 (1.2%) |
Employment Status by Educational Attainment in Lanesboro
According to labor force statistics for Lanesboro, 83.8% of individuals (325) out of the total population between 25 and 64 years of age (388) are in the labor force, with 0.6% or 2 of them being unemployed. The group with the highest labor force participation rate are those with the educational attainment of high school diploma, with 92.6% or 50 individuals in the labor force. Within the labor force, individuals with high school diploma education have the highest percentage of unemployment, with 4.0% or 2 of them being unemployed.

| Educational Attainment | In Labor Force | Unemployed |
| Less than High School | 2 (22.2%) | 0 (0.0%) |
| High School Diploma | 50 (92.6%) | 2 (4.0%) |
| College / Associate Degree | 125 (89.9%) | 0 (0.0%) |
| Bachelor's Degree or higher | 148 (79.6%) | 0 (0.0%) |
| Total | 325 (83.8%) | 2 (0.6%) |
Employment Occupations by Sex in Lanesboro
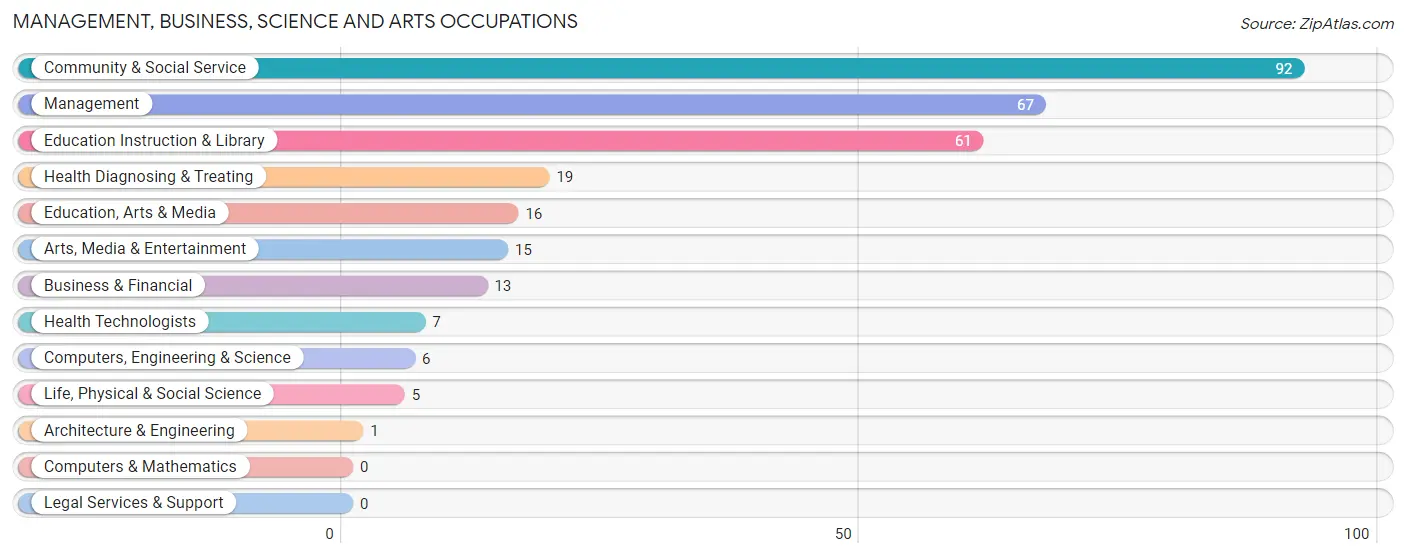
Management, Business, Science and Arts Occupations
The most common Management, Business, Science and Arts occupations in Lanesboro are Community & Social Service (92 | 22.1%), Management (67 | 16.1%), Education Instruction & Library (61 | 14.6%), Health Diagnosing & Treating (19 | 4.6%), and Education, Arts & Media (16 | 3.8%).
Management, Business, Science and Arts Occupations by Sex
Within the Management, Business, Science and Arts occupations in Lanesboro, the most male-oriented occupations are Computers, Engineering & Science (100.0%), Architecture & Engineering (100.0%), and Life, Physical & Social Science (100.0%), while the most female-oriented occupations are Health Diagnosing & Treating (89.5%), Education, Arts & Media (87.5%), and Community & Social Service (72.8%).
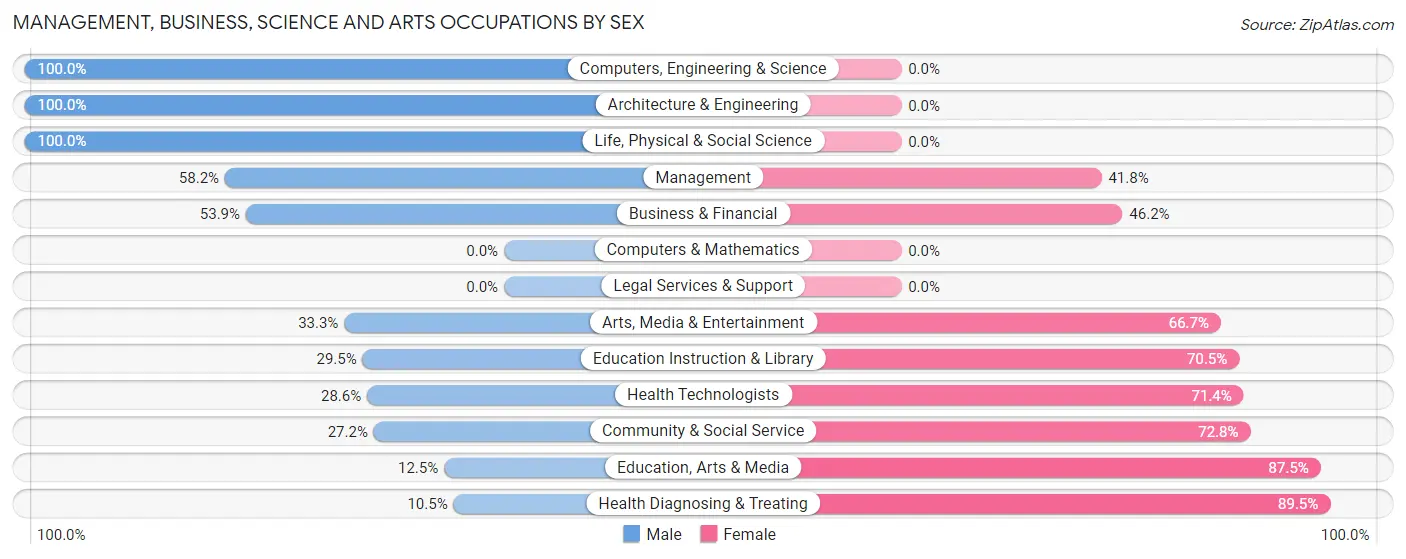
| Occupation | Male | Female |
| Management | 39 (58.2%) | 28 (41.8%) |
| Business & Financial | 7 (53.8%) | 6 (46.2%) |
| Computers, Engineering & Science | 6 (100.0%) | 0 (0.0%) |
| Computers & Mathematics | 0 (0.0%) | 0 (0.0%) |
| Architecture & Engineering | 1 (100.0%) | 0 (0.0%) |
| Life, Physical & Social Science | 5 (100.0%) | 0 (0.0%) |
| Community & Social Service | 25 (27.2%) | 67 (72.8%) |
| Education, Arts & Media | 2 (12.5%) | 14 (87.5%) |
| Legal Services & Support | 0 (0.0%) | 0 (0.0%) |
| Education Instruction & Library | 18 (29.5%) | 43 (70.5%) |
| Arts, Media & Entertainment | 5 (33.3%) | 10 (66.7%) |
| Health Diagnosing & Treating | 2 (10.5%) | 17 (89.5%) |
| Health Technologists | 2 (28.6%) | 5 (71.4%) |
| Total (Category) | 79 (40.1%) | 118 (59.9%) |
| Total (Overall) | 221 (53.0%) | 196 (47.0%) |
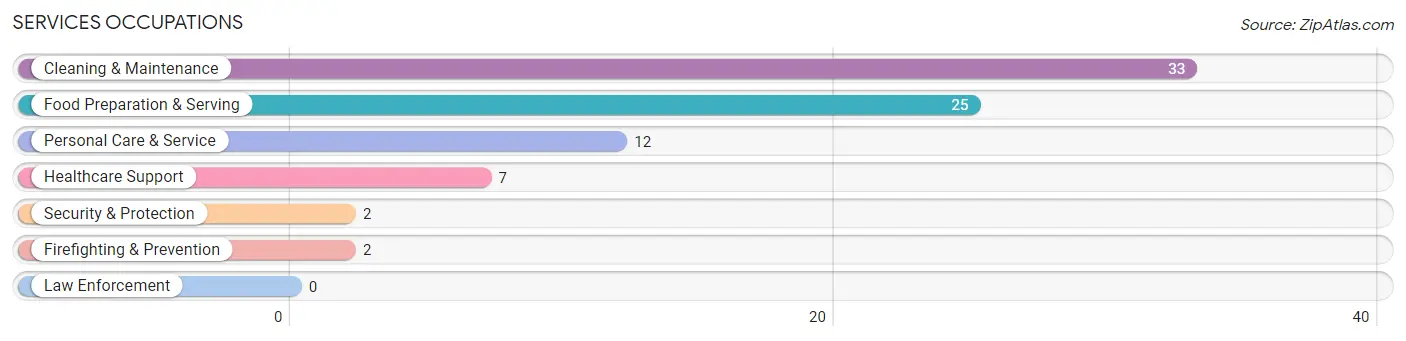
Services Occupations
The most common Services occupations in Lanesboro are Cleaning & Maintenance (33 | 7.9%), Food Preparation & Serving (25 | 6.0%), Personal Care & Service (12 | 2.9%), Healthcare Support (7 | 1.7%), and Security & Protection (2 | 0.5%).
Services Occupations by Sex
Within the Services occupations in Lanesboro, the most male-oriented occupations are Cleaning & Maintenance (84.9%), Food Preparation & Serving (60.0%), and Personal Care & Service (33.3%), while the most female-oriented occupations are Healthcare Support (100.0%), Security & Protection (100.0%), and Firefighting & Prevention (100.0%).
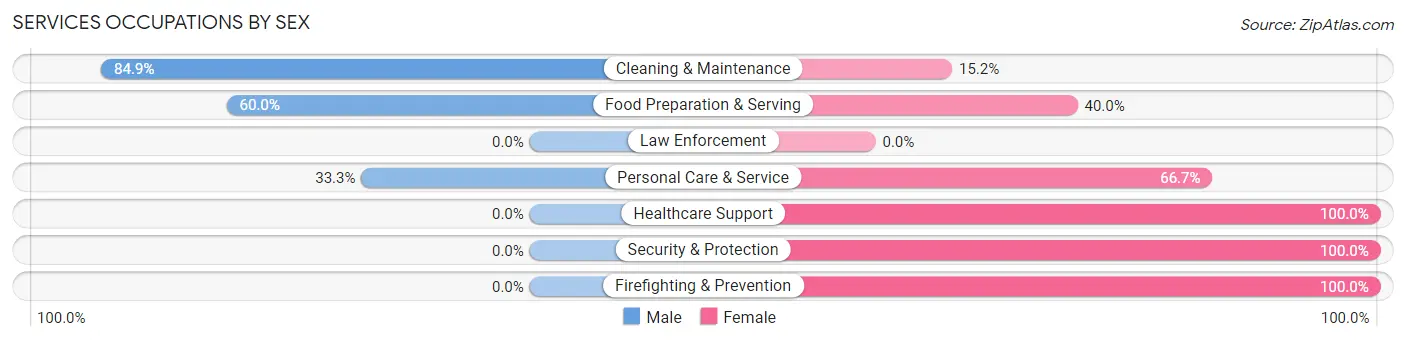
| Occupation | Male | Female |
| Healthcare Support | 0 (0.0%) | 7 (100.0%) |
| Security & Protection | 0 (0.0%) | 2 (100.0%) |
| Firefighting & Prevention | 0 (0.0%) | 2 (100.0%) |
| Law Enforcement | 0 (0.0%) | 0 (0.0%) |
| Food Preparation & Serving | 15 (60.0%) | 10 (40.0%) |
| Cleaning & Maintenance | 28 (84.9%) | 5 (15.1%) |
| Personal Care & Service | 4 (33.3%) | 8 (66.7%) |
| Total (Category) | 47 (59.5%) | 32 (40.5%) |
| Total (Overall) | 221 (53.0%) | 196 (47.0%) |
Sales and Office Occupations
The most common Sales and Office occupations in Lanesboro are Office & Administration (45 | 10.8%), and Sales & Related (28 | 6.7%).

Sales and Office Occupations by Sex

| Occupation | Male | Female |
| Sales & Related | 13 (46.4%) | 15 (53.6%) |
| Office & Administration | 17 (37.8%) | 28 (62.2%) |
| Total (Category) | 30 (41.1%) | 43 (58.9%) |
| Total (Overall) | 221 (53.0%) | 196 (47.0%) |
Natural Resources, Construction and Maintenance Occupations
The most common Natural Resources, Construction and Maintenance occupations in Lanesboro are Construction & Extraction (19 | 4.6%), Farming, Fishing & Forestry (17 | 4.1%), and Installation, Maintenance & Repair (4 | 1.0%).

Natural Resources, Construction and Maintenance Occupations by Sex

| Occupation | Male | Female |
| Farming, Fishing & Forestry | 17 (100.0%) | 0 (0.0%) |
| Construction & Extraction | 19 (100.0%) | 0 (0.0%) |
| Installation, Maintenance & Repair | 4 (100.0%) | 0 (0.0%) |
| Total (Category) | 40 (100.0%) | 0 (0.0%) |
| Total (Overall) | 221 (53.0%) | 196 (47.0%) |
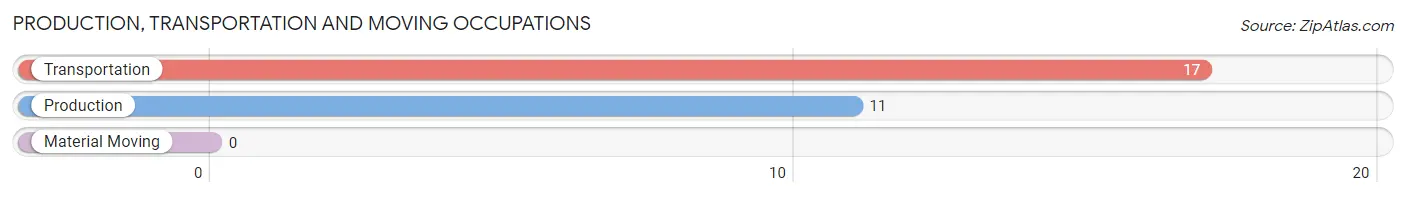
Production, Transportation and Moving Occupations
The most common Production, Transportation and Moving occupations in Lanesboro are Transportation (17 | 4.1%), and Production (11 | 2.6%).
Production, Transportation and Moving Occupations by Sex
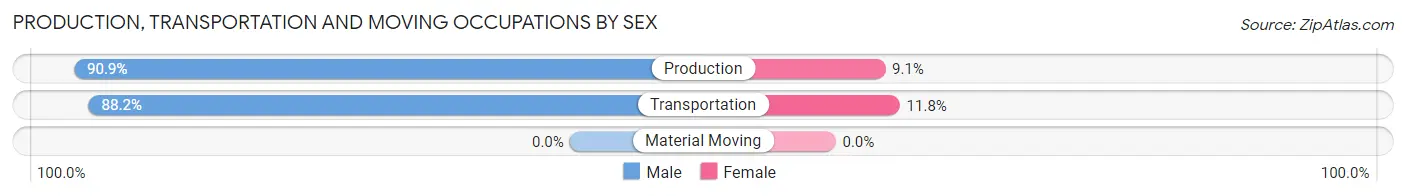
| Occupation | Male | Female |
| Production | 10 (90.9%) | 1 (9.1%) |
| Transportation | 15 (88.2%) | 2 (11.8%) |
| Material Moving | 0 (0.0%) | 0 (0.0%) |
| Total (Category) | 25 (89.3%) | 3 (10.7%) |
| Total (Overall) | 221 (53.0%) | 196 (47.0%) |
Employment Industries by Sex in Lanesboro
Employment Industries in Lanesboro
The major employment industries in Lanesboro include Health Care & Social Assistance (72 | 17.3%), Educational Services (67 | 16.1%), Retail Trade (43 | 10.3%), Accommodation & Food Services (36 | 8.6%), and Manufacturing (29 | 7.0%).
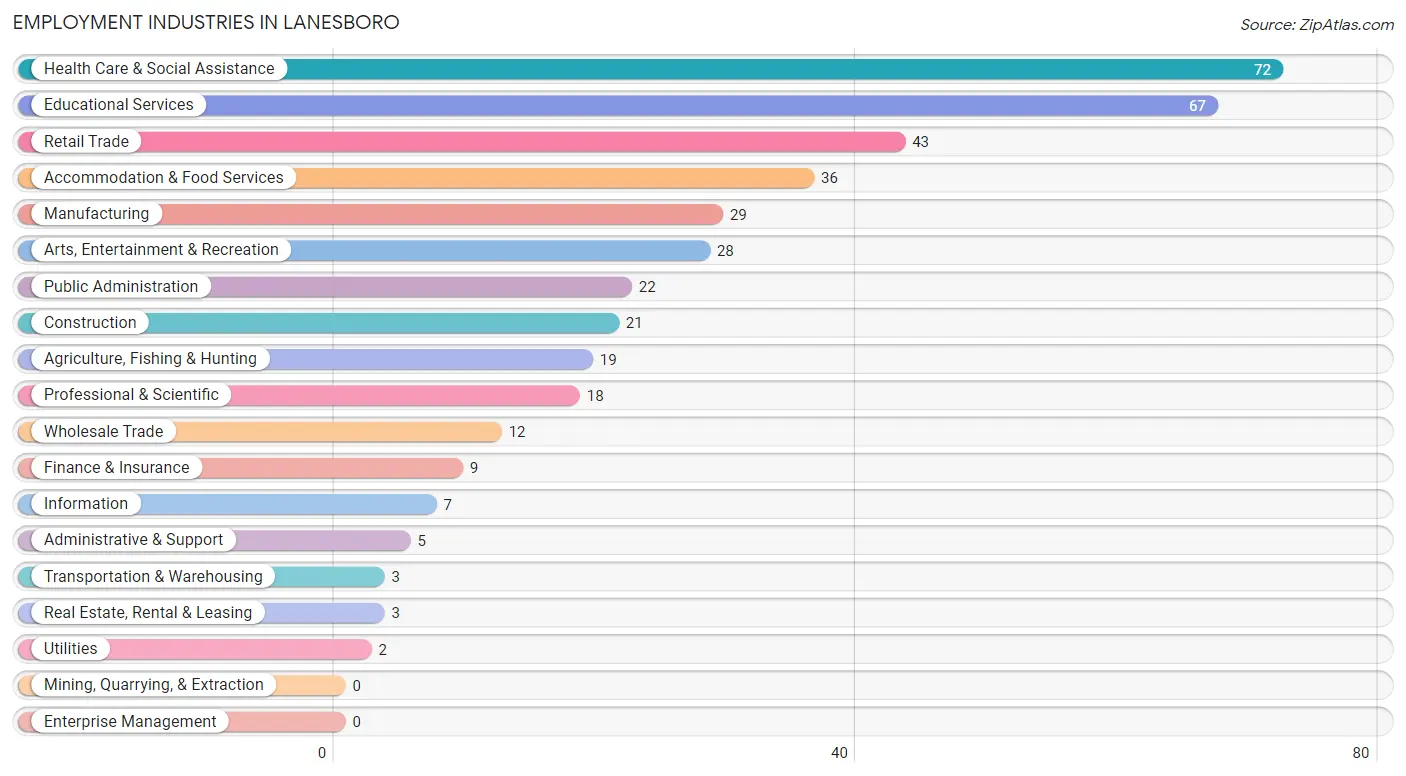
Employment Industries by Sex in Lanesboro
The Lanesboro industries that see more men than women are Agriculture, Fishing & Hunting (100.0%), Utilities (100.0%), and Administrative & Support (100.0%), whereas the industries that tend to have a higher number of women are Health Care & Social Assistance (83.3%), Finance & Insurance (77.8%), and Information (71.4%).
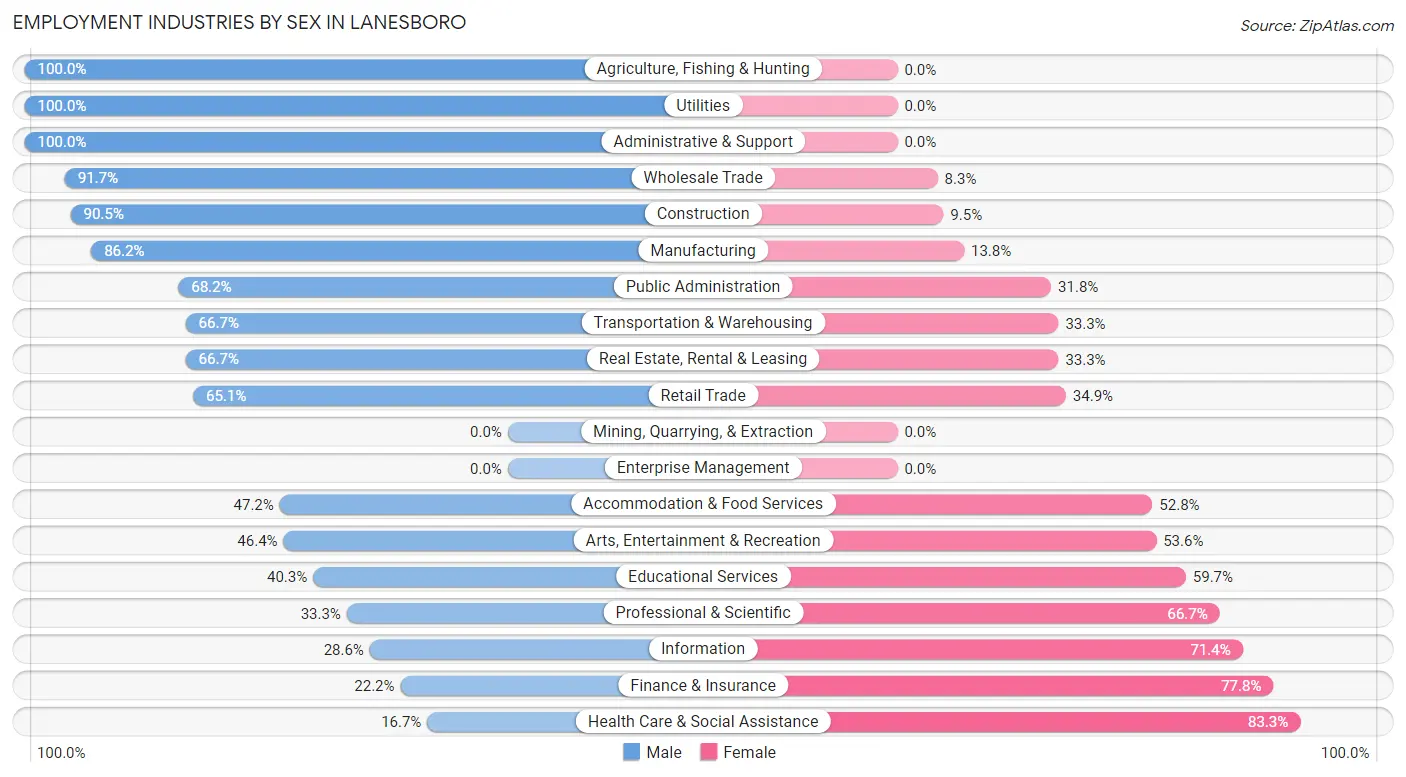
| Industry | Male | Female |
| Agriculture, Fishing & Hunting | 19 (100.0%) | 0 (0.0%) |
| Mining, Quarrying, & Extraction | 0 (0.0%) | 0 (0.0%) |
| Construction | 19 (90.5%) | 2 (9.5%) |
| Manufacturing | 25 (86.2%) | 4 (13.8%) |
| Wholesale Trade | 11 (91.7%) | 1 (8.3%) |
| Retail Trade | 28 (65.1%) | 15 (34.9%) |
| Transportation & Warehousing | 2 (66.7%) | 1 (33.3%) |
| Utilities | 2 (100.0%) | 0 (0.0%) |
| Information | 2 (28.6%) | 5 (71.4%) |
| Finance & Insurance | 2 (22.2%) | 7 (77.8%) |
| Real Estate, Rental & Leasing | 2 (66.7%) | 1 (33.3%) |
| Professional & Scientific | 6 (33.3%) | 12 (66.7%) |
| Enterprise Management | 0 (0.0%) | 0 (0.0%) |
| Administrative & Support | 5 (100.0%) | 0 (0.0%) |
| Educational Services | 27 (40.3%) | 40 (59.7%) |
| Health Care & Social Assistance | 12 (16.7%) | 60 (83.3%) |
| Arts, Entertainment & Recreation | 13 (46.4%) | 15 (53.6%) |
| Accommodation & Food Services | 17 (47.2%) | 19 (52.8%) |
| Public Administration | 15 (68.2%) | 7 (31.8%) |
| Total | 221 (53.0%) | 196 (47.0%) |
Education in Lanesboro
School Enrollment in Lanesboro
The most common levels of schooling among the 206 students in Lanesboro are middle school (76 | 36.9%), elementary school (38 | 18.4%), and high school (33 | 16.0%).
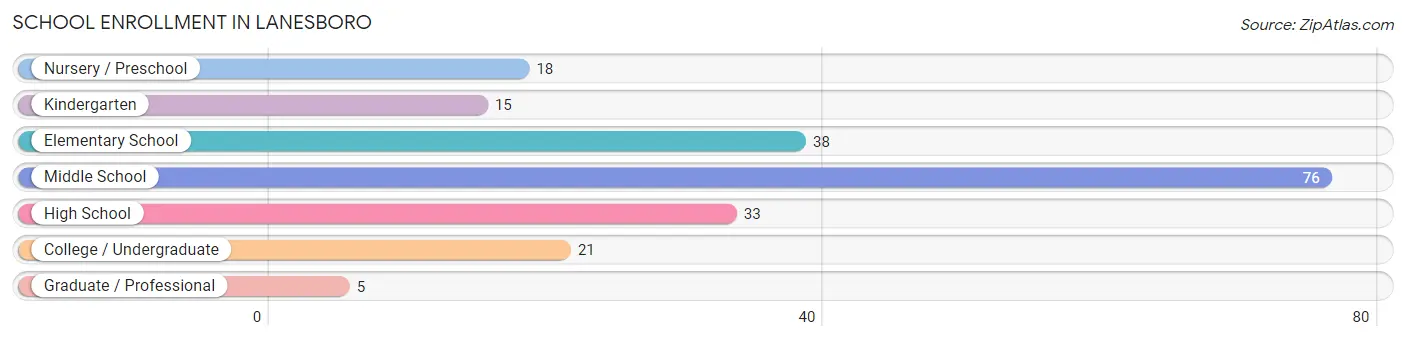
| School Level | # Students | % Students |
| Nursery / Preschool | 18 | 8.7% |
| Kindergarten | 15 | 7.3% |
| Elementary School | 38 | 18.4% |
| Middle School | 76 | 36.9% |
| High School | 33 | 16.0% |
| College / Undergraduate | 21 | 10.2% |
| Graduate / Professional | 5 | 2.4% |
| Total | 206 | 100.0% |
School Enrollment by Age by Funding Source in Lanesboro
Out of a total of 206 students who are enrolled in schools in Lanesboro, 19 (9.2%) attend a private institution, while the remaining 187 (90.8%) are enrolled in public schools. The age group of 20 to 24 year olds has the highest likelihood of being enrolled in private schools, with 10 (76.9% in the age bracket) enrolled. Conversely, the age group of 3 to 4 year olds has the lowest likelihood of being enrolled in a private school, with 8 (100.0% in the age bracket) attending a public institution.
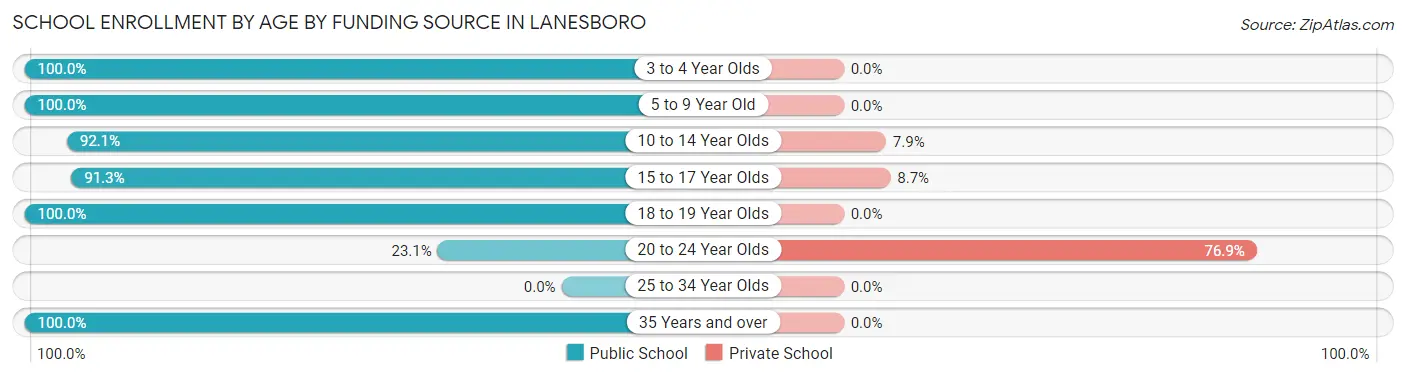
| Age Bracket | Public School | Private School |
| 3 to 4 Year Olds | 8 (100.0%) | 0 (0.0%) |
| 5 to 9 Year Old | 53 (100.0%) | 0 (0.0%) |
| 10 to 14 Year Olds | 82 (92.1%) | 7 (7.9%) |
| 15 to 17 Year Olds | 21 (91.3%) | 2 (8.7%) |
| 18 to 19 Year Olds | 12 (100.0%) | 0 (0.0%) |
| 20 to 24 Year Olds | 3 (23.1%) | 10 (76.9%) |
| 25 to 34 Year Olds | 0 (0.0%) | 0 (0.0%) |
| 35 Years and over | 8 (100.0%) | 0 (0.0%) |
| Total | 187 (90.8%) | 19 (9.2%) |
Educational Attainment by Field of Study in Lanesboro
Education (59 | 20.6%), arts & humanities (38 | 13.2%), business (35 | 12.2%), visual & performing arts (26 | 9.1%), and bio, nature & agricultural (20 | 7.0%) are the most common fields of study among 287 individuals in Lanesboro who have obtained a bachelor's degree or higher.
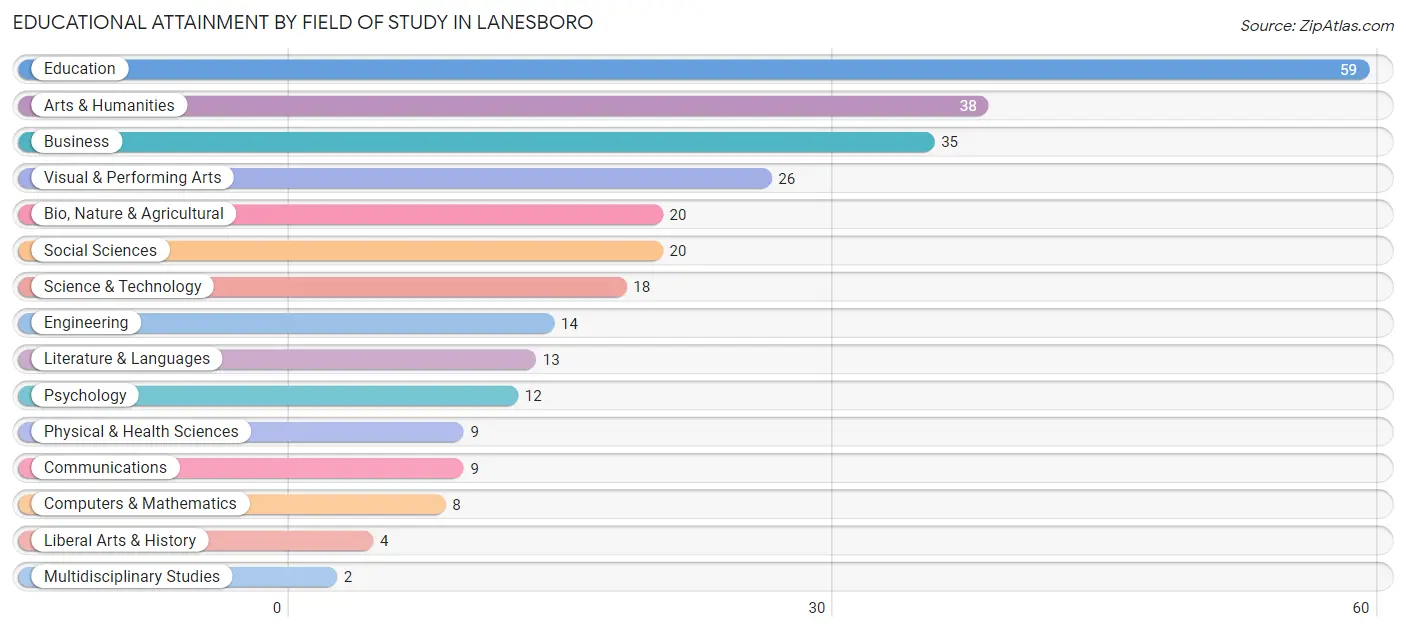
| Field of Study | # Graduates | % Graduates |
| Computers & Mathematics | 8 | 2.8% |
| Bio, Nature & Agricultural | 20 | 7.0% |
| Physical & Health Sciences | 9 | 3.1% |
| Psychology | 12 | 4.2% |
| Social Sciences | 20 | 7.0% |
| Engineering | 14 | 4.9% |
| Multidisciplinary Studies | 2 | 0.7% |
| Science & Technology | 18 | 6.3% |
| Business | 35 | 12.2% |
| Education | 59 | 20.6% |
| Literature & Languages | 13 | 4.5% |
| Liberal Arts & History | 4 | 1.4% |
| Visual & Performing Arts | 26 | 9.1% |
| Communications | 9 | 3.1% |
| Arts & Humanities | 38 | 13.2% |
| Total | 287 | 100.0% |
Transportation & Commute in Lanesboro
Vehicle Availability by Sex in Lanesboro
The most prevalent vehicle ownership categories in Lanesboro are males with 2 vehicles (107, accounting for 48.4%) and females with 2 vehicles (94, making up 54.9%).
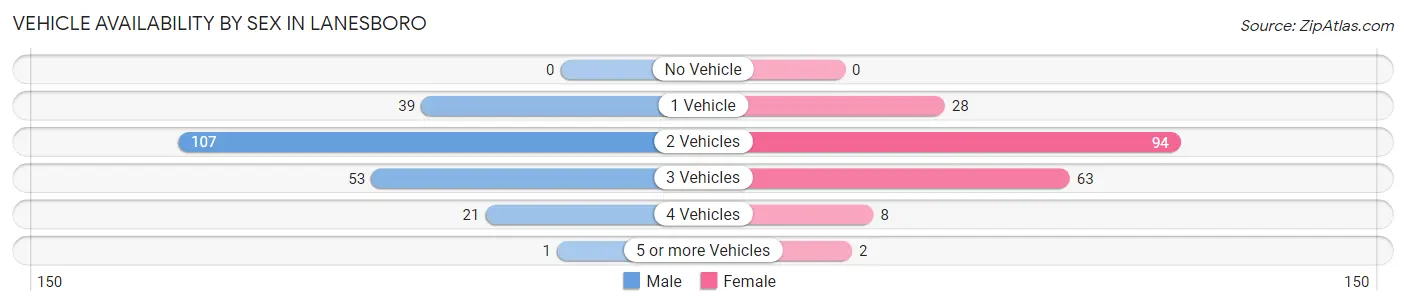
| Vehicles Available | Male | Female |
| No Vehicle | 0 (0.0%) | 0 (0.0%) |
| 1 Vehicle | 39 (17.6%) | 28 (14.4%) |
| 2 Vehicles | 107 (48.4%) | 94 (48.2%) |
| 3 Vehicles | 53 (24.0%) | 63 (32.3%) |
| 4 Vehicles | 21 (9.5%) | 8 (4.1%) |
| 5 or more Vehicles | 1 (0.4%) | 2 (1.0%) |
| Total | 221 (100.0%) | 195 (100.0%) |
Commute Time in Lanesboro
The most frequently occuring commute durations in Lanesboro are 5 to 9 minutes (107 commuters, 27.2%), 45 to 59 minutes (84 commuters, 21.3%), and less than 5 minutes (54 commuters, 13.7%).
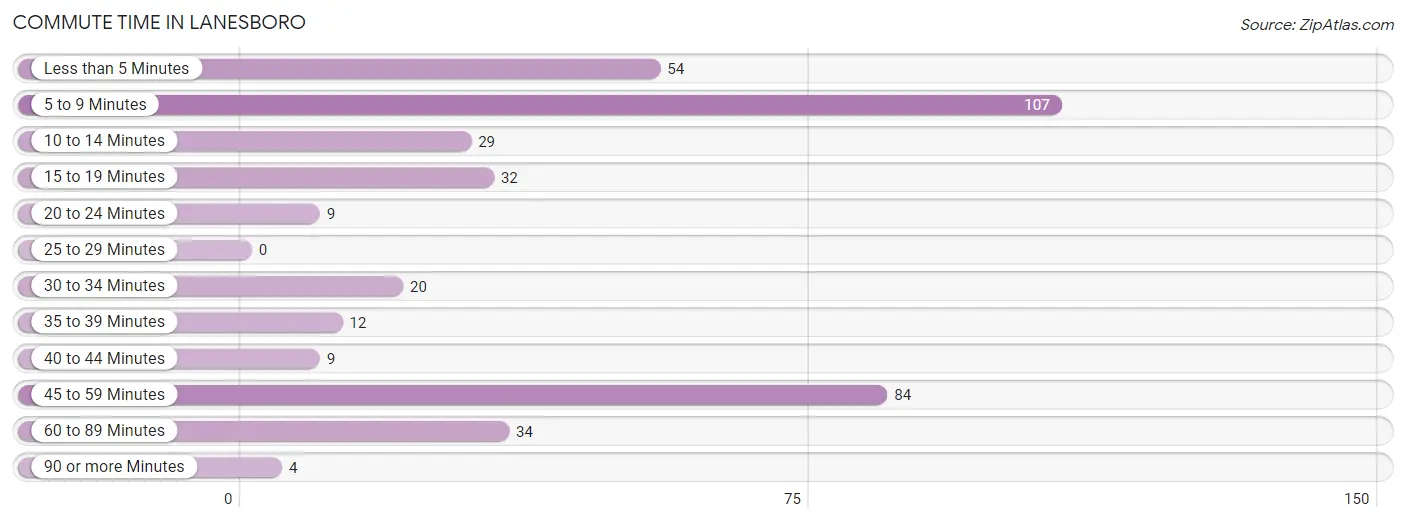
| Commute Time | # Commuters | % Commuters |
| Less than 5 Minutes | 54 | 13.7% |
| 5 to 9 Minutes | 107 | 27.2% |
| 10 to 14 Minutes | 29 | 7.4% |
| 15 to 19 Minutes | 32 | 8.1% |
| 20 to 24 Minutes | 9 | 2.3% |
| 25 to 29 Minutes | 0 | 0.0% |
| 30 to 34 Minutes | 20 | 5.1% |
| 35 to 39 Minutes | 12 | 3.0% |
| 40 to 44 Minutes | 9 | 2.3% |
| 45 to 59 Minutes | 84 | 21.3% |
| 60 to 89 Minutes | 34 | 8.6% |
| 90 or more Minutes | 4 | 1.0% |
Commute Time by Sex in Lanesboro
The most common commute times in Lanesboro are 5 to 9 minutes (51 commuters, 23.5%) for males and 5 to 9 minutes (56 commuters, 31.6%) for females.
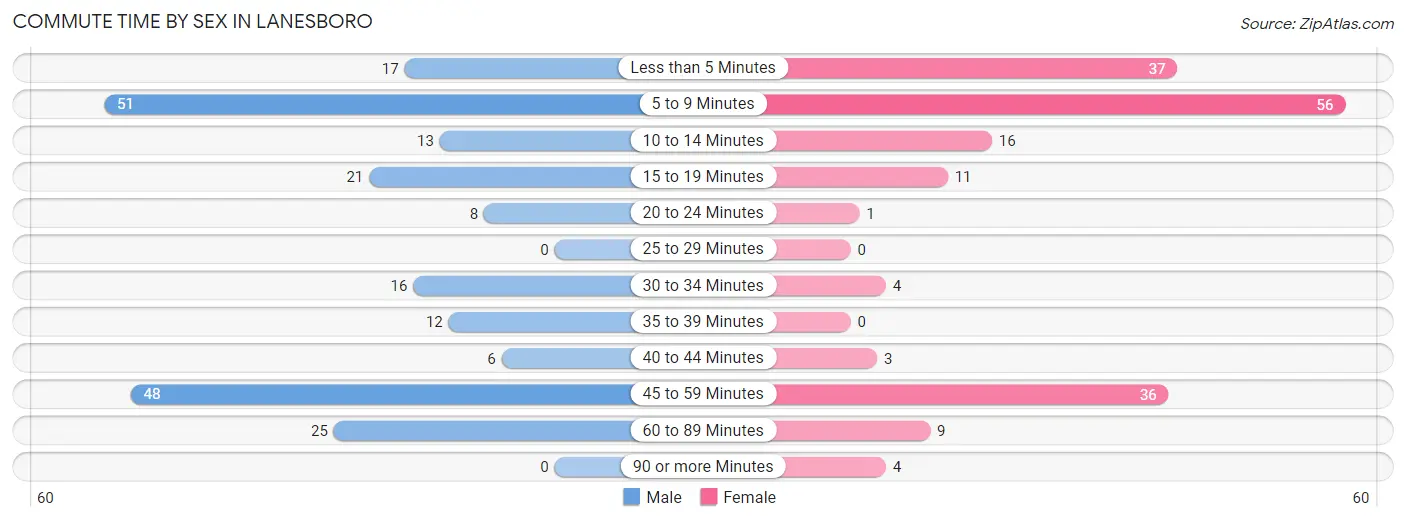
| Commute Time | Male | Female |
| Less than 5 Minutes | 17 (7.8%) | 37 (20.9%) |
| 5 to 9 Minutes | 51 (23.5%) | 56 (31.6%) |
| 10 to 14 Minutes | 13 (6.0%) | 16 (9.0%) |
| 15 to 19 Minutes | 21 (9.7%) | 11 (6.2%) |
| 20 to 24 Minutes | 8 (3.7%) | 1 (0.6%) |
| 25 to 29 Minutes | 0 (0.0%) | 0 (0.0%) |
| 30 to 34 Minutes | 16 (7.4%) | 4 (2.3%) |
| 35 to 39 Minutes | 12 (5.5%) | 0 (0.0%) |
| 40 to 44 Minutes | 6 (2.8%) | 3 (1.7%) |
| 45 to 59 Minutes | 48 (22.1%) | 36 (20.3%) |
| 60 to 89 Minutes | 25 (11.5%) | 9 (5.1%) |
| 90 or more Minutes | 0 (0.0%) | 4 (2.3%) |
Time of Departure to Work by Sex in Lanesboro
The most frequent times of departure to work in Lanesboro are 8:00 AM to 8:29 AM (46, 21.2%) for males and 7:00 AM to 7:29 AM (41, 23.2%) for females.
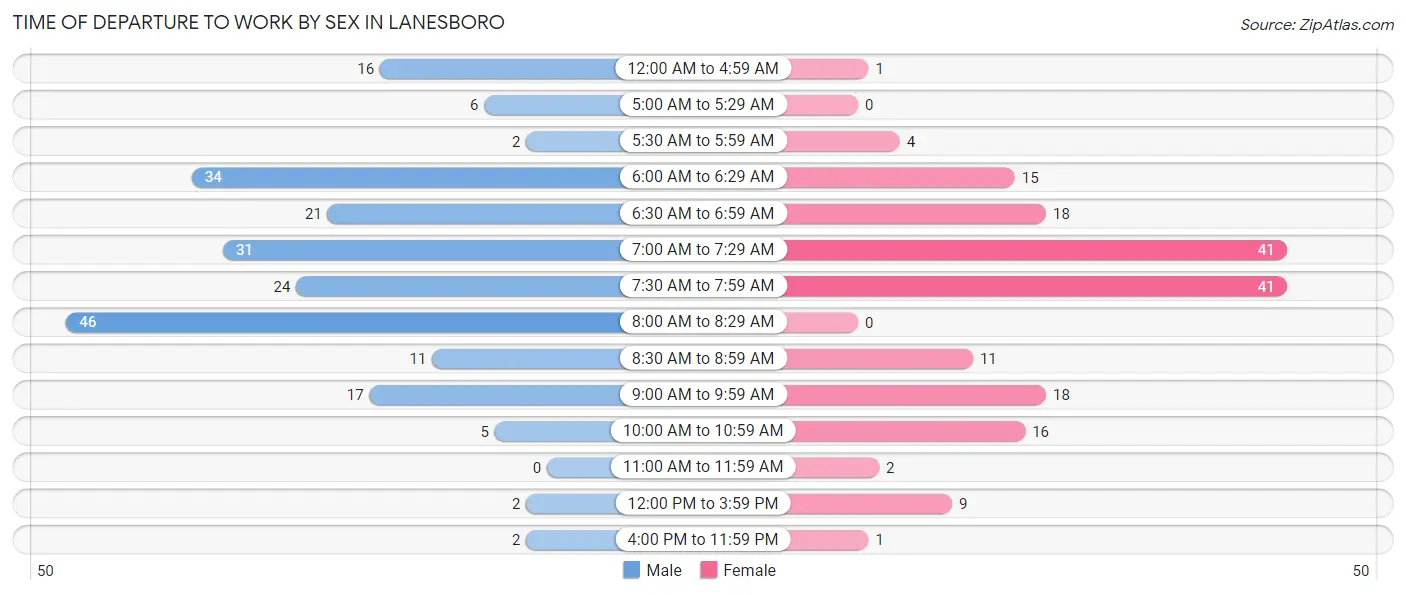
| Time of Departure | Male | Female |
| 12:00 AM to 4:59 AM | 16 (7.4%) | 1 (0.6%) |
| 5:00 AM to 5:29 AM | 6 (2.8%) | 0 (0.0%) |
| 5:30 AM to 5:59 AM | 2 (0.9%) | 4 (2.3%) |
| 6:00 AM to 6:29 AM | 34 (15.7%) | 15 (8.5%) |
| 6:30 AM to 6:59 AM | 21 (9.7%) | 18 (10.2%) |
| 7:00 AM to 7:29 AM | 31 (14.3%) | 41 (23.2%) |
| 7:30 AM to 7:59 AM | 24 (11.1%) | 41 (23.2%) |
| 8:00 AM to 8:29 AM | 46 (21.2%) | 0 (0.0%) |
| 8:30 AM to 8:59 AM | 11 (5.1%) | 11 (6.2%) |
| 9:00 AM to 9:59 AM | 17 (7.8%) | 18 (10.2%) |
| 10:00 AM to 10:59 AM | 5 (2.3%) | 16 (9.0%) |
| 11:00 AM to 11:59 AM | 0 (0.0%) | 2 (1.1%) |
| 12:00 PM to 3:59 PM | 2 (0.9%) | 9 (5.1%) |
| 4:00 PM to 11:59 PM | 2 (0.9%) | 1 (0.6%) |
| Total | 217 (100.0%) | 177 (100.0%) |
Housing Occupancy in Lanesboro
Occupancy by Ownership in Lanesboro
Of the total 380 dwellings in Lanesboro, owner-occupied units account for 267 (70.3%), while renter-occupied units make up 113 (29.7%).
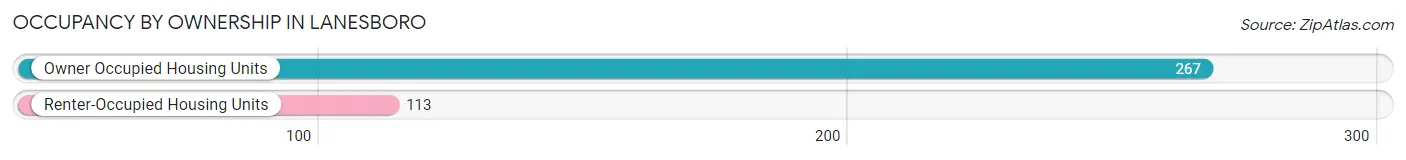
| Occupancy | # Housing Units | % Housing Units |
| Owner Occupied Housing Units | 267 | 70.3% |
| Renter-Occupied Housing Units | 113 | 29.7% |
| Total Occupied Housing Units | 380 | 100.0% |
Occupancy by Household Size in Lanesboro
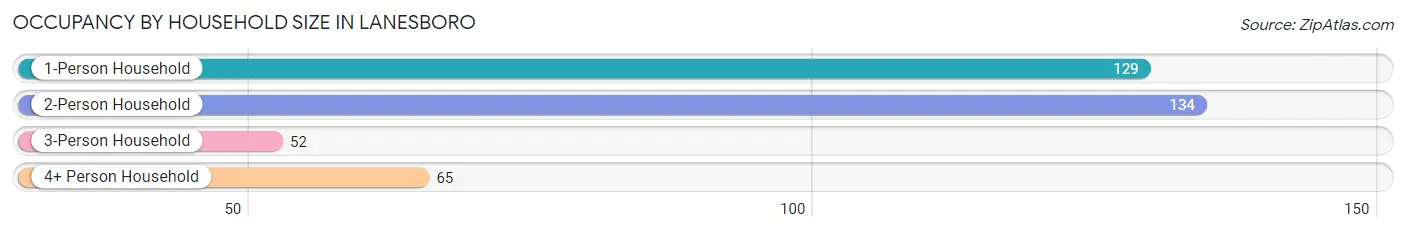
| Household Size | # Housing Units | % Housing Units |
| 1-Person Household | 129 | 34.0% |
| 2-Person Household | 134 | 35.3% |
| 3-Person Household | 52 | 13.7% |
| 4+ Person Household | 65 | 17.1% |
| Total Housing Units | 380 | 100.0% |
Occupancy by Ownership by Household Size in Lanesboro
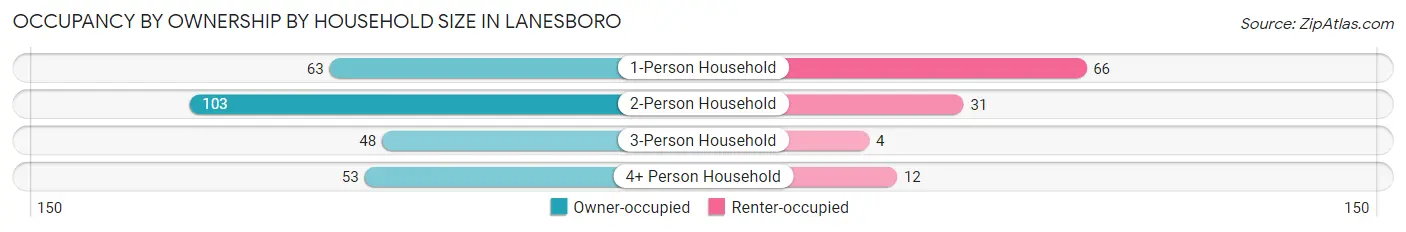
| Household Size | Owner-occupied | Renter-occupied |
| 1-Person Household | 63 (48.8%) | 66 (51.2%) |
| 2-Person Household | 103 (76.9%) | 31 (23.1%) |
| 3-Person Household | 48 (92.3%) | 4 (7.7%) |
| 4+ Person Household | 53 (81.5%) | 12 (18.5%) |
| Total Housing Units | 267 (70.3%) | 113 (29.7%) |
Occupancy by Educational Attainment in Lanesboro
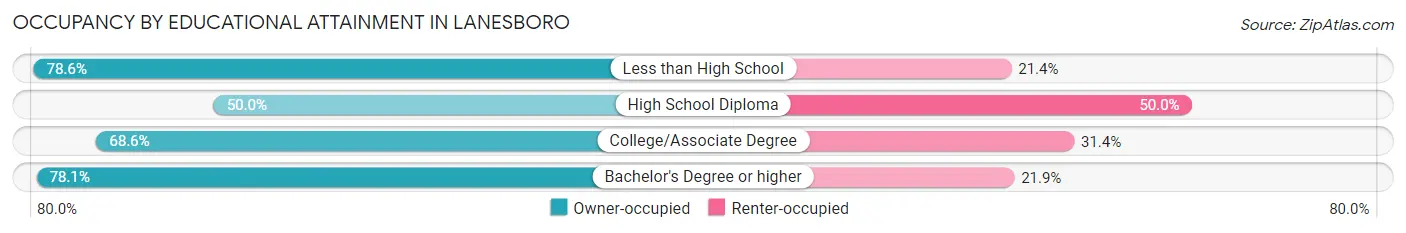
| Household Size | Owner-occupied | Renter-occupied |
| Less than High School | 11 (78.6%) | 3 (21.4%) |
| High School Diploma | 30 (50.0%) | 30 (50.0%) |
| College/Associate Degree | 94 (68.6%) | 43 (31.4%) |
| Bachelor's Degree or higher | 132 (78.1%) | 37 (21.9%) |
Occupancy by Age of Householder in Lanesboro
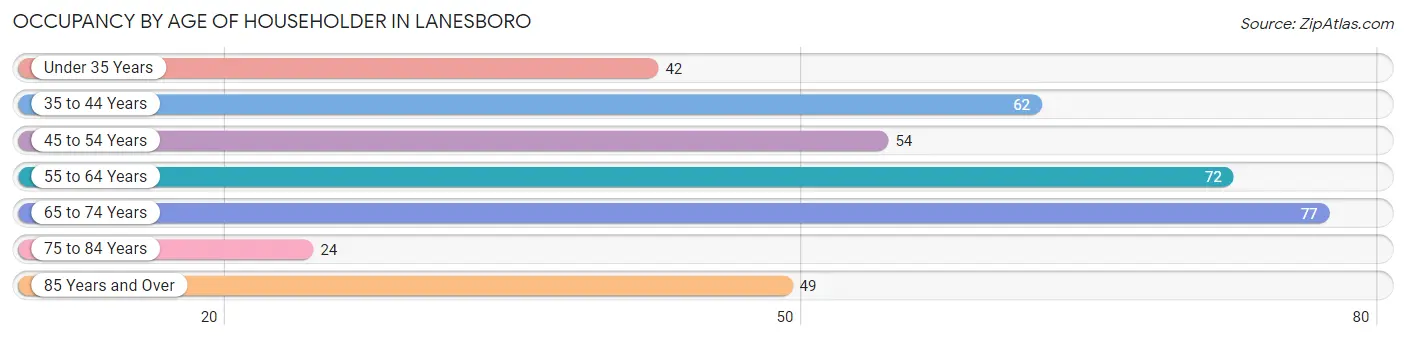
| Age Bracket | # Households | % Households |
| Under 35 Years | 42 | 11.1% |
| 35 to 44 Years | 62 | 16.3% |
| 45 to 54 Years | 54 | 14.2% |
| 55 to 64 Years | 72 | 19.0% |
| 65 to 74 Years | 77 | 20.3% |
| 75 to 84 Years | 24 | 6.3% |
| 85 Years and Over | 49 | 12.9% |
| Total | 380 | 100.0% |
Housing Finances in Lanesboro
Median Income by Occupancy in Lanesboro
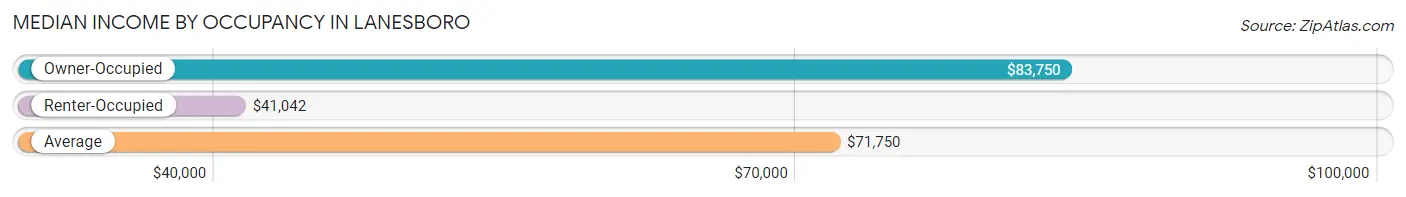
| Occupancy Type | # Households | Median Income |
| Owner-Occupied | 267 (70.3%) | $83,750 |
| Renter-Occupied | 113 (29.7%) | $41,042 |
| Average | 380 (100.0%) | $71,750 |
Occupancy by Householder Income Bracket in Lanesboro
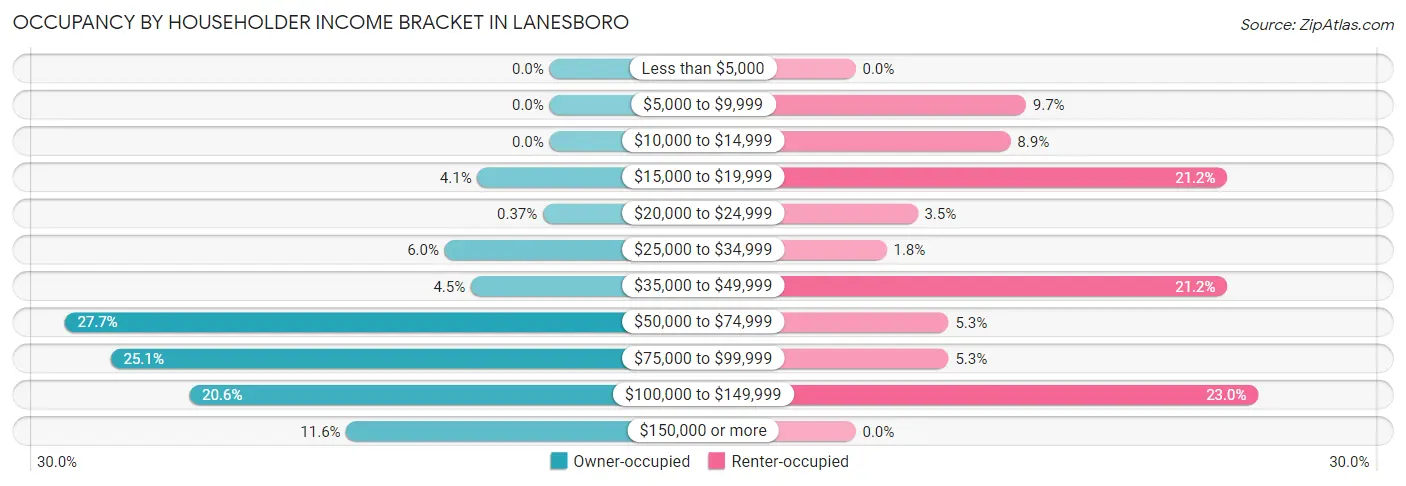
| Income Bracket | Owner-occupied | Renter-occupied |
| Less than $5,000 | 0 (0.0%) | 0 (0.0%) |
| $5,000 to $9,999 | 0 (0.0%) | 11 (9.7%) |
| $10,000 to $14,999 | 0 (0.0%) | 10 (8.8%) |
| $15,000 to $19,999 | 11 (4.1%) | 24 (21.2%) |
| $20,000 to $24,999 | 1 (0.4%) | 4 (3.5%) |
| $25,000 to $34,999 | 16 (6.0%) | 2 (1.8%) |
| $35,000 to $49,999 | 12 (4.5%) | 24 (21.2%) |
| $50,000 to $74,999 | 74 (27.7%) | 6 (5.3%) |
| $75,000 to $99,999 | 67 (25.1%) | 6 (5.3%) |
| $100,000 to $149,999 | 55 (20.6%) | 26 (23.0%) |
| $150,000 or more | 31 (11.6%) | 0 (0.0%) |
| Total | 267 (100.0%) | 113 (100.0%) |
Monthly Housing Cost Tiers in Lanesboro
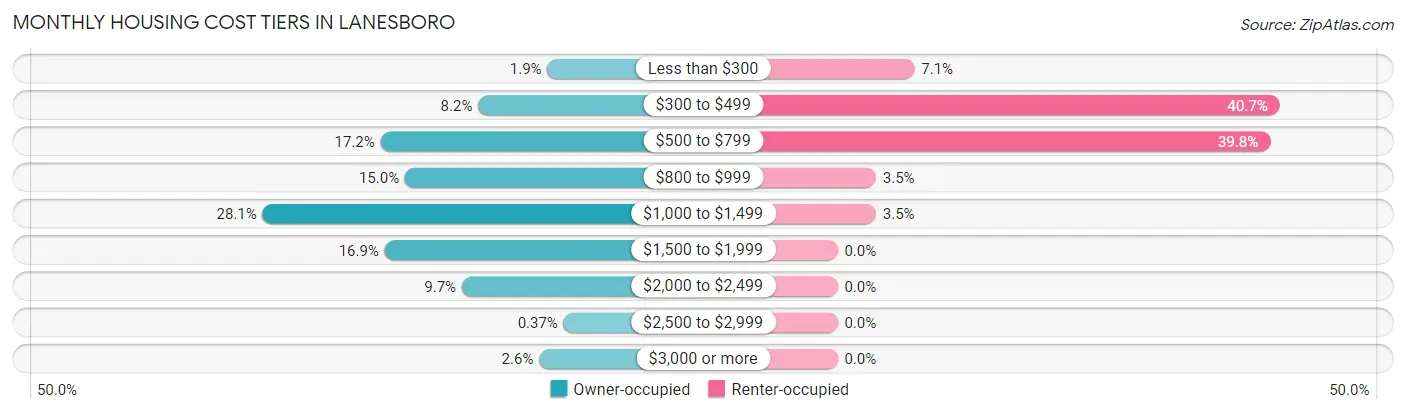
| Monthly Cost | Owner-occupied | Renter-occupied |
| Less than $300 | 5 (1.9%) | 8 (7.1%) |
| $300 to $499 | 22 (8.2%) | 46 (40.7%) |
| $500 to $799 | 46 (17.2%) | 45 (39.8%) |
| $800 to $999 | 40 (15.0%) | 4 (3.5%) |
| $1,000 to $1,499 | 75 (28.1%) | 4 (3.5%) |
| $1,500 to $1,999 | 45 (16.9%) | 0 (0.0%) |
| $2,000 to $2,499 | 26 (9.7%) | 0 (0.0%) |
| $2,500 to $2,999 | 1 (0.4%) | 0 (0.0%) |
| $3,000 or more | 7 (2.6%) | 0 (0.0%) |
| Total | 267 (100.0%) | 113 (100.0%) |
Physical Housing Characteristics in Lanesboro
Housing Structures in Lanesboro
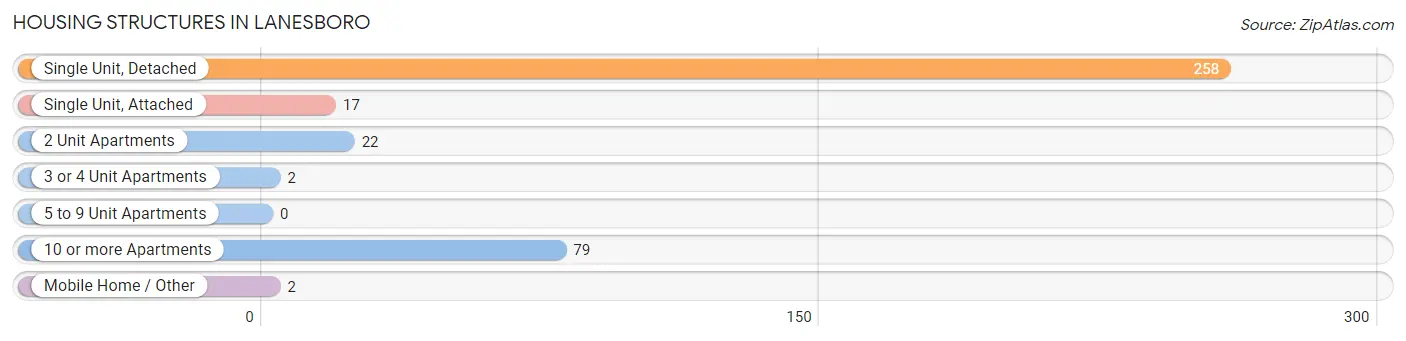
| Structure Type | # Housing Units | % Housing Units |
| Single Unit, Detached | 258 | 67.9% |
| Single Unit, Attached | 17 | 4.5% |
| 2 Unit Apartments | 22 | 5.8% |
| 3 or 4 Unit Apartments | 2 | 0.5% |
| 5 to 9 Unit Apartments | 0 | 0.0% |
| 10 or more Apartments | 79 | 20.8% |
| Mobile Home / Other | 2 | 0.5% |
| Total | 380 | 100.0% |
Housing Structures by Occupancy in Lanesboro
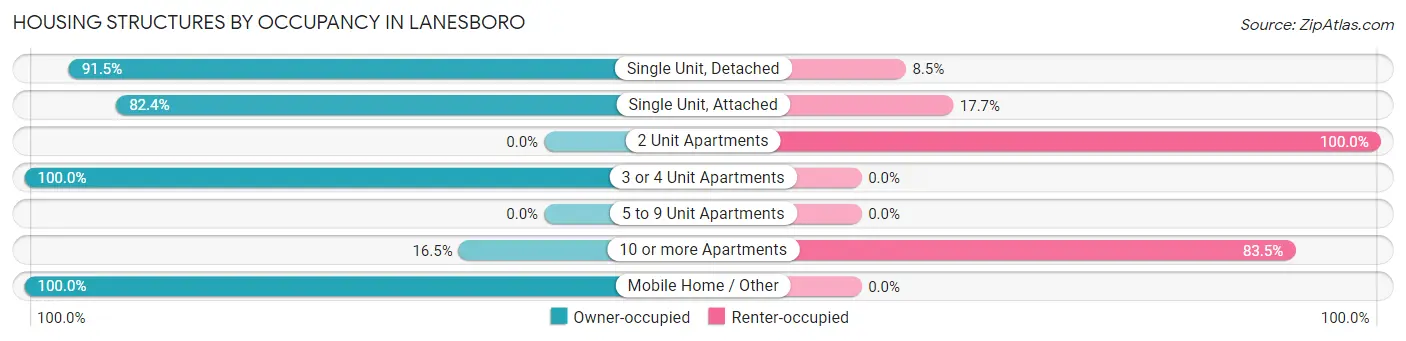
| Structure Type | Owner-occupied | Renter-occupied |
| Single Unit, Detached | 236 (91.5%) | 22 (8.5%) |
| Single Unit, Attached | 14 (82.4%) | 3 (17.6%) |
| 2 Unit Apartments | 0 (0.0%) | 22 (100.0%) |
| 3 or 4 Unit Apartments | 2 (100.0%) | 0 (0.0%) |
| 5 to 9 Unit Apartments | 0 (0.0%) | 0 (0.0%) |
| 10 or more Apartments | 13 (16.5%) | 66 (83.5%) |
| Mobile Home / Other | 2 (100.0%) | 0 (0.0%) |
| Total | 267 (70.3%) | 113 (29.7%) |
Housing Structures by Number of Rooms in Lanesboro
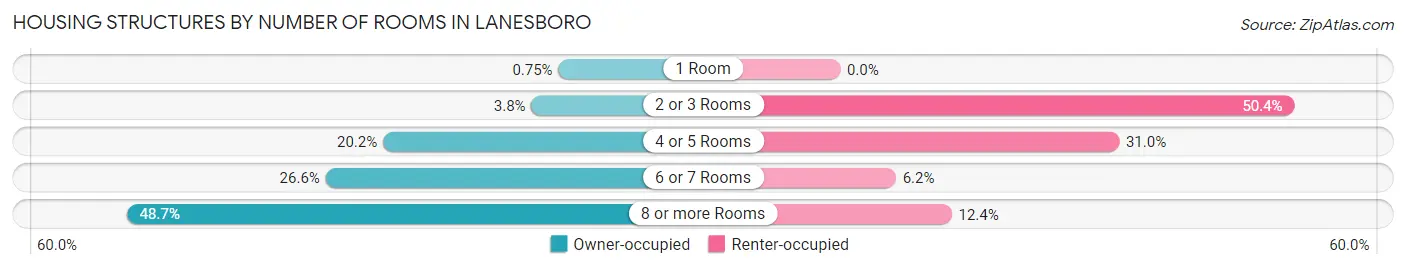
| Number of Rooms | Owner-occupied | Renter-occupied |
| 1 Room | 2 (0.7%) | 0 (0.0%) |
| 2 or 3 Rooms | 10 (3.7%) | 57 (50.4%) |
| 4 or 5 Rooms | 54 (20.2%) | 35 (31.0%) |
| 6 or 7 Rooms | 71 (26.6%) | 7 (6.2%) |
| 8 or more Rooms | 130 (48.7%) | 14 (12.4%) |
| Total | 267 (100.0%) | 113 (100.0%) |
Housing Structure by Heating Type in Lanesboro
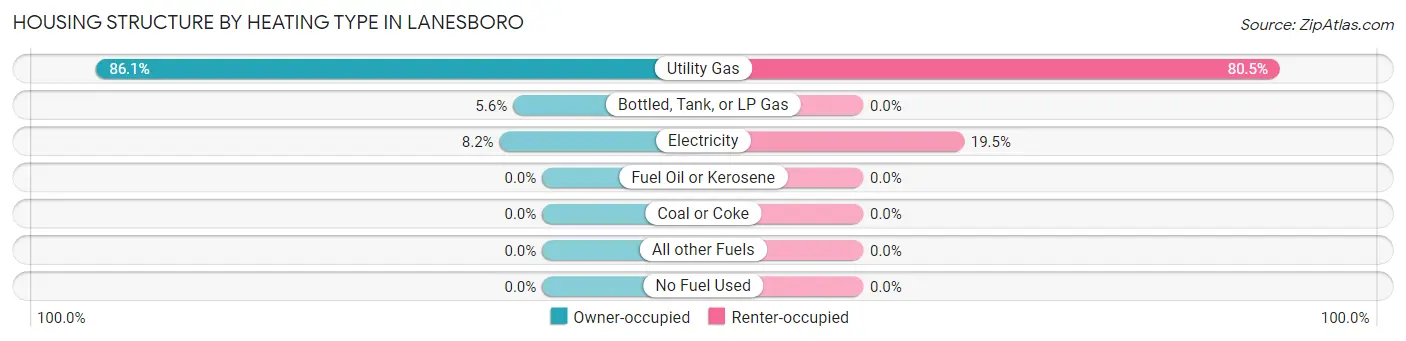
| Heating Type | Owner-occupied | Renter-occupied |
| Utility Gas | 230 (86.1%) | 91 (80.5%) |
| Bottled, Tank, or LP Gas | 15 (5.6%) | 0 (0.0%) |
| Electricity | 22 (8.2%) | 22 (19.5%) |
| Fuel Oil or Kerosene | 0 (0.0%) | 0 (0.0%) |
| Coal or Coke | 0 (0.0%) | 0 (0.0%) |
| All other Fuels | 0 (0.0%) | 0 (0.0%) |
| No Fuel Used | 0 (0.0%) | 0 (0.0%) |
| Total | 267 (100.0%) | 113 (100.0%) |
Household Vehicle Usage in Lanesboro
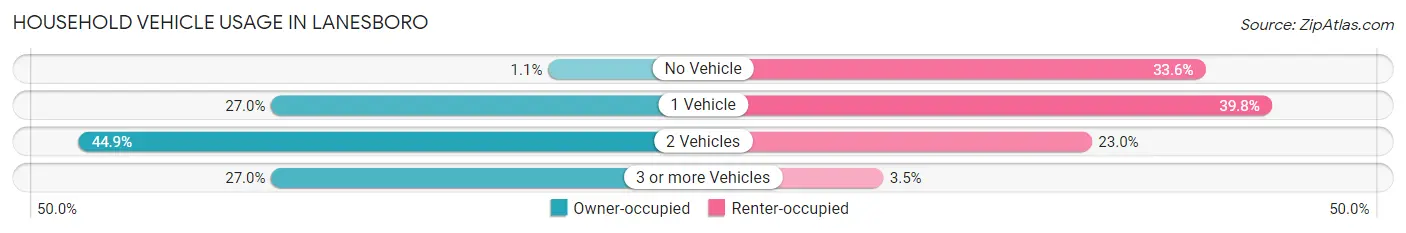
| Vehicles per Household | Owner-occupied | Renter-occupied |
| No Vehicle | 3 (1.1%) | 38 (33.6%) |
| 1 Vehicle | 72 (27.0%) | 45 (39.8%) |
| 2 Vehicles | 120 (44.9%) | 26 (23.0%) |
| 3 or more Vehicles | 72 (27.0%) | 4 (3.5%) |
| Total | 267 (100.0%) | 113 (100.0%) |
Real Estate & Mortgages in Lanesboro
Real Estate and Mortgage Overview in Lanesboro
| Characteristic | Without Mortgage | With Mortgage |
| Housing Units | 81 | 186 |
| Median Property Value | $159,000 | $170,000 |
| Median Household Income | $63,750 | $20 |
| Monthly Housing Costs | $590 | $7 |
| Real Estate Taxes | $2,214 | $2 |
Property Value by Mortgage Status in Lanesboro
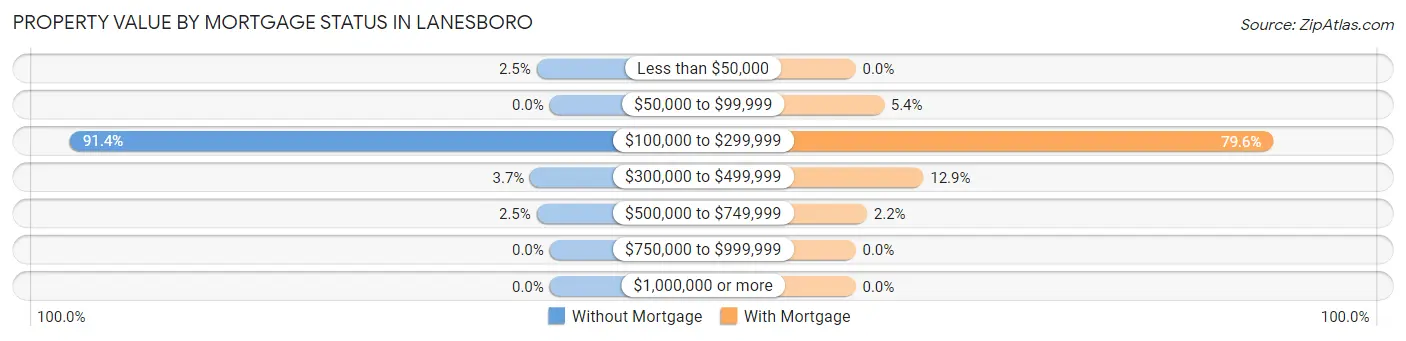
| Property Value | Without Mortgage | With Mortgage |
| Less than $50,000 | 2 (2.5%) | 0 (0.0%) |
| $50,000 to $99,999 | 0 (0.0%) | 10 (5.4%) |
| $100,000 to $299,999 | 74 (91.4%) | 148 (79.6%) |
| $300,000 to $499,999 | 3 (3.7%) | 24 (12.9%) |
| $500,000 to $749,999 | 2 (2.5%) | 4 (2.1%) |
| $750,000 to $999,999 | 0 (0.0%) | 0 (0.0%) |
| $1,000,000 or more | 0 (0.0%) | 0 (0.0%) |
| Total | 81 (100.0%) | 186 (100.0%) |
Household Income by Mortgage Status in Lanesboro
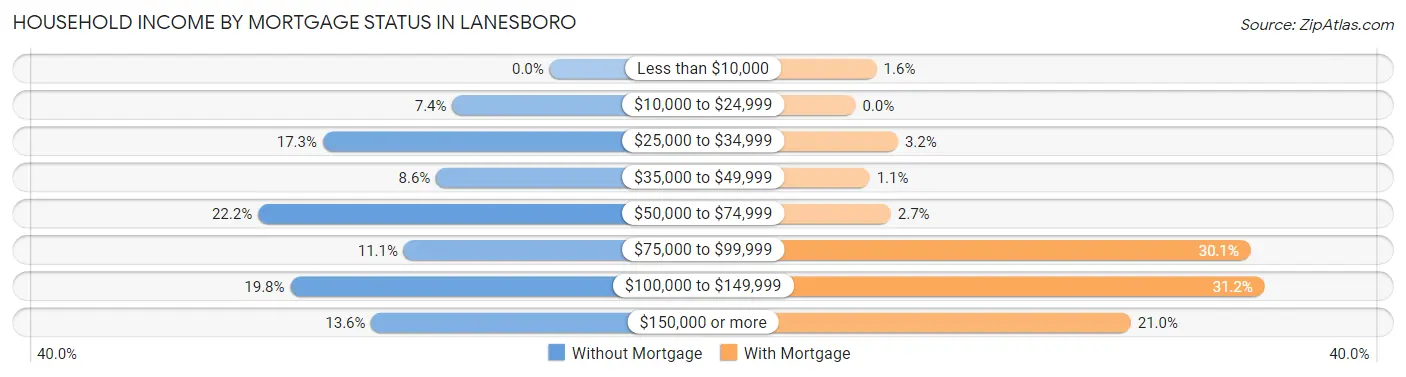
| Household Income | Without Mortgage | With Mortgage |
| Less than $10,000 | 0 (0.0%) | 3 (1.6%) |
| $10,000 to $24,999 | 6 (7.4%) | 0 (0.0%) |
| $25,000 to $34,999 | 14 (17.3%) | 6 (3.2%) |
| $35,000 to $49,999 | 7 (8.6%) | 2 (1.1%) |
| $50,000 to $74,999 | 18 (22.2%) | 5 (2.7%) |
| $75,000 to $99,999 | 9 (11.1%) | 56 (30.1%) |
| $100,000 to $149,999 | 16 (19.8%) | 58 (31.2%) |
| $150,000 or more | 11 (13.6%) | 39 (21.0%) |
| Total | 81 (100.0%) | 186 (100.0%) |
Property Value to Household Income Ratio in Lanesboro
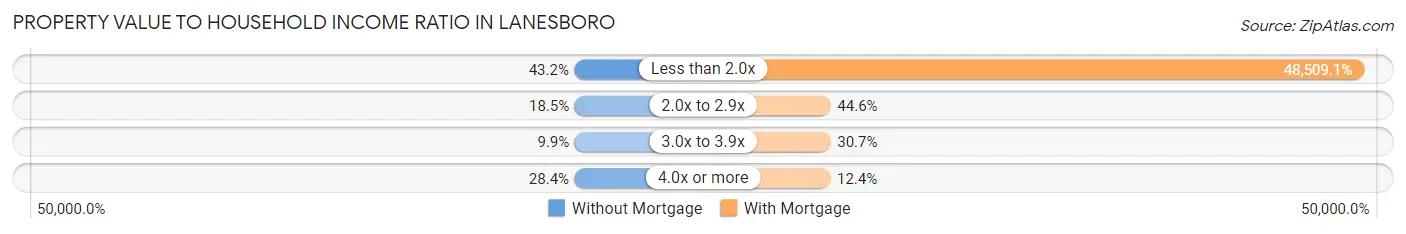
| Value-to-Income Ratio | Without Mortgage | With Mortgage |
| Less than 2.0x | 35 (43.2%) | 90,227 (48,509.1%) |
| 2.0x to 2.9x | 15 (18.5%) | 83 (44.6%) |
| 3.0x to 3.9x | 8 (9.9%) | 57 (30.6%) |
| 4.0x or more | 23 (28.4%) | 23 (12.4%) |
| Total | 81 (100.0%) | 186 (100.0%) |
Real Estate Taxes by Mortgage Status in Lanesboro
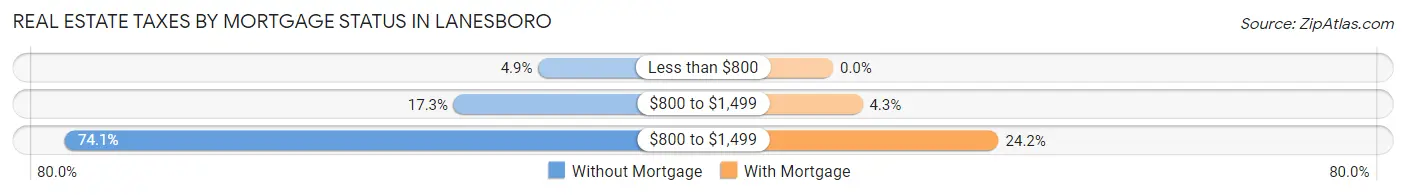
| Property Taxes | Without Mortgage | With Mortgage |
| Less than $800 | 4 (4.9%) | 0 (0.0%) |
| $800 to $1,499 | 14 (17.3%) | 8 (4.3%) |
| $800 to $1,499 | 60 (74.1%) | 45 (24.2%) |
| Total | 81 (100.0%) | 186 (100.0%) |
Health & Disability in Lanesboro
Health Insurance Coverage by Age in Lanesboro
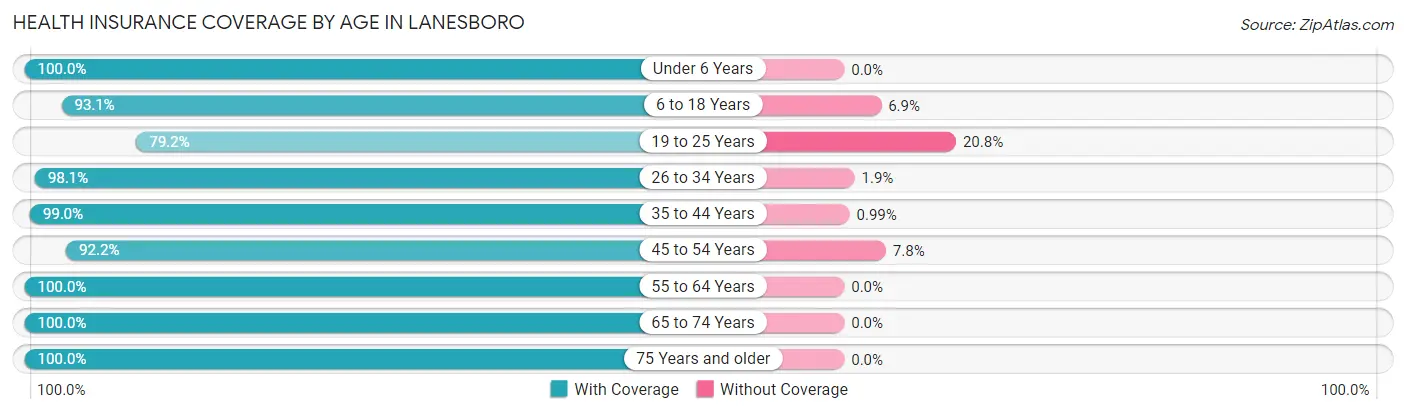
| Age Bracket | With Coverage | Without Coverage |
| Under 6 Years | 27 (100.0%) | 0 (0.0%) |
| 6 to 18 Years | 149 (93.1%) | 11 (6.9%) |
| 19 to 25 Years | 38 (79.2%) | 10 (20.8%) |
| 26 to 34 Years | 51 (98.1%) | 1 (1.9%) |
| 35 to 44 Years | 100 (99.0%) | 1 (1.0%) |
| 45 to 54 Years | 107 (92.2%) | 9 (7.8%) |
| 55 to 64 Years | 108 (100.0%) | 0 (0.0%) |
| 65 to 74 Years | 127 (100.0%) | 0 (0.0%) |
| 75 Years and older | 90 (100.0%) | 0 (0.0%) |
| Total | 797 (96.1%) | 32 (3.9%) |
Health Insurance Coverage by Citizenship Status in Lanesboro

| Citizenship Status | With Coverage | Without Coverage |
| Native Born | 27 (100.0%) | 0 (0.0%) |
| Foreign Born, Citizen | 149 (93.1%) | 11 (6.9%) |
| Foreign Born, not a Citizen | 38 (79.2%) | 10 (20.8%) |
Health Insurance Coverage by Household Income in Lanesboro

| Household Income | With Coverage | Without Coverage |
| Under $25,000 | 63 (100.0%) | 0 (0.0%) |
| $25,000 to $49,999 | 86 (100.0%) | 0 (0.0%) |
| $50,000 to $74,999 | 189 (100.0%) | 0 (0.0%) |
| $75,000 to $99,999 | 176 (95.7%) | 8 (4.3%) |
| $100,000 and over | 282 (92.2%) | 24 (7.8%) |
Public vs Private Health Insurance Coverage by Age in Lanesboro
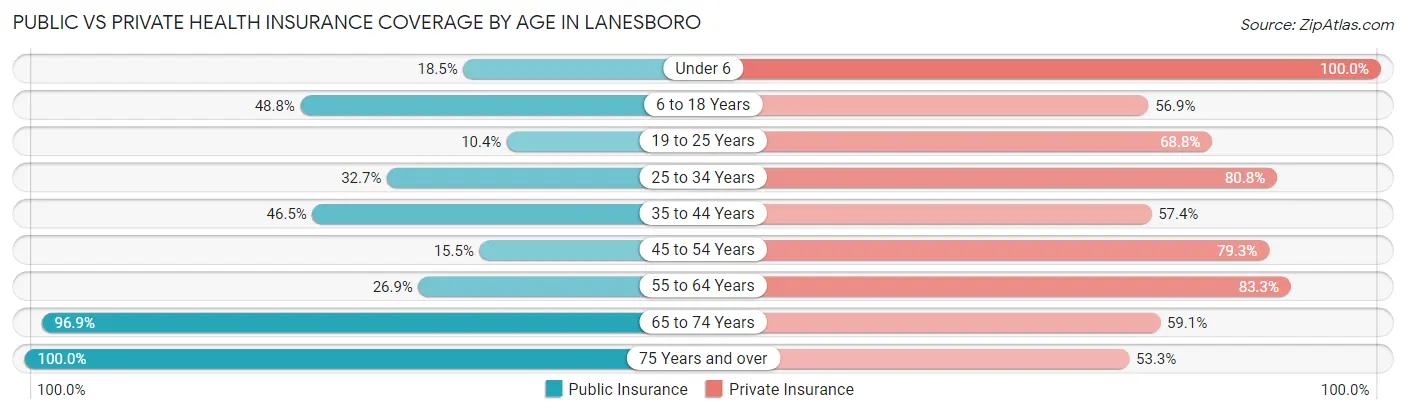
| Age Bracket | Public Insurance | Private Insurance |
| Under 6 | 5 (18.5%) | 27 (100.0%) |
| 6 to 18 Years | 78 (48.7%) | 91 (56.9%) |
| 19 to 25 Years | 5 (10.4%) | 33 (68.8%) |
| 25 to 34 Years | 17 (32.7%) | 42 (80.8%) |
| 35 to 44 Years | 47 (46.5%) | 58 (57.4%) |
| 45 to 54 Years | 18 (15.5%) | 92 (79.3%) |
| 55 to 64 Years | 29 (26.9%) | 90 (83.3%) |
| 65 to 74 Years | 123 (96.9%) | 75 (59.1%) |
| 75 Years and over | 90 (100.0%) | 48 (53.3%) |
| Total | 412 (49.7%) | 556 (67.1%) |
Disability Status by Sex by Age in Lanesboro
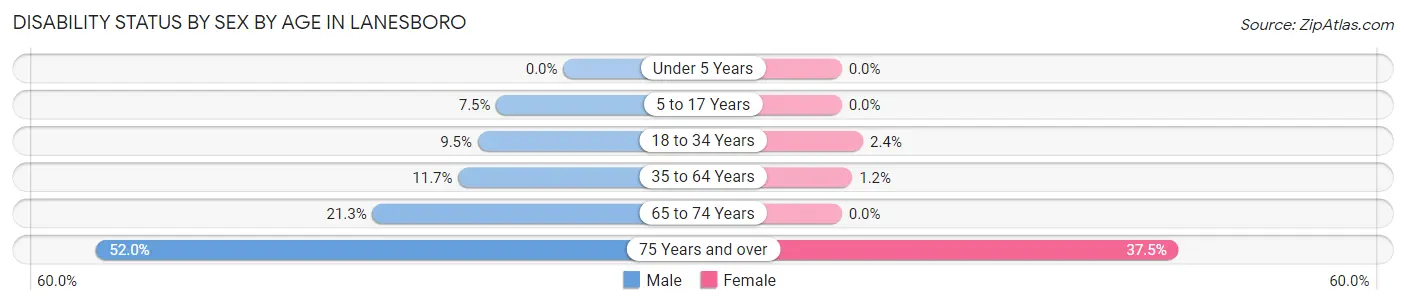
| Age Bracket | Male | Female |
| Under 5 Years | 0 (0.0%) | 0 (0.0%) |
| 5 to 17 Years | 5 (7.5%) | 0 (0.0%) |
| 18 to 34 Years | 6 (9.5%) | 1 (2.4%) |
| 35 to 64 Years | 18 (11.7%) | 2 (1.2%) |
| 65 to 74 Years | 17 (21.2%) | 0 (0.0%) |
| 75 Years and over | 26 (52.0%) | 15 (37.5%) |
Disability Class by Sex by Age in Lanesboro
Disability Class: Hearing Difficulty
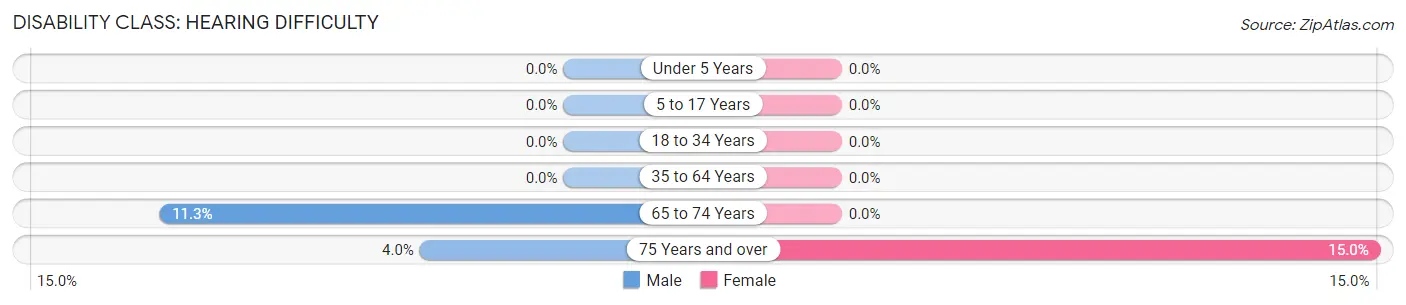
| Age Bracket | Male | Female |
| Under 5 Years | 0 (0.0%) | 0 (0.0%) |
| 5 to 17 Years | 0 (0.0%) | 0 (0.0%) |
| 18 to 34 Years | 0 (0.0%) | 0 (0.0%) |
| 35 to 64 Years | 0 (0.0%) | 0 (0.0%) |
| 65 to 74 Years | 9 (11.3%) | 0 (0.0%) |
| 75 Years and over | 2 (4.0%) | 6 (15.0%) |
Disability Class: Vision Difficulty
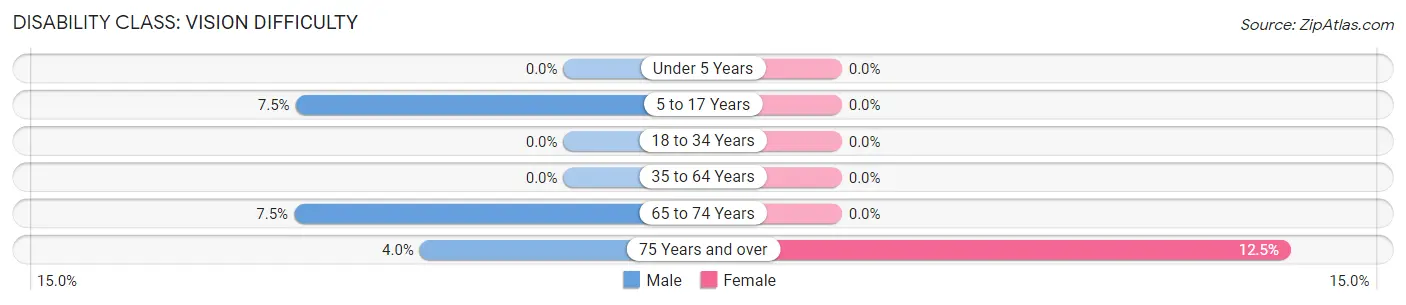
| Age Bracket | Male | Female |
| Under 5 Years | 0 (0.0%) | 0 (0.0%) |
| 5 to 17 Years | 5 (7.5%) | 0 (0.0%) |
| 18 to 34 Years | 0 (0.0%) | 0 (0.0%) |
| 35 to 64 Years | 0 (0.0%) | 0 (0.0%) |
| 65 to 74 Years | 6 (7.5%) | 0 (0.0%) |
| 75 Years and over | 2 (4.0%) | 5 (12.5%) |
Disability Class: Cognitive Difficulty

| Age Bracket | Male | Female |
| 5 to 17 Years | 5 (7.5%) | 0 (0.0%) |
| 18 to 34 Years | 6 (9.5%) | 1 (2.4%) |
| 35 to 64 Years | 18 (11.7%) | 0 (0.0%) |
| 65 to 74 Years | 0 (0.0%) | 0 (0.0%) |
| 75 Years and over | 3 (6.0%) | 0 (0.0%) |
Disability Class: Ambulatory Difficulty
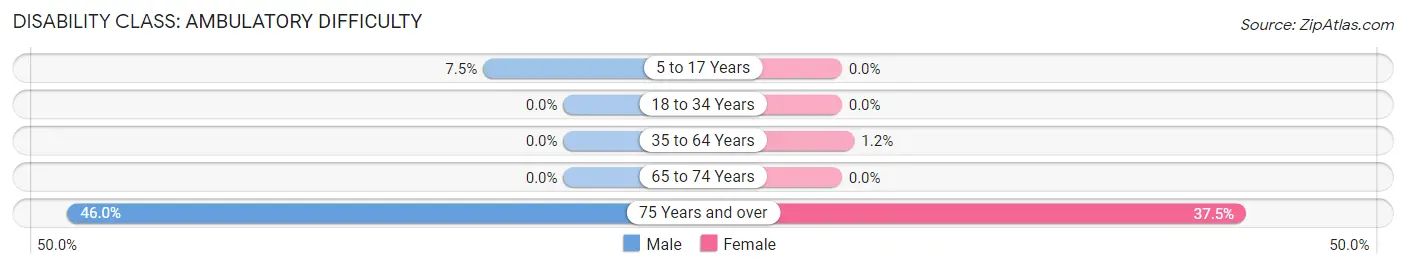
| Age Bracket | Male | Female |
| 5 to 17 Years | 5 (7.5%) | 0 (0.0%) |
| 18 to 34 Years | 0 (0.0%) | 0 (0.0%) |
| 35 to 64 Years | 0 (0.0%) | 2 (1.2%) |
| 65 to 74 Years | 0 (0.0%) | 0 (0.0%) |
| 75 Years and over | 23 (46.0%) | 15 (37.5%) |
Disability Class: Self-Care Difficulty

| Age Bracket | Male | Female |
| 5 to 17 Years | 0 (0.0%) | 0 (0.0%) |
| 18 to 34 Years | 0 (0.0%) | 0 (0.0%) |
| 35 to 64 Years | 17 (11.0%) | 2 (1.2%) |
| 65 to 74 Years | 2 (2.5%) | 0 (0.0%) |
| 75 Years and over | 2 (4.0%) | 2 (5.0%) |
Technology Access in Lanesboro
Computing Device Access in Lanesboro
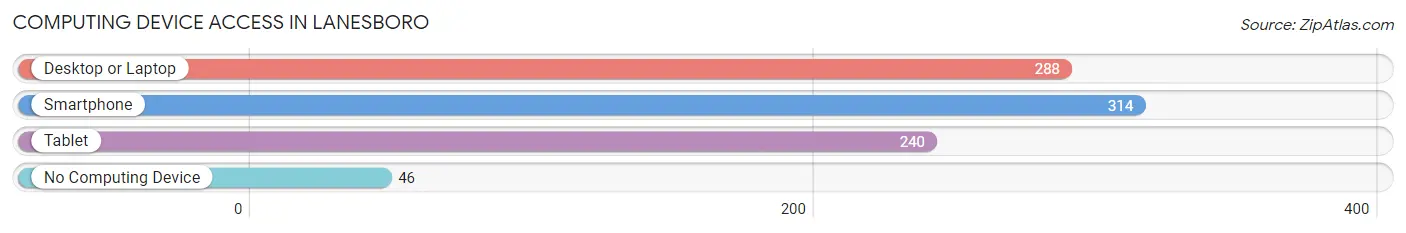
| Device Type | # Households | % Households |
| Desktop or Laptop | 288 | 75.8% |
| Smartphone | 314 | 82.6% |
| Tablet | 240 | 63.2% |
| No Computing Device | 46 | 12.1% |
| Total | 380 | 100.0% |
Internet Access in Lanesboro
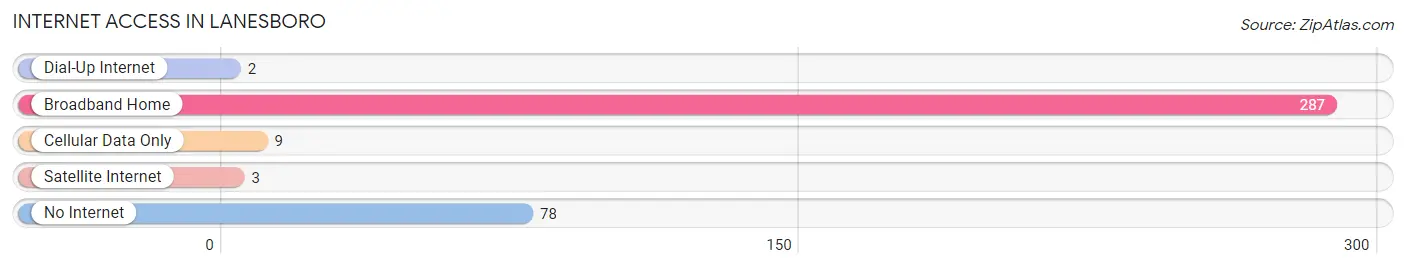
| Internet Type | # Households | % Households |
| Dial-Up Internet | 2 | 0.5% |
| Broadband Home | 287 | 75.5% |
| Cellular Data Only | 9 | 2.4% |
| Satellite Internet | 3 | 0.8% |
| No Internet | 78 | 20.5% |
| Total | 380 | 100.0% |
Lanesboro Summary
Lanesboro, Minnesota is a small city located in Fillmore County, in the southeastern corner of the state. It is situated along the Root River, and is known for its picturesque bluffs and rolling hills. The city has a population of about 1,000 people, and is a popular tourist destination due to its proximity to the Root River State Trail and the Root River Valley Scenic Byway.
History
Lanesboro was founded in 1854 by a group of settlers from New York. The city was named after a nearby creek, which was named after a local Native American chief. The settlers were attracted to the area due to its abundance of natural resources, including timber and limestone. The city quickly grew, and by the late 1800s, it had become a bustling center of commerce and industry.
The city was home to several businesses, including a flour mill, a sawmill, a brickyard, and a limestone quarry. The limestone quarry was particularly important, as it provided the material for many of the city’s buildings. The city also had a thriving agricultural industry, with many farmers growing wheat, oats, and corn.
In the early 1900s, the city began to decline as the railroad bypassed it and the limestone quarry closed. However, the city was revitalized in the 1970s when the Root River State Trail was established. The trail brought in many tourists, and the city began to experience a resurgence. Today, Lanesboro is a popular tourist destination, and is home to many shops, restaurants, and other attractions.
Geography
Lanesboro is located in southeastern Minnesota, in Fillmore County. It is situated along the Root River, and is surrounded by rolling hills and bluffs. The city is located about 50 miles southeast of Rochester, and about 90 miles southeast of Minneapolis.
The city has a total area of 1.2 square miles, all of which is land. The city has a humid continental climate, with cold winters and hot, humid summers. The average annual temperature is around 45 degrees Fahrenheit, and the average annual precipitation is around 30 inches.
Economy
Lanesboro’s economy is largely based on tourism. The city is home to many shops, restaurants, and other attractions, which draw in visitors from all over the region. The city is also home to several small businesses, including a brewery, a winery, and a distillery.
The city is also home to several manufacturing companies, including a furniture manufacturer and a plastics manufacturer. The city is also home to a number of agricultural businesses, including a dairy farm and a vegetable farm.
Demographics
As of the 2010 census, the population of Lanesboro was 1,037. The racial makeup of the city was 97.2% White, 0.7% African American, 0.3% Native American, 0.3% Asian, 0.1% Pacific Islander, 0.3% from other races, and 1.2% from two or more races. Hispanic or Latino of any race were 1.2% of the population.
The median household income in Lanesboro was $41,250, and the median family income was $50,000. The per capita income was $20,945. About 8.2% of the population was below the poverty line.
Conclusion
Lanesboro, Minnesota is a small city located in Fillmore County, in the southeastern corner of the state. It is situated along the Root River, and is known for its picturesque bluffs and rolling hills. The city has a population of about 1,000 people, and is a popular tourist destination due to its proximity to the Root River State Trail and the Root River Valley Scenic Byway. The city’s economy is largely based on tourism, and it is home to many shops, restaurants, and other attractions. The city also has a number of manufacturing and agricultural businesses. The population of Lanesboro is predominantly white, with a median household income of $41,250 and a median family income of $50,000.
Common Questions
What is Per Capita Income in Lanesboro?
Per Capita income in Lanesboro is $37,821.
What is the Median Family Income in Lanesboro?
Median Family Income in Lanesboro is $93,000.
What is the Median Household income in Lanesboro?
Median Household Income in Lanesboro is $71,750.
What is Income or Wage Gap in Lanesboro?
Income or Wage Gap in Lanesboro is 40.5%.
Women in Lanesboro earn 59.5 cents for every dollar earned by a man.
What is Inequality or Gini Index in Lanesboro?
Inequality or Gini Index in Lanesboro is 0.39.
What is the Total Population of Lanesboro?
Total Population of Lanesboro is 829.
What is the Total Male Population of Lanesboro?
Total Male Population of Lanesboro is 416.
What is the Total Female Population of Lanesboro?
Total Female Population of Lanesboro is 413.
What is the Ratio of Males per 100 Females in Lanesboro?
There are 100.73 Males per 100 Females in Lanesboro.
What is the Ratio of Females per 100 Males in Lanesboro?
There are 99.28 Females per 100 Males in Lanesboro.
What is the Median Population Age in Lanesboro?
Median Population Age in Lanesboro is 46.6 Years.
What is the Average Family Size in Lanesboro
Average Family Size in Lanesboro is 2.8 People.
What is the Average Household Size in Lanesboro
Average Household Size in Lanesboro is 2.2 People.
How Large is the Labor Force in Lanesboro?
There are 422 People in the Labor Forcein in Lanesboro.
What is the Percentage of People in the Labor Force in Lanesboro?
63.2% of People are in the Labor Force in Lanesboro.
What is the Unemployment Rate in Lanesboro?
Unemployment Rate in Lanesboro is 1.2%.