Fifty Lakes, MN Map & Demographics
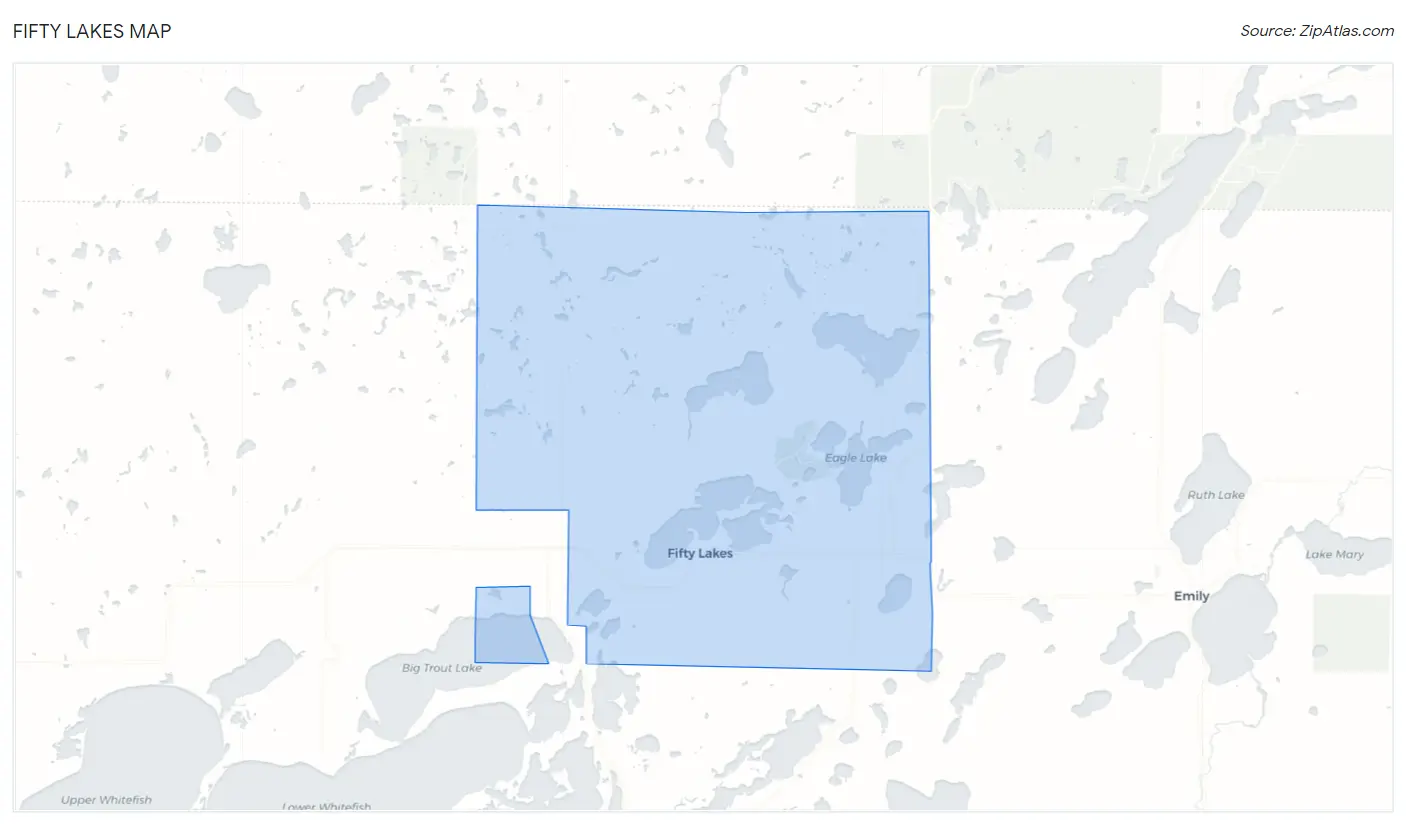
Fifty Lakes Map
Fifty Lakes Overview
$42,682
PER CAPITA INCOME
$79,688
AVG FAMILY INCOME
$67,031
AVG HOUSEHOLD INCOME
$7,650
FAMILY INCOME DEFICIT
0.41
INEQUALITY / GINI INDEX
431
TOTAL POPULATION
254
MALE POPULATION
177
FEMALE POPULATION
143.50
MALES / 100 FEMALES
69.69
FEMALES / 100 MALES
63.7
MEDIAN AGE
2.3
AVG FAMILY SIZE
2.0
AVG HOUSEHOLD SIZE
154
LABOR FORCE [ PEOPLE ]
36.8%
PERCENT IN LABOR FORCE
3.9%
UNEMPLOYMENT RATE
Fifty Lakes Zip Codes
Fifty Lakes Area Codes
Income in Fifty Lakes
Income Overview in Fifty Lakes
Per Capita Income in Fifty Lakes is $42,682, while median incomes of families and households are $79,688 and $67,031 respectively.
| Characteristic | Number | Measure |
| Per Capita Income | 431 | $42,682 |
| Median Family Income | 149 | $79,688 |
| Mean Family Income | 149 | $98,530 |
| Median Household Income | 219 | $67,031 |
| Mean Household Income | 219 | $85,333 |
| Income Deficit | 149 | $7,650 |
| Wage / Income Gap (%) | 431 | 0.00% |
| Wage / Income Gap ($) | 431 | 100.00¢ per $1 |
| Gini / Inequality Index | 431 | 0.41 |
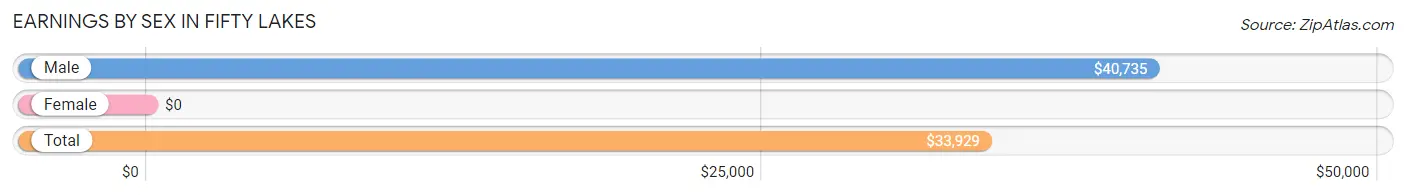
Earnings by Sex in Fifty Lakes
| Sex | Number | Average Earnings |
| Male | 104 (62.6%) | $40,735 |
| Female | 62 (37.3%) | $0 |
| Total | 166 (100.0%) | $33,929 |
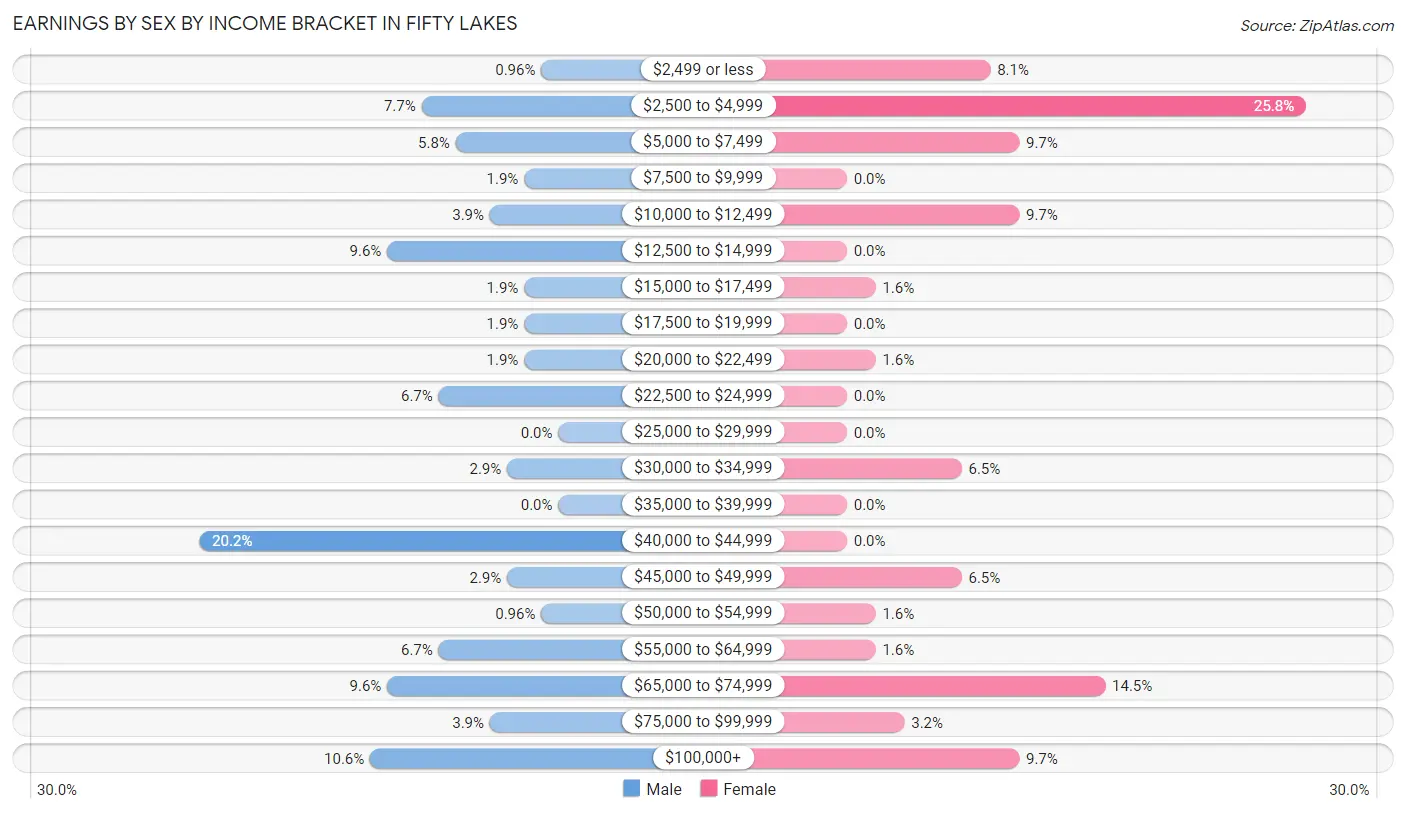
Earnings by Sex by Income Bracket in Fifty Lakes
The most common earnings brackets in Fifty Lakes are $40,000 to $44,999 for men (21 | 20.2%) and $2,500 to $4,999 for women (16 | 25.8%).
| Income | Male | Female |
| $2,499 or less | 1 (1.0%) | 5 (8.1%) |
| $2,500 to $4,999 | 8 (7.7%) | 16 (25.8%) |
| $5,000 to $7,499 | 6 (5.8%) | 6 (9.7%) |
| $7,500 to $9,999 | 2 (1.9%) | 0 (0.0%) |
| $10,000 to $12,499 | 4 (3.8%) | 6 (9.7%) |
| $12,500 to $14,999 | 10 (9.6%) | 0 (0.0%) |
| $15,000 to $17,499 | 2 (1.9%) | 1 (1.6%) |
| $17,500 to $19,999 | 2 (1.9%) | 0 (0.0%) |
| $20,000 to $22,499 | 2 (1.9%) | 1 (1.6%) |
| $22,500 to $24,999 | 7 (6.7%) | 0 (0.0%) |
| $25,000 to $29,999 | 0 (0.0%) | 0 (0.0%) |
| $30,000 to $34,999 | 3 (2.9%) | 4 (6.5%) |
| $35,000 to $39,999 | 0 (0.0%) | 0 (0.0%) |
| $40,000 to $44,999 | 21 (20.2%) | 0 (0.0%) |
| $45,000 to $49,999 | 3 (2.9%) | 4 (6.5%) |
| $50,000 to $54,999 | 1 (1.0%) | 1 (1.6%) |
| $55,000 to $64,999 | 7 (6.7%) | 1 (1.6%) |
| $65,000 to $74,999 | 10 (9.6%) | 9 (14.5%) |
| $75,000 to $99,999 | 4 (3.8%) | 2 (3.2%) |
| $100,000+ | 11 (10.6%) | 6 (9.7%) |
| Total | 104 (100.0%) | 62 (100.0%) |
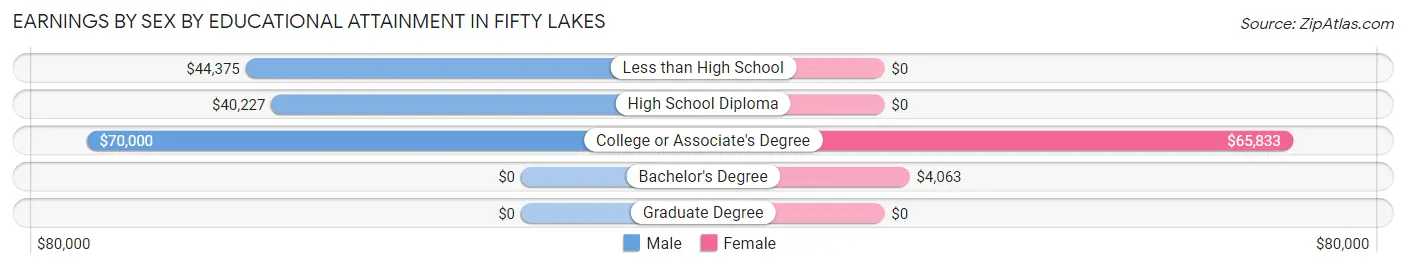
Earnings by Sex by Educational Attainment in Fifty Lakes
| Educational Attainment | Male Income | Female Income |
| Less than High School | $44,375 | $0 |
| High School Diploma | $40,227 | $0 |
| College or Associate's Degree | $70,000 | $65,833 |
| Bachelor's Degree | - | - |
| Graduate Degree | - | - |
| Total | $41,471 | $0 |
Family Income in Fifty Lakes
Family Income Brackets in Fifty Lakes
According to the Fifty Lakes family income data, there are 30 families falling into the $100,000 to $149,999 income range, which is the most common income bracket and makes up 20.1% of all families. Conversely, the less than $10,000 income bracket is the least frequent group with only 1 families (0.7%) belonging to this category.
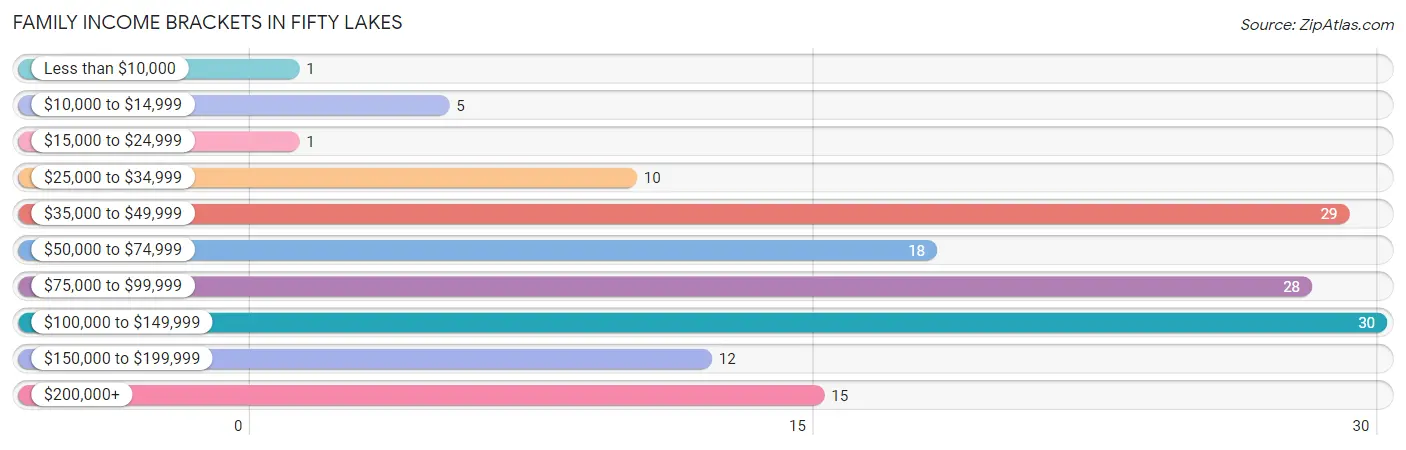
| Income Bracket | # Families | % Families |
| Less than $10,000 | 1 | 0.7% |
| $10,000 to $14,999 | 5 | 3.4% |
| $15,000 to $24,999 | 1 | 0.7% |
| $25,000 to $34,999 | 10 | 6.7% |
| $35,000 to $49,999 | 29 | 19.5% |
| $50,000 to $74,999 | 18 | 12.1% |
| $75,000 to $99,999 | 28 | 18.8% |
| $100,000 to $149,999 | 30 | 20.1% |
| $150,000 to $199,999 | 12 | 8.1% |
| $200,000+ | 15 | 10.1% |
Family Income by Famaliy Size in Fifty Lakes
3-person families (12 | 8.1%) account for the highest median family income in Fifty Lakes with $144,286 per family, while 3-person families (12 | 8.1%) have the highest median income of $48,095 per family member.
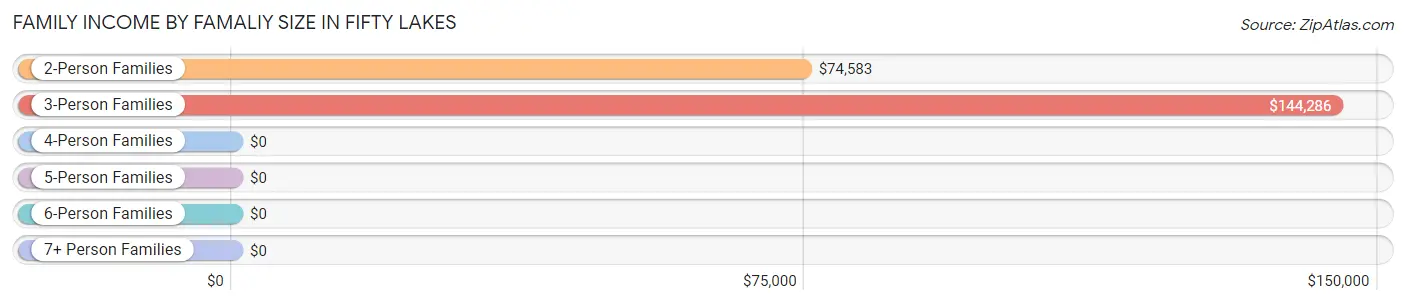
| Income Bracket | # Families | Median Income |
| 2-Person Families | 125 (83.9%) | $74,583 |
| 3-Person Families | 12 (8.1%) | $144,286 |
| 4-Person Families | 10 (6.7%) | $0 |
| 5-Person Families | 2 (1.3%) | $0 |
| 6-Person Families | 0 (0.0%) | $0 |
| 7+ Person Families | 0 (0.0%) | $0 |
| Total | 149 (100.0%) | $79,688 |
Family Income by Number of Earners in Fifty Lakes
The median family income in Fifty Lakes is $79,688, with families comprising 3+ earners (9) having the highest median family income of $204,375, while families with 1 earner (49) have the lowest median family income of $44,485, accounting for 6.0% and 32.9% of families, respectively.
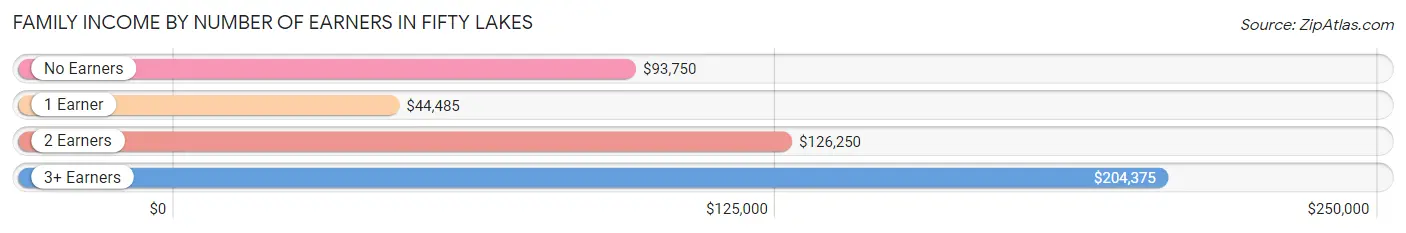
| Number of Earners | # Families | Median Income |
| No Earners | 70 (47.0%) | $93,750 |
| 1 Earner | 49 (32.9%) | $44,485 |
| 2 Earners | 21 (14.1%) | $126,250 |
| 3+ Earners | 9 (6.0%) | $204,375 |
| Total | 149 (100.0%) | $79,688 |
Household Income in Fifty Lakes
Household Income Brackets in Fifty Lakes
With 50 households falling in the category, the $35,000 to $49,999 income range is the most frequent in Fifty Lakes, accounting for 22.8% of all households. In contrast, only 8 households (3.6%) fall into the less than $10,000 income bracket, making it the least populous group.
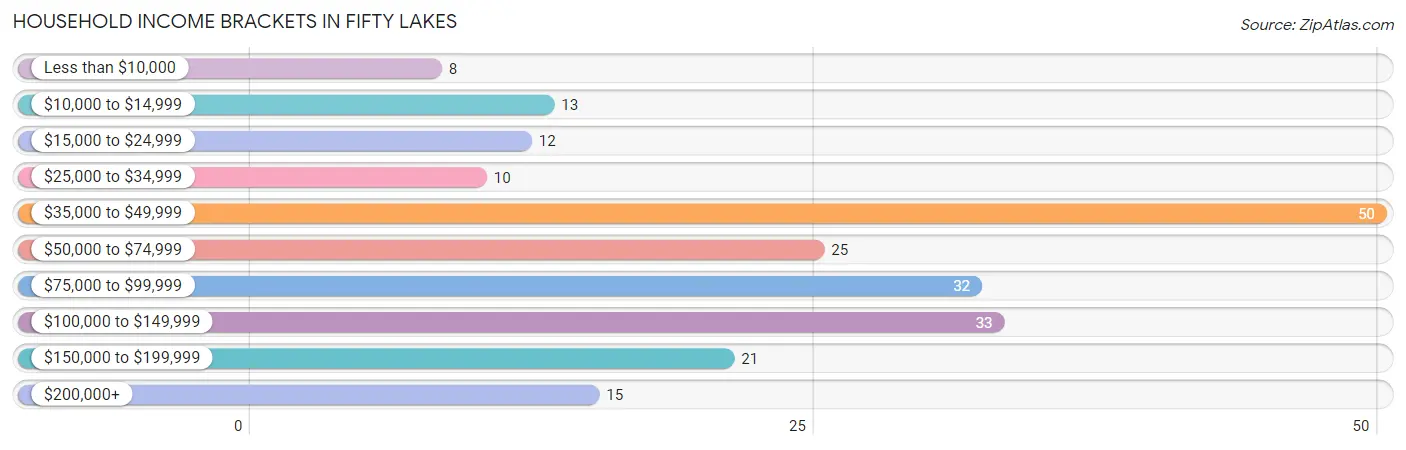
| Income Bracket | # Households | % Households |
| Less than $10,000 | 8 | 3.7% |
| $10,000 to $14,999 | 13 | 5.9% |
| $15,000 to $24,999 | 12 | 5.5% |
| $25,000 to $34,999 | 10 | 4.6% |
| $35,000 to $49,999 | 50 | 22.8% |
| $50,000 to $74,999 | 25 | 11.4% |
| $75,000 to $99,999 | 32 | 14.6% |
| $100,000 to $149,999 | 33 | 15.1% |
| $150,000 to $199,999 | 21 | 9.6% |
| $200,000+ | 15 | 6.8% |
Household Income by Householder Age in Fifty Lakes
The median household income in Fifty Lakes is $67,031, with the highest median household income of $79,688 found in the 65+ years age bracket for the primary householder. A total of 95 households (43.4%) fall into this category.
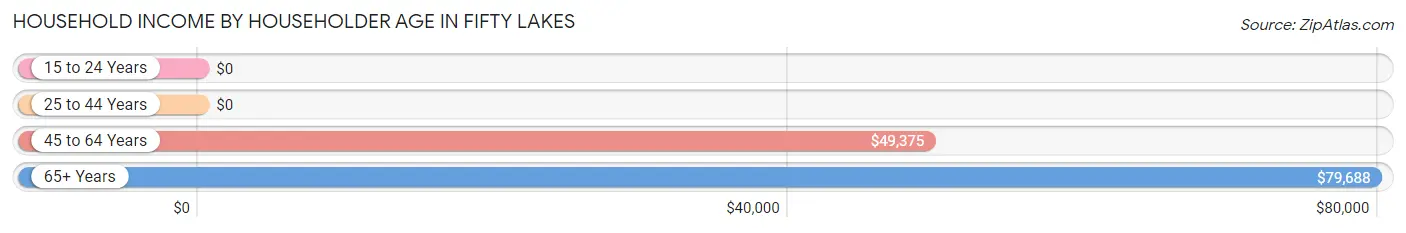
| Income Bracket | # Households | Median Income |
| 15 to 24 Years | 0 (0.0%) | $0 |
| 25 to 44 Years | 16 (7.3%) | $0 |
| 45 to 64 Years | 108 (49.3%) | $49,375 |
| 65+ Years | 95 (43.4%) | $79,688 |
| Total | 219 (100.0%) | $67,031 |
Poverty in Fifty Lakes
Income Below Poverty by Sex and Age in Fifty Lakes
With 8.3% poverty level for males and 9.0% for females among the residents of Fifty Lakes, 75 year old and over males and 35 to 44 year old females are the most vulnerable to poverty, with 9 males (20.9%) and 2 females (25.0%) in their respective age groups living below the poverty level.
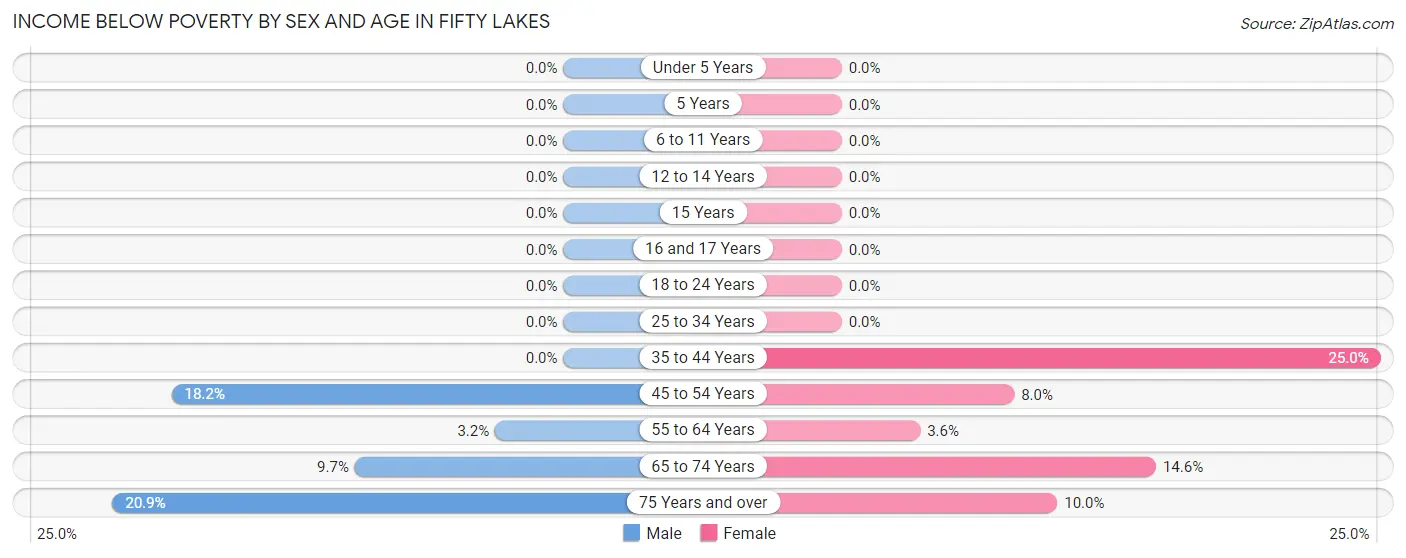
| Age Bracket | Male | Female |
| Under 5 Years | 0 (0.0%) | 0 (0.0%) |
| 5 Years | 0 (0.0%) | 0 (0.0%) |
| 6 to 11 Years | 0 (0.0%) | 0 (0.0%) |
| 12 to 14 Years | 0 (0.0%) | 0 (0.0%) |
| 15 Years | 0 (0.0%) | 0 (0.0%) |
| 16 and 17 Years | 0 (0.0%) | 0 (0.0%) |
| 18 to 24 Years | 0 (0.0%) | 0 (0.0%) |
| 25 to 34 Years | 0 (0.0%) | 0 (0.0%) |
| 35 to 44 Years | 0 (0.0%) | 2 (25.0%) |
| 45 to 54 Years | 4 (18.2%) | 2 (8.0%) |
| 55 to 64 Years | 2 (3.2%) | 2 (3.6%) |
| 65 to 74 Years | 6 (9.7%) | 7 (14.6%) |
| 75 Years and over | 9 (20.9%) | 3 (10.0%) |
| Total | 21 (8.3%) | 16 (9.0%) |
Income Above Poverty by Sex and Age in Fifty Lakes
According to the poverty statistics in Fifty Lakes, males aged 6 to 11 years and females aged 6 to 11 years are the age groups that are most secure financially, with 100.0% of males and 100.0% of females in these age groups living above the poverty line.
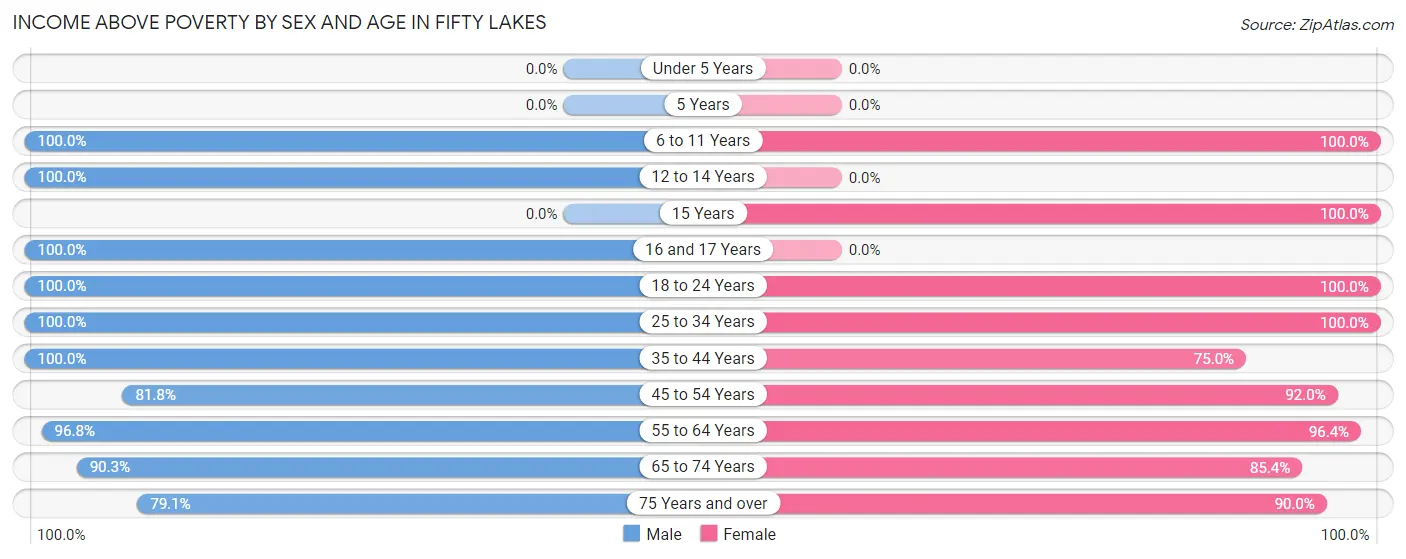
| Age Bracket | Male | Female |
| Under 5 Years | 0 (0.0%) | 0 (0.0%) |
| 5 Years | 0 (0.0%) | 0 (0.0%) |
| 6 to 11 Years | 3 (100.0%) | 3 (100.0%) |
| 12 to 14 Years | 5 (100.0%) | 0 (0.0%) |
| 15 Years | 0 (0.0%) | 2 (100.0%) |
| 16 and 17 Years | 8 (100.0%) | 0 (0.0%) |
| 18 to 24 Years | 29 (100.0%) | 3 (100.0%) |
| 25 to 34 Years | 5 (100.0%) | 3 (100.0%) |
| 35 to 44 Years | 14 (100.0%) | 6 (75.0%) |
| 45 to 54 Years | 18 (81.8%) | 23 (92.0%) |
| 55 to 64 Years | 61 (96.8%) | 53 (96.4%) |
| 65 to 74 Years | 56 (90.3%) | 41 (85.4%) |
| 75 Years and over | 34 (79.1%) | 27 (90.0%) |
| Total | 233 (91.7%) | 161 (91.0%) |
Income Below Poverty Among Married-Couple Families in Fifty Lakes
The poverty statistics for married-couple families in Fifty Lakes show that 5.1% or 6 of the total 118 families live below the poverty line. Families with no children have the highest poverty rate of 5.7%, comprising of 6 families. On the other hand, families with 1 or 2 children have the lowest poverty rate of 0.0%, which includes 0 families.
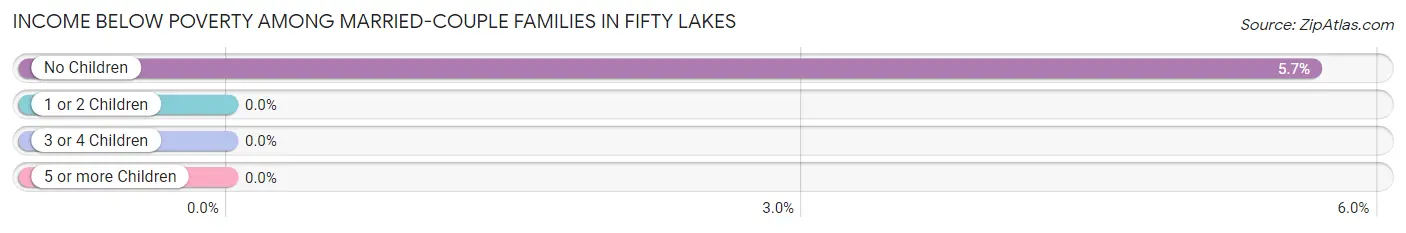
| Children | Above Poverty | Below Poverty |
| No Children | 100 (94.3%) | 6 (5.7%) |
| 1 or 2 Children | 12 (100.0%) | 0 (0.0%) |
| 3 or 4 Children | 0 (0.0%) | 0 (0.0%) |
| 5 or more Children | 0 (0.0%) | 0 (0.0%) |
| Total | 112 (94.9%) | 6 (5.1%) |
Income Below Poverty Among Single-Parent Households in Fifty Lakes
| Children | Single Father | Single Mother |
| No Children | 0 (0.0%) | 0 (0.0%) |
| 1 or 2 Children | 0 (0.0%) | 0 (0.0%) |
| 3 or 4 Children | 0 (0.0%) | 0 (0.0%) |
| 5 or more Children | 0 (0.0%) | 0 (0.0%) |
| Total | 0 (0.0%) | 0 (0.0%) |
Income Below Poverty Among Married-Couple vs Single-Parent Households in Fifty Lakes
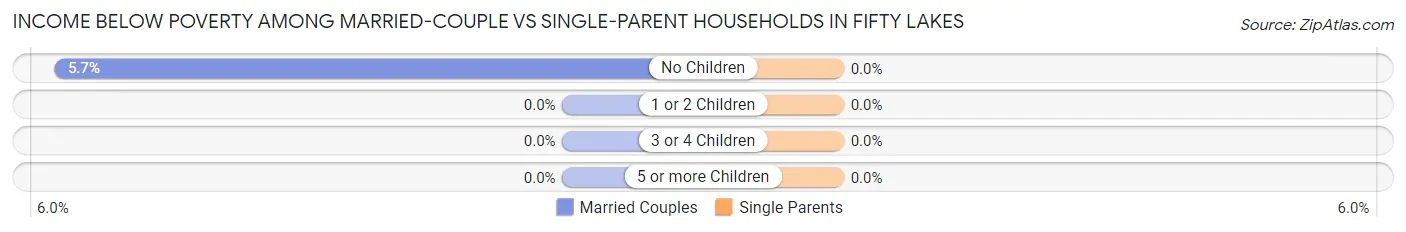
| Children | Married-Couple Families | Single-Parent Households |
| No Children | 6 (5.7%) | 0 (0.0%) |
| 1 or 2 Children | 0 (0.0%) | 0 (0.0%) |
| 3 or 4 Children | 0 (0.0%) | 0 (0.0%) |
| 5 or more Children | 0 (0.0%) | 0 (0.0%) |
| Total | 6 (5.1%) | 0 (0.0%) |
Race in Fifty Lakes
The most populous races in Fifty Lakes are White / Caucasian (426 | 98.8%), and Two or more Races (5 | 1.2%).
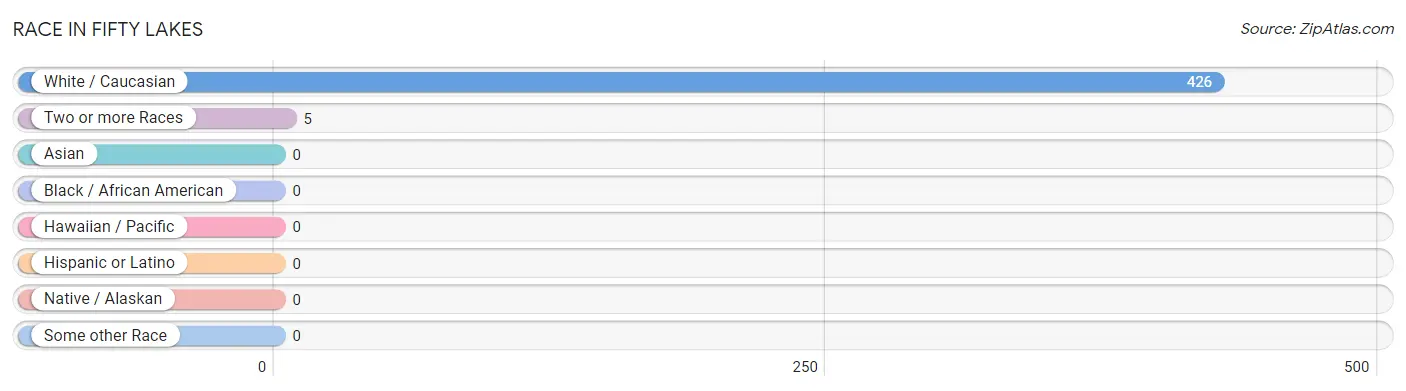
| Race | # Population | % Population |
| Asian | 0 | 0.0% |
| Black / African American | 0 | 0.0% |
| Hawaiian / Pacific | 0 | 0.0% |
| Hispanic or Latino | 0 | 0.0% |
| Native / Alaskan | 0 | 0.0% |
| White / Caucasian | 426 | 98.8% |
| Two or more Races | 5 | 1.2% |
| Some other Race | 0 | 0.0% |
| Total | 431 | 100.0% |
Ancestry in Fifty Lakes
The most populous ancestries reported in Fifty Lakes are German (181 | 42.0%), English (97 | 22.5%), Irish (73 | 16.9%), Swedish (65 | 15.1%), and Norwegian (52 | 12.1%), together accounting for 108.6% of all Fifty Lakes residents.
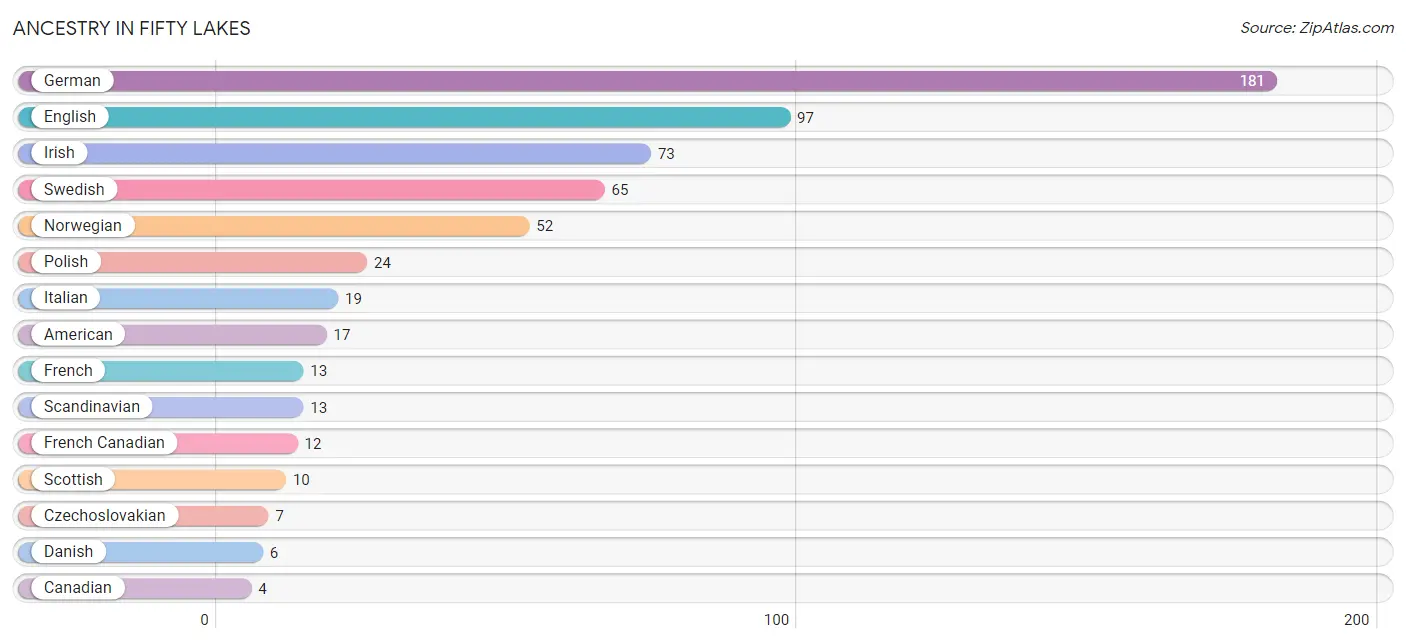
| Ancestry | # Population | % Population |
| American | 17 | 3.9% |
| Canadian | 4 | 0.9% |
| Czech | 4 | 0.9% |
| Czechoslovakian | 7 | 1.6% |
| Danish | 6 | 1.4% |
| English | 97 | 22.5% |
| European | 4 | 0.9% |
| Finnish | 2 | 0.5% |
| French | 13 | 3.0% |
| French Canadian | 12 | 2.8% |
| German | 181 | 42.0% |
| Irish | 73 | 16.9% |
| Italian | 19 | 4.4% |
| Norwegian | 52 | 12.1% |
| Polish | 24 | 5.6% |
| Scandinavian | 13 | 3.0% |
| Scotch-Irish | 3 | 0.7% |
| Scottish | 10 | 2.3% |
| Swedish | 65 | 15.1% |
| Ukrainian | 2 | 0.5% |
| Welsh | 1 | 0.2% | View All 21 Rows |
Immigrants in Fifty Lakes
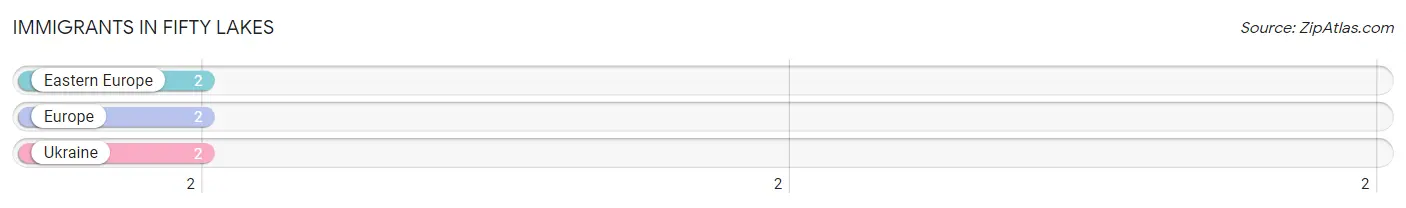
The most numerous immigrant groups reported in Fifty Lakes came from Eastern Europe (2 | 0.5%), Europe (2 | 0.5%), and Ukraine (2 | 0.5%), together accounting for 1.4% of all Fifty Lakes residents.
| Immigration Origin | # Population | % Population |
| Eastern Europe | 2 | 0.5% |
| Europe | 2 | 0.5% |
| Ukraine | 2 | 0.5% | View All 3 Rows |
Sex and Age in Fifty Lakes
Sex and Age in Fifty Lakes
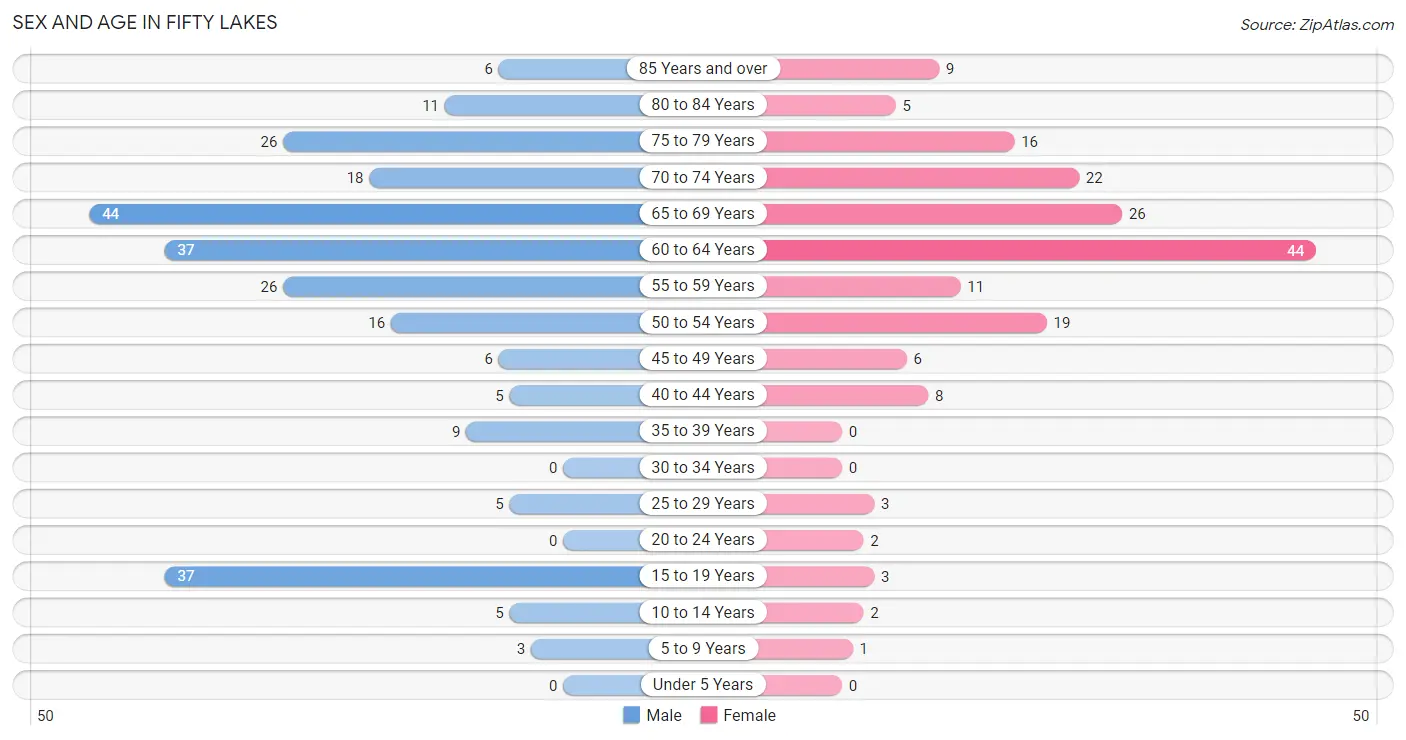
The most populous age groups in Fifty Lakes are 65 to 69 Years (44 | 17.3%) for men and 60 to 64 Years (44 | 24.9%) for women.
| Age Bracket | Male | Female |
| Under 5 Years | 0 (0.0%) | 0 (0.0%) |
| 5 to 9 Years | 3 (1.2%) | 1 (0.6%) |
| 10 to 14 Years | 5 (2.0%) | 2 (1.1%) |
| 15 to 19 Years | 37 (14.6%) | 3 (1.7%) |
| 20 to 24 Years | 0 (0.0%) | 2 (1.1%) |
| 25 to 29 Years | 5 (2.0%) | 3 (1.7%) |
| 30 to 34 Years | 0 (0.0%) | 0 (0.0%) |
| 35 to 39 Years | 9 (3.5%) | 0 (0.0%) |
| 40 to 44 Years | 5 (2.0%) | 8 (4.5%) |
| 45 to 49 Years | 6 (2.4%) | 6 (3.4%) |
| 50 to 54 Years | 16 (6.3%) | 19 (10.7%) |
| 55 to 59 Years | 26 (10.2%) | 11 (6.2%) |
| 60 to 64 Years | 37 (14.6%) | 44 (24.9%) |
| 65 to 69 Years | 44 (17.3%) | 26 (14.7%) |
| 70 to 74 Years | 18 (7.1%) | 22 (12.4%) |
| 75 to 79 Years | 26 (10.2%) | 16 (9.0%) |
| 80 to 84 Years | 11 (4.3%) | 5 (2.8%) |
| 85 Years and over | 6 (2.4%) | 9 (5.1%) |
| Total | 254 (100.0%) | 177 (100.0%) |
Families and Households in Fifty Lakes
Median Family Size in Fifty Lakes
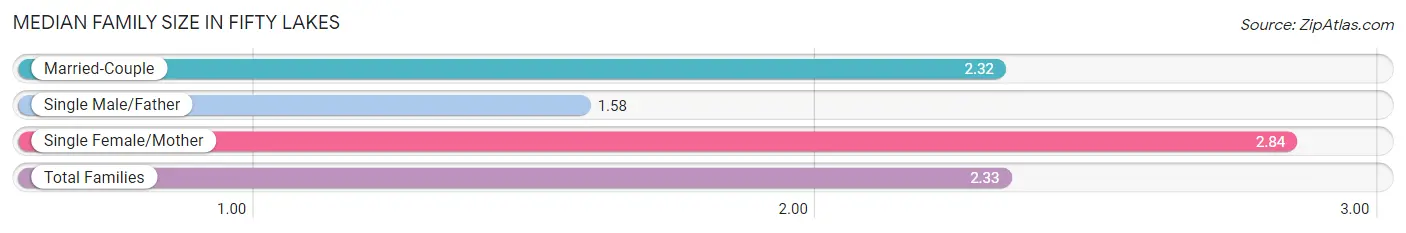
The median family size in Fifty Lakes is 2.33 persons per family, with single female/mother families (19 | 12.8%) accounting for the largest median family size of 2.84 persons per family. On the other hand, single male/father families (12 | 8.1%) represent the smallest median family size with 1.58 persons per family.
| Family Type | # Families | Family Size |
| Married-Couple | 118 (79.2%) | 2.32 |
| Single Male/Father | 12 (8.1%) | 1.58 |
| Single Female/Mother | 19 (12.8%) | 2.84 |
| Total Families | 149 (100.0%) | 2.33 |
Median Household Size in Fifty Lakes
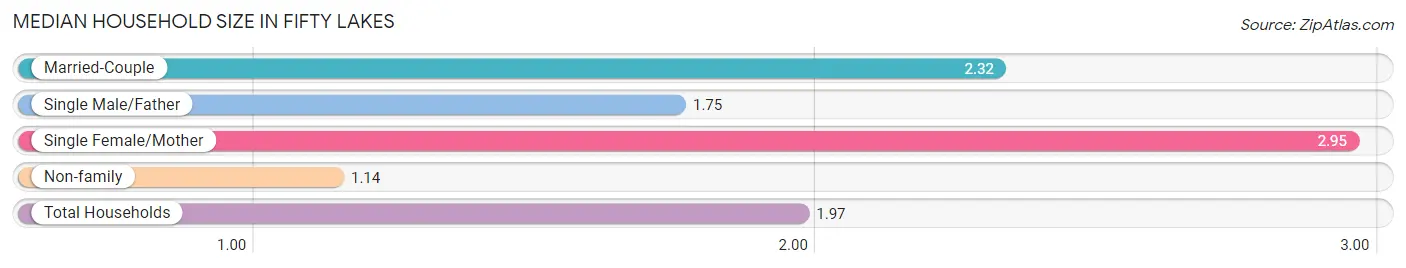
The median household size in Fifty Lakes is 1.97 persons per household, with single female/mother households (19 | 8.7%) accounting for the largest median household size of 2.95 persons per household. non-family households (70 | 32.0%) represent the smallest median household size with 1.14 persons per household.
| Household Type | # Households | Household Size |
| Married-Couple | 118 (53.9%) | 2.32 |
| Single Male/Father | 12 (5.5%) | 1.75 |
| Single Female/Mother | 19 (8.7%) | 2.95 |
| Non-family | 70 (32.0%) | 1.14 |
| Total Households | 219 (100.0%) | 1.97 |
Household Size by Marriage Status in Fifty Lakes
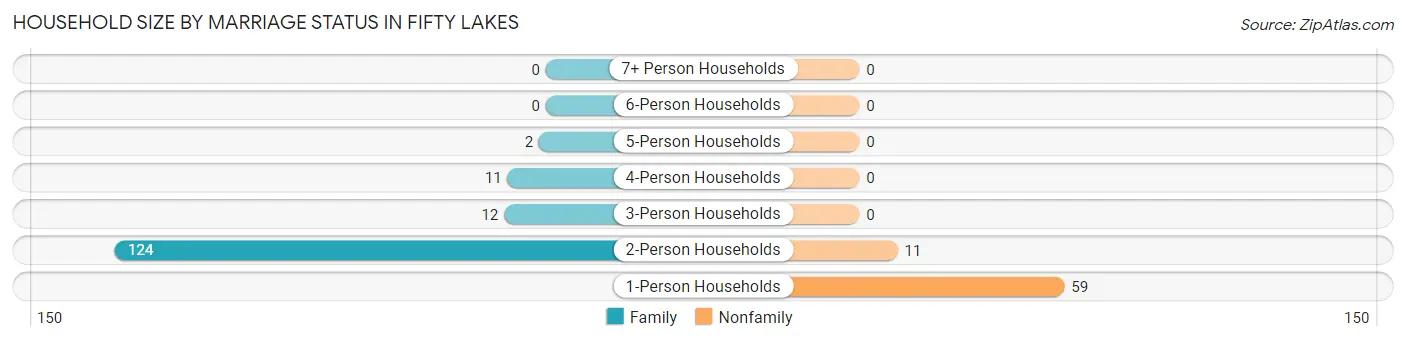
Out of a total of 219 households in Fifty Lakes, 149 (68.0%) are family households, while 70 (32.0%) are nonfamily households. The most numerous type of family households are 2-person households, comprising 124, and the most common type of nonfamily households are 1-person households, comprising 59.
| Household Size | Family Households | Nonfamily Households |
| 1-Person Households | - | 59 (26.9%) |
| 2-Person Households | 124 (56.6%) | 11 (5.0%) |
| 3-Person Households | 12 (5.5%) | 0 (0.0%) |
| 4-Person Households | 11 (5.0%) | 0 (0.0%) |
| 5-Person Households | 2 (0.9%) | 0 (0.0%) |
| 6-Person Households | 0 (0.0%) | 0 (0.0%) |
| 7+ Person Households | 0 (0.0%) | 0 (0.0%) |
| Total | 149 (68.0%) | 70 (32.0%) |
Female Fertility in Fifty Lakes
Fertility by Age in Fifty Lakes
| Age Bracket | Women with Births | Births / 1,000 Women |
| 15 to 19 years | 0 (0.0%) | 0.0 |
| 20 to 34 years | 0 (0.0%) | 0.0 |
| 35 to 50 years | 0 (0.0%) | 0.0 |
| Total | 0 (0.0%) | 0.0 |
Fertility by Age by Marriage Status in Fifty Lakes
| Age Bracket | Married | Unmarried |
| 15 to 19 years | 0 (0.0%) | 0 (0.0%) |
| 20 to 34 years | 0 (0.0%) | 0 (0.0%) |
| 35 to 50 years | 0 (0.0%) | 0 (0.0%) |
| Total | 0 (0.0%) | 0 (0.0%) |
Fertility by Education in Fifty Lakes
| Educational Attainment | Women with Births | Births / 1,000 Women |
| Less than High School | 0 (0.0%) | 0.0 |
| High School Diploma | 0 (0.0%) | 0.0 |
| College or Associate's Degree | 0 (0.0%) | 0.0 |
| Bachelor's Degree | 0 (0.0%) | 0.0 |
| Graduate Degree | 0 (0.0%) | 0.0 |
| Total | 0 (0.0%) | 0.0 |
Fertility by Education by Marriage Status in Fifty Lakes
| Educational Attainment | Married | Unmarried |
| Less than High School | 0 (0.0%) | 0 (0.0%) |
| High School Diploma | 0 (0.0%) | 0 (0.0%) |
| College or Associate's Degree | 0 (0.0%) | 0 (0.0%) |
| Bachelor's Degree | 0 (0.0%) | 0 (0.0%) |
| Graduate Degree | 0 (0.0%) | 0 (0.0%) |
| Total | 0 (0.0%) | 0 (0.0%) |
Employment Characteristics in Fifty Lakes
Employment by Class of Employer in Fifty Lakes
Among the 146 employed individuals in Fifty Lakes, private company employees (64 | 43.8%), self-employed (incorporated) (33 | 22.6%), and self-employed (not incorporated) (18 | 12.3%) make up the most common classes of employment.
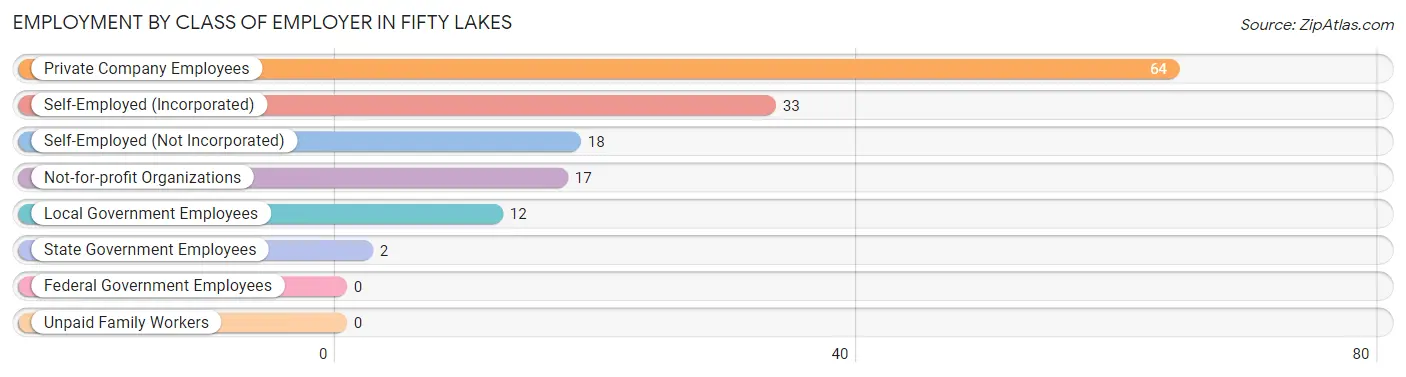
| Employer Class | # Employees | % Employees |
| Private Company Employees | 64 | 43.8% |
| Self-Employed (Incorporated) | 33 | 22.6% |
| Self-Employed (Not Incorporated) | 18 | 12.3% |
| Not-for-profit Organizations | 17 | 11.6% |
| Local Government Employees | 12 | 8.2% |
| State Government Employees | 2 | 1.4% |
| Federal Government Employees | 0 | 0.0% |
| Unpaid Family Workers | 0 | 0.0% |
| Total | 146 | 100.0% |
Employment Status by Age in Fifty Lakes
According to the labor force statistics for Fifty Lakes, out of the total population over 16 years of age (418), 36.8% or 154 individuals are in the labor force, with 3.9% or 6 of them unemployed. The age group with the highest labor force participation rate is 20 to 24 years, with 100.0% or 2 individuals in the labor force. Within the labor force, the 25 to 29 years age range has the highest percentage of unemployed individuals, with 50.0% or 4 of them being unemployed.
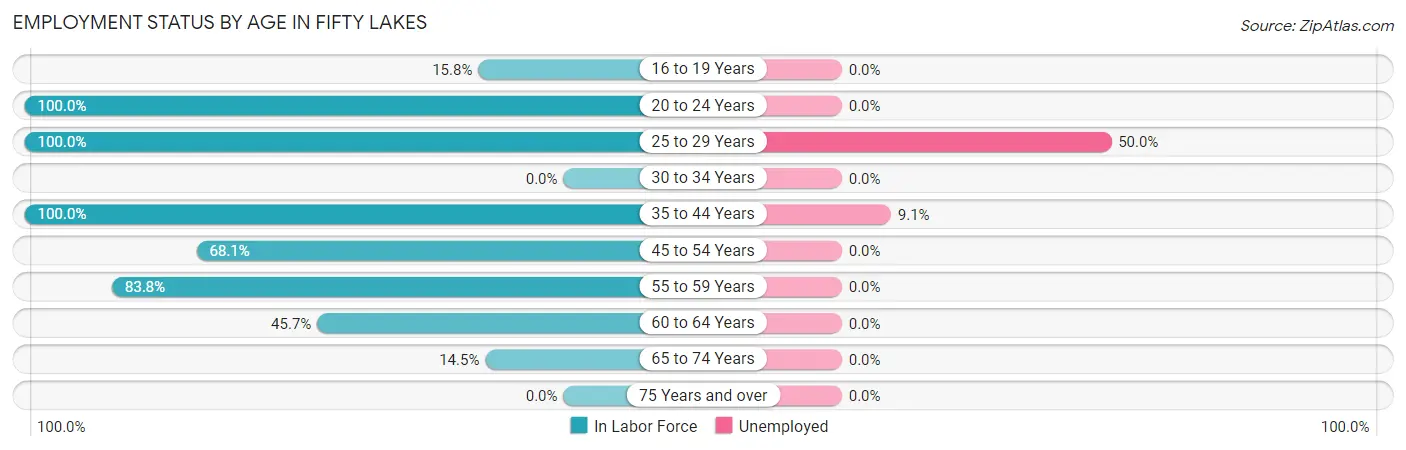
| Age Bracket | In Labor Force | Unemployed |
| 16 to 19 Years | 6 (15.8%) | 0 (0.0%) |
| 20 to 24 Years | 2 (100.0%) | 0 (0.0%) |
| 25 to 29 Years | 8 (100.0%) | 4 (50.0%) |
| 30 to 34 Years | 0 (0.0%) | 0 (0.0%) |
| 35 to 44 Years | 22 (100.0%) | 2 (9.1%) |
| 45 to 54 Years | 32 (68.1%) | 0 (0.0%) |
| 55 to 59 Years | 31 (83.8%) | 0 (0.0%) |
| 60 to 64 Years | 37 (45.7%) | 0 (0.0%) |
| 65 to 74 Years | 16 (14.5%) | 0 (0.0%) |
| 75 Years and over | 0 (0.0%) | 0 (0.0%) |
| Total | 154 (36.8%) | 6 (3.9%) |
Employment Status by Educational Attainment in Fifty Lakes
According to labor force statistics for Fifty Lakes, 66.7% of individuals (130) out of the total population between 25 and 64 years of age (195) are in the labor force, with 4.6% or 6 of them being unemployed. The group with the highest labor force participation rate are those with the educational attainment of less than high school, with 100.0% or 16 individuals in the labor force. Within the labor force, individuals with bachelor's degree or higher education have the highest percentage of unemployment, with 10.3% or 4 of them being unemployed.
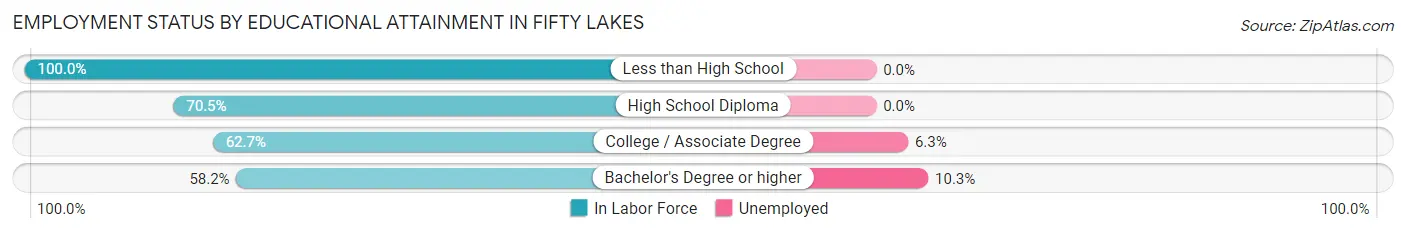
| Educational Attainment | In Labor Force | Unemployed |
| Less than High School | 16 (100.0%) | 0 (0.0%) |
| High School Diploma | 43 (70.5%) | 0 (0.0%) |
| College / Associate Degree | 32 (62.7%) | 3 (6.3%) |
| Bachelor's Degree or higher | 39 (58.2%) | 7 (10.3%) |
| Total | 130 (66.7%) | 9 (4.6%) |
Employment Occupations by Sex in Fifty Lakes
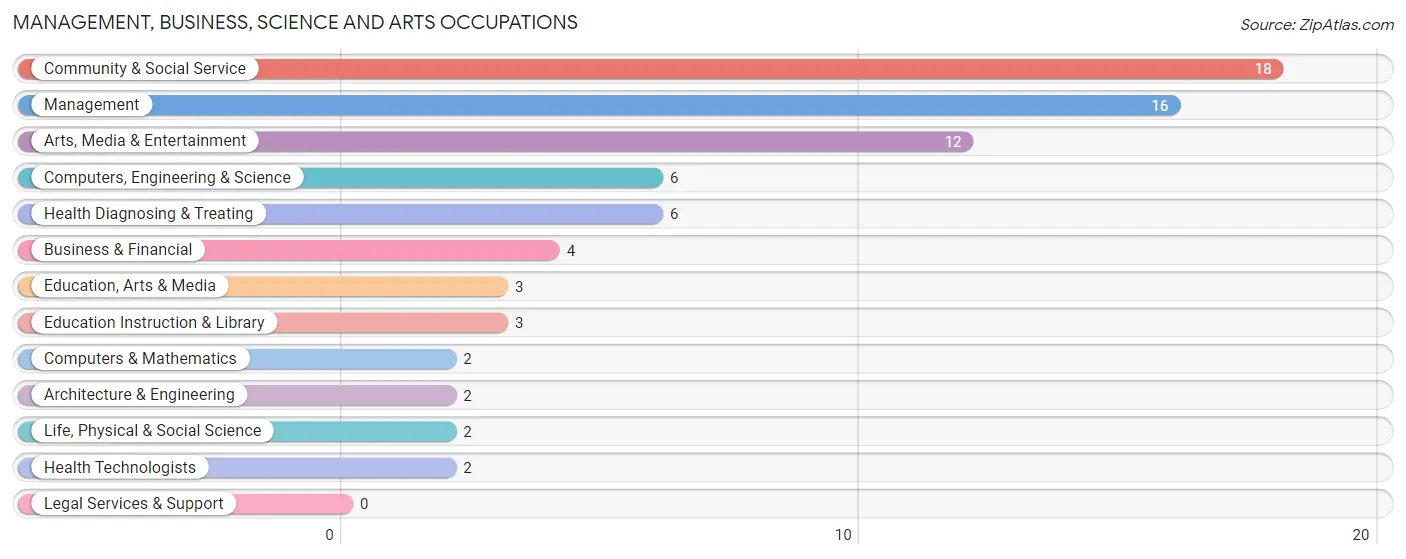
Management, Business, Science and Arts Occupations
The most common Management, Business, Science and Arts occupations in Fifty Lakes are Community & Social Service (18 | 12.2%), Management (16 | 10.8%), Arts, Media & Entertainment (12 | 8.1%), Computers, Engineering & Science (6 | 4.1%), and Health Diagnosing & Treating (6 | 4.1%).
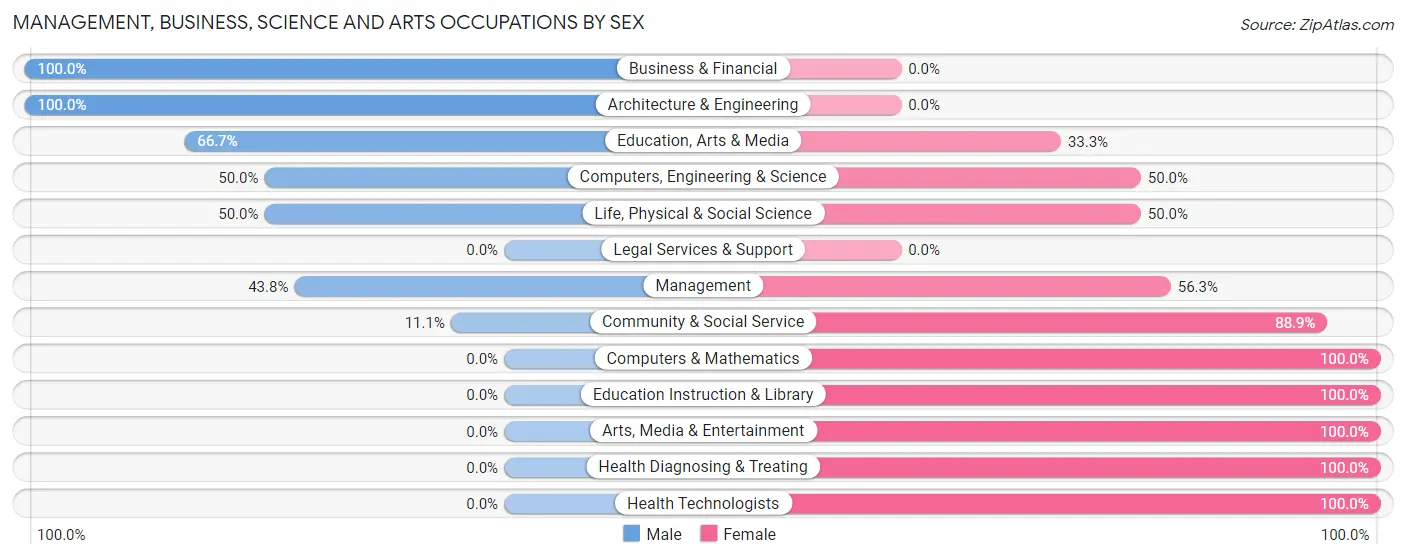
Management, Business, Science and Arts Occupations by Sex
Within the Management, Business, Science and Arts occupations in Fifty Lakes, the most male-oriented occupations are Business & Financial (100.0%), Architecture & Engineering (100.0%), and Education, Arts & Media (66.7%), while the most female-oriented occupations are Computers & Mathematics (100.0%), Education Instruction & Library (100.0%), and Arts, Media & Entertainment (100.0%).
| Occupation | Male | Female |
| Management | 7 (43.8%) | 9 (56.2%) |
| Business & Financial | 4 (100.0%) | 0 (0.0%) |
| Computers, Engineering & Science | 3 (50.0%) | 3 (50.0%) |
| Computers & Mathematics | 0 (0.0%) | 2 (100.0%) |
| Architecture & Engineering | 2 (100.0%) | 0 (0.0%) |
| Life, Physical & Social Science | 1 (50.0%) | 1 (50.0%) |
| Community & Social Service | 2 (11.1%) | 16 (88.9%) |
| Education, Arts & Media | 2 (66.7%) | 1 (33.3%) |
| Legal Services & Support | 0 (0.0%) | 0 (0.0%) |
| Education Instruction & Library | 0 (0.0%) | 3 (100.0%) |
| Arts, Media & Entertainment | 0 (0.0%) | 12 (100.0%) |
| Health Diagnosing & Treating | 0 (0.0%) | 6 (100.0%) |
| Health Technologists | 0 (0.0%) | 2 (100.0%) |
| Total (Category) | 16 (32.0%) | 34 (68.0%) |
| Total (Overall) | 93 (62.8%) | 55 (37.2%) |
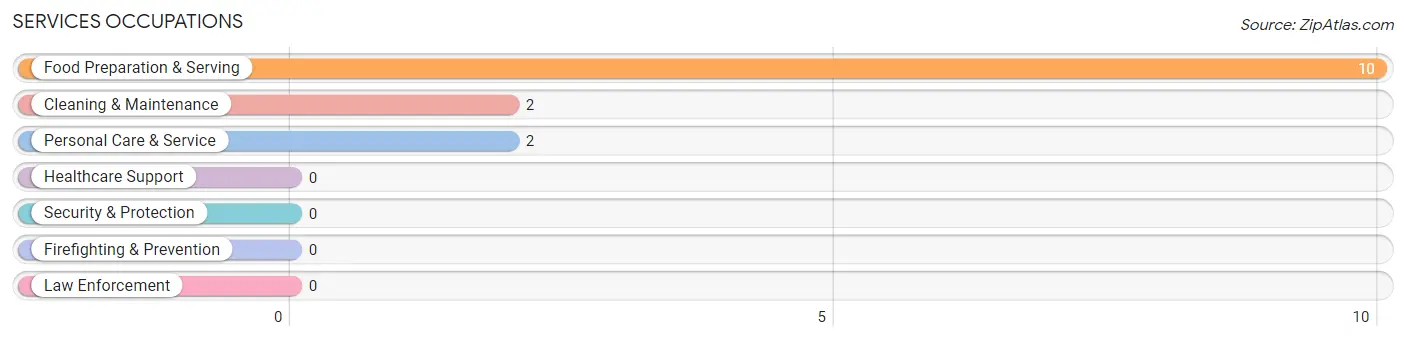
Services Occupations
The most common Services occupations in Fifty Lakes are Food Preparation & Serving (10 | 6.8%), Cleaning & Maintenance (2 | 1.3%), and Personal Care & Service (2 | 1.3%).
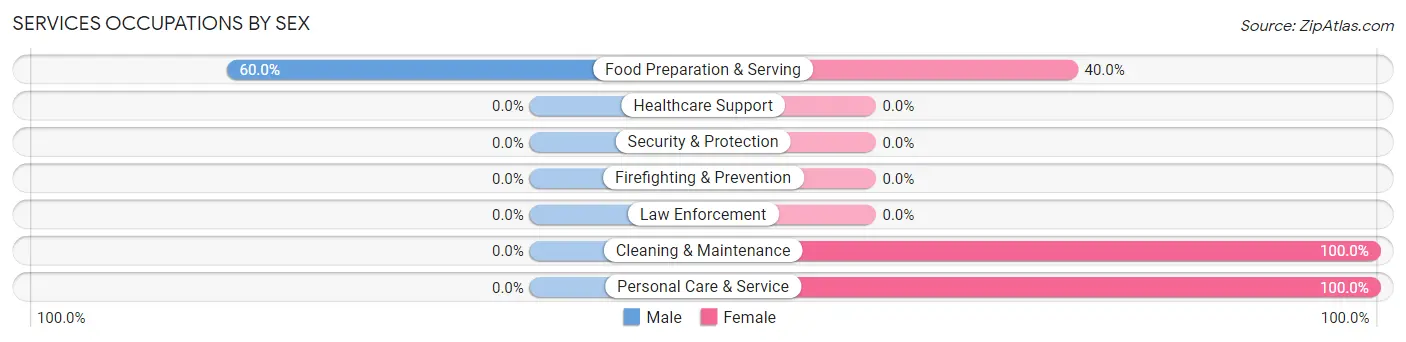
Services Occupations by Sex
| Occupation | Male | Female |
| Healthcare Support | 0 (0.0%) | 0 (0.0%) |
| Security & Protection | 0 (0.0%) | 0 (0.0%) |
| Firefighting & Prevention | 0 (0.0%) | 0 (0.0%) |
| Law Enforcement | 0 (0.0%) | 0 (0.0%) |
| Food Preparation & Serving | 6 (60.0%) | 4 (40.0%) |
| Cleaning & Maintenance | 0 (0.0%) | 2 (100.0%) |
| Personal Care & Service | 0 (0.0%) | 2 (100.0%) |
| Total (Category) | 6 (42.9%) | 8 (57.1%) |
| Total (Overall) | 93 (62.8%) | 55 (37.2%) |
Sales and Office Occupations
The most common Sales and Office occupations in Fifty Lakes are Sales & Related (23 | 15.5%), and Office & Administration (12 | 8.1%).
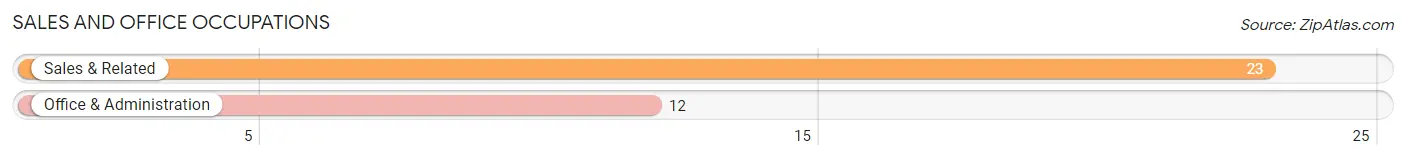
Sales and Office Occupations by Sex
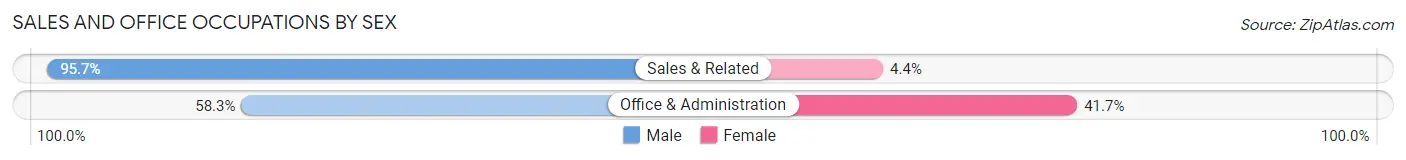
| Occupation | Male | Female |
| Sales & Related | 22 (95.7%) | 1 (4.3%) |
| Office & Administration | 7 (58.3%) | 5 (41.7%) |
| Total (Category) | 29 (82.9%) | 6 (17.1%) |
| Total (Overall) | 93 (62.8%) | 55 (37.2%) |
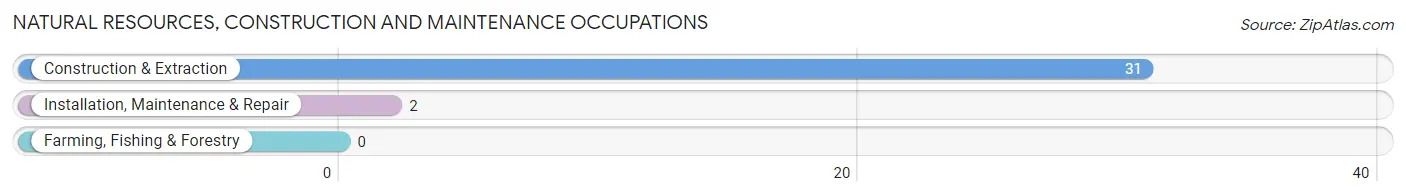
Natural Resources, Construction and Maintenance Occupations
The most common Natural Resources, Construction and Maintenance occupations in Fifty Lakes are Construction & Extraction (31 | 20.9%), and Installation, Maintenance & Repair (2 | 1.3%).
Natural Resources, Construction and Maintenance Occupations by Sex
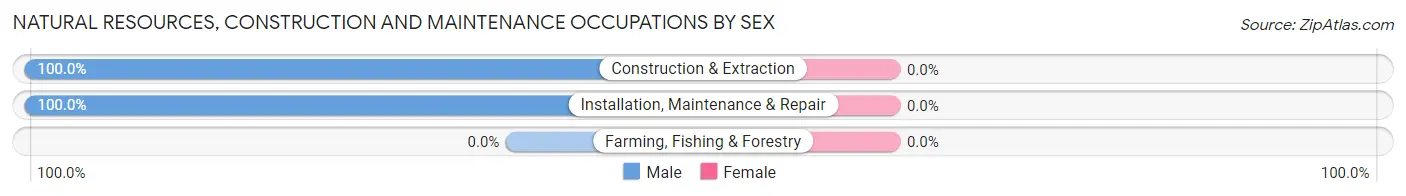
| Occupation | Male | Female |
| Farming, Fishing & Forestry | 0 (0.0%) | 0 (0.0%) |
| Construction & Extraction | 31 (100.0%) | 0 (0.0%) |
| Installation, Maintenance & Repair | 2 (100.0%) | 0 (0.0%) |
| Total (Category) | 33 (100.0%) | 0 (0.0%) |
| Total (Overall) | 93 (62.8%) | 55 (37.2%) |
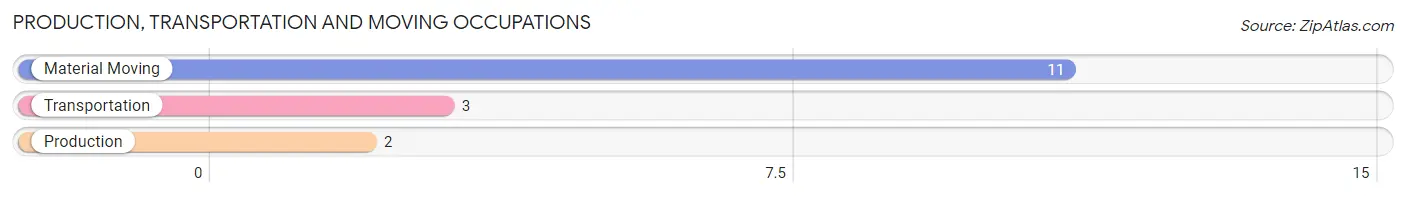
Production, Transportation and Moving Occupations
The most common Production, Transportation and Moving occupations in Fifty Lakes are Material Moving (11 | 7.4%), Transportation (3 | 2.0%), and Production (2 | 1.3%).
Production, Transportation and Moving Occupations by Sex
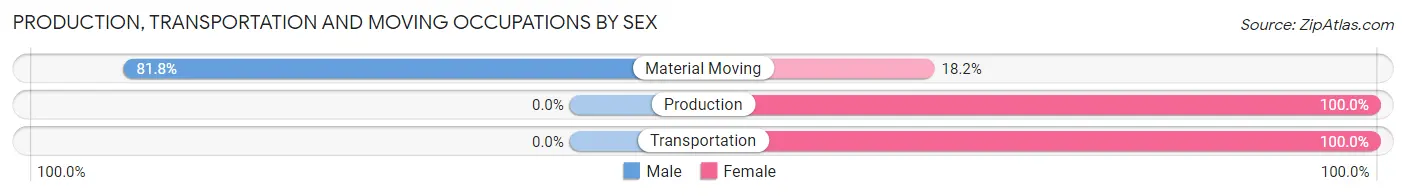
| Occupation | Male | Female |
| Production | 0 (0.0%) | 2 (100.0%) |
| Transportation | 0 (0.0%) | 3 (100.0%) |
| Material Moving | 9 (81.8%) | 2 (18.2%) |
| Total (Category) | 9 (56.2%) | 7 (43.8%) |
| Total (Overall) | 93 (62.8%) | 55 (37.2%) |
Employment Industries by Sex in Fifty Lakes
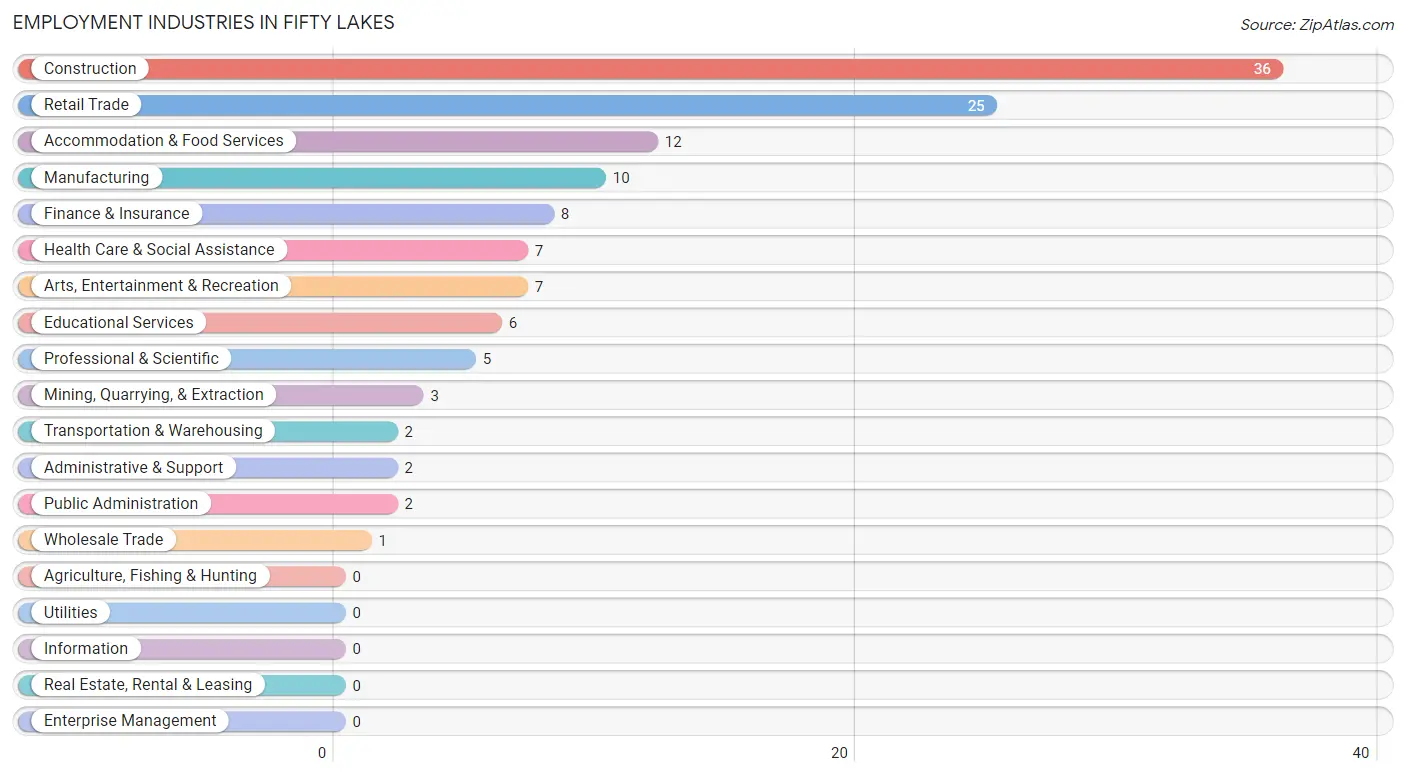
Employment Industries in Fifty Lakes
The major employment industries in Fifty Lakes include Construction (36 | 24.3%), Retail Trade (25 | 16.9%), Accommodation & Food Services (12 | 8.1%), Manufacturing (10 | 6.8%), and Finance & Insurance (8 | 5.4%).
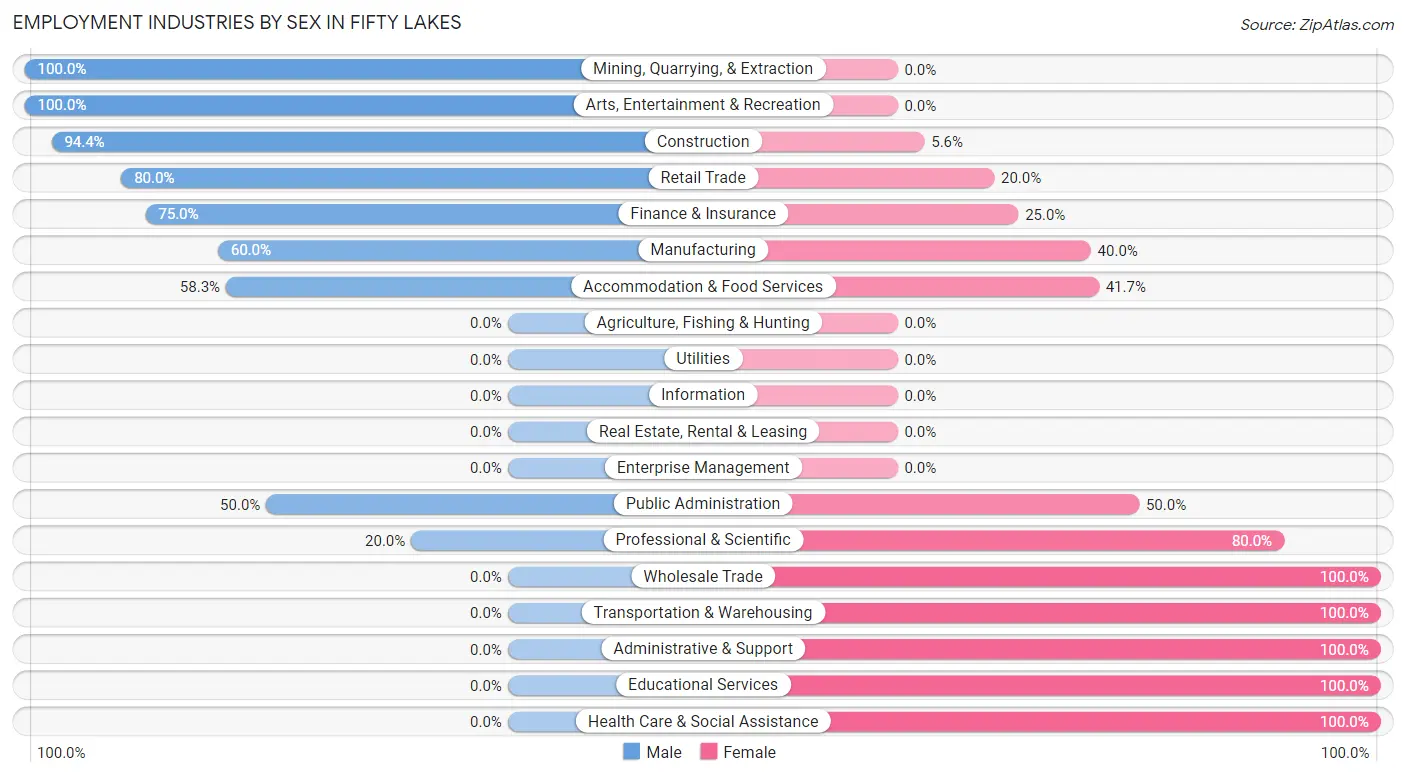
Employment Industries by Sex in Fifty Lakes
The Fifty Lakes industries that see more men than women are Mining, Quarrying, & Extraction (100.0%), Arts, Entertainment & Recreation (100.0%), and Construction (94.4%), whereas the industries that tend to have a higher number of women are Wholesale Trade (100.0%), Transportation & Warehousing (100.0%), and Administrative & Support (100.0%).
| Industry | Male | Female |
| Agriculture, Fishing & Hunting | 0 (0.0%) | 0 (0.0%) |
| Mining, Quarrying, & Extraction | 3 (100.0%) | 0 (0.0%) |
| Construction | 34 (94.4%) | 2 (5.6%) |
| Manufacturing | 6 (60.0%) | 4 (40.0%) |
| Wholesale Trade | 0 (0.0%) | 1 (100.0%) |
| Retail Trade | 20 (80.0%) | 5 (20.0%) |
| Transportation & Warehousing | 0 (0.0%) | 2 (100.0%) |
| Utilities | 0 (0.0%) | 0 (0.0%) |
| Information | 0 (0.0%) | 0 (0.0%) |
| Finance & Insurance | 6 (75.0%) | 2 (25.0%) |
| Real Estate, Rental & Leasing | 0 (0.0%) | 0 (0.0%) |
| Professional & Scientific | 1 (20.0%) | 4 (80.0%) |
| Enterprise Management | 0 (0.0%) | 0 (0.0%) |
| Administrative & Support | 0 (0.0%) | 2 (100.0%) |
| Educational Services | 0 (0.0%) | 6 (100.0%) |
| Health Care & Social Assistance | 0 (0.0%) | 7 (100.0%) |
| Arts, Entertainment & Recreation | 7 (100.0%) | 0 (0.0%) |
| Accommodation & Food Services | 7 (58.3%) | 5 (41.7%) |
| Public Administration | 1 (50.0%) | 1 (50.0%) |
| Total | 93 (62.8%) | 55 (37.2%) |
Education in Fifty Lakes
School Enrollment in Fifty Lakes
The most common levels of schooling among the 52 students in Fifty Lakes are college / undergraduate (26 | 50.0%), high school (19 | 36.5%), and elementary school (4 | 7.7%).
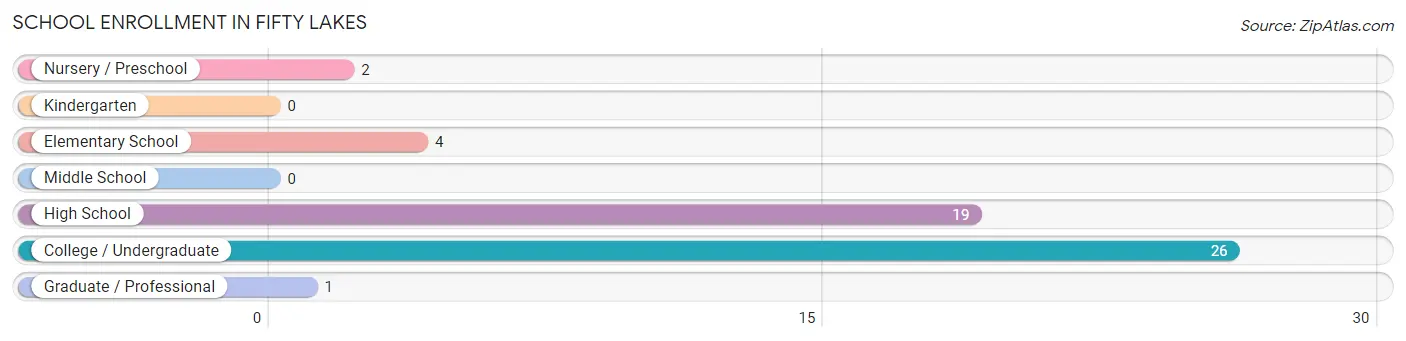
| School Level | # Students | % Students |
| Nursery / Preschool | 2 | 3.8% |
| Kindergarten | 0 | 0.0% |
| Elementary School | 4 | 7.7% |
| Middle School | 0 | 0.0% |
| High School | 19 | 36.5% |
| College / Undergraduate | 26 | 50.0% |
| Graduate / Professional | 1 | 1.9% |
| Total | 52 | 100.0% |
School Enrollment by Age by Funding Source in Fifty Lakes
Out of a total of 52 students who are enrolled in schools in Fifty Lakes, 5 (9.6%) attend a private institution, while the remaining 47 (90.4%) are enrolled in public schools. The age group of 10 to 14 year olds has the highest likelihood of being enrolled in private schools, with 5 (71.4% in the age bracket) enrolled. Conversely, the age group of 5 to 9 year old has the lowest likelihood of being enrolled in a private school, with 4 (100.0% in the age bracket) attending a public institution.
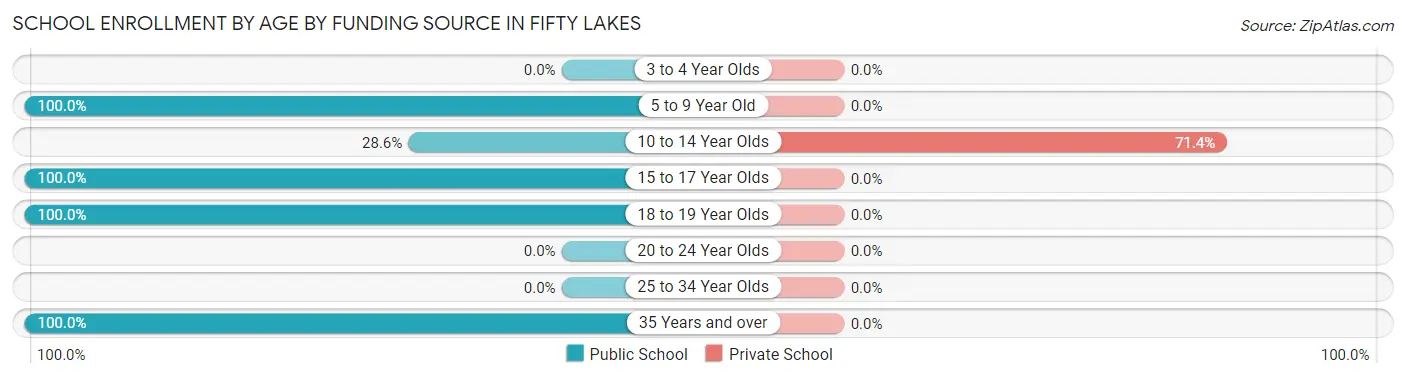
| Age Bracket | Public School | Private School |
| 3 to 4 Year Olds | 0 (0.0%) | 0 (0.0%) |
| 5 to 9 Year Old | 4 (100.0%) | 0 (0.0%) |
| 10 to 14 Year Olds | 2 (28.6%) | 5 (71.4%) |
| 15 to 17 Year Olds | 10 (100.0%) | 0 (0.0%) |
| 18 to 19 Year Olds | 29 (100.0%) | 0 (0.0%) |
| 20 to 24 Year Olds | 0 (0.0%) | 0 (0.0%) |
| 25 to 34 Year Olds | 0 (0.0%) | 0 (0.0%) |
| 35 Years and over | 2 (100.0%) | 0 (0.0%) |
| Total | 47 (90.4%) | 5 (9.6%) |
Educational Attainment by Field of Study in Fifty Lakes
Education (39 | 22.9%), engineering (28 | 16.5%), business (23 | 13.5%), social sciences (15 | 8.8%), and visual & performing arts (14 | 8.2%) are the most common fields of study among 170 individuals in Fifty Lakes who have obtained a bachelor's degree or higher.
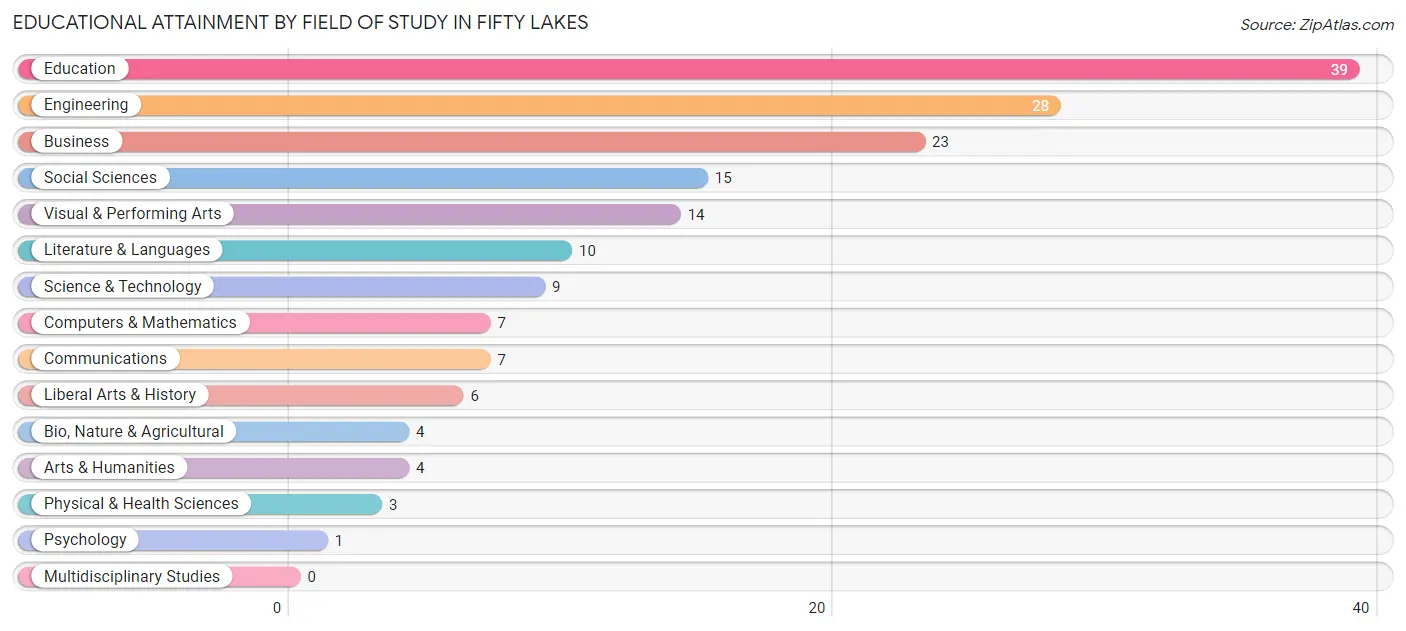
| Field of Study | # Graduates | % Graduates |
| Computers & Mathematics | 7 | 4.1% |
| Bio, Nature & Agricultural | 4 | 2.4% |
| Physical & Health Sciences | 3 | 1.8% |
| Psychology | 1 | 0.6% |
| Social Sciences | 15 | 8.8% |
| Engineering | 28 | 16.5% |
| Multidisciplinary Studies | 0 | 0.0% |
| Science & Technology | 9 | 5.3% |
| Business | 23 | 13.5% |
| Education | 39 | 22.9% |
| Literature & Languages | 10 | 5.9% |
| Liberal Arts & History | 6 | 3.5% |
| Visual & Performing Arts | 14 | 8.2% |
| Communications | 7 | 4.1% |
| Arts & Humanities | 4 | 2.4% |
| Total | 170 | 100.0% |
Transportation & Commute in Fifty Lakes
Vehicle Availability by Sex in Fifty Lakes
The most prevalent vehicle ownership categories in Fifty Lakes are males with 2 vehicles (33, accounting for 36.3%) and females with 2 vehicles (10, making up 60.0%).
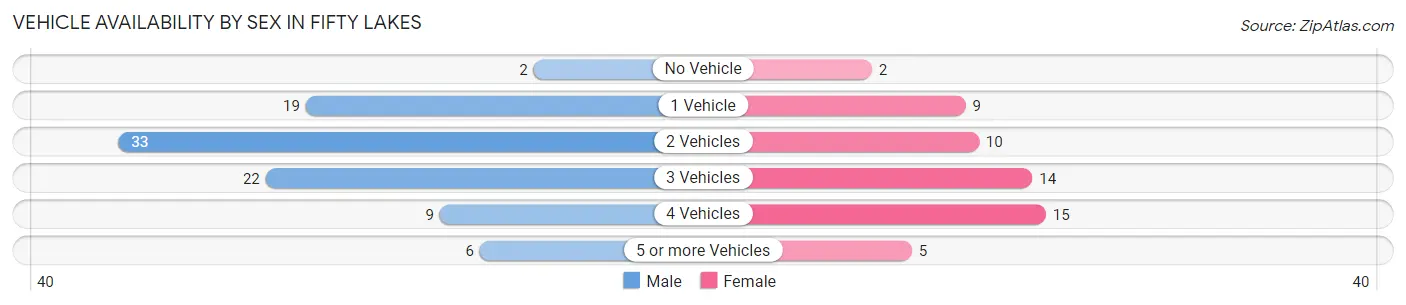
| Vehicles Available | Male | Female |
| No Vehicle | 2 (2.2%) | 2 (3.6%) |
| 1 Vehicle | 19 (20.9%) | 9 (16.4%) |
| 2 Vehicles | 33 (36.3%) | 10 (18.2%) |
| 3 Vehicles | 22 (24.2%) | 14 (25.5%) |
| 4 Vehicles | 9 (9.9%) | 15 (27.3%) |
| 5 or more Vehicles | 6 (6.6%) | 5 (9.1%) |
| Total | 91 (100.0%) | 55 (100.0%) |
Commute Time in Fifty Lakes
The most frequently occuring commute durations in Fifty Lakes are 15 to 19 minutes (22 commuters, 17.9%), 45 to 59 minutes (22 commuters, 17.9%), and 10 to 14 minutes (20 commuters, 16.3%).
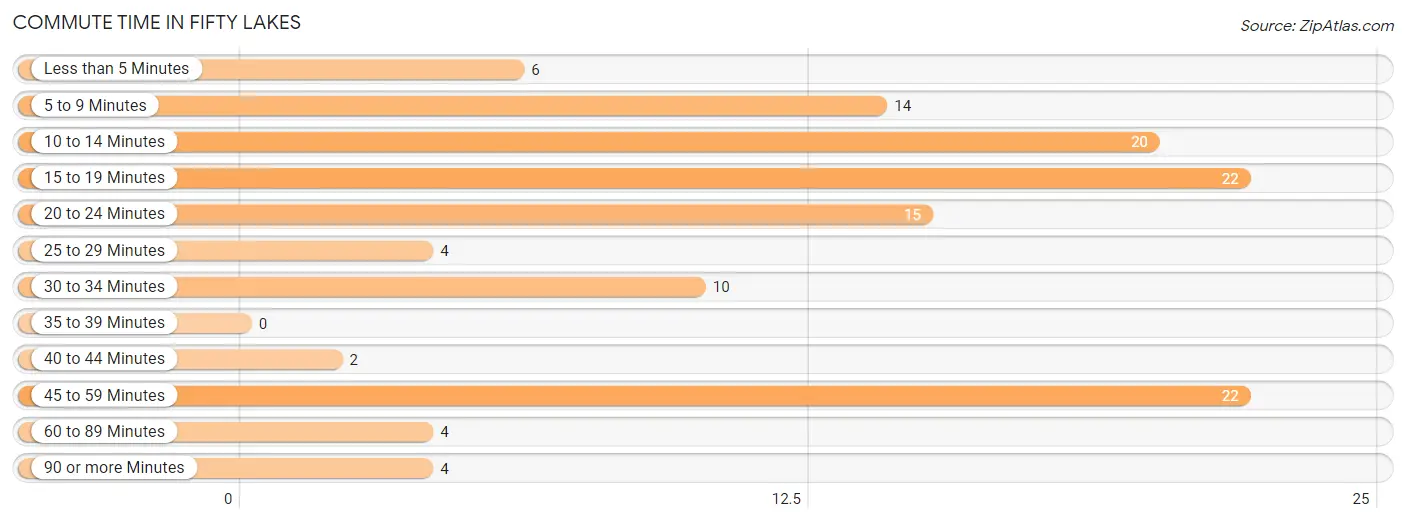
| Commute Time | # Commuters | % Commuters |
| Less than 5 Minutes | 6 | 4.9% |
| 5 to 9 Minutes | 14 | 11.4% |
| 10 to 14 Minutes | 20 | 16.3% |
| 15 to 19 Minutes | 22 | 17.9% |
| 20 to 24 Minutes | 15 | 12.2% |
| 25 to 29 Minutes | 4 | 3.3% |
| 30 to 34 Minutes | 10 | 8.1% |
| 35 to 39 Minutes | 0 | 0.0% |
| 40 to 44 Minutes | 2 | 1.6% |
| 45 to 59 Minutes | 22 | 17.9% |
| 60 to 89 Minutes | 4 | 3.3% |
| 90 or more Minutes | 4 | 3.3% |
Commute Time by Sex in Fifty Lakes
The most common commute times in Fifty Lakes are 10 to 14 minutes (13 commuters, 17.8%) for males and 15 to 19 minutes (15 commuters, 30.0%) for females.
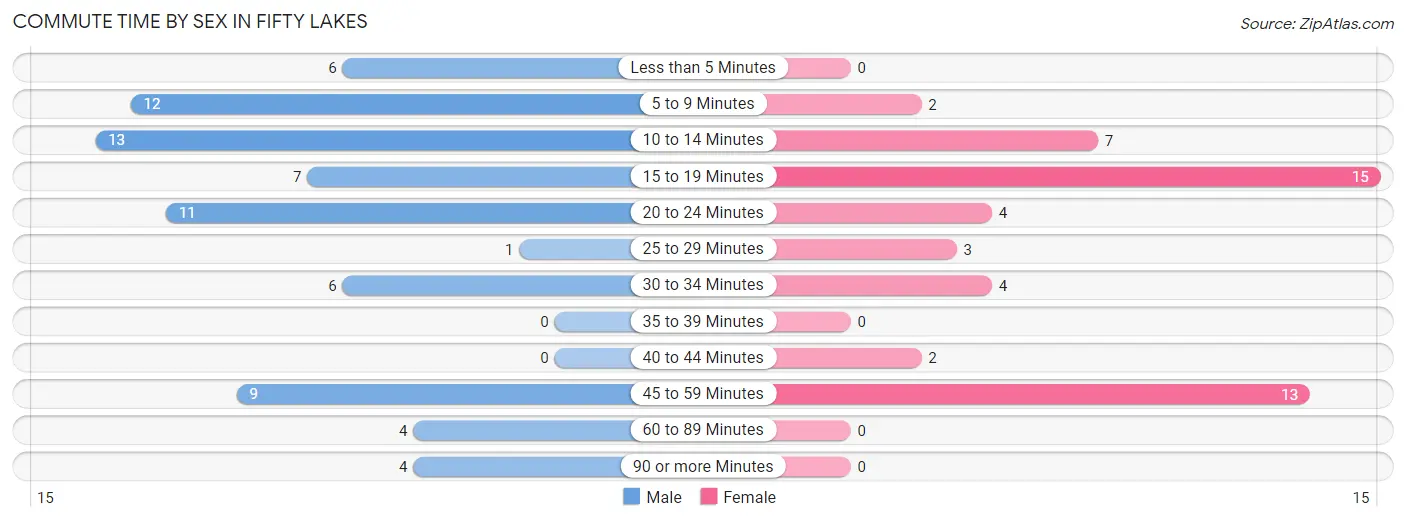
| Commute Time | Male | Female |
| Less than 5 Minutes | 6 (8.2%) | 0 (0.0%) |
| 5 to 9 Minutes | 12 (16.4%) | 2 (4.0%) |
| 10 to 14 Minutes | 13 (17.8%) | 7 (14.0%) |
| 15 to 19 Minutes | 7 (9.6%) | 15 (30.0%) |
| 20 to 24 Minutes | 11 (15.1%) | 4 (8.0%) |
| 25 to 29 Minutes | 1 (1.4%) | 3 (6.0%) |
| 30 to 34 Minutes | 6 (8.2%) | 4 (8.0%) |
| 35 to 39 Minutes | 0 (0.0%) | 0 (0.0%) |
| 40 to 44 Minutes | 0 (0.0%) | 2 (4.0%) |
| 45 to 59 Minutes | 9 (12.3%) | 13 (26.0%) |
| 60 to 89 Minutes | 4 (5.5%) | 0 (0.0%) |
| 90 or more Minutes | 4 (5.5%) | 0 (0.0%) |
Time of Departure to Work by Sex in Fifty Lakes
The most frequent times of departure to work in Fifty Lakes are 4:00 PM to 11:59 PM (11, 15.1%) for males and 7:00 AM to 7:29 AM (15, 30.0%) for females.
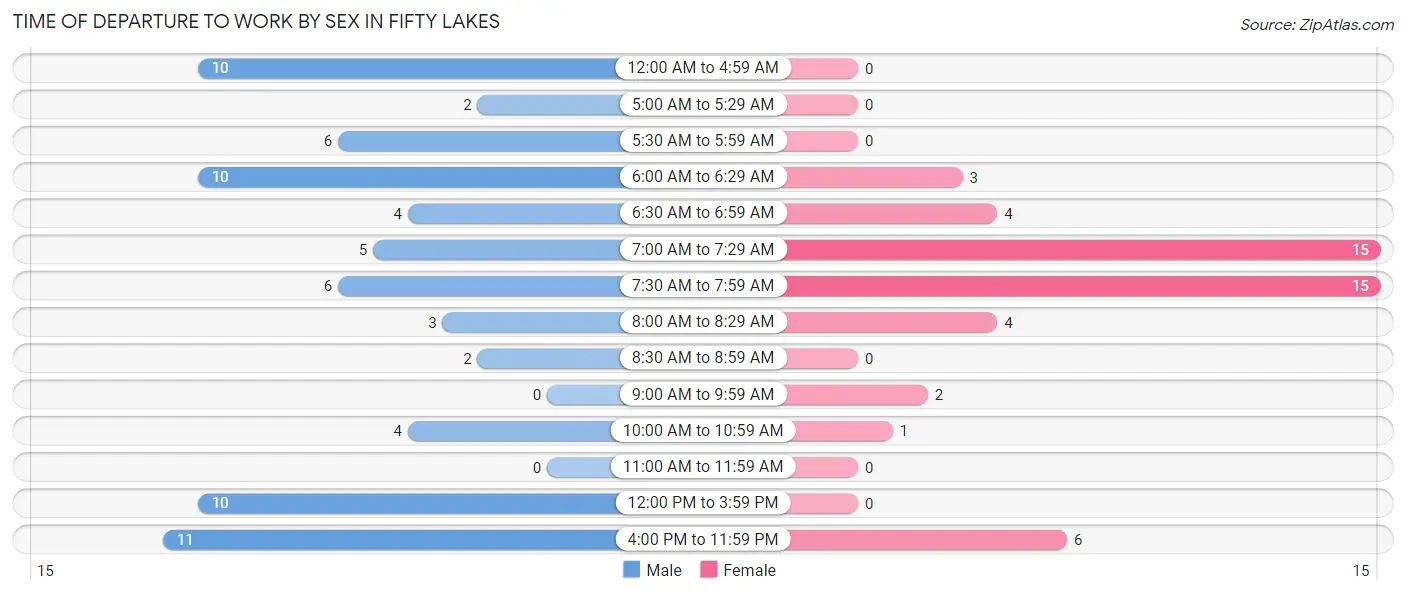
| Time of Departure | Male | Female |
| 12:00 AM to 4:59 AM | 10 (13.7%) | 0 (0.0%) |
| 5:00 AM to 5:29 AM | 2 (2.7%) | 0 (0.0%) |
| 5:30 AM to 5:59 AM | 6 (8.2%) | 0 (0.0%) |
| 6:00 AM to 6:29 AM | 10 (13.7%) | 3 (6.0%) |
| 6:30 AM to 6:59 AM | 4 (5.5%) | 4 (8.0%) |
| 7:00 AM to 7:29 AM | 5 (6.9%) | 15 (30.0%) |
| 7:30 AM to 7:59 AM | 6 (8.2%) | 15 (30.0%) |
| 8:00 AM to 8:29 AM | 3 (4.1%) | 4 (8.0%) |
| 8:30 AM to 8:59 AM | 2 (2.7%) | 0 (0.0%) |
| 9:00 AM to 9:59 AM | 0 (0.0%) | 2 (4.0%) |
| 10:00 AM to 10:59 AM | 4 (5.5%) | 1 (2.0%) |
| 11:00 AM to 11:59 AM | 0 (0.0%) | 0 (0.0%) |
| 12:00 PM to 3:59 PM | 10 (13.7%) | 0 (0.0%) |
| 4:00 PM to 11:59 PM | 11 (15.1%) | 6 (12.0%) |
| Total | 73 (100.0%) | 50 (100.0%) |
Housing Occupancy in Fifty Lakes
Occupancy by Ownership in Fifty Lakes
Of the total 219 dwellings in Fifty Lakes, owner-occupied units account for 207 (94.5%), while renter-occupied units make up 12 (5.5%).
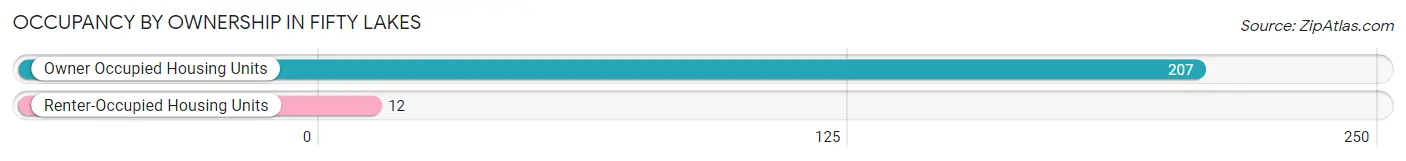
| Occupancy | # Housing Units | % Housing Units |
| Owner Occupied Housing Units | 207 | 94.5% |
| Renter-Occupied Housing Units | 12 | 5.5% |
| Total Occupied Housing Units | 219 | 100.0% |
Occupancy by Household Size in Fifty Lakes
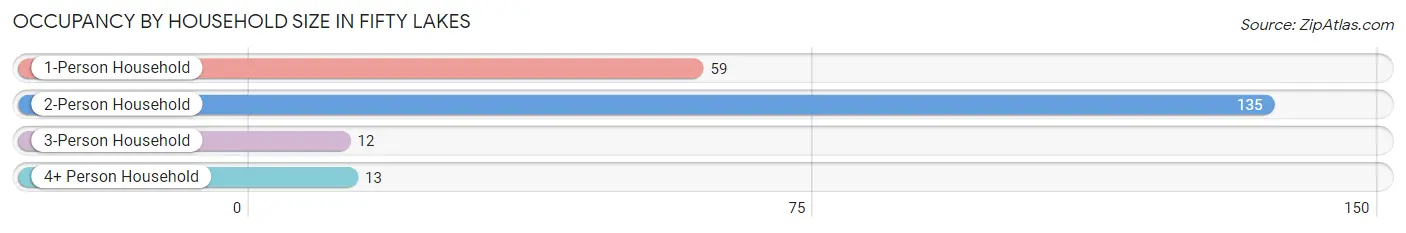
| Household Size | # Housing Units | % Housing Units |
| 1-Person Household | 59 | 26.9% |
| 2-Person Household | 135 | 61.6% |
| 3-Person Household | 12 | 5.5% |
| 4+ Person Household | 13 | 5.9% |
| Total Housing Units | 219 | 100.0% |
Occupancy by Ownership by Household Size in Fifty Lakes
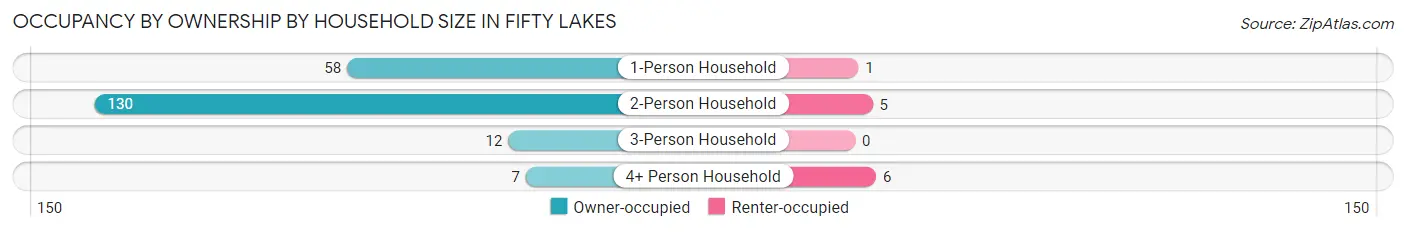
| Household Size | Owner-occupied | Renter-occupied |
| 1-Person Household | 58 (98.3%) | 1 (1.7%) |
| 2-Person Household | 130 (96.3%) | 5 (3.7%) |
| 3-Person Household | 12 (100.0%) | 0 (0.0%) |
| 4+ Person Household | 7 (53.8%) | 6 (46.2%) |
| Total Housing Units | 207 (94.5%) | 12 (5.5%) |
Occupancy by Educational Attainment in Fifty Lakes
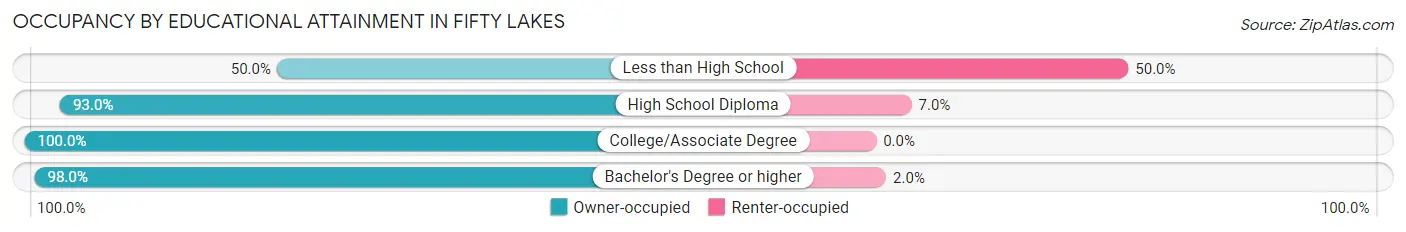
| Household Size | Owner-occupied | Renter-occupied |
| Less than High School | 6 (50.0%) | 6 (50.0%) |
| High School Diploma | 53 (93.0%) | 4 (7.0%) |
| College/Associate Degree | 49 (100.0%) | 0 (0.0%) |
| Bachelor's Degree or higher | 99 (98.0%) | 2 (2.0%) |
Occupancy by Age of Householder in Fifty Lakes
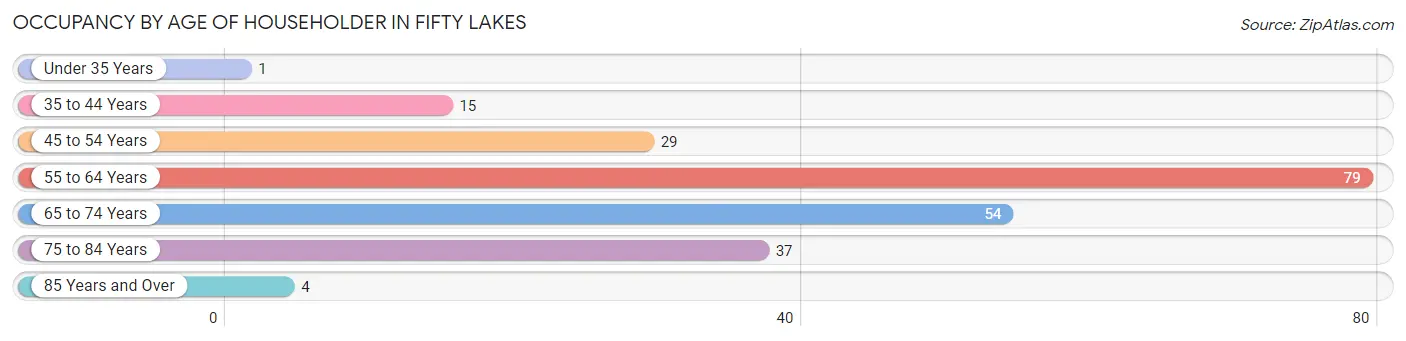
| Age Bracket | # Households | % Households |
| Under 35 Years | 1 | 0.5% |
| 35 to 44 Years | 15 | 6.9% |
| 45 to 54 Years | 29 | 13.2% |
| 55 to 64 Years | 79 | 36.1% |
| 65 to 74 Years | 54 | 24.7% |
| 75 to 84 Years | 37 | 16.9% |
| 85 Years and Over | 4 | 1.8% |
| Total | 219 | 100.0% |
Housing Finances in Fifty Lakes
Median Income by Occupancy in Fifty Lakes
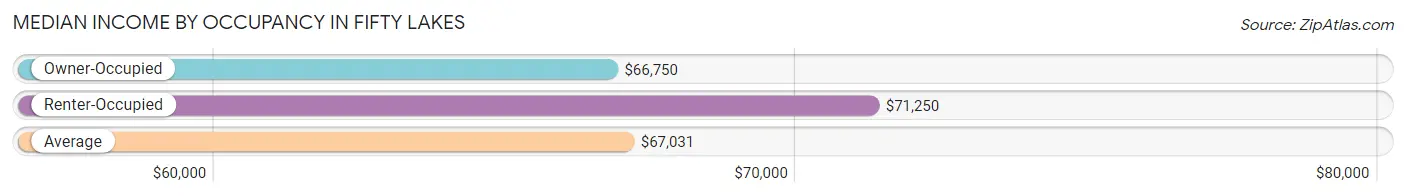
| Occupancy Type | # Households | Median Income |
| Owner-Occupied | 207 (94.5%) | $66,750 |
| Renter-Occupied | 12 (5.5%) | $71,250 |
| Average | 219 (100.0%) | $67,031 |
Occupancy by Householder Income Bracket in Fifty Lakes
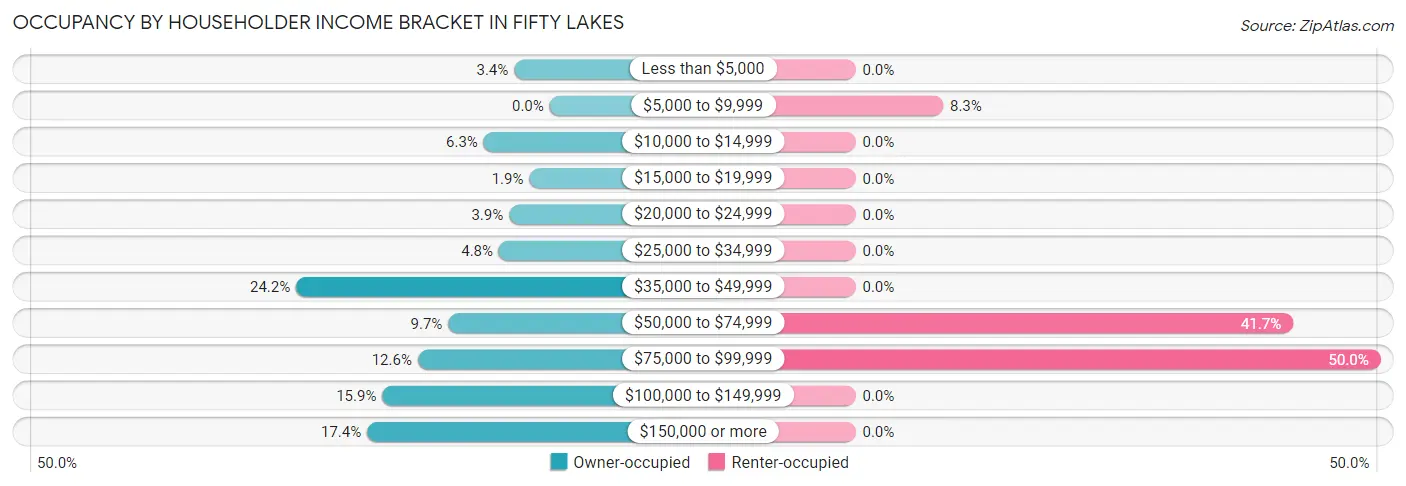
| Income Bracket | Owner-occupied | Renter-occupied |
| Less than $5,000 | 7 (3.4%) | 0 (0.0%) |
| $5,000 to $9,999 | 0 (0.0%) | 1 (8.3%) |
| $10,000 to $14,999 | 13 (6.3%) | 0 (0.0%) |
| $15,000 to $19,999 | 4 (1.9%) | 0 (0.0%) |
| $20,000 to $24,999 | 8 (3.9%) | 0 (0.0%) |
| $25,000 to $34,999 | 10 (4.8%) | 0 (0.0%) |
| $35,000 to $49,999 | 50 (24.1%) | 0 (0.0%) |
| $50,000 to $74,999 | 20 (9.7%) | 5 (41.7%) |
| $75,000 to $99,999 | 26 (12.6%) | 6 (50.0%) |
| $100,000 to $149,999 | 33 (15.9%) | 0 (0.0%) |
| $150,000 or more | 36 (17.4%) | 0 (0.0%) |
| Total | 207 (100.0%) | 12 (100.0%) |
Monthly Housing Cost Tiers in Fifty Lakes
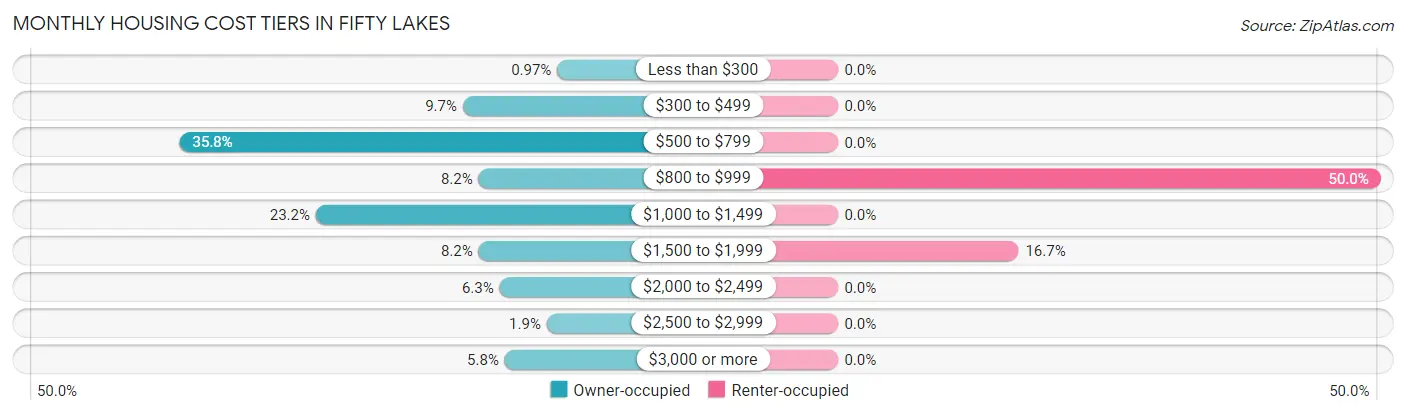
| Monthly Cost | Owner-occupied | Renter-occupied |
| Less than $300 | 2 (1.0%) | 0 (0.0%) |
| $300 to $499 | 20 (9.7%) | 0 (0.0%) |
| $500 to $799 | 74 (35.7%) | 0 (0.0%) |
| $800 to $999 | 17 (8.2%) | 6 (50.0%) |
| $1,000 to $1,499 | 48 (23.2%) | 0 (0.0%) |
| $1,500 to $1,999 | 17 (8.2%) | 2 (16.7%) |
| $2,000 to $2,499 | 13 (6.3%) | 0 (0.0%) |
| $2,500 to $2,999 | 4 (1.9%) | 0 (0.0%) |
| $3,000 or more | 12 (5.8%) | 0 (0.0%) |
| Total | 207 (100.0%) | 12 (100.0%) |
Physical Housing Characteristics in Fifty Lakes
Housing Structures in Fifty Lakes
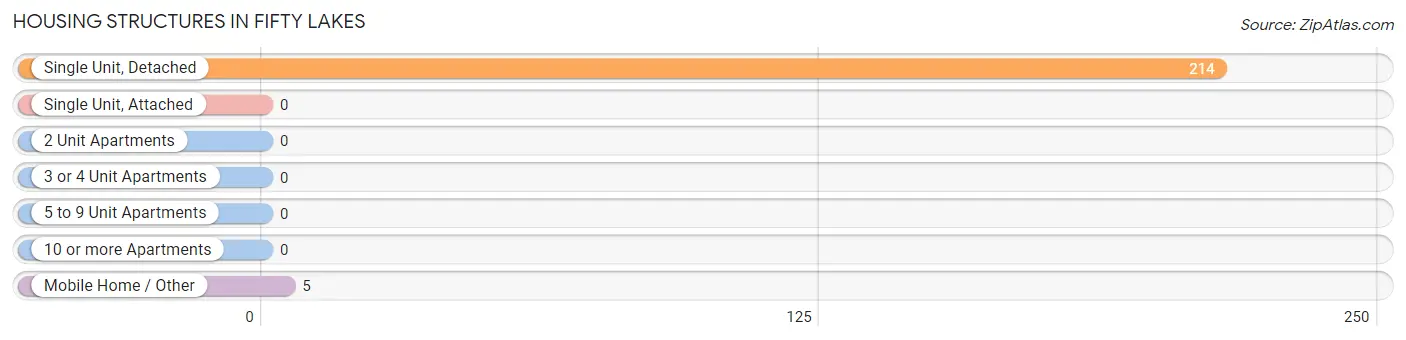
| Structure Type | # Housing Units | % Housing Units |
| Single Unit, Detached | 214 | 97.7% |
| Single Unit, Attached | 0 | 0.0% |
| 2 Unit Apartments | 0 | 0.0% |
| 3 or 4 Unit Apartments | 0 | 0.0% |
| 5 to 9 Unit Apartments | 0 | 0.0% |
| 10 or more Apartments | 0 | 0.0% |
| Mobile Home / Other | 5 | 2.3% |
| Total | 219 | 100.0% |
Housing Structures by Occupancy in Fifty Lakes
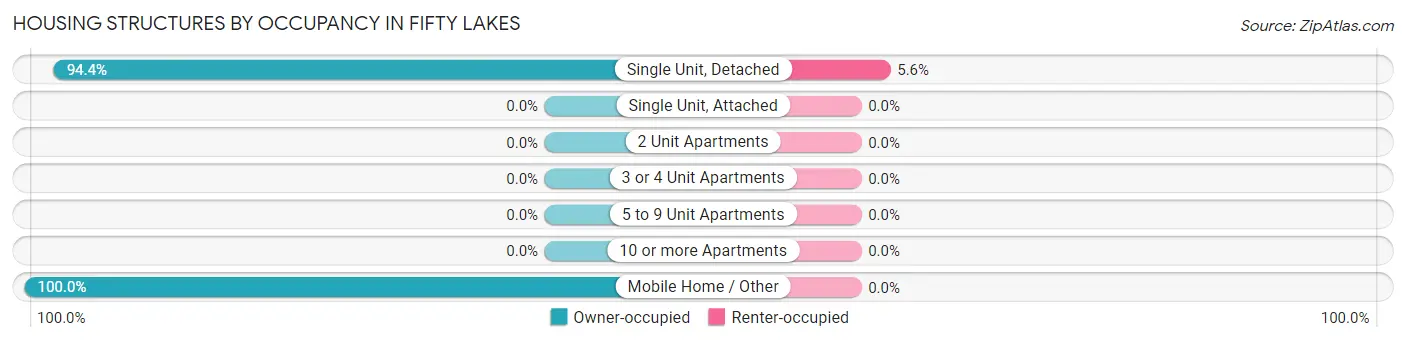
| Structure Type | Owner-occupied | Renter-occupied |
| Single Unit, Detached | 202 (94.4%) | 12 (5.6%) |
| Single Unit, Attached | 0 (0.0%) | 0 (0.0%) |
| 2 Unit Apartments | 0 (0.0%) | 0 (0.0%) |
| 3 or 4 Unit Apartments | 0 (0.0%) | 0 (0.0%) |
| 5 to 9 Unit Apartments | 0 (0.0%) | 0 (0.0%) |
| 10 or more Apartments | 0 (0.0%) | 0 (0.0%) |
| Mobile Home / Other | 5 (100.0%) | 0 (0.0%) |
| Total | 207 (94.5%) | 12 (5.5%) |
Housing Structures by Number of Rooms in Fifty Lakes
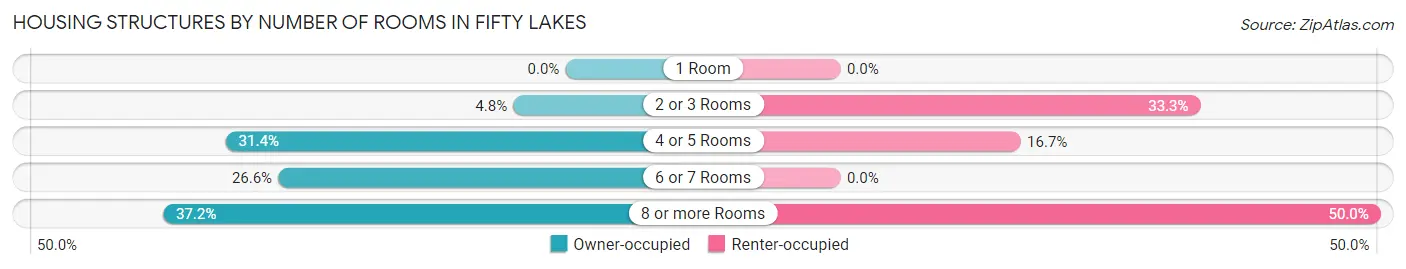
| Number of Rooms | Owner-occupied | Renter-occupied |
| 1 Room | 0 (0.0%) | 0 (0.0%) |
| 2 or 3 Rooms | 10 (4.8%) | 4 (33.3%) |
| 4 or 5 Rooms | 65 (31.4%) | 2 (16.7%) |
| 6 or 7 Rooms | 55 (26.6%) | 0 (0.0%) |
| 8 or more Rooms | 77 (37.2%) | 6 (50.0%) |
| Total | 207 (100.0%) | 12 (100.0%) |
Housing Structure by Heating Type in Fifty Lakes
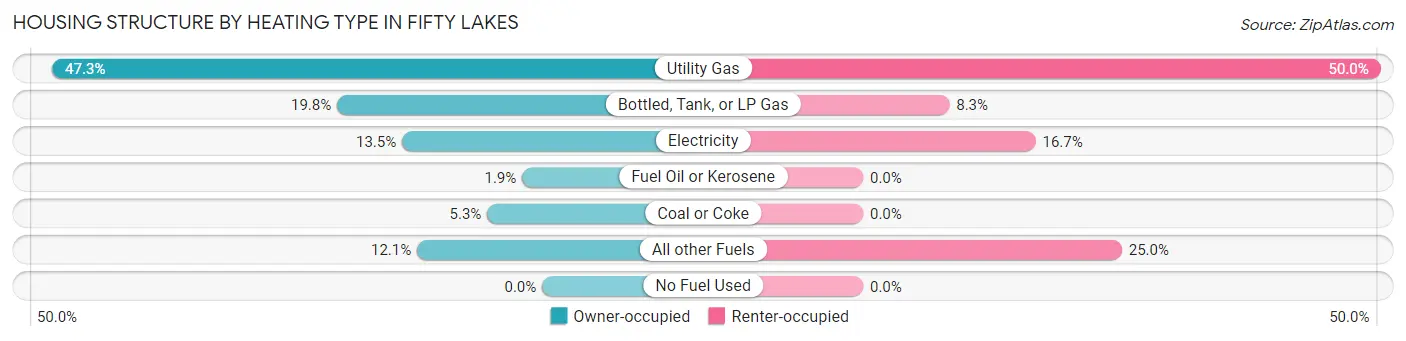
| Heating Type | Owner-occupied | Renter-occupied |
| Utility Gas | 98 (47.3%) | 6 (50.0%) |
| Bottled, Tank, or LP Gas | 41 (19.8%) | 1 (8.3%) |
| Electricity | 28 (13.5%) | 2 (16.7%) |
| Fuel Oil or Kerosene | 4 (1.9%) | 0 (0.0%) |
| Coal or Coke | 11 (5.3%) | 0 (0.0%) |
| All other Fuels | 25 (12.1%) | 3 (25.0%) |
| No Fuel Used | 0 (0.0%) | 0 (0.0%) |
| Total | 207 (100.0%) | 12 (100.0%) |
Household Vehicle Usage in Fifty Lakes
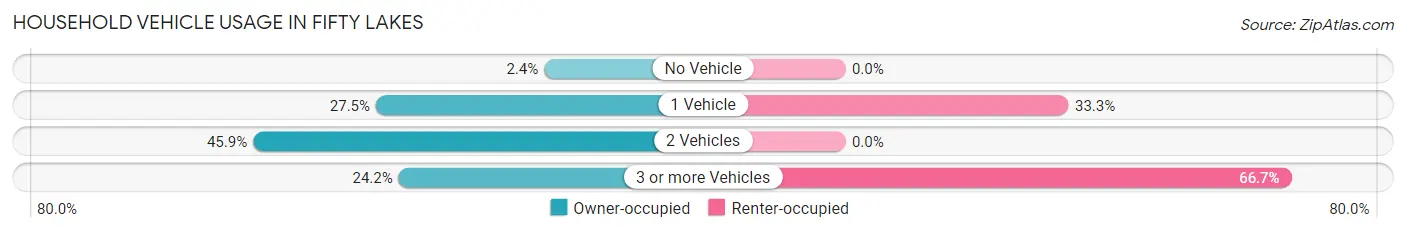
| Vehicles per Household | Owner-occupied | Renter-occupied |
| No Vehicle | 5 (2.4%) | 0 (0.0%) |
| 1 Vehicle | 57 (27.5%) | 4 (33.3%) |
| 2 Vehicles | 95 (45.9%) | 0 (0.0%) |
| 3 or more Vehicles | 50 (24.1%) | 8 (66.7%) |
| Total | 207 (100.0%) | 12 (100.0%) |
Real Estate & Mortgages in Fifty Lakes
Real Estate and Mortgage Overview in Fifty Lakes
| Characteristic | Without Mortgage | With Mortgage |
| Housing Units | 111 | 96 |
| Median Property Value | $340,600 | $406,500 |
| Median Household Income | $47,813 | $20 |
| Monthly Housing Costs | $593 | $12 |
| Real Estate Taxes | $2,324 | $1 |
Property Value by Mortgage Status in Fifty Lakes
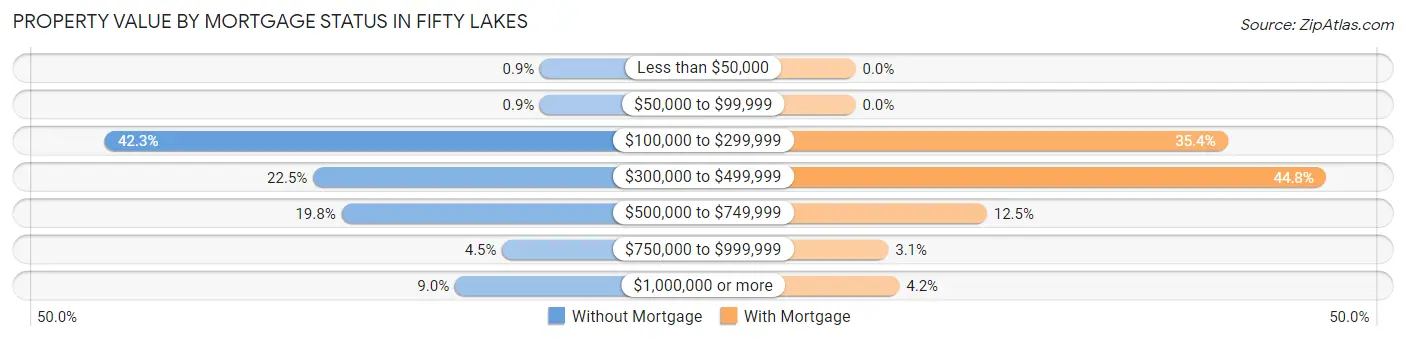
| Property Value | Without Mortgage | With Mortgage |
| Less than $50,000 | 1 (0.9%) | 0 (0.0%) |
| $50,000 to $99,999 | 1 (0.9%) | 0 (0.0%) |
| $100,000 to $299,999 | 47 (42.3%) | 34 (35.4%) |
| $300,000 to $499,999 | 25 (22.5%) | 43 (44.8%) |
| $500,000 to $749,999 | 22 (19.8%) | 12 (12.5%) |
| $750,000 to $999,999 | 5 (4.5%) | 3 (3.1%) |
| $1,000,000 or more | 10 (9.0%) | 4 (4.2%) |
| Total | 111 (100.0%) | 96 (100.0%) |
Household Income by Mortgage Status in Fifty Lakes
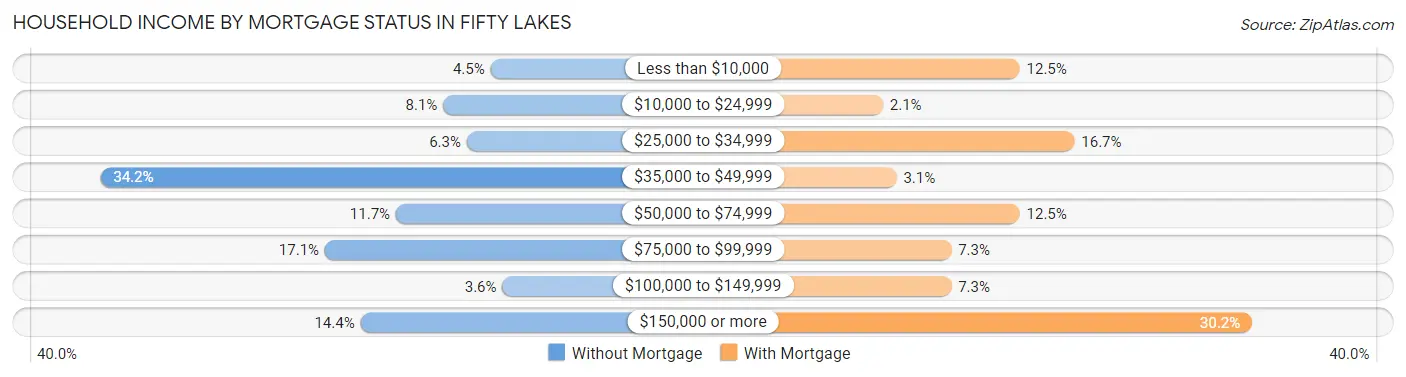
| Household Income | Without Mortgage | With Mortgage |
| Less than $10,000 | 5 (4.5%) | 12 (12.5%) |
| $10,000 to $24,999 | 9 (8.1%) | 2 (2.1%) |
| $25,000 to $34,999 | 7 (6.3%) | 16 (16.7%) |
| $35,000 to $49,999 | 38 (34.2%) | 3 (3.1%) |
| $50,000 to $74,999 | 13 (11.7%) | 12 (12.5%) |
| $75,000 to $99,999 | 19 (17.1%) | 7 (7.3%) |
| $100,000 to $149,999 | 4 (3.6%) | 7 (7.3%) |
| $150,000 or more | 16 (14.4%) | 29 (30.2%) |
| Total | 111 (100.0%) | 96 (100.0%) |
Property Value to Household Income Ratio in Fifty Lakes
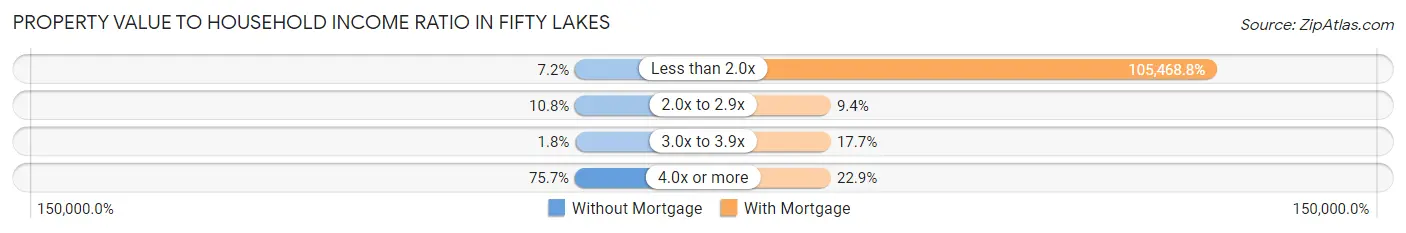
| Value-to-Income Ratio | Without Mortgage | With Mortgage |
| Less than 2.0x | 8 (7.2%) | 101,250 (105,468.8%) |
| 2.0x to 2.9x | 12 (10.8%) | 9 (9.4%) |
| 3.0x to 3.9x | 2 (1.8%) | 17 (17.7%) |
| 4.0x or more | 84 (75.7%) | 22 (22.9%) |
| Total | 111 (100.0%) | 96 (100.0%) |
Real Estate Taxes by Mortgage Status in Fifty Lakes
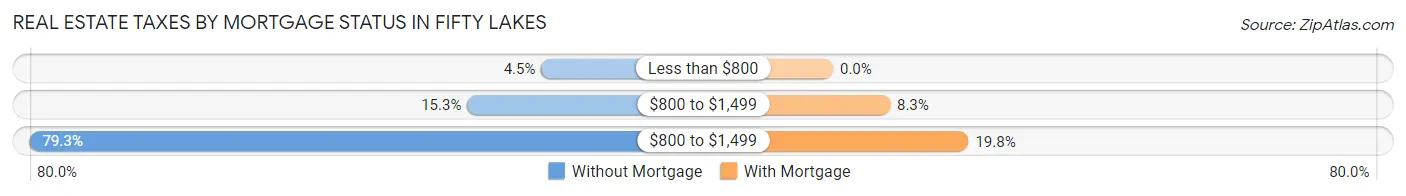
| Property Taxes | Without Mortgage | With Mortgage |
| Less than $800 | 5 (4.5%) | 0 (0.0%) |
| $800 to $1,499 | 17 (15.3%) | 8 (8.3%) |
| $800 to $1,499 | 88 (79.3%) | 19 (19.8%) |
| Total | 111 (100.0%) | 96 (100.0%) |
Health & Disability in Fifty Lakes
Health Insurance Coverage by Age in Fifty Lakes
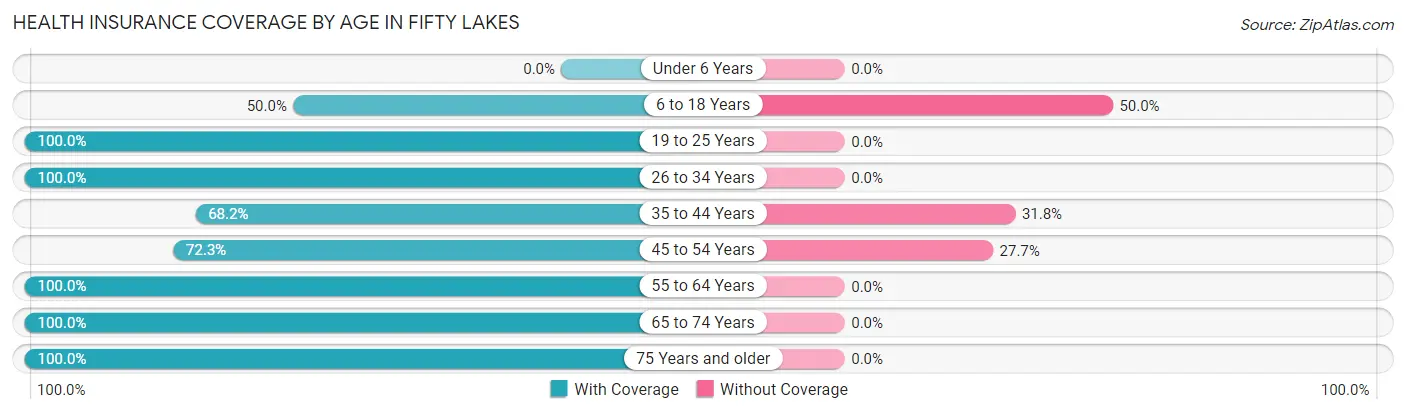
| Age Bracket | With Coverage | Without Coverage |
| Under 6 Years | 0 (0.0%) | 0 (0.0%) |
| 6 to 18 Years | 13 (50.0%) | 13 (50.0%) |
| 19 to 25 Years | 27 (100.0%) | 0 (0.0%) |
| 26 to 34 Years | 8 (100.0%) | 0 (0.0%) |
| 35 to 44 Years | 15 (68.2%) | 7 (31.8%) |
| 45 to 54 Years | 34 (72.3%) | 13 (27.7%) |
| 55 to 64 Years | 118 (100.0%) | 0 (0.0%) |
| 65 to 74 Years | 110 (100.0%) | 0 (0.0%) |
| 75 Years and older | 73 (100.0%) | 0 (0.0%) |
| Total | 398 (92.3%) | 33 (7.7%) |
Health Insurance Coverage by Citizenship Status in Fifty Lakes
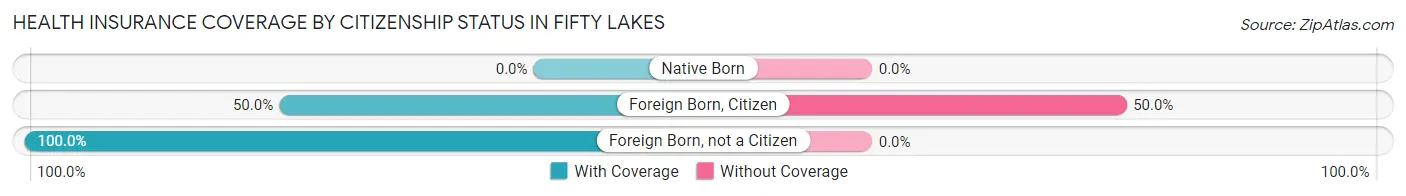
| Citizenship Status | With Coverage | Without Coverage |
| Native Born | 0 (0.0%) | 0 (0.0%) |
| Foreign Born, Citizen | 13 (50.0%) | 13 (50.0%) |
| Foreign Born, not a Citizen | 27 (100.0%) | 0 (0.0%) |
Health Insurance Coverage by Household Income in Fifty Lakes
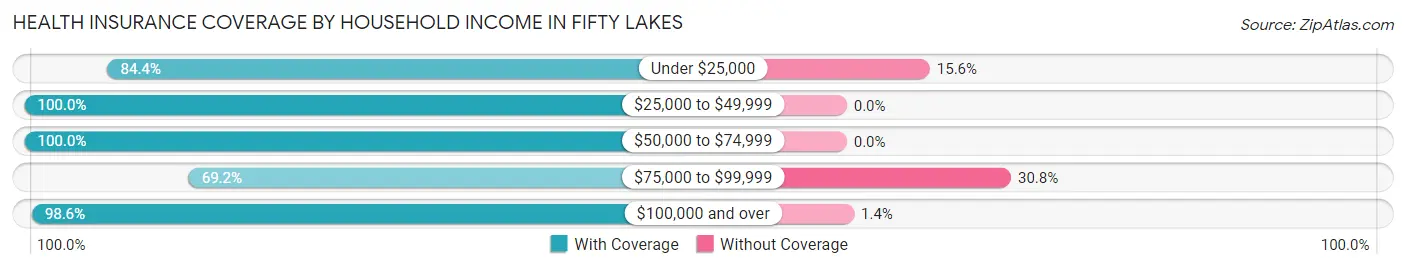
| Household Income | With Coverage | Without Coverage |
| Under $25,000 | 38 (84.4%) | 7 (15.6%) |
| $25,000 to $49,999 | 114 (100.0%) | 0 (0.0%) |
| $50,000 to $74,999 | 48 (100.0%) | 0 (0.0%) |
| $75,000 to $99,999 | 54 (69.2%) | 24 (30.8%) |
| $100,000 and over | 144 (98.6%) | 2 (1.4%) |
Public vs Private Health Insurance Coverage by Age in Fifty Lakes
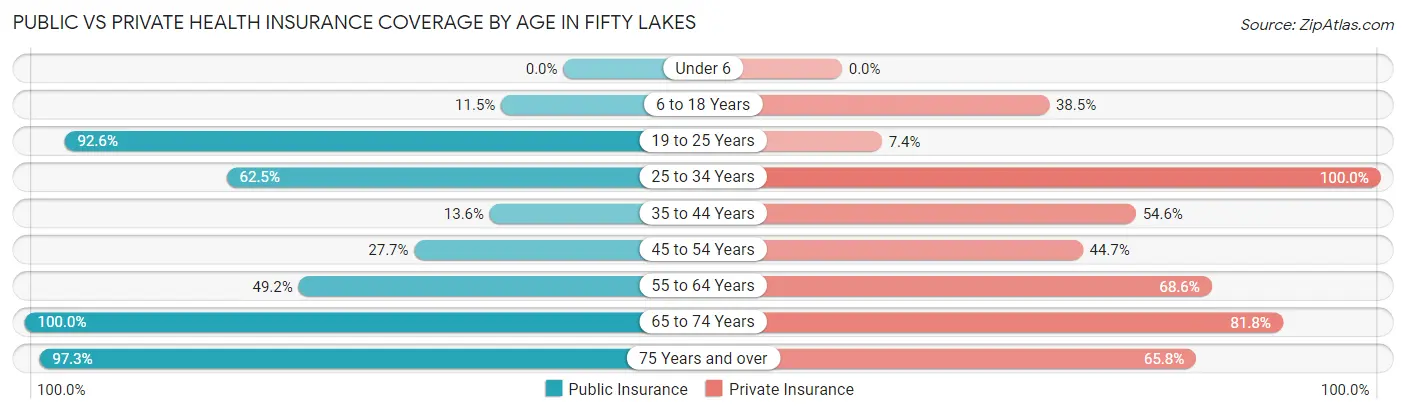
| Age Bracket | Public Insurance | Private Insurance |
| Under 6 | 0 (0.0%) | 0 (0.0%) |
| 6 to 18 Years | 3 (11.5%) | 10 (38.5%) |
| 19 to 25 Years | 25 (92.6%) | 2 (7.4%) |
| 25 to 34 Years | 5 (62.5%) | 8 (100.0%) |
| 35 to 44 Years | 3 (13.6%) | 12 (54.5%) |
| 45 to 54 Years | 13 (27.7%) | 21 (44.7%) |
| 55 to 64 Years | 58 (49.1%) | 81 (68.6%) |
| 65 to 74 Years | 110 (100.0%) | 90 (81.8%) |
| 75 Years and over | 71 (97.3%) | 48 (65.7%) |
| Total | 288 (66.8%) | 272 (63.1%) |
Disability Status by Sex by Age in Fifty Lakes
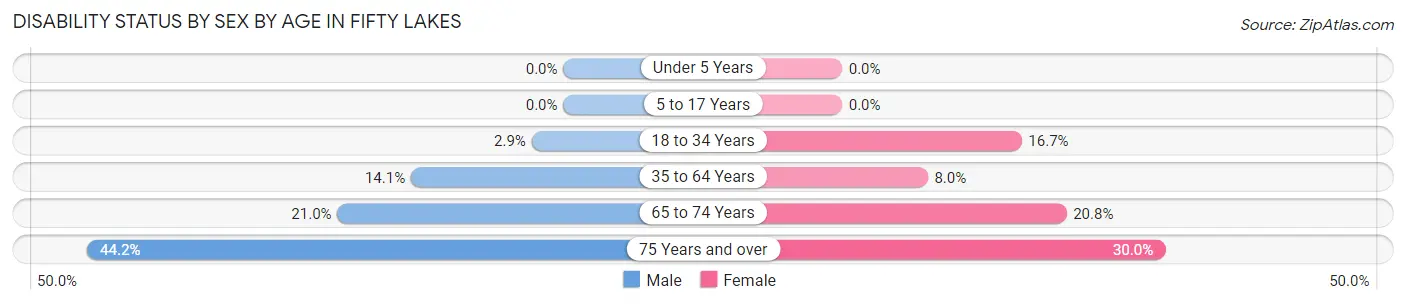
| Age Bracket | Male | Female |
| Under 5 Years | 0 (0.0%) | 0 (0.0%) |
| 5 to 17 Years | 0 (0.0%) | 0 (0.0%) |
| 18 to 34 Years | 1 (2.9%) | 1 (16.7%) |
| 35 to 64 Years | 14 (14.1%) | 7 (8.0%) |
| 65 to 74 Years | 13 (21.0%) | 10 (20.8%) |
| 75 Years and over | 19 (44.2%) | 9 (30.0%) |
Disability Class by Sex by Age in Fifty Lakes
Disability Class: Hearing Difficulty
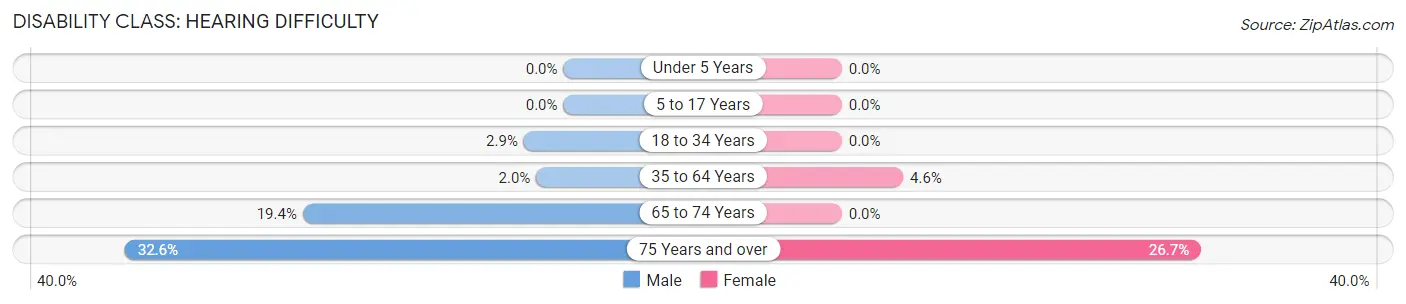
| Age Bracket | Male | Female |
| Under 5 Years | 0 (0.0%) | 0 (0.0%) |
| 5 to 17 Years | 0 (0.0%) | 0 (0.0%) |
| 18 to 34 Years | 1 (2.9%) | 0 (0.0%) |
| 35 to 64 Years | 2 (2.0%) | 4 (4.5%) |
| 65 to 74 Years | 12 (19.4%) | 0 (0.0%) |
| 75 Years and over | 14 (32.6%) | 8 (26.7%) |
Disability Class: Vision Difficulty
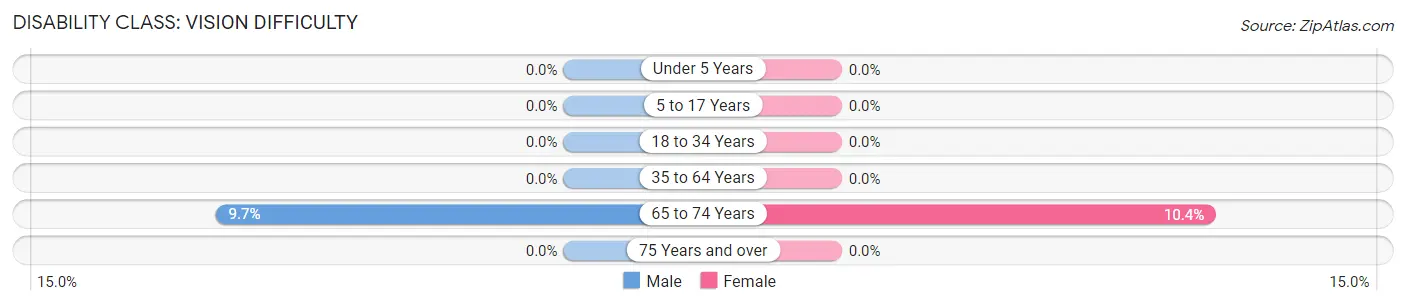
| Age Bracket | Male | Female |
| Under 5 Years | 0 (0.0%) | 0 (0.0%) |
| 5 to 17 Years | 0 (0.0%) | 0 (0.0%) |
| 18 to 34 Years | 0 (0.0%) | 0 (0.0%) |
| 35 to 64 Years | 0 (0.0%) | 0 (0.0%) |
| 65 to 74 Years | 6 (9.7%) | 5 (10.4%) |
| 75 Years and over | 0 (0.0%) | 0 (0.0%) |
Disability Class: Cognitive Difficulty
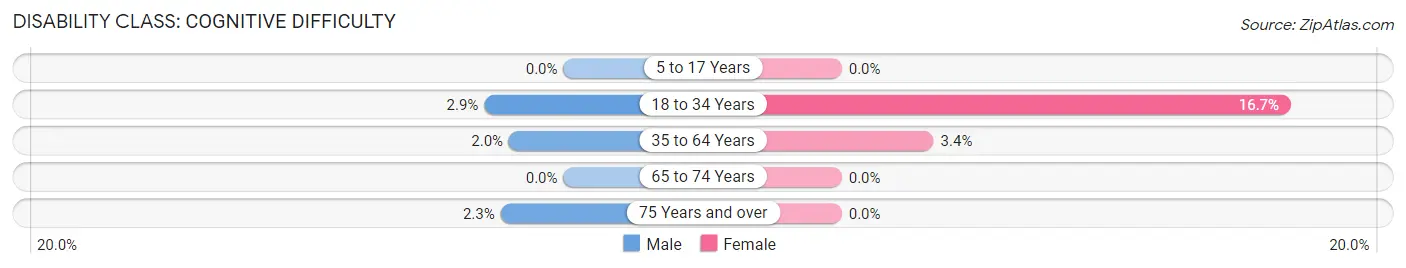
| Age Bracket | Male | Female |
| 5 to 17 Years | 0 (0.0%) | 0 (0.0%) |
| 18 to 34 Years | 1 (2.9%) | 1 (16.7%) |
| 35 to 64 Years | 2 (2.0%) | 3 (3.4%) |
| 65 to 74 Years | 0 (0.0%) | 0 (0.0%) |
| 75 Years and over | 1 (2.3%) | 0 (0.0%) |
Disability Class: Ambulatory Difficulty
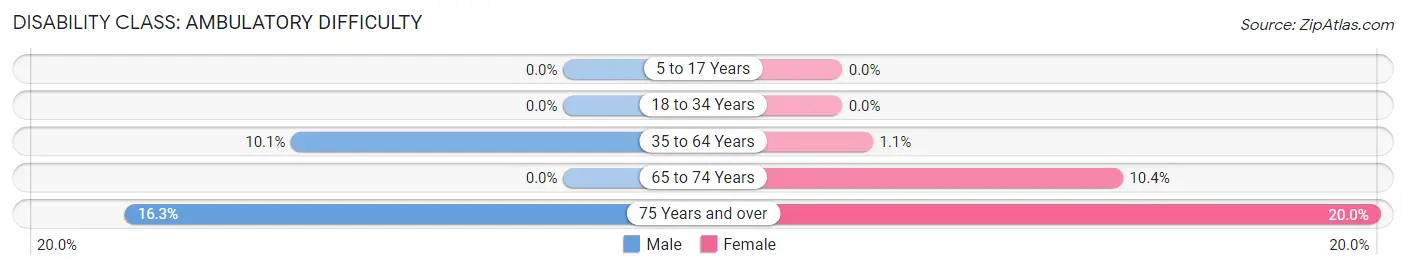
| Age Bracket | Male | Female |
| 5 to 17 Years | 0 (0.0%) | 0 (0.0%) |
| 18 to 34 Years | 0 (0.0%) | 0 (0.0%) |
| 35 to 64 Years | 10 (10.1%) | 1 (1.1%) |
| 65 to 74 Years | 0 (0.0%) | 5 (10.4%) |
| 75 Years and over | 7 (16.3%) | 6 (20.0%) |
Disability Class: Self-Care Difficulty
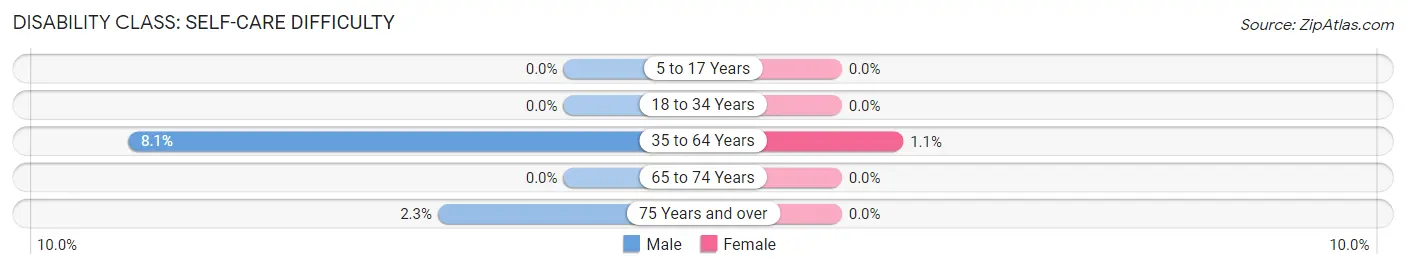
| Age Bracket | Male | Female |
| 5 to 17 Years | 0 (0.0%) | 0 (0.0%) |
| 18 to 34 Years | 0 (0.0%) | 0 (0.0%) |
| 35 to 64 Years | 8 (8.1%) | 1 (1.1%) |
| 65 to 74 Years | 0 (0.0%) | 0 (0.0%) |
| 75 Years and over | 1 (2.3%) | 0 (0.0%) |
Technology Access in Fifty Lakes
Computing Device Access in Fifty Lakes
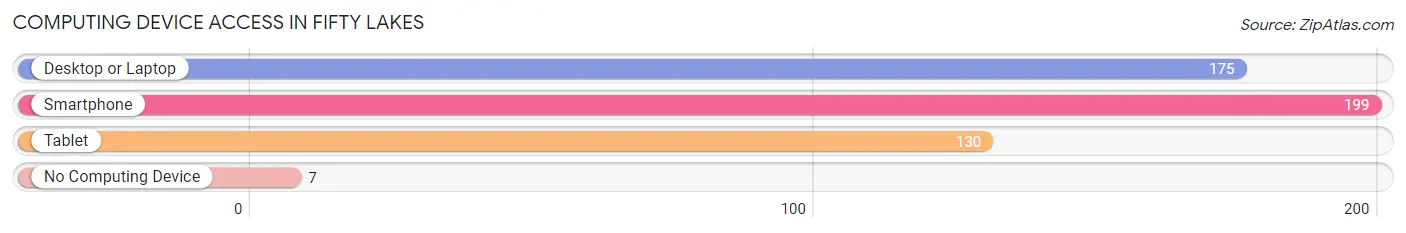
| Device Type | # Households | % Households |
| Desktop or Laptop | 175 | 79.9% |
| Smartphone | 199 | 90.9% |
| Tablet | 130 | 59.4% |
| No Computing Device | 7 | 3.2% |
| Total | 219 | 100.0% |
Internet Access in Fifty Lakes
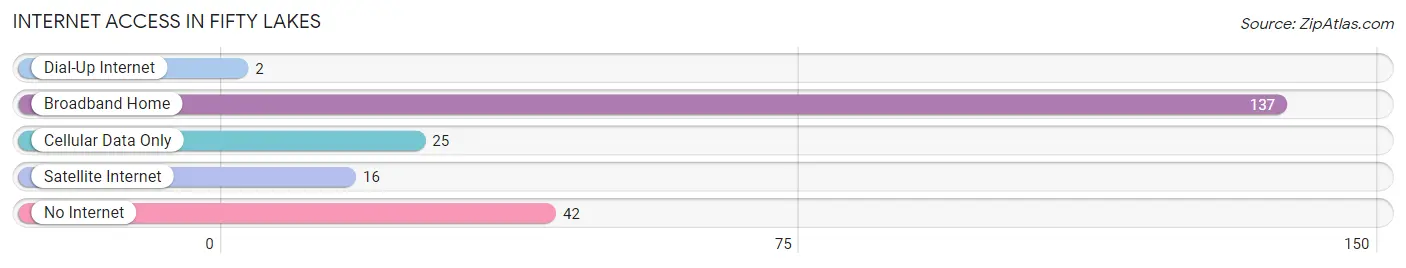
| Internet Type | # Households | % Households |
| Dial-Up Internet | 2 | 0.9% |
| Broadband Home | 137 | 62.6% |
| Cellular Data Only | 25 | 11.4% |
| Satellite Internet | 16 | 7.3% |
| No Internet | 42 | 19.2% |
| Total | 219 | 100.0% |
Fifty Lakes Summary
Fifty Lakes, Minnesota is a small town located in Crow Wing County, in the north-central part of the state. It is situated on the south shore of Whitefish Lake, and is part of the Brainerd Lakes Area. The town was founded in 1887 and was named after the fifty lakes that are located within a five-mile radius of the town.
Geography
Fifty Lakes is located in the heart of Minnesota's lake country. It is situated on the south shore of Whitefish Lake, which is part of the Whitefish Chain of Lakes. The town is surrounded by numerous other lakes, including Big Trout Lake, Little Trout Lake, and Round Lake. The town is located in the northern part of the state, and is part of the Brainerd Lakes Area. The town is located approximately 30 miles north of Brainerd, and is about a two-hour drive from the Twin Cities.
The town is situated on a rolling landscape, with the Whitefish Chain of Lakes to the north and the Mississippi River to the south. The town is located in a heavily wooded area, with numerous pine and hardwood forests. The town is also home to several wildlife areas, including the Whitefish Chain Wildlife Management Area and the Round Lake Wildlife Management Area.
Economy
Fifty Lakes is a small, rural town, and the economy is largely based on tourism and recreation. The town is home to several resorts and campgrounds, which attract visitors from all over the state. The town is also home to several marinas, which provide access to the Whitefish Chain of Lakes. The town is also home to several restaurants, bars, and other businesses that cater to tourists.
The town is also home to several manufacturing and industrial businesses. The town is home to a large paper mill, which is the largest employer in the town. The town is also home to several small businesses, including a lumber mill, a sawmill, and a machine shop.
Demographics
As of the 2010 census, the population of Fifty Lakes was 1,072. The population is largely white, with a small percentage of African Americans, Native Americans, and Asians. The median household income is $41,250, and the median home value is $150,000. The town is largely rural, with a small percentage of the population living in urban areas.
Conclusion
Fifty Lakes, Minnesota is a small town located in the north-central part of the state. It is situated on the south shore of Whitefish Lake, and is part of the Brainerd Lakes Area. The town was founded in 1887 and was named after the fifty lakes that are located within a five-mile radius of the town. The town is largely rural, and the economy is largely based on tourism and recreation. The population of Fifty Lakes is largely white, with a small percentage of African Americans, Native Americans, and Asians. The median household income is $41,250, and the median home value is $150,000.
Common Questions
What is Per Capita Income in Fifty Lakes?
Per Capita income in Fifty Lakes is $42,682.
What is the Median Family Income in Fifty Lakes?
Median Family Income in Fifty Lakes is $79,688.
What is the Median Household income in Fifty Lakes?
Median Household Income in Fifty Lakes is $67,031.
What is Family Income Deficit in Fifty Lakes?
Family Income Deficit in Fifty Lakes is $7,650.
Families that are below poverty line in Fifty Lakes earn $7,650 less on average than the poverty threshold level.
What is Inequality or Gini Index in Fifty Lakes?
Inequality or Gini Index in Fifty Lakes is 0.41.
What is the Total Population of Fifty Lakes?
Total Population of Fifty Lakes is 431.
What is the Total Male Population of Fifty Lakes?
Total Male Population of Fifty Lakes is 254.
What is the Total Female Population of Fifty Lakes?
Total Female Population of Fifty Lakes is 177.
What is the Ratio of Males per 100 Females in Fifty Lakes?
There are 143.50 Males per 100 Females in Fifty Lakes.
What is the Ratio of Females per 100 Males in Fifty Lakes?
There are 69.69 Females per 100 Males in Fifty Lakes.
What is the Median Population Age in Fifty Lakes?
Median Population Age in Fifty Lakes is 63.7 Years.
What is the Average Family Size in Fifty Lakes
Average Family Size in Fifty Lakes is 2.3 People.
What is the Average Household Size in Fifty Lakes
Average Household Size in Fifty Lakes is 2.0 People.
How Large is the Labor Force in Fifty Lakes?
There are 154 People in the Labor Forcein in Fifty Lakes.
What is the Percentage of People in the Labor Force in Fifty Lakes?
36.8% of People are in the Labor Force in Fifty Lakes.
What is the Unemployment Rate in Fifty Lakes?
Unemployment Rate in Fifty Lakes is 3.9%.