Zip Codes with the Highest Percentage of Population Employed in Installation, Maintenance & Repair in Hopkins, MN
RELATED REPORTS & OPTIONS
Installation, Maintenance & Repair
Hopkins
Compare Zip Codes
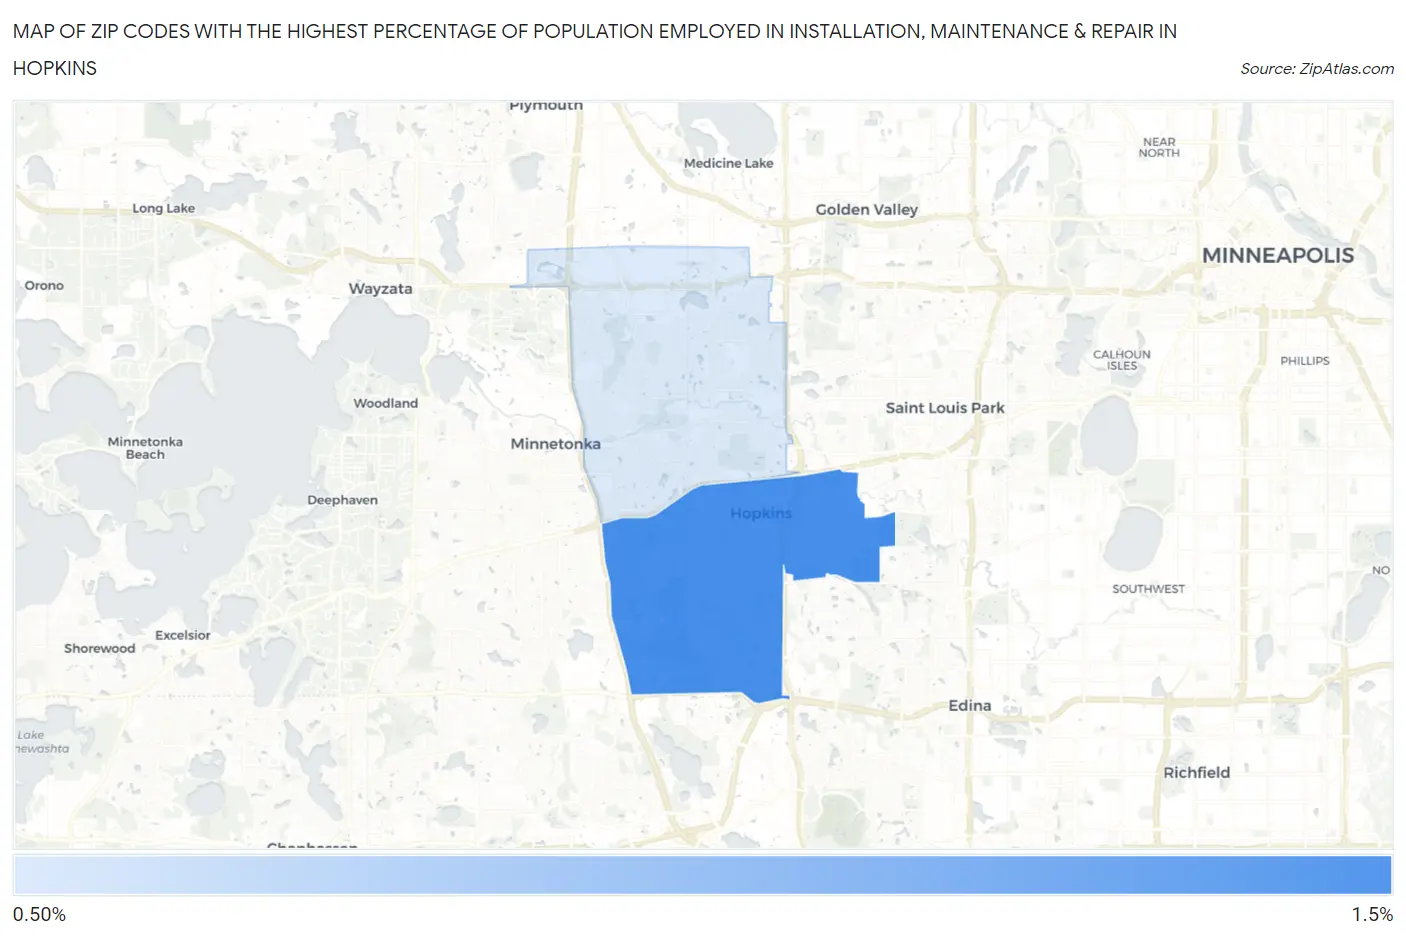
Map of Zip Codes with the Highest Percentage of Population Employed in Installation, Maintenance & Repair in Hopkins
0.84%
1.1%
Zip Codes with the Highest Percentage of Population Employed in Installation, Maintenance & Repair in Hopkins, MN
| Zip Code | % Employed | vs State | vs National | |
| 1. | 55343 | 1.1% | 2.9%(-1.77)#777 | 3.1%(-1.96)#25,587 |
| 2. | 55305 | 0.84% | 2.9%(-2.04)#801 | 3.1%(-2.23)#26,381 |
1
Common Questions
What are the Top Zip Codes with the Highest Percentage of Population Employed in Installation, Maintenance & Repair in Hopkins, MN?
Top Zip Codes with the Highest Percentage of Population Employed in Installation, Maintenance & Repair in Hopkins, MN are:
What zip code has the Highest Percentage of Population Employed in Installation, Maintenance & Repair in Hopkins, MN?
55343 has the Highest Percentage of Population Employed in Installation, Maintenance & Repair in Hopkins, MN with 1.1%.
What is the Percentage of Population Employed in Installation, Maintenance & Repair in Hopkins, MN?
Percentage of Population Employed in Installation, Maintenance & Repair in Hopkins is 0.61%.
What is the Percentage of Population Employed in Installation, Maintenance & Repair in Minnesota?
Percentage of Population Employed in Installation, Maintenance & Repair in Minnesota is 2.9%.
What is the Percentage of Population Employed in Installation, Maintenance & Repair in the United States?
Percentage of Population Employed in Installation, Maintenance & Repair in the United States is 3.1%.