Zip Codes with the Highest Percentage of Population Employed in Installation, Maintenance & Repair in Mankato, MN
RELATED REPORTS & OPTIONS
Installation, Maintenance & Repair
Mankato
Compare Zip Codes
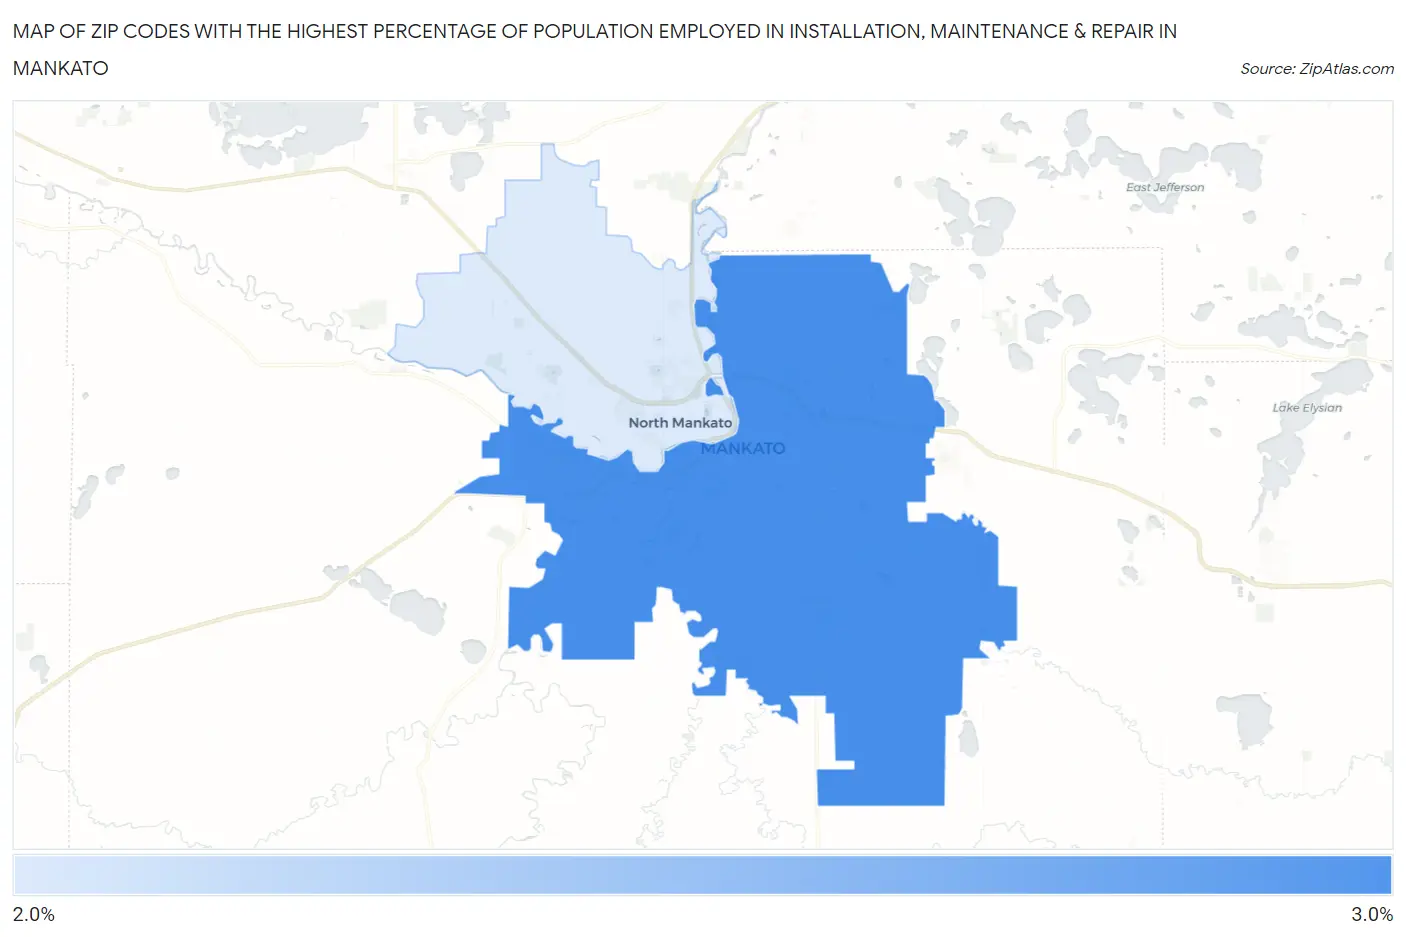
Map of Zip Codes with the Highest Percentage of Population Employed in Installation, Maintenance & Repair in Mankato
2.2%
2.5%
Zip Codes with the Highest Percentage of Population Employed in Installation, Maintenance & Repair in Mankato, MN
| Zip Code | % Employed | vs State | vs National | |
| 1. | 56001 | 2.5% | 2.9%(-0.336)#619 | 3.1%(-0.527)#19,350 |
| 2. | 56003 | 2.2% | 2.9%(-0.675)#663 | 3.1%(-0.867)#21,080 |
1
Common Questions
What are the Top Zip Codes with the Highest Percentage of Population Employed in Installation, Maintenance & Repair in Mankato, MN?
Top Zip Codes with the Highest Percentage of Population Employed in Installation, Maintenance & Repair in Mankato, MN are:
What zip code has the Highest Percentage of Population Employed in Installation, Maintenance & Repair in Mankato, MN?
56001 has the Highest Percentage of Population Employed in Installation, Maintenance & Repair in Mankato, MN with 2.5%.
What is the Percentage of Population Employed in Installation, Maintenance & Repair in Mankato, MN?
Percentage of Population Employed in Installation, Maintenance & Repair in Mankato is 2.3%.
What is the Percentage of Population Employed in Installation, Maintenance & Repair in Minnesota?
Percentage of Population Employed in Installation, Maintenance & Repair in Minnesota is 2.9%.
What is the Percentage of Population Employed in Installation, Maintenance & Repair in the United States?
Percentage of Population Employed in Installation, Maintenance & Repair in the United States is 3.1%.