Twin Lakes CDP Lake County, CO Map & Demographics
Twin Lakes CDP Lake County Overview
$36,782
PER CAPITA INCOME
$46,016
AVG HOUSEHOLD INCOME
52.4%
WAGE / INCOME GAP [ % ]
47.6¢/ $1
WAGE / INCOME GAP [ $ ]
0.47
INEQUALITY / GINI INDEX
348
TOTAL POPULATION
167
MALE POPULATION
181
FEMALE POPULATION
92.27
MALES / 100 FEMALES
108.38
FEMALES / 100 MALES
63.2
MEDIAN AGE
3.2
AVG FAMILY SIZE
2.1
AVG HOUSEHOLD SIZE
182
LABOR FORCE [ PEOPLE ]
52.3%
PERCENT IN LABOR FORCE
Income in Twin Lakes CDP Lake County
Income Overview in Twin Lakes CDP Lake County
| Characteristic | Number | Measure |
| Per Capita Income | 348 | $36,782 |
| Median Family Income | 81 | $0 |
| Mean Family Income | 81 | $97,465 |
| Median Household Income | 169 | $46,016 |
| Mean Household Income | 169 | $64,738 |
| Income Deficit | 81 | $0 |
| Wage / Income Gap (%) | 348 | 52.44% |
| Wage / Income Gap ($) | 348 | 47.56¢ per $1 |
| Gini / Inequality Index | 348 | 0.47 |
Earnings by Sex in Twin Lakes CDP Lake County
Average Earnings in Twin Lakes CDP Lake County are $47,727, $63,074 for men and $30,000 for women, a difference of 52.4%.
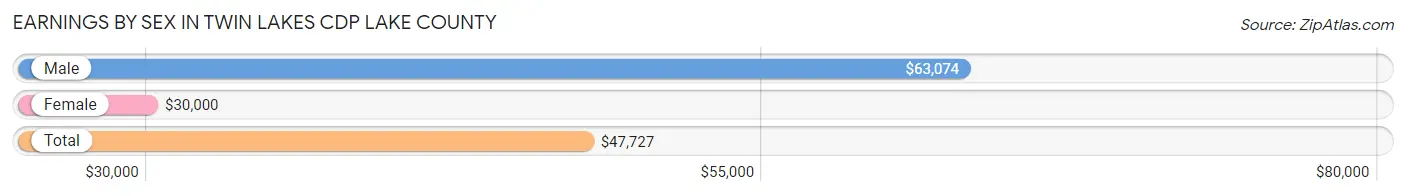
| Sex | Number | Average Earnings |
| Male | 94 (51.6%) | $63,074 |
| Female | 88 (48.3%) | $30,000 |
| Total | 182 (100.0%) | $47,727 |
Earnings by Sex by Income Bracket in Twin Lakes CDP Lake County
The most common earnings brackets in Twin Lakes CDP Lake County are $55,000 to $64,999 for men (61 | 64.9%) and $30,000 to $34,999 for women (44 | 50.0%).
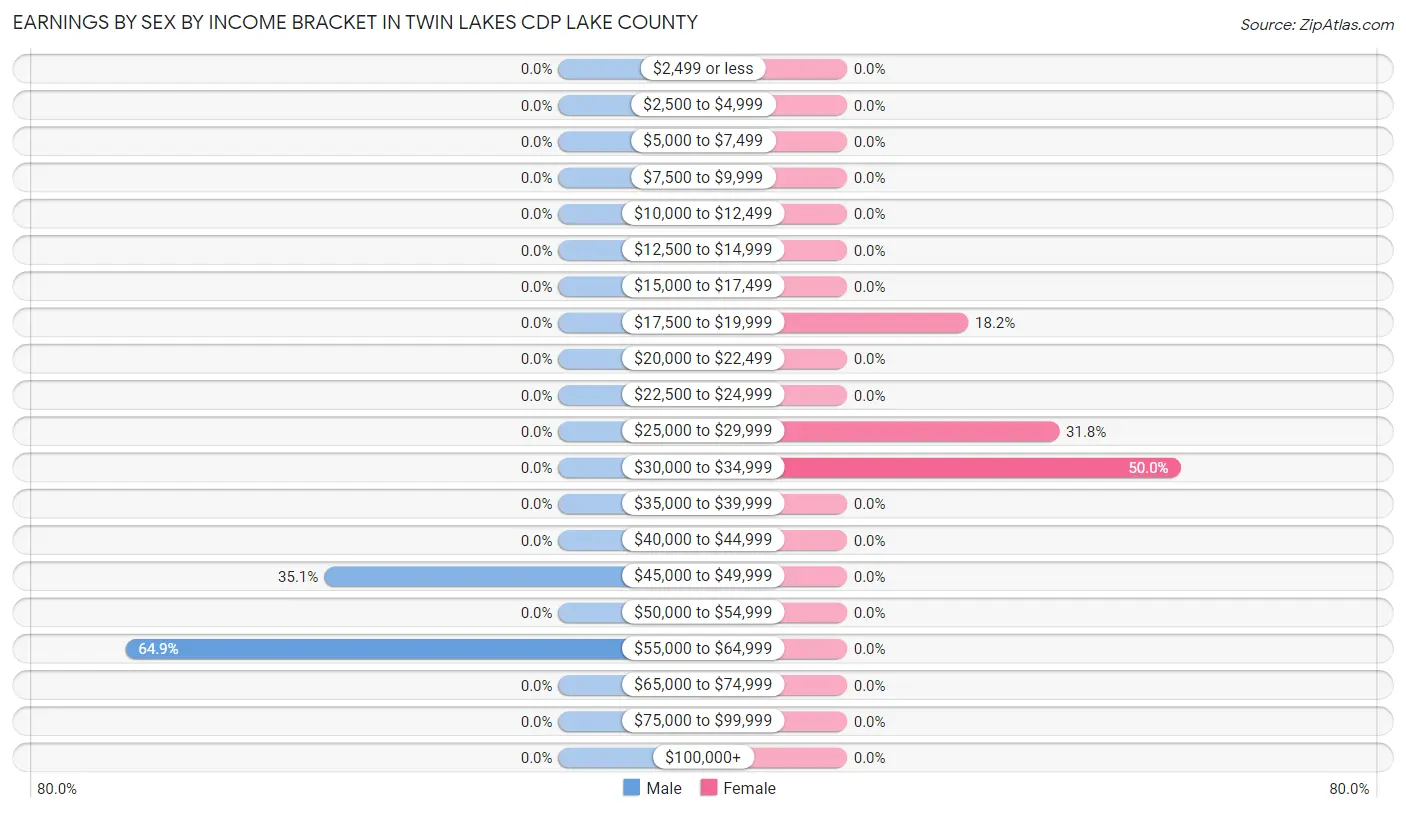
| Income | Male | Female |
| $2,499 or less | 0 (0.0%) | 0 (0.0%) |
| $2,500 to $4,999 | 0 (0.0%) | 0 (0.0%) |
| $5,000 to $7,499 | 0 (0.0%) | 0 (0.0%) |
| $7,500 to $9,999 | 0 (0.0%) | 0 (0.0%) |
| $10,000 to $12,499 | 0 (0.0%) | 0 (0.0%) |
| $12,500 to $14,999 | 0 (0.0%) | 0 (0.0%) |
| $15,000 to $17,499 | 0 (0.0%) | 0 (0.0%) |
| $17,500 to $19,999 | 0 (0.0%) | 16 (18.2%) |
| $20,000 to $22,499 | 0 (0.0%) | 0 (0.0%) |
| $22,500 to $24,999 | 0 (0.0%) | 0 (0.0%) |
| $25,000 to $29,999 | 0 (0.0%) | 28 (31.8%) |
| $30,000 to $34,999 | 0 (0.0%) | 44 (50.0%) |
| $35,000 to $39,999 | 0 (0.0%) | 0 (0.0%) |
| $40,000 to $44,999 | 0 (0.0%) | 0 (0.0%) |
| $45,000 to $49,999 | 33 (35.1%) | 0 (0.0%) |
| $50,000 to $54,999 | 0 (0.0%) | 0 (0.0%) |
| $55,000 to $64,999 | 61 (64.9%) | 0 (0.0%) |
| $65,000 to $74,999 | 0 (0.0%) | 0 (0.0%) |
| $75,000 to $99,999 | 0 (0.0%) | 0 (0.0%) |
| $100,000+ | 0 (0.0%) | 0 (0.0%) |
| Total | 94 (100.0%) | 88 (100.0%) |
Earnings by Sex by Educational Attainment in Twin Lakes CDP Lake County
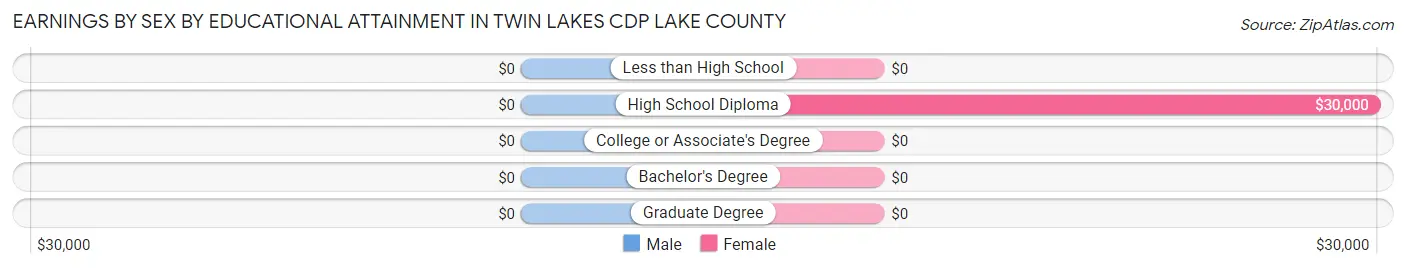
| Educational Attainment | Male Income | Female Income |
| Less than High School | - | - |
| High School Diploma | - | - |
| College or Associate's Degree | - | - |
| Bachelor's Degree | - | - |
| Graduate Degree | - | - |
| Total | $63,074 | $30,000 |
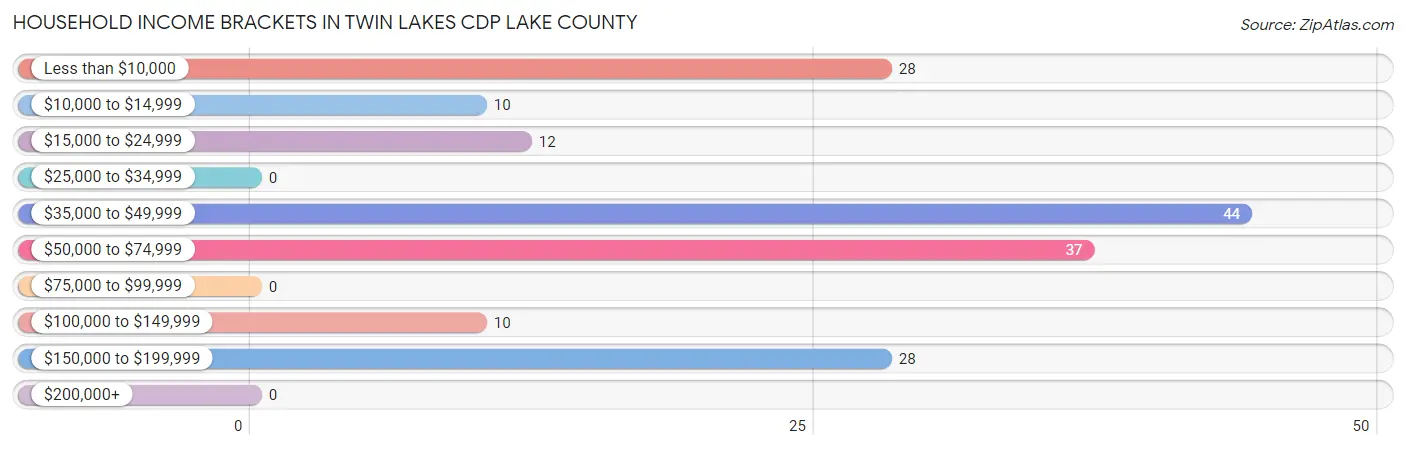
Family Income in Twin Lakes CDP Lake County
Family Income Brackets in Twin Lakes CDP Lake County
According to the Twin Lakes CDP Lake County family income data, there are 28 families falling into the $150,000 to $199,999 income range, which is the most common income bracket and makes up 34.6% of all families.
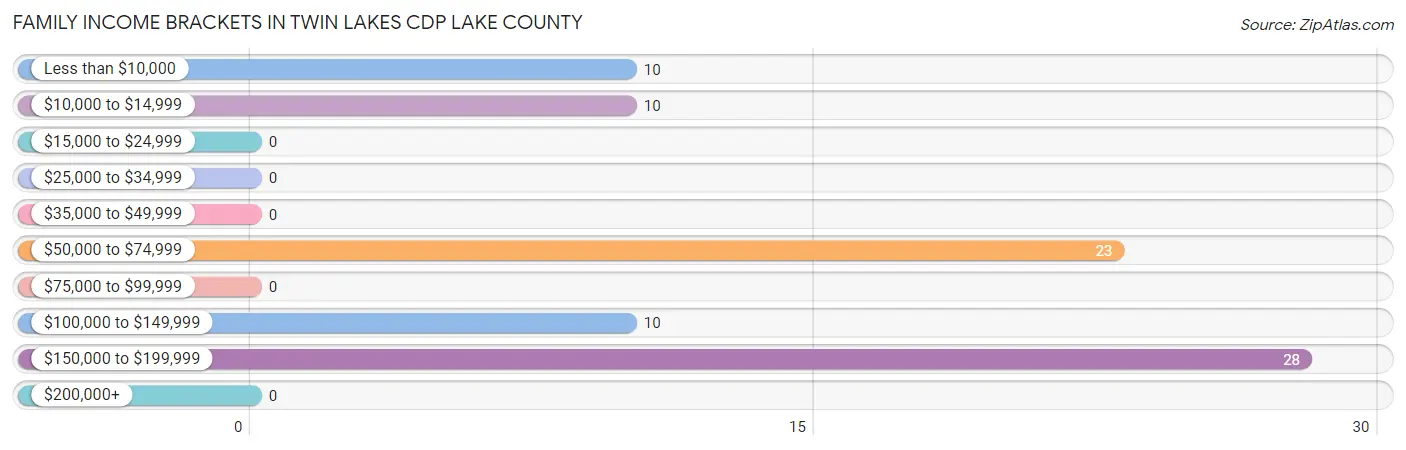
| Income Bracket | # Families | % Families |
| Less than $10,000 | 10 | 12.3% |
| $10,000 to $14,999 | 10 | 12.3% |
| $15,000 to $24,999 | 0 | 0.0% |
| $25,000 to $34,999 | 0 | 0.0% |
| $35,000 to $49,999 | 0 | 0.0% |
| $50,000 to $74,999 | 23 | 28.4% |
| $75,000 to $99,999 | 0 | 0.0% |
| $100,000 to $149,999 | 10 | 12.3% |
| $150,000 to $199,999 | 28 | 34.6% |
| $200,000+ | 0 | 0.0% |
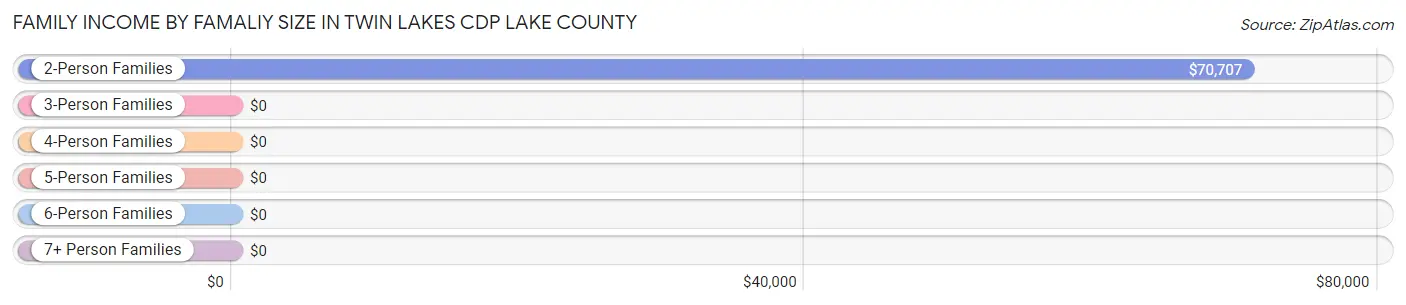
Family Income by Famaliy Size in Twin Lakes CDP Lake County
2-person families (53 | 65.4%) account for the highest median family income in Twin Lakes CDP Lake County with $70,707 per family, while 2-person families (53 | 65.4%) have the highest median income of $35,354 per family member.
| Income Bracket | # Families | Median Income |
| 2-Person Families | 53 (65.4%) | $70,707 |
| 3-Person Families | 0 (0.0%) | $0 |
| 4-Person Families | 28 (34.6%) | $0 |
| 5-Person Families | 0 (0.0%) | $0 |
| 6-Person Families | 0 (0.0%) | $0 |
| 7+ Person Families | 0 (0.0%) | $0 |
| Total | 81 (100.0%) | $0 |
Family Income by Number of Earners in Twin Lakes CDP Lake County
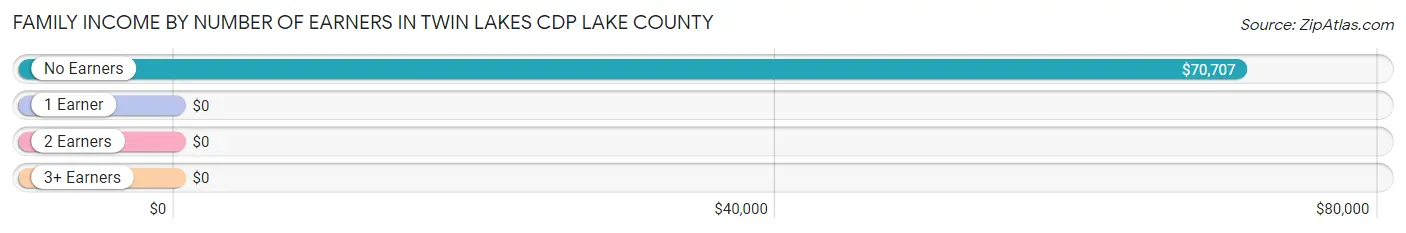
| Number of Earners | # Families | Median Income |
| No Earners | 53 (65.4%) | $70,707 |
| 1 Earner | 0 (0.0%) | $0 |
| 2 Earners | 0 (0.0%) | $0 |
| 3+ Earners | 28 (34.6%) | $0 |
| Total | 81 (100.0%) | $0 |
Household Income in Twin Lakes CDP Lake County
Household Income Brackets in Twin Lakes CDP Lake County
With 44 households falling in the category, the $35,000 to $49,999 income range is the most frequent in Twin Lakes CDP Lake County, accounting for 26.0% of all households.
| Income Bracket | # Households | % Households |
| Less than $10,000 | 28 | 16.6% |
| $10,000 to $14,999 | 10 | 5.9% |
| $15,000 to $24,999 | 12 | 7.1% |
| $25,000 to $34,999 | 0 | 0.0% |
| $35,000 to $49,999 | 44 | 26.0% |
| $50,000 to $74,999 | 37 | 21.9% |
| $75,000 to $99,999 | 0 | 0.0% |
| $100,000 to $149,999 | 10 | 5.9% |
| $150,000 to $199,999 | 28 | 16.6% |
| $200,000+ | 0 | 0.0% |
Household Income by Householder Age in Twin Lakes CDP Lake County
The median household income in Twin Lakes CDP Lake County is $46,016, with the highest median household income of $62,946 found in the 45 to 64 years age bracket for the primary householder. A total of 103 households (61.0%) fall into this category.
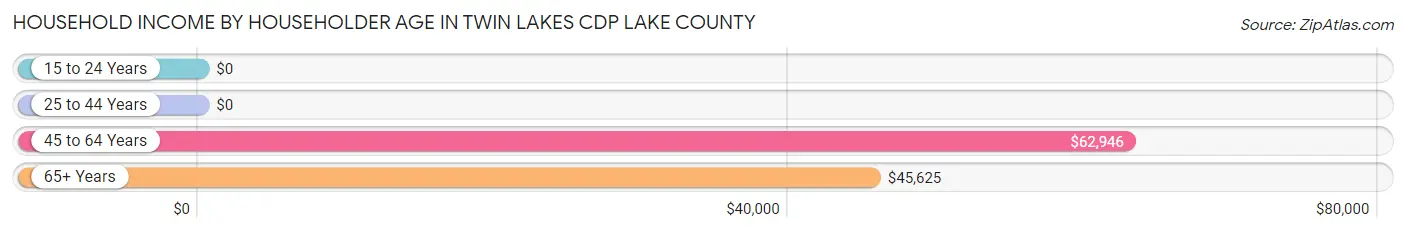
| Income Bracket | # Households | Median Income |
| 15 to 24 Years | 0 (0.0%) | $0 |
| 25 to 44 Years | 0 (0.0%) | $0 |
| 45 to 64 Years | 103 (61.0%) | $62,946 |
| 65+ Years | 66 (39.1%) | $45,625 |
| Total | 169 (100.0%) | $46,016 |
Poverty in Twin Lakes CDP Lake County
Income Below Poverty by Sex and Age in Twin Lakes CDP Lake County
With 12.0% poverty level for males and 23.2% for females among the residents of Twin Lakes CDP Lake County, 55 to 64 year old males and 45 to 54 year old females are the most vulnerable to poverty, with 20 males (19.8%) and 18 females (100.0%) in their respective age groups living below the poverty level.
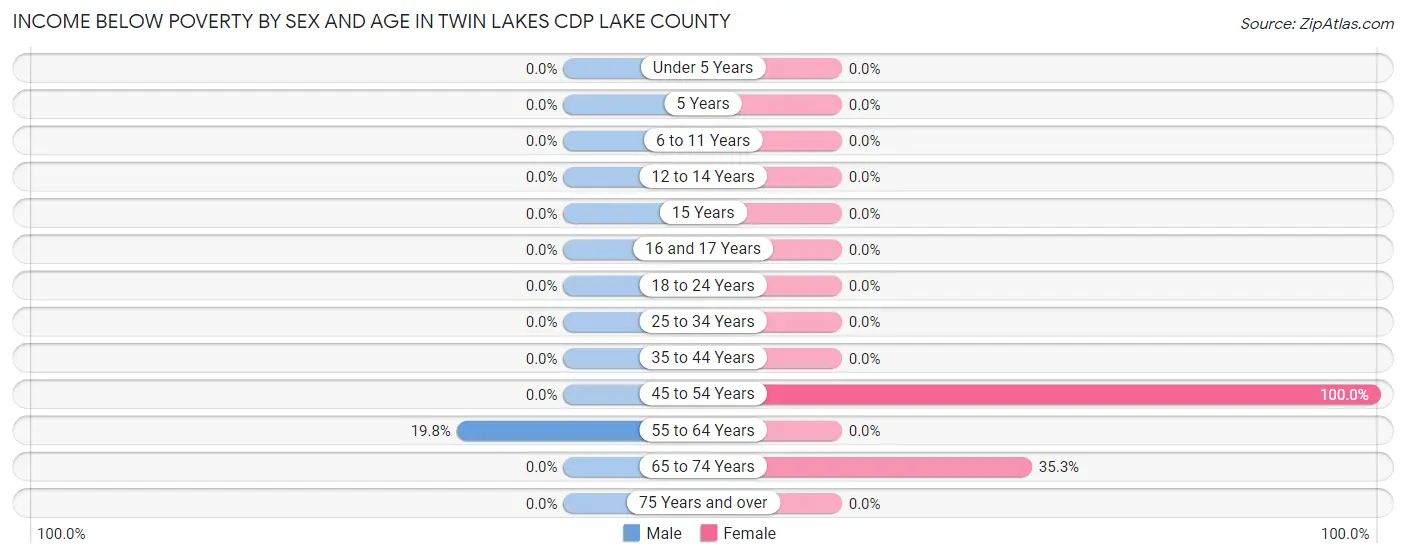
| Age Bracket | Male | Female |
| Under 5 Years | 0 (0.0%) | 0 (0.0%) |
| 5 Years | 0 (0.0%) | 0 (0.0%) |
| 6 to 11 Years | 0 (0.0%) | 0 (0.0%) |
| 12 to 14 Years | 0 (0.0%) | 0 (0.0%) |
| 15 Years | 0 (0.0%) | 0 (0.0%) |
| 16 and 17 Years | 0 (0.0%) | 0 (0.0%) |
| 18 to 24 Years | 0 (0.0%) | 0 (0.0%) |
| 25 to 34 Years | 0 (0.0%) | 0 (0.0%) |
| 35 to 44 Years | 0 (0.0%) | 0 (0.0%) |
| 45 to 54 Years | 0 (0.0%) | 18 (100.0%) |
| 55 to 64 Years | 20 (19.8%) | 0 (0.0%) |
| 65 to 74 Years | 0 (0.0%) | 24 (35.3%) |
| 75 Years and over | 0 (0.0%) | 0 (0.0%) |
| Total | 20 (12.0%) | 42 (23.2%) |
Income Above Poverty by Sex and Age in Twin Lakes CDP Lake County
According to the poverty statistics in Twin Lakes CDP Lake County, males aged 25 to 34 years and females aged 25 to 34 years are the age groups that are most secure financially, with 100.0% of males and 100.0% of females in these age groups living above the poverty line.
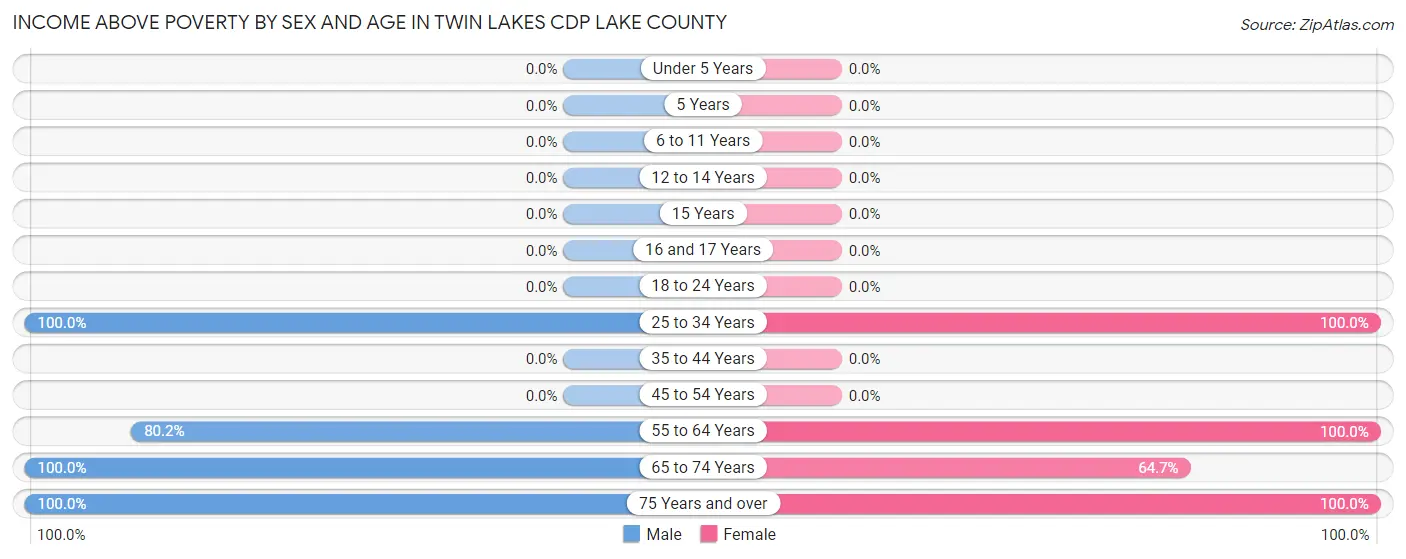
| Age Bracket | Male | Female |
| Under 5 Years | 0 (0.0%) | 0 (0.0%) |
| 5 Years | 0 (0.0%) | 0 (0.0%) |
| 6 to 11 Years | 0 (0.0%) | 0 (0.0%) |
| 12 to 14 Years | 0 (0.0%) | 0 (0.0%) |
| 15 Years | 0 (0.0%) | 0 (0.0%) |
| 16 and 17 Years | 0 (0.0%) | 0 (0.0%) |
| 18 to 24 Years | 0 (0.0%) | 0 (0.0%) |
| 25 to 34 Years | 33 (100.0%) | 44 (100.0%) |
| 35 to 44 Years | 0 (0.0%) | 0 (0.0%) |
| 45 to 54 Years | 0 (0.0%) | 0 (0.0%) |
| 55 to 64 Years | 81 (80.2%) | 40 (100.0%) |
| 65 to 74 Years | 22 (100.0%) | 44 (64.7%) |
| 75 Years and over | 11 (100.0%) | 11 (100.0%) |
| Total | 147 (88.0%) | 139 (76.8%) |
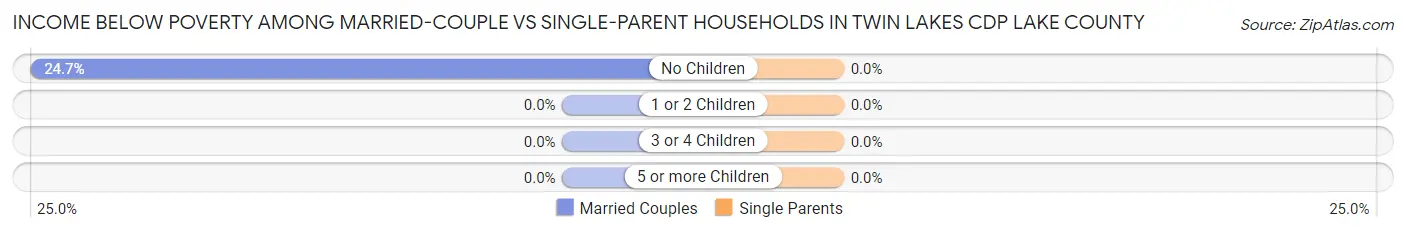
Income Below Poverty Among Married-Couple Families in Twin Lakes CDP Lake County
The poverty statistics for married-couple families in Twin Lakes CDP Lake County show that 24.7% or 20 of the total 81 families live below the poverty line. Families with no children have the highest poverty rate of 24.7%, comprising of 20 families. On the other hand, families with no children have the lowest poverty rate of 24.7%, which includes 20 families.
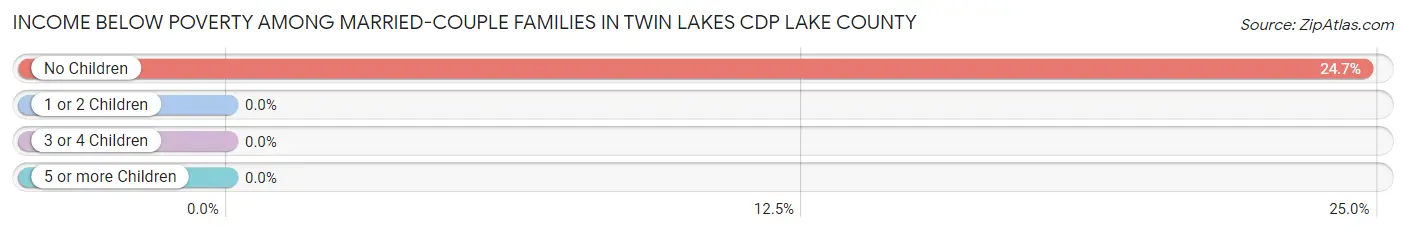
| Children | Above Poverty | Below Poverty |
| No Children | 61 (75.3%) | 20 (24.7%) |
| 1 or 2 Children | 0 (0.0%) | 0 (0.0%) |
| 3 or 4 Children | 0 (0.0%) | 0 (0.0%) |
| 5 or more Children | 0 (0.0%) | 0 (0.0%) |
| Total | 61 (75.3%) | 20 (24.7%) |
Income Below Poverty Among Single-Parent Households in Twin Lakes CDP Lake County
| Children | Single Father | Single Mother |
| No Children | 0 (0.0%) | 0 (0.0%) |
| 1 or 2 Children | 0 (0.0%) | 0 (0.0%) |
| 3 or 4 Children | 0 (0.0%) | 0 (0.0%) |
| 5 or more Children | 0 (0.0%) | 0 (0.0%) |
| Total | 0 (0.0%) | 0 (0.0%) |
Income Below Poverty Among Married-Couple vs Single-Parent Households in Twin Lakes CDP Lake County
| Children | Married-Couple Families | Single-Parent Households |
| No Children | 20 (24.7%) | 0 (0.0%) |
| 1 or 2 Children | 0 (0.0%) | 0 (0.0%) |
| 3 or 4 Children | 0 (0.0%) | 0 (0.0%) |
| 5 or more Children | 0 (0.0%) | 0 (0.0%) |
| Total | 20 (24.7%) | 0 (0.0%) |
Race in Twin Lakes CDP Lake County
The most populous races in Twin Lakes CDP Lake County are White / Caucasian (196 | 56.3%), Hispanic or Latino (170 | 48.8%), and Two or more Races (152 | 43.7%).
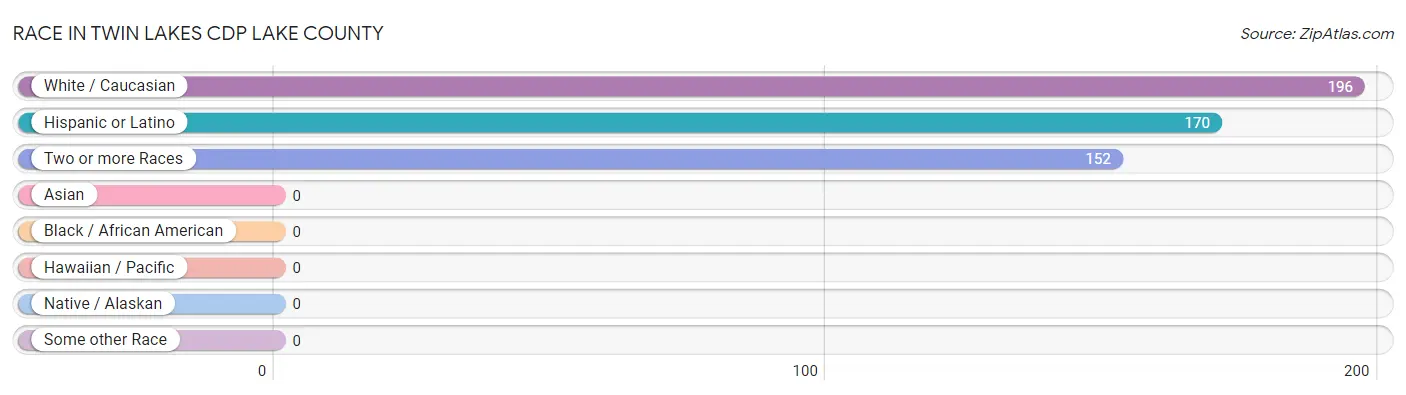
| Race | # Population | % Population |
| Asian | 0 | 0.0% |
| Black / African American | 0 | 0.0% |
| Hawaiian / Pacific | 0 | 0.0% |
| Hispanic or Latino | 170 | 48.8% |
| Native / Alaskan | 0 | 0.0% |
| White / Caucasian | 196 | 56.3% |
| Two or more Races | 152 | 43.7% |
| Some other Race | 0 | 0.0% |
| Total | 348 | 100.0% |
Ancestry in Twin Lakes CDP Lake County
The most populous ancestries reported in Twin Lakes CDP Lake County are Irish (73 | 21.0%), German (69 | 19.8%), English (25 | 7.2%), American (23 | 6.6%), and French (23 | 6.6%), together accounting for 61.2% of all Twin Lakes CDP Lake County residents.
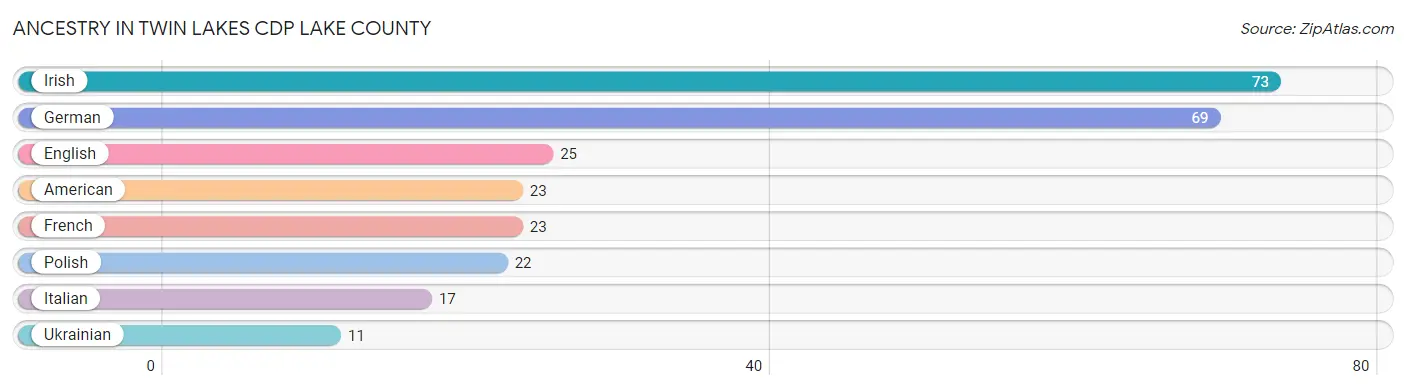
| Ancestry | # Population | % Population |
| American | 23 | 6.6% |
| English | 25 | 7.2% |
| French | 23 | 6.6% |
| German | 69 | 19.8% |
| Irish | 73 | 21.0% |
| Italian | 17 | 4.9% |
| Polish | 22 | 6.3% |
| Ukrainian | 11 | 3.2% | View All 8 Rows |
Immigrants in Twin Lakes CDP Lake County

| Immigration Origin | # Population | % Population | View All 0 Rows |
Sex and Age in Twin Lakes CDP Lake County
Sex and Age in Twin Lakes CDP Lake County
The most populous age groups in Twin Lakes CDP Lake County are 60 to 64 Years (87 | 52.1%) for men and 25 to 29 Years (44 | 24.3%) for women.
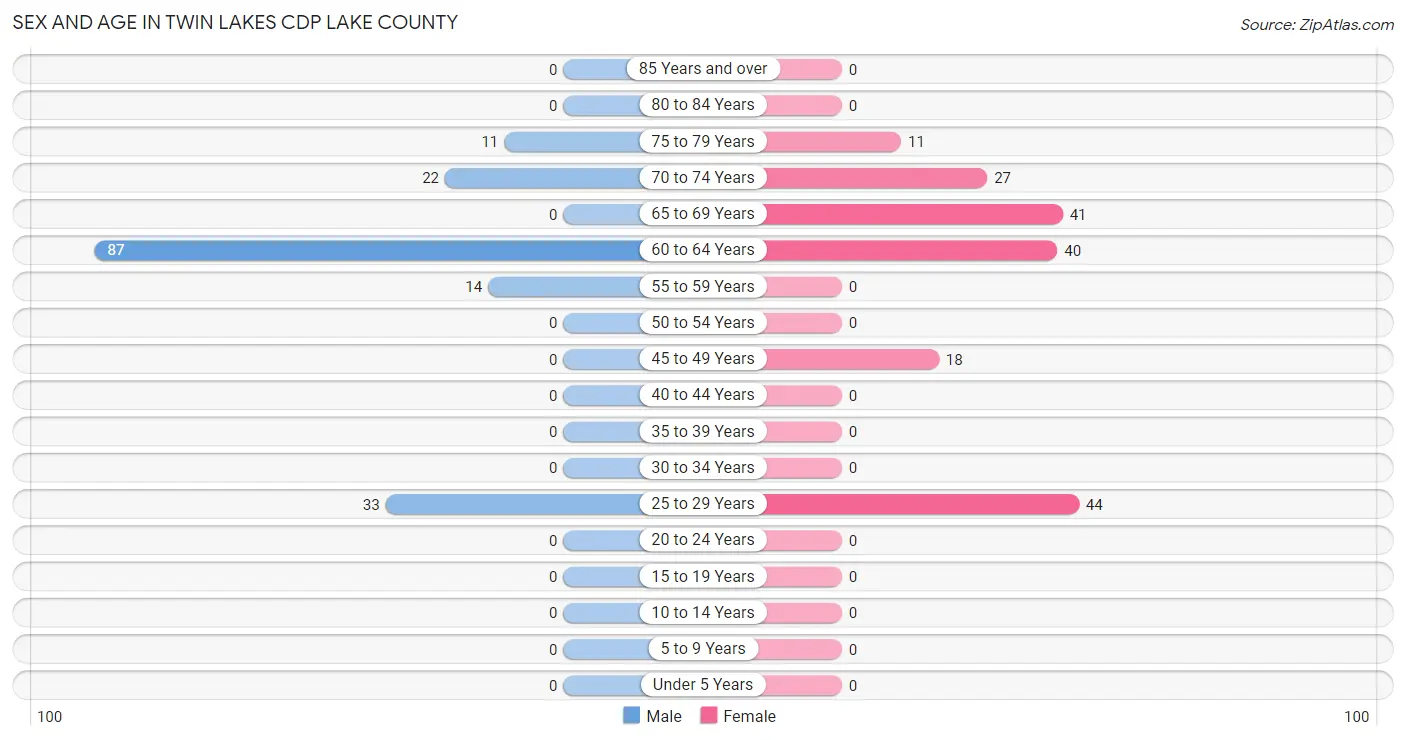
| Age Bracket | Male | Female |
| Under 5 Years | 0 (0.0%) | 0 (0.0%) |
| 5 to 9 Years | 0 (0.0%) | 0 (0.0%) |
| 10 to 14 Years | 0 (0.0%) | 0 (0.0%) |
| 15 to 19 Years | 0 (0.0%) | 0 (0.0%) |
| 20 to 24 Years | 0 (0.0%) | 0 (0.0%) |
| 25 to 29 Years | 33 (19.8%) | 44 (24.3%) |
| 30 to 34 Years | 0 (0.0%) | 0 (0.0%) |
| 35 to 39 Years | 0 (0.0%) | 0 (0.0%) |
| 40 to 44 Years | 0 (0.0%) | 0 (0.0%) |
| 45 to 49 Years | 0 (0.0%) | 18 (9.9%) |
| 50 to 54 Years | 0 (0.0%) | 0 (0.0%) |
| 55 to 59 Years | 14 (8.4%) | 0 (0.0%) |
| 60 to 64 Years | 87 (52.1%) | 40 (22.1%) |
| 65 to 69 Years | 0 (0.0%) | 41 (22.7%) |
| 70 to 74 Years | 22 (13.2%) | 27 (14.9%) |
| 75 to 79 Years | 11 (6.6%) | 11 (6.1%) |
| 80 to 84 Years | 0 (0.0%) | 0 (0.0%) |
| 85 Years and over | 0 (0.0%) | 0 (0.0%) |
| Total | 167 (100.0%) | 181 (100.0%) |
Families and Households in Twin Lakes CDP Lake County
Median Family Size in Twin Lakes CDP Lake County
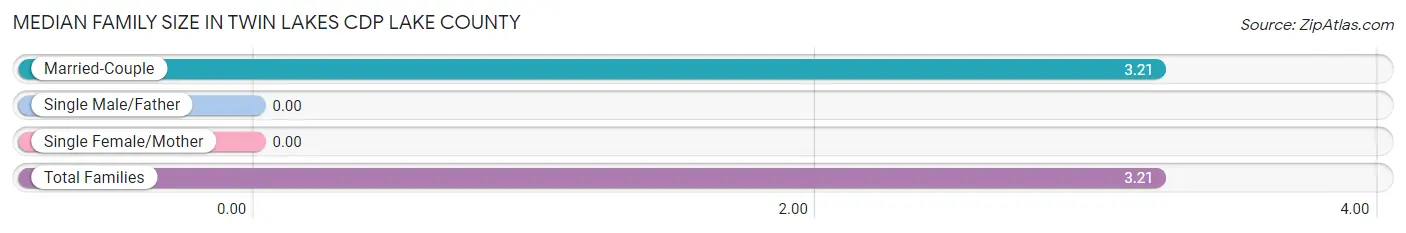
| Family Type | # Families | Family Size |
| Married-Couple | 81 (100.0%) | 3.21 |
| Single Male/Father | 0 (0.0%) | - |
| Single Female/Mother | 0 (0.0%) | - |
| Total Families | 81 (100.0%) | 3.21 |
Median Household Size in Twin Lakes CDP Lake County
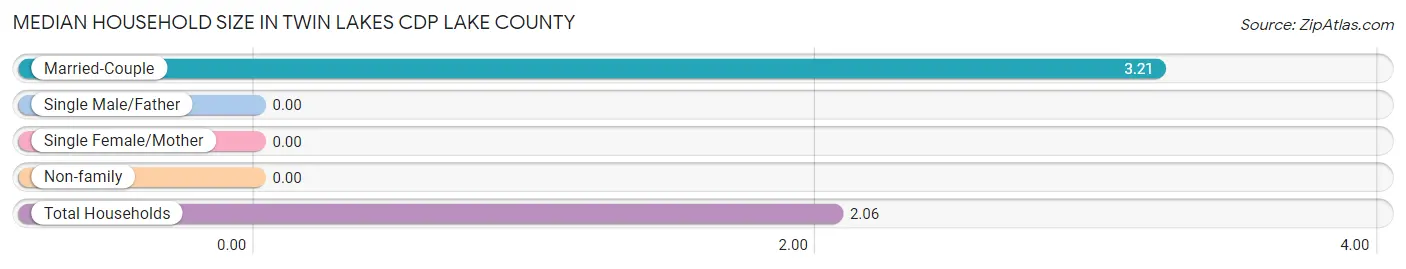
| Household Type | # Households | Household Size |
| Married-Couple | 81 (47.9%) | 3.21 |
| Single Male/Father | 0 (0.0%) | - |
| Single Female/Mother | 0 (0.0%) | - |
| Non-family | 88 (52.1%) | - |
| Total Households | 169 (100.0%) | 2.06 |
Household Size by Marriage Status in Twin Lakes CDP Lake County
Out of a total of 169 households in Twin Lakes CDP Lake County, 81 (47.9%) are family households, while 88 (52.1%) are nonfamily households. The most numerous type of family households are 2-person households, comprising 53, and the most common type of nonfamily households are 1-person households, comprising 88.
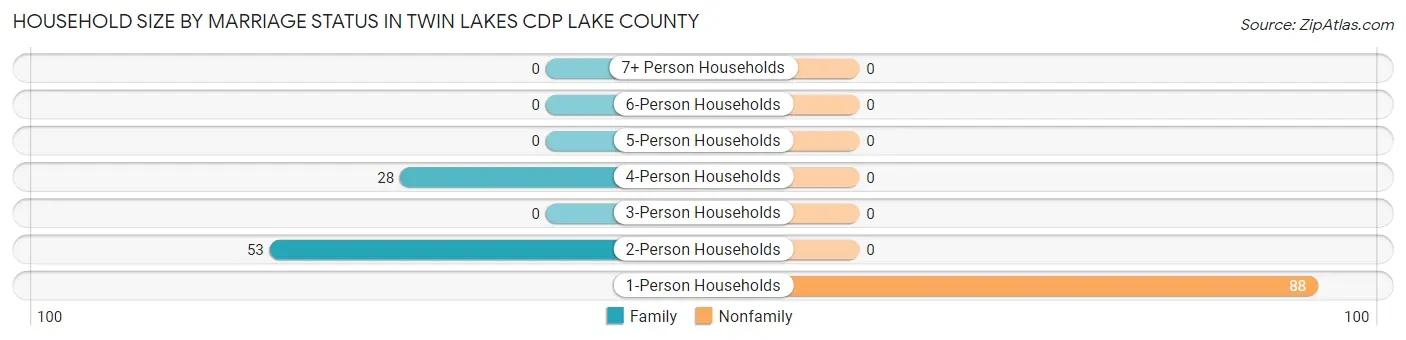
| Household Size | Family Households | Nonfamily Households |
| 1-Person Households | - | 88 (52.1%) |
| 2-Person Households | 53 (31.4%) | 0 (0.0%) |
| 3-Person Households | 0 (0.0%) | 0 (0.0%) |
| 4-Person Households | 28 (16.6%) | 0 (0.0%) |
| 5-Person Households | 0 (0.0%) | 0 (0.0%) |
| 6-Person Households | 0 (0.0%) | 0 (0.0%) |
| 7+ Person Households | 0 (0.0%) | 0 (0.0%) |
| Total | 81 (47.9%) | 88 (52.1%) |
Female Fertility in Twin Lakes CDP Lake County
Fertility by Age in Twin Lakes CDP Lake County
| Age Bracket | Women with Births | Births / 1,000 Women |
| 15 to 19 years | 0 (0.0%) | 0.0 |
| 20 to 34 years | 0 (0.0%) | 0.0 |
| 35 to 50 years | 0 (0.0%) | 0.0 |
| Total | 0 (0.0%) | 0.0 |
Fertility by Age by Marriage Status in Twin Lakes CDP Lake County
| Age Bracket | Married | Unmarried |
| 15 to 19 years | 0 (0.0%) | 0 (0.0%) |
| 20 to 34 years | 0 (0.0%) | 0 (0.0%) |
| 35 to 50 years | 0 (0.0%) | 0 (0.0%) |
| Total | 0 (0.0%) | 0 (0.0%) |
Fertility by Education in Twin Lakes CDP Lake County
| Educational Attainment | Women with Births | Births / 1,000 Women |
| Less than High School | 0 (0.0%) | 0.0 |
| High School Diploma | 0 (0.0%) | 0.0 |
| College or Associate's Degree | 0 (0.0%) | 0.0 |
| Bachelor's Degree | 0 (0.0%) | 0.0 |
| Graduate Degree | 0 (0.0%) | 0.0 |
| Total | 0 (0.0%) | 0.0 |
Fertility by Education by Marriage Status in Twin Lakes CDP Lake County
| Educational Attainment | Married | Unmarried |
| Less than High School | 0 (0.0%) | 0 (0.0%) |
| High School Diploma | 0 (0.0%) | 0 (0.0%) |
| College or Associate's Degree | 0 (0.0%) | 0 (0.0%) |
| Bachelor's Degree | 0 (0.0%) | 0 (0.0%) |
| Graduate Degree | 0 (0.0%) | 0 (0.0%) |
| Total | 0 (0.0%) | 0 (0.0%) |
Employment Characteristics in Twin Lakes CDP Lake County
Employment by Class of Employer in Twin Lakes CDP Lake County
Among the 182 employed individuals in Twin Lakes CDP Lake County, private company employees (77 | 42.3%), state government employees (47 | 25.8%), and local government employees (42 | 23.1%) make up the most common classes of employment.
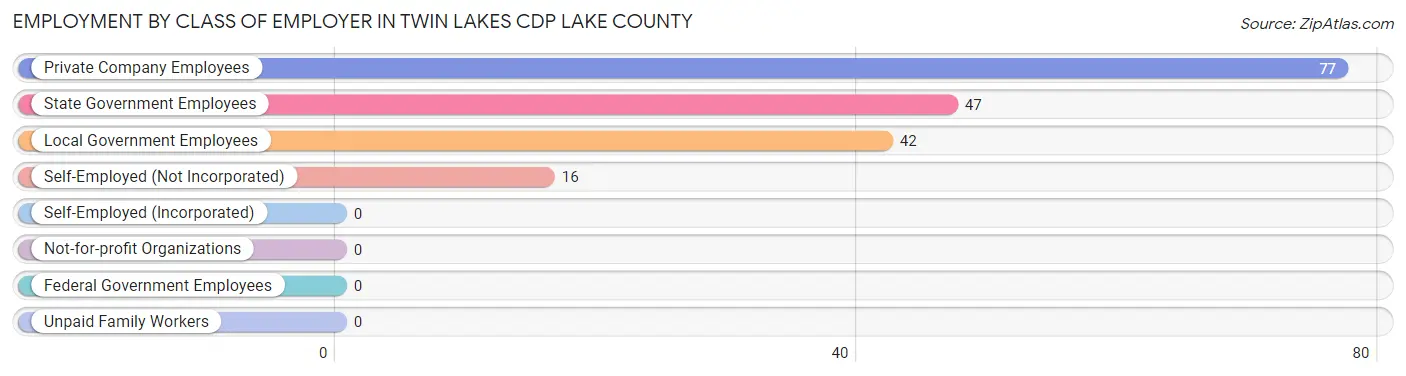
| Employer Class | # Employees | % Employees |
| Private Company Employees | 77 | 42.3% |
| Self-Employed (Incorporated) | 0 | 0.0% |
| Self-Employed (Not Incorporated) | 16 | 8.8% |
| Not-for-profit Organizations | 0 | 0.0% |
| Local Government Employees | 42 | 23.1% |
| State Government Employees | 47 | 25.8% |
| Federal Government Employees | 0 | 0.0% |
| Unpaid Family Workers | 0 | 0.0% |
| Total | 182 | 100.0% |
Employment Status by Age in Twin Lakes CDP Lake County
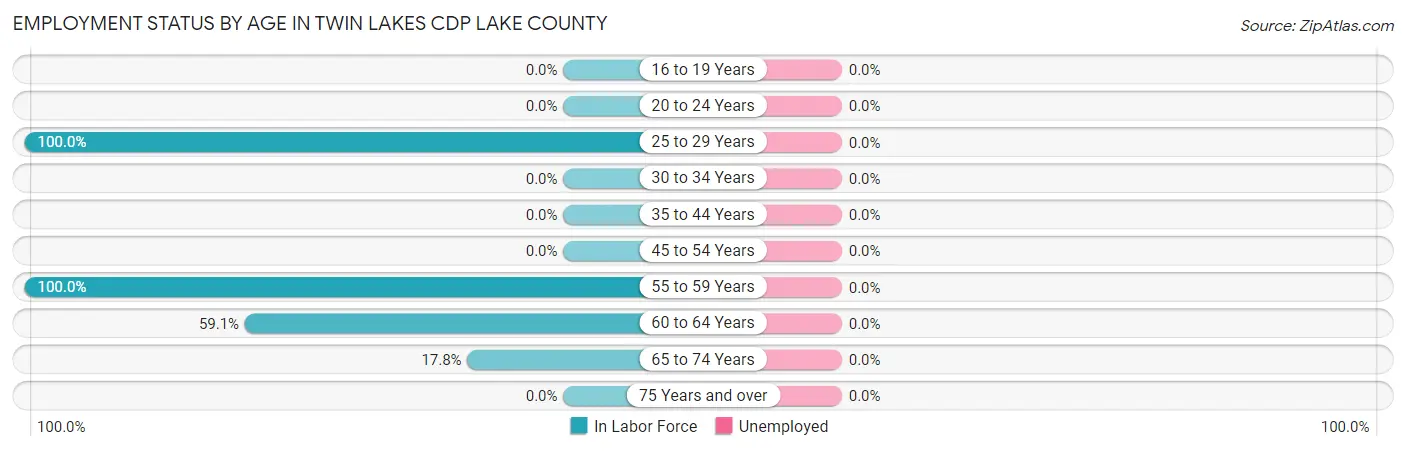
| Age Bracket | In Labor Force | Unemployed |
| 16 to 19 Years | 0 (0.0%) | 0 (0.0%) |
| 20 to 24 Years | 0 (0.0%) | 0 (0.0%) |
| 25 to 29 Years | 77 (100.0%) | 0 (0.0%) |
| 30 to 34 Years | 0 (0.0%) | 0 (0.0%) |
| 35 to 44 Years | 0 (0.0%) | 0 (0.0%) |
| 45 to 54 Years | 0 (0.0%) | 0 (0.0%) |
| 55 to 59 Years | 14 (100.0%) | 0 (0.0%) |
| 60 to 64 Years | 75 (59.1%) | 0 (0.0%) |
| 65 to 74 Years | 16 (17.8%) | 0 (0.0%) |
| 75 Years and over | 0 (0.0%) | 0 (0.0%) |
| Total | 182 (52.3%) | 0 (0.0%) |
Employment Status by Educational Attainment in Twin Lakes CDP Lake County
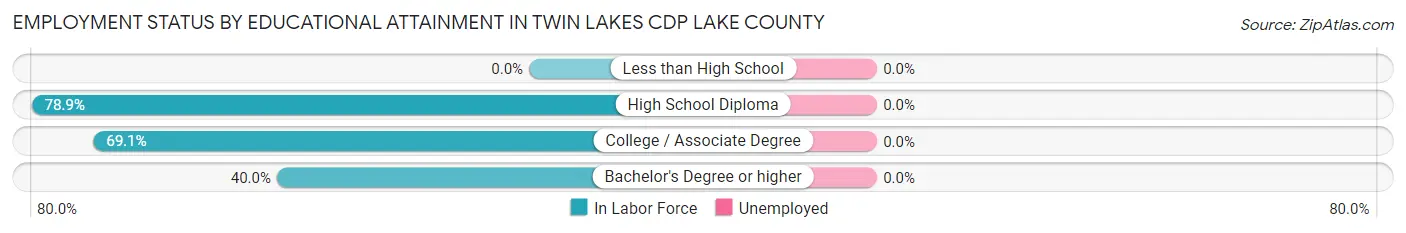
| Educational Attainment | In Labor Force | Unemployed |
| Less than High School | 0 (0.0%) | 0 (0.0%) |
| High School Diploma | 105 (78.9%) | 0 (0.0%) |
| College / Associate Degree | 47 (69.1%) | 0 (0.0%) |
| Bachelor's Degree or higher | 14 (40.0%) | 0 (0.0%) |
| Total | 166 (70.3%) | 0 (0.0%) |
Employment Occupations by Sex in Twin Lakes CDP Lake County
Management, Business, Science and Arts Occupations
Management, Business, Science and Arts Occupations by Sex
| Occupation | Male | Female |
| Management | 0 (0.0%) | 0 (0.0%) |
| Business & Financial | 0 (0.0%) | 0 (0.0%) |
| Computers, Engineering & Science | 0 (0.0%) | 0 (0.0%) |
| Computers & Mathematics | 0 (0.0%) | 0 (0.0%) |
| Architecture & Engineering | 0 (0.0%) | 0 (0.0%) |
| Life, Physical & Social Science | 0 (0.0%) | 0 (0.0%) |
| Community & Social Service | 0 (0.0%) | 0 (0.0%) |
| Education, Arts & Media | 0 (0.0%) | 0 (0.0%) |
| Legal Services & Support | 0 (0.0%) | 0 (0.0%) |
| Education Instruction & Library | 0 (0.0%) | 0 (0.0%) |
| Arts, Media & Entertainment | 0 (0.0%) | 0 (0.0%) |
| Health Diagnosing & Treating | 0 (0.0%) | 0 (0.0%) |
| Health Technologists | 0 (0.0%) | 0 (0.0%) |
| Total (Category) | 0 (0.0%) | 0 (0.0%) |
| Total (Overall) | 94 (51.6%) | 88 (48.3%) |
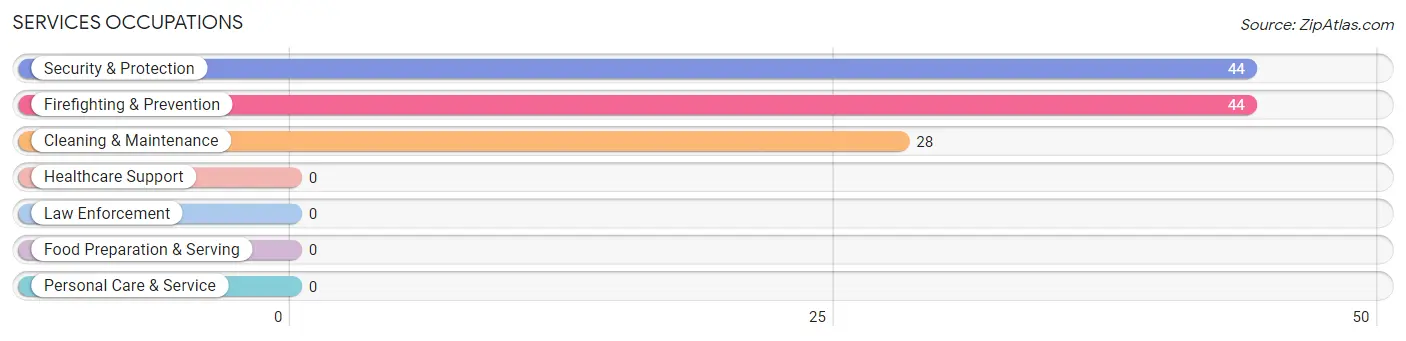
Services Occupations
The most common Services occupations in Twin Lakes CDP Lake County are Security & Protection (44 | 24.2%), Firefighting & Prevention (44 | 24.2%), and Cleaning & Maintenance (28 | 15.4%).
Services Occupations by Sex
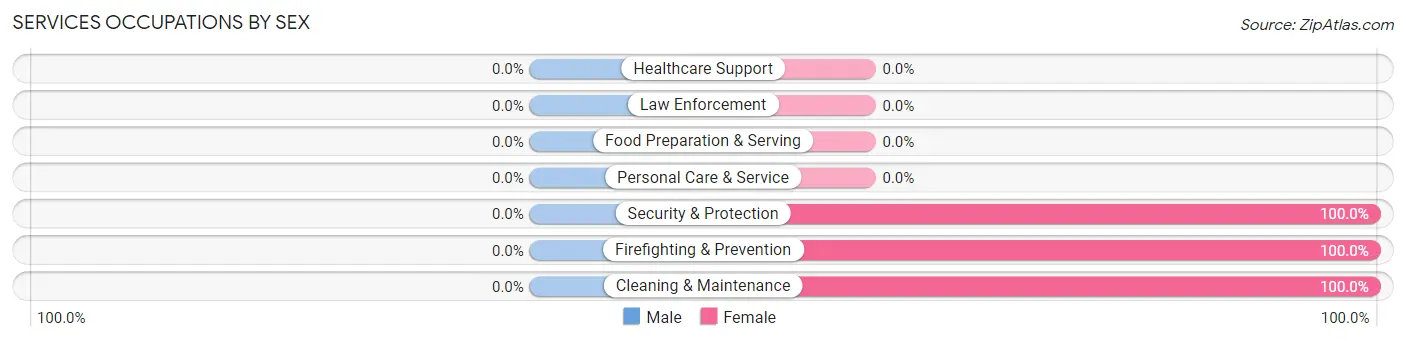
| Occupation | Male | Female |
| Healthcare Support | 0 (0.0%) | 0 (0.0%) |
| Security & Protection | 0 (0.0%) | 44 (100.0%) |
| Firefighting & Prevention | 0 (0.0%) | 44 (100.0%) |
| Law Enforcement | 0 (0.0%) | 0 (0.0%) |
| Food Preparation & Serving | 0 (0.0%) | 0 (0.0%) |
| Cleaning & Maintenance | 0 (0.0%) | 28 (100.0%) |
| Personal Care & Service | 0 (0.0%) | 0 (0.0%) |
| Total (Category) | 0 (0.0%) | 72 (100.0%) |
| Total (Overall) | 94 (51.6%) | 88 (48.3%) |
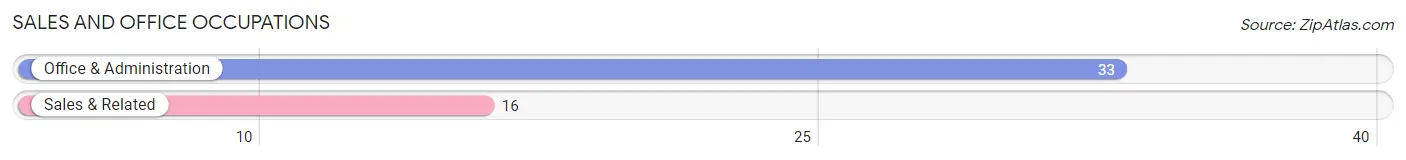
Sales and Office Occupations
The most common Sales and Office occupations in Twin Lakes CDP Lake County are Office & Administration (33 | 18.1%), and Sales & Related (16 | 8.8%).
Sales and Office Occupations by Sex
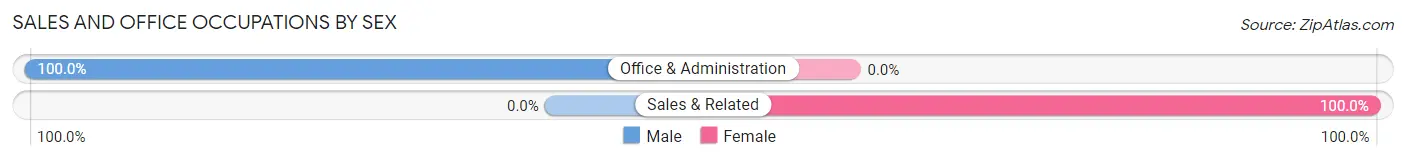
| Occupation | Male | Female |
| Sales & Related | 0 (0.0%) | 16 (100.0%) |
| Office & Administration | 33 (100.0%) | 0 (0.0%) |
| Total (Category) | 33 (67.3%) | 16 (32.7%) |
| Total (Overall) | 94 (51.6%) | 88 (48.3%) |
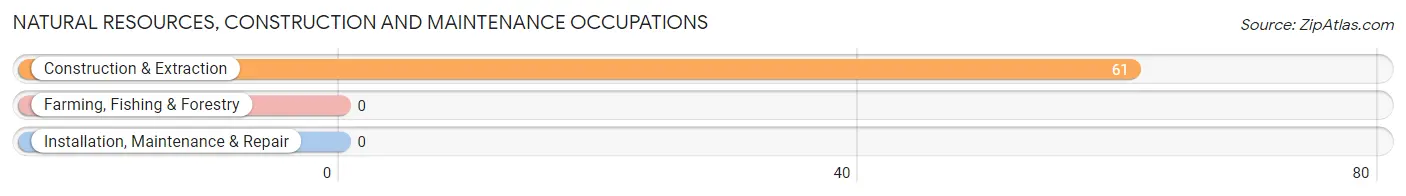
Natural Resources, Construction and Maintenance Occupations
The most common Natural Resources, Construction and Maintenance occupations in Twin Lakes CDP Lake County are , and Construction & Extraction (61 | 33.5%).
Natural Resources, Construction and Maintenance Occupations by Sex
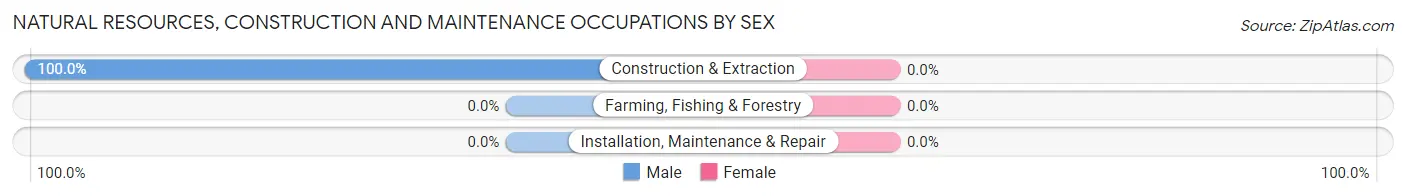
| Occupation | Male | Female |
| Farming, Fishing & Forestry | 0 (0.0%) | 0 (0.0%) |
| Construction & Extraction | 61 (100.0%) | 0 (0.0%) |
| Installation, Maintenance & Repair | 0 (0.0%) | 0 (0.0%) |
| Total (Category) | 61 (100.0%) | 0 (0.0%) |
| Total (Overall) | 94 (51.6%) | 88 (48.3%) |
Production, Transportation and Moving Occupations
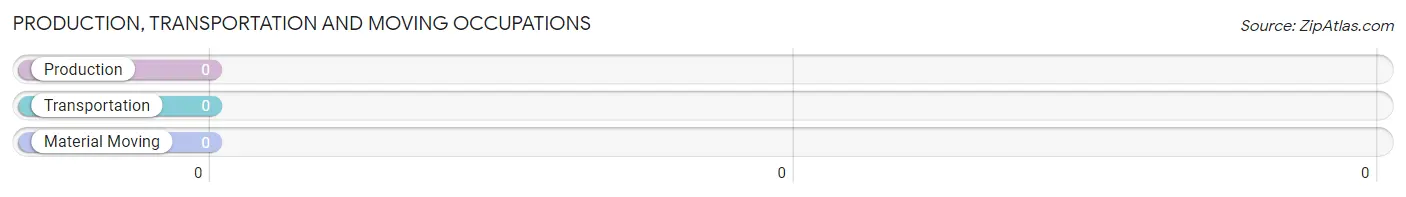
Production, Transportation and Moving Occupations by Sex
| Occupation | Male | Female |
| Production | 0 (0.0%) | 0 (0.0%) |
| Transportation | 0 (0.0%) | 0 (0.0%) |
| Material Moving | 0 (0.0%) | 0 (0.0%) |
| Total (Category) | 0 (0.0%) | 0 (0.0%) |
| Total (Overall) | 94 (51.6%) | 88 (48.3%) |
Employment Industries by Sex in Twin Lakes CDP Lake County
Employment Industries in Twin Lakes CDP Lake County
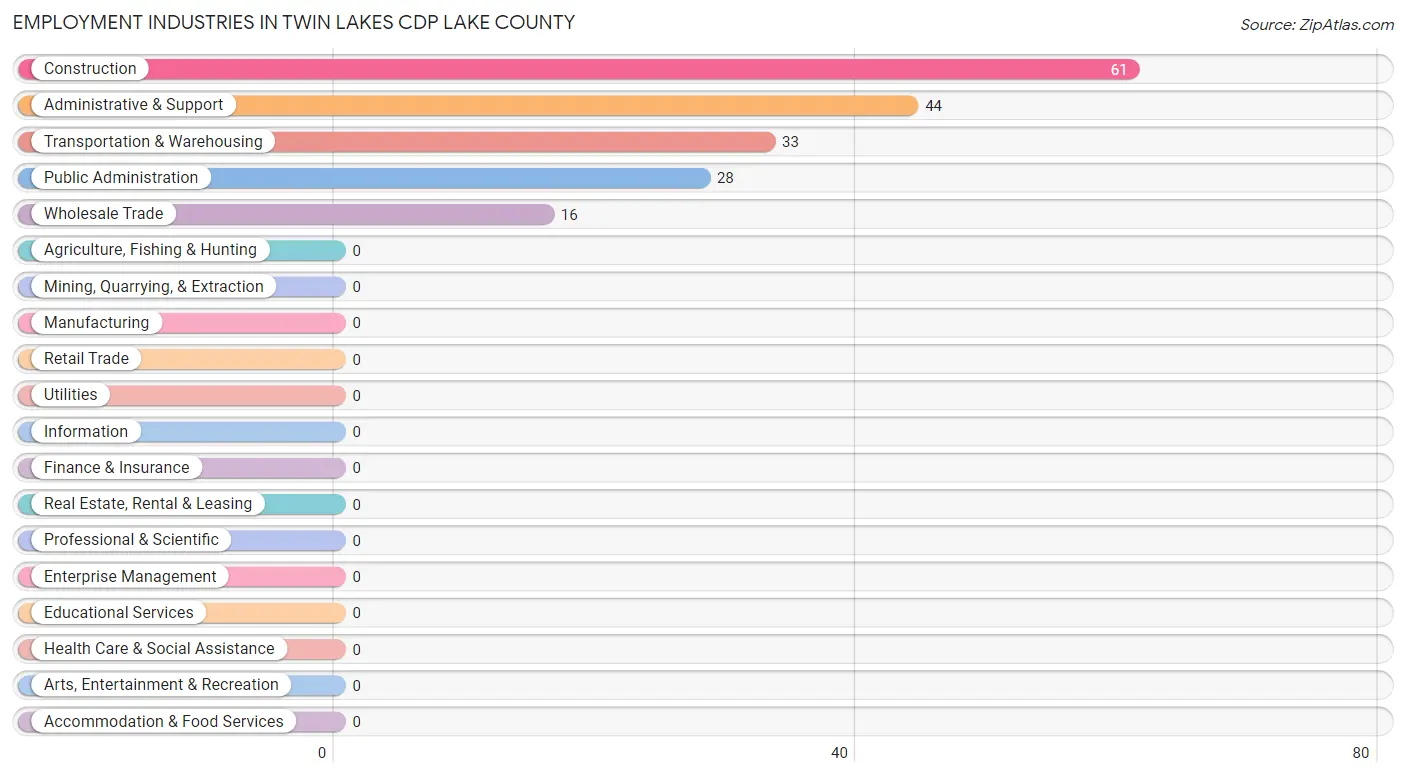
The major employment industries in Twin Lakes CDP Lake County include Construction (61 | 33.5%), Administrative & Support (44 | 24.2%), Transportation & Warehousing (33 | 18.1%), Public Administration (28 | 15.4%), and Wholesale Trade (16 | 8.8%).
Employment Industries by Sex in Twin Lakes CDP Lake County
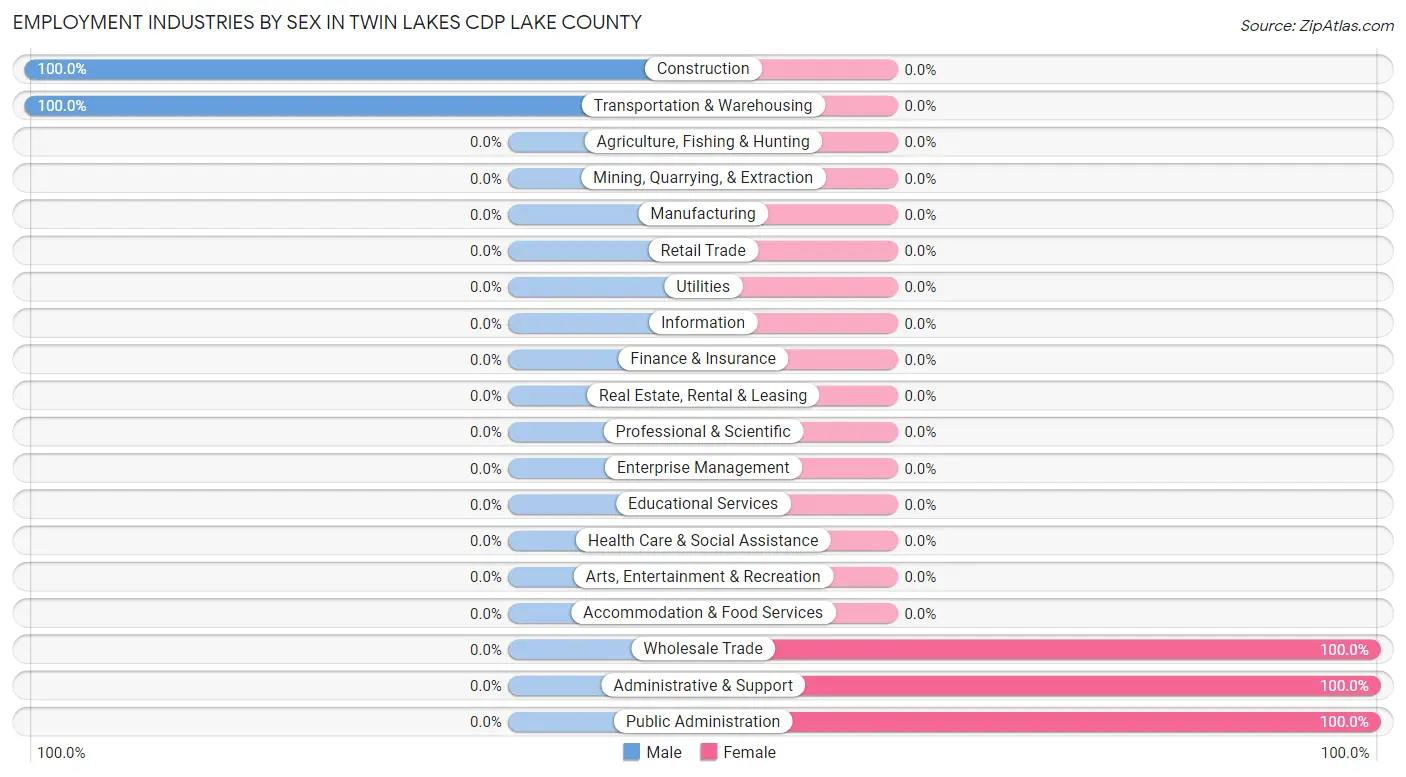
The Twin Lakes CDP Lake County industries that see more men than women are Construction (100.0%), and Transportation & Warehousing (100.0%), whereas the industries that tend to have a higher number of women are Wholesale Trade (100.0%), Administrative & Support (100.0%), and Public Administration (100.0%).
| Industry | Male | Female |
| Agriculture, Fishing & Hunting | 0 (0.0%) | 0 (0.0%) |
| Mining, Quarrying, & Extraction | 0 (0.0%) | 0 (0.0%) |
| Construction | 61 (100.0%) | 0 (0.0%) |
| Manufacturing | 0 (0.0%) | 0 (0.0%) |
| Wholesale Trade | 0 (0.0%) | 16 (100.0%) |
| Retail Trade | 0 (0.0%) | 0 (0.0%) |
| Transportation & Warehousing | 33 (100.0%) | 0 (0.0%) |
| Utilities | 0 (0.0%) | 0 (0.0%) |
| Information | 0 (0.0%) | 0 (0.0%) |
| Finance & Insurance | 0 (0.0%) | 0 (0.0%) |
| Real Estate, Rental & Leasing | 0 (0.0%) | 0 (0.0%) |
| Professional & Scientific | 0 (0.0%) | 0 (0.0%) |
| Enterprise Management | 0 (0.0%) | 0 (0.0%) |
| Administrative & Support | 0 (0.0%) | 44 (100.0%) |
| Educational Services | 0 (0.0%) | 0 (0.0%) |
| Health Care & Social Assistance | 0 (0.0%) | 0 (0.0%) |
| Arts, Entertainment & Recreation | 0 (0.0%) | 0 (0.0%) |
| Accommodation & Food Services | 0 (0.0%) | 0 (0.0%) |
| Public Administration | 0 (0.0%) | 28 (100.0%) |
| Total | 94 (51.6%) | 88 (48.3%) |
Education in Twin Lakes CDP Lake County
School Enrollment in Twin Lakes CDP Lake County
| School Level | # Students | % Students |
| Nursery / Preschool | 0 | 0.0% |
| Kindergarten | 0 | 0.0% |
| Elementary School | 0 | 0.0% |
| Middle School | 0 | 0.0% |
| High School | 0 | 0.0% |
| College / Undergraduate | 0 | 0.0% |
| Graduate / Professional | 0 | 0.0% |
| Total | 0 | 0.0% |
School Enrollment by Age by Funding Source in Twin Lakes CDP Lake County
| Age Bracket | Public School | Private School |
| 3 to 4 Year Olds | 0 (0.0%) | 0 (0.0%) |
| 5 to 9 Year Old | 0 (0.0%) | 0 (0.0%) |
| 10 to 14 Year Olds | 0 (0.0%) | 0 (0.0%) |
| 15 to 17 Year Olds | 0 (0.0%) | 0 (0.0%) |
| 18 to 19 Year Olds | 0 (0.0%) | 0 (0.0%) |
| 20 to 24 Year Olds | 0 (0.0%) | 0 (0.0%) |
| 25 to 34 Year Olds | 0 (0.0%) | 0 (0.0%) |
| 35 Years and over | 0 (0.0%) | 0 (0.0%) |
| Total | 0 (0.0%) | 0 (0.0%) |
Educational Attainment by Field of Study in Twin Lakes CDP Lake County
Business (48 | 50.0%), bio, nature & agricultural (14 | 14.6%), psychology (12 | 12.5%), social sciences (11 | 11.5%), and literature & languages (11 | 11.5%) are the most common fields of study among 96 individuals in Twin Lakes CDP Lake County who have obtained a bachelor's degree or higher.
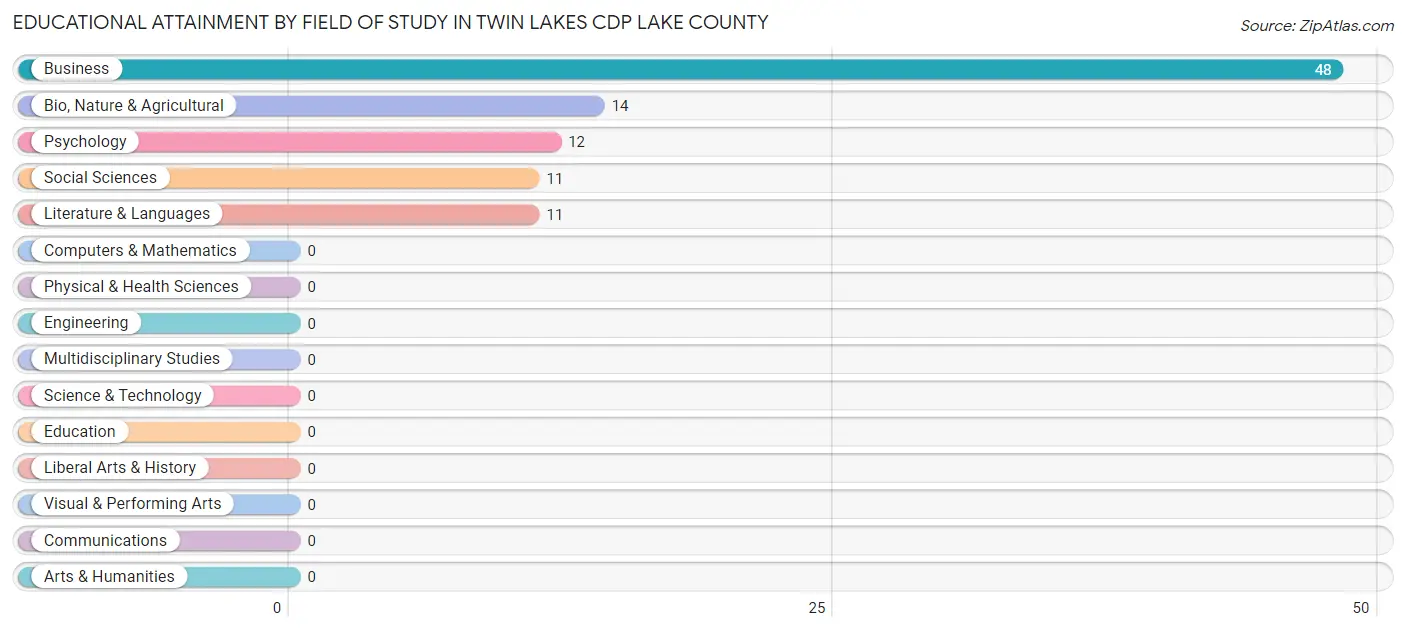
| Field of Study | # Graduates | % Graduates |
| Computers & Mathematics | 0 | 0.0% |
| Bio, Nature & Agricultural | 14 | 14.6% |
| Physical & Health Sciences | 0 | 0.0% |
| Psychology | 12 | 12.5% |
| Social Sciences | 11 | 11.5% |
| Engineering | 0 | 0.0% |
| Multidisciplinary Studies | 0 | 0.0% |
| Science & Technology | 0 | 0.0% |
| Business | 48 | 50.0% |
| Education | 0 | 0.0% |
| Literature & Languages | 11 | 11.5% |
| Liberal Arts & History | 0 | 0.0% |
| Visual & Performing Arts | 0 | 0.0% |
| Communications | 0 | 0.0% |
| Arts & Humanities | 0 | 0.0% |
| Total | 96 | 100.0% |
Transportation & Commute in Twin Lakes CDP Lake County
Vehicle Availability by Sex in Twin Lakes CDP Lake County
The most prevalent vehicle ownership categories in Twin Lakes CDP Lake County are males with 4 vehicles (80, accounting for 85.1%) and females with 4 vehicles (72, making up 90.9%).
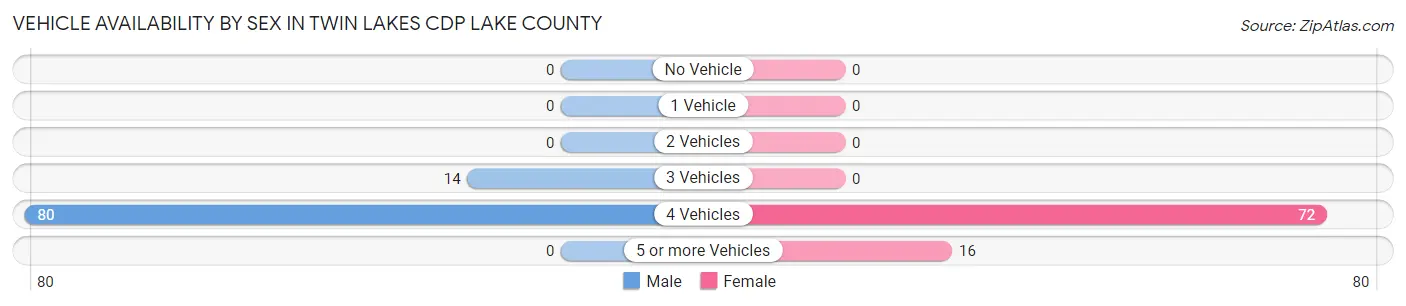
| Vehicles Available | Male | Female |
| No Vehicle | 0 (0.0%) | 0 (0.0%) |
| 1 Vehicle | 0 (0.0%) | 0 (0.0%) |
| 2 Vehicles | 0 (0.0%) | 0 (0.0%) |
| 3 Vehicles | 14 (14.9%) | 0 (0.0%) |
| 4 Vehicles | 80 (85.1%) | 72 (81.8%) |
| 5 or more Vehicles | 0 (0.0%) | 16 (18.2%) |
| Total | 94 (100.0%) | 88 (100.0%) |
Commute Time in Twin Lakes CDP Lake County
The most frequently occuring commute durations in Twin Lakes CDP Lake County are 60 to 89 minutes (77 commuters, 46.4%), 20 to 24 minutes (75 commuters, 45.2%), and 30 to 34 minutes (14 commuters, 8.4%).
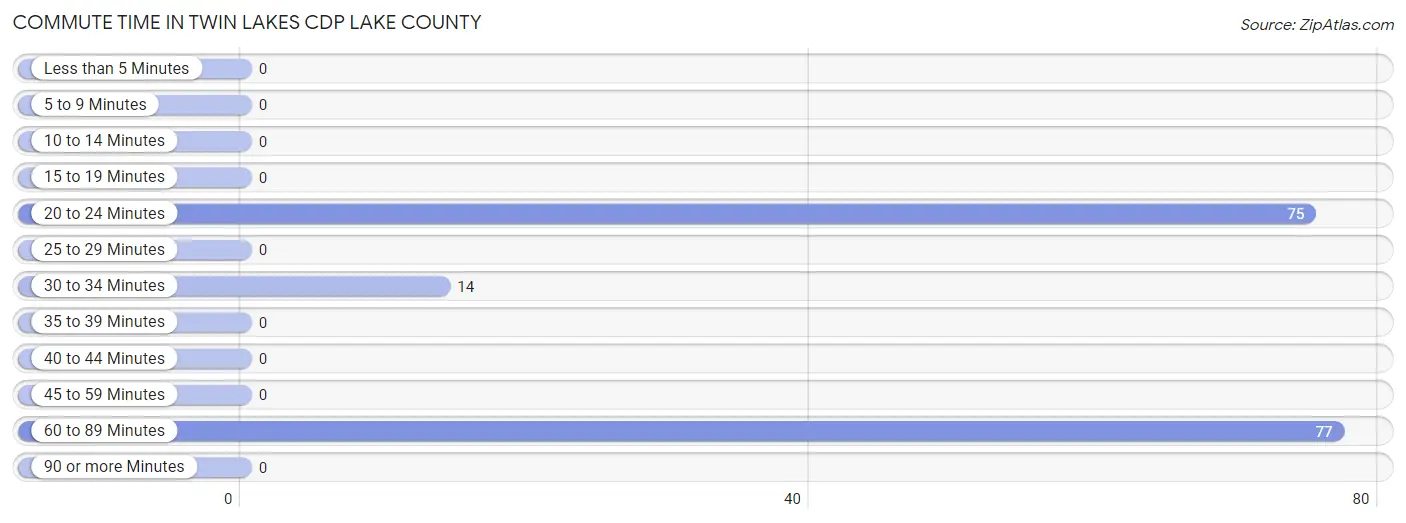
| Commute Time | # Commuters | % Commuters |
| Less than 5 Minutes | 0 | 0.0% |
| 5 to 9 Minutes | 0 | 0.0% |
| 10 to 14 Minutes | 0 | 0.0% |
| 15 to 19 Minutes | 0 | 0.0% |
| 20 to 24 Minutes | 75 | 45.2% |
| 25 to 29 Minutes | 0 | 0.0% |
| 30 to 34 Minutes | 14 | 8.4% |
| 35 to 39 Minutes | 0 | 0.0% |
| 40 to 44 Minutes | 0 | 0.0% |
| 45 to 59 Minutes | 0 | 0.0% |
| 60 to 89 Minutes | 77 | 46.4% |
| 90 or more Minutes | 0 | 0.0% |
Commute Time by Sex in Twin Lakes CDP Lake County
The most common commute times in Twin Lakes CDP Lake County are 20 to 24 minutes (47 commuters, 50.0%) for males and 60 to 89 minutes (44 commuters, 61.1%) for females.
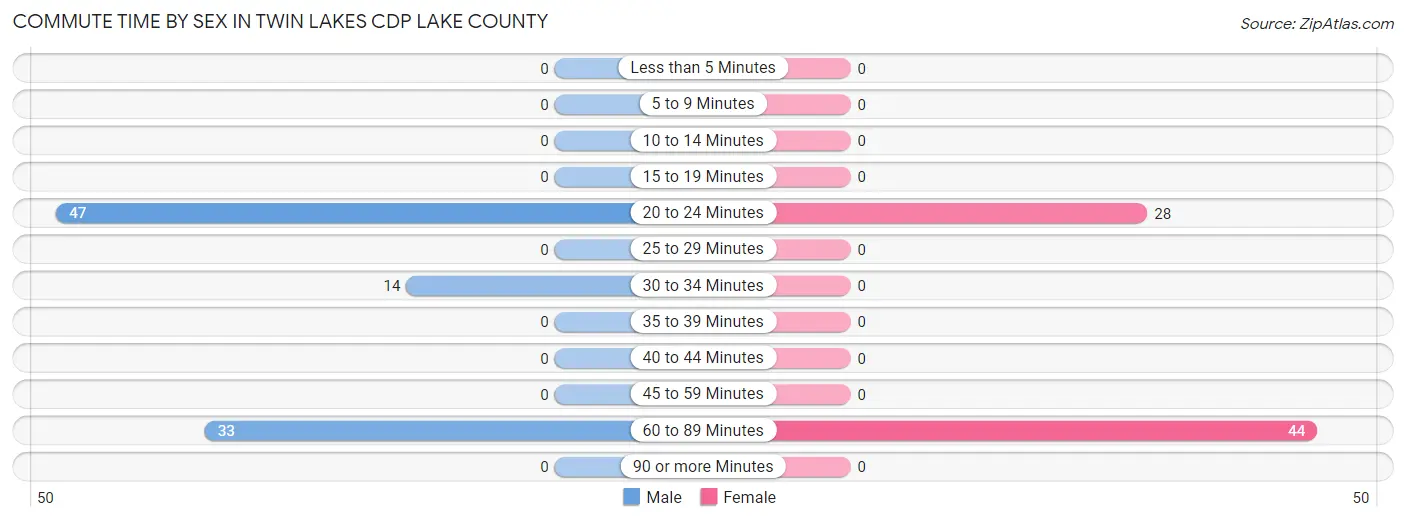
| Commute Time | Male | Female |
| Less than 5 Minutes | 0 (0.0%) | 0 (0.0%) |
| 5 to 9 Minutes | 0 (0.0%) | 0 (0.0%) |
| 10 to 14 Minutes | 0 (0.0%) | 0 (0.0%) |
| 15 to 19 Minutes | 0 (0.0%) | 0 (0.0%) |
| 20 to 24 Minutes | 47 (50.0%) | 28 (38.9%) |
| 25 to 29 Minutes | 0 (0.0%) | 0 (0.0%) |
| 30 to 34 Minutes | 14 (14.9%) | 0 (0.0%) |
| 35 to 39 Minutes | 0 (0.0%) | 0 (0.0%) |
| 40 to 44 Minutes | 0 (0.0%) | 0 (0.0%) |
| 45 to 59 Minutes | 0 (0.0%) | 0 (0.0%) |
| 60 to 89 Minutes | 33 (35.1%) | 44 (61.1%) |
| 90 or more Minutes | 0 (0.0%) | 0 (0.0%) |
Time of Departure to Work by Sex in Twin Lakes CDP Lake County
The most frequent times of departure to work in Twin Lakes CDP Lake County are 12:00 PM to 3:59 PM (47, 50.0%) for males and 5:30 AM to 5:59 AM (44, 61.1%) for females.
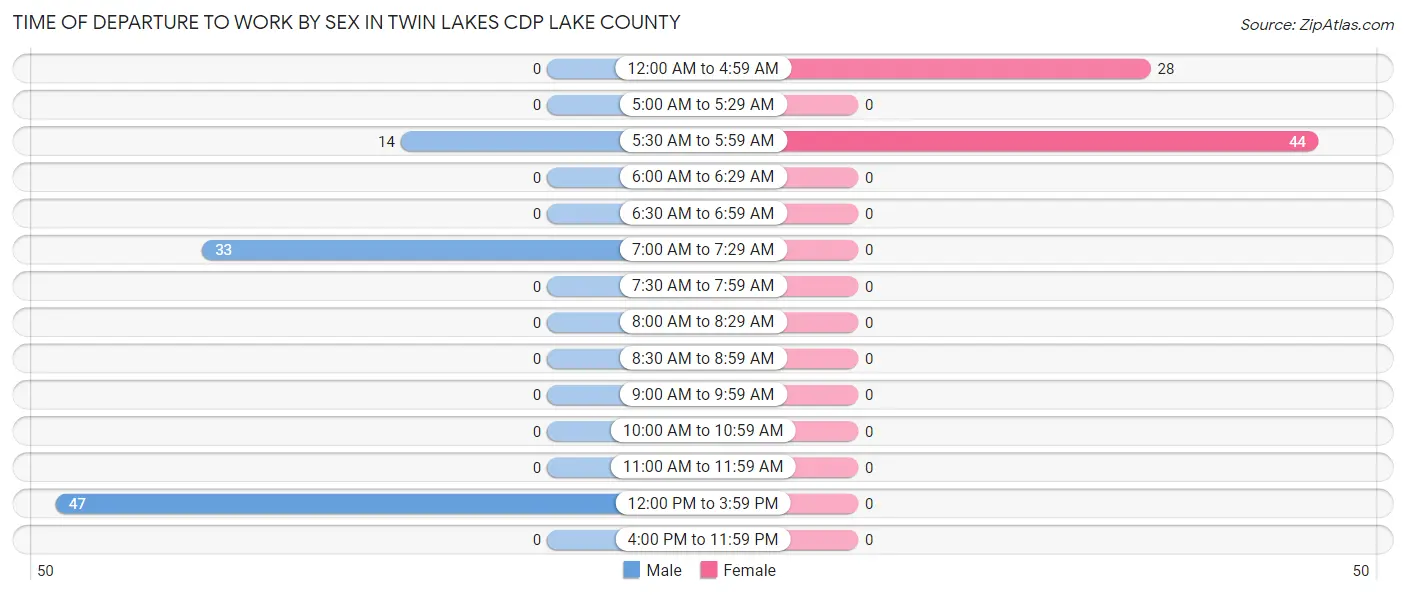
| Time of Departure | Male | Female |
| 12:00 AM to 4:59 AM | 0 (0.0%) | 28 (38.9%) |
| 5:00 AM to 5:29 AM | 0 (0.0%) | 0 (0.0%) |
| 5:30 AM to 5:59 AM | 14 (14.9%) | 44 (61.1%) |
| 6:00 AM to 6:29 AM | 0 (0.0%) | 0 (0.0%) |
| 6:30 AM to 6:59 AM | 0 (0.0%) | 0 (0.0%) |
| 7:00 AM to 7:29 AM | 33 (35.1%) | 0 (0.0%) |
| 7:30 AM to 7:59 AM | 0 (0.0%) | 0 (0.0%) |
| 8:00 AM to 8:29 AM | 0 (0.0%) | 0 (0.0%) |
| 8:30 AM to 8:59 AM | 0 (0.0%) | 0 (0.0%) |
| 9:00 AM to 9:59 AM | 0 (0.0%) | 0 (0.0%) |
| 10:00 AM to 10:59 AM | 0 (0.0%) | 0 (0.0%) |
| 11:00 AM to 11:59 AM | 0 (0.0%) | 0 (0.0%) |
| 12:00 PM to 3:59 PM | 47 (50.0%) | 0 (0.0%) |
| 4:00 PM to 11:59 PM | 0 (0.0%) | 0 (0.0%) |
| Total | 94 (100.0%) | 72 (100.0%) |
Housing Occupancy in Twin Lakes CDP Lake County
Occupancy by Ownership in Twin Lakes CDP Lake County
Of the total 169 dwellings in Twin Lakes CDP Lake County, owner-occupied units account for 169 (100.0%), while renter-occupied units make up 0 (0.0%).
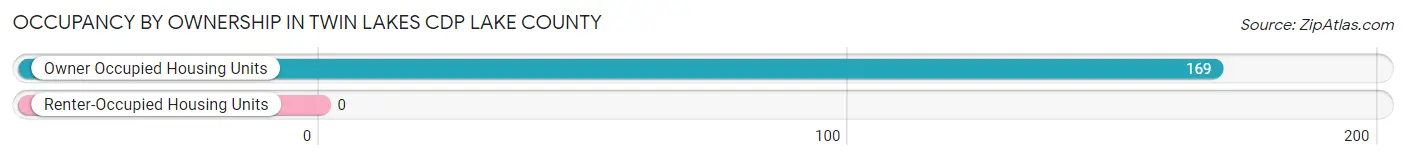
| Occupancy | # Housing Units | % Housing Units |
| Owner Occupied Housing Units | 169 | 100.0% |
| Renter-Occupied Housing Units | 0 | 0.0% |
| Total Occupied Housing Units | 169 | 100.0% |
Occupancy by Household Size in Twin Lakes CDP Lake County
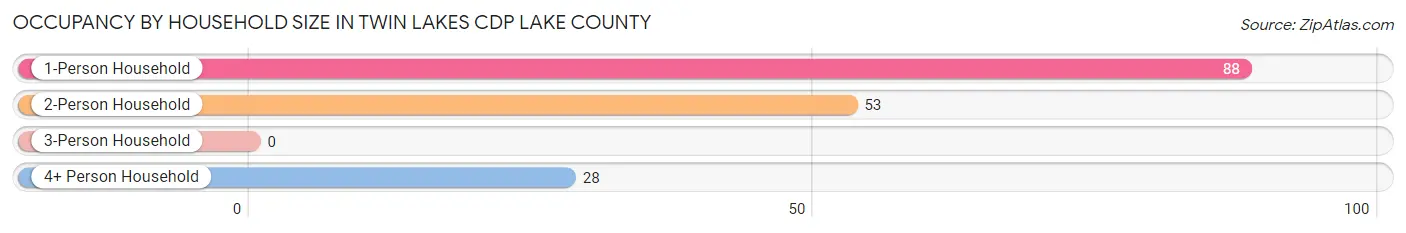
| Household Size | # Housing Units | % Housing Units |
| 1-Person Household | 88 | 52.1% |
| 2-Person Household | 53 | 31.4% |
| 3-Person Household | 0 | 0.0% |
| 4+ Person Household | 28 | 16.6% |
| Total Housing Units | 169 | 100.0% |
Occupancy by Ownership by Household Size in Twin Lakes CDP Lake County
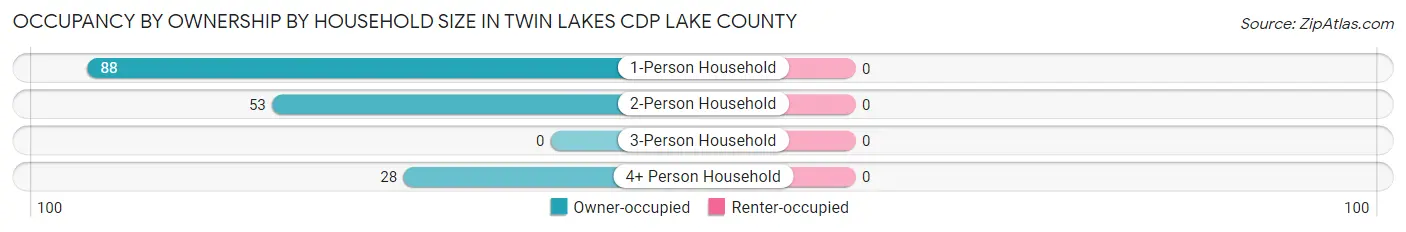
| Household Size | Owner-occupied | Renter-occupied |
| 1-Person Household | 88 (100.0%) | 0 (0.0%) |
| 2-Person Household | 53 (100.0%) | 0 (0.0%) |
| 3-Person Household | 0 (0.0%) | 0 (0.0%) |
| 4+ Person Household | 28 (100.0%) | 0 (0.0%) |
| Total Housing Units | 169 (100.0%) | 0 (0.0%) |
Occupancy by Educational Attainment in Twin Lakes CDP Lake County
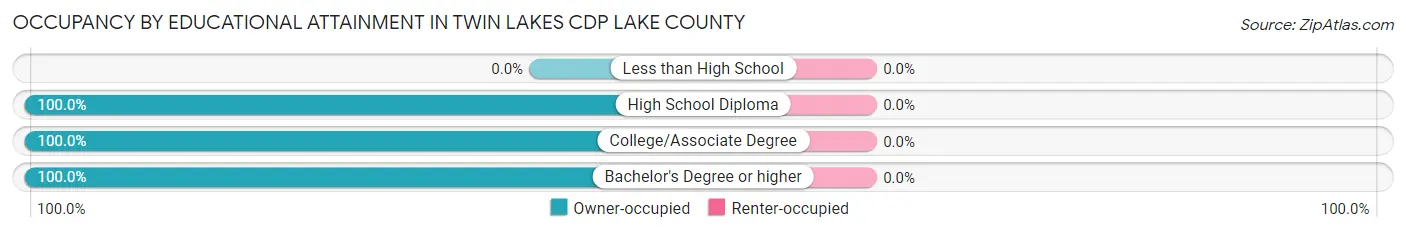
| Household Size | Owner-occupied | Renter-occupied |
| Less than High School | 0 (0.0%) | 0 (0.0%) |
| High School Diploma | 83 (100.0%) | 0 (0.0%) |
| College/Associate Degree | 21 (100.0%) | 0 (0.0%) |
| Bachelor's Degree or higher | 65 (100.0%) | 0 (0.0%) |
Occupancy by Age of Householder in Twin Lakes CDP Lake County
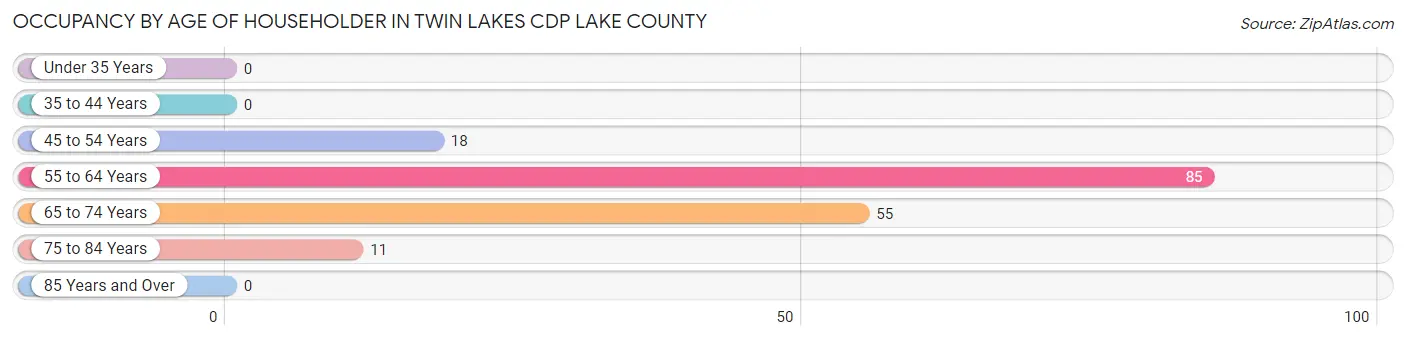
| Age Bracket | # Households | % Households |
| Under 35 Years | 0 | 0.0% |
| 35 to 44 Years | 0 | 0.0% |
| 45 to 54 Years | 18 | 10.6% |
| 55 to 64 Years | 85 | 50.3% |
| 65 to 74 Years | 55 | 32.5% |
| 75 to 84 Years | 11 | 6.5% |
| 85 Years and Over | 0 | 0.0% |
| Total | 169 | 100.0% |
Housing Finances in Twin Lakes CDP Lake County
Median Income by Occupancy in Twin Lakes CDP Lake County
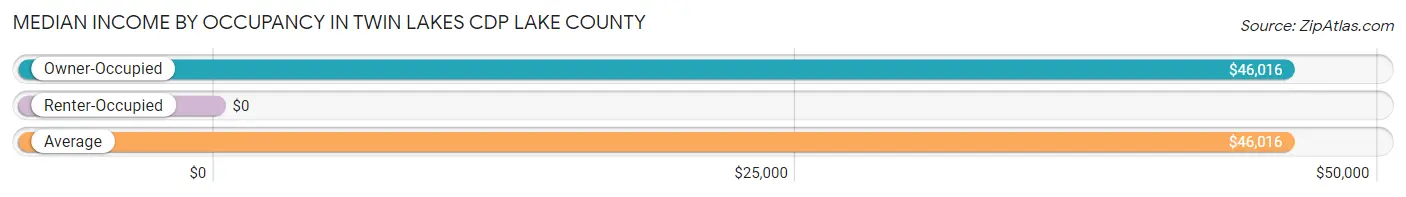
| Occupancy Type | # Households | Median Income |
| Owner-Occupied | 169 (100.0%) | $46,016 |
| Renter-Occupied | 0 (0.0%) | $0 |
| Average | 169 (100.0%) | $46,016 |
Occupancy by Householder Income Bracket in Twin Lakes CDP Lake County
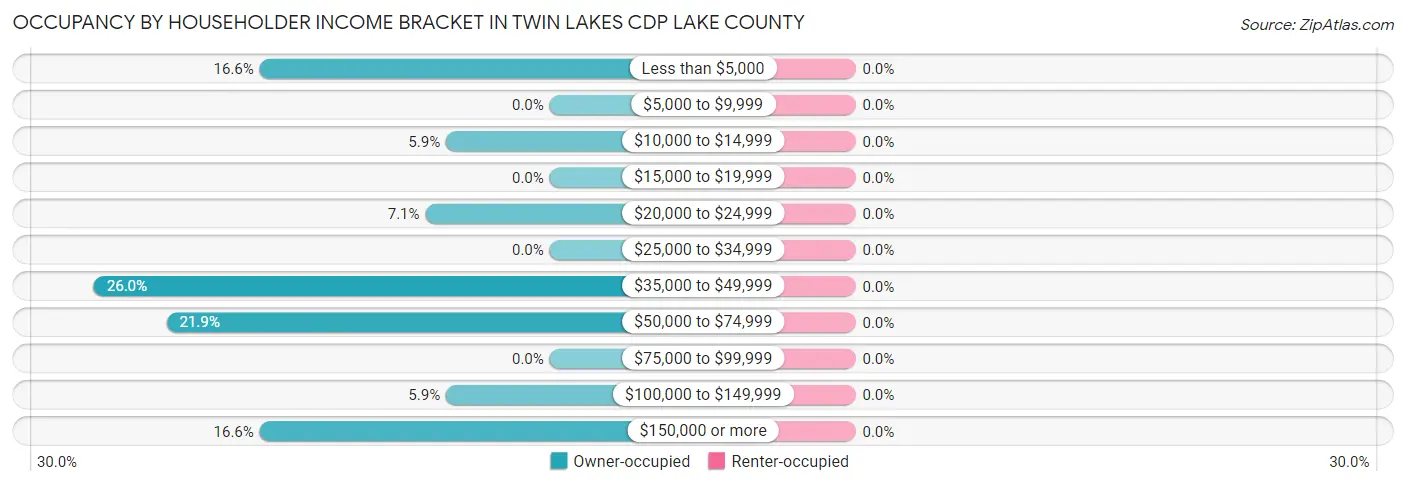
| Income Bracket | Owner-occupied | Renter-occupied |
| Less than $5,000 | 28 (16.6%) | 0 (0.0%) |
| $5,000 to $9,999 | 0 (0.0%) | 0 (0.0%) |
| $10,000 to $14,999 | 10 (5.9%) | 0 (0.0%) |
| $15,000 to $19,999 | 0 (0.0%) | 0 (0.0%) |
| $20,000 to $24,999 | 12 (7.1%) | 0 (0.0%) |
| $25,000 to $34,999 | 0 (0.0%) | 0 (0.0%) |
| $35,000 to $49,999 | 44 (26.0%) | 0 (0.0%) |
| $50,000 to $74,999 | 37 (21.9%) | 0 (0.0%) |
| $75,000 to $99,999 | 0 (0.0%) | 0 (0.0%) |
| $100,000 to $149,999 | 10 (5.9%) | 0 (0.0%) |
| $150,000 or more | 28 (16.6%) | 0 (0.0%) |
| Total | 169 (100.0%) | 0 (0.0%) |
Monthly Housing Cost Tiers in Twin Lakes CDP Lake County
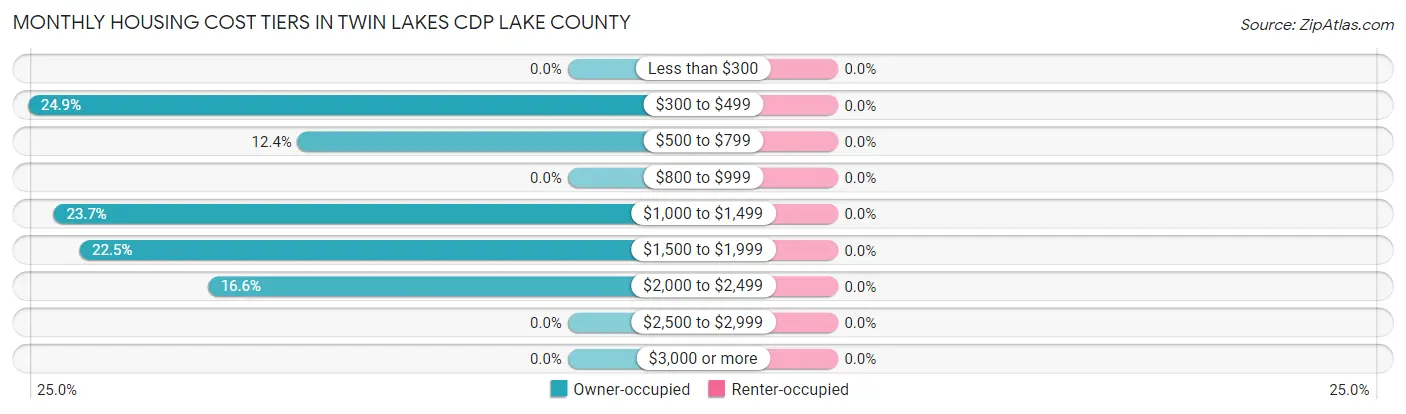
| Monthly Cost | Owner-occupied | Renter-occupied |
| Less than $300 | 0 (0.0%) | 0 (0.0%) |
| $300 to $499 | 42 (24.8%) | 0 (0.0%) |
| $500 to $799 | 21 (12.4%) | 0 (0.0%) |
| $800 to $999 | 0 (0.0%) | 0 (0.0%) |
| $1,000 to $1,499 | 40 (23.7%) | 0 (0.0%) |
| $1,500 to $1,999 | 38 (22.5%) | 0 (0.0%) |
| $2,000 to $2,499 | 28 (16.6%) | 0 (0.0%) |
| $2,500 to $2,999 | 0 (0.0%) | 0 (0.0%) |
| $3,000 or more | 0 (0.0%) | 0 (0.0%) |
| Total | 169 (100.0%) | 0 (0.0%) |
Physical Housing Characteristics in Twin Lakes CDP Lake County
Housing Structures in Twin Lakes CDP Lake County
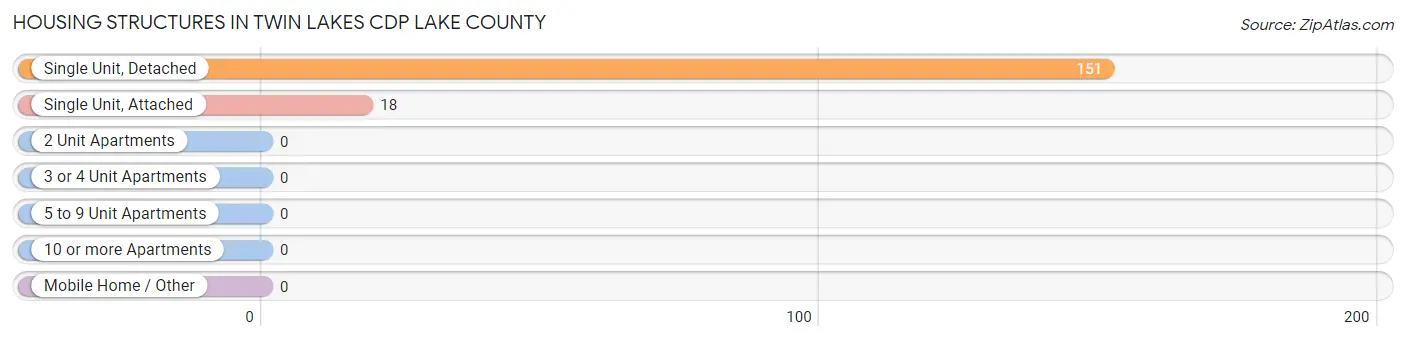
| Structure Type | # Housing Units | % Housing Units |
| Single Unit, Detached | 151 | 89.3% |
| Single Unit, Attached | 18 | 10.6% |
| 2 Unit Apartments | 0 | 0.0% |
| 3 or 4 Unit Apartments | 0 | 0.0% |
| 5 to 9 Unit Apartments | 0 | 0.0% |
| 10 or more Apartments | 0 | 0.0% |
| Mobile Home / Other | 0 | 0.0% |
| Total | 169 | 100.0% |
Housing Structures by Occupancy in Twin Lakes CDP Lake County
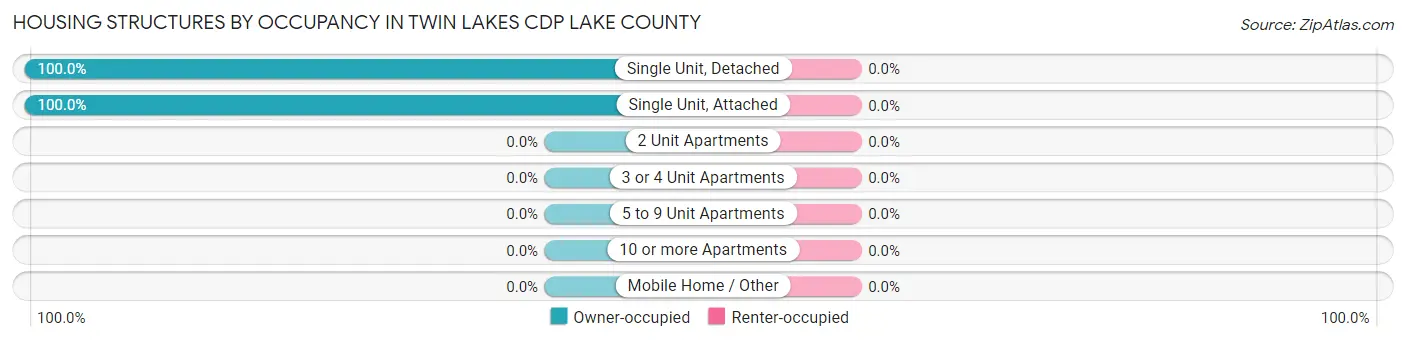
| Structure Type | Owner-occupied | Renter-occupied |
| Single Unit, Detached | 151 (100.0%) | 0 (0.0%) |
| Single Unit, Attached | 18 (100.0%) | 0 (0.0%) |
| 2 Unit Apartments | 0 (0.0%) | 0 (0.0%) |
| 3 or 4 Unit Apartments | 0 (0.0%) | 0 (0.0%) |
| 5 to 9 Unit Apartments | 0 (0.0%) | 0 (0.0%) |
| 10 or more Apartments | 0 (0.0%) | 0 (0.0%) |
| Mobile Home / Other | 0 (0.0%) | 0 (0.0%) |
| Total | 169 (100.0%) | 0 (0.0%) |
Housing Structures by Number of Rooms in Twin Lakes CDP Lake County
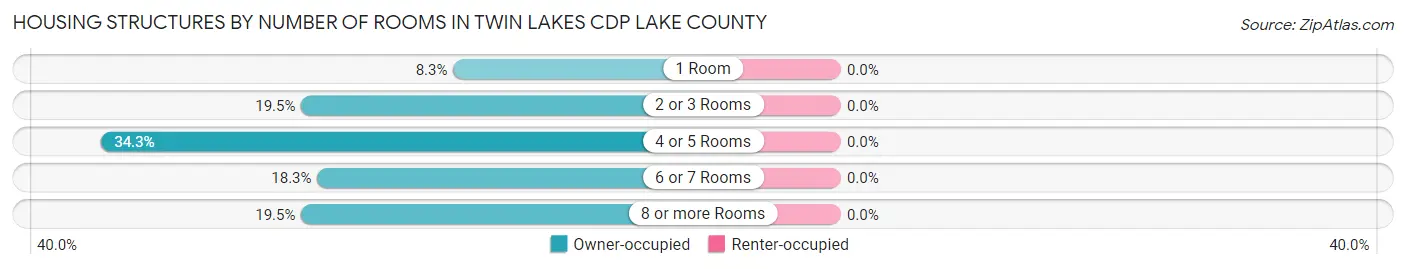
| Number of Rooms | Owner-occupied | Renter-occupied |
| 1 Room | 14 (8.3%) | 0 (0.0%) |
| 2 or 3 Rooms | 33 (19.5%) | 0 (0.0%) |
| 4 or 5 Rooms | 58 (34.3%) | 0 (0.0%) |
| 6 or 7 Rooms | 31 (18.3%) | 0 (0.0%) |
| 8 or more Rooms | 33 (19.5%) | 0 (0.0%) |
| Total | 169 (100.0%) | 0 (0.0%) |
Housing Structure by Heating Type in Twin Lakes CDP Lake County
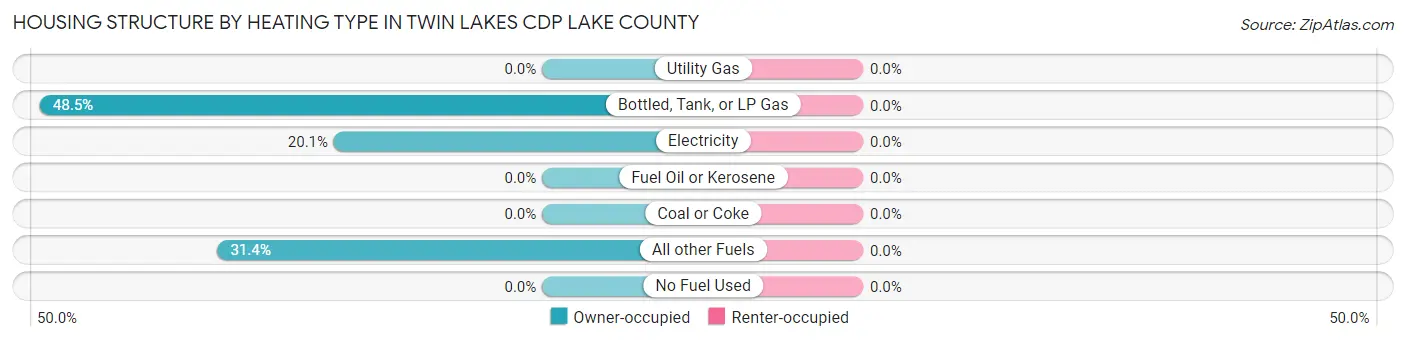
| Heating Type | Owner-occupied | Renter-occupied |
| Utility Gas | 0 (0.0%) | 0 (0.0%) |
| Bottled, Tank, or LP Gas | 82 (48.5%) | 0 (0.0%) |
| Electricity | 34 (20.1%) | 0 (0.0%) |
| Fuel Oil or Kerosene | 0 (0.0%) | 0 (0.0%) |
| Coal or Coke | 0 (0.0%) | 0 (0.0%) |
| All other Fuels | 53 (31.4%) | 0 (0.0%) |
| No Fuel Used | 0 (0.0%) | 0 (0.0%) |
| Total | 169 (100.0%) | 0 (0.0%) |
Household Vehicle Usage in Twin Lakes CDP Lake County
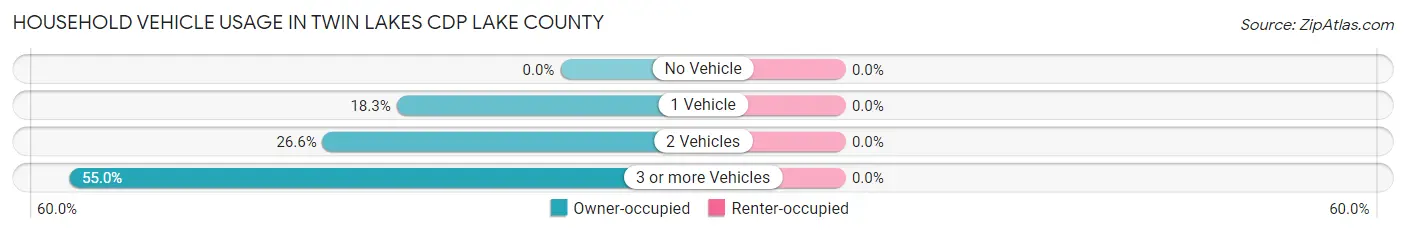
| Vehicles per Household | Owner-occupied | Renter-occupied |
| No Vehicle | 0 (0.0%) | 0 (0.0%) |
| 1 Vehicle | 31 (18.3%) | 0 (0.0%) |
| 2 Vehicles | 45 (26.6%) | 0 (0.0%) |
| 3 or more Vehicles | 93 (55.0%) | 0 (0.0%) |
| Total | 169 (100.0%) | 0 (0.0%) |
Real Estate & Mortgages in Twin Lakes CDP Lake County
Real Estate and Mortgage Overview in Twin Lakes CDP Lake County
| Characteristic | Without Mortgage | With Mortgage |
| Housing Units | 85 | 84 |
| Median Property Value | - | - |
| Median Household Income | - | - |
| Monthly Housing Costs | - | - |
| Real Estate Taxes | $1,508 | $0 |
Property Value by Mortgage Status in Twin Lakes CDP Lake County
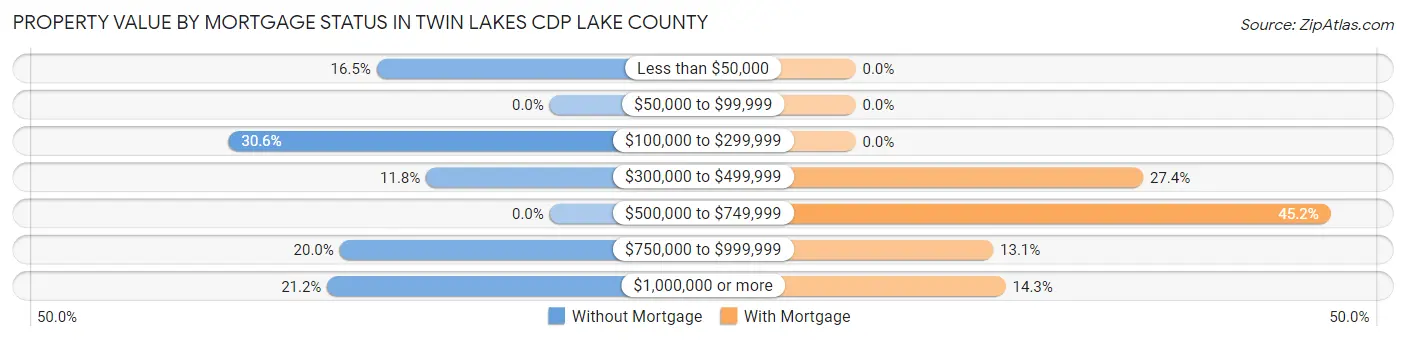
| Property Value | Without Mortgage | With Mortgage |
| Less than $50,000 | 14 (16.5%) | 0 (0.0%) |
| $50,000 to $99,999 | 0 (0.0%) | 0 (0.0%) |
| $100,000 to $299,999 | 26 (30.6%) | 0 (0.0%) |
| $300,000 to $499,999 | 10 (11.8%) | 23 (27.4%) |
| $500,000 to $749,999 | 0 (0.0%) | 38 (45.2%) |
| $750,000 to $999,999 | 17 (20.0%) | 11 (13.1%) |
| $1,000,000 or more | 18 (21.2%) | 12 (14.3%) |
| Total | 85 (100.0%) | 84 (100.0%) |
Household Income by Mortgage Status in Twin Lakes CDP Lake County
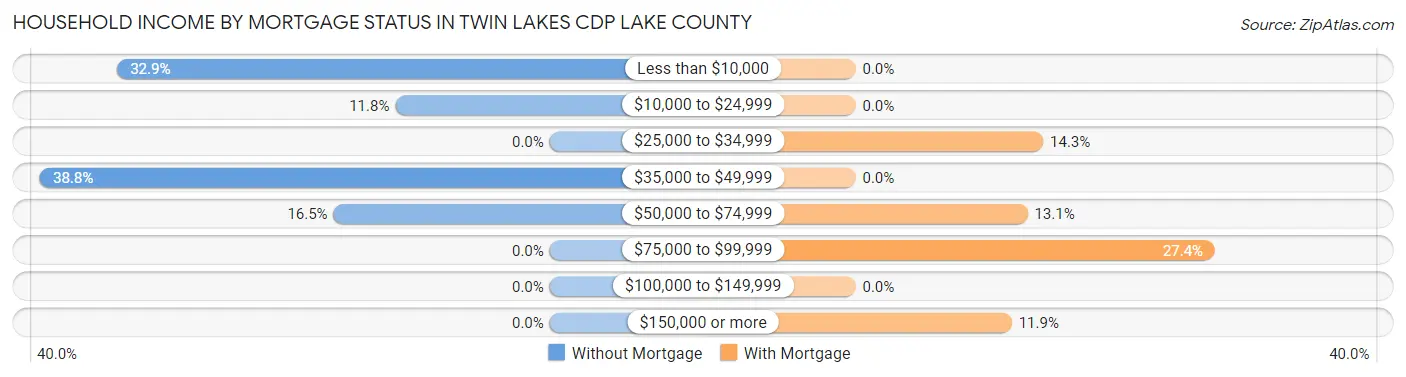
| Household Income | Without Mortgage | With Mortgage |
| Less than $10,000 | 28 (32.9%) | 0 (0.0%) |
| $10,000 to $24,999 | 10 (11.8%) | 0 (0.0%) |
| $25,000 to $34,999 | 0 (0.0%) | 12 (14.3%) |
| $35,000 to $49,999 | 33 (38.8%) | 0 (0.0%) |
| $50,000 to $74,999 | 14 (16.5%) | 11 (13.1%) |
| $75,000 to $99,999 | 0 (0.0%) | 23 (27.4%) |
| $100,000 to $149,999 | 0 (0.0%) | 0 (0.0%) |
| $150,000 or more | 0 (0.0%) | 10 (11.9%) |
| Total | 85 (100.0%) | 84 (100.0%) |
Property Value to Household Income Ratio in Twin Lakes CDP Lake County
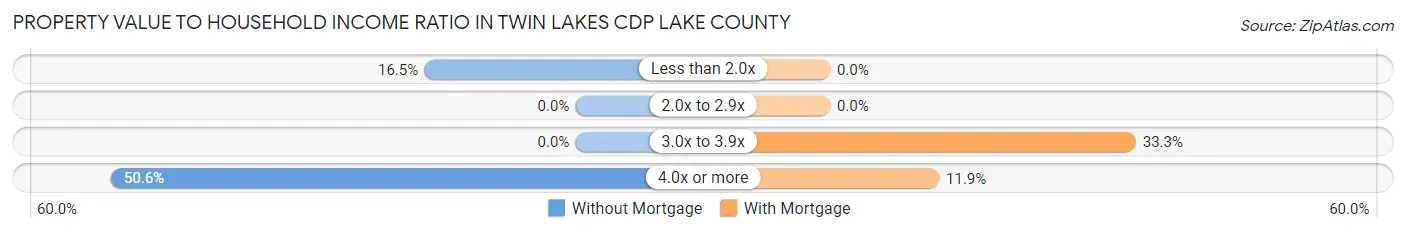
| Value-to-Income Ratio | Without Mortgage | With Mortgage |
| Less than 2.0x | 14 (16.5%) | 0 (0.0%) |
| 2.0x to 2.9x | 0 (0.0%) | 0 (0.0%) |
| 3.0x to 3.9x | 0 (0.0%) | 28 (33.3%) |
| 4.0x or more | 43 (50.6%) | 10 (11.9%) |
| Total | 85 (100.0%) | 84 (100.0%) |
Real Estate Taxes by Mortgage Status in Twin Lakes CDP Lake County
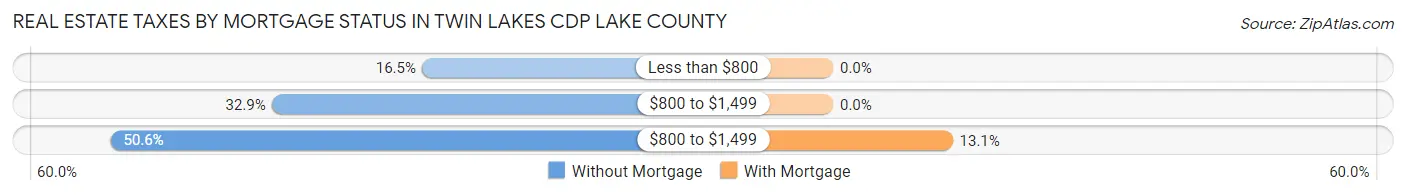
| Property Taxes | Without Mortgage | With Mortgage |
| Less than $800 | 14 (16.5%) | 0 (0.0%) |
| $800 to $1,499 | 28 (32.9%) | 0 (0.0%) |
| $800 to $1,499 | 43 (50.6%) | 11 (13.1%) |
| Total | 85 (100.0%) | 84 (100.0%) |
Health & Disability in Twin Lakes CDP Lake County
Health Insurance Coverage by Age in Twin Lakes CDP Lake County
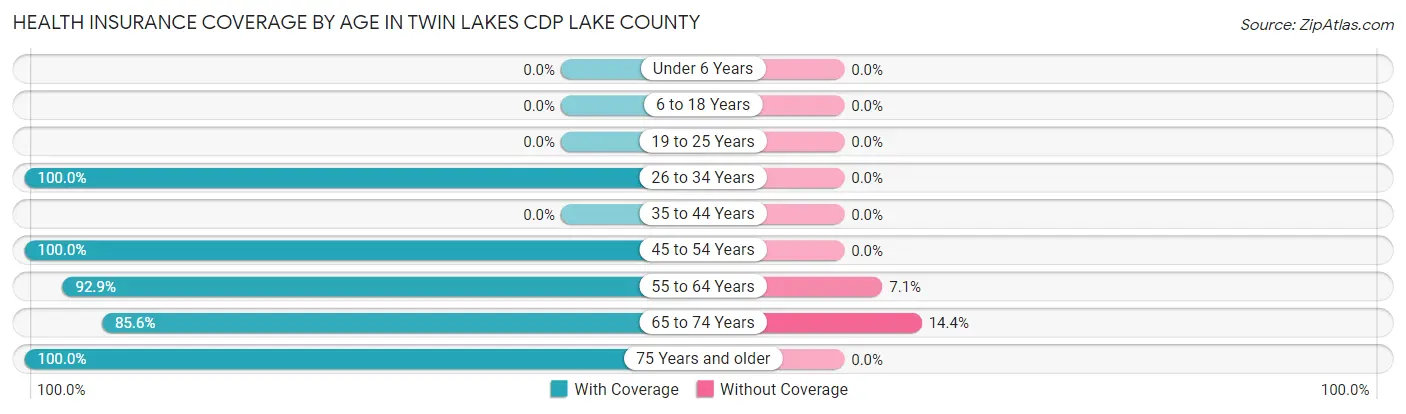
| Age Bracket | With Coverage | Without Coverage |
| Under 6 Years | 0 (0.0%) | 0 (0.0%) |
| 6 to 18 Years | 0 (0.0%) | 0 (0.0%) |
| 19 to 25 Years | 0 (0.0%) | 0 (0.0%) |
| 26 to 34 Years | 77 (100.0%) | 0 (0.0%) |
| 35 to 44 Years | 0 (0.0%) | 0 (0.0%) |
| 45 to 54 Years | 18 (100.0%) | 0 (0.0%) |
| 55 to 64 Years | 131 (92.9%) | 10 (7.1%) |
| 65 to 74 Years | 77 (85.6%) | 13 (14.4%) |
| 75 Years and older | 22 (100.0%) | 0 (0.0%) |
| Total | 325 (93.4%) | 23 (6.6%) |
Health Insurance Coverage by Citizenship Status in Twin Lakes CDP Lake County
| Citizenship Status | With Coverage | Without Coverage |
| Native Born | 0 (0.0%) | 0 (0.0%) |
| Foreign Born, Citizen | 0 (0.0%) | 0 (0.0%) |
| Foreign Born, not a Citizen | 0 (0.0%) | 0 (0.0%) |
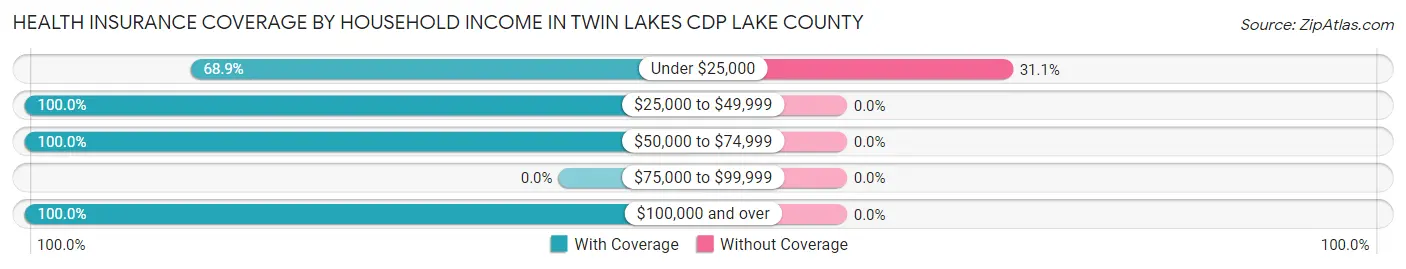
Health Insurance Coverage by Household Income in Twin Lakes CDP Lake County
| Household Income | With Coverage | Without Coverage |
| Under $25,000 | 51 (68.9%) | 23 (31.1%) |
| $25,000 to $49,999 | 44 (100.0%) | 0 (0.0%) |
| $50,000 to $74,999 | 57 (100.0%) | 0 (0.0%) |
| $75,000 to $99,999 | 0 (0.0%) | 0 (0.0%) |
| $100,000 and over | 173 (100.0%) | 0 (0.0%) |
Public vs Private Health Insurance Coverage by Age in Twin Lakes CDP Lake County
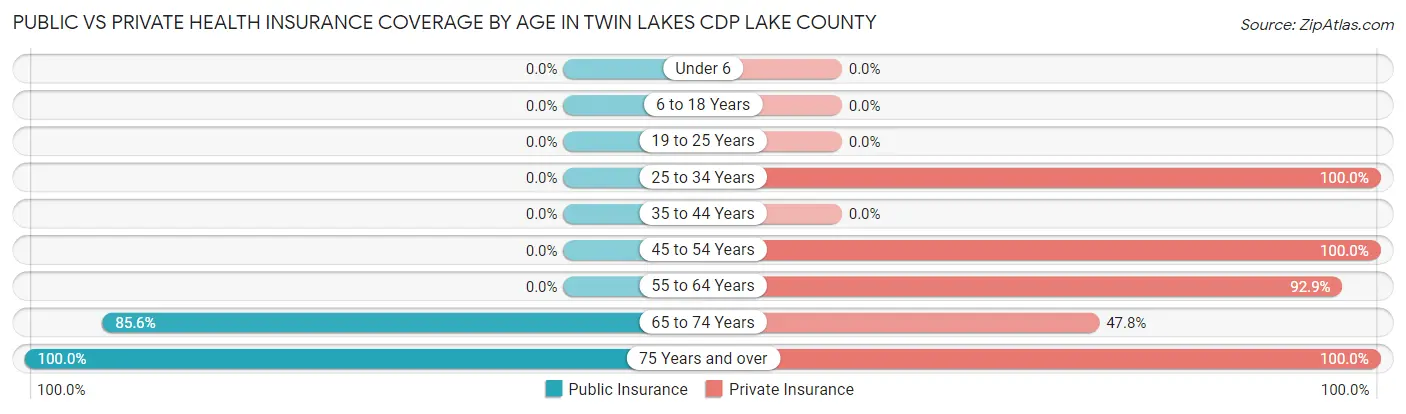
| Age Bracket | Public Insurance | Private Insurance |
| Under 6 | 0 (0.0%) | 0 (0.0%) |
| 6 to 18 Years | 0 (0.0%) | 0 (0.0%) |
| 19 to 25 Years | 0 (0.0%) | 0 (0.0%) |
| 25 to 34 Years | 0 (0.0%) | 77 (100.0%) |
| 35 to 44 Years | 0 (0.0%) | 0 (0.0%) |
| 45 to 54 Years | 0 (0.0%) | 18 (100.0%) |
| 55 to 64 Years | 0 (0.0%) | 131 (92.9%) |
| 65 to 74 Years | 77 (85.6%) | 43 (47.8%) |
| 75 Years and over | 22 (100.0%) | 22 (100.0%) |
| Total | 99 (28.4%) | 291 (83.6%) |
Disability Status by Sex by Age in Twin Lakes CDP Lake County
| Age Bracket | Male | Female |
| Under 5 Years | 0 (0.0%) | 0 (0.0%) |
| 5 to 17 Years | 0 (0.0%) | 0 (0.0%) |
| 18 to 34 Years | 0 (0.0%) | 0 (0.0%) |
| 35 to 64 Years | 0 (0.0%) | 0 (0.0%) |
| 65 to 74 Years | 0 (0.0%) | 0 (0.0%) |
| 75 Years and over | 0 (0.0%) | 0 (0.0%) |
Disability Class by Sex by Age in Twin Lakes CDP Lake County
Disability Class: Hearing Difficulty
| Age Bracket | Male | Female |
| Under 5 Years | 0 (0.0%) | 0 (0.0%) |
| 5 to 17 Years | 0 (0.0%) | 0 (0.0%) |
| 18 to 34 Years | 0 (0.0%) | 0 (0.0%) |
| 35 to 64 Years | 0 (0.0%) | 0 (0.0%) |
| 65 to 74 Years | 0 (0.0%) | 0 (0.0%) |
| 75 Years and over | 0 (0.0%) | 0 (0.0%) |
Disability Class: Vision Difficulty
| Age Bracket | Male | Female |
| Under 5 Years | 0 (0.0%) | 0 (0.0%) |
| 5 to 17 Years | 0 (0.0%) | 0 (0.0%) |
| 18 to 34 Years | 0 (0.0%) | 0 (0.0%) |
| 35 to 64 Years | 0 (0.0%) | 0 (0.0%) |
| 65 to 74 Years | 0 (0.0%) | 0 (0.0%) |
| 75 Years and over | 0 (0.0%) | 0 (0.0%) |
Disability Class: Cognitive Difficulty
| Age Bracket | Male | Female |
| 5 to 17 Years | 0 (0.0%) | 0 (0.0%) |
| 18 to 34 Years | 0 (0.0%) | 0 (0.0%) |
| 35 to 64 Years | 0 (0.0%) | 0 (0.0%) |
| 65 to 74 Years | 0 (0.0%) | 0 (0.0%) |
| 75 Years and over | 0 (0.0%) | 0 (0.0%) |
Disability Class: Ambulatory Difficulty
| Age Bracket | Male | Female |
| 5 to 17 Years | 0 (0.0%) | 0 (0.0%) |
| 18 to 34 Years | 0 (0.0%) | 0 (0.0%) |
| 35 to 64 Years | 0 (0.0%) | 0 (0.0%) |
| 65 to 74 Years | 0 (0.0%) | 0 (0.0%) |
| 75 Years and over | 0 (0.0%) | 0 (0.0%) |
Disability Class: Self-Care Difficulty

| Age Bracket | Male | Female |
| 5 to 17 Years | 0 (0.0%) | 0 (0.0%) |
| 18 to 34 Years | 0 (0.0%) | 0 (0.0%) |
| 35 to 64 Years | 0 (0.0%) | 0 (0.0%) |
| 65 to 74 Years | 0 (0.0%) | 0 (0.0%) |
| 75 Years and over | 0 (0.0%) | 0 (0.0%) |
Technology Access in Twin Lakes CDP Lake County
Computing Device Access in Twin Lakes CDP Lake County
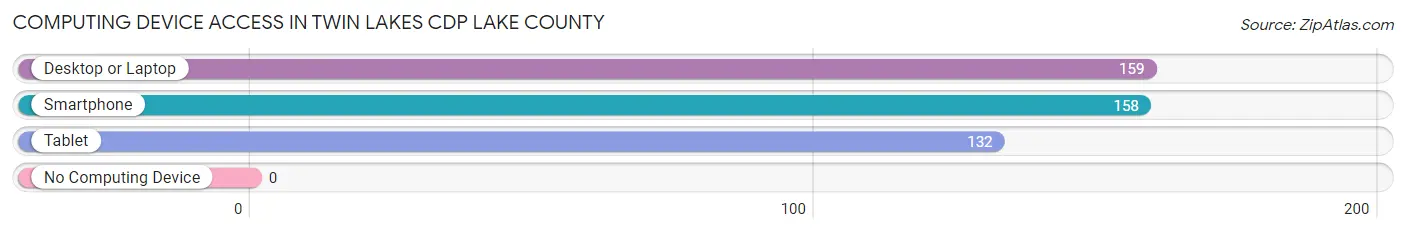
| Device Type | # Households | % Households |
| Desktop or Laptop | 159 | 94.1% |
| Smartphone | 158 | 93.5% |
| Tablet | 132 | 78.1% |
| No Computing Device | 0 | 0.0% |
| Total | 169 | 100.0% |
Internet Access in Twin Lakes CDP Lake County
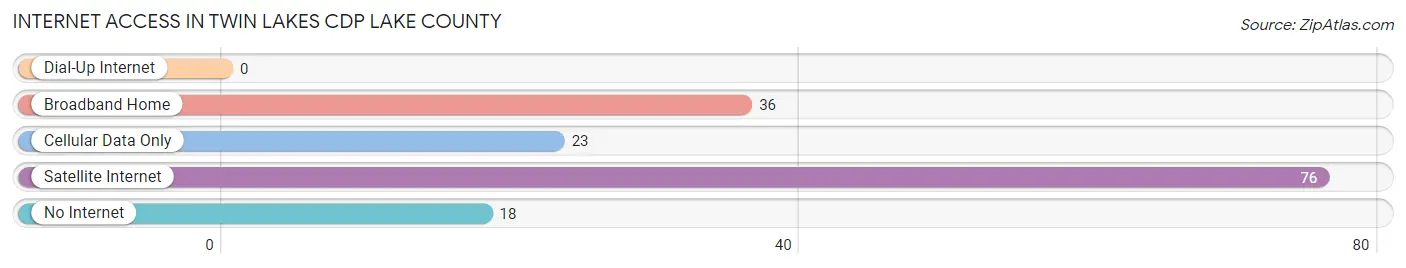
| Internet Type | # Households | % Households |
| Dial-Up Internet | 0 | 0.0% |
| Broadband Home | 36 | 21.3% |
| Cellular Data Only | 23 | 13.6% |
| Satellite Internet | 76 | 45.0% |
| No Internet | 18 | 10.6% |
| Total | 169 | 100.0% |
Twin Lakes CDP Lake County Summary
Twin Lakes Cdp is a census-designated place (CDP) located in Lake County, Colorado. It is situated in the heart of the Rocky Mountains, at an elevation of 8,945 feet. The CDP is located in the San Isabel National Forest and is surrounded by the Twin Lakes Reservoir, which is part of the Arkansas River headwaters. The area is known for its stunning views of the surrounding mountains and its abundance of outdoor recreational activities.
History
The area now known as Twin Lakes Cdp has been inhabited for thousands of years. The Ute people were the first to inhabit the area, followed by the Arapaho and Cheyenne tribes. The area was first explored by Europeans in the late 1700s, and the first settlers arrived in the early 1800s. The area was originally known as Twin Lakes, named for the two large lakes in the area. The area was officially established as a CDP in 2000.
Geography
Twin Lakes Cdp is located in the San Isabel National Forest in Lake County, Colorado. It is situated at an elevation of 8,945 feet and is surrounded by the Twin Lakes Reservoir. The area is known for its stunning views of the surrounding mountains, including Mount Elbert, the highest peak in Colorado. The area is also home to several other lakes, including Turquoise Lake, Twin Lakes Reservoir, and Lake San Cristobal.
The climate in Twin Lakes Cdp is generally mild, with warm summers and cold winters. The average annual temperature is around 40 degrees Fahrenheit, with temperatures ranging from the low 20s in the winter to the mid-80s in the summer. The area receives an average of around 20 inches of precipitation per year, with most of it falling in the form of snow.
Economy
The economy of Twin Lakes Cdp is largely based on tourism and outdoor recreation. The area is home to several popular tourist attractions, including the Twin Lakes Reservoir, Turquoise Lake, and Lake San Cristobal. The area is also popular for its abundance of outdoor recreational activities, such as fishing, camping, hiking, and mountain biking.
The area is also home to several businesses, including restaurants, lodging, and retail stores. The area is also home to several small farms and ranches, which produce a variety of products, including hay, beef, and dairy products.
Demographics
As of the 2010 census, the population of Twin Lakes Cdp was 1,093. The population is largely white (94.3%), with small percentages of Hispanic (2.2%), Native American (1.2%), and African American (0.7%) residents. The median household income is $50,000, and the median age is 44. The area is largely rural, with most of the population living in single-family homes.
Conclusion
Twin Lakes Cdp is a census-designated place located in Lake County, Colorado. It is situated in the heart of the Rocky Mountains, at an elevation of 8,945 feet. The area is known for its stunning views of the surrounding mountains and its abundance of outdoor recreational activities. The economy of Twin Lakes Cdp is largely based on tourism and outdoor recreation, and the population is largely white. The area is also home to several businesses, farms, and ranches, which produce a variety of products.
Common Questions
What is Per Capita Income in Twin Lakes CDP Lake County?
Per Capita income in Twin Lakes CDP Lake County is $36,782.
What is the Median Household income in Twin Lakes CDP Lake County?
Median Household Income in Twin Lakes CDP Lake County is $46,016.
What is Income or Wage Gap in Twin Lakes CDP Lake County?
Income or Wage Gap in Twin Lakes CDP Lake County is 52.4%.
Women in Twin Lakes CDP Lake County earn 47.6 cents for every dollar earned by a man.
What is Inequality or Gini Index in Twin Lakes CDP Lake County?
Inequality or Gini Index in Twin Lakes CDP Lake County is 0.47.
What is the Total Population of Twin Lakes CDP Lake County?
Total Population of Twin Lakes CDP Lake County is 348.
What is the Total Male Population of Twin Lakes CDP Lake County?
Total Male Population of Twin Lakes CDP Lake County is 167.
What is the Total Female Population of Twin Lakes CDP Lake County?
Total Female Population of Twin Lakes CDP Lake County is 181.
What is the Ratio of Males per 100 Females in Twin Lakes CDP Lake County?
There are 92.27 Males per 100 Females in Twin Lakes CDP Lake County.
What is the Ratio of Females per 100 Males in Twin Lakes CDP Lake County?
There are 108.38 Females per 100 Males in Twin Lakes CDP Lake County.
What is the Median Population Age in Twin Lakes CDP Lake County?
Median Population Age in Twin Lakes CDP Lake County is 63.2 Years.
What is the Average Family Size in Twin Lakes CDP Lake County
Average Family Size in Twin Lakes CDP Lake County is 3.2 People.
What is the Average Household Size in Twin Lakes CDP Lake County
Average Household Size in Twin Lakes CDP Lake County is 2.1 People.
How Large is the Labor Force in Twin Lakes CDP Lake County?
There are 182 People in the Labor Forcein in Twin Lakes CDP Lake County.
What is the Percentage of People in the Labor Force in Twin Lakes CDP Lake County?
52.3% of People are in the Labor Force in Twin Lakes CDP Lake County.