Bayfield, CO Map & Demographics
Bayfield Map
Bayfield Overview
$38,039
PER CAPITA INCOME
$92,176
AVG FAMILY INCOME
$84,609
AVG HOUSEHOLD INCOME
19.3%
WAGE / INCOME GAP [ % ]
80.7¢/ $1
WAGE / INCOME GAP [ $ ]
$7,294
FAMILY INCOME DEFICIT
0.34
INEQUALITY / GINI INDEX
2,853
TOTAL POPULATION
1,484
MALE POPULATION
1,369
FEMALE POPULATION
108.40
MALES / 100 FEMALES
92.25
FEMALES / 100 MALES
32.6
MEDIAN AGE
3.4
AVG FAMILY SIZE
2.8
AVG HOUSEHOLD SIZE
1,592
LABOR FORCE [ PEOPLE ]
78.3%
PERCENT IN LABOR FORCE
5.9%
UNEMPLOYMENT RATE
Bayfield Zip Codes
Bayfield Area Codes
Income in Bayfield
Income Overview in Bayfield
Per Capita Income in Bayfield is $38,039, while median incomes of families and households are $92,176 and $84,609 respectively.
| Characteristic | Number | Measure |
| Per Capita Income | 2,853 | $38,039 |
| Median Family Income | 676 | $92,176 |
| Mean Family Income | 676 | $110,604 |
| Median Household Income | 1,017 | $84,609 |
| Mean Household Income | 1,017 | $100,699 |
| Income Deficit | 676 | $7,294 |
| Wage / Income Gap (%) | 2,853 | 19.26% |
| Wage / Income Gap ($) | 2,853 | 80.74¢ per $1 |
| Gini / Inequality Index | 2,853 | 0.34 |
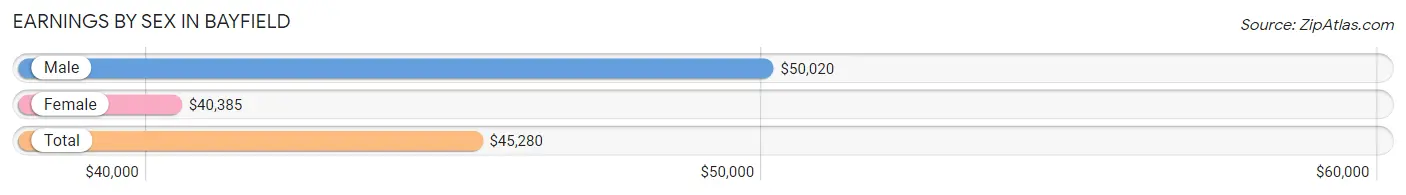
Earnings by Sex in Bayfield
Average Earnings in Bayfield are $45,280, $50,020 for men and $40,385 for women, a difference of 19.3%.
| Sex | Number | Average Earnings |
| Male | 799 (50.7%) | $50,020 |
| Female | 776 (49.3%) | $40,385 |
| Total | 1,575 (100.0%) | $45,280 |
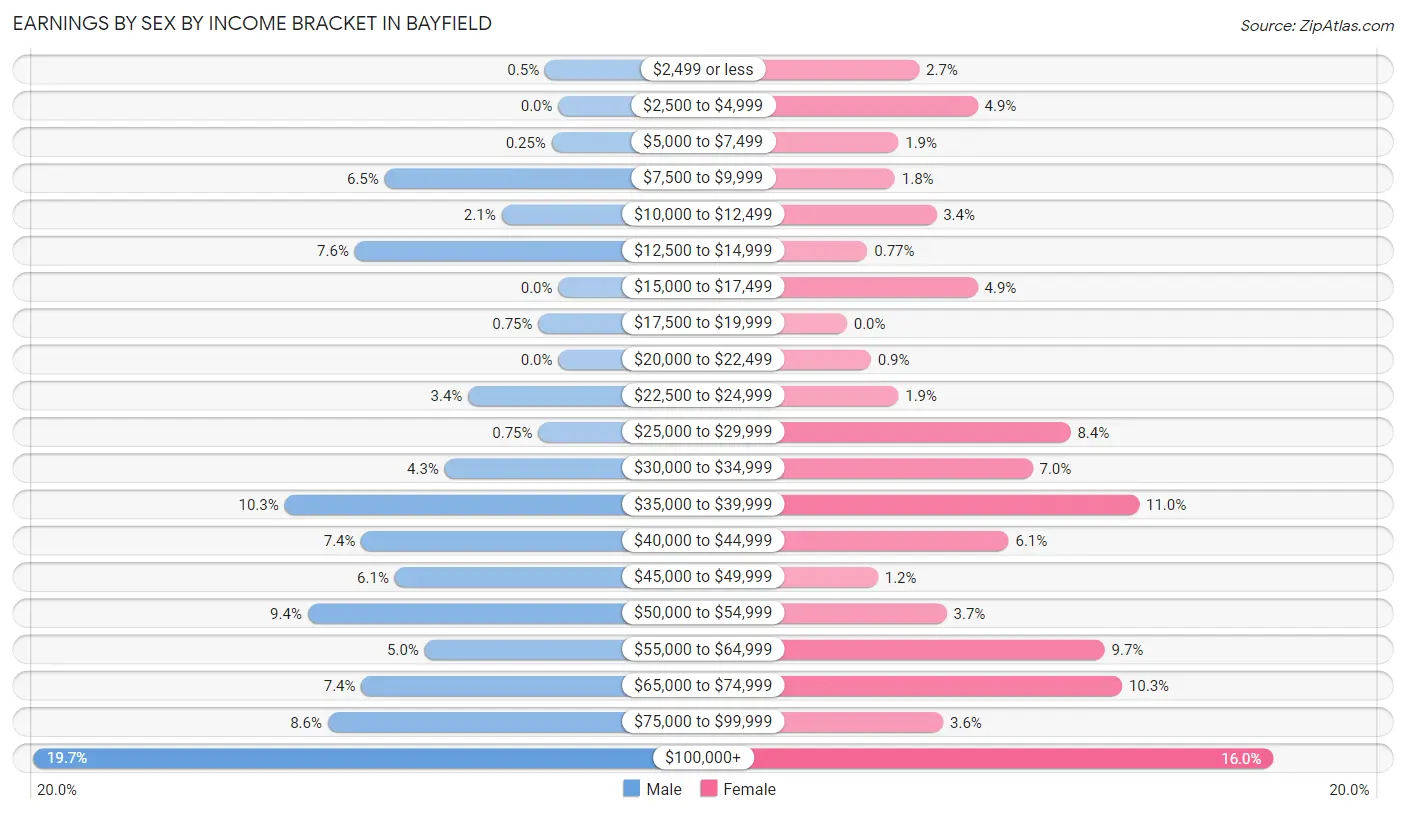
Earnings by Sex by Income Bracket in Bayfield
The most common earnings brackets in Bayfield are $100,000+ for men (157 | 19.7%) and $100,000+ for women (124 | 16.0%).
| Income | Male | Female |
| $2,499 or less | 4 (0.5%) | 21 (2.7%) |
| $2,500 to $4,999 | 0 (0.0%) | 38 (4.9%) |
| $5,000 to $7,499 | 2 (0.3%) | 15 (1.9%) |
| $7,500 to $9,999 | 52 (6.5%) | 14 (1.8%) |
| $10,000 to $12,499 | 17 (2.1%) | 26 (3.4%) |
| $12,500 to $14,999 | 61 (7.6%) | 6 (0.8%) |
| $15,000 to $17,499 | 0 (0.0%) | 38 (4.9%) |
| $17,500 to $19,999 | 6 (0.7%) | 0 (0.0%) |
| $20,000 to $22,499 | 0 (0.0%) | 7 (0.9%) |
| $22,500 to $24,999 | 27 (3.4%) | 15 (1.9%) |
| $25,000 to $29,999 | 6 (0.7%) | 65 (8.4%) |
| $30,000 to $34,999 | 34 (4.3%) | 54 (7.0%) |
| $35,000 to $39,999 | 82 (10.3%) | 85 (11.0%) |
| $40,000 to $44,999 | 59 (7.4%) | 47 (6.1%) |
| $45,000 to $49,999 | 49 (6.1%) | 9 (1.2%) |
| $50,000 to $54,999 | 75 (9.4%) | 29 (3.7%) |
| $55,000 to $64,999 | 40 (5.0%) | 75 (9.7%) |
| $65,000 to $74,999 | 59 (7.4%) | 80 (10.3%) |
| $75,000 to $99,999 | 69 (8.6%) | 28 (3.6%) |
| $100,000+ | 157 (19.7%) | 124 (16.0%) |
| Total | 799 (100.0%) | 776 (100.0%) |
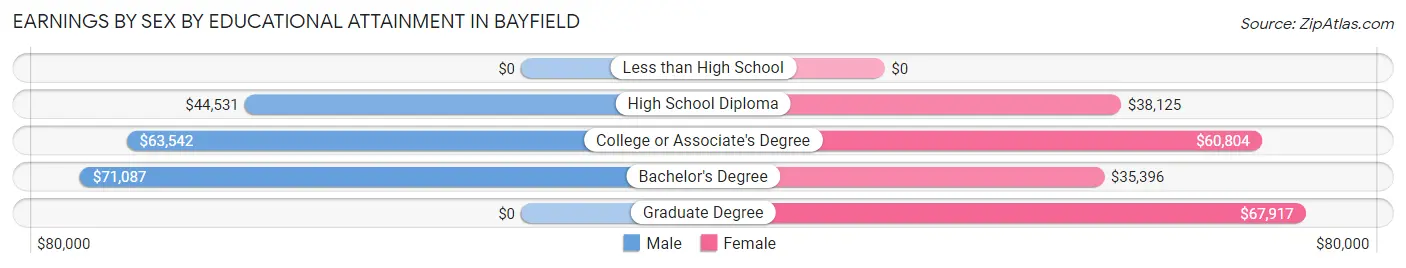
Earnings by Sex by Educational Attainment in Bayfield
Average earnings in Bayfield are $51,721 for men and $41,154 for women, a difference of 20.4%. Men with an educational attainment of bachelor's degree enjoy the highest average annual earnings of $71,087, while those with high school diploma education earn the least with $44,531. Women with an educational attainment of graduate degree earn the most with the average annual earnings of $67,917, while those with bachelor's degree education have the smallest earnings of $35,396.
| Educational Attainment | Male Income | Female Income |
| Less than High School | - | - |
| High School Diploma | $44,531 | $38,125 |
| College or Associate's Degree | $63,542 | $60,804 |
| Bachelor's Degree | $71,087 | $35,396 |
| Graduate Degree | - | - |
| Total | $51,721 | $41,154 |
Family Income in Bayfield
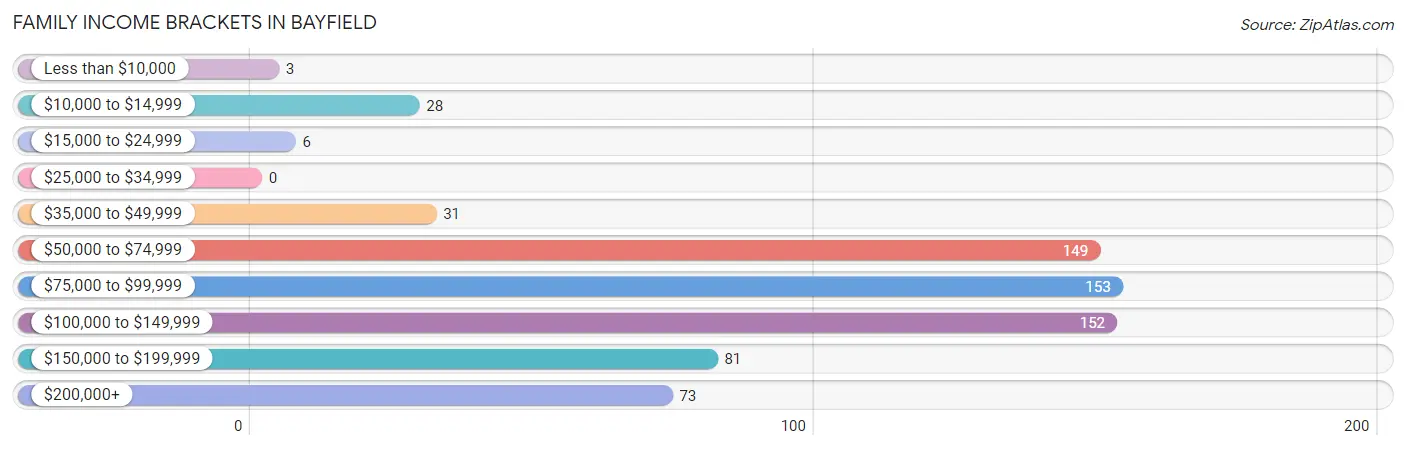
Family Income Brackets in Bayfield
According to the Bayfield family income data, there are 153 families falling into the $75,000 to $99,999 income range, which is the most common income bracket and makes up 22.6% of all families.
| Income Bracket | # Families | % Families |
| Less than $10,000 | 3 | 0.4% |
| $10,000 to $14,999 | 28 | 4.1% |
| $15,000 to $24,999 | 6 | 0.9% |
| $25,000 to $34,999 | 0 | 0.0% |
| $35,000 to $49,999 | 31 | 4.6% |
| $50,000 to $74,999 | 149 | 22.0% |
| $75,000 to $99,999 | 153 | 22.6% |
| $100,000 to $149,999 | 152 | 22.5% |
| $150,000 to $199,999 | 81 | 12.0% |
| $200,000+ | 73 | 10.8% |
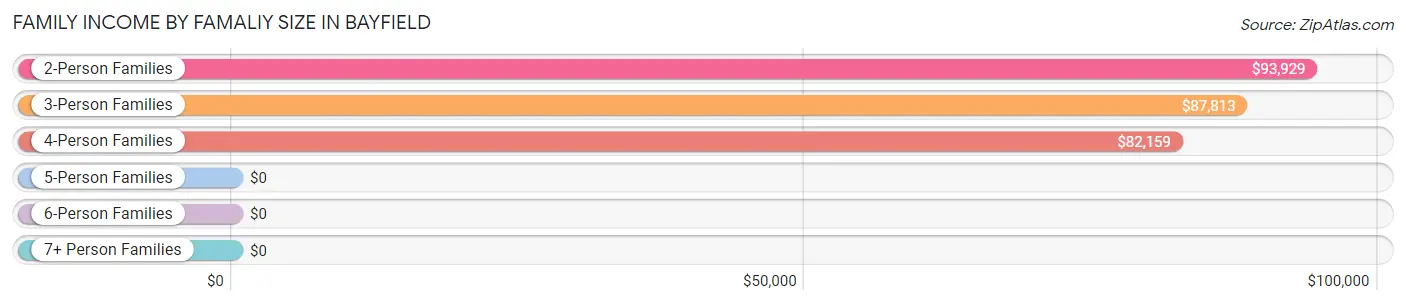
Family Income by Famaliy Size in Bayfield
2-person families (224 | 33.1%) account for the highest median family income in Bayfield with $93,929 per family, while 2-person families (224 | 33.1%) have the highest median income of $46,964 per family member.
| Income Bracket | # Families | Median Income |
| 2-Person Families | 224 (33.1%) | $93,929 |
| 3-Person Families | 199 (29.4%) | $87,813 |
| 4-Person Families | 135 (20.0%) | $82,159 |
| 5-Person Families | 90 (13.3%) | $0 |
| 6-Person Families | 18 (2.7%) | $0 |
| 7+ Person Families | 10 (1.5%) | $0 |
| Total | 676 (100.0%) | $92,176 |
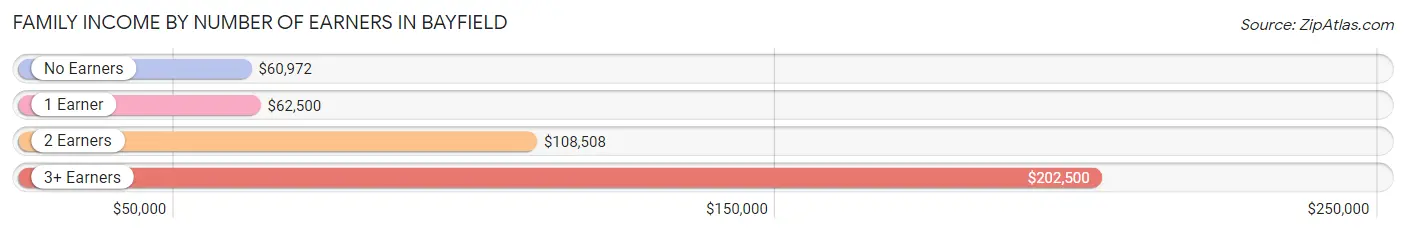
Family Income by Number of Earners in Bayfield
The median family income in Bayfield is $92,176, with families comprising 3+ earners (68) having the highest median family income of $202,500, while families with no earners (45) have the lowest median family income of $60,972, accounting for 10.1% and 6.7% of families, respectively.
| Number of Earners | # Families | Median Income |
| No Earners | 45 (6.7%) | $60,972 |
| 1 Earner | 190 (28.1%) | $62,500 |
| 2 Earners | 373 (55.2%) | $108,508 |
| 3+ Earners | 68 (10.1%) | $202,500 |
| Total | 676 (100.0%) | $92,176 |
Household Income in Bayfield
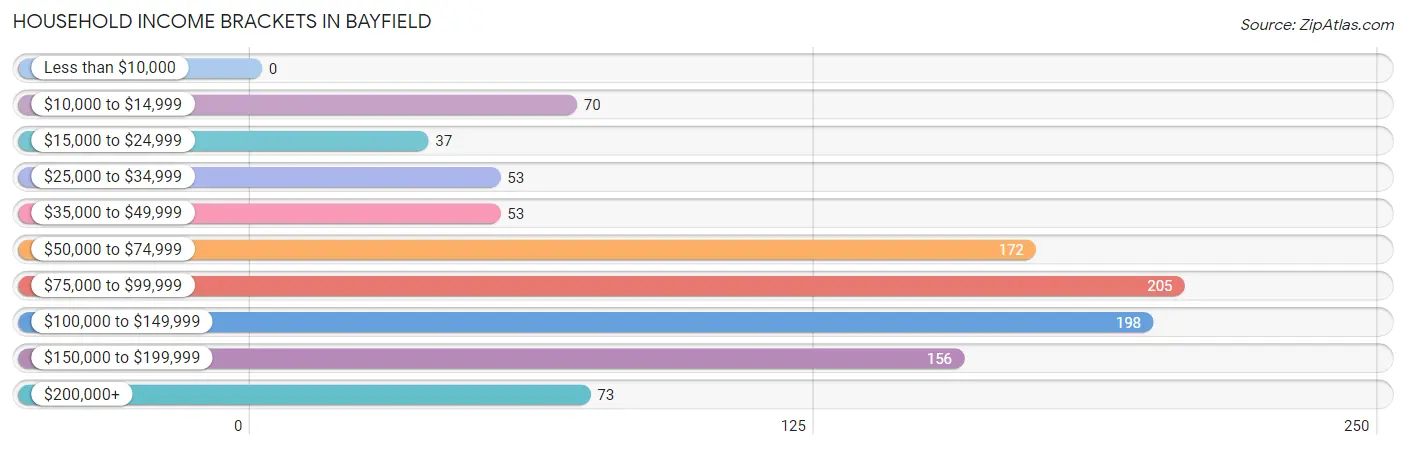
Household Income Brackets in Bayfield
With 205 households falling in the category, the $75,000 to $99,999 income range is the most frequent in Bayfield, accounting for 20.2% of all households.
| Income Bracket | # Households | % Households |
| Less than $10,000 | 0 | 0.0% |
| $10,000 to $14,999 | 70 | 6.9% |
| $15,000 to $24,999 | 37 | 3.6% |
| $25,000 to $34,999 | 53 | 5.2% |
| $35,000 to $49,999 | 53 | 5.2% |
| $50,000 to $74,999 | 172 | 16.9% |
| $75,000 to $99,999 | 205 | 20.2% |
| $100,000 to $149,999 | 198 | 19.5% |
| $150,000 to $199,999 | 156 | 15.3% |
| $200,000+ | 73 | 7.2% |
Household Income by Householder Age in Bayfield
The median household income in Bayfield is $84,609, with the highest median household income of $102,917 found in the 45 to 64 years age bracket for the primary householder. A total of 389 households (38.3%) fall into this category.
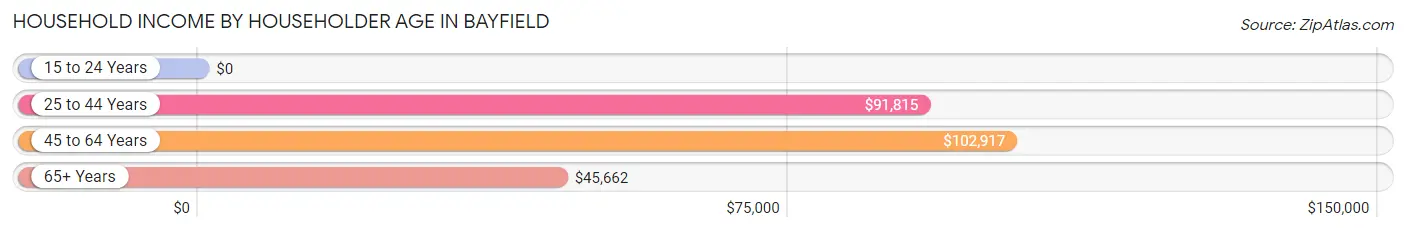
| Income Bracket | # Households | Median Income |
| 15 to 24 Years | 0 (0.0%) | $0 |
| 25 to 44 Years | 413 (40.6%) | $91,815 |
| 45 to 64 Years | 389 (38.3%) | $102,917 |
| 65+ Years | 215 (21.1%) | $45,662 |
| Total | 1,017 (100.0%) | $84,609 |
Poverty in Bayfield
Income Below Poverty by Sex and Age in Bayfield
With 5.1% poverty level for males and 7.2% for females among the residents of Bayfield, 18 to 24 year old males and 16 and 17 year old females are the most vulnerable to poverty, with 45 males (42.1%) and 25 females (65.8%) in their respective age groups living below the poverty level.
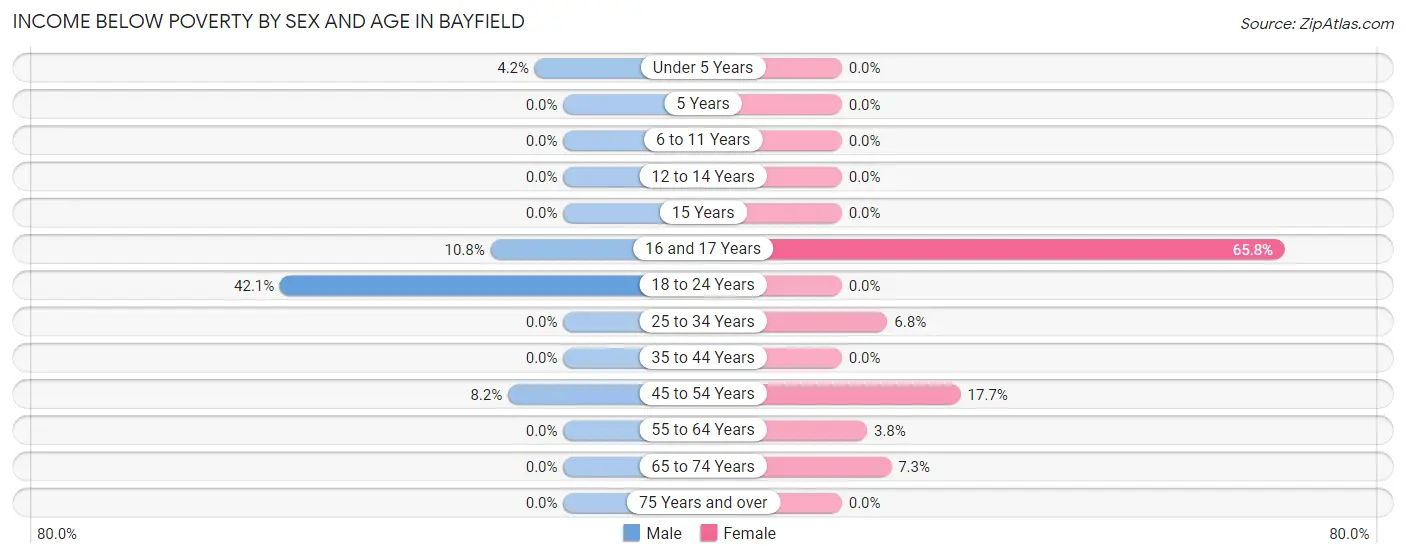
| Age Bracket | Male | Female |
| Under 5 Years | 6 (4.2%) | 0 (0.0%) |
| 5 Years | 0 (0.0%) | 0 (0.0%) |
| 6 to 11 Years | 0 (0.0%) | 0 (0.0%) |
| 12 to 14 Years | 0 (0.0%) | 0 (0.0%) |
| 15 Years | 0 (0.0%) | 0 (0.0%) |
| 16 and 17 Years | 4 (10.8%) | 25 (65.8%) |
| 18 to 24 Years | 45 (42.1%) | 0 (0.0%) |
| 25 to 34 Years | 0 (0.0%) | 18 (6.8%) |
| 35 to 44 Years | 0 (0.0%) | 0 (0.0%) |
| 45 to 54 Years | 16 (8.2%) | 42 (17.6%) |
| 55 to 64 Years | 0 (0.0%) | 6 (3.7%) |
| 65 to 74 Years | 0 (0.0%) | 8 (7.3%) |
| 75 Years and over | 0 (0.0%) | 0 (0.0%) |
| Total | 71 (5.1%) | 99 (7.2%) |
Income Above Poverty by Sex and Age in Bayfield
According to the poverty statistics in Bayfield, males aged 5 years and females aged under 5 years are the age groups that are most secure financially, with 100.0% of males and 100.0% of females in these age groups living above the poverty line.
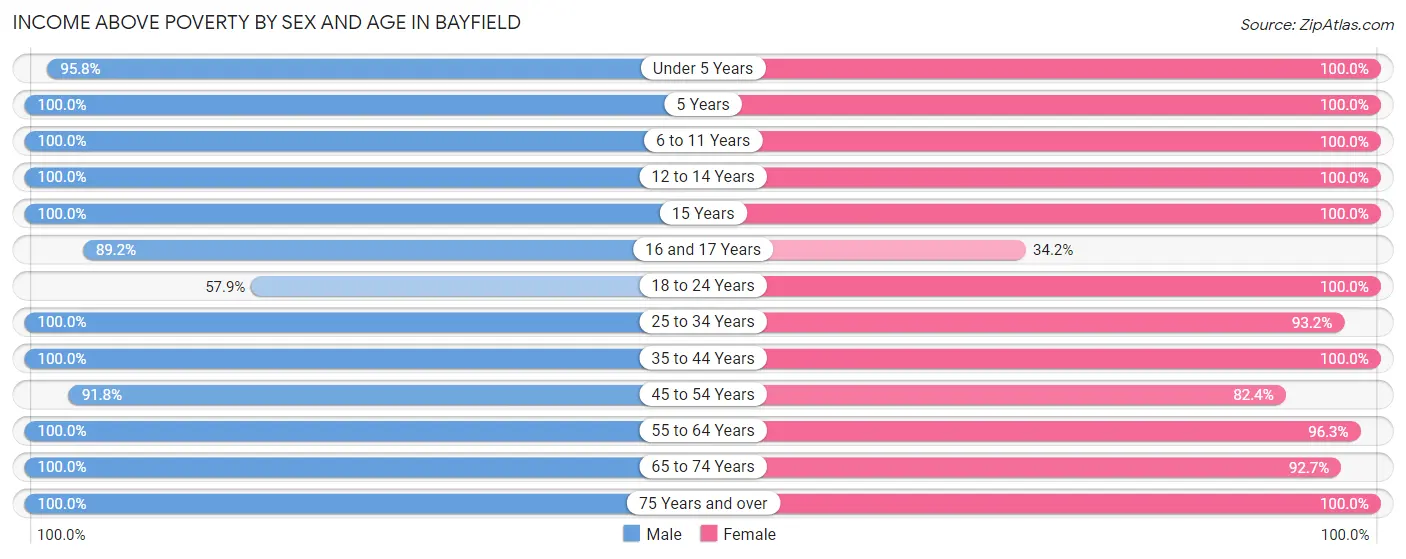
| Age Bracket | Male | Female |
| Under 5 Years | 136 (95.8%) | 102 (100.0%) |
| 5 Years | 2 (100.0%) | 32 (100.0%) |
| 6 to 11 Years | 124 (100.0%) | 97 (100.0%) |
| 12 to 14 Years | 83 (100.0%) | 74 (100.0%) |
| 15 Years | 33 (100.0%) | 45 (100.0%) |
| 16 and 17 Years | 33 (89.2%) | 13 (34.2%) |
| 18 to 24 Years | 62 (57.9%) | 11 (100.0%) |
| 25 to 34 Years | 290 (100.0%) | 248 (93.2%) |
| 35 to 44 Years | 174 (100.0%) | 125 (100.0%) |
| 45 to 54 Years | 179 (91.8%) | 196 (82.4%) |
| 55 to 64 Years | 109 (100.0%) | 154 (96.3%) |
| 65 to 74 Years | 70 (100.0%) | 101 (92.7%) |
| 75 Years and over | 30 (100.0%) | 70 (100.0%) |
| Total | 1,325 (94.9%) | 1,268 (92.8%) |
Income Below Poverty Among Married-Couple Families in Bayfield
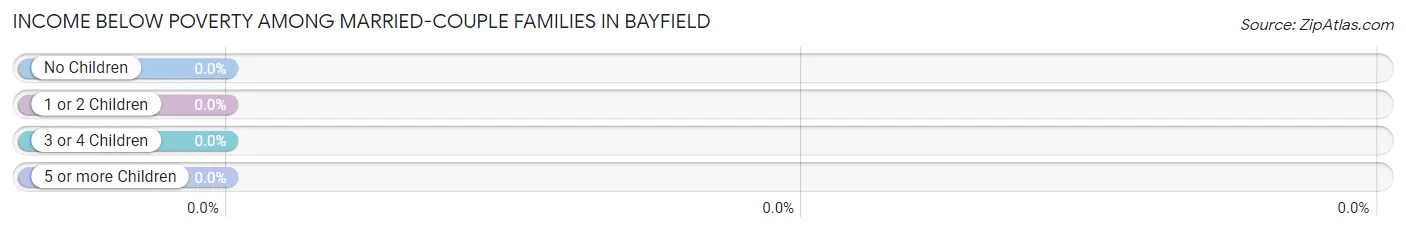
| Children | Above Poverty | Below Poverty |
| No Children | 168 (100.0%) | 0 (0.0%) |
| 1 or 2 Children | 267 (100.0%) | 0 (0.0%) |
| 3 or 4 Children | 69 (100.0%) | 0 (0.0%) |
| 5 or more Children | 10 (100.0%) | 0 (0.0%) |
| Total | 514 (100.0%) | 0 (0.0%) |
Income Below Poverty Among Single-Parent Households in Bayfield
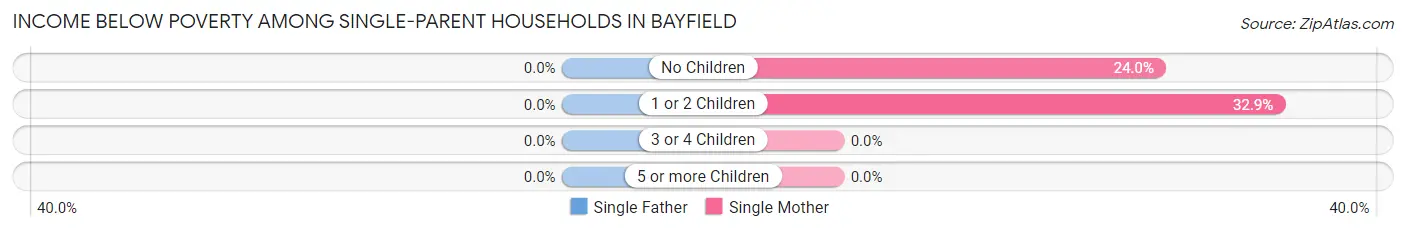
| Children | Single Father | Single Mother |
| No Children | 0 (0.0%) | 6 (24.0%) |
| 1 or 2 Children | 0 (0.0%) | 25 (32.9%) |
| 3 or 4 Children | 0 (0.0%) | 0 (0.0%) |
| 5 or more Children | 0 (0.0%) | 0 (0.0%) |
| Total | 0 (0.0%) | 31 (29.5%) |
Income Below Poverty Among Married-Couple vs Single-Parent Households in Bayfield
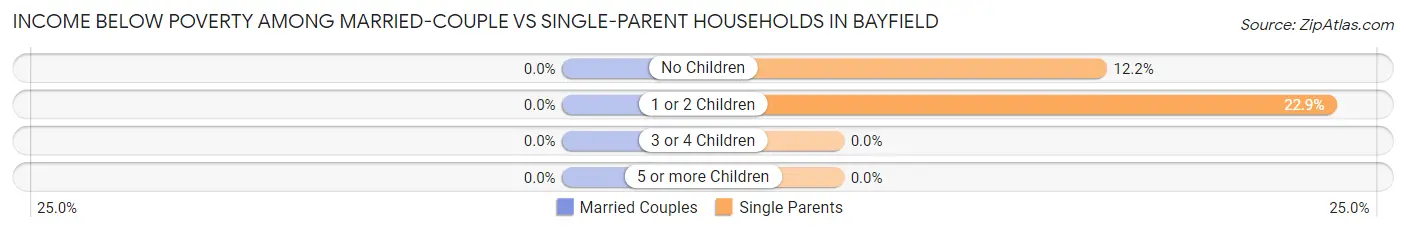
| Children | Married-Couple Families | Single-Parent Households |
| No Children | 0 (0.0%) | 6 (12.2%) |
| 1 or 2 Children | 0 (0.0%) | 25 (22.9%) |
| 3 or 4 Children | 0 (0.0%) | 0 (0.0%) |
| 5 or more Children | 0 (0.0%) | 0 (0.0%) |
| Total | 0 (0.0%) | 31 (19.1%) |
Race in Bayfield
The most populous races in Bayfield are White / Caucasian (2,642 | 92.6%), Hispanic or Latino (551 | 19.3%), and Two or more Races (115 | 4.0%).
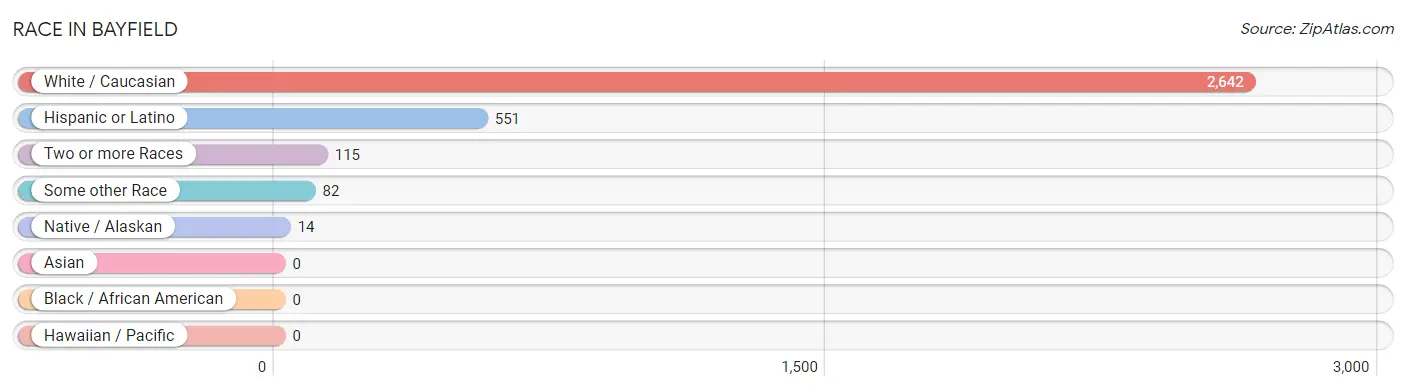
| Race | # Population | % Population |
| Asian | 0 | 0.0% |
| Black / African American | 0 | 0.0% |
| Hawaiian / Pacific | 0 | 0.0% |
| Hispanic or Latino | 551 | 19.3% |
| Native / Alaskan | 14 | 0.5% |
| White / Caucasian | 2,642 | 92.6% |
| Two or more Races | 115 | 4.0% |
| Some other Race | 82 | 2.9% |
| Total | 2,853 | 100.0% |
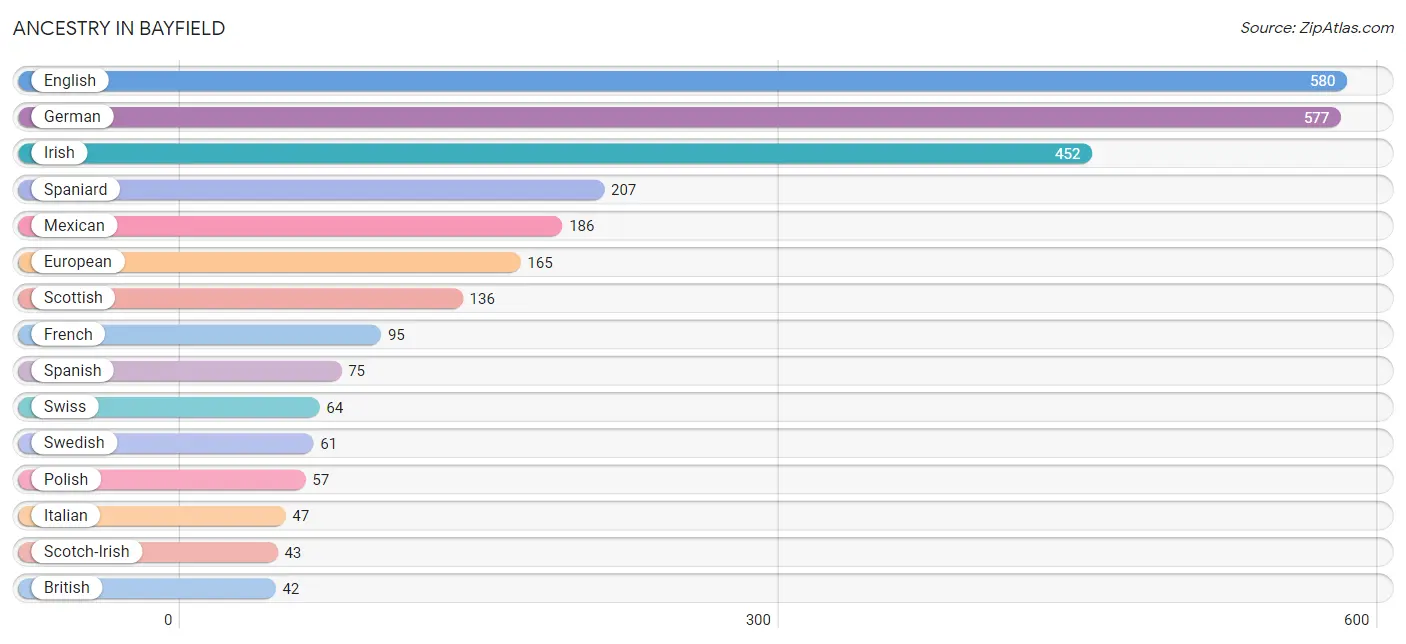
Ancestry in Bayfield
The most populous ancestries reported in Bayfield are English (580 | 20.3%), German (577 | 20.2%), Irish (452 | 15.8%), Spaniard (207 | 7.3%), and Mexican (186 | 6.5%), together accounting for 70.2% of all Bayfield residents.
| Ancestry | # Population | % Population |
| Apache | 9 | 0.3% |
| Bhutanese | 9 | 0.3% |
| British | 42 | 1.5% |
| Danish | 42 | 1.5% |
| Dutch | 29 | 1.0% |
| Eastern European | 5 | 0.2% |
| English | 580 | 20.3% |
| European | 165 | 5.8% |
| French | 95 | 3.3% |
| German | 577 | 20.2% |
| Greek | 6 | 0.2% |
| Hungarian | 11 | 0.4% |
| Irish | 452 | 15.8% |
| Italian | 47 | 1.7% |
| Mexican | 186 | 6.5% |
| Northern European | 15 | 0.5% |
| Norwegian | 40 | 1.4% |
| Pennsylvania German | 1 | 0.0% |
| Polish | 57 | 2.0% |
| Pueblo | 9 | 0.3% |
| Puerto Rican | 19 | 0.7% |
| Russian | 8 | 0.3% |
| Scotch-Irish | 43 | 1.5% |
| Scottish | 136 | 4.8% |
| Sioux | 5 | 0.2% |
| Spaniard | 207 | 7.3% |
| Spanish | 75 | 2.6% |
| Swedish | 61 | 2.1% |
| Swiss | 64 | 2.2% |
| Ukrainian | 8 | 0.3% |
| Welsh | 20 | 0.7% | View All 31 Rows |
Immigrants in Bayfield
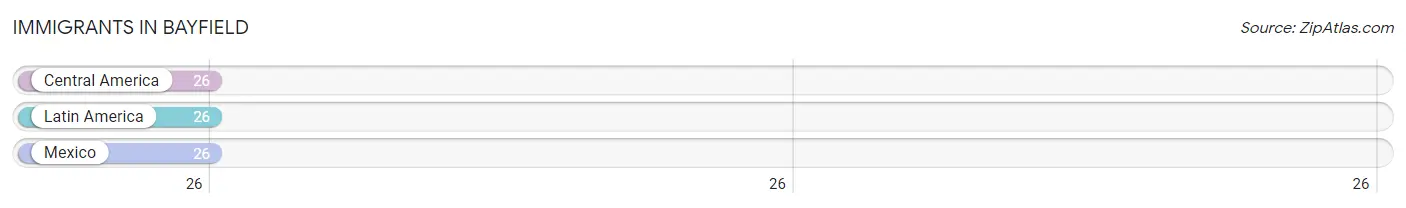
The most numerous immigrant groups reported in Bayfield came from Central America (26 | 0.9%), Latin America (26 | 0.9%), and Mexico (26 | 0.9%), together accounting for 2.7% of all Bayfield residents.
| Immigration Origin | # Population | % Population |
| Central America | 26 | 0.9% |
| Latin America | 26 | 0.9% |
| Mexico | 26 | 0.9% | View All 3 Rows |
Sex and Age in Bayfield
Sex and Age in Bayfield
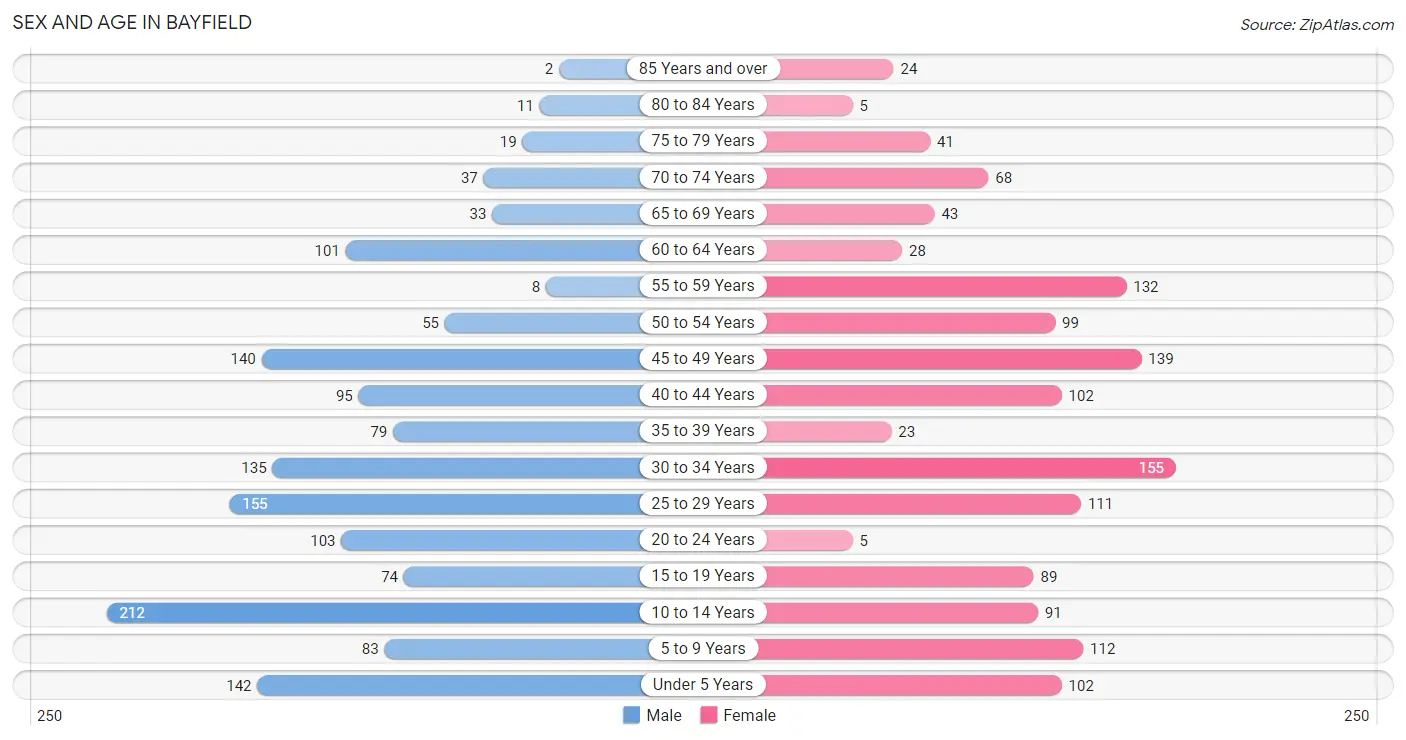
The most populous age groups in Bayfield are 10 to 14 Years (212 | 14.3%) for men and 30 to 34 Years (155 | 11.3%) for women.
| Age Bracket | Male | Female |
| Under 5 Years | 142 (9.6%) | 102 (7.4%) |
| 5 to 9 Years | 83 (5.6%) | 112 (8.2%) |
| 10 to 14 Years | 212 (14.3%) | 91 (6.7%) |
| 15 to 19 Years | 74 (5.0%) | 89 (6.5%) |
| 20 to 24 Years | 103 (6.9%) | 5 (0.4%) |
| 25 to 29 Years | 155 (10.4%) | 111 (8.1%) |
| 30 to 34 Years | 135 (9.1%) | 155 (11.3%) |
| 35 to 39 Years | 79 (5.3%) | 23 (1.7%) |
| 40 to 44 Years | 95 (6.4%) | 102 (7.4%) |
| 45 to 49 Years | 140 (9.4%) | 139 (10.2%) |
| 50 to 54 Years | 55 (3.7%) | 99 (7.2%) |
| 55 to 59 Years | 8 (0.5%) | 132 (9.6%) |
| 60 to 64 Years | 101 (6.8%) | 28 (2.1%) |
| 65 to 69 Years | 33 (2.2%) | 43 (3.1%) |
| 70 to 74 Years | 37 (2.5%) | 68 (5.0%) |
| 75 to 79 Years | 19 (1.3%) | 41 (3.0%) |
| 80 to 84 Years | 11 (0.7%) | 5 (0.4%) |
| 85 Years and over | 2 (0.1%) | 24 (1.8%) |
| Total | 1,484 (100.0%) | 1,369 (100.0%) |
Families and Households in Bayfield
Median Family Size in Bayfield
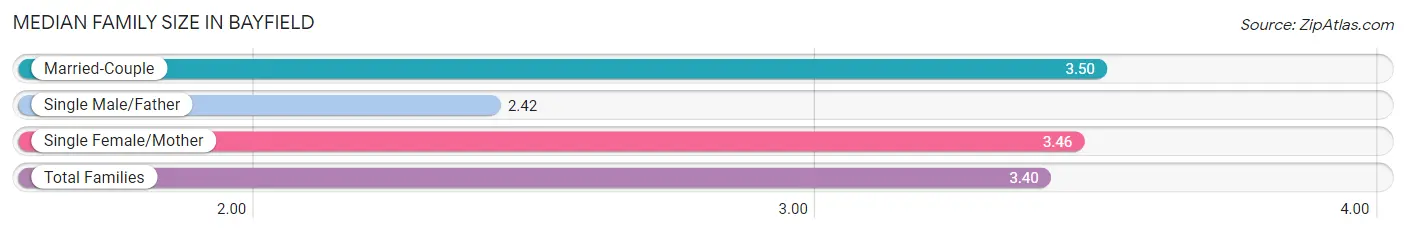
The median family size in Bayfield is 3.40 persons per family, with married-couple families (514 | 76.0%) accounting for the largest median family size of 3.5 persons per family. On the other hand, single male/father families (57 | 8.4%) represent the smallest median family size with 2.42 persons per family.
| Family Type | # Families | Family Size |
| Married-Couple | 514 (76.0%) | 3.50 |
| Single Male/Father | 57 (8.4%) | 2.42 |
| Single Female/Mother | 105 (15.5%) | 3.46 |
| Total Families | 676 (100.0%) | 3.40 |
Median Household Size in Bayfield
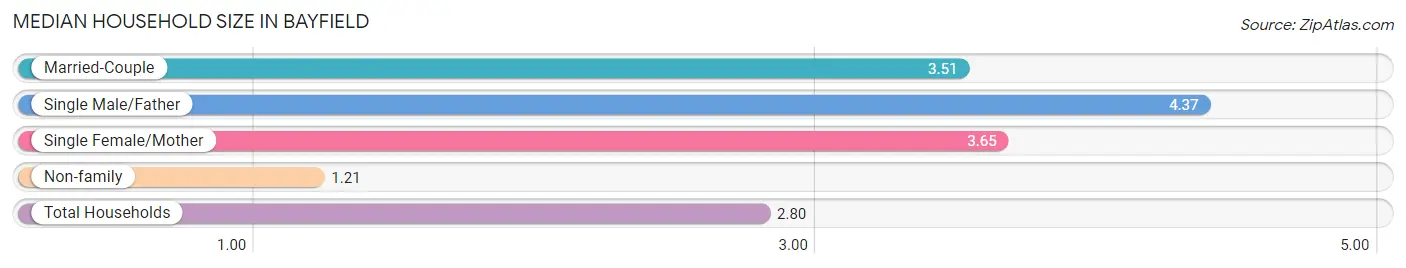
The median household size in Bayfield is 2.80 persons per household, with single male/father households (57 | 5.6%) accounting for the largest median household size of 4.37 persons per household. non-family households (341 | 33.5%) represent the smallest median household size with 1.21 persons per household.
| Household Type | # Households | Household Size |
| Married-Couple | 514 (50.5%) | 3.51 |
| Single Male/Father | 57 (5.6%) | 4.37 |
| Single Female/Mother | 105 (10.3%) | 3.65 |
| Non-family | 341 (33.5%) | 1.21 |
| Total Households | 1,017 (100.0%) | 2.80 |
Household Size by Marriage Status in Bayfield
Out of a total of 1,017 households in Bayfield, 676 (66.5%) are family households, while 341 (33.5%) are nonfamily households. The most numerous type of family households are 2-person households, comprising 205, and the most common type of nonfamily households are 1-person households, comprising 281.
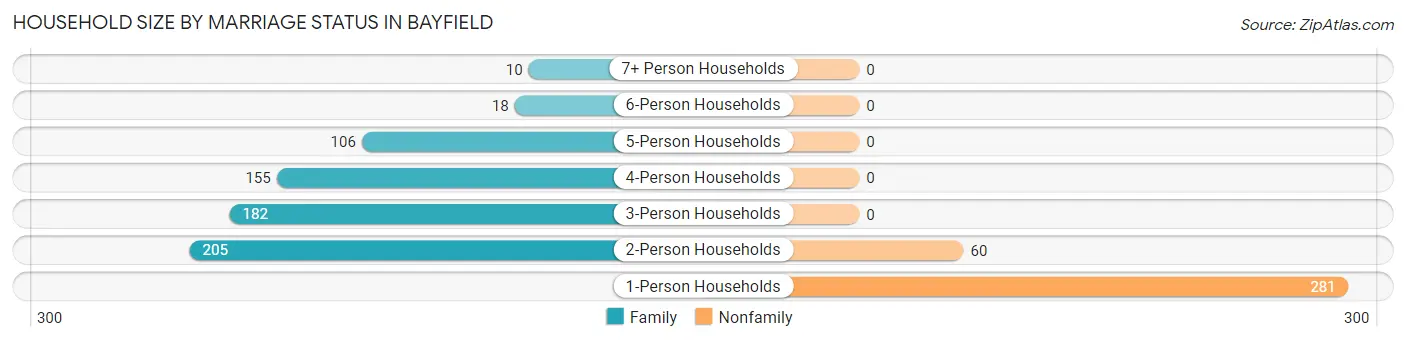
| Household Size | Family Households | Nonfamily Households |
| 1-Person Households | - | 281 (27.6%) |
| 2-Person Households | 205 (20.2%) | 60 (5.9%) |
| 3-Person Households | 182 (17.9%) | 0 (0.0%) |
| 4-Person Households | 155 (15.2%) | 0 (0.0%) |
| 5-Person Households | 106 (10.4%) | 0 (0.0%) |
| 6-Person Households | 18 (1.8%) | 0 (0.0%) |
| 7+ Person Households | 10 (1.0%) | 0 (0.0%) |
| Total | 676 (66.5%) | 341 (33.5%) |
Female Fertility in Bayfield
Fertility by Age in Bayfield
Average fertility rate in Bayfield is 61.0 births per 1,000 women. Women in the age bracket of 20 to 34 years have the highest fertility rate with 140.0 births per 1,000 women. Women in the age bracket of 20 to 34 years acount for 100.0% of all women with births.
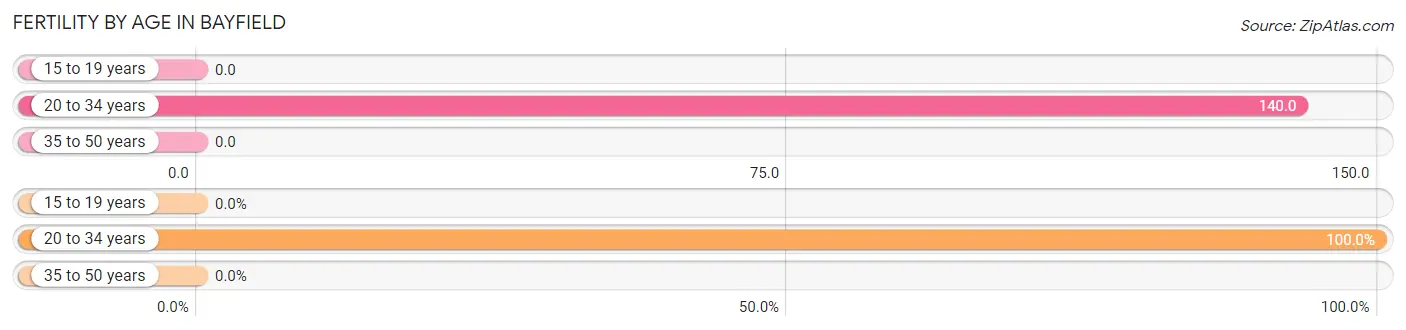
| Age Bracket | Women with Births | Births / 1,000 Women |
| 15 to 19 years | 0 (0.0%) | 0.0 |
| 20 to 34 years | 38 (100.0%) | 140.0 |
| 35 to 50 years | 0 (0.0%) | 0.0 |
| Total | 38 (100.0%) | 61.0 |
Fertility by Age by Marriage Status in Bayfield
47.4% of women with births (38) in Bayfield are married. The highest percentage of unmarried women with births falls into 20 to 34 years age bracket with 52.6% of them unmarried at the time of birth, while the lowest percentage of unmarried women with births belong to 20 to 34 years age bracket with 52.6% of them unmarried.
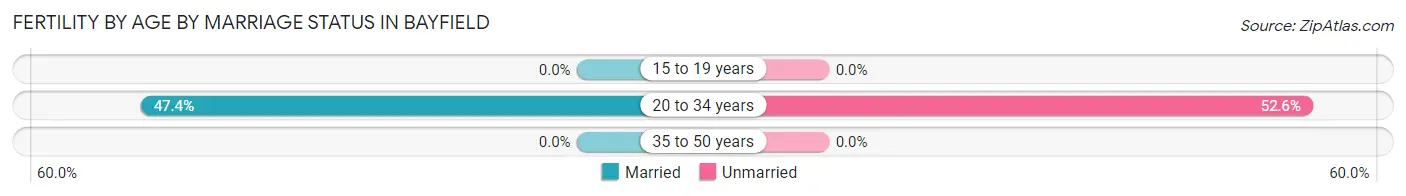
| Age Bracket | Married | Unmarried |
| 15 to 19 years | 0 (0.0%) | 0 (0.0%) |
| 20 to 34 years | 18 (47.4%) | 20 (52.6%) |
| 35 to 50 years | 0 (0.0%) | 0 (0.0%) |
| Total | 18 (47.4%) | 20 (52.6%) |
Fertility by Education in Bayfield
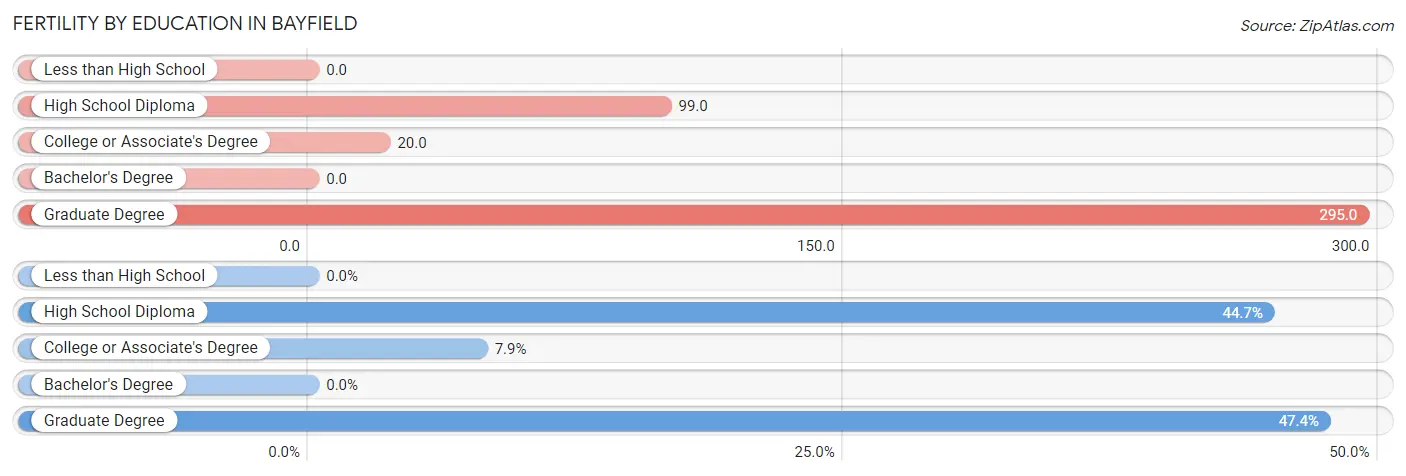
| Educational Attainment | Women with Births | Births / 1,000 Women |
| Less than High School | 0 (0.0%) | 0.0 |
| High School Diploma | 17 (44.7%) | 99.0 |
| College or Associate's Degree | 3 (7.9%) | 20.0 |
| Bachelor's Degree | 0 (0.0%) | 0.0 |
| Graduate Degree | 18 (47.4%) | 295.0 |
| Total | 38 (100.0%) | 61.0 |
Fertility by Education by Marriage Status in Bayfield
52.6% of women with births in Bayfield are unmarried. Women with the educational attainment of graduate degree are most likely to be married with 100.0% of them married at childbirth, while women with the educational attainment of high school diploma are least likely to be married with 100.0% of them unmarried at childbirth.
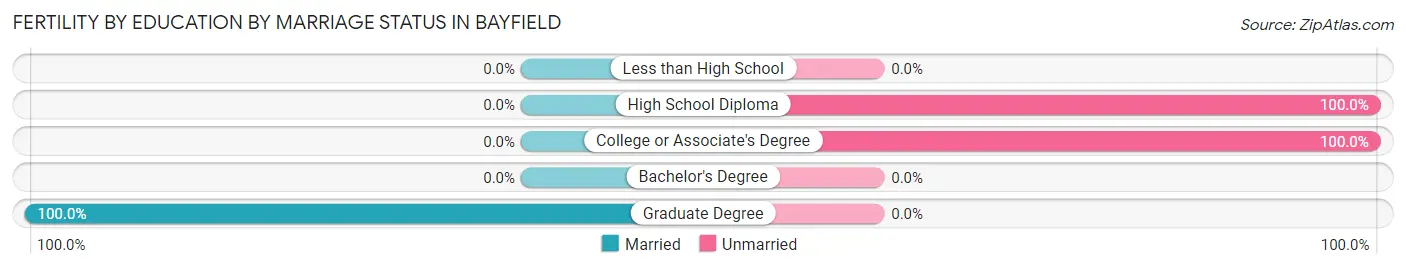
| Educational Attainment | Married | Unmarried |
| Less than High School | 0 (0.0%) | 0 (0.0%) |
| High School Diploma | 0 (0.0%) | 17 (100.0%) |
| College or Associate's Degree | 0 (0.0%) | 3 (100.0%) |
| Bachelor's Degree | 0 (0.0%) | 0 (0.0%) |
| Graduate Degree | 18 (100.0%) | 0 (0.0%) |
| Total | 18 (47.4%) | 20 (52.6%) |
Employment Characteristics in Bayfield
Employment by Class of Employer in Bayfield
Among the 1,470 employed individuals in Bayfield, private company employees (856 | 58.2%), self-employed (not incorporated) (152 | 10.3%), and local government employees (150 | 10.2%) make up the most common classes of employment.
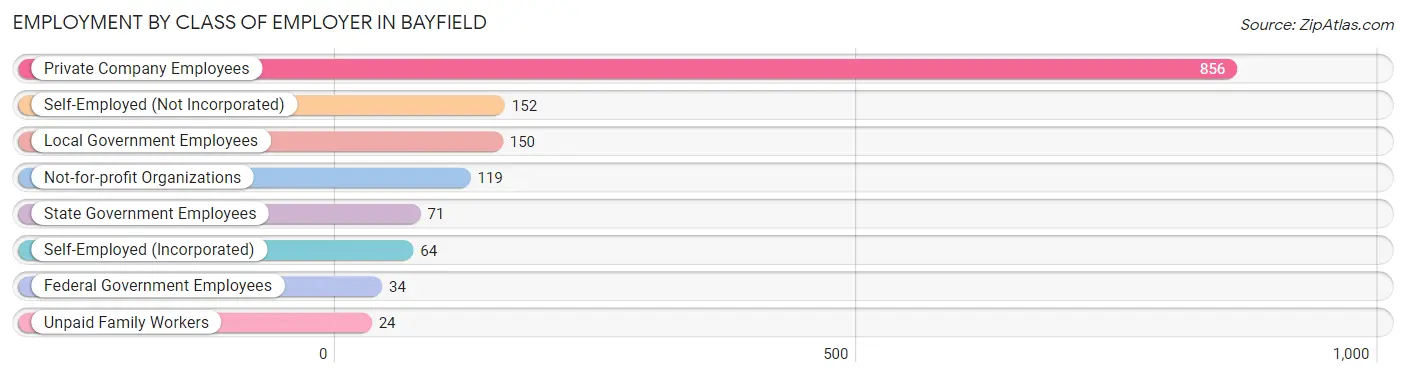
| Employer Class | # Employees | % Employees |
| Private Company Employees | 856 | 58.2% |
| Self-Employed (Incorporated) | 64 | 4.3% |
| Self-Employed (Not Incorporated) | 152 | 10.3% |
| Not-for-profit Organizations | 119 | 8.1% |
| Local Government Employees | 150 | 10.2% |
| State Government Employees | 71 | 4.8% |
| Federal Government Employees | 34 | 2.3% |
| Unpaid Family Workers | 24 | 1.6% |
| Total | 1,470 | 100.0% |
Employment Status by Age in Bayfield
According to the labor force statistics for Bayfield, out of the total population over 16 years of age (2,033), 78.3% or 1,592 individuals are in the labor force, with 5.9% or 94 of them unemployed. The age group with the highest labor force participation rate is 20 to 24 years, with 100.0% or 108 individuals in the labor force. Within the labor force, the 20 to 24 years age range has the highest percentage of unemployed individuals, with 41.7% or 45 of them being unemployed.
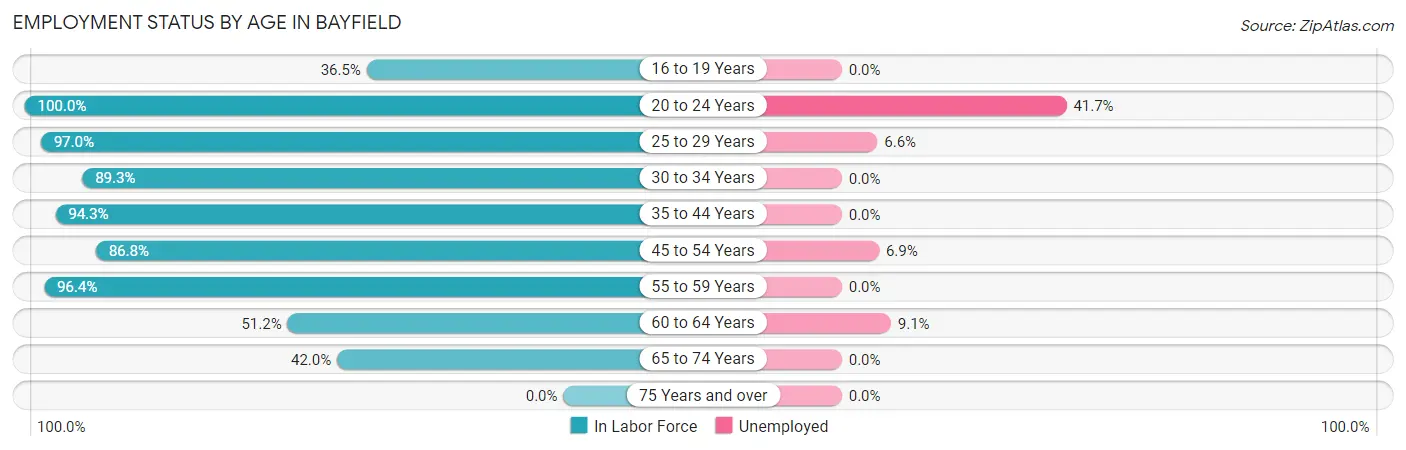
| Age Bracket | In Labor Force | Unemployed |
| 16 to 19 Years | 31 (36.5%) | 0 (0.0%) |
| 20 to 24 Years | 108 (100.0%) | 45 (41.7%) |
| 25 to 29 Years | 258 (97.0%) | 17 (6.6%) |
| 30 to 34 Years | 259 (89.3%) | 0 (0.0%) |
| 35 to 44 Years | 282 (94.3%) | 0 (0.0%) |
| 45 to 54 Years | 376 (86.8%) | 26 (6.9%) |
| 55 to 59 Years | 135 (96.4%) | 0 (0.0%) |
| 60 to 64 Years | 66 (51.2%) | 6 (9.1%) |
| 65 to 74 Years | 76 (42.0%) | 0 (0.0%) |
| 75 Years and over | 0 (0.0%) | 0 (0.0%) |
| Total | 1,592 (78.3%) | 94 (5.9%) |
Employment Status by Educational Attainment in Bayfield
According to labor force statistics for Bayfield, 88.4% of individuals (1,376) out of the total population between 25 and 64 years of age (1,557) are in the labor force, with 3.6% or 50 of them being unemployed. The group with the highest labor force participation rate are those with the educational attainment of less than high school, with 100.0% or 29 individuals in the labor force. Within the labor force, individuals with college / associate degree education have the highest percentage of unemployment, with 7.2% or 32 of them being unemployed.
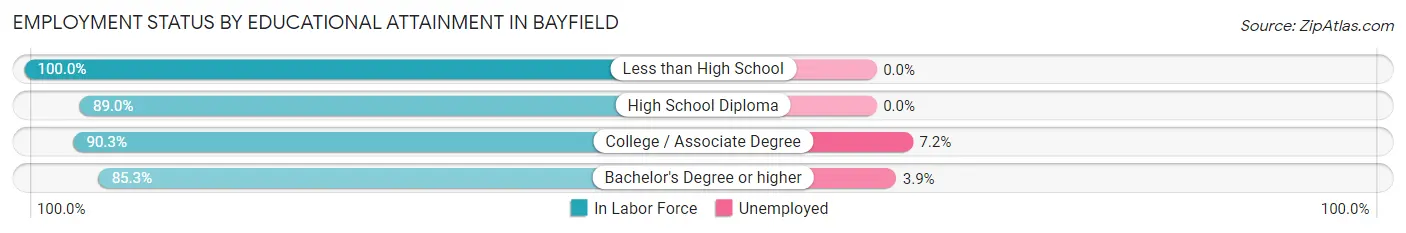
| Educational Attainment | In Labor Force | Unemployed |
| Less than High School | 29 (100.0%) | 0 (0.0%) |
| High School Diploma | 462 (89.0%) | 0 (0.0%) |
| College / Associate Degree | 445 (90.3%) | 35 (7.2%) |
| Bachelor's Degree or higher | 440 (85.3%) | 20 (3.9%) |
| Total | 1,376 (88.4%) | 56 (3.6%) |
Employment Occupations by Sex in Bayfield
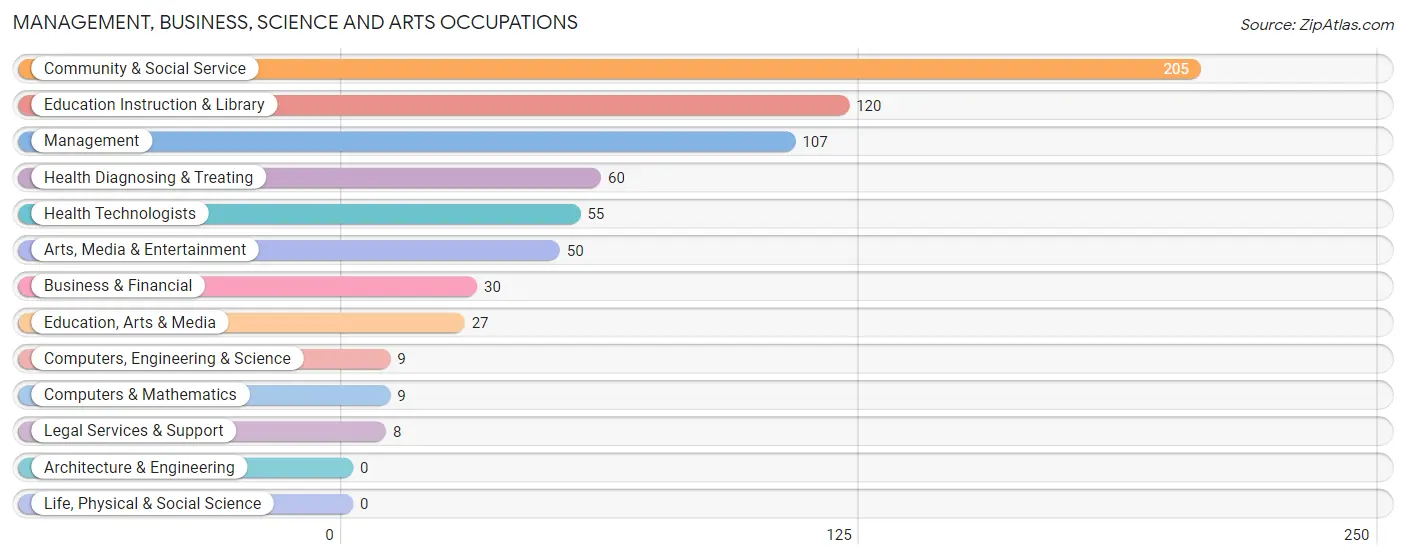
Management, Business, Science and Arts Occupations
The most common Management, Business, Science and Arts occupations in Bayfield are Community & Social Service (205 | 13.7%), Education Instruction & Library (120 | 8.0%), Management (107 | 7.1%), Health Diagnosing & Treating (60 | 4.0%), and Health Technologists (55 | 3.7%).
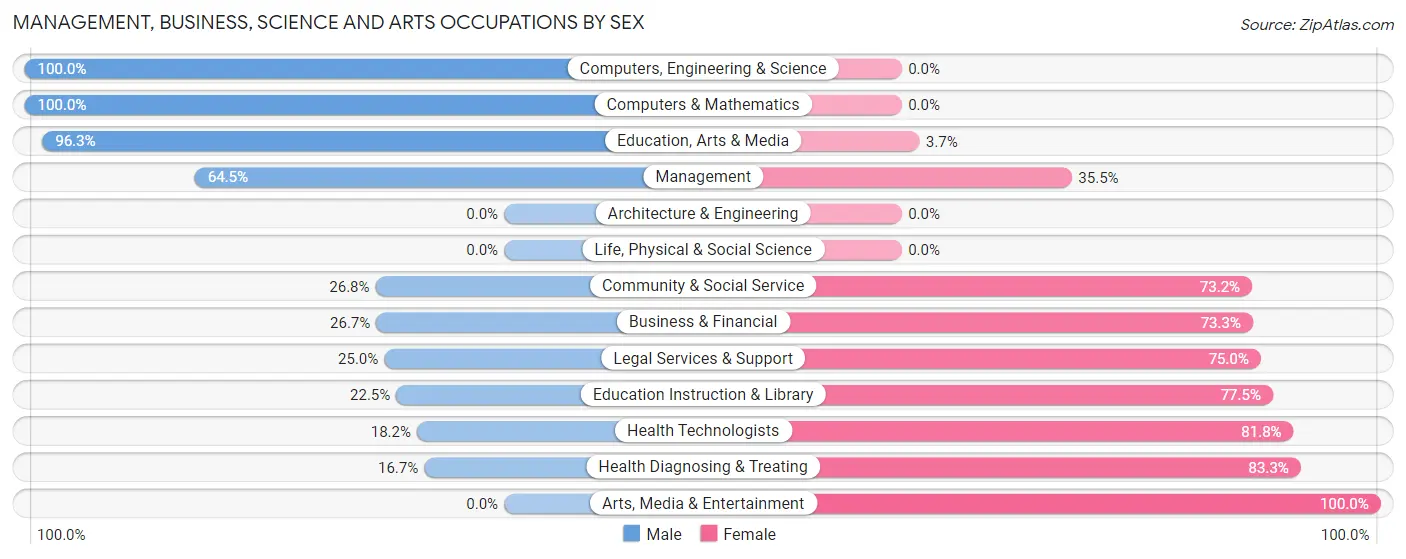
Management, Business, Science and Arts Occupations by Sex
Within the Management, Business, Science and Arts occupations in Bayfield, the most male-oriented occupations are Computers, Engineering & Science (100.0%), Computers & Mathematics (100.0%), and Education, Arts & Media (96.3%), while the most female-oriented occupations are Arts, Media & Entertainment (100.0%), Health Diagnosing & Treating (83.3%), and Health Technologists (81.8%).
| Occupation | Male | Female |
| Management | 69 (64.5%) | 38 (35.5%) |
| Business & Financial | 8 (26.7%) | 22 (73.3%) |
| Computers, Engineering & Science | 9 (100.0%) | 0 (0.0%) |
| Computers & Mathematics | 9 (100.0%) | 0 (0.0%) |
| Architecture & Engineering | 0 (0.0%) | 0 (0.0%) |
| Life, Physical & Social Science | 0 (0.0%) | 0 (0.0%) |
| Community & Social Service | 55 (26.8%) | 150 (73.2%) |
| Education, Arts & Media | 26 (96.3%) | 1 (3.7%) |
| Legal Services & Support | 2 (25.0%) | 6 (75.0%) |
| Education Instruction & Library | 27 (22.5%) | 93 (77.5%) |
| Arts, Media & Entertainment | 0 (0.0%) | 50 (100.0%) |
| Health Diagnosing & Treating | 10 (16.7%) | 50 (83.3%) |
| Health Technologists | 10 (18.2%) | 45 (81.8%) |
| Total (Category) | 151 (36.7%) | 260 (63.3%) |
| Total (Overall) | 764 (51.0%) | 733 (49.0%) |
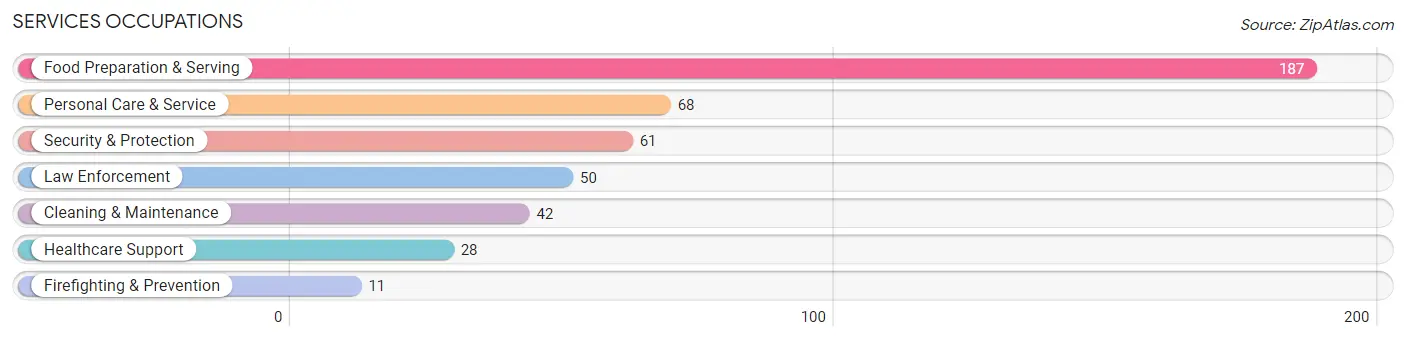
Services Occupations
The most common Services occupations in Bayfield are Food Preparation & Serving (187 | 12.5%), Personal Care & Service (68 | 4.5%), Security & Protection (61 | 4.1%), Law Enforcement (50 | 3.3%), and Cleaning & Maintenance (42 | 2.8%).
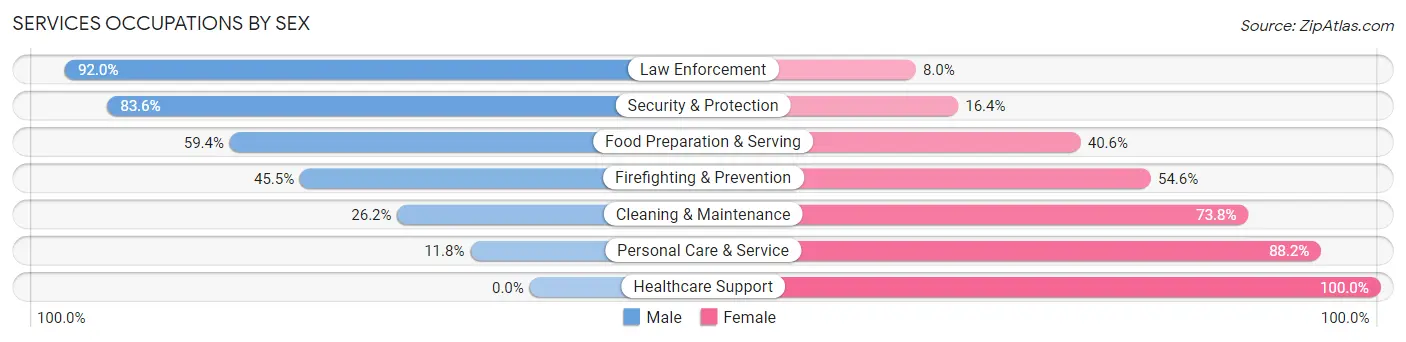
Services Occupations by Sex
Within the Services occupations in Bayfield, the most male-oriented occupations are Law Enforcement (92.0%), Security & Protection (83.6%), and Food Preparation & Serving (59.4%), while the most female-oriented occupations are Healthcare Support (100.0%), Personal Care & Service (88.2%), and Cleaning & Maintenance (73.8%).
| Occupation | Male | Female |
| Healthcare Support | 0 (0.0%) | 28 (100.0%) |
| Security & Protection | 51 (83.6%) | 10 (16.4%) |
| Firefighting & Prevention | 5 (45.5%) | 6 (54.5%) |
| Law Enforcement | 46 (92.0%) | 4 (8.0%) |
| Food Preparation & Serving | 111 (59.4%) | 76 (40.6%) |
| Cleaning & Maintenance | 11 (26.2%) | 31 (73.8%) |
| Personal Care & Service | 8 (11.8%) | 60 (88.2%) |
| Total (Category) | 181 (46.9%) | 205 (53.1%) |
| Total (Overall) | 764 (51.0%) | 733 (49.0%) |
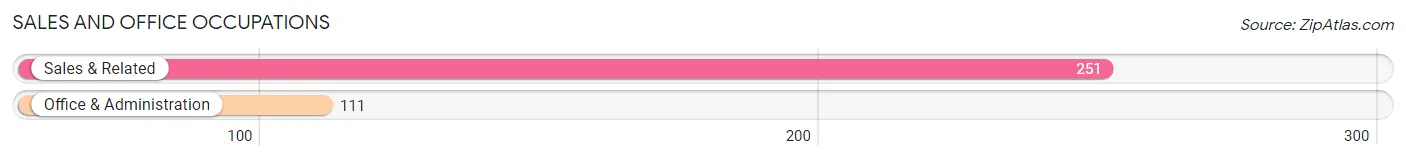
Sales and Office Occupations
The most common Sales and Office occupations in Bayfield are Sales & Related (251 | 16.8%), and Office & Administration (111 | 7.4%).
Sales and Office Occupations by Sex
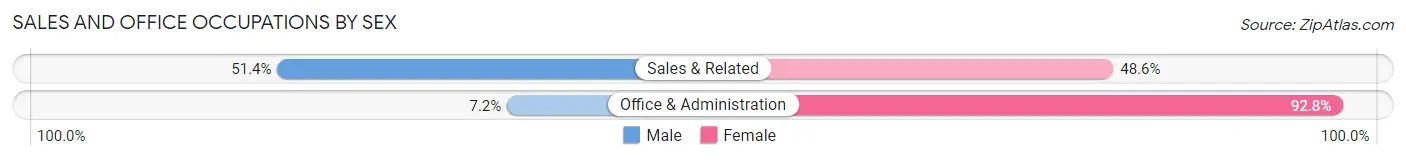
| Occupation | Male | Female |
| Sales & Related | 129 (51.4%) | 122 (48.6%) |
| Office & Administration | 8 (7.2%) | 103 (92.8%) |
| Total (Category) | 137 (37.9%) | 225 (62.2%) |
| Total (Overall) | 764 (51.0%) | 733 (49.0%) |
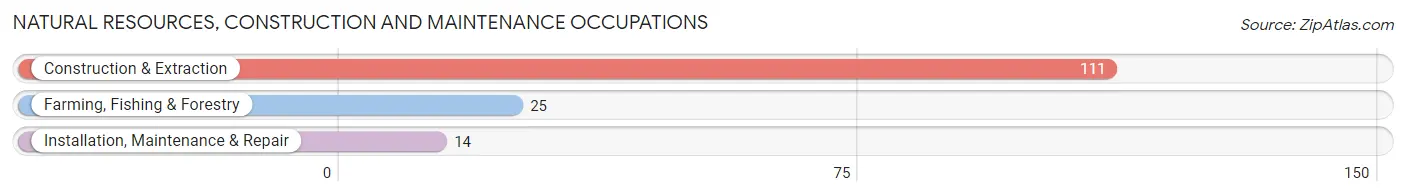
Natural Resources, Construction and Maintenance Occupations
The most common Natural Resources, Construction and Maintenance occupations in Bayfield are Construction & Extraction (111 | 7.4%), Farming, Fishing & Forestry (25 | 1.7%), and Installation, Maintenance & Repair (14 | 0.9%).
Natural Resources, Construction and Maintenance Occupations by Sex
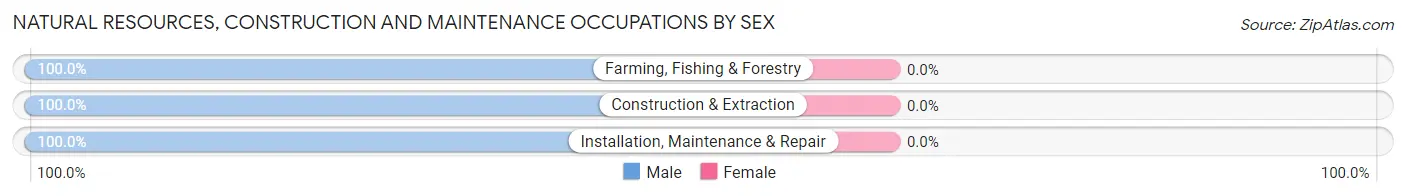
| Occupation | Male | Female |
| Farming, Fishing & Forestry | 25 (100.0%) | 0 (0.0%) |
| Construction & Extraction | 111 (100.0%) | 0 (0.0%) |
| Installation, Maintenance & Repair | 14 (100.0%) | 0 (0.0%) |
| Total (Category) | 150 (100.0%) | 0 (0.0%) |
| Total (Overall) | 764 (51.0%) | 733 (49.0%) |
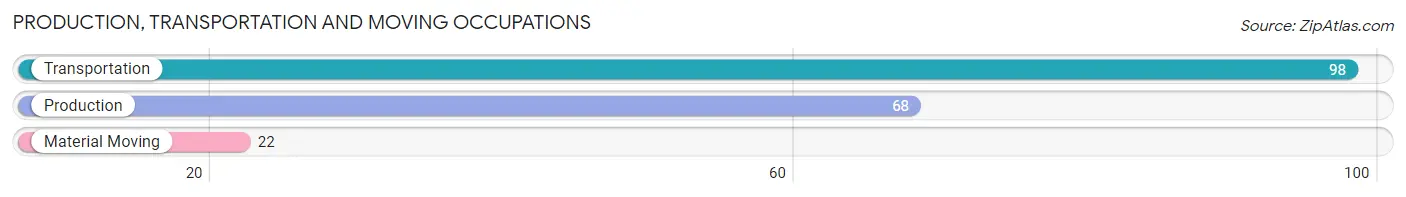
Production, Transportation and Moving Occupations
The most common Production, Transportation and Moving occupations in Bayfield are Transportation (98 | 6.6%), Production (68 | 4.5%), and Material Moving (22 | 1.5%).
Production, Transportation and Moving Occupations by Sex
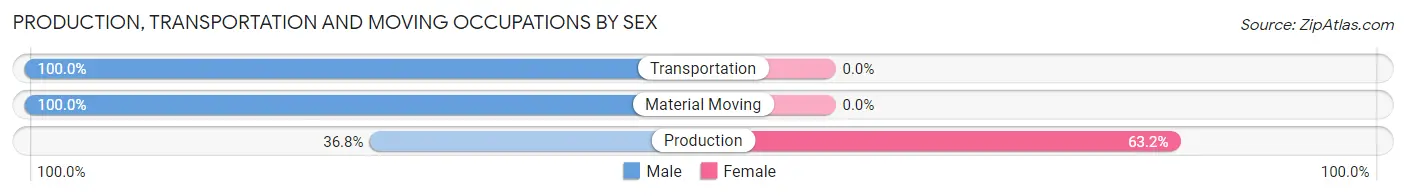
| Occupation | Male | Female |
| Production | 25 (36.8%) | 43 (63.2%) |
| Transportation | 98 (100.0%) | 0 (0.0%) |
| Material Moving | 22 (100.0%) | 0 (0.0%) |
| Total (Category) | 145 (77.1%) | 43 (22.9%) |
| Total (Overall) | 764 (51.0%) | 733 (49.0%) |
Employment Industries by Sex in Bayfield
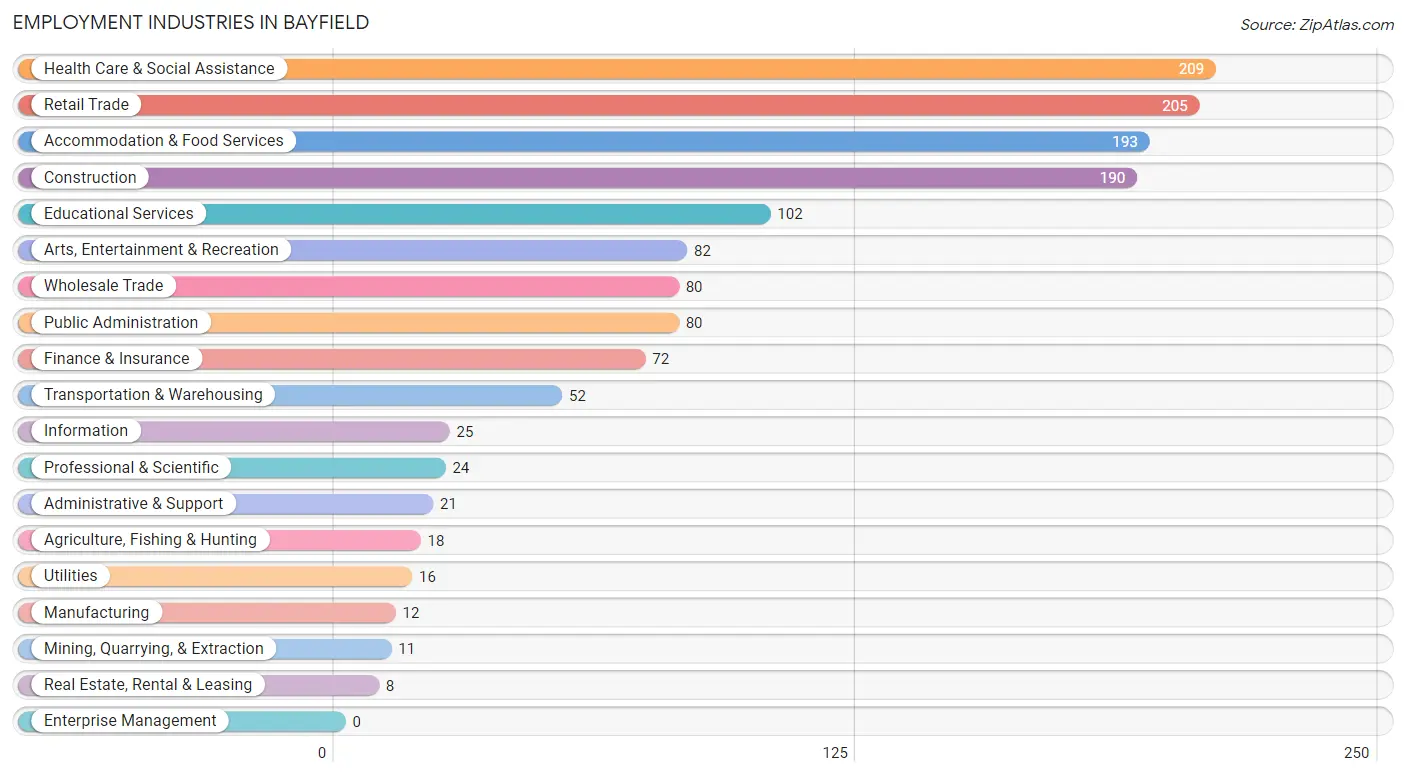
Employment Industries in Bayfield
The major employment industries in Bayfield include Health Care & Social Assistance (209 | 14.0%), Retail Trade (205 | 13.7%), Accommodation & Food Services (193 | 12.9%), Construction (190 | 12.7%), and Educational Services (102 | 6.8%).
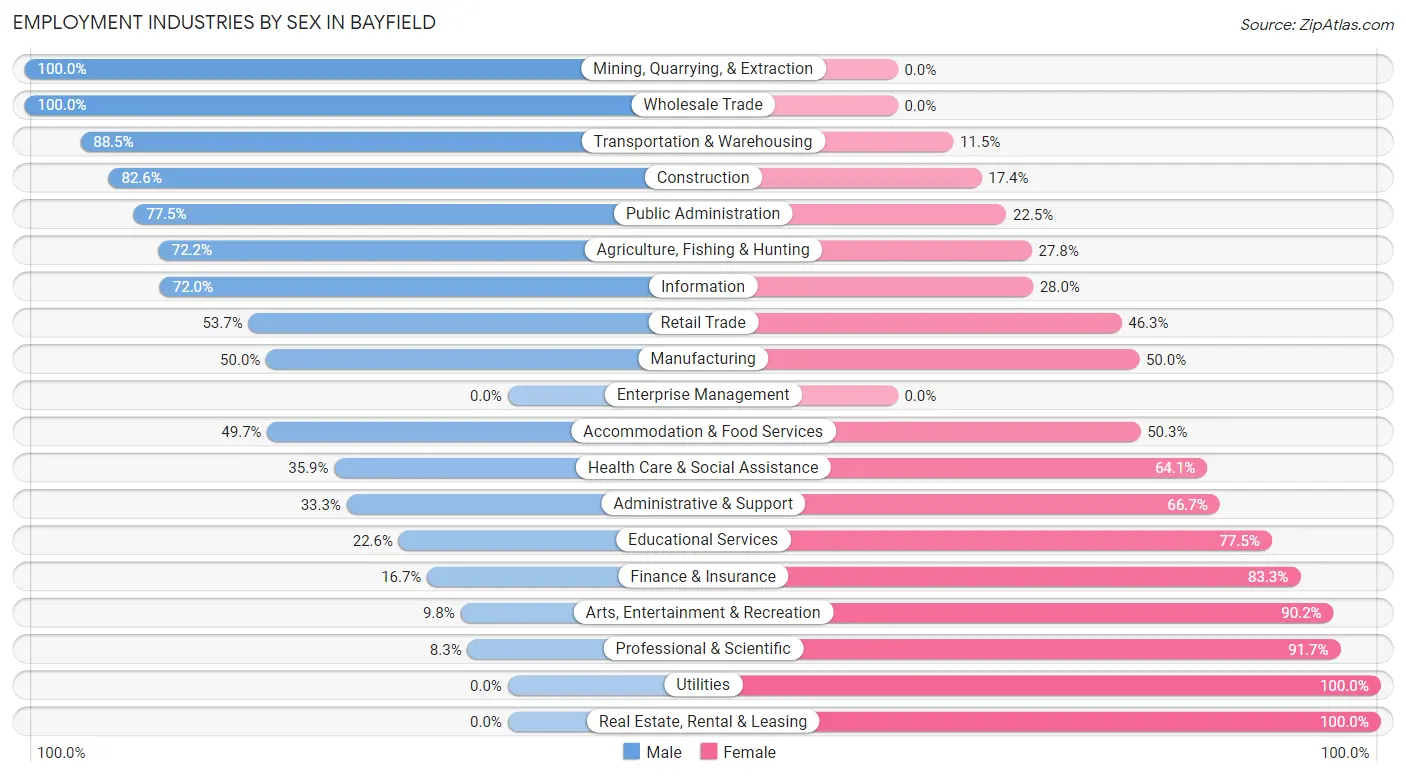
Employment Industries by Sex in Bayfield
The Bayfield industries that see more men than women are Mining, Quarrying, & Extraction (100.0%), Wholesale Trade (100.0%), and Transportation & Warehousing (88.5%), whereas the industries that tend to have a higher number of women are Utilities (100.0%), Real Estate, Rental & Leasing (100.0%), and Professional & Scientific (91.7%).
| Industry | Male | Female |
| Agriculture, Fishing & Hunting | 13 (72.2%) | 5 (27.8%) |
| Mining, Quarrying, & Extraction | 11 (100.0%) | 0 (0.0%) |
| Construction | 157 (82.6%) | 33 (17.4%) |
| Manufacturing | 6 (50.0%) | 6 (50.0%) |
| Wholesale Trade | 80 (100.0%) | 0 (0.0%) |
| Retail Trade | 110 (53.7%) | 95 (46.3%) |
| Transportation & Warehousing | 46 (88.5%) | 6 (11.5%) |
| Utilities | 0 (0.0%) | 16 (100.0%) |
| Information | 18 (72.0%) | 7 (28.0%) |
| Finance & Insurance | 12 (16.7%) | 60 (83.3%) |
| Real Estate, Rental & Leasing | 0 (0.0%) | 8 (100.0%) |
| Professional & Scientific | 2 (8.3%) | 22 (91.7%) |
| Enterprise Management | 0 (0.0%) | 0 (0.0%) |
| Administrative & Support | 7 (33.3%) | 14 (66.7%) |
| Educational Services | 23 (22.6%) | 79 (77.4%) |
| Health Care & Social Assistance | 75 (35.9%) | 134 (64.1%) |
| Arts, Entertainment & Recreation | 8 (9.8%) | 74 (90.2%) |
| Accommodation & Food Services | 96 (49.7%) | 97 (50.3%) |
| Public Administration | 62 (77.5%) | 18 (22.5%) |
| Total | 764 (51.0%) | 733 (49.0%) |
Education in Bayfield
School Enrollment in Bayfield
The most common levels of schooling among the 709 students in Bayfield are middle school (232 | 32.7%), elementary school (203 | 28.6%), and high school (153 | 21.6%).
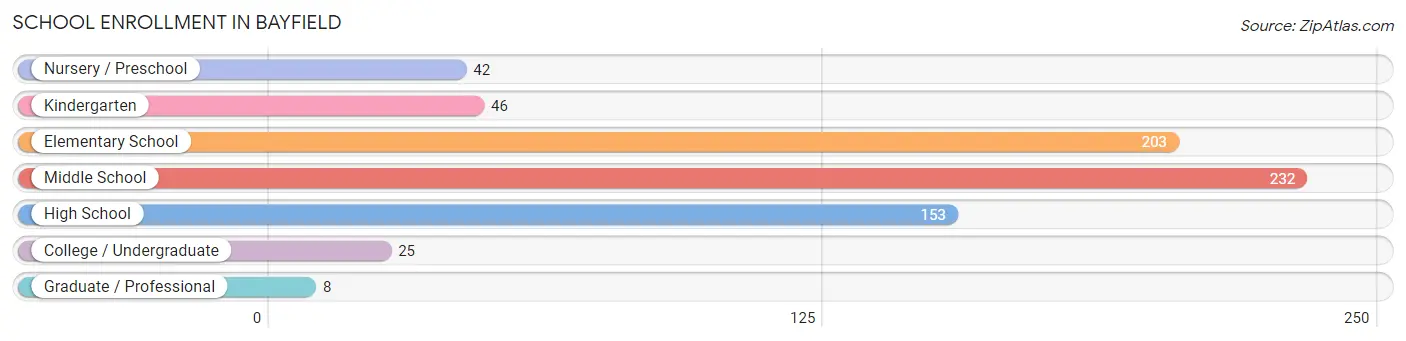
| School Level | # Students | % Students |
| Nursery / Preschool | 42 | 5.9% |
| Kindergarten | 46 | 6.5% |
| Elementary School | 203 | 28.6% |
| Middle School | 232 | 32.7% |
| High School | 153 | 21.6% |
| College / Undergraduate | 25 | 3.5% |
| Graduate / Professional | 8 | 1.1% |
| Total | 709 | 100.0% |
School Enrollment by Age by Funding Source in Bayfield
Out of a total of 709 students who are enrolled in schools in Bayfield, 38 (5.4%) attend a private institution, while the remaining 671 (94.6%) are enrolled in public schools. The age group of 15 to 17 year olds has the highest likelihood of being enrolled in private schools, with 15 (9.8% in the age bracket) enrolled. Conversely, the age group of 3 to 4 year olds has the lowest likelihood of being enrolled in a private school, with 40 (100.0% in the age bracket) attending a public institution.
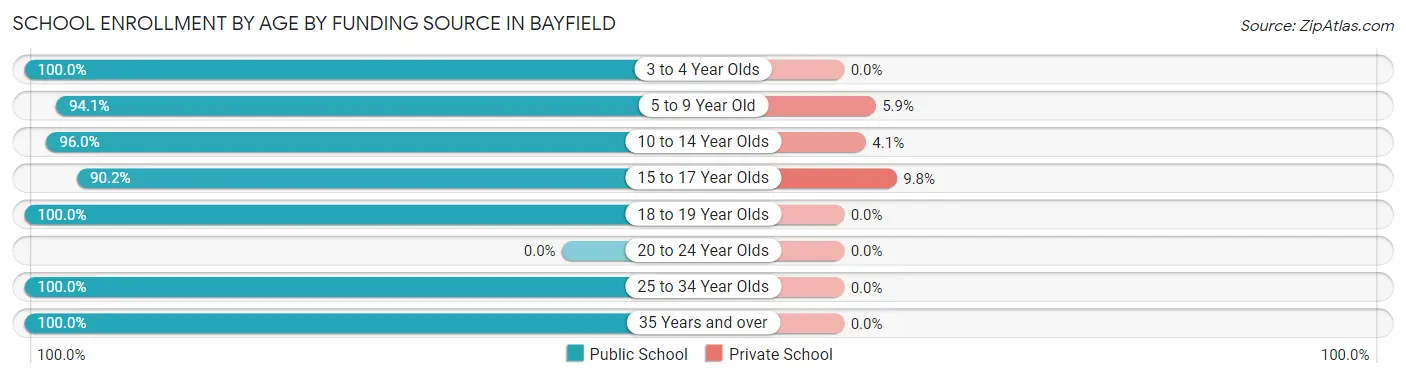
| Age Bracket | Public School | Private School |
| 3 to 4 Year Olds | 40 (100.0%) | 0 (0.0%) |
| 5 to 9 Year Old | 176 (94.1%) | 11 (5.9%) |
| 10 to 14 Year Olds | 284 (96.0%) | 12 (4.1%) |
| 15 to 17 Year Olds | 138 (90.2%) | 15 (9.8%) |
| 18 to 19 Year Olds | 6 (100.0%) | 0 (0.0%) |
| 20 to 24 Year Olds | 0 (0.0%) | 0 (0.0%) |
| 25 to 34 Year Olds | 6 (100.0%) | 0 (0.0%) |
| 35 Years and over | 21 (100.0%) | 0 (0.0%) |
| Total | 671 (94.6%) | 38 (5.4%) |
Educational Attainment by Field of Study in Bayfield
Business (96 | 16.2%), bio, nature & agricultural (65 | 11.0%), psychology (63 | 10.6%), social sciences (63 | 10.6%), and arts & humanities (63 | 10.6%) are the most common fields of study among 592 individuals in Bayfield who have obtained a bachelor's degree or higher.
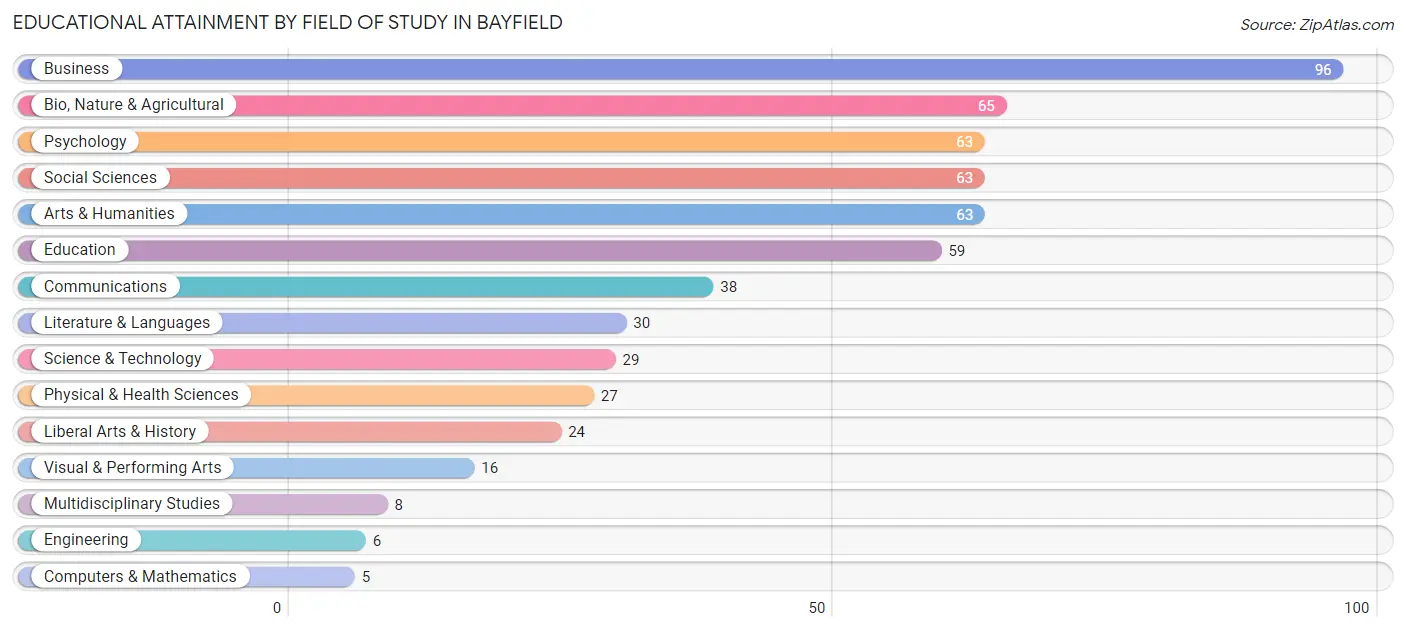
| Field of Study | # Graduates | % Graduates |
| Computers & Mathematics | 5 | 0.8% |
| Bio, Nature & Agricultural | 65 | 11.0% |
| Physical & Health Sciences | 27 | 4.6% |
| Psychology | 63 | 10.6% |
| Social Sciences | 63 | 10.6% |
| Engineering | 6 | 1.0% |
| Multidisciplinary Studies | 8 | 1.3% |
| Science & Technology | 29 | 4.9% |
| Business | 96 | 16.2% |
| Education | 59 | 10.0% |
| Literature & Languages | 30 | 5.1% |
| Liberal Arts & History | 24 | 4.1% |
| Visual & Performing Arts | 16 | 2.7% |
| Communications | 38 | 6.4% |
| Arts & Humanities | 63 | 10.6% |
| Total | 592 | 100.0% |
Transportation & Commute in Bayfield
Vehicle Availability by Sex in Bayfield
The most prevalent vehicle ownership categories in Bayfield are males with 2 vehicles (490, accounting for 64.5%) and females with 2 vehicles (418, making up 69.0%).
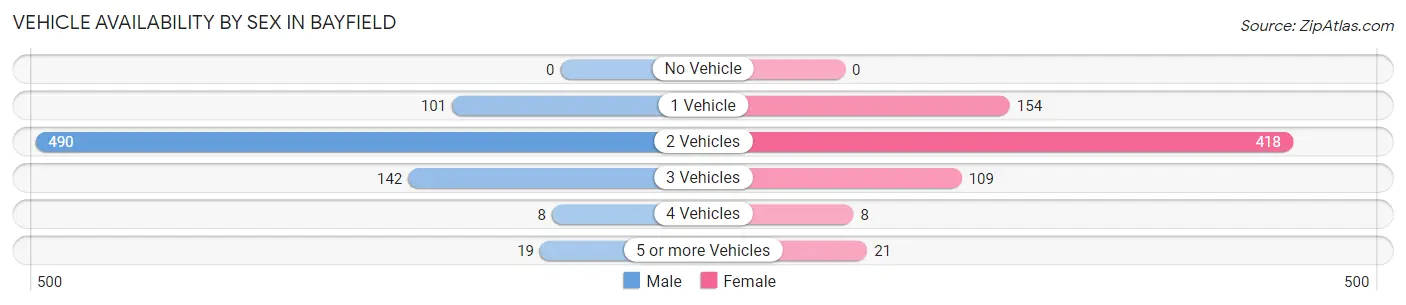
| Vehicles Available | Male | Female |
| No Vehicle | 0 (0.0%) | 0 (0.0%) |
| 1 Vehicle | 101 (13.3%) | 154 (21.7%) |
| 2 Vehicles | 490 (64.5%) | 418 (58.9%) |
| 3 Vehicles | 142 (18.7%) | 109 (15.3%) |
| 4 Vehicles | 8 (1.1%) | 8 (1.1%) |
| 5 or more Vehicles | 19 (2.5%) | 21 (3.0%) |
| Total | 760 (100.0%) | 710 (100.0%) |
Commute Time in Bayfield
The most frequently occuring commute durations in Bayfield are 30 to 34 minutes (330 commuters, 25.1%), 5 to 9 minutes (239 commuters, 18.2%), and 20 to 24 minutes (233 commuters, 17.7%).
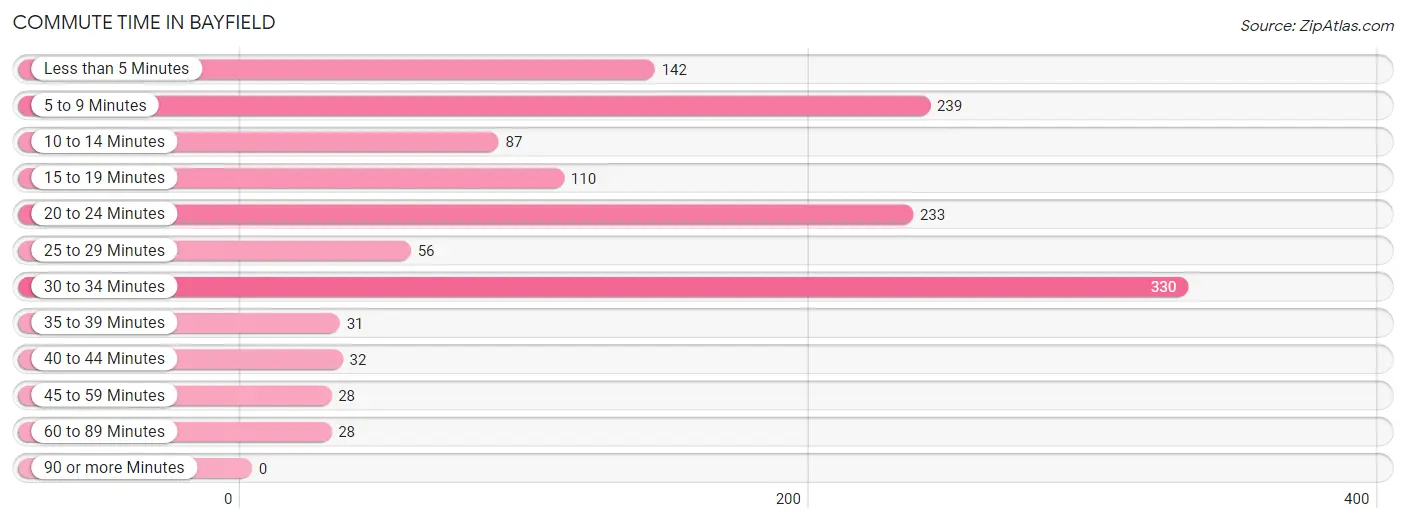
| Commute Time | # Commuters | % Commuters |
| Less than 5 Minutes | 142 | 10.8% |
| 5 to 9 Minutes | 239 | 18.2% |
| 10 to 14 Minutes | 87 | 6.6% |
| 15 to 19 Minutes | 110 | 8.4% |
| 20 to 24 Minutes | 233 | 17.7% |
| 25 to 29 Minutes | 56 | 4.3% |
| 30 to 34 Minutes | 330 | 25.1% |
| 35 to 39 Minutes | 31 | 2.4% |
| 40 to 44 Minutes | 32 | 2.4% |
| 45 to 59 Minutes | 28 | 2.1% |
| 60 to 89 Minutes | 28 | 2.1% |
| 90 or more Minutes | 0 | 0.0% |
Commute Time by Sex in Bayfield
The most common commute times in Bayfield are 20 to 24 minutes (192 commuters, 26.5%) for males and 30 to 34 minutes (143 commuters, 24.2%) for females.
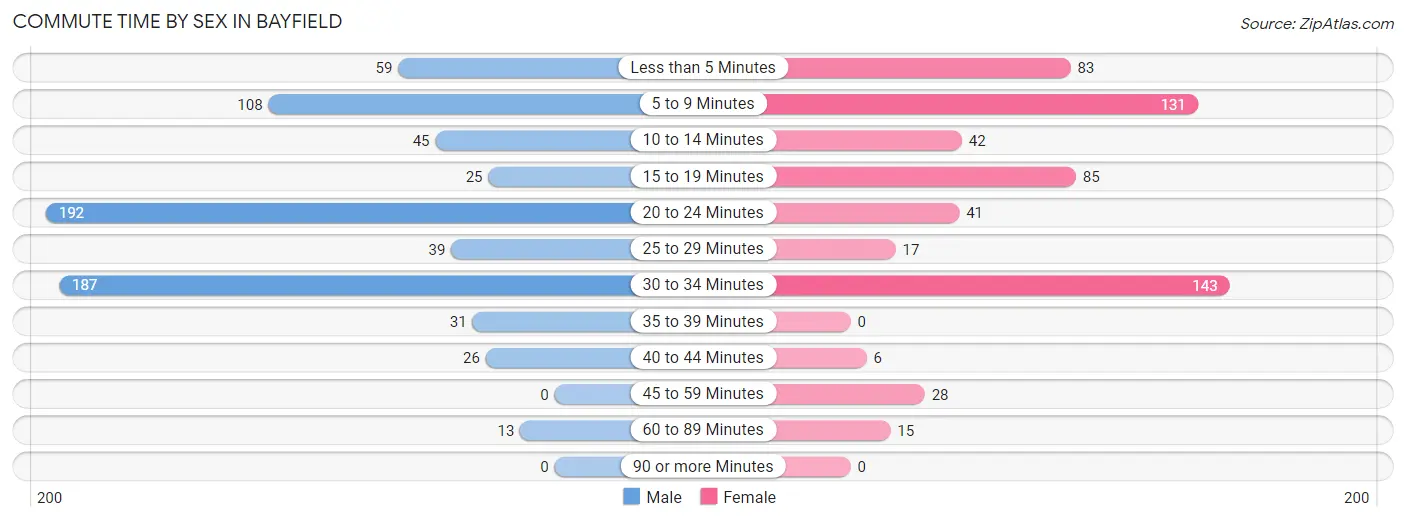
| Commute Time | Male | Female |
| Less than 5 Minutes | 59 (8.1%) | 83 (14.0%) |
| 5 to 9 Minutes | 108 (14.9%) | 131 (22.2%) |
| 10 to 14 Minutes | 45 (6.2%) | 42 (7.1%) |
| 15 to 19 Minutes | 25 (3.5%) | 85 (14.4%) |
| 20 to 24 Minutes | 192 (26.5%) | 41 (6.9%) |
| 25 to 29 Minutes | 39 (5.4%) | 17 (2.9%) |
| 30 to 34 Minutes | 187 (25.8%) | 143 (24.2%) |
| 35 to 39 Minutes | 31 (4.3%) | 0 (0.0%) |
| 40 to 44 Minutes | 26 (3.6%) | 6 (1.0%) |
| 45 to 59 Minutes | 0 (0.0%) | 28 (4.7%) |
| 60 to 89 Minutes | 13 (1.8%) | 15 (2.5%) |
| 90 or more Minutes | 0 (0.0%) | 0 (0.0%) |
Time of Departure to Work by Sex in Bayfield
The most frequent times of departure to work in Bayfield are 6:30 AM to 6:59 AM (163, 22.5%) for males and 7:30 AM to 7:59 AM (207, 35.0%) for females.
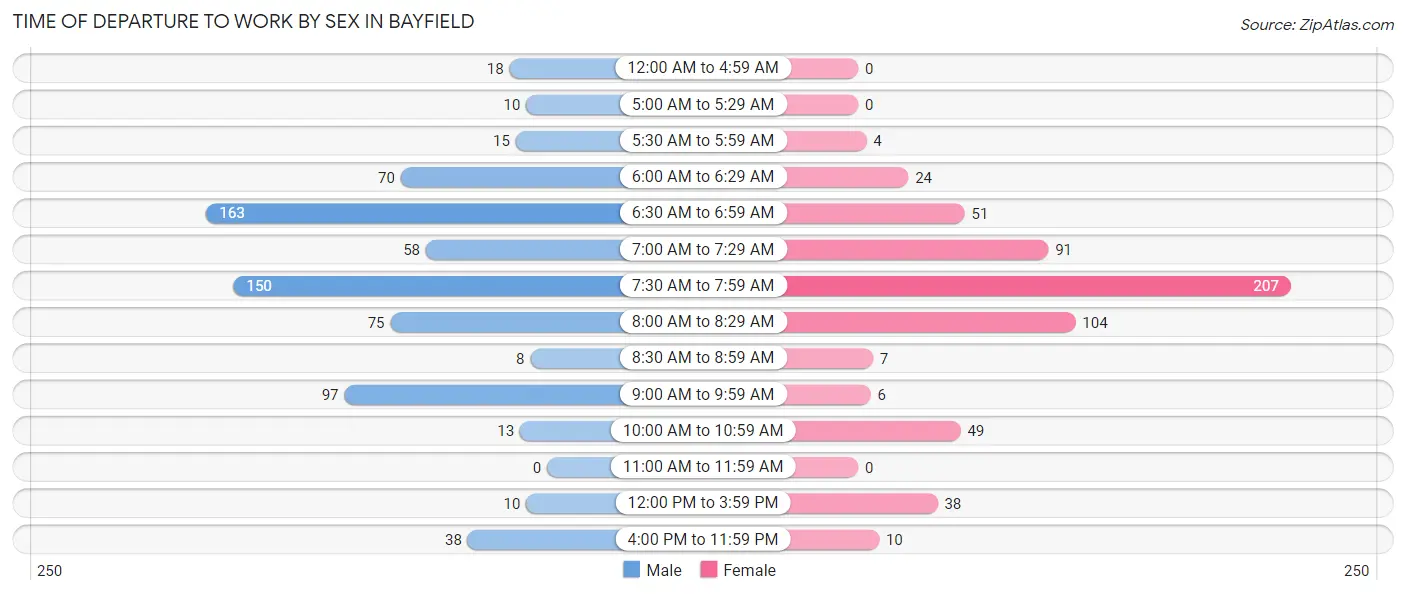
| Time of Departure | Male | Female |
| 12:00 AM to 4:59 AM | 18 (2.5%) | 0 (0.0%) |
| 5:00 AM to 5:29 AM | 10 (1.4%) | 0 (0.0%) |
| 5:30 AM to 5:59 AM | 15 (2.1%) | 4 (0.7%) |
| 6:00 AM to 6:29 AM | 70 (9.7%) | 24 (4.1%) |
| 6:30 AM to 6:59 AM | 163 (22.5%) | 51 (8.6%) |
| 7:00 AM to 7:29 AM | 58 (8.0%) | 91 (15.4%) |
| 7:30 AM to 7:59 AM | 150 (20.7%) | 207 (35.0%) |
| 8:00 AM to 8:29 AM | 75 (10.3%) | 104 (17.6%) |
| 8:30 AM to 8:59 AM | 8 (1.1%) | 7 (1.2%) |
| 9:00 AM to 9:59 AM | 97 (13.4%) | 6 (1.0%) |
| 10:00 AM to 10:59 AM | 13 (1.8%) | 49 (8.3%) |
| 11:00 AM to 11:59 AM | 0 (0.0%) | 0 (0.0%) |
| 12:00 PM to 3:59 PM | 10 (1.4%) | 38 (6.4%) |
| 4:00 PM to 11:59 PM | 38 (5.2%) | 10 (1.7%) |
| Total | 725 (100.0%) | 591 (100.0%) |
Housing Occupancy in Bayfield
Occupancy by Ownership in Bayfield
Of the total 1,017 dwellings in Bayfield, owner-occupied units account for 751 (73.8%), while renter-occupied units make up 266 (26.2%).
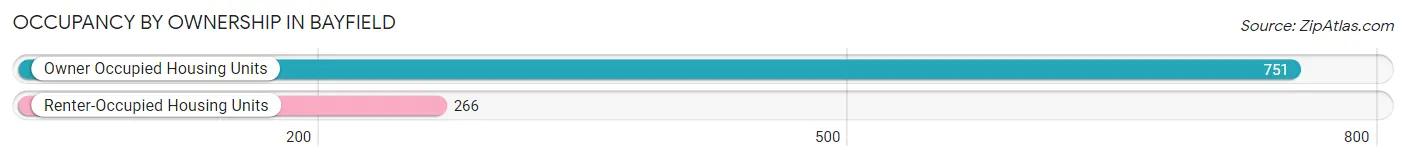
| Occupancy | # Housing Units | % Housing Units |
| Owner Occupied Housing Units | 751 | 73.8% |
| Renter-Occupied Housing Units | 266 | 26.2% |
| Total Occupied Housing Units | 1,017 | 100.0% |
Occupancy by Household Size in Bayfield
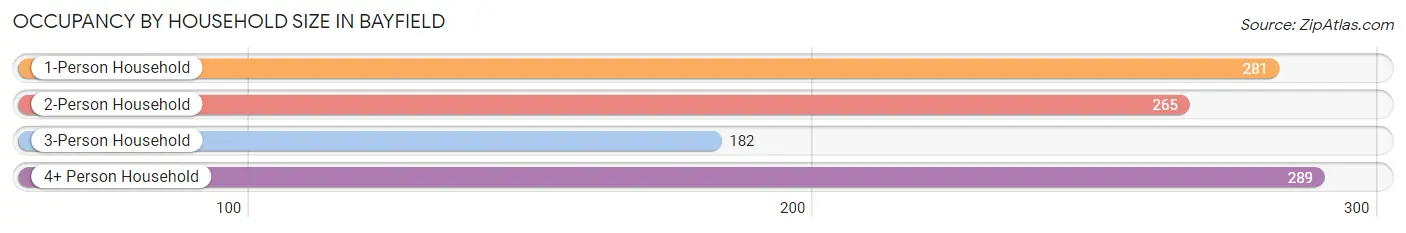
| Household Size | # Housing Units | % Housing Units |
| 1-Person Household | 281 | 27.6% |
| 2-Person Household | 265 | 26.1% |
| 3-Person Household | 182 | 17.9% |
| 4+ Person Household | 289 | 28.4% |
| Total Housing Units | 1,017 | 100.0% |
Occupancy by Ownership by Household Size in Bayfield
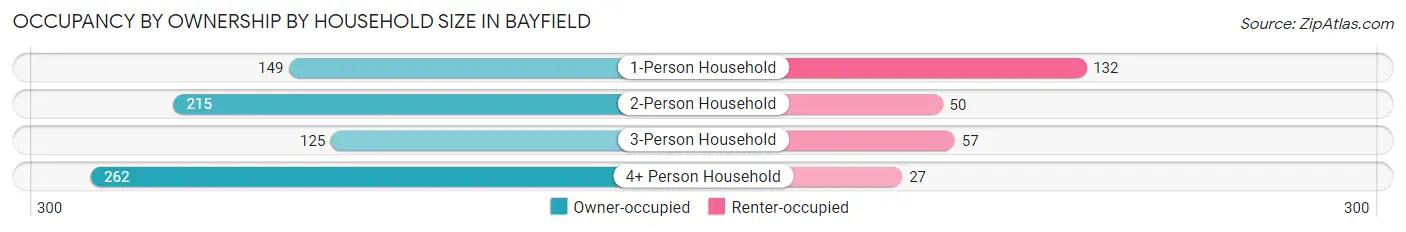
| Household Size | Owner-occupied | Renter-occupied |
| 1-Person Household | 149 (53.0%) | 132 (47.0%) |
| 2-Person Household | 215 (81.1%) | 50 (18.9%) |
| 3-Person Household | 125 (68.7%) | 57 (31.3%) |
| 4+ Person Household | 262 (90.7%) | 27 (9.3%) |
| Total Housing Units | 751 (73.8%) | 266 (26.2%) |
Occupancy by Educational Attainment in Bayfield
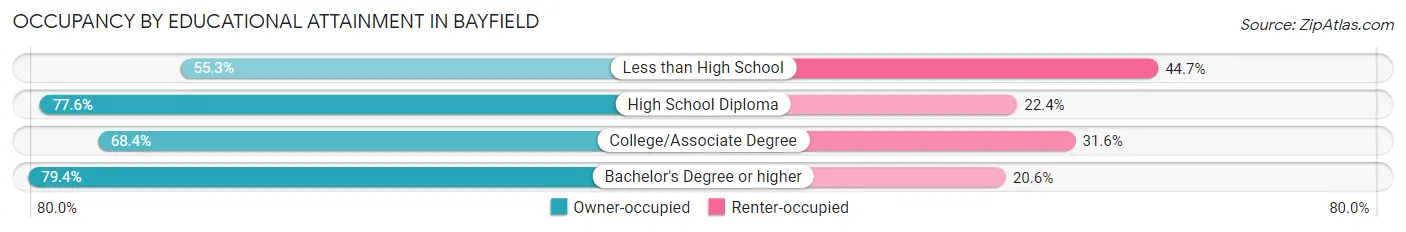
| Household Size | Owner-occupied | Renter-occupied |
| Less than High School | 21 (55.3%) | 17 (44.7%) |
| High School Diploma | 194 (77.6%) | 56 (22.4%) |
| College/Associate Degree | 266 (68.4%) | 123 (31.6%) |
| Bachelor's Degree or higher | 270 (79.4%) | 70 (20.6%) |
Occupancy by Age of Householder in Bayfield
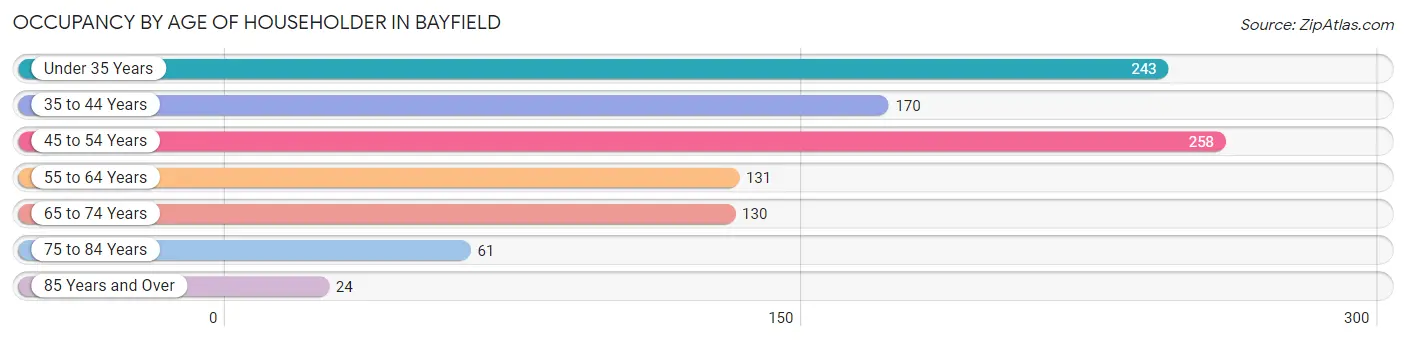
| Age Bracket | # Households | % Households |
| Under 35 Years | 243 | 23.9% |
| 35 to 44 Years | 170 | 16.7% |
| 45 to 54 Years | 258 | 25.4% |
| 55 to 64 Years | 131 | 12.9% |
| 65 to 74 Years | 130 | 12.8% |
| 75 to 84 Years | 61 | 6.0% |
| 85 Years and Over | 24 | 2.4% |
| Total | 1,017 | 100.0% |
Housing Finances in Bayfield
Median Income by Occupancy in Bayfield
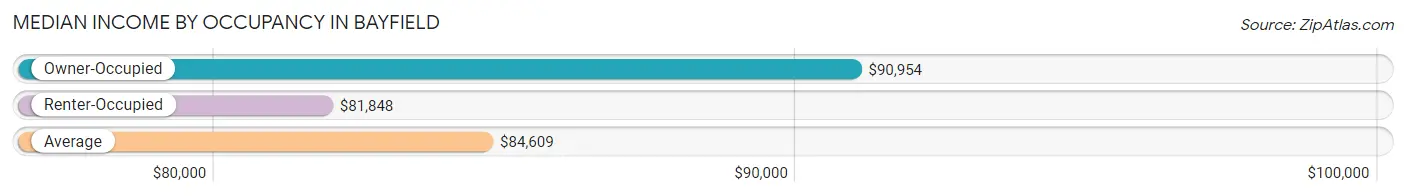
| Occupancy Type | # Households | Median Income |
| Owner-Occupied | 751 (73.8%) | $90,954 |
| Renter-Occupied | 266 (26.2%) | $81,848 |
| Average | 1,017 (100.0%) | $84,609 |
Occupancy by Householder Income Bracket in Bayfield
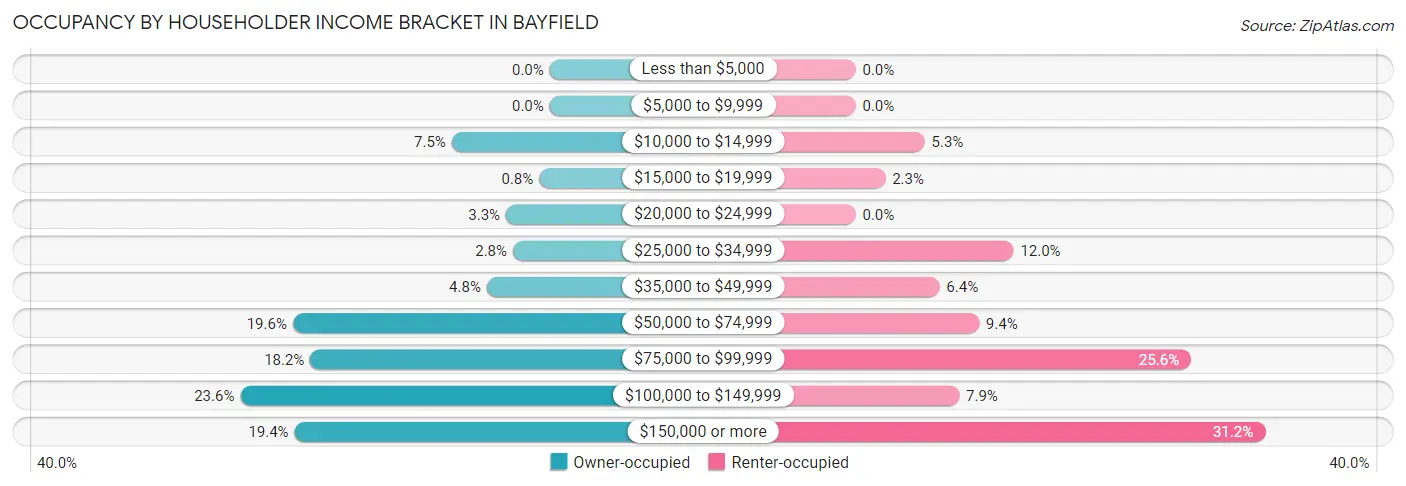
| Income Bracket | Owner-occupied | Renter-occupied |
| Less than $5,000 | 0 (0.0%) | 0 (0.0%) |
| $5,000 to $9,999 | 0 (0.0%) | 0 (0.0%) |
| $10,000 to $14,999 | 56 (7.5%) | 14 (5.3%) |
| $15,000 to $19,999 | 6 (0.8%) | 6 (2.3%) |
| $20,000 to $24,999 | 25 (3.3%) | 0 (0.0%) |
| $25,000 to $34,999 | 21 (2.8%) | 32 (12.0%) |
| $35,000 to $49,999 | 36 (4.8%) | 17 (6.4%) |
| $50,000 to $74,999 | 147 (19.6%) | 25 (9.4%) |
| $75,000 to $99,999 | 137 (18.2%) | 68 (25.6%) |
| $100,000 to $149,999 | 177 (23.6%) | 21 (7.9%) |
| $150,000 or more | 146 (19.4%) | 83 (31.2%) |
| Total | 751 (100.0%) | 266 (100.0%) |
Monthly Housing Cost Tiers in Bayfield
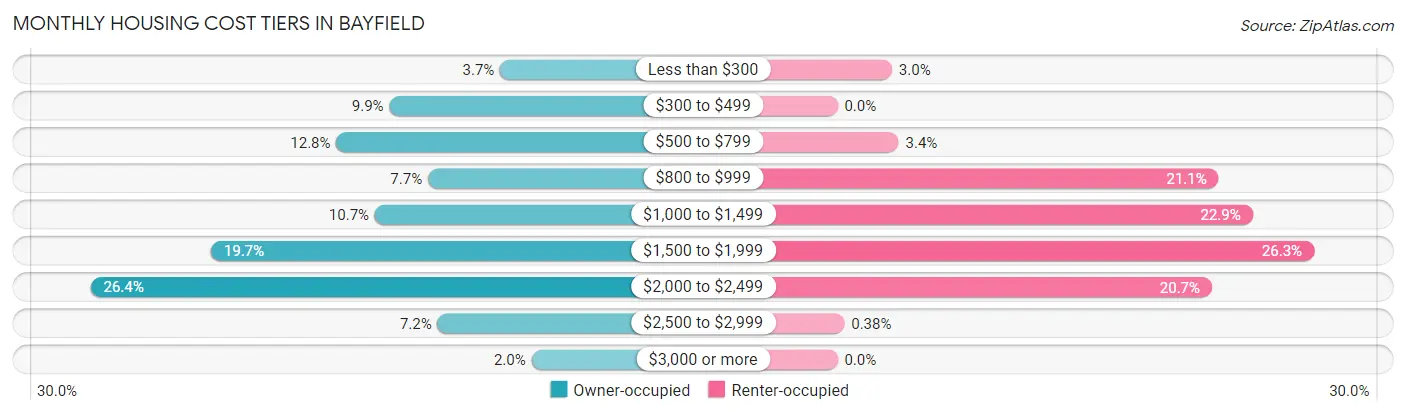
| Monthly Cost | Owner-occupied | Renter-occupied |
| Less than $300 | 28 (3.7%) | 8 (3.0%) |
| $300 to $499 | 74 (9.9%) | 0 (0.0%) |
| $500 to $799 | 96 (12.8%) | 9 (3.4%) |
| $800 to $999 | 58 (7.7%) | 56 (21.0%) |
| $1,000 to $1,499 | 80 (10.6%) | 61 (22.9%) |
| $1,500 to $1,999 | 148 (19.7%) | 70 (26.3%) |
| $2,000 to $2,499 | 198 (26.4%) | 55 (20.7%) |
| $2,500 to $2,999 | 54 (7.2%) | 1 (0.4%) |
| $3,000 or more | 15 (2.0%) | 0 (0.0%) |
| Total | 751 (100.0%) | 266 (100.0%) |
Physical Housing Characteristics in Bayfield
Housing Structures in Bayfield
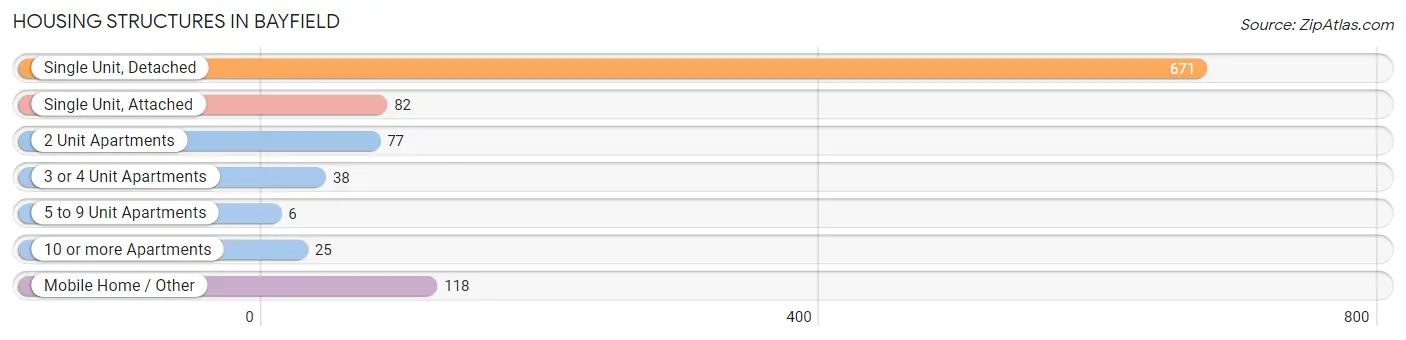
| Structure Type | # Housing Units | % Housing Units |
| Single Unit, Detached | 671 | 66.0% |
| Single Unit, Attached | 82 | 8.1% |
| 2 Unit Apartments | 77 | 7.6% |
| 3 or 4 Unit Apartments | 38 | 3.7% |
| 5 to 9 Unit Apartments | 6 | 0.6% |
| 10 or more Apartments | 25 | 2.5% |
| Mobile Home / Other | 118 | 11.6% |
| Total | 1,017 | 100.0% |
Housing Structures by Occupancy in Bayfield
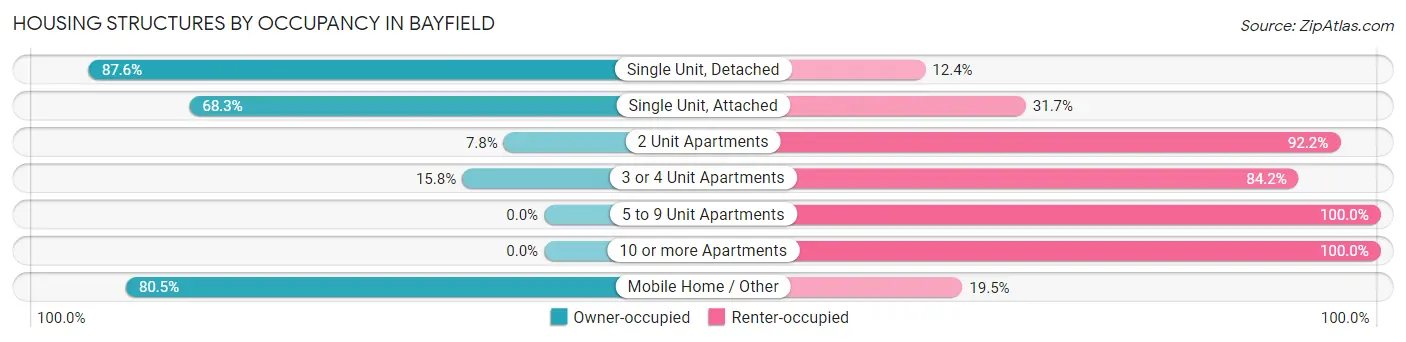
| Structure Type | Owner-occupied | Renter-occupied |
| Single Unit, Detached | 588 (87.6%) | 83 (12.4%) |
| Single Unit, Attached | 56 (68.3%) | 26 (31.7%) |
| 2 Unit Apartments | 6 (7.8%) | 71 (92.2%) |
| 3 or 4 Unit Apartments | 6 (15.8%) | 32 (84.2%) |
| 5 to 9 Unit Apartments | 0 (0.0%) | 6 (100.0%) |
| 10 or more Apartments | 0 (0.0%) | 25 (100.0%) |
| Mobile Home / Other | 95 (80.5%) | 23 (19.5%) |
| Total | 751 (73.8%) | 266 (26.2%) |
Housing Structures by Number of Rooms in Bayfield
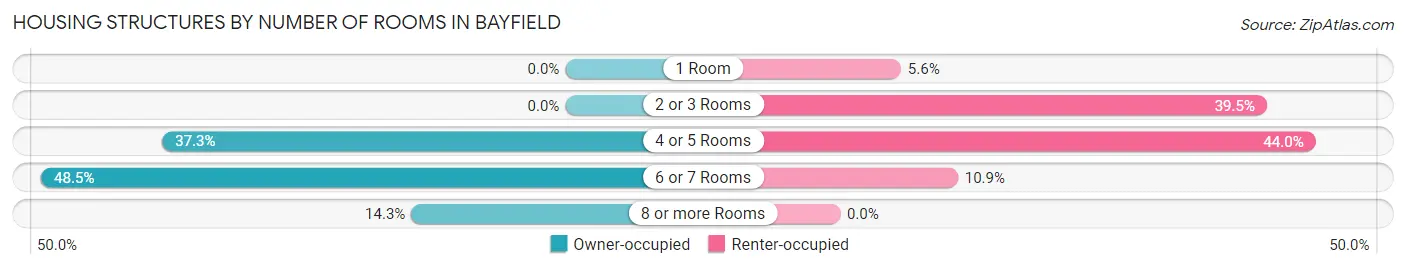
| Number of Rooms | Owner-occupied | Renter-occupied |
| 1 Room | 0 (0.0%) | 15 (5.6%) |
| 2 or 3 Rooms | 0 (0.0%) | 105 (39.5%) |
| 4 or 5 Rooms | 280 (37.3%) | 117 (44.0%) |
| 6 or 7 Rooms | 364 (48.5%) | 29 (10.9%) |
| 8 or more Rooms | 107 (14.2%) | 0 (0.0%) |
| Total | 751 (100.0%) | 266 (100.0%) |
Housing Structure by Heating Type in Bayfield
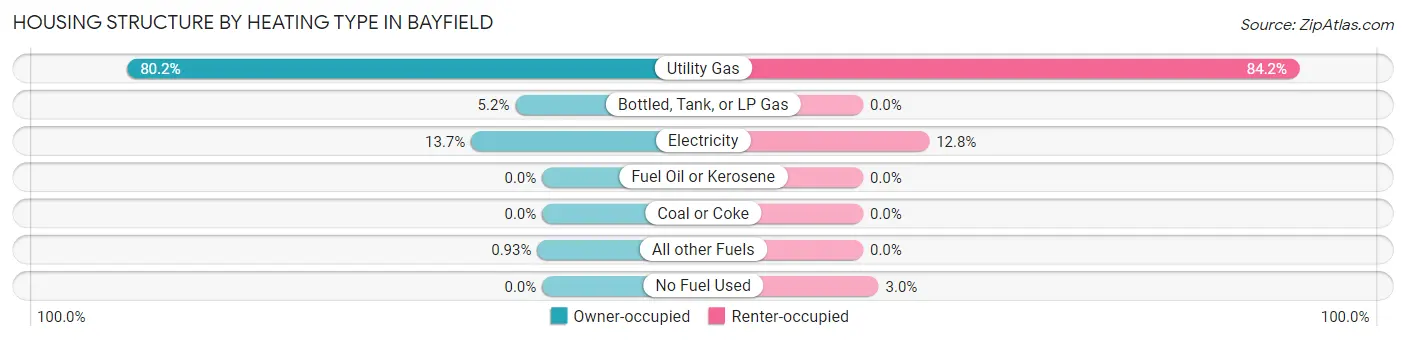
| Heating Type | Owner-occupied | Renter-occupied |
| Utility Gas | 602 (80.2%) | 224 (84.2%) |
| Bottled, Tank, or LP Gas | 39 (5.2%) | 0 (0.0%) |
| Electricity | 103 (13.7%) | 34 (12.8%) |
| Fuel Oil or Kerosene | 0 (0.0%) | 0 (0.0%) |
| Coal or Coke | 0 (0.0%) | 0 (0.0%) |
| All other Fuels | 7 (0.9%) | 0 (0.0%) |
| No Fuel Used | 0 (0.0%) | 8 (3.0%) |
| Total | 751 (100.0%) | 266 (100.0%) |
Household Vehicle Usage in Bayfield
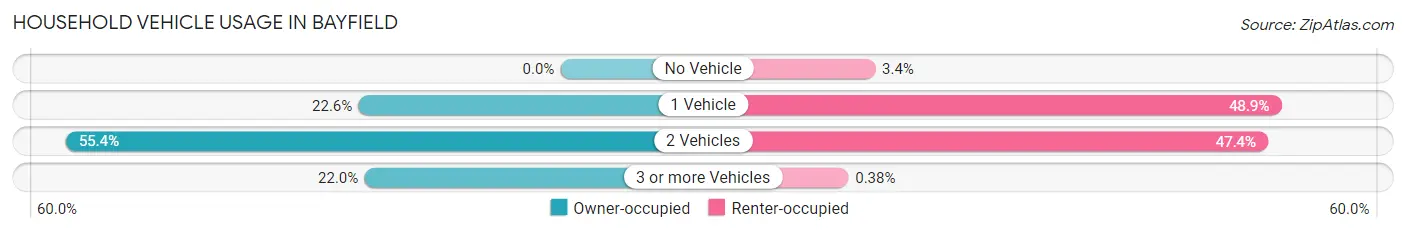
| Vehicles per Household | Owner-occupied | Renter-occupied |
| No Vehicle | 0 (0.0%) | 9 (3.4%) |
| 1 Vehicle | 170 (22.6%) | 130 (48.9%) |
| 2 Vehicles | 416 (55.4%) | 126 (47.4%) |
| 3 or more Vehicles | 165 (22.0%) | 1 (0.4%) |
| Total | 751 (100.0%) | 266 (100.0%) |
Real Estate & Mortgages in Bayfield
Real Estate and Mortgage Overview in Bayfield
| Characteristic | Without Mortgage | With Mortgage |
| Housing Units | 209 | 542 |
| Median Property Value | $287,500 | $388,300 |
| Median Household Income | $61,157 | $116 |
| Monthly Housing Costs | $509 | $15 |
| Real Estate Taxes | $1,338 | $2 |
Property Value by Mortgage Status in Bayfield
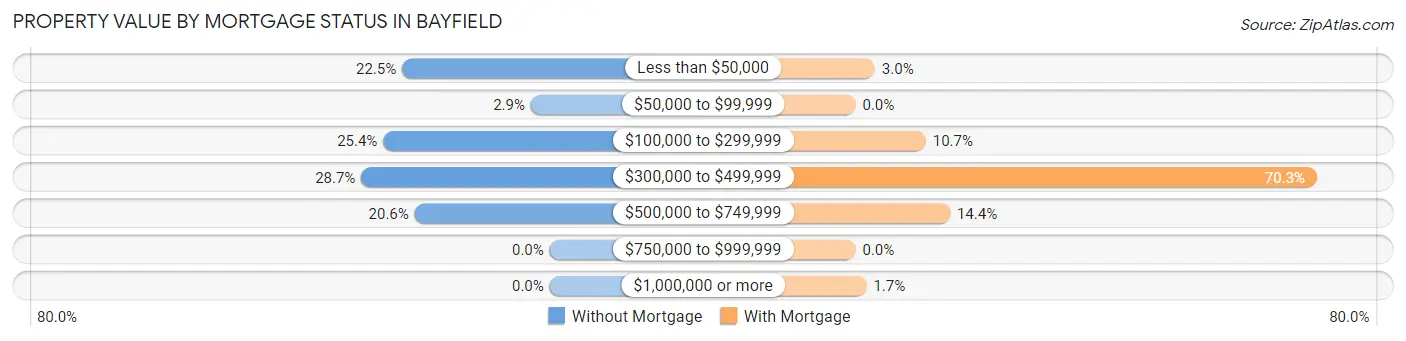
| Property Value | Without Mortgage | With Mortgage |
| Less than $50,000 | 47 (22.5%) | 16 (2.9%) |
| $50,000 to $99,999 | 6 (2.9%) | 0 (0.0%) |
| $100,000 to $299,999 | 53 (25.4%) | 58 (10.7%) |
| $300,000 to $499,999 | 60 (28.7%) | 381 (70.3%) |
| $500,000 to $749,999 | 43 (20.6%) | 78 (14.4%) |
| $750,000 to $999,999 | 0 (0.0%) | 0 (0.0%) |
| $1,000,000 or more | 0 (0.0%) | 9 (1.7%) |
| Total | 209 (100.0%) | 542 (100.0%) |
Household Income by Mortgage Status in Bayfield
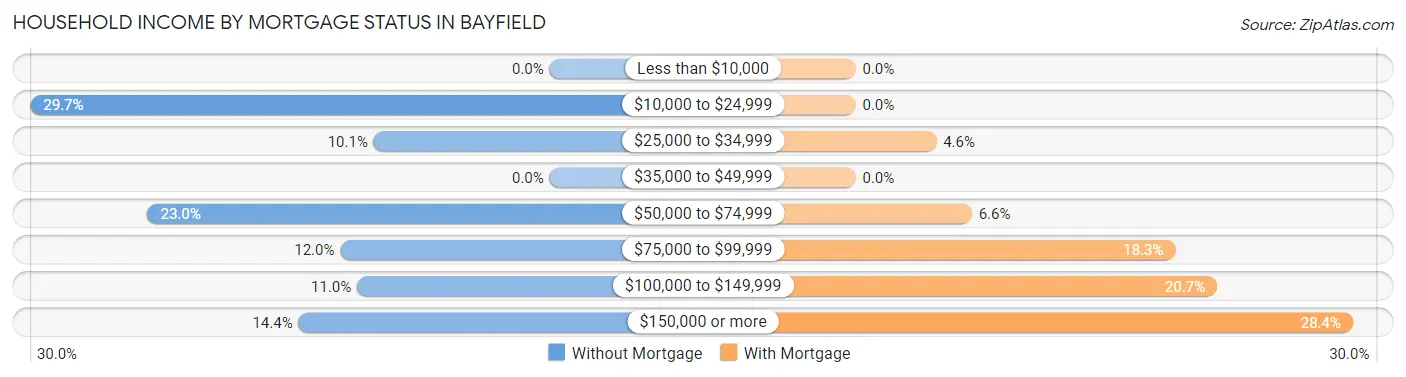
| Household Income | Without Mortgage | With Mortgage |
| Less than $10,000 | 0 (0.0%) | 0 (0.0%) |
| $10,000 to $24,999 | 62 (29.7%) | 0 (0.0%) |
| $25,000 to $34,999 | 21 (10.1%) | 25 (4.6%) |
| $35,000 to $49,999 | 0 (0.0%) | 0 (0.0%) |
| $50,000 to $74,999 | 48 (23.0%) | 36 (6.6%) |
| $75,000 to $99,999 | 25 (12.0%) | 99 (18.3%) |
| $100,000 to $149,999 | 23 (11.0%) | 112 (20.7%) |
| $150,000 or more | 30 (14.3%) | 154 (28.4%) |
| Total | 209 (100.0%) | 542 (100.0%) |
Property Value to Household Income Ratio in Bayfield
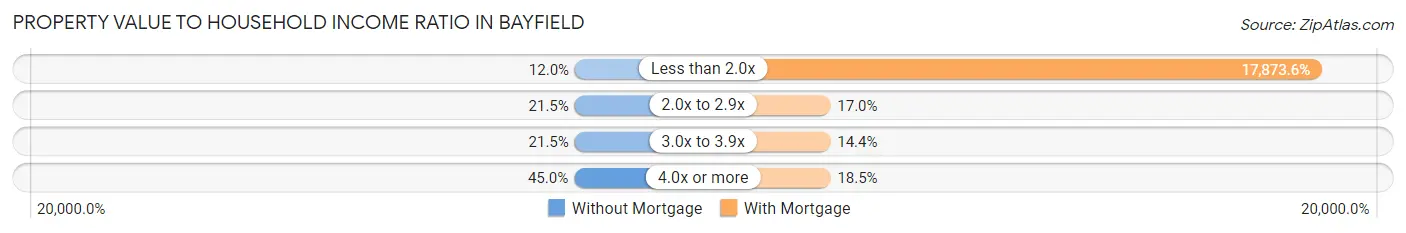
| Value-to-Income Ratio | Without Mortgage | With Mortgage |
| Less than 2.0x | 25 (12.0%) | 96,875 (17,873.6%) |
| 2.0x to 2.9x | 45 (21.5%) | 92 (17.0%) |
| 3.0x to 3.9x | 45 (21.5%) | 78 (14.4%) |
| 4.0x or more | 94 (45.0%) | 100 (18.4%) |
| Total | 209 (100.0%) | 542 (100.0%) |
Real Estate Taxes by Mortgage Status in Bayfield
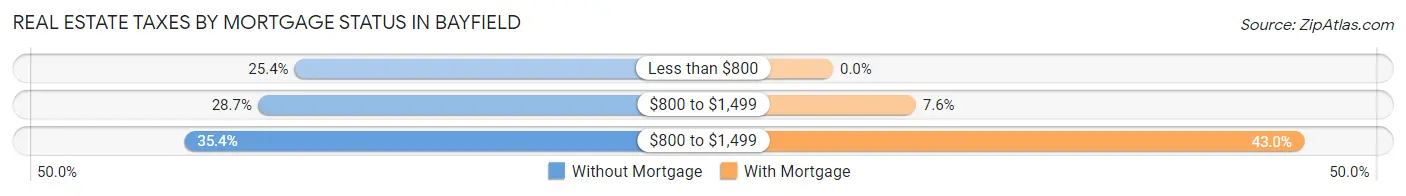
| Property Taxes | Without Mortgage | With Mortgage |
| Less than $800 | 53 (25.4%) | 0 (0.0%) |
| $800 to $1,499 | 60 (28.7%) | 41 (7.6%) |
| $800 to $1,499 | 74 (35.4%) | 233 (43.0%) |
| Total | 209 (100.0%) | 542 (100.0%) |
Health & Disability in Bayfield
Health Insurance Coverage by Age in Bayfield
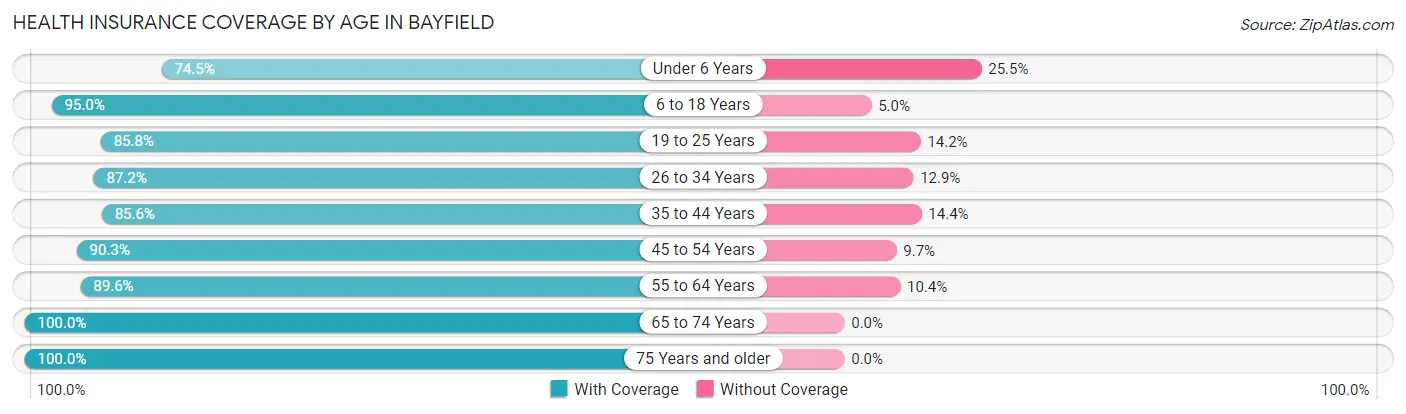
| Age Bracket | With Coverage | Without Coverage |
| Under 6 Years | 207 (74.5%) | 71 (25.5%) |
| 6 to 18 Years | 586 (95.0%) | 31 (5.0%) |
| 19 to 25 Years | 151 (85.8%) | 25 (14.2%) |
| 26 to 34 Years | 434 (87.2%) | 64 (12.9%) |
| 35 to 44 Years | 256 (85.6%) | 43 (14.4%) |
| 45 to 54 Years | 391 (90.3%) | 42 (9.7%) |
| 55 to 64 Years | 241 (89.6%) | 28 (10.4%) |
| 65 to 74 Years | 179 (100.0%) | 0 (0.0%) |
| 75 Years and older | 100 (100.0%) | 0 (0.0%) |
| Total | 2,545 (89.3%) | 304 (10.7%) |
Health Insurance Coverage by Citizenship Status in Bayfield
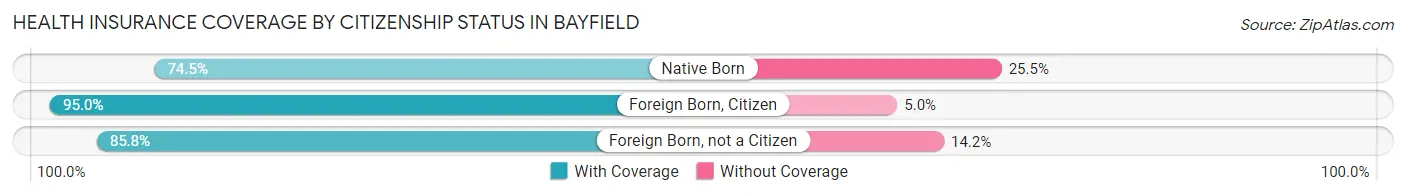
| Citizenship Status | With Coverage | Without Coverage |
| Native Born | 207 (74.5%) | 71 (25.5%) |
| Foreign Born, Citizen | 586 (95.0%) | 31 (5.0%) |
| Foreign Born, not a Citizen | 151 (85.8%) | 25 (14.2%) |
Health Insurance Coverage by Household Income in Bayfield
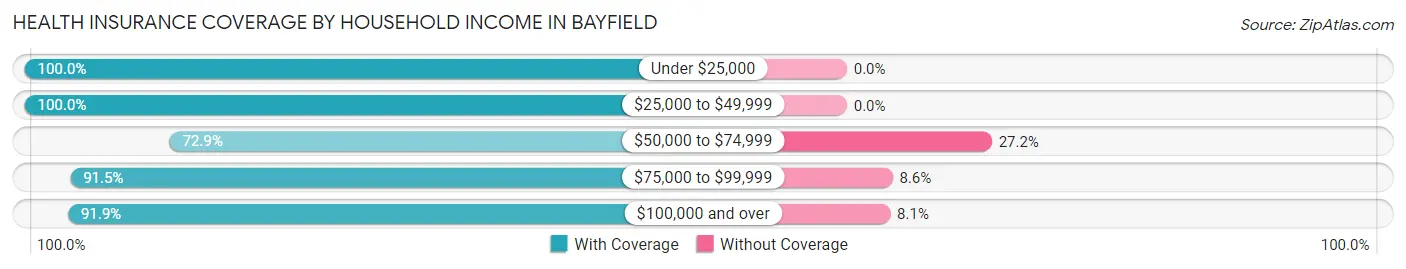
| Household Income | With Coverage | Without Coverage |
| Under $25,000 | 182 (100.0%) | 0 (0.0%) |
| $25,000 to $49,999 | 155 (100.0%) | 0 (0.0%) |
| $50,000 to $74,999 | 373 (72.9%) | 139 (27.2%) |
| $75,000 to $99,999 | 556 (91.4%) | 52 (8.6%) |
| $100,000 and over | 1,279 (91.9%) | 113 (8.1%) |
Public vs Private Health Insurance Coverage by Age in Bayfield
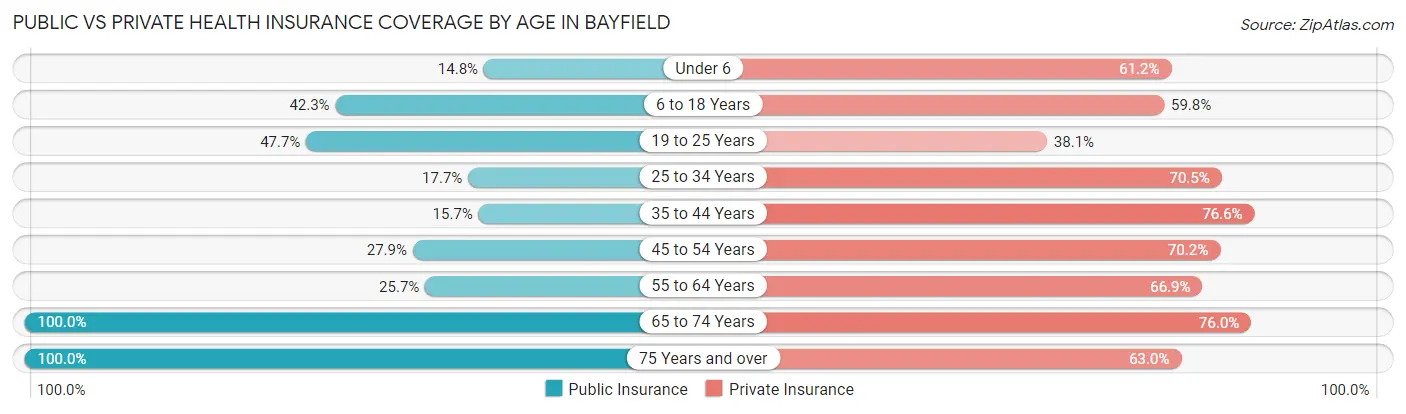
| Age Bracket | Public Insurance | Private Insurance |
| Under 6 | 41 (14.7%) | 170 (61.2%) |
| 6 to 18 Years | 261 (42.3%) | 369 (59.8%) |
| 19 to 25 Years | 84 (47.7%) | 67 (38.1%) |
| 25 to 34 Years | 88 (17.7%) | 351 (70.5%) |
| 35 to 44 Years | 47 (15.7%) | 229 (76.6%) |
| 45 to 54 Years | 121 (27.9%) | 304 (70.2%) |
| 55 to 64 Years | 69 (25.7%) | 180 (66.9%) |
| 65 to 74 Years | 179 (100.0%) | 136 (76.0%) |
| 75 Years and over | 100 (100.0%) | 63 (63.0%) |
| Total | 990 (34.7%) | 1,869 (65.6%) |
Disability Status by Sex by Age in Bayfield
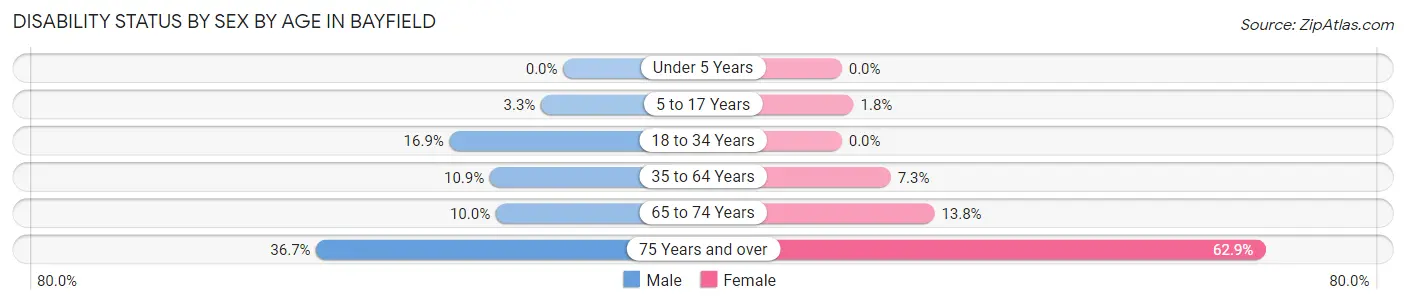
| Age Bracket | Male | Female |
| Under 5 Years | 0 (0.0%) | 0 (0.0%) |
| 5 to 17 Years | 12 (3.3%) | 5 (1.8%) |
| 18 to 34 Years | 67 (16.9%) | 0 (0.0%) |
| 35 to 64 Years | 52 (10.9%) | 38 (7.3%) |
| 65 to 74 Years | 7 (10.0%) | 15 (13.8%) |
| 75 Years and over | 11 (36.7%) | 44 (62.9%) |
Disability Class by Sex by Age in Bayfield
Disability Class: Hearing Difficulty
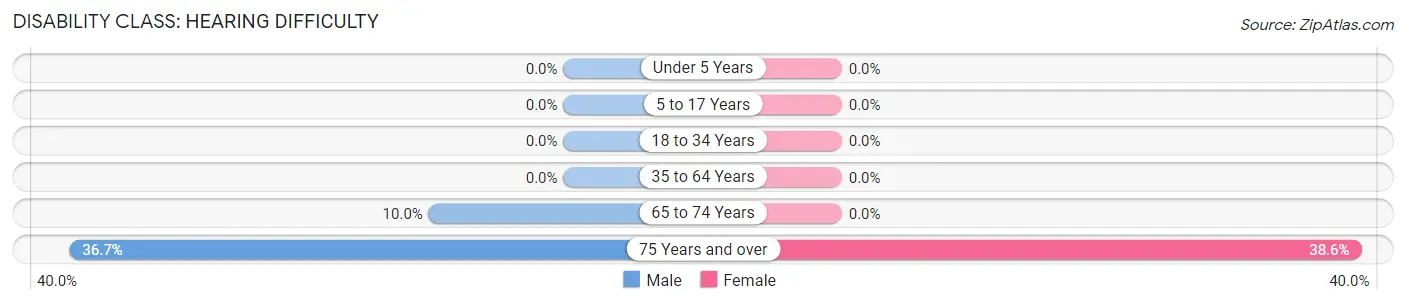
| Age Bracket | Male | Female |
| Under 5 Years | 0 (0.0%) | 0 (0.0%) |
| 5 to 17 Years | 0 (0.0%) | 0 (0.0%) |
| 18 to 34 Years | 0 (0.0%) | 0 (0.0%) |
| 35 to 64 Years | 0 (0.0%) | 0 (0.0%) |
| 65 to 74 Years | 7 (10.0%) | 0 (0.0%) |
| 75 Years and over | 11 (36.7%) | 27 (38.6%) |
Disability Class: Vision Difficulty
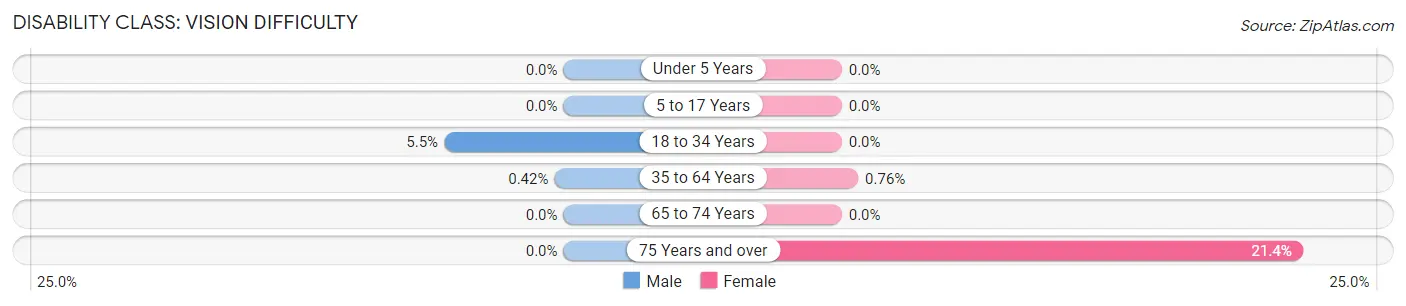
| Age Bracket | Male | Female |
| Under 5 Years | 0 (0.0%) | 0 (0.0%) |
| 5 to 17 Years | 0 (0.0%) | 0 (0.0%) |
| 18 to 34 Years | 22 (5.5%) | 0 (0.0%) |
| 35 to 64 Years | 2 (0.4%) | 4 (0.8%) |
| 65 to 74 Years | 0 (0.0%) | 0 (0.0%) |
| 75 Years and over | 0 (0.0%) | 15 (21.4%) |
Disability Class: Cognitive Difficulty
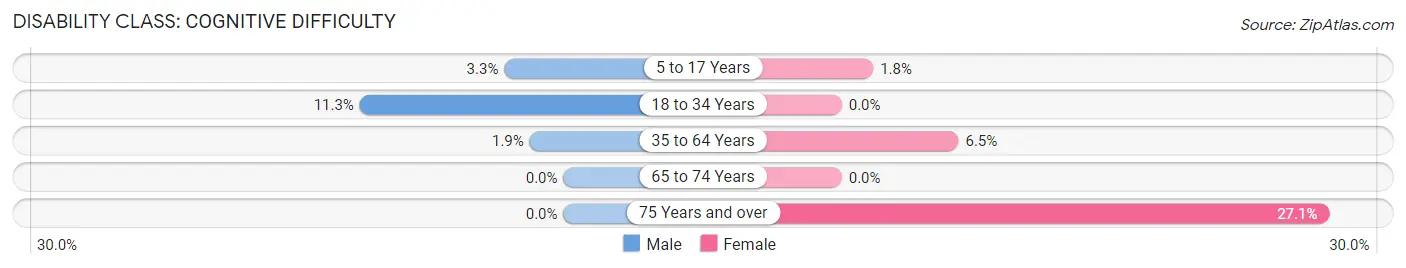
| Age Bracket | Male | Female |
| 5 to 17 Years | 12 (3.3%) | 5 (1.8%) |
| 18 to 34 Years | 45 (11.3%) | 0 (0.0%) |
| 35 to 64 Years | 9 (1.9%) | 34 (6.5%) |
| 65 to 74 Years | 0 (0.0%) | 0 (0.0%) |
| 75 Years and over | 0 (0.0%) | 19 (27.1%) |
Disability Class: Ambulatory Difficulty
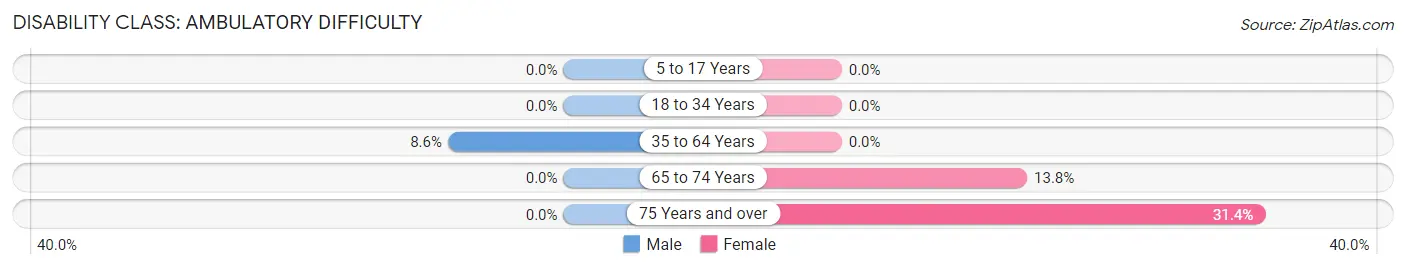
| Age Bracket | Male | Female |
| 5 to 17 Years | 0 (0.0%) | 0 (0.0%) |
| 18 to 34 Years | 0 (0.0%) | 0 (0.0%) |
| 35 to 64 Years | 41 (8.6%) | 0 (0.0%) |
| 65 to 74 Years | 0 (0.0%) | 15 (13.8%) |
| 75 Years and over | 0 (0.0%) | 22 (31.4%) |
Disability Class: Self-Care Difficulty
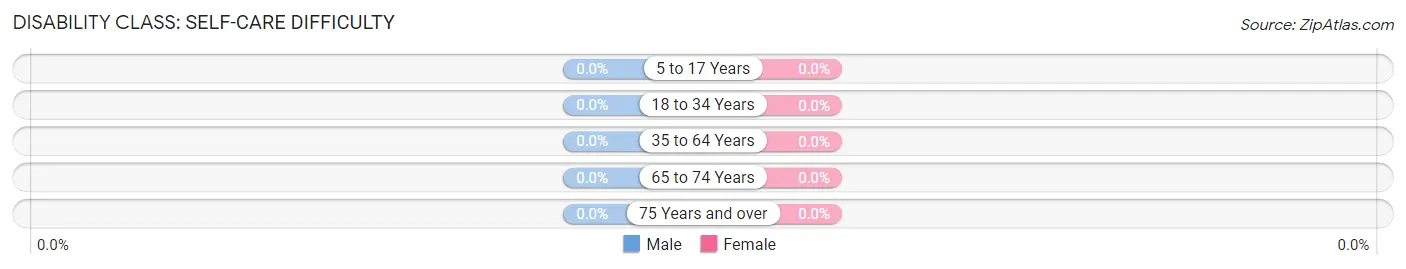
| Age Bracket | Male | Female |
| 5 to 17 Years | 0 (0.0%) | 0 (0.0%) |
| 18 to 34 Years | 0 (0.0%) | 0 (0.0%) |
| 35 to 64 Years | 0 (0.0%) | 0 (0.0%) |
| 65 to 74 Years | 0 (0.0%) | 0 (0.0%) |
| 75 Years and over | 0 (0.0%) | 0 (0.0%) |
Technology Access in Bayfield
Computing Device Access in Bayfield
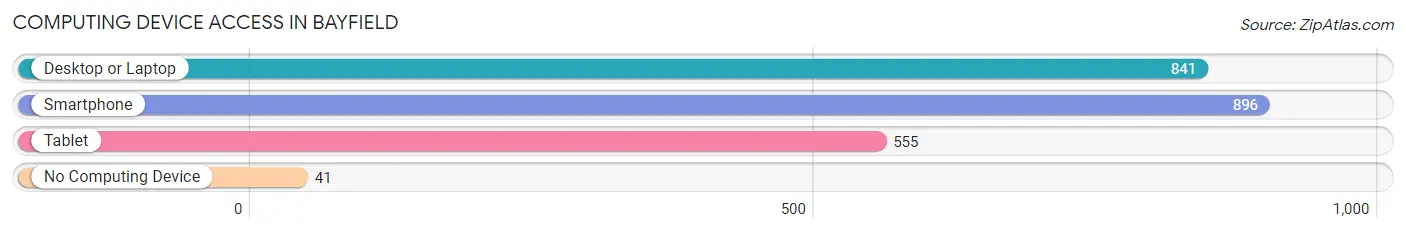
| Device Type | # Households | % Households |
| Desktop or Laptop | 841 | 82.7% |
| Smartphone | 896 | 88.1% |
| Tablet | 555 | 54.6% |
| No Computing Device | 41 | 4.0% |
| Total | 1,017 | 100.0% |
Internet Access in Bayfield
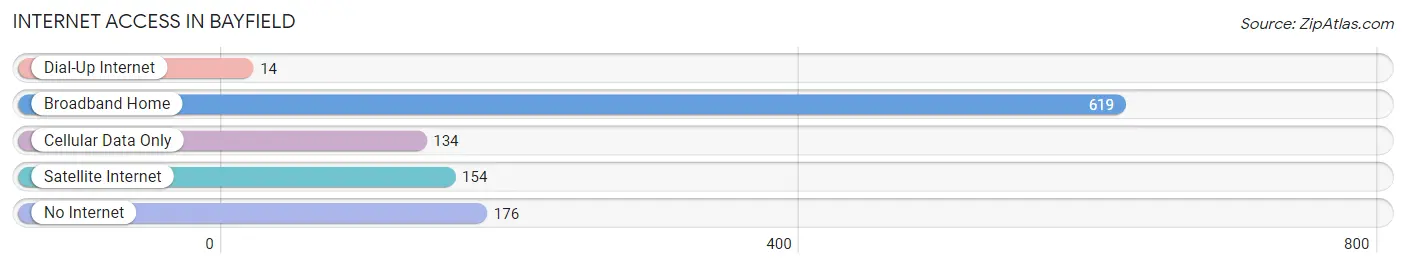
| Internet Type | # Households | % Households |
| Dial-Up Internet | 14 | 1.4% |
| Broadband Home | 619 | 60.9% |
| Cellular Data Only | 134 | 13.2% |
| Satellite Internet | 154 | 15.1% |
| No Internet | 176 | 17.3% |
| Total | 1,017 | 100.0% |
Bayfield Summary
Bayfield, Colorado is a small town located in La Plata County in the southwestern part of the state. It is situated at the base of the San Juan Mountains, near the headwaters of the Animas River. The town was founded in 1881 and has a population of approximately 1,500 people.
History
Bayfield was founded in 1881 by a group of settlers from the Midwest. The town was named after a local rancher, William Bayfield, who had a large ranch in the area. The town was originally a farming and ranching community, but it soon became a popular tourist destination due to its proximity to the San Juan Mountains. In the early 1900s, the town was home to several hotels, restaurants, and stores.
In the 1920s, the town began to experience a decline in population as many of the original settlers moved away. However, the town was revitalized in the 1950s when the nearby ski resort of Purgatory was built. This brought a new influx of tourists and residents to the area, and the town has since become a popular destination for outdoor recreation.
Geography
Bayfield is located in La Plata County in the southwestern part of Colorado. It is situated at the base of the San Juan Mountains, near the headwaters of the Animas River. The town is surrounded by mountains and forests, and is close to several popular ski resorts. The town is also close to the Four Corners Monument, which marks the intersection of Colorado, New Mexico, Arizona, and Utah.
The climate in Bayfield is semi-arid, with hot summers and cold winters. The average annual temperature is around 50 degrees Fahrenheit, and the average annual precipitation is around 16 inches.
Economy
The economy of Bayfield is largely based on tourism and outdoor recreation. The town is home to several ski resorts, including Purgatory, which is one of the most popular ski resorts in the state. The town is also home to several restaurants, hotels, and stores that cater to tourists.
In addition to tourism, Bayfield is also home to several small businesses, including a lumber mill, a sawmill, and a few small farms. The town is also home to a few manufacturing companies, including a furniture factory and a metal fabrication plant.
Demographics
As of the 2010 census, the population of Bayfield was 1,500. The racial makeup of the town was 94.2% White, 0.7% African American, 0.7% Native American, 0.7% Asian, 0.3% Pacific Islander, and 2.7% from other races. The median household income was $41,250, and the median family income was $50,000.
The town is home to several churches, including the Bayfield Community Church, the First Baptist Church, and the Church of Jesus Christ of Latter-day Saints. The town is also home to several schools, including Bayfield High School, Bayfield Middle School, and Bayfield Elementary School.
Common Questions
What is Per Capita Income in Bayfield?
Per Capita income in Bayfield is $38,039.
What is the Median Family Income in Bayfield?
Median Family Income in Bayfield is $92,176.
What is the Median Household income in Bayfield?
Median Household Income in Bayfield is $84,609.
What is Income or Wage Gap in Bayfield?
Income or Wage Gap in Bayfield is 19.3%.
Women in Bayfield earn 80.7 cents for every dollar earned by a man.
What is Family Income Deficit in Bayfield?
Family Income Deficit in Bayfield is $7,294.
Families that are below poverty line in Bayfield earn $7,294 less on average than the poverty threshold level.
What is Inequality or Gini Index in Bayfield?
Inequality or Gini Index in Bayfield is 0.34.
What is the Total Population of Bayfield?
Total Population of Bayfield is 2,853.
What is the Total Male Population of Bayfield?
Total Male Population of Bayfield is 1,484.
What is the Total Female Population of Bayfield?
Total Female Population of Bayfield is 1,369.
What is the Ratio of Males per 100 Females in Bayfield?
There are 108.40 Males per 100 Females in Bayfield.
What is the Ratio of Females per 100 Males in Bayfield?
There are 92.25 Females per 100 Males in Bayfield.
What is the Median Population Age in Bayfield?
Median Population Age in Bayfield is 32.6 Years.
What is the Average Family Size in Bayfield
Average Family Size in Bayfield is 3.4 People.
What is the Average Household Size in Bayfield
Average Household Size in Bayfield is 2.8 People.
How Large is the Labor Force in Bayfield?
There are 1,592 People in the Labor Forcein in Bayfield.
What is the Percentage of People in the Labor Force in Bayfield?
78.3% of People are in the Labor Force in Bayfield.
What is the Unemployment Rate in Bayfield?
Unemployment Rate in Bayfield is 5.9%.