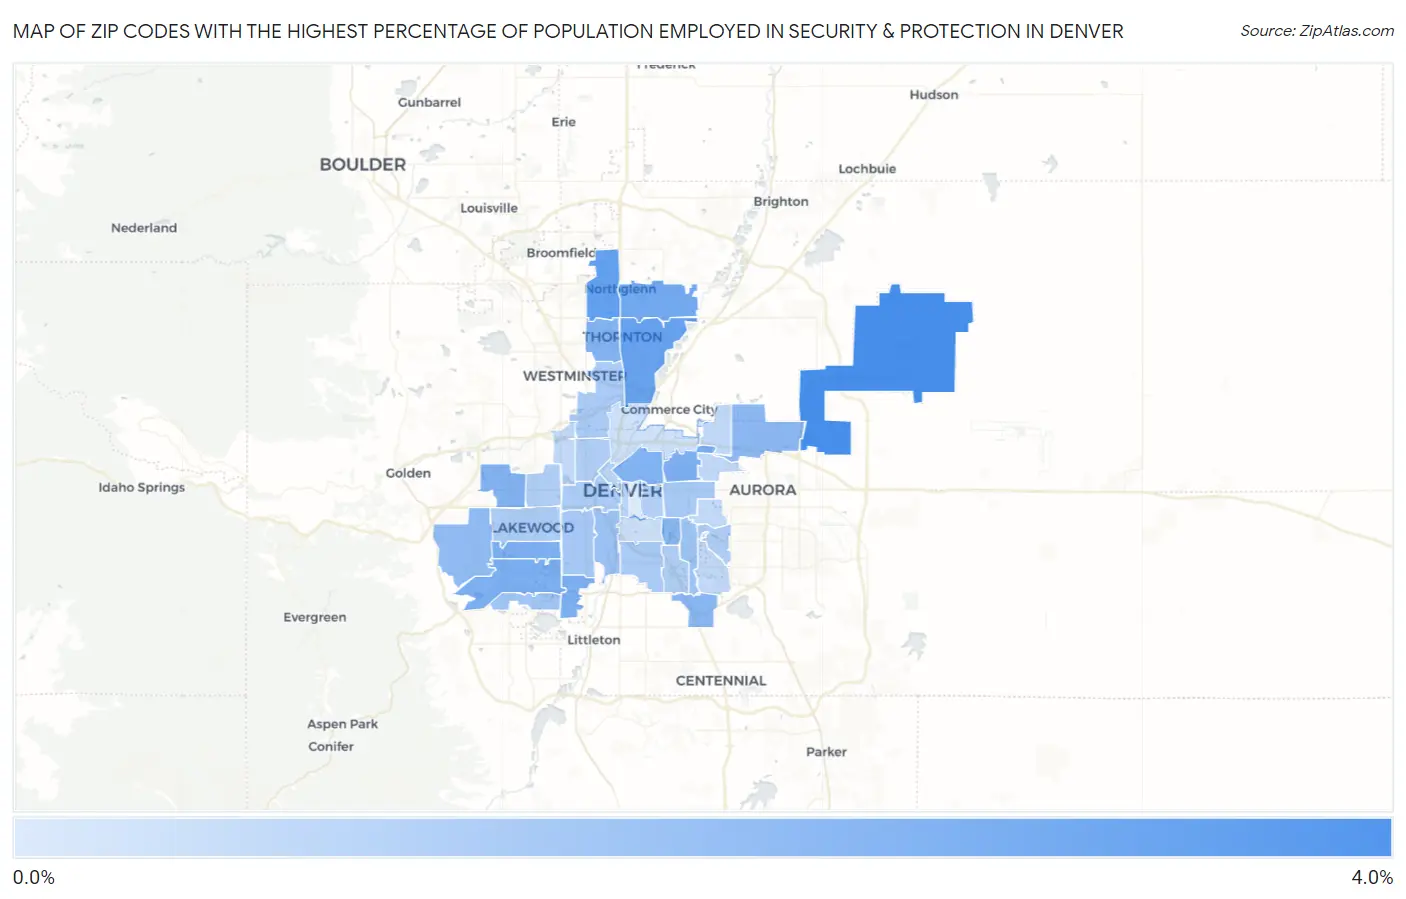
Zip Codes with the Highest Percentage of Population Employed in Security & Protection in Denver, CO
RELATED REPORTS & OPTIONS
Security & Protection
Denver
Compare Zip Codes
Map of Zip Codes with the Highest Percentage of Population Employed in Security & Protection in Denver
0.15%
3.3%
Zip Codes with the Highest Percentage of Population Employed in Security & Protection in Denver, CO
| Zip Code | % Employed | vs State | vs National | |
| 1. | 80249 | 3.3% | 2.0%(+1.28)#102 | 2.1%(+1.14)#6,284 |
| 2. | 80234 | 2.7% | 2.0%(+0.676)#129 | 2.1%(+0.532)#8,626 |
| 3. | 80229 | 2.6% | 2.0%(+0.618)#134 | 2.1%(+0.475)#8,906 |
| 4. | 80233 | 2.4% | 2.0%(+0.368)#159 | 2.1%(+0.225)#10,205 |
| 5. | 80227 | 2.2% | 2.0%(+0.179)#174 | 2.1%(+0.035)#11,354 |
| 6. | 80207 | 2.1% | 2.0%(+0.124)#180 | 2.1%(-0.019)#11,708 |
| 7. | 80236 | 2.1% | 2.0%(+0.104)#186 | 2.1%(-0.040)#11,844 |
| 8. | 80232 | 2.1% | 2.0%(+0.096)#187 | 2.1%(-0.047)#11,898 |
| 9. | 80205 | 2.1% | 2.0%(+0.075)#191 | 2.1%(-0.069)#12,054 |
| 10. | 80260 | 2.0% | 2.0%(+0.024)#196 | 2.1%(-0.120)#12,372 |
| 11. | 80215 | 2.0% | 2.0%(+0.007)#198 | 2.1%(-0.136)#12,480 |
| 12. | 80246 | 1.9% | 2.0%(-0.115)#207 | 2.1%(-0.258)#13,301 |
| 13. | 80237 | 1.9% | 2.0%(-0.131)#211 | 2.1%(-0.274)#13,412 |
| 14. | 80239 | 1.8% | 2.0%(-0.195)#217 | 2.1%(-0.339)#13,856 |
| 15. | 80228 | 1.7% | 2.0%(-0.263)#229 | 2.1%(-0.406)#14,373 |
| 16. | 80223 | 1.5% | 2.0%(-0.475)#256 | 2.1%(-0.619)#15,956 |
| 17. | 80224 | 1.4% | 2.0%(-0.579)#271 | 2.1%(-0.722)#16,761 |
| 18. | 80235 | 1.4% | 2.0%(-0.591)#273 | 2.1%(-0.735)#16,849 |
| 19. | 80219 | 1.3% | 2.0%(-0.697)#286 | 2.1%(-0.841)#17,669 |
| 20. | 80220 | 1.2% | 2.0%(-0.762)#292 | 2.1%(-0.906)#18,184 |
| 21. | 80210 | 1.2% | 2.0%(-0.797)#295 | 2.1%(-0.940)#18,448 |
| 22. | 80221 | 1.2% | 2.0%(-0.810)#296 | 2.1%(-0.954)#18,541 |
| 23. | 80204 | 1.2% | 2.0%(-0.841)#298 | 2.1%(-0.984)#18,784 |
| 24. | 80226 | 1.2% | 2.0%(-0.843)#300 | 2.1%(-0.987)#18,809 |
| 25. | 80247 | 1.1% | 2.0%(-0.886)#304 | 2.1%(-1.03)#19,145 |
| 26. | 80214 | 1.1% | 2.0%(-0.894)#307 | 2.1%(-1.04)#19,206 |
| 27. | 80211 | 1.1% | 2.0%(-0.912)#309 | 2.1%(-1.06)#19,340 |
| 28. | 80222 | 1.0% | 2.0%(-0.963)#315 | 2.1%(-1.11)#19,717 |
| 29. | 80206 | 1.0% | 2.0%(-0.994)#322 | 2.1%(-1.14)#19,953 |
| 30. | 80202 | 0.90% | 2.0%(-1.10)#335 | 2.1%(-1.25)#20,772 |
| 31. | 80203 | 0.87% | 2.0%(-1.14)#338 | 2.1%(-1.28)#20,972 |
| 32. | 80238 | 0.74% | 2.0%(-1.26)#348 | 2.1%(-1.41)#21,786 |
| 33. | 80230 | 0.71% | 2.0%(-1.30)#351 | 2.1%(-1.44)#22,014 |
| 34. | 80231 | 0.70% | 2.0%(-1.30)#352 | 2.1%(-1.44)#22,047 |
| 35. | 80212 | 0.70% | 2.0%(-1.30)#353 | 2.1%(-1.45)#22,068 |
| 36. | 80209 | 0.48% | 2.0%(-1.52)#363 | 2.1%(-1.67)#23,329 |
| 37. | 80216 | 0.43% | 2.0%(-1.57)#365 | 2.1%(-1.71)#23,565 |
| 38. | 80218 | 0.15% | 2.0%(-1.85)#373 | 2.1%(-2.00)#24,638 |
1
Common Questions
What are the Top 10 Zip Codes with the Highest Percentage of Population Employed in Security & Protection in Denver, CO?
Top 10 Zip Codes with the Highest Percentage of Population Employed in Security & Protection in Denver, CO are:
What zip code has the Highest Percentage of Population Employed in Security & Protection in Denver, CO?
80249 has the Highest Percentage of Population Employed in Security & Protection in Denver, CO with 3.3%.
What is the Percentage of Population Employed in Security & Protection in Denver, CO?
Percentage of Population Employed in Security & Protection in Denver is 1.3%.
What is the Percentage of Population Employed in Security & Protection in Colorado?
Percentage of Population Employed in Security & Protection in Colorado is 2.0%.
What is the Percentage of Population Employed in Security & Protection in the United States?
Percentage of Population Employed in Security & Protection in the United States is 2.1%.