Estes Park, CO Map & Demographics
Estes Park Map
Estes Park Overview
$55,282
PER CAPITA INCOME
$92,100
AVG FAMILY INCOME
$63,598
AVG HOUSEHOLD INCOME
33.5%
WAGE / INCOME GAP [ % ]
66.5¢/ $1
WAGE / INCOME GAP [ $ ]
0.52
INEQUALITY / GINI INDEX
5,906
TOTAL POPULATION
2,722
MALE POPULATION
3,184
FEMALE POPULATION
85.49
MALES / 100 FEMALES
116.97
FEMALES / 100 MALES
60.9
MEDIAN AGE
2.3
AVG FAMILY SIZE
1.8
AVG HOUSEHOLD SIZE
2,770
LABOR FORCE [ PEOPLE ]
50.6%
PERCENT IN LABOR FORCE
5.4%
UNEMPLOYMENT RATE
Estes Park Zip Codes
Estes Park Area Codes
Income in Estes Park
Income Overview in Estes Park
Per Capita Income in Estes Park is $55,282, while median incomes of families and households are $92,100 and $63,598 respectively.
| Characteristic | Number | Measure |
| Per Capita Income | 5,906 | $55,282 |
| Median Family Income | 1,854 | $92,100 |
| Mean Family Income | 1,854 | $131,707 |
| Median Household Income | 3,166 | $63,598 |
| Mean Household Income | 3,166 | $105,157 |
| Income Deficit | 1,854 | $0 |
| Wage / Income Gap (%) | 5,906 | 33.48% |
| Wage / Income Gap ($) | 5,906 | 66.52¢ per $1 |
| Gini / Inequality Index | 5,906 | 0.52 |
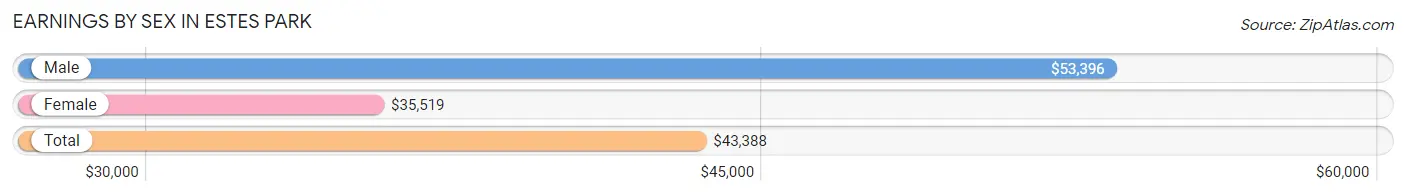
Earnings by Sex in Estes Park
Average Earnings in Estes Park are $43,388, $53,396 for men and $35,519 for women, a difference of 33.5%.
| Sex | Number | Average Earnings |
| Male | 1,507 (51.7%) | $53,396 |
| Female | 1,408 (48.3%) | $35,519 |
| Total | 2,915 (100.0%) | $43,388 |
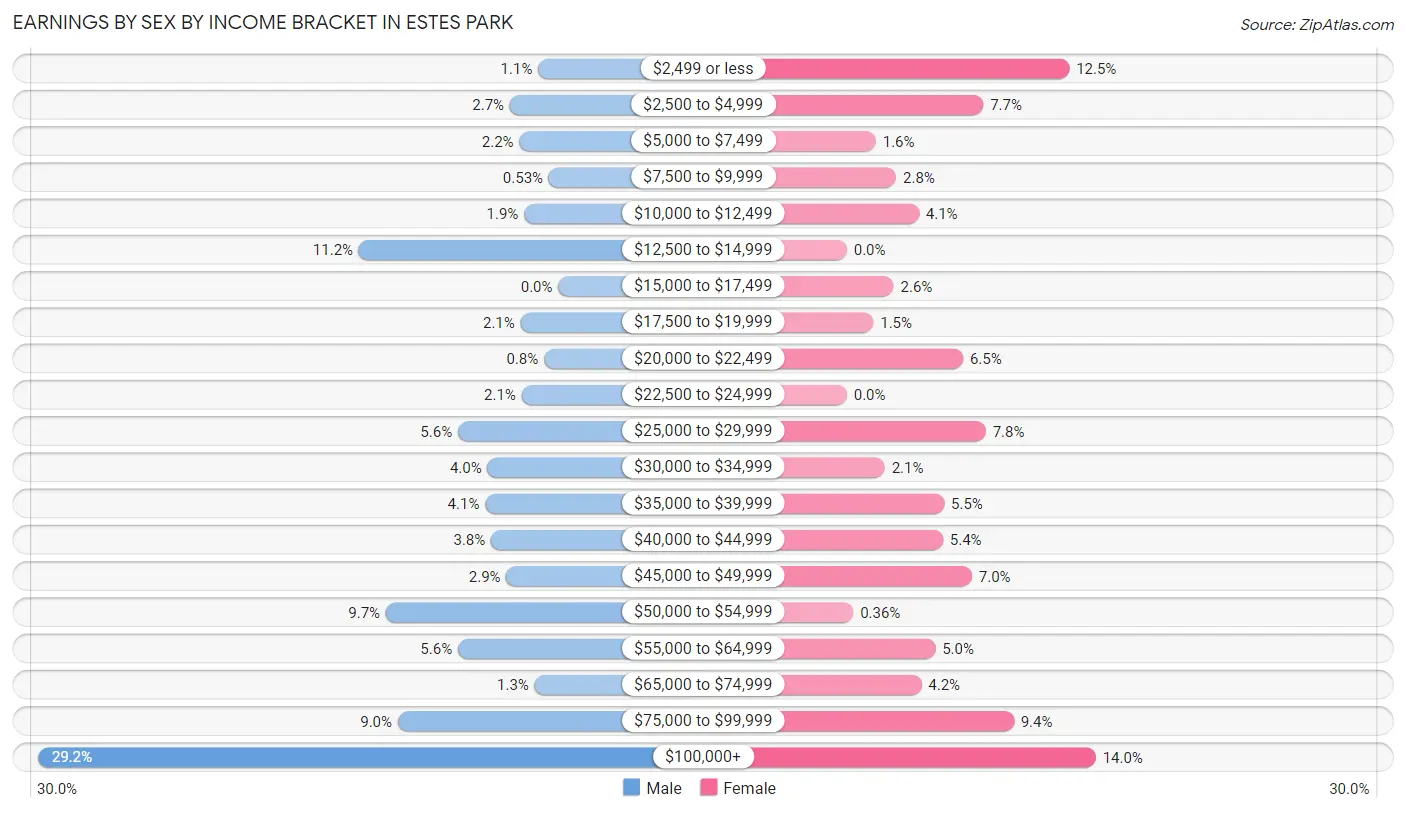
Earnings by Sex by Income Bracket in Estes Park
The most common earnings brackets in Estes Park are $100,000+ for men (440 | 29.2%) and $100,000+ for women (197 | 14.0%).
| Income | Male | Female |
| $2,499 or less | 17 (1.1%) | 176 (12.5%) |
| $2,500 to $4,999 | 41 (2.7%) | 108 (7.7%) |
| $5,000 to $7,499 | 33 (2.2%) | 23 (1.6%) |
| $7,500 to $9,999 | 8 (0.5%) | 39 (2.8%) |
| $10,000 to $12,499 | 29 (1.9%) | 57 (4.1%) |
| $12,500 to $14,999 | 169 (11.2%) | 0 (0.0%) |
| $15,000 to $17,499 | 0 (0.0%) | 37 (2.6%) |
| $17,500 to $19,999 | 32 (2.1%) | 21 (1.5%) |
| $20,000 to $22,499 | 12 (0.8%) | 92 (6.5%) |
| $22,500 to $24,999 | 31 (2.1%) | 0 (0.0%) |
| $25,000 to $29,999 | 85 (5.6%) | 110 (7.8%) |
| $30,000 to $34,999 | 60 (4.0%) | 30 (2.1%) |
| $35,000 to $39,999 | 62 (4.1%) | 77 (5.5%) |
| $40,000 to $44,999 | 57 (3.8%) | 76 (5.4%) |
| $45,000 to $49,999 | 44 (2.9%) | 99 (7.0%) |
| $50,000 to $54,999 | 146 (9.7%) | 5 (0.4%) |
| $55,000 to $64,999 | 85 (5.6%) | 70 (5.0%) |
| $65,000 to $74,999 | 20 (1.3%) | 59 (4.2%) |
| $75,000 to $99,999 | 136 (9.0%) | 132 (9.4%) |
| $100,000+ | 440 (29.2%) | 197 (14.0%) |
| Total | 1,507 (100.0%) | 1,408 (100.0%) |
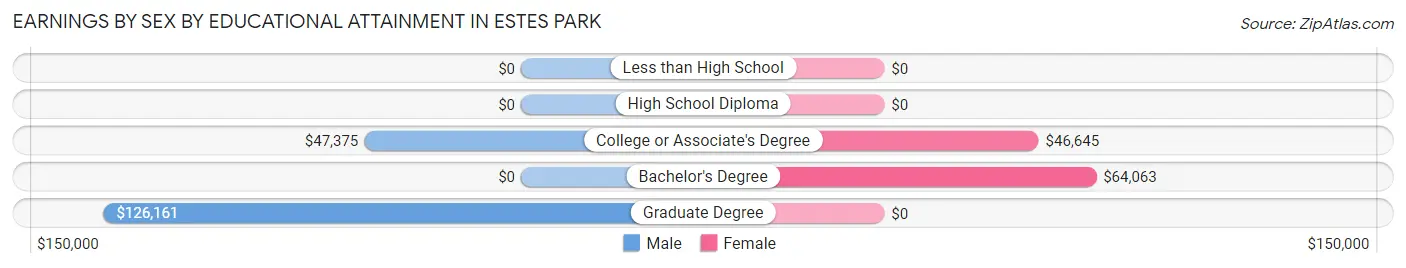
Earnings by Sex by Educational Attainment in Estes Park
Average earnings in Estes Park are $53,750 for men and $37,656 for women, a difference of 29.9%. Men with an educational attainment of graduate degree enjoy the highest average annual earnings of $126,161, while those with college or associate's degree education earn the least with $47,375. Women with an educational attainment of bachelor's degree earn the most with the average annual earnings of $64,063, while those with college or associate's degree education have the smallest earnings of $46,645.
| Educational Attainment | Male Income | Female Income |
| Less than High School | - | - |
| High School Diploma | - | - |
| College or Associate's Degree | $47,375 | $46,645 |
| Bachelor's Degree | - | - |
| Graduate Degree | $126,161 | $0 |
| Total | $53,750 | $37,656 |
Family Income in Estes Park
Family Income Brackets in Estes Park
According to the Estes Park family income data, there are 417 families falling into the $100,000 to $149,999 income range, which is the most common income bracket and makes up 22.5% of all families. Conversely, the $10,000 to $14,999 income bracket is the least frequent group with only 22 families (1.2%) belonging to this category.
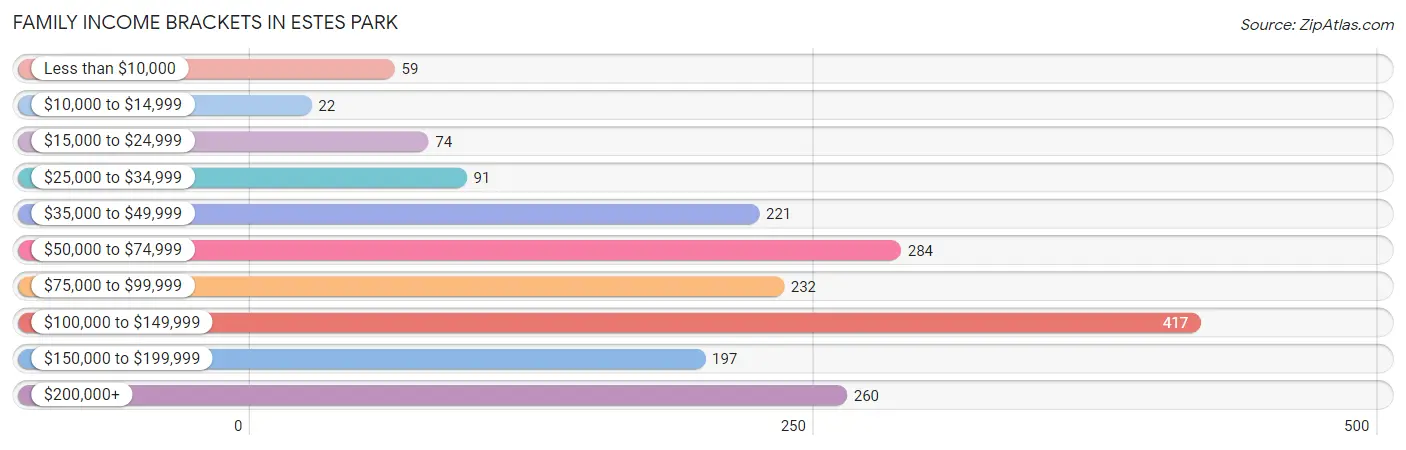
| Income Bracket | # Families | % Families |
| Less than $10,000 | 59 | 3.2% |
| $10,000 to $14,999 | 22 | 1.2% |
| $15,000 to $24,999 | 74 | 4.0% |
| $25,000 to $34,999 | 91 | 4.9% |
| $35,000 to $49,999 | 221 | 11.9% |
| $50,000 to $74,999 | 284 | 15.3% |
| $75,000 to $99,999 | 232 | 12.5% |
| $100,000 to $149,999 | 417 | 22.5% |
| $150,000 to $199,999 | 197 | 10.6% |
| $200,000+ | 260 | 14.0% |
Family Income by Famaliy Size in Estes Park
4-person families (149 | 8.0%) account for the highest median family income in Estes Park with $130,625 per family, while 2-person families (1,484 | 80.0%) have the highest median income of $47,500 per family member.
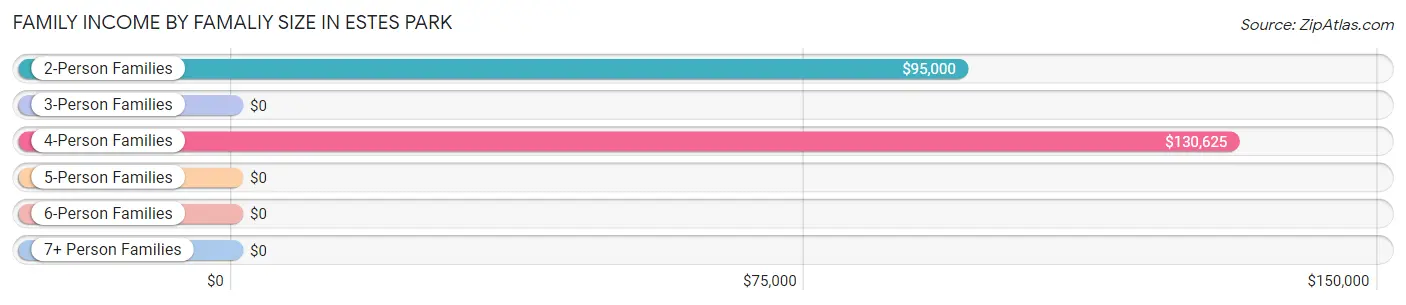
| Income Bracket | # Families | Median Income |
| 2-Person Families | 1,484 (80.0%) | $95,000 |
| 3-Person Families | 170 (9.2%) | $0 |
| 4-Person Families | 149 (8.0%) | $130,625 |
| 5-Person Families | 39 (2.1%) | $0 |
| 6-Person Families | 12 (0.6%) | $0 |
| 7+ Person Families | 0 (0.0%) | $0 |
| Total | 1,854 (100.0%) | $92,100 |
Family Income by Number of Earners in Estes Park
The median family income in Estes Park is $92,100, with families comprising 3+ earners (48) having the highest median family income of $237,885, while families with 1 earner (642) have the lowest median family income of $84,432, accounting for 2.6% and 34.6% of families, respectively.
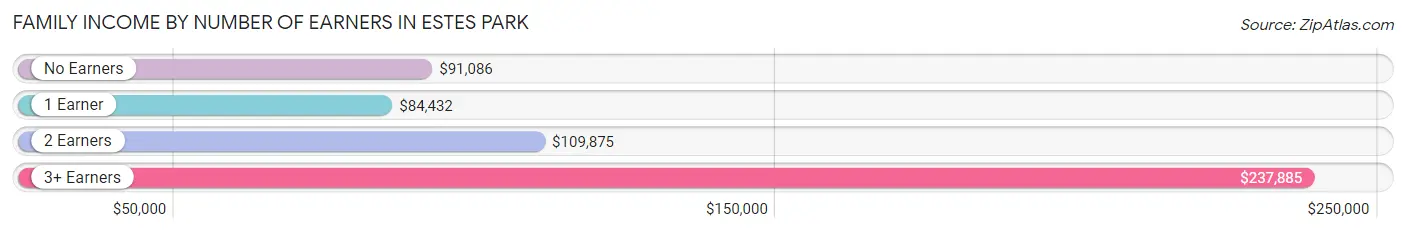
| Number of Earners | # Families | Median Income |
| No Earners | 463 (25.0%) | $91,086 |
| 1 Earner | 642 (34.6%) | $84,432 |
| 2 Earners | 701 (37.8%) | $109,875 |
| 3+ Earners | 48 (2.6%) | $237,885 |
| Total | 1,854 (100.0%) | $92,100 |
Household Income in Estes Park
Household Income Brackets in Estes Park
With 551 households falling in the category, the $100,000 to $149,999 income range is the most frequent in Estes Park, accounting for 17.4% of all households. In contrast, only 108 households (3.4%) fall into the $10,000 to $14,999 income bracket, making it the least populous group.
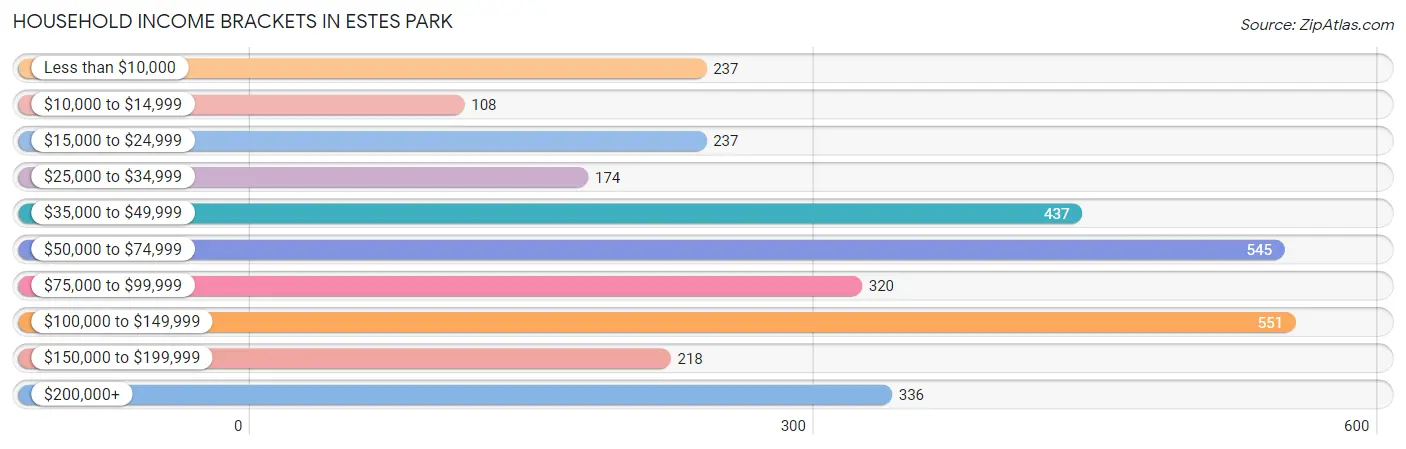
| Income Bracket | # Households | % Households |
| Less than $10,000 | 237 | 7.5% |
| $10,000 to $14,999 | 108 | 3.4% |
| $15,000 to $24,999 | 237 | 7.5% |
| $25,000 to $34,999 | 174 | 5.5% |
| $35,000 to $49,999 | 437 | 13.8% |
| $50,000 to $74,999 | 545 | 17.2% |
| $75,000 to $99,999 | 320 | 10.1% |
| $100,000 to $149,999 | 551 | 17.4% |
| $150,000 to $199,999 | 218 | 6.9% |
| $200,000+ | 336 | 10.6% |
Household Income by Householder Age in Estes Park
The median household income in Estes Park is $63,598, with the highest median household income of $75,625 found in the 45 to 64 years age bracket for the primary householder. A total of 1,107 households (35.0%) fall into this category. Meanwhile, the 15 to 24 years age bracket for the primary householder has the lowest median household income of $0, with 28 households (0.9%) in this group.
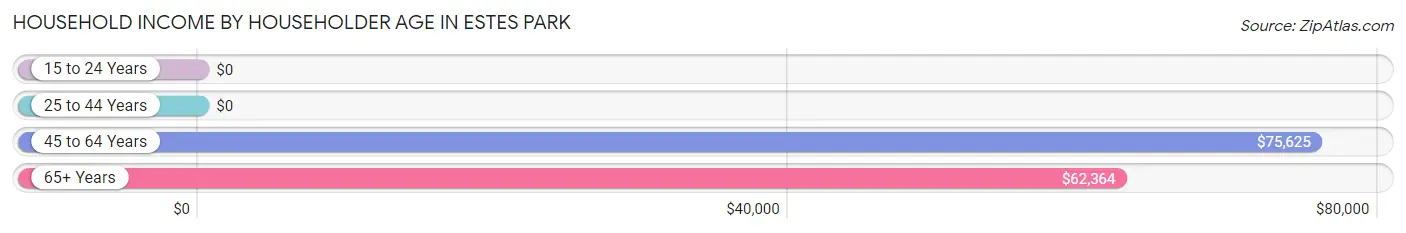
| Income Bracket | # Households | Median Income |
| 15 to 24 Years | 28 (0.9%) | $0 |
| 25 to 44 Years | 530 (16.7%) | $0 |
| 45 to 64 Years | 1,107 (35.0%) | $75,625 |
| 65+ Years | 1,501 (47.4%) | $62,364 |
| Total | 3,166 (100.0%) | $63,598 |
Poverty in Estes Park
Income Below Poverty by Sex and Age in Estes Park
With 11.1% poverty level for males and 10.1% for females among the residents of Estes Park, 6 to 11 year old males and 5 year old females are the most vulnerable to poverty, with 20 males (35.1%) and 19 females (100.0%) in their respective age groups living below the poverty level.
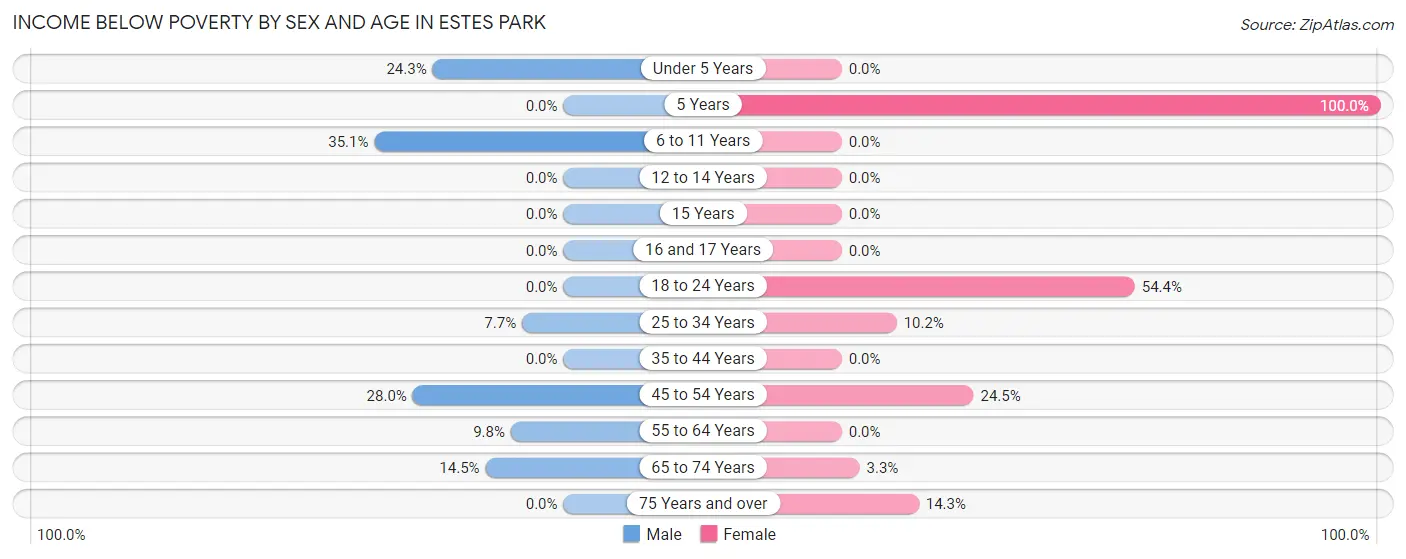
| Age Bracket | Male | Female |
| Under 5 Years | 17 (24.3%) | 0 (0.0%) |
| 5 Years | 0 (0.0%) | 19 (100.0%) |
| 6 to 11 Years | 20 (35.1%) | 0 (0.0%) |
| 12 to 14 Years | 0 (0.0%) | 0 (0.0%) |
| 15 Years | 0 (0.0%) | 0 (0.0%) |
| 16 and 17 Years | 0 (0.0%) | 0 (0.0%) |
| 18 to 24 Years | 0 (0.0%) | 62 (54.4%) |
| 25 to 34 Years | 38 (7.7%) | 22 (10.2%) |
| 35 to 44 Years | 0 (0.0%) | 0 (0.0%) |
| 45 to 54 Years | 73 (28.0%) | 133 (24.4%) |
| 55 to 64 Years | 39 (9.8%) | 0 (0.0%) |
| 65 to 74 Years | 111 (14.5%) | 30 (3.3%) |
| 75 Years and over | 0 (0.0%) | 56 (14.3%) |
| Total | 298 (11.1%) | 322 (10.1%) |
Income Above Poverty by Sex and Age in Estes Park
According to the poverty statistics in Estes Park, males aged 5 years and females aged under 5 years are the age groups that are most secure financially, with 100.0% of males and 100.0% of females in these age groups living above the poverty line.
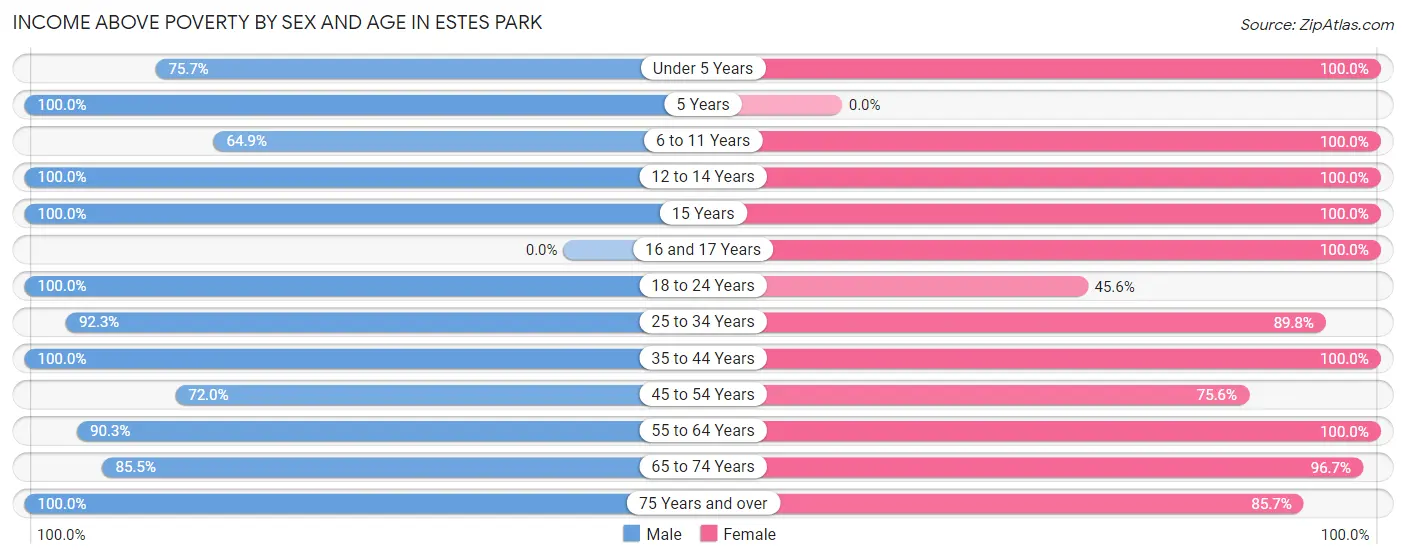
| Age Bracket | Male | Female |
| Under 5 Years | 53 (75.7%) | 21 (100.0%) |
| 5 Years | 29 (100.0%) | 0 (0.0%) |
| 6 to 11 Years | 37 (64.9%) | 74 (100.0%) |
| 12 to 14 Years | 74 (100.0%) | 29 (100.0%) |
| 15 Years | 23 (100.0%) | 36 (100.0%) |
| 16 and 17 Years | 0 (0.0%) | 33 (100.0%) |
| 18 to 24 Years | 54 (100.0%) | 52 (45.6%) |
| 25 to 34 Years | 457 (92.3%) | 194 (89.8%) |
| 35 to 44 Years | 198 (100.0%) | 148 (100.0%) |
| 45 to 54 Years | 188 (72.0%) | 411 (75.5%) |
| 55 to 64 Years | 361 (90.2%) | 640 (100.0%) |
| 65 to 74 Years | 656 (85.5%) | 878 (96.7%) |
| 75 Years and over | 266 (100.0%) | 336 (85.7%) |
| Total | 2,396 (88.9%) | 2,852 (89.9%) |
Income Below Poverty Among Married-Couple Families in Estes Park
The poverty statistics for married-couple families in Estes Park show that 5.4% or 83 of the total 1,542 families live below the poverty line. Families with no children have the highest poverty rate of 6.1%, comprising of 83 families. On the other hand, families with 1 or 2 children have the lowest poverty rate of 0.0%, which includes 0 families.
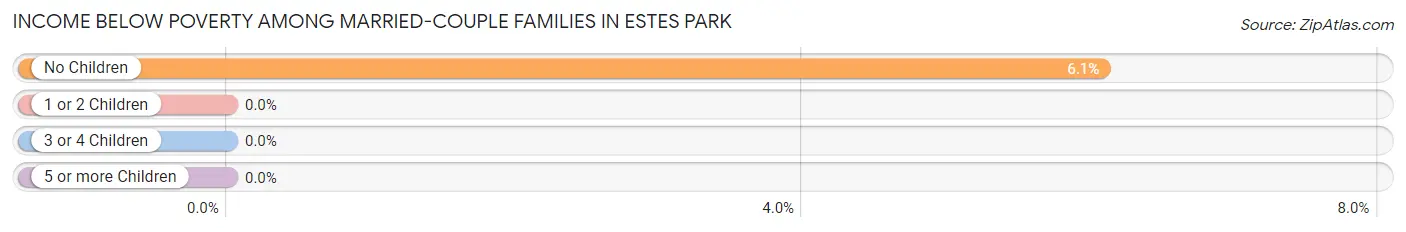
| Children | Above Poverty | Below Poverty |
| No Children | 1,283 (93.9%) | 83 (6.1%) |
| 1 or 2 Children | 150 (100.0%) | 0 (0.0%) |
| 3 or 4 Children | 26 (100.0%) | 0 (0.0%) |
| 5 or more Children | 0 (0.0%) | 0 (0.0%) |
| Total | 1,459 (94.6%) | 83 (5.4%) |
Income Below Poverty Among Single-Parent Households in Estes Park
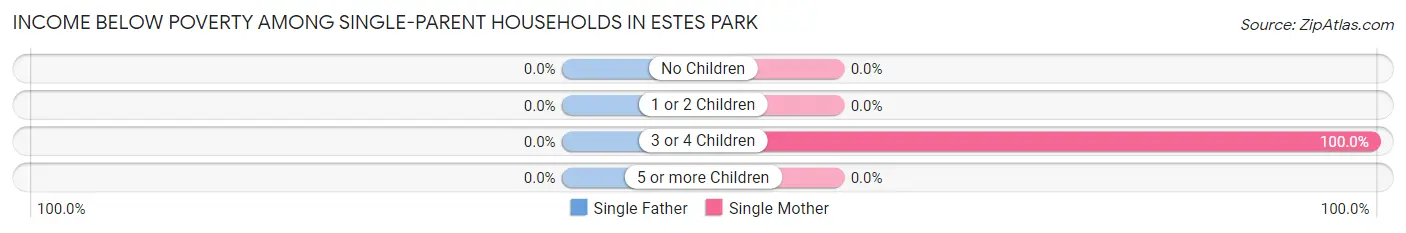
| Children | Single Father | Single Mother |
| No Children | 0 (0.0%) | 0 (0.0%) |
| 1 or 2 Children | 0 (0.0%) | 0 (0.0%) |
| 3 or 4 Children | 0 (0.0%) | 22 (100.0%) |
| 5 or more Children | 0 (0.0%) | 0 (0.0%) |
| Total | 0 (0.0%) | 22 (12.9%) |
Income Below Poverty Among Married-Couple vs Single-Parent Households in Estes Park
The poverty data for Estes Park shows that 83 of the married-couple family households (5.4%) and 22 of the single-parent households (7.0%) are living below the poverty level. Within the married-couple family households, those with no children have the highest poverty rate, with 83 households (6.1%) falling below the poverty line. Among the single-parent households, those with 3 or 4 children have the highest poverty rate, with 22 household (100.0%) living below poverty.
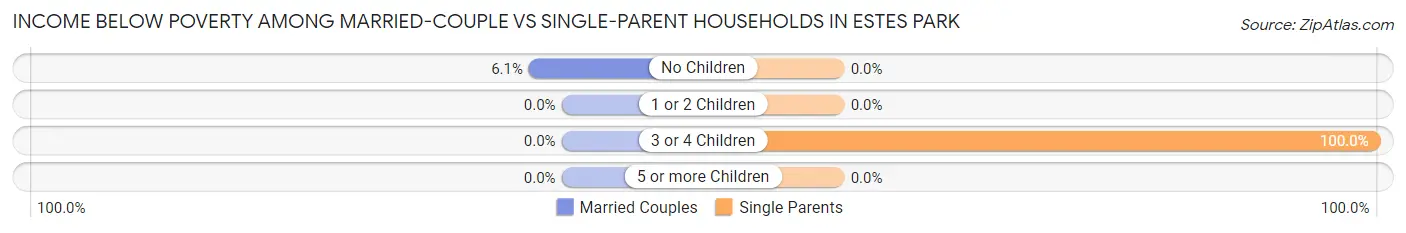
| Children | Married-Couple Families | Single-Parent Households |
| No Children | 83 (6.1%) | 0 (0.0%) |
| 1 or 2 Children | 0 (0.0%) | 0 (0.0%) |
| 3 or 4 Children | 0 (0.0%) | 22 (100.0%) |
| 5 or more Children | 0 (0.0%) | 0 (0.0%) |
| Total | 83 (5.4%) | 22 (7.0%) |
Race in Estes Park
The most populous races in Estes Park are White / Caucasian (5,408 | 91.6%), Hispanic or Latino (674 | 11.4%), and Two or more Races (269 | 4.5%).
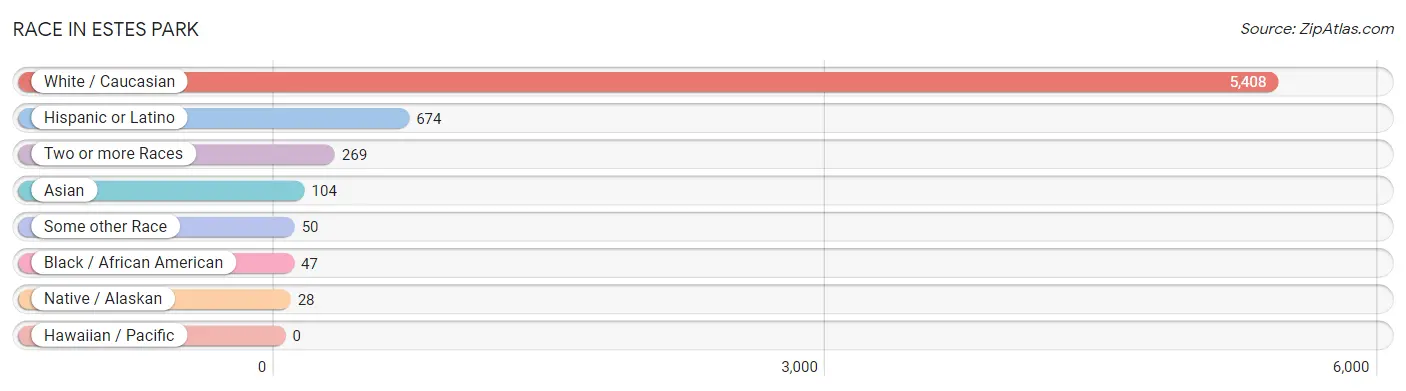
| Race | # Population | % Population |
| Asian | 104 | 1.8% |
| Black / African American | 47 | 0.8% |
| Hawaiian / Pacific | 0 | 0.0% |
| Hispanic or Latino | 674 | 11.4% |
| Native / Alaskan | 28 | 0.5% |
| White / Caucasian | 5,408 | 91.6% |
| Two or more Races | 269 | 4.5% |
| Some other Race | 50 | 0.9% |
| Total | 5,906 | 100.0% |
Ancestry in Estes Park
The most populous ancestries reported in Estes Park are German (1,189 | 20.1%), English (1,113 | 18.9%), Irish (817 | 13.8%), Mexican (572 | 9.7%), and American (367 | 6.2%), together accounting for 68.7% of all Estes Park residents.
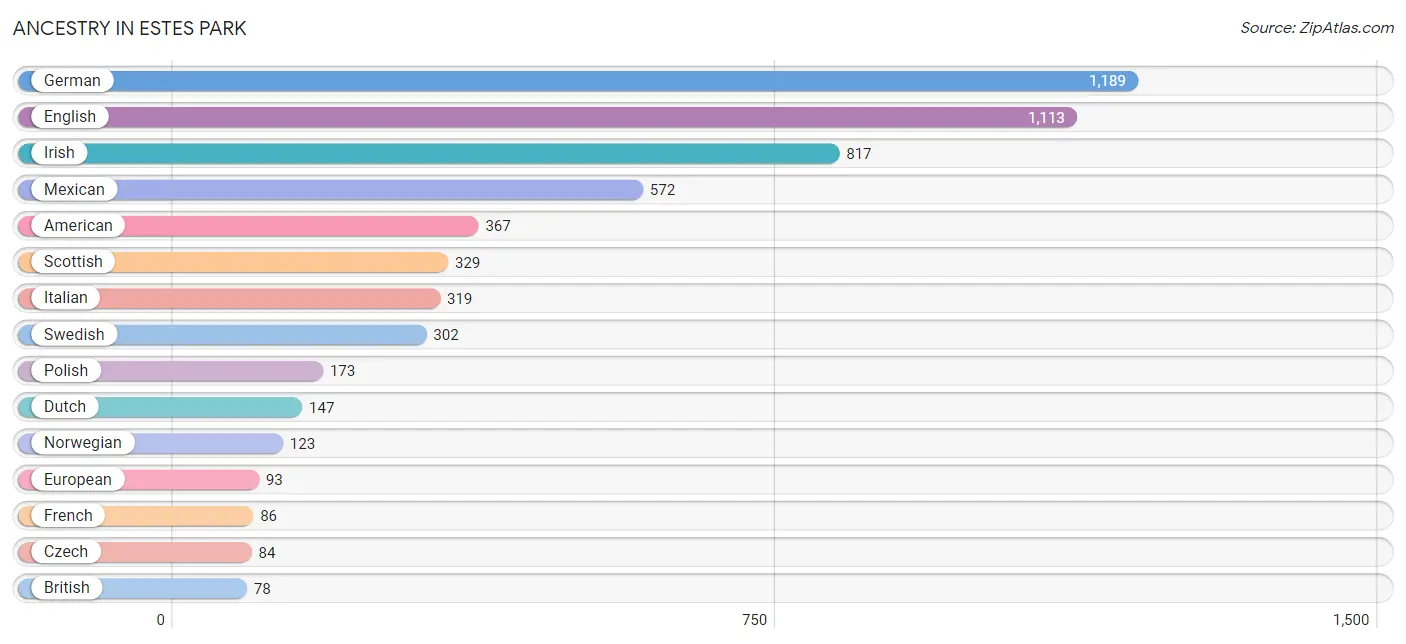
| Ancestry | # Population | % Population |
| American | 367 | 6.2% |
| Argentinean | 12 | 0.2% |
| British | 78 | 1.3% |
| Burmese | 38 | 0.6% |
| Canadian | 19 | 0.3% |
| Cherokee | 13 | 0.2% |
| Colombian | 24 | 0.4% |
| Cuban | 18 | 0.3% |
| Czech | 84 | 1.4% |
| Danish | 14 | 0.2% |
| Dutch | 147 | 2.5% |
| English | 1,113 | 18.9% |
| European | 93 | 1.6% |
| French | 86 | 1.5% |
| French Canadian | 20 | 0.3% |
| German | 1,189 | 20.1% |
| Hungarian | 33 | 0.6% |
| Irish | 817 | 13.8% |
| Italian | 319 | 5.4% |
| Korean | 22 | 0.4% |
| Lithuanian | 36 | 0.6% |
| Mexican | 572 | 9.7% |
| Navajo | 8 | 0.1% |
| Northern European | 40 | 0.7% |
| Norwegian | 123 | 2.1% |
| Ottawa | 21 | 0.4% |
| Polish | 173 | 2.9% |
| Portuguese | 11 | 0.2% |
| Romanian | 7 | 0.1% |
| Russian | 73 | 1.2% |
| Scandinavian | 62 | 1.1% |
| Scotch-Irish | 49 | 0.8% |
| Scottish | 329 | 5.6% |
| Slovene | 9 | 0.2% |
| South American | 36 | 0.6% |
| Spaniard | 9 | 0.2% |
| Spanish | 39 | 0.7% |
| Swedish | 302 | 5.1% |
| Swiss | 45 | 0.8% |
| Thai | 66 | 1.1% |
| Welsh | 61 | 1.0% | View All 41 Rows |
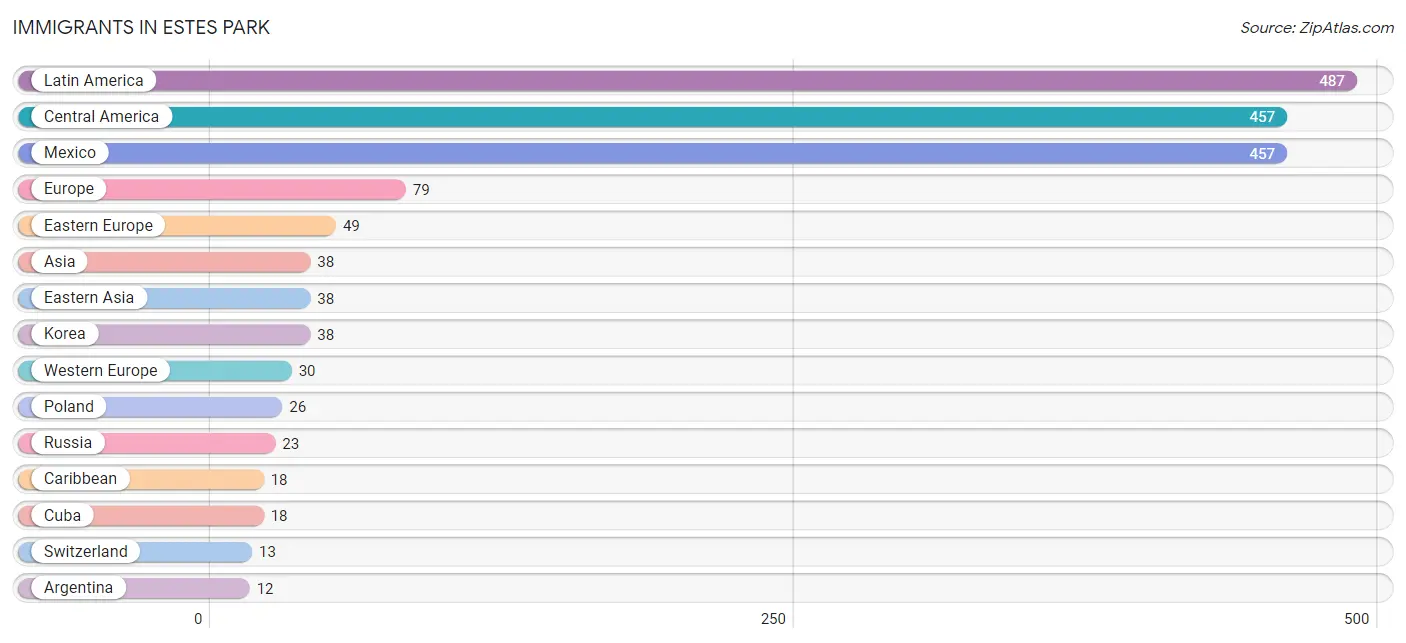
Immigrants in Estes Park
The most numerous immigrant groups reported in Estes Park came from Latin America (487 | 8.3%), Central America (457 | 7.7%), Mexico (457 | 7.7%), Europe (79 | 1.3%), and Eastern Europe (49 | 0.8%), together accounting for 25.9% of all Estes Park residents.
| Immigration Origin | # Population | % Population |
| Argentina | 12 | 0.2% |
| Asia | 38 | 0.6% |
| Caribbean | 18 | 0.3% |
| Central America | 457 | 7.7% |
| Cuba | 18 | 0.3% |
| Eastern Asia | 38 | 0.6% |
| Eastern Europe | 49 | 0.8% |
| Europe | 79 | 1.3% |
| Germany | 8 | 0.1% |
| Korea | 38 | 0.6% |
| Latin America | 487 | 8.3% |
| Mexico | 457 | 7.7% |
| Netherlands | 9 | 0.2% |
| Poland | 26 | 0.4% |
| Russia | 23 | 0.4% |
| South America | 12 | 0.2% |
| Switzerland | 13 | 0.2% |
| Western Europe | 30 | 0.5% | View All 18 Rows |
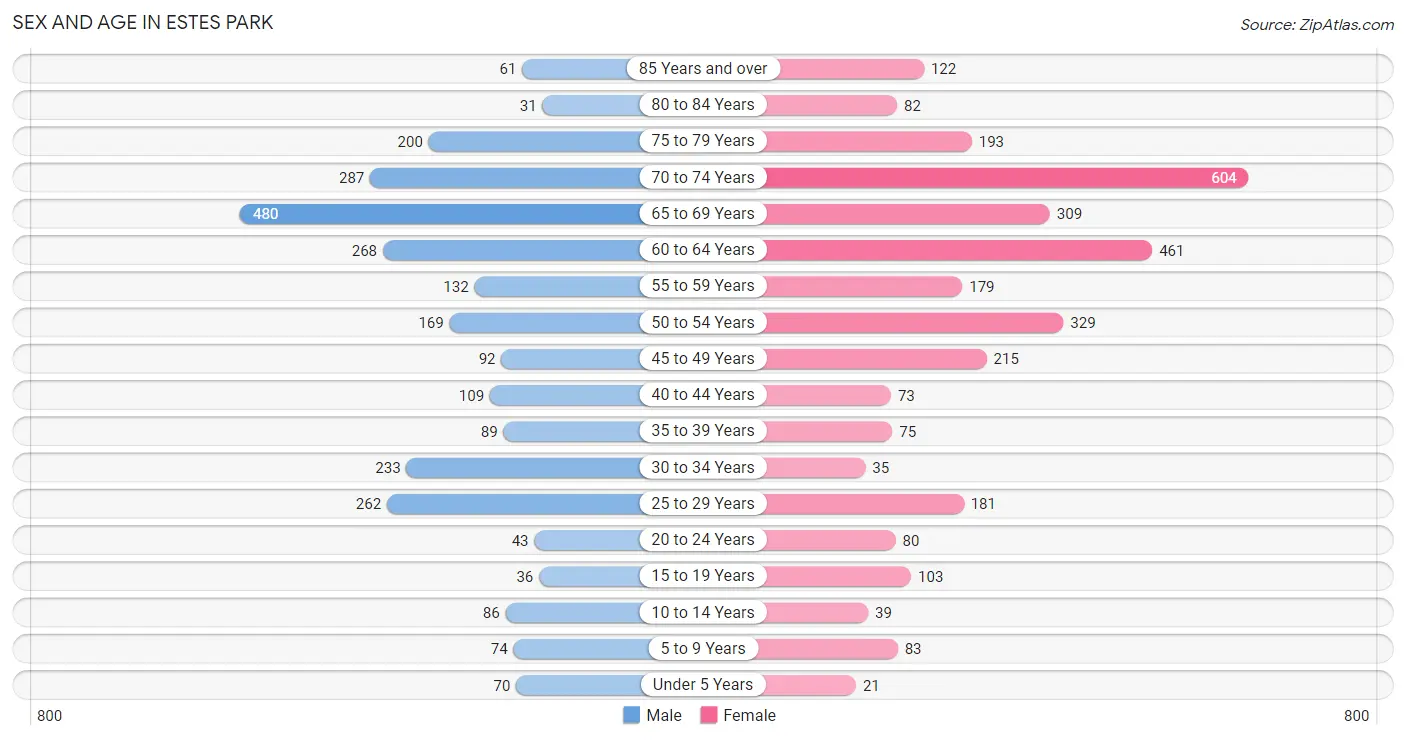
Sex and Age in Estes Park
Sex and Age in Estes Park
The most populous age groups in Estes Park are 65 to 69 Years (480 | 17.6%) for men and 70 to 74 Years (604 | 19.0%) for women.
| Age Bracket | Male | Female |
| Under 5 Years | 70 (2.6%) | 21 (0.7%) |
| 5 to 9 Years | 74 (2.7%) | 83 (2.6%) |
| 10 to 14 Years | 86 (3.2%) | 39 (1.2%) |
| 15 to 19 Years | 36 (1.3%) | 103 (3.2%) |
| 20 to 24 Years | 43 (1.6%) | 80 (2.5%) |
| 25 to 29 Years | 262 (9.6%) | 181 (5.7%) |
| 30 to 34 Years | 233 (8.6%) | 35 (1.1%) |
| 35 to 39 Years | 89 (3.3%) | 75 (2.4%) |
| 40 to 44 Years | 109 (4.0%) | 73 (2.3%) |
| 45 to 49 Years | 92 (3.4%) | 215 (6.8%) |
| 50 to 54 Years | 169 (6.2%) | 329 (10.3%) |
| 55 to 59 Years | 132 (4.9%) | 179 (5.6%) |
| 60 to 64 Years | 268 (9.9%) | 461 (14.5%) |
| 65 to 69 Years | 480 (17.6%) | 309 (9.7%) |
| 70 to 74 Years | 287 (10.5%) | 604 (19.0%) |
| 75 to 79 Years | 200 (7.3%) | 193 (6.1%) |
| 80 to 84 Years | 31 (1.1%) | 82 (2.6%) |
| 85 Years and over | 61 (2.2%) | 122 (3.8%) |
| Total | 2,722 (100.0%) | 3,184 (100.0%) |
Families and Households in Estes Park
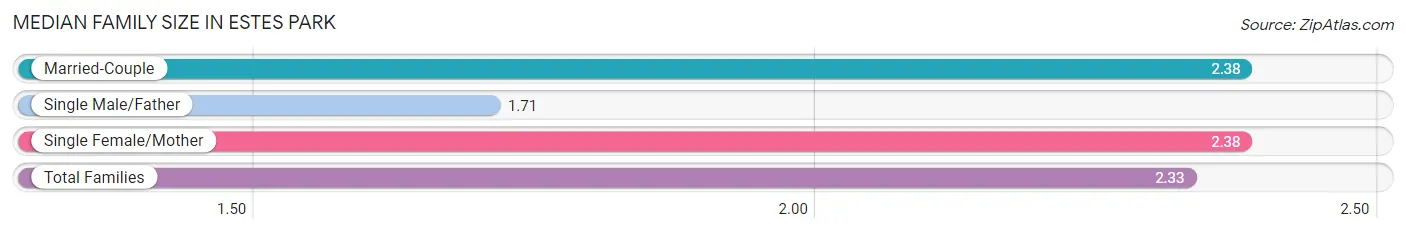
Median Family Size in Estes Park
The median family size in Estes Park is 2.33 persons per family, with married-couple families (1,542 | 83.2%) accounting for the largest median family size of 2.38 persons per family. On the other hand, single male/father families (142 | 7.7%) represent the smallest median family size with 1.71 persons per family.
| Family Type | # Families | Family Size |
| Married-Couple | 1,542 (83.2%) | 2.38 |
| Single Male/Father | 142 (7.7%) | 1.71 |
| Single Female/Mother | 170 (9.2%) | 2.38 |
| Total Families | 1,854 (100.0%) | 2.33 |
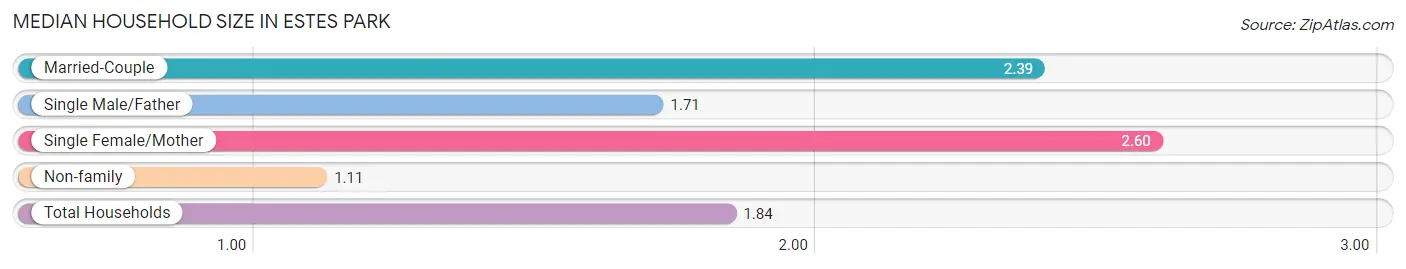
Median Household Size in Estes Park
The median household size in Estes Park is 1.84 persons per household, with single female/mother households (170 | 5.4%) accounting for the largest median household size of 2.6 persons per household. non-family households (1,312 | 41.4%) represent the smallest median household size with 1.11 persons per household.
| Household Type | # Households | Household Size |
| Married-Couple | 1,542 (48.7%) | 2.39 |
| Single Male/Father | 142 (4.5%) | 1.71 |
| Single Female/Mother | 170 (5.4%) | 2.60 |
| Non-family | 1,312 (41.4%) | 1.11 |
| Total Households | 3,166 (100.0%) | 1.84 |
Household Size by Marriage Status in Estes Park
Out of a total of 3,166 households in Estes Park, 1,854 (58.6%) are family households, while 1,312 (41.4%) are nonfamily households. The most numerous type of family households are 2-person households, comprising 1,439, and the most common type of nonfamily households are 1-person households, comprising 1,156.
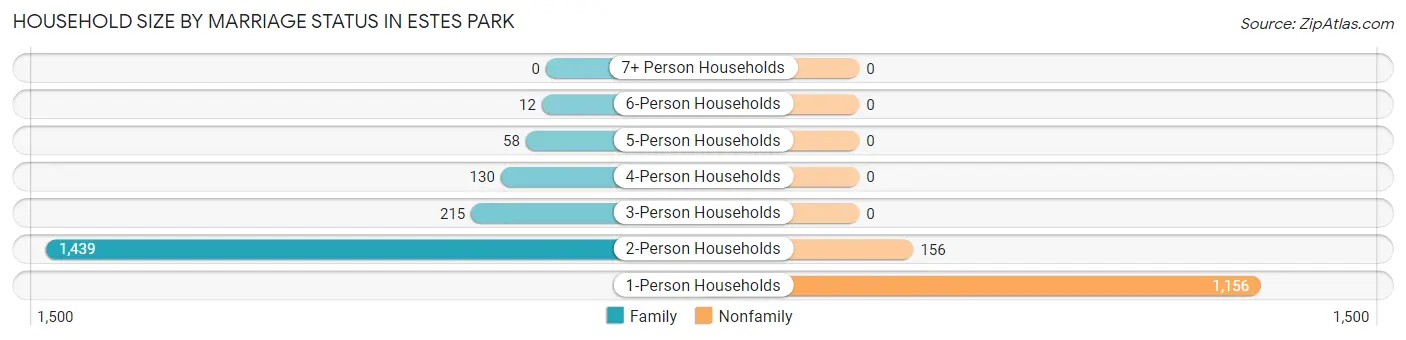
| Household Size | Family Households | Nonfamily Households |
| 1-Person Households | - | 1,156 (36.5%) |
| 2-Person Households | 1,439 (45.5%) | 156 (4.9%) |
| 3-Person Households | 215 (6.8%) | 0 (0.0%) |
| 4-Person Households | 130 (4.1%) | 0 (0.0%) |
| 5-Person Households | 58 (1.8%) | 0 (0.0%) |
| 6-Person Households | 12 (0.4%) | 0 (0.0%) |
| 7+ Person Households | 0 (0.0%) | 0 (0.0%) |
| Total | 1,854 (58.6%) | 1,312 (41.4%) |
Female Fertility in Estes Park
Fertility by Age in Estes Park
Average fertility rate in Estes Park is 55.0 births per 1,000 women. Women in the age bracket of 35 to 50 years have the highest fertility rate with 75.0 births per 1,000 women. Women in the age bracket of 35 to 50 years acount for 71.7% of all women with births.
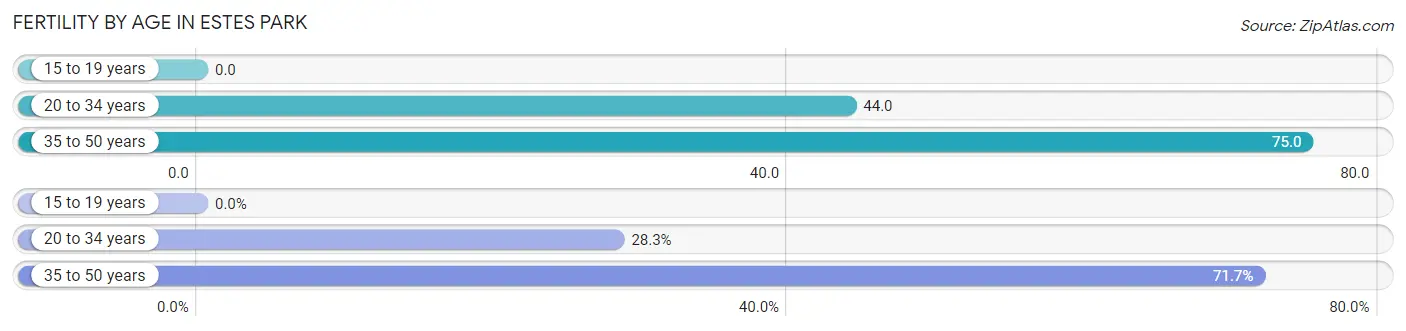
| Age Bracket | Women with Births | Births / 1,000 Women |
| 15 to 19 years | 0 (0.0%) | 0.0 |
| 20 to 34 years | 13 (28.3%) | 44.0 |
| 35 to 50 years | 33 (71.7%) | 75.0 |
| Total | 46 (100.0%) | 55.0 |
Fertility by Age by Marriage Status in Estes Park
67.4% of women with births (46) in Estes Park are married. The highest percentage of unmarried women with births falls into 35 to 50 years age bracket with 45.5% of them unmarried at the time of birth, while the lowest percentage of unmarried women with births belong to 20 to 34 years age bracket with 0.0% of them unmarried.
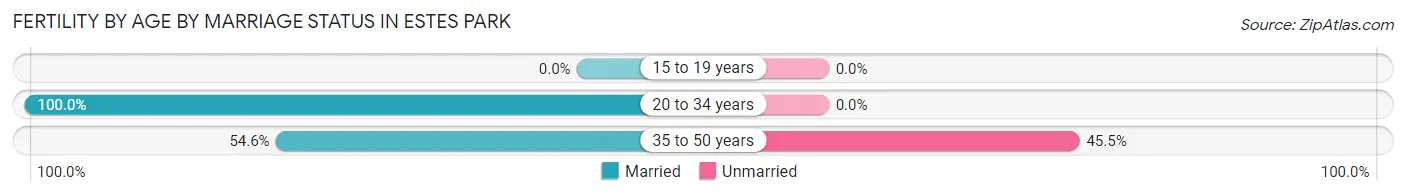
| Age Bracket | Married | Unmarried |
| 15 to 19 years | 0 (0.0%) | 0 (0.0%) |
| 20 to 34 years | 13 (100.0%) | 0 (0.0%) |
| 35 to 50 years | 18 (54.5%) | 15 (45.5%) |
| Total | 31 (67.4%) | 15 (32.6%) |
Fertility by Education in Estes Park
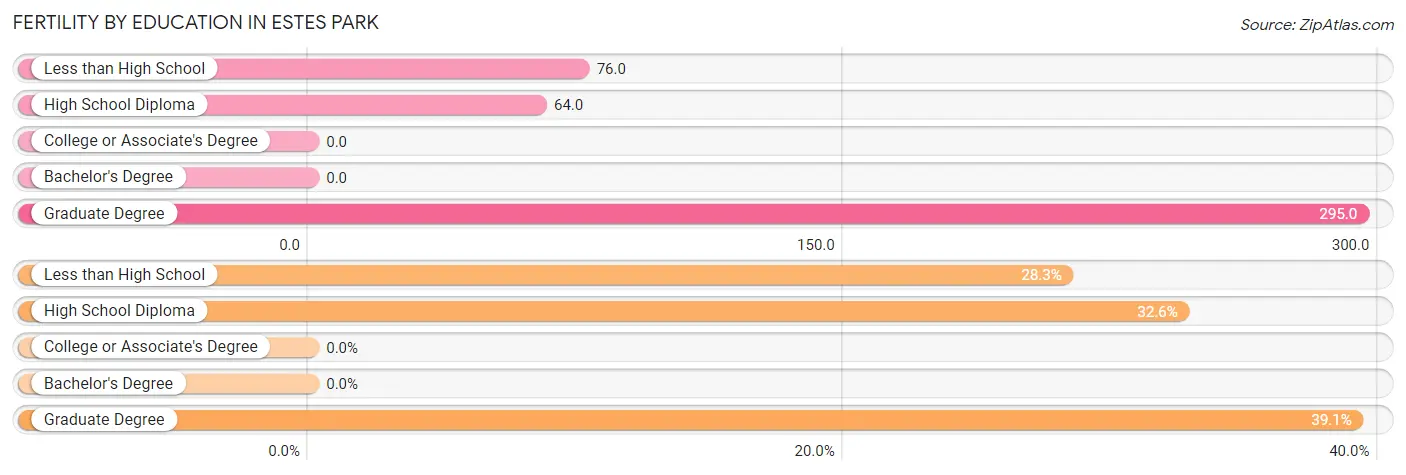
| Educational Attainment | Women with Births | Births / 1,000 Women |
| Less than High School | 13 (28.3%) | 76.0 |
| High School Diploma | 15 (32.6%) | 64.0 |
| College or Associate's Degree | 0 (0.0%) | 0.0 |
| Bachelor's Degree | 0 (0.0%) | 0.0 |
| Graduate Degree | 18 (39.1%) | 295.0 |
| Total | 46 (100.0%) | 55.0 |
Fertility by Education by Marriage Status in Estes Park
32.6% of women with births in Estes Park are unmarried. Women with the educational attainment of less than high school are most likely to be married with 100.0% of them married at childbirth, while women with the educational attainment of high school diploma are least likely to be married with 100.0% of them unmarried at childbirth.
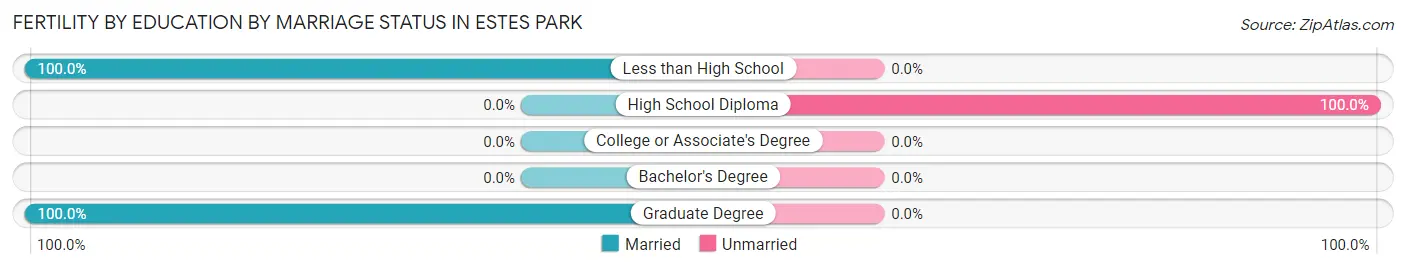
| Educational Attainment | Married | Unmarried |
| Less than High School | 13 (100.0%) | 0 (0.0%) |
| High School Diploma | 0 (0.0%) | 15 (100.0%) |
| College or Associate's Degree | 0 (0.0%) | 0 (0.0%) |
| Bachelor's Degree | 0 (0.0%) | 0 (0.0%) |
| Graduate Degree | 18 (100.0%) | 0 (0.0%) |
| Total | 31 (67.4%) | 15 (32.6%) |
Employment Characteristics in Estes Park
Employment by Class of Employer in Estes Park
Among the 2,565 employed individuals in Estes Park, private company employees (1,696 | 66.1%), local government employees (250 | 9.8%), and not-for-profit organizations (182 | 7.1%) make up the most common classes of employment.
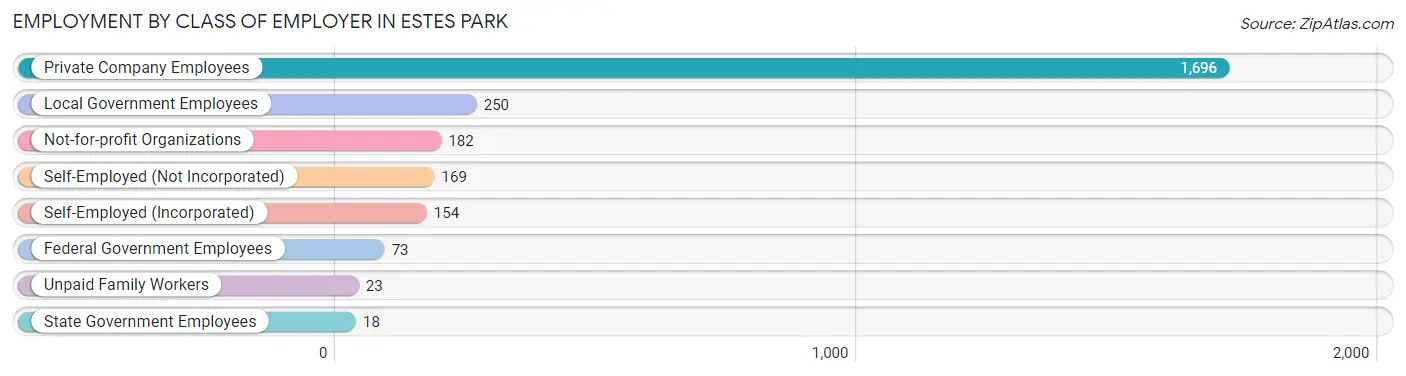
| Employer Class | # Employees | % Employees |
| Private Company Employees | 1,696 | 66.1% |
| Self-Employed (Incorporated) | 154 | 6.0% |
| Self-Employed (Not Incorporated) | 169 | 6.6% |
| Not-for-profit Organizations | 182 | 7.1% |
| Local Government Employees | 250 | 9.8% |
| State Government Employees | 18 | 0.7% |
| Federal Government Employees | 73 | 2.9% |
| Unpaid Family Workers | 23 | 0.9% |
| Total | 2,565 | 100.0% |
Employment Status by Age in Estes Park
According to the labor force statistics for Estes Park, out of the total population over 16 years of age (5,474), 50.6% or 2,770 individuals are in the labor force, with 5.4% or 150 of them unemployed. The age group with the highest labor force participation rate is 30 to 34 years, with 100.0% or 268 individuals in the labor force. Within the labor force, the 45 to 54 years age range has the highest percentage of unemployed individuals, with 24.2% or 151 of them being unemployed.
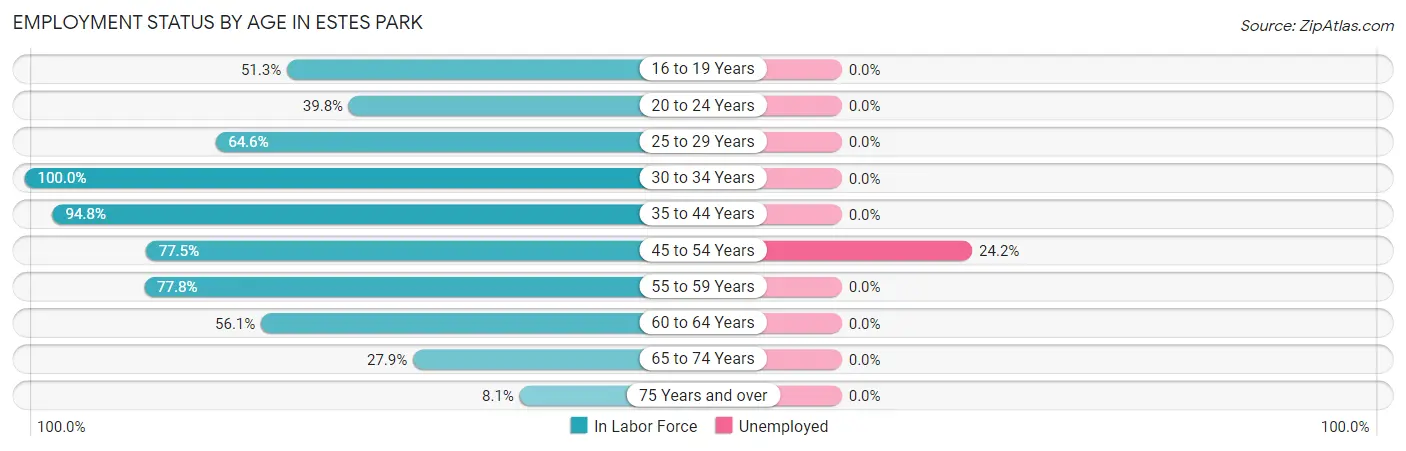
| Age Bracket | In Labor Force | Unemployed |
| 16 to 19 Years | 41 (51.3%) | 0 (0.0%) |
| 20 to 24 Years | 49 (39.8%) | 0 (0.0%) |
| 25 to 29 Years | 286 (64.6%) | 0 (0.0%) |
| 30 to 34 Years | 268 (100.0%) | 0 (0.0%) |
| 35 to 44 Years | 328 (94.8%) | 0 (0.0%) |
| 45 to 54 Years | 624 (77.5%) | 151 (24.2%) |
| 55 to 59 Years | 242 (77.8%) | 0 (0.0%) |
| 60 to 64 Years | 409 (56.1%) | 0 (0.0%) |
| 65 to 74 Years | 469 (27.9%) | 0 (0.0%) |
| 75 Years and over | 56 (8.1%) | 0 (0.0%) |
| Total | 2,770 (50.6%) | 150 (5.4%) |
Employment Status by Educational Attainment in Estes Park
According to labor force statistics for Estes Park, 74.3% of individuals (2,156) out of the total population between 25 and 64 years of age (2,902) are in the labor force, with 7.0% or 151 of them being unemployed. The group with the highest labor force participation rate are those with the educational attainment of less than high school, with 87.1% or 176 individuals in the labor force. Within the labor force, individuals with college / associate degree education have the highest percentage of unemployment, with 13.3% or 83 of them being unemployed.
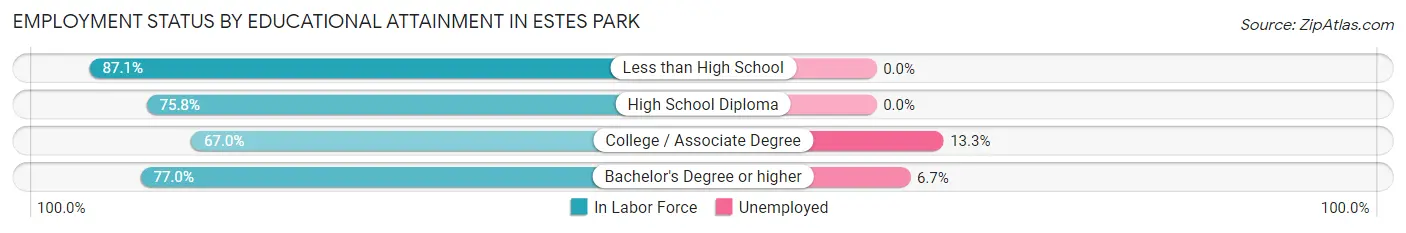
| Educational Attainment | In Labor Force | Unemployed |
| Less than High School | 176 (87.1%) | 0 (0.0%) |
| High School Diploma | 345 (75.8%) | 0 (0.0%) |
| College / Associate Degree | 622 (67.0%) | 123 (13.3%) |
| Bachelor's Degree or higher | 1,014 (77.0%) | 88 (6.7%) |
| Total | 2,156 (74.3%) | 203 (7.0%) |
Employment Occupations by Sex in Estes Park
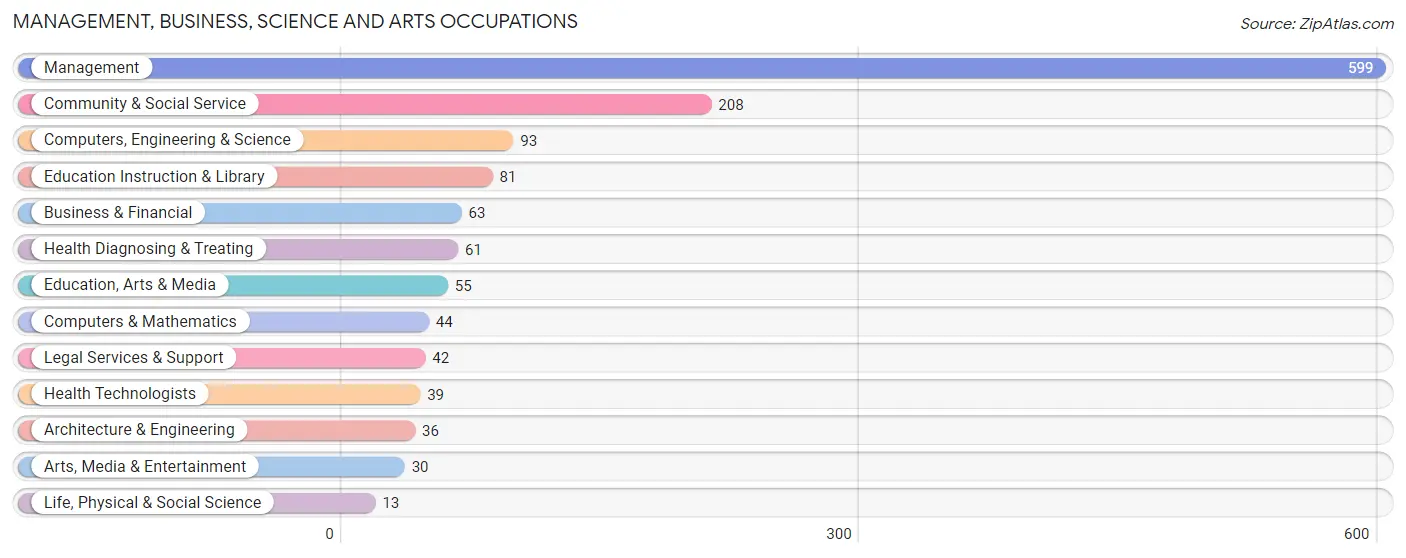
Management, Business, Science and Arts Occupations
The most common Management, Business, Science and Arts occupations in Estes Park are Management (599 | 22.9%), Community & Social Service (208 | 7.9%), Computers, Engineering & Science (93 | 3.5%), Education Instruction & Library (81 | 3.1%), and Business & Financial (63 | 2.4%).
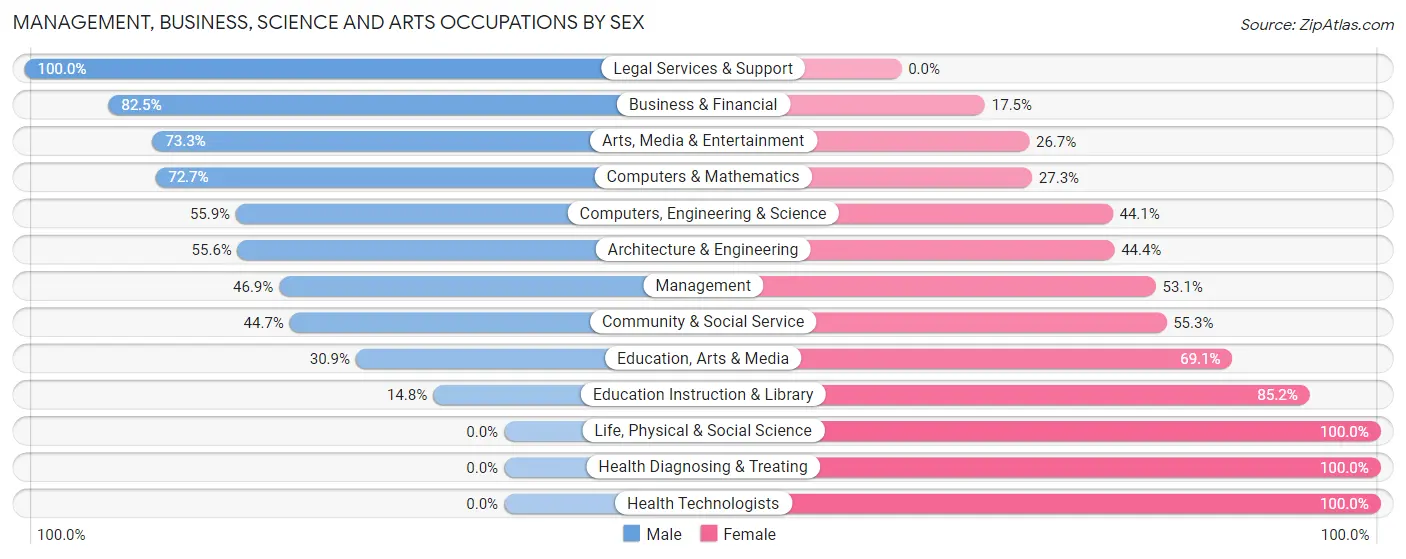
Management, Business, Science and Arts Occupations by Sex
Within the Management, Business, Science and Arts occupations in Estes Park, the most male-oriented occupations are Legal Services & Support (100.0%), Business & Financial (82.5%), and Arts, Media & Entertainment (73.3%), while the most female-oriented occupations are Life, Physical & Social Science (100.0%), Health Diagnosing & Treating (100.0%), and Health Technologists (100.0%).
| Occupation | Male | Female |
| Management | 281 (46.9%) | 318 (53.1%) |
| Business & Financial | 52 (82.5%) | 11 (17.5%) |
| Computers, Engineering & Science | 52 (55.9%) | 41 (44.1%) |
| Computers & Mathematics | 32 (72.7%) | 12 (27.3%) |
| Architecture & Engineering | 20 (55.6%) | 16 (44.4%) |
| Life, Physical & Social Science | 0 (0.0%) | 13 (100.0%) |
| Community & Social Service | 93 (44.7%) | 115 (55.3%) |
| Education, Arts & Media | 17 (30.9%) | 38 (69.1%) |
| Legal Services & Support | 42 (100.0%) | 0 (0.0%) |
| Education Instruction & Library | 12 (14.8%) | 69 (85.2%) |
| Arts, Media & Entertainment | 22 (73.3%) | 8 (26.7%) |
| Health Diagnosing & Treating | 0 (0.0%) | 61 (100.0%) |
| Health Technologists | 0 (0.0%) | 39 (100.0%) |
| Total (Category) | 478 (46.7%) | 546 (53.3%) |
| Total (Overall) | 1,479 (56.4%) | 1,142 (43.6%) |
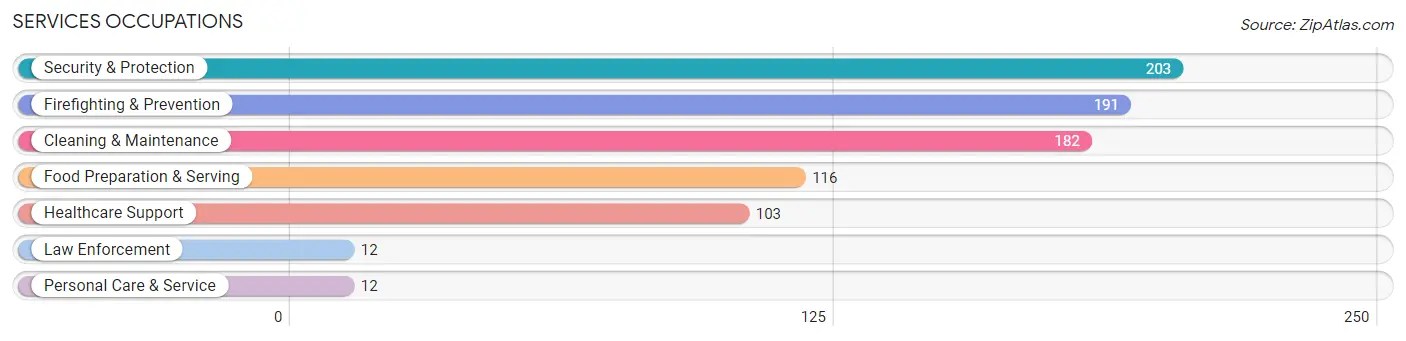
Services Occupations
The most common Services occupations in Estes Park are Security & Protection (203 | 7.7%), Firefighting & Prevention (191 | 7.3%), Cleaning & Maintenance (182 | 6.9%), Food Preparation & Serving (116 | 4.4%), and Healthcare Support (103 | 3.9%).
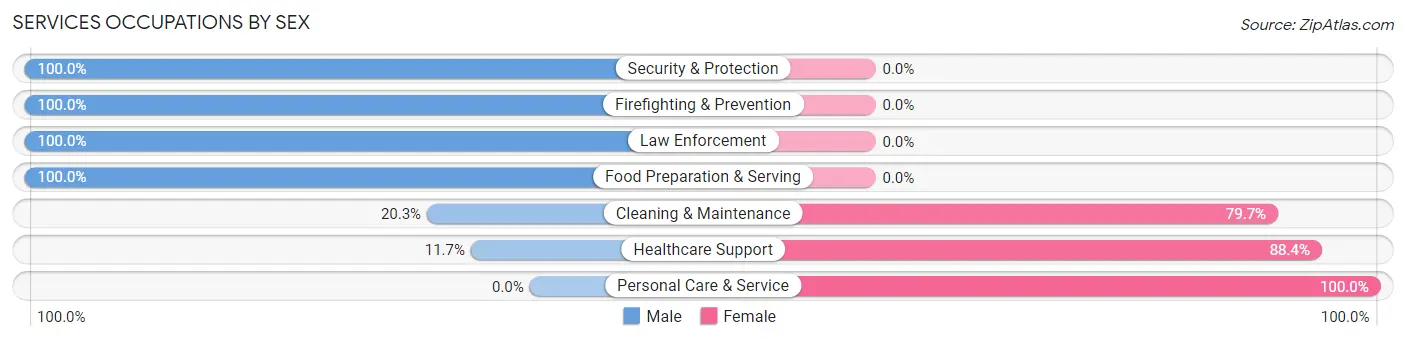
Services Occupations by Sex
Within the Services occupations in Estes Park, the most male-oriented occupations are Security & Protection (100.0%), Firefighting & Prevention (100.0%), and Law Enforcement (100.0%), while the most female-oriented occupations are Personal Care & Service (100.0%), Healthcare Support (88.3%), and Cleaning & Maintenance (79.7%).
| Occupation | Male | Female |
| Healthcare Support | 12 (11.7%) | 91 (88.3%) |
| Security & Protection | 203 (100.0%) | 0 (0.0%) |
| Firefighting & Prevention | 191 (100.0%) | 0 (0.0%) |
| Law Enforcement | 12 (100.0%) | 0 (0.0%) |
| Food Preparation & Serving | 116 (100.0%) | 0 (0.0%) |
| Cleaning & Maintenance | 37 (20.3%) | 145 (79.7%) |
| Personal Care & Service | 0 (0.0%) | 12 (100.0%) |
| Total (Category) | 368 (59.7%) | 248 (40.3%) |
| Total (Overall) | 1,479 (56.4%) | 1,142 (43.6%) |
Sales and Office Occupations
The most common Sales and Office occupations in Estes Park are Office & Administration (326 | 12.4%), and Sales & Related (314 | 12.0%).

Sales and Office Occupations by Sex
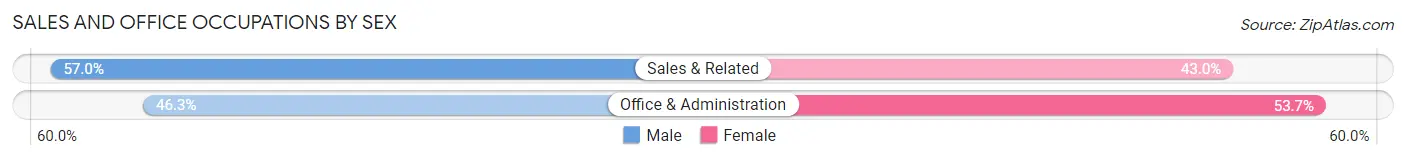
| Occupation | Male | Female |
| Sales & Related | 179 (57.0%) | 135 (43.0%) |
| Office & Administration | 151 (46.3%) | 175 (53.7%) |
| Total (Category) | 330 (51.6%) | 310 (48.4%) |
| Total (Overall) | 1,479 (56.4%) | 1,142 (43.6%) |
Natural Resources, Construction and Maintenance Occupations
The most common Natural Resources, Construction and Maintenance occupations in Estes Park are , and Construction & Extraction (221 | 8.4%).
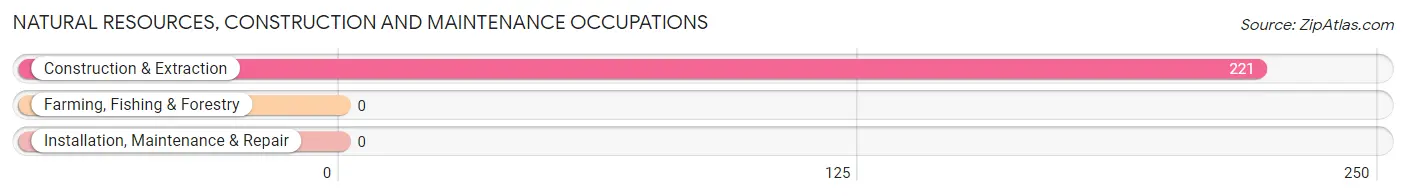
Natural Resources, Construction and Maintenance Occupations by Sex
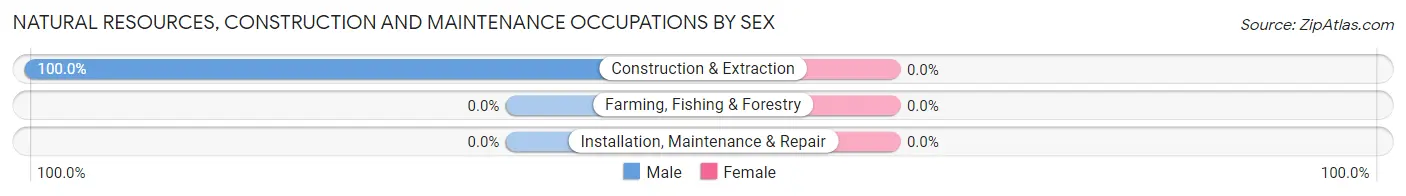
| Occupation | Male | Female |
| Farming, Fishing & Forestry | 0 (0.0%) | 0 (0.0%) |
| Construction & Extraction | 221 (100.0%) | 0 (0.0%) |
| Installation, Maintenance & Repair | 0 (0.0%) | 0 (0.0%) |
| Total (Category) | 221 (100.0%) | 0 (0.0%) |
| Total (Overall) | 1,479 (56.4%) | 1,142 (43.6%) |
Production, Transportation and Moving Occupations
The most common Production, Transportation and Moving occupations in Estes Park are Production (76 | 2.9%), Transportation (29 | 1.1%), and Material Moving (15 | 0.6%).
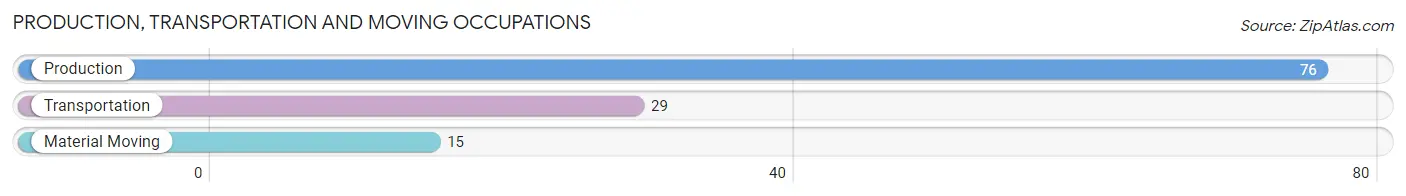
Production, Transportation and Moving Occupations by Sex
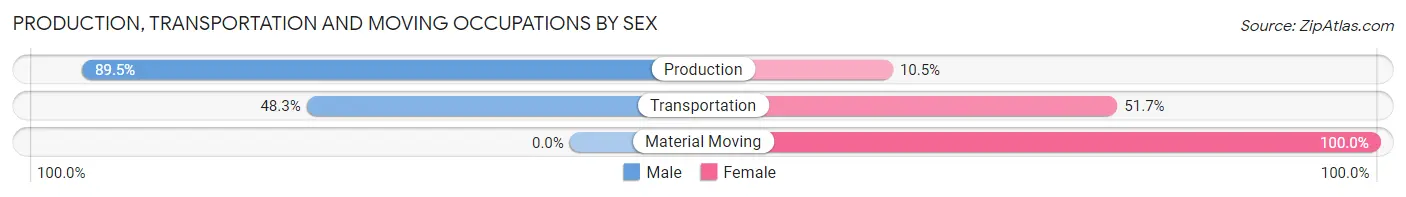
| Occupation | Male | Female |
| Production | 68 (89.5%) | 8 (10.5%) |
| Transportation | 14 (48.3%) | 15 (51.7%) |
| Material Moving | 0 (0.0%) | 15 (100.0%) |
| Total (Category) | 82 (68.3%) | 38 (31.7%) |
| Total (Overall) | 1,479 (56.4%) | 1,142 (43.6%) |
Employment Industries by Sex in Estes Park
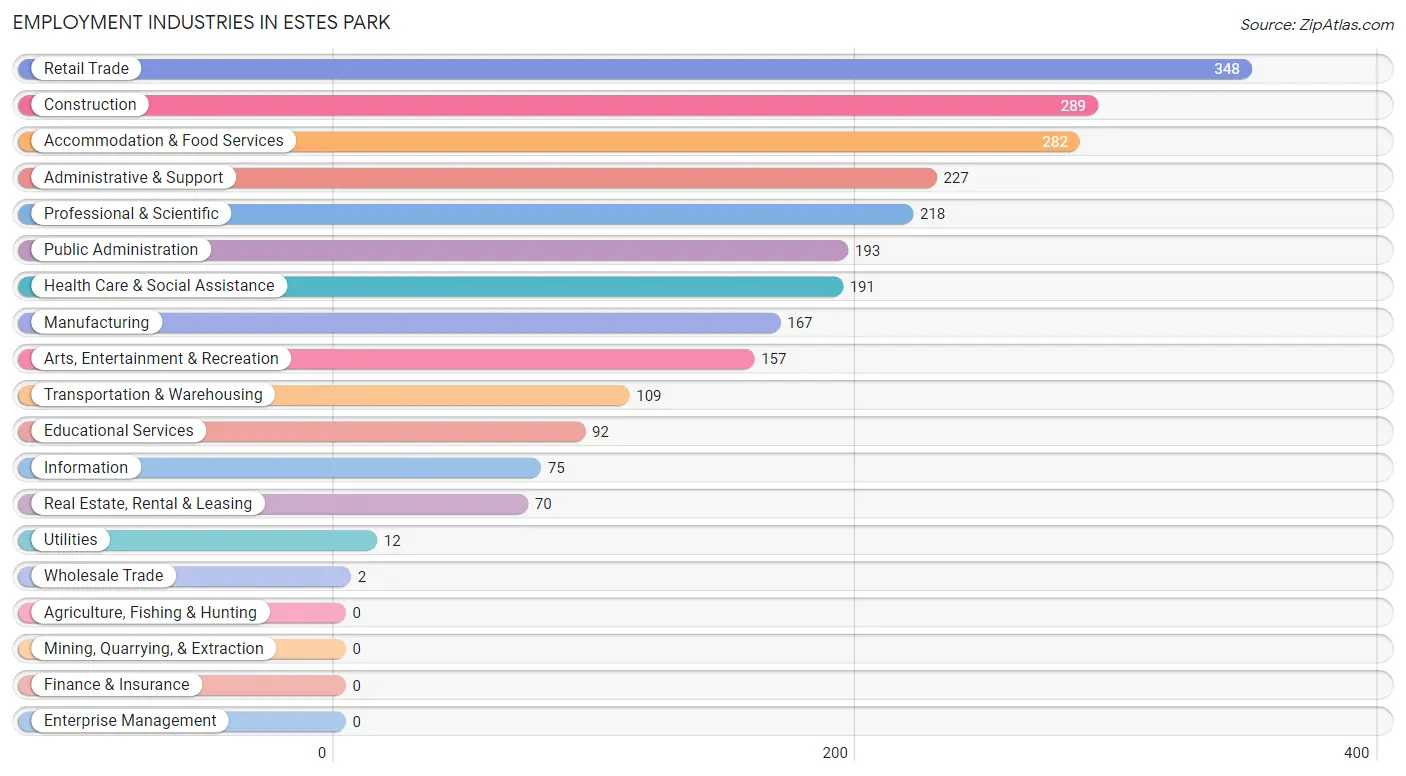
Employment Industries in Estes Park
The major employment industries in Estes Park include Retail Trade (348 | 13.3%), Construction (289 | 11.0%), Accommodation & Food Services (282 | 10.8%), Administrative & Support (227 | 8.7%), and Professional & Scientific (218 | 8.3%).
Employment Industries by Sex in Estes Park
The Estes Park industries that see more men than women are Wholesale Trade (100.0%), Utilities (100.0%), and Manufacturing (93.4%), whereas the industries that tend to have a higher number of women are Educational Services (87.0%), Health Care & Social Assistance (83.3%), and Administrative & Support (78.0%).
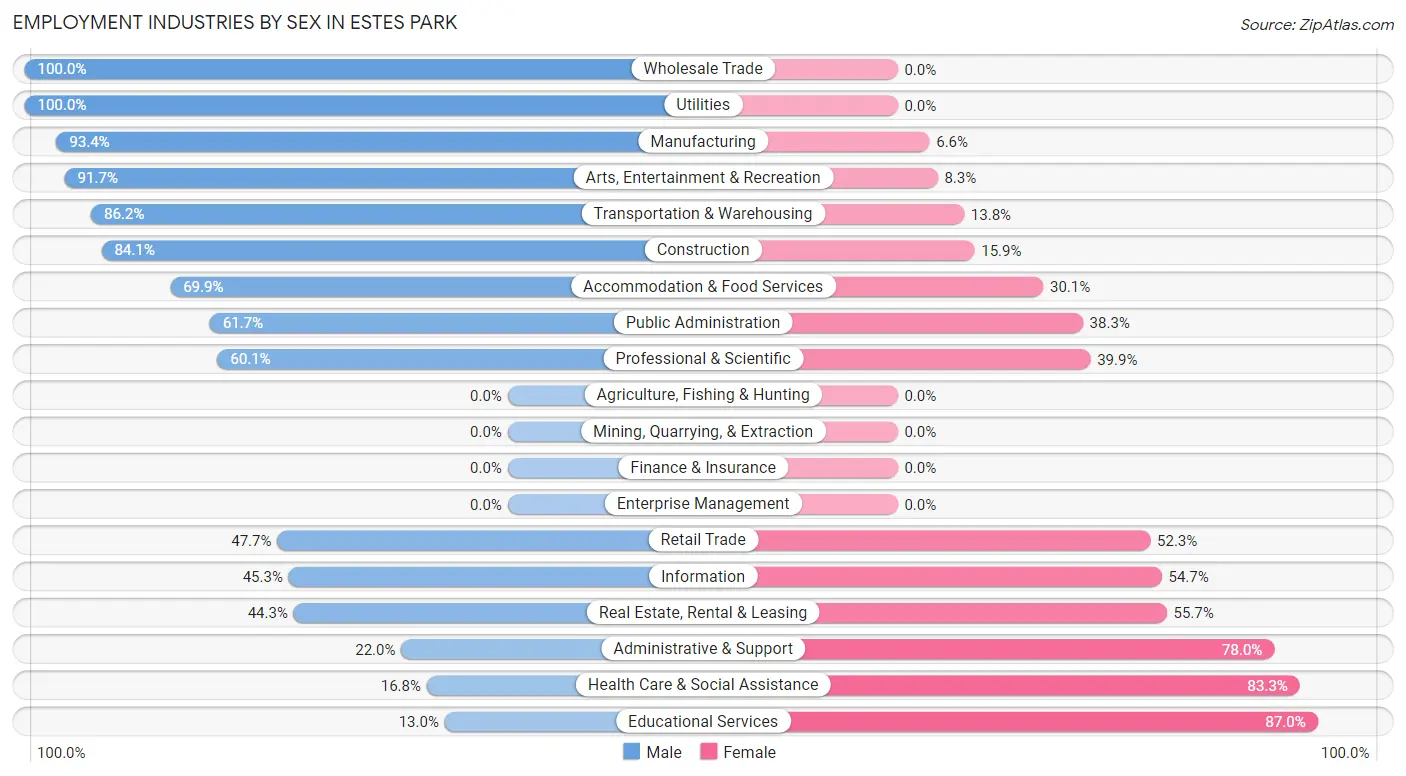
| Industry | Male | Female |
| Agriculture, Fishing & Hunting | 0 (0.0%) | 0 (0.0%) |
| Mining, Quarrying, & Extraction | 0 (0.0%) | 0 (0.0%) |
| Construction | 243 (84.1%) | 46 (15.9%) |
| Manufacturing | 156 (93.4%) | 11 (6.6%) |
| Wholesale Trade | 2 (100.0%) | 0 (0.0%) |
| Retail Trade | 166 (47.7%) | 182 (52.3%) |
| Transportation & Warehousing | 94 (86.2%) | 15 (13.8%) |
| Utilities | 12 (100.0%) | 0 (0.0%) |
| Information | 34 (45.3%) | 41 (54.7%) |
| Finance & Insurance | 0 (0.0%) | 0 (0.0%) |
| Real Estate, Rental & Leasing | 31 (44.3%) | 39 (55.7%) |
| Professional & Scientific | 131 (60.1%) | 87 (39.9%) |
| Enterprise Management | 0 (0.0%) | 0 (0.0%) |
| Administrative & Support | 50 (22.0%) | 177 (78.0%) |
| Educational Services | 12 (13.0%) | 80 (87.0%) |
| Health Care & Social Assistance | 32 (16.8%) | 159 (83.3%) |
| Arts, Entertainment & Recreation | 144 (91.7%) | 13 (8.3%) |
| Accommodation & Food Services | 197 (69.9%) | 85 (30.1%) |
| Public Administration | 119 (61.7%) | 74 (38.3%) |
| Total | 1,479 (56.4%) | 1,142 (43.6%) |
Education in Estes Park
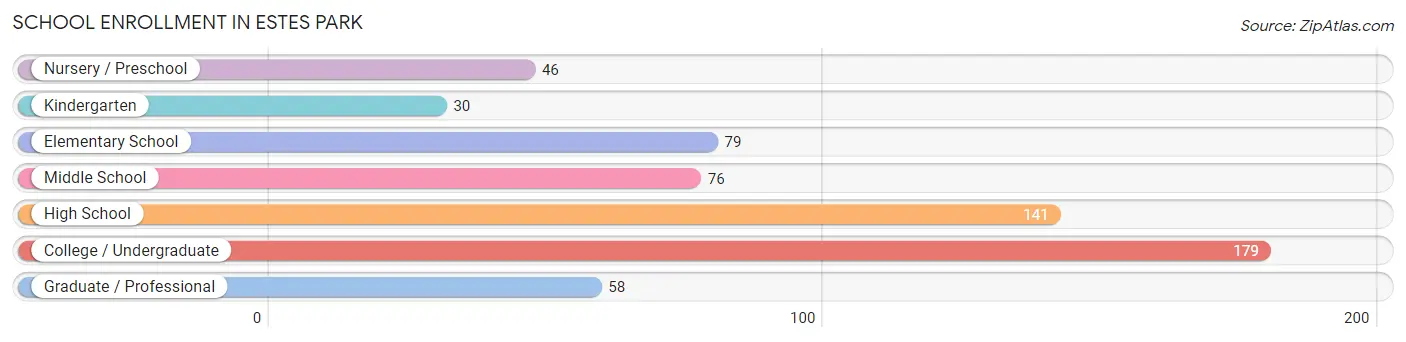
School Enrollment in Estes Park
The most common levels of schooling among the 609 students in Estes Park are college / undergraduate (179 | 29.4%), high school (141 | 23.2%), and elementary school (79 | 13.0%).
| School Level | # Students | % Students |
| Nursery / Preschool | 46 | 7.5% |
| Kindergarten | 30 | 4.9% |
| Elementary School | 79 | 13.0% |
| Middle School | 76 | 12.5% |
| High School | 141 | 23.2% |
| College / Undergraduate | 179 | 29.4% |
| Graduate / Professional | 58 | 9.5% |
| Total | 609 | 100.0% |
School Enrollment by Age by Funding Source in Estes Park
Out of a total of 609 students who are enrolled in schools in Estes Park, 163 (26.8%) attend a private institution, while the remaining 446 (73.2%) are enrolled in public schools. The age group of 15 to 17 year olds has the highest likelihood of being enrolled in private schools, with 73 (79.3% in the age bracket) enrolled. Conversely, the age group of 3 to 4 year olds has the lowest likelihood of being enrolled in a private school, with 17 (100.0% in the age bracket) attending a public institution.
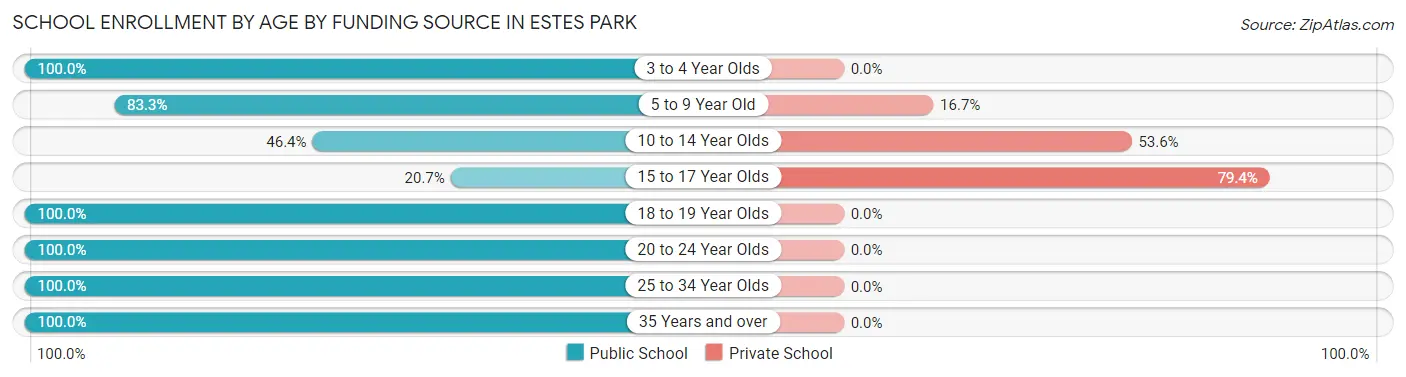
| Age Bracket | Public School | Private School |
| 3 to 4 Year Olds | 17 (100.0%) | 0 (0.0%) |
| 5 to 9 Year Old | 115 (83.3%) | 23 (16.7%) |
| 10 to 14 Year Olds | 58 (46.4%) | 67 (53.6%) |
| 15 to 17 Year Olds | 19 (20.6%) | 73 (79.3%) |
| 18 to 19 Year Olds | 6 (100.0%) | 0 (0.0%) |
| 20 to 24 Year Olds | 19 (100.0%) | 0 (0.0%) |
| 25 to 34 Year Olds | 114 (100.0%) | 0 (0.0%) |
| 35 Years and over | 98 (100.0%) | 0 (0.0%) |
| Total | 446 (73.2%) | 163 (26.8%) |
Educational Attainment by Field of Study in Estes Park
Business (580 | 18.2%), education (413 | 13.0%), engineering (330 | 10.3%), literature & languages (283 | 8.9%), and bio, nature & agricultural (261 | 8.2%) are the most common fields of study among 3,190 individuals in Estes Park who have obtained a bachelor's degree or higher.
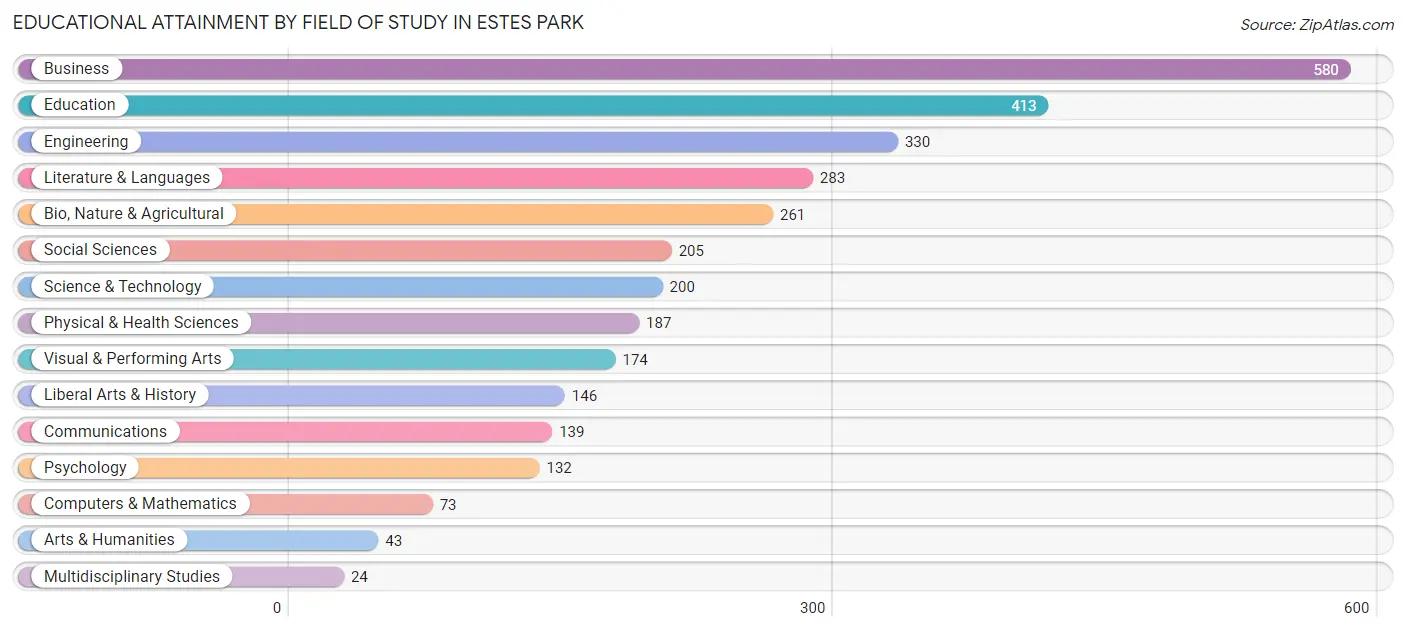
| Field of Study | # Graduates | % Graduates |
| Computers & Mathematics | 73 | 2.3% |
| Bio, Nature & Agricultural | 261 | 8.2% |
| Physical & Health Sciences | 187 | 5.9% |
| Psychology | 132 | 4.1% |
| Social Sciences | 205 | 6.4% |
| Engineering | 330 | 10.3% |
| Multidisciplinary Studies | 24 | 0.7% |
| Science & Technology | 200 | 6.3% |
| Business | 580 | 18.2% |
| Education | 413 | 13.0% |
| Literature & Languages | 283 | 8.9% |
| Liberal Arts & History | 146 | 4.6% |
| Visual & Performing Arts | 174 | 5.4% |
| Communications | 139 | 4.4% |
| Arts & Humanities | 43 | 1.3% |
| Total | 3,190 | 100.0% |
Transportation & Commute in Estes Park
Vehicle Availability by Sex in Estes Park
The most prevalent vehicle ownership categories in Estes Park are males with 2 vehicles (888, accounting for 61.4%) and females with 2 vehicles (634, making up 79.4%).
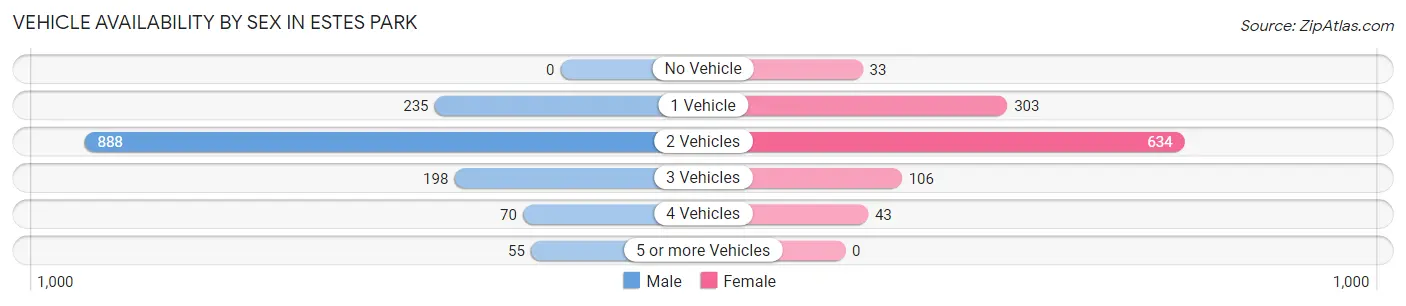
| Vehicles Available | Male | Female |
| No Vehicle | 0 (0.0%) | 33 (2.9%) |
| 1 Vehicle | 235 (16.3%) | 303 (27.1%) |
| 2 Vehicles | 888 (61.4%) | 634 (56.7%) |
| 3 Vehicles | 198 (13.7%) | 106 (9.5%) |
| 4 Vehicles | 70 (4.8%) | 43 (3.8%) |
| 5 or more Vehicles | 55 (3.8%) | 0 (0.0%) |
| Total | 1,446 (100.0%) | 1,119 (100.0%) |
Commute Time in Estes Park
The most frequently occuring commute durations in Estes Park are 5 to 9 minutes (740 commuters, 34.9%), 10 to 14 minutes (657 commuters, 31.0%), and 15 to 19 minutes (155 commuters, 7.3%).
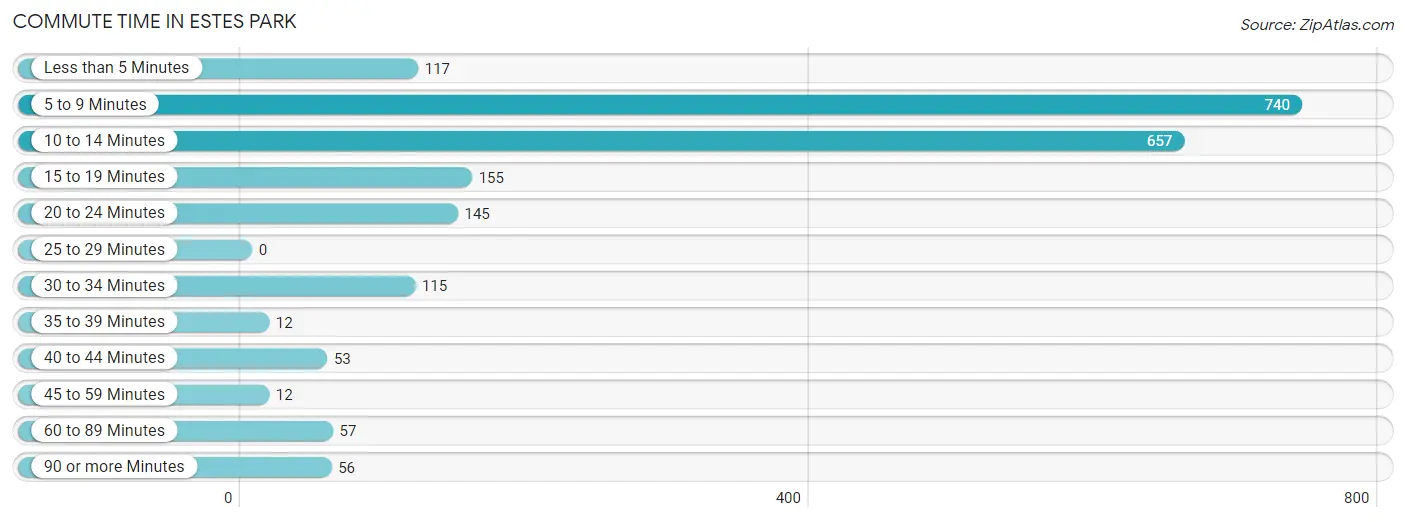
| Commute Time | # Commuters | % Commuters |
| Less than 5 Minutes | 117 | 5.5% |
| 5 to 9 Minutes | 740 | 34.9% |
| 10 to 14 Minutes | 657 | 31.0% |
| 15 to 19 Minutes | 155 | 7.3% |
| 20 to 24 Minutes | 145 | 6.8% |
| 25 to 29 Minutes | 0 | 0.0% |
| 30 to 34 Minutes | 115 | 5.4% |
| 35 to 39 Minutes | 12 | 0.6% |
| 40 to 44 Minutes | 53 | 2.5% |
| 45 to 59 Minutes | 12 | 0.6% |
| 60 to 89 Minutes | 57 | 2.7% |
| 90 or more Minutes | 56 | 2.6% |
Commute Time by Sex in Estes Park
The most common commute times in Estes Park are 5 to 9 minutes (399 commuters, 33.6%) for males and 5 to 9 minutes (341 commuters, 36.5%) for females.
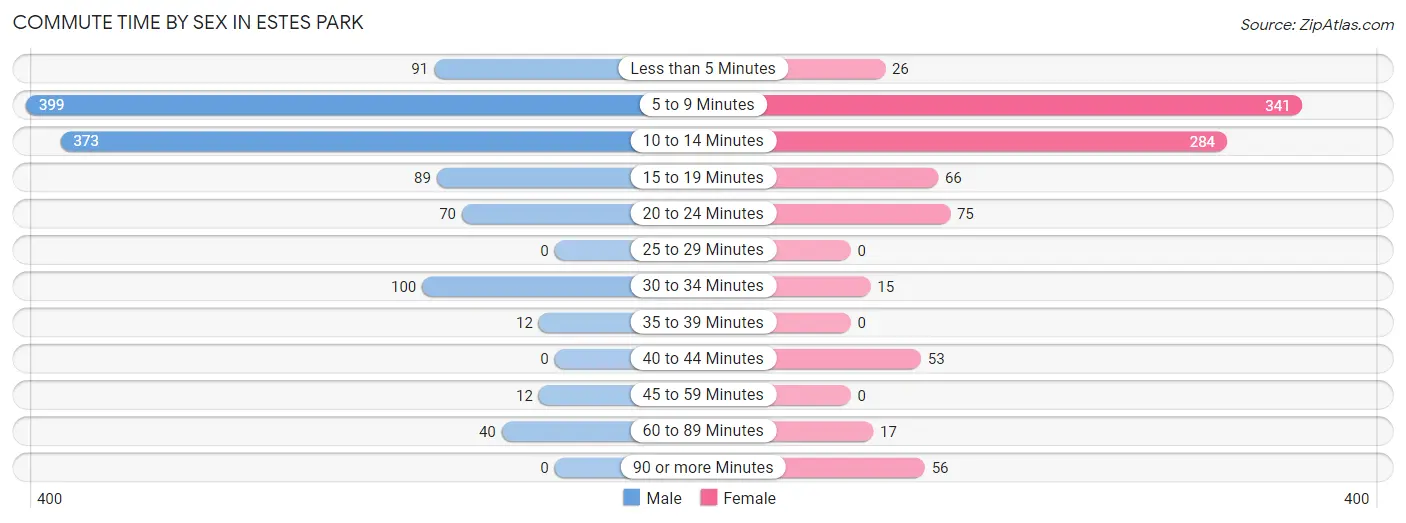
| Commute Time | Male | Female |
| Less than 5 Minutes | 91 (7.7%) | 26 (2.8%) |
| 5 to 9 Minutes | 399 (33.6%) | 341 (36.5%) |
| 10 to 14 Minutes | 373 (31.5%) | 284 (30.4%) |
| 15 to 19 Minutes | 89 (7.5%) | 66 (7.1%) |
| 20 to 24 Minutes | 70 (5.9%) | 75 (8.0%) |
| 25 to 29 Minutes | 0 (0.0%) | 0 (0.0%) |
| 30 to 34 Minutes | 100 (8.4%) | 15 (1.6%) |
| 35 to 39 Minutes | 12 (1.0%) | 0 (0.0%) |
| 40 to 44 Minutes | 0 (0.0%) | 53 (5.7%) |
| 45 to 59 Minutes | 12 (1.0%) | 0 (0.0%) |
| 60 to 89 Minutes | 40 (3.4%) | 17 (1.8%) |
| 90 or more Minutes | 0 (0.0%) | 56 (6.0%) |
Time of Departure to Work by Sex in Estes Park
The most frequent times of departure to work in Estes Park are 7:00 AM to 7:29 AM (274, 23.1%) for males and 8:00 AM to 8:29 AM (308, 33.0%) for females.
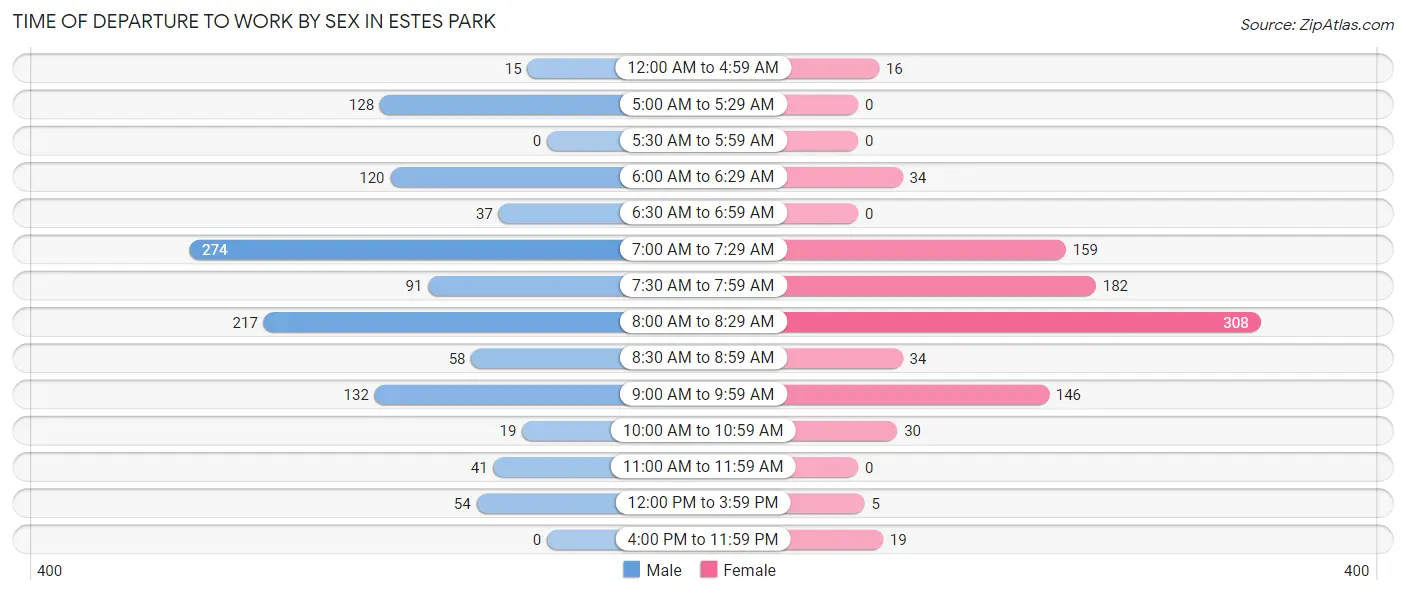
| Time of Departure | Male | Female |
| 12:00 AM to 4:59 AM | 15 (1.3%) | 16 (1.7%) |
| 5:00 AM to 5:29 AM | 128 (10.8%) | 0 (0.0%) |
| 5:30 AM to 5:59 AM | 0 (0.0%) | 0 (0.0%) |
| 6:00 AM to 6:29 AM | 120 (10.1%) | 34 (3.6%) |
| 6:30 AM to 6:59 AM | 37 (3.1%) | 0 (0.0%) |
| 7:00 AM to 7:29 AM | 274 (23.1%) | 159 (17.0%) |
| 7:30 AM to 7:59 AM | 91 (7.7%) | 182 (19.5%) |
| 8:00 AM to 8:29 AM | 217 (18.3%) | 308 (33.0%) |
| 8:30 AM to 8:59 AM | 58 (4.9%) | 34 (3.6%) |
| 9:00 AM to 9:59 AM | 132 (11.1%) | 146 (15.7%) |
| 10:00 AM to 10:59 AM | 19 (1.6%) | 30 (3.2%) |
| 11:00 AM to 11:59 AM | 41 (3.5%) | 0 (0.0%) |
| 12:00 PM to 3:59 PM | 54 (4.5%) | 5 (0.5%) |
| 4:00 PM to 11:59 PM | 0 (0.0%) | 19 (2.0%) |
| Total | 1,186 (100.0%) | 933 (100.0%) |
Housing Occupancy in Estes Park
Occupancy by Ownership in Estes Park
Of the total 3,166 dwellings in Estes Park, owner-occupied units account for 2,006 (63.4%), while renter-occupied units make up 1,160 (36.6%).
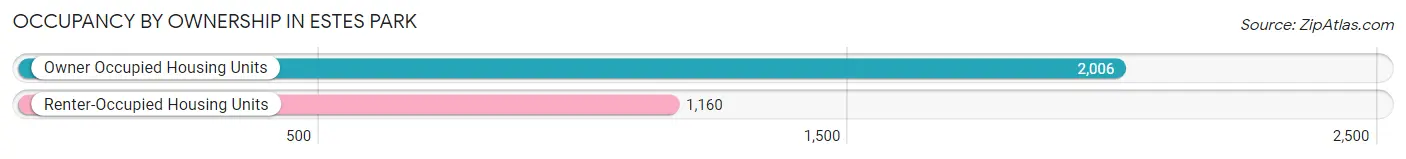
| Occupancy | # Housing Units | % Housing Units |
| Owner Occupied Housing Units | 2,006 | 63.4% |
| Renter-Occupied Housing Units | 1,160 | 36.6% |
| Total Occupied Housing Units | 3,166 | 100.0% |
Occupancy by Household Size in Estes Park
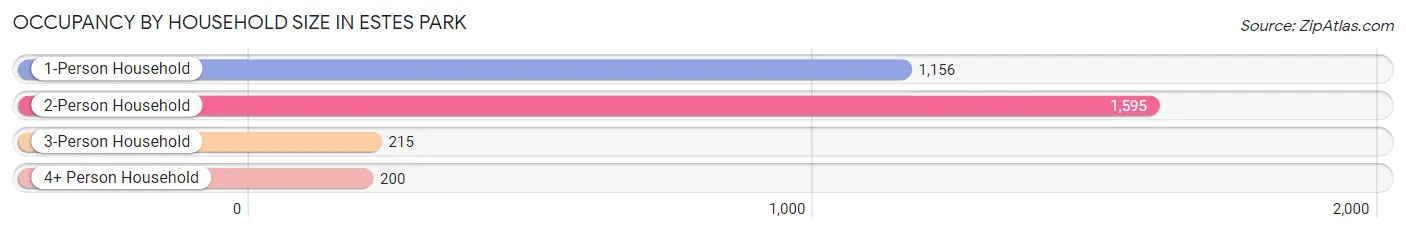
| Household Size | # Housing Units | % Housing Units |
| 1-Person Household | 1,156 | 36.5% |
| 2-Person Household | 1,595 | 50.4% |
| 3-Person Household | 215 | 6.8% |
| 4+ Person Household | 200 | 6.3% |
| Total Housing Units | 3,166 | 100.0% |
Occupancy by Ownership by Household Size in Estes Park
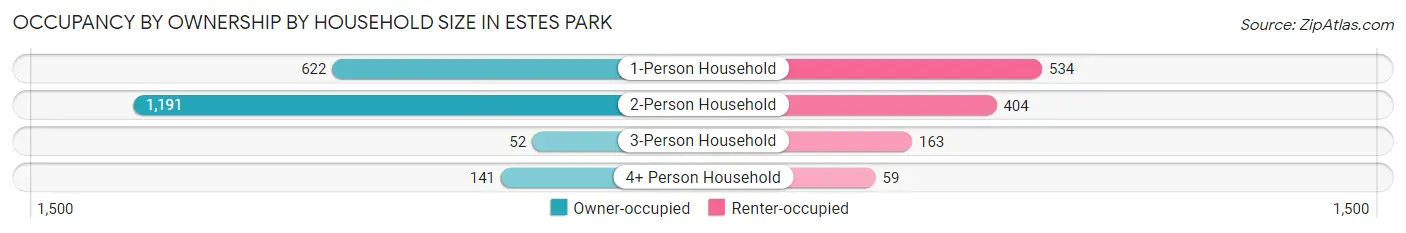
| Household Size | Owner-occupied | Renter-occupied |
| 1-Person Household | 622 (53.8%) | 534 (46.2%) |
| 2-Person Household | 1,191 (74.7%) | 404 (25.3%) |
| 3-Person Household | 52 (24.2%) | 163 (75.8%) |
| 4+ Person Household | 141 (70.5%) | 59 (29.5%) |
| Total Housing Units | 2,006 (63.4%) | 1,160 (36.6%) |
Occupancy by Educational Attainment in Estes Park
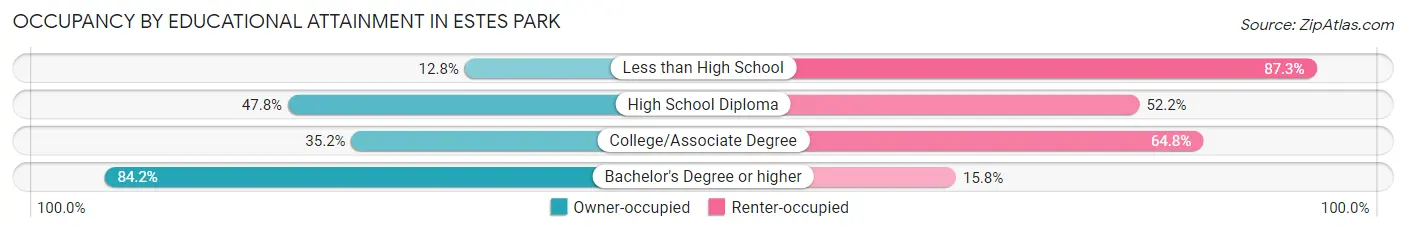
| Household Size | Owner-occupied | Renter-occupied |
| Less than High School | 13 (12.8%) | 89 (87.3%) |
| High School Diploma | 185 (47.8%) | 202 (52.2%) |
| College/Associate Degree | 320 (35.2%) | 589 (64.8%) |
| Bachelor's Degree or higher | 1,488 (84.2%) | 280 (15.8%) |
Occupancy by Age of Householder in Estes Park
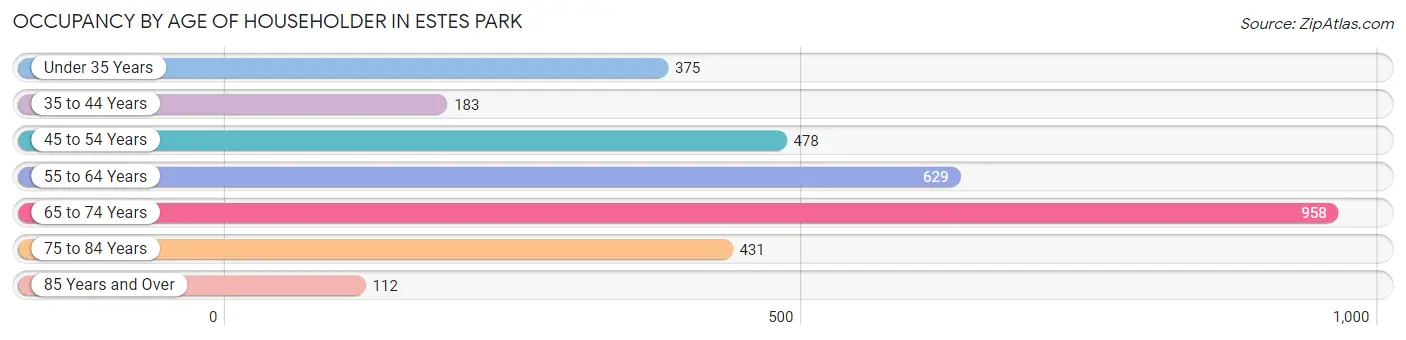
| Age Bracket | # Households | % Households |
| Under 35 Years | 375 | 11.8% |
| 35 to 44 Years | 183 | 5.8% |
| 45 to 54 Years | 478 | 15.1% |
| 55 to 64 Years | 629 | 19.9% |
| 65 to 74 Years | 958 | 30.3% |
| 75 to 84 Years | 431 | 13.6% |
| 85 Years and Over | 112 | 3.5% |
| Total | 3,166 | 100.0% |
Housing Finances in Estes Park
Median Income by Occupancy in Estes Park
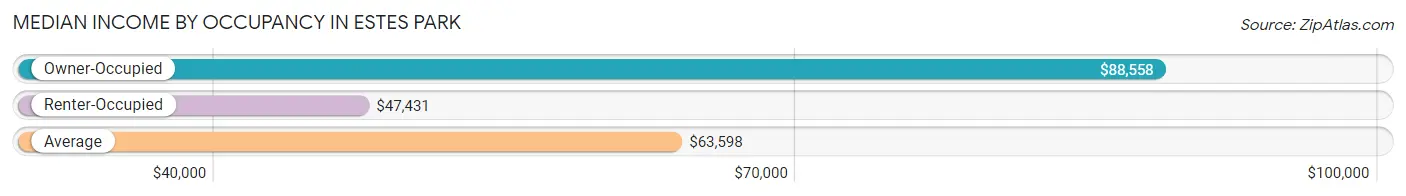
| Occupancy Type | # Households | Median Income |
| Owner-Occupied | 2,006 (63.4%) | $88,558 |
| Renter-Occupied | 1,160 (36.6%) | $47,431 |
| Average | 3,166 (100.0%) | $63,598 |
Occupancy by Householder Income Bracket in Estes Park
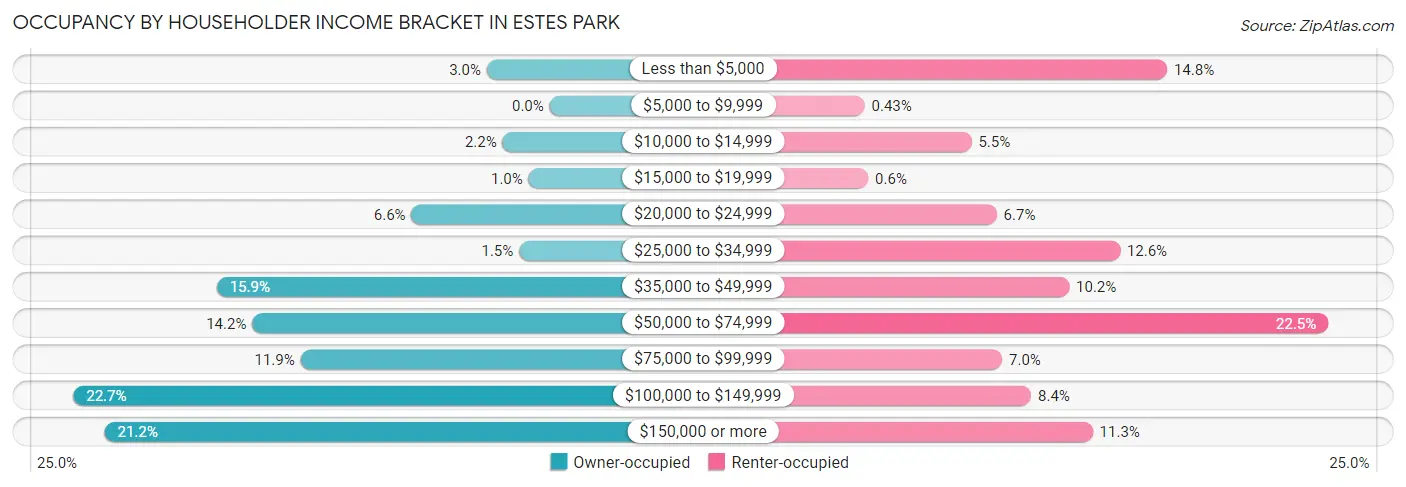
| Income Bracket | Owner-occupied | Renter-occupied |
| Less than $5,000 | 60 (3.0%) | 172 (14.8%) |
| $5,000 to $9,999 | 0 (0.0%) | 5 (0.4%) |
| $10,000 to $14,999 | 45 (2.2%) | 64 (5.5%) |
| $15,000 to $19,999 | 20 (1.0%) | 7 (0.6%) |
| $20,000 to $24,999 | 132 (6.6%) | 78 (6.7%) |
| $25,000 to $34,999 | 29 (1.5%) | 146 (12.6%) |
| $35,000 to $49,999 | 318 (15.9%) | 118 (10.2%) |
| $50,000 to $74,999 | 284 (14.2%) | 261 (22.5%) |
| $75,000 to $99,999 | 238 (11.9%) | 81 (7.0%) |
| $100,000 to $149,999 | 455 (22.7%) | 97 (8.4%) |
| $150,000 or more | 425 (21.2%) | 131 (11.3%) |
| Total | 2,006 (100.0%) | 1,160 (100.0%) |
Monthly Housing Cost Tiers in Estes Park
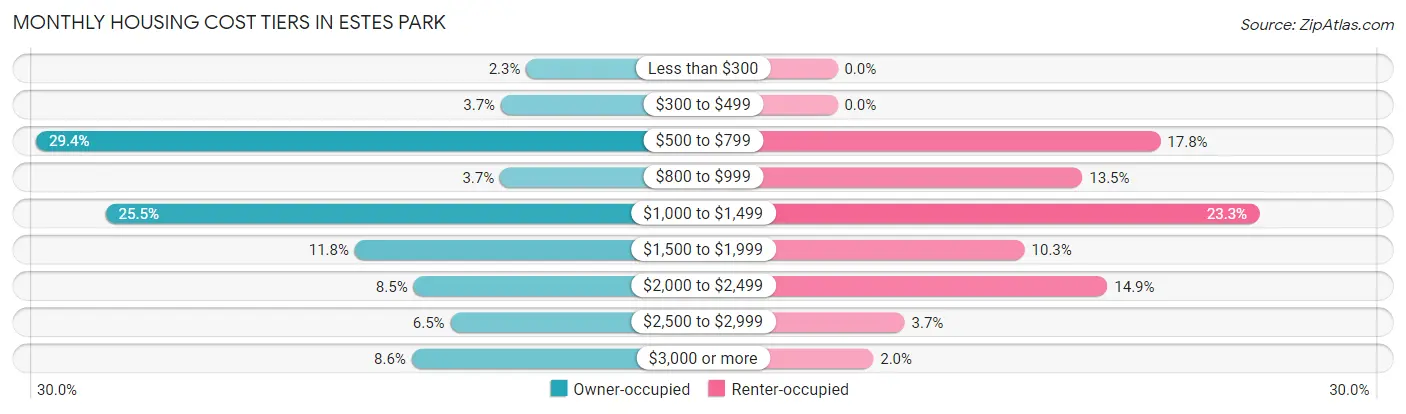
| Monthly Cost | Owner-occupied | Renter-occupied |
| Less than $300 | 46 (2.3%) | 0 (0.0%) |
| $300 to $499 | 74 (3.7%) | 0 (0.0%) |
| $500 to $799 | 589 (29.4%) | 207 (17.8%) |
| $800 to $999 | 75 (3.7%) | 157 (13.5%) |
| $1,000 to $1,499 | 512 (25.5%) | 270 (23.3%) |
| $1,500 to $1,999 | 236 (11.8%) | 120 (10.3%) |
| $2,000 to $2,499 | 171 (8.5%) | 173 (14.9%) |
| $2,500 to $2,999 | 130 (6.5%) | 43 (3.7%) |
| $3,000 or more | 173 (8.6%) | 23 (2.0%) |
| Total | 2,006 (100.0%) | 1,160 (100.0%) |
Physical Housing Characteristics in Estes Park
Housing Structures in Estes Park
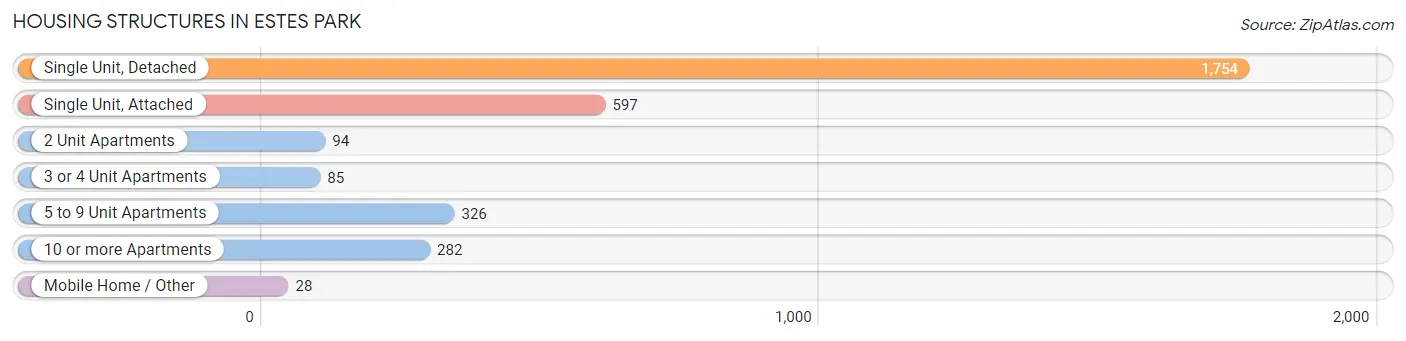
| Structure Type | # Housing Units | % Housing Units |
| Single Unit, Detached | 1,754 | 55.4% |
| Single Unit, Attached | 597 | 18.9% |
| 2 Unit Apartments | 94 | 3.0% |
| 3 or 4 Unit Apartments | 85 | 2.7% |
| 5 to 9 Unit Apartments | 326 | 10.3% |
| 10 or more Apartments | 282 | 8.9% |
| Mobile Home / Other | 28 | 0.9% |
| Total | 3,166 | 100.0% |
Housing Structures by Occupancy in Estes Park
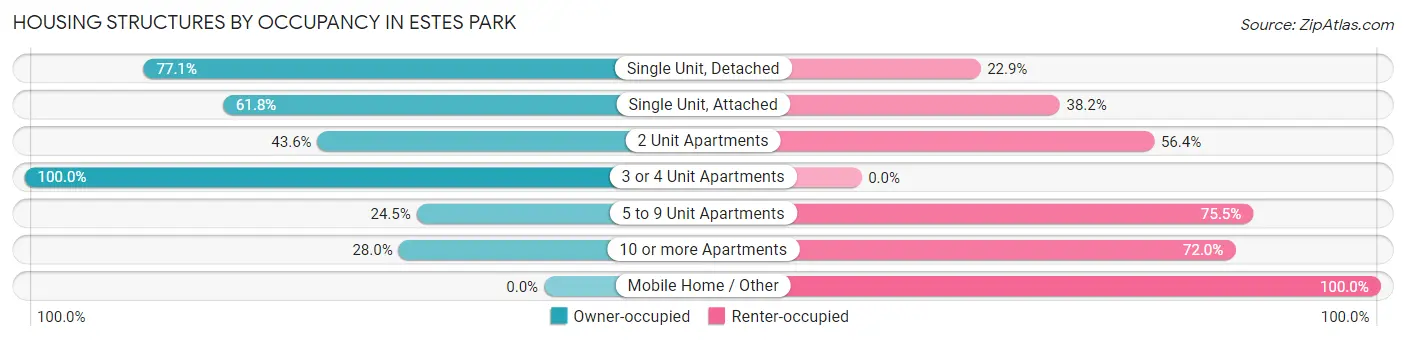
| Structure Type | Owner-occupied | Renter-occupied |
| Single Unit, Detached | 1,352 (77.1%) | 402 (22.9%) |
| Single Unit, Attached | 369 (61.8%) | 228 (38.2%) |
| 2 Unit Apartments | 41 (43.6%) | 53 (56.4%) |
| 3 or 4 Unit Apartments | 85 (100.0%) | 0 (0.0%) |
| 5 to 9 Unit Apartments | 80 (24.5%) | 246 (75.5%) |
| 10 or more Apartments | 79 (28.0%) | 203 (72.0%) |
| Mobile Home / Other | 0 (0.0%) | 28 (100.0%) |
| Total | 2,006 (63.4%) | 1,160 (36.6%) |
Housing Structures by Number of Rooms in Estes Park
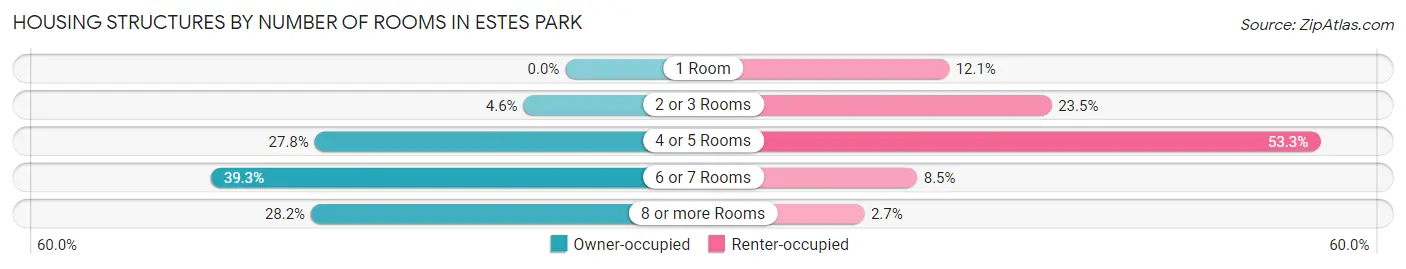
| Number of Rooms | Owner-occupied | Renter-occupied |
| 1 Room | 0 (0.0%) | 140 (12.1%) |
| 2 or 3 Rooms | 93 (4.6%) | 272 (23.4%) |
| 4 or 5 Rooms | 558 (27.8%) | 618 (53.3%) |
| 6 or 7 Rooms | 789 (39.3%) | 99 (8.5%) |
| 8 or more Rooms | 566 (28.2%) | 31 (2.7%) |
| Total | 2,006 (100.0%) | 1,160 (100.0%) |
Housing Structure by Heating Type in Estes Park
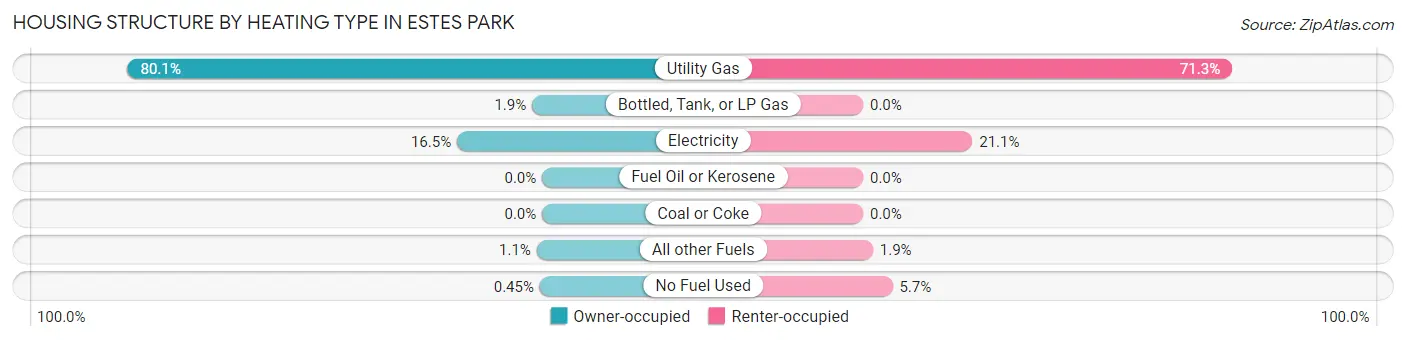
| Heating Type | Owner-occupied | Renter-occupied |
| Utility Gas | 1,607 (80.1%) | 827 (71.3%) |
| Bottled, Tank, or LP Gas | 39 (1.9%) | 0 (0.0%) |
| Electricity | 330 (16.5%) | 245 (21.1%) |
| Fuel Oil or Kerosene | 0 (0.0%) | 0 (0.0%) |
| Coal or Coke | 0 (0.0%) | 0 (0.0%) |
| All other Fuels | 21 (1.1%) | 22 (1.9%) |
| No Fuel Used | 9 (0.4%) | 66 (5.7%) |
| Total | 2,006 (100.0%) | 1,160 (100.0%) |
Household Vehicle Usage in Estes Park
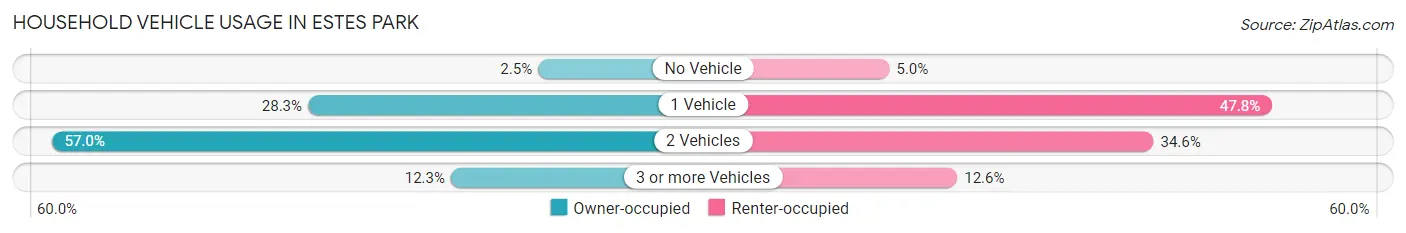
| Vehicles per Household | Owner-occupied | Renter-occupied |
| No Vehicle | 50 (2.5%) | 58 (5.0%) |
| 1 Vehicle | 567 (28.3%) | 555 (47.8%) |
| 2 Vehicles | 1,143 (57.0%) | 401 (34.6%) |
| 3 or more Vehicles | 246 (12.3%) | 146 (12.6%) |
| Total | 2,006 (100.0%) | 1,160 (100.0%) |
Real Estate & Mortgages in Estes Park
Real Estate and Mortgage Overview in Estes Park
| Characteristic | Without Mortgage | With Mortgage |
| Housing Units | 755 | 1,251 |
| Median Property Value | $636,300 | $546,700 |
| Median Household Income | $80,417 | $242 |
| Monthly Housing Costs | $634 | $173 |
| Real Estate Taxes | $2,670 | $18 |
Property Value by Mortgage Status in Estes Park
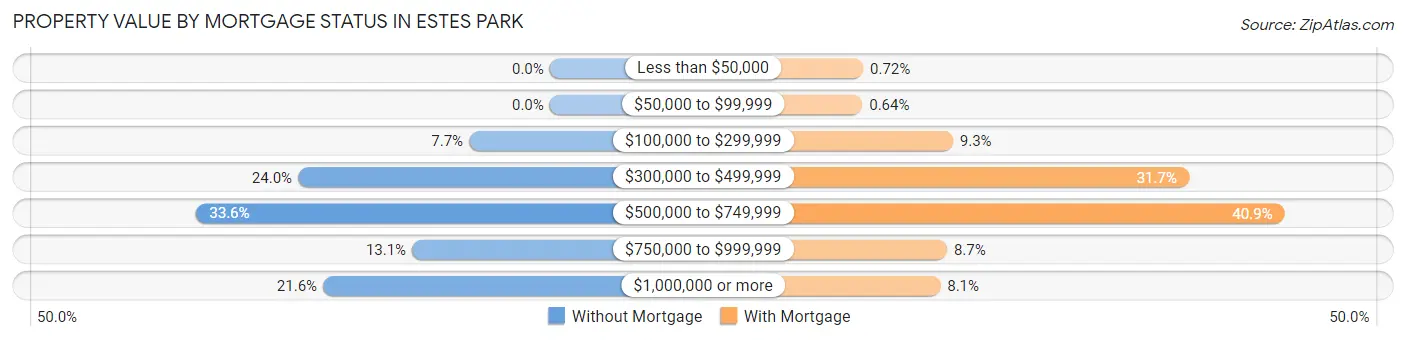
| Property Value | Without Mortgage | With Mortgage |
| Less than $50,000 | 0 (0.0%) | 9 (0.7%) |
| $50,000 to $99,999 | 0 (0.0%) | 8 (0.6%) |
| $100,000 to $299,999 | 58 (7.7%) | 116 (9.3%) |
| $300,000 to $499,999 | 181 (24.0%) | 397 (31.7%) |
| $500,000 to $749,999 | 254 (33.6%) | 511 (40.8%) |
| $750,000 to $999,999 | 99 (13.1%) | 109 (8.7%) |
| $1,000,000 or more | 163 (21.6%) | 101 (8.1%) |
| Total | 755 (100.0%) | 1,251 (100.0%) |
Household Income by Mortgage Status in Estes Park
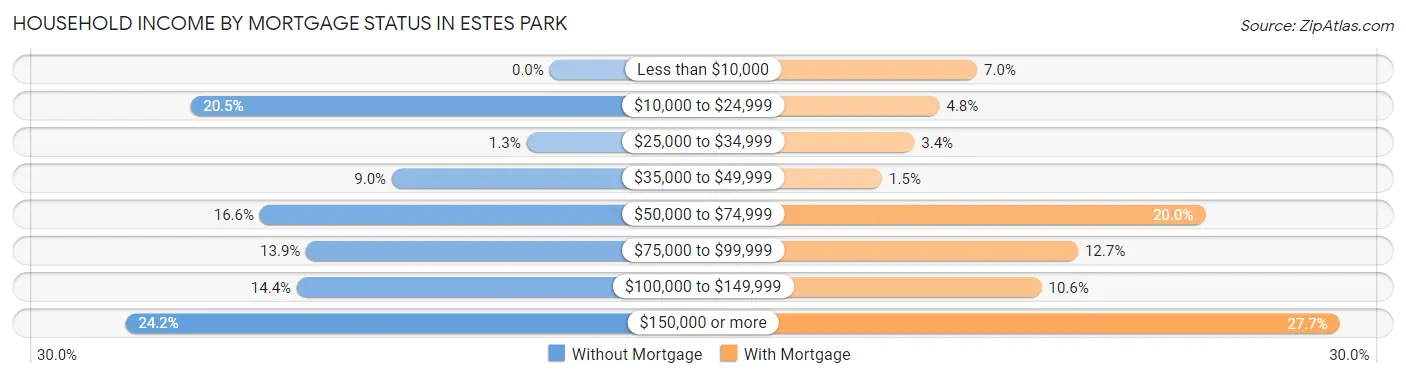
| Household Income | Without Mortgage | With Mortgage |
| Less than $10,000 | 0 (0.0%) | 87 (7.0%) |
| $10,000 to $24,999 | 155 (20.5%) | 60 (4.8%) |
| $25,000 to $34,999 | 10 (1.3%) | 42 (3.4%) |
| $35,000 to $49,999 | 68 (9.0%) | 19 (1.5%) |
| $50,000 to $74,999 | 125 (16.6%) | 250 (20.0%) |
| $75,000 to $99,999 | 105 (13.9%) | 159 (12.7%) |
| $100,000 to $149,999 | 109 (14.4%) | 133 (10.6%) |
| $150,000 or more | 183 (24.2%) | 346 (27.7%) |
| Total | 755 (100.0%) | 1,251 (100.0%) |
Property Value to Household Income Ratio in Estes Park
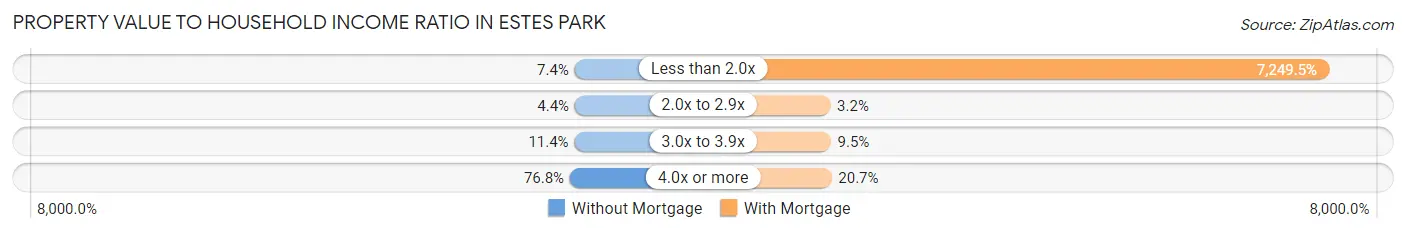
| Value-to-Income Ratio | Without Mortgage | With Mortgage |
| Less than 2.0x | 56 (7.4%) | 90,691 (7,249.5%) |
| 2.0x to 2.9x | 33 (4.4%) | 40 (3.2%) |
| 3.0x to 3.9x | 86 (11.4%) | 119 (9.5%) |
| 4.0x or more | 580 (76.8%) | 259 (20.7%) |
| Total | 755 (100.0%) | 1,251 (100.0%) |
Real Estate Taxes by Mortgage Status in Estes Park
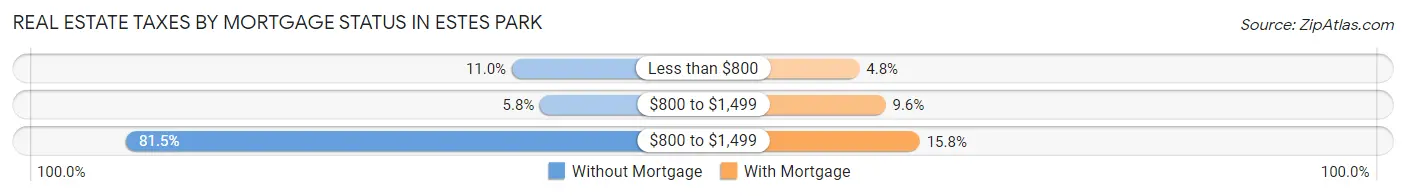
| Property Taxes | Without Mortgage | With Mortgage |
| Less than $800 | 83 (11.0%) | 60 (4.8%) |
| $800 to $1,499 | 44 (5.8%) | 120 (9.6%) |
| $800 to $1,499 | 615 (81.5%) | 198 (15.8%) |
| Total | 755 (100.0%) | 1,251 (100.0%) |
Health & Disability in Estes Park
Health Insurance Coverage by Age in Estes Park
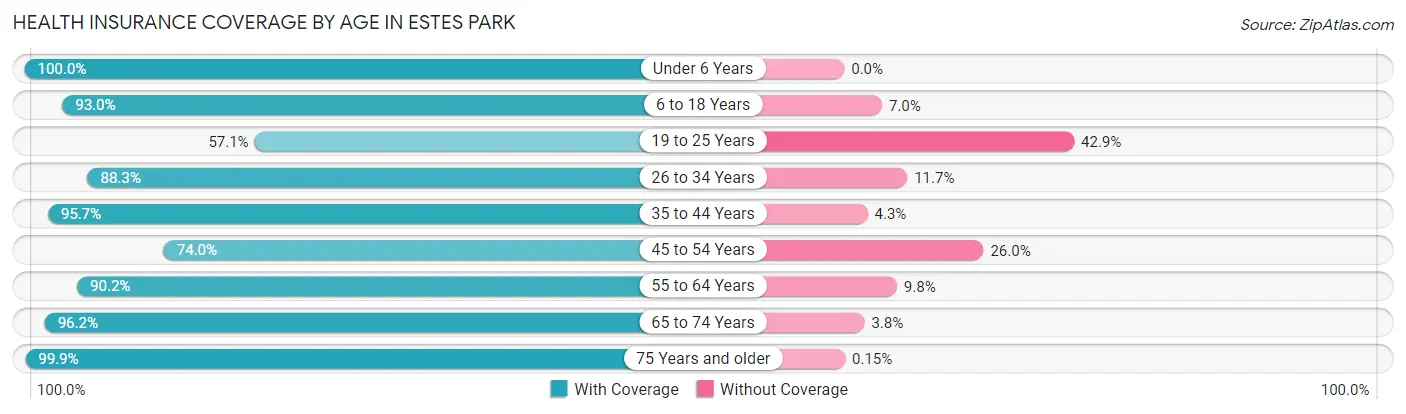
| Age Bracket | With Coverage | Without Coverage |
| Under 6 Years | 139 (100.0%) | 0 (0.0%) |
| 6 to 18 Years | 317 (93.0%) | 24 (7.0%) |
| 19 to 25 Years | 164 (57.1%) | 123 (42.9%) |
| 26 to 34 Years | 511 (88.3%) | 68 (11.7%) |
| 35 to 44 Years | 331 (95.7%) | 15 (4.3%) |
| 45 to 54 Years | 596 (74.0%) | 209 (26.0%) |
| 55 to 64 Years | 938 (90.2%) | 102 (9.8%) |
| 65 to 74 Years | 1,612 (96.2%) | 63 (3.8%) |
| 75 Years and older | 657 (99.9%) | 1 (0.2%) |
| Total | 5,265 (89.7%) | 605 (10.3%) |
Health Insurance Coverage by Citizenship Status in Estes Park
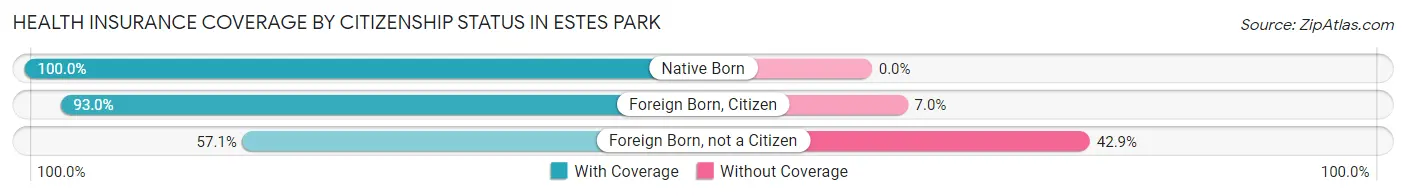
| Citizenship Status | With Coverage | Without Coverage |
| Native Born | 139 (100.0%) | 0 (0.0%) |
| Foreign Born, Citizen | 317 (93.0%) | 24 (7.0%) |
| Foreign Born, not a Citizen | 164 (57.1%) | 123 (42.9%) |
Health Insurance Coverage by Household Income in Estes Park
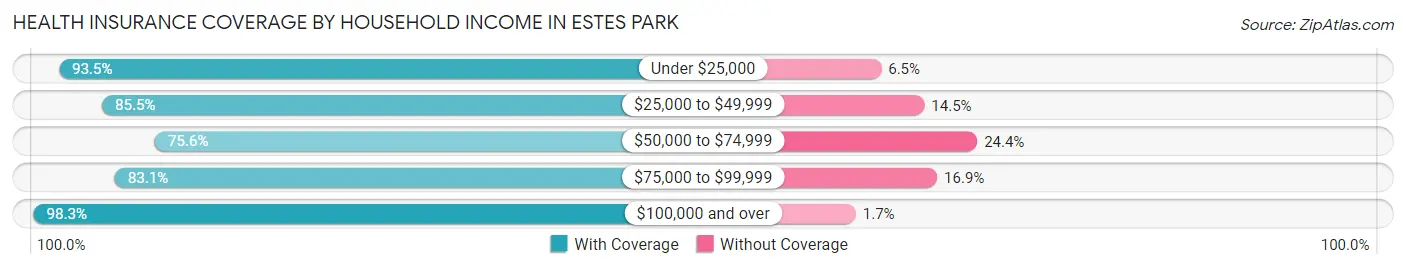
| Household Income | With Coverage | Without Coverage |
| Under $25,000 | 724 (93.5%) | 50 (6.5%) |
| $25,000 to $49,999 | 782 (85.5%) | 133 (14.5%) |
| $50,000 to $74,999 | 823 (75.6%) | 266 (24.4%) |
| $75,000 to $99,999 | 569 (83.1%) | 116 (16.9%) |
| $100,000 and over | 2,318 (98.3%) | 40 (1.7%) |
Public vs Private Health Insurance Coverage by Age in Estes Park
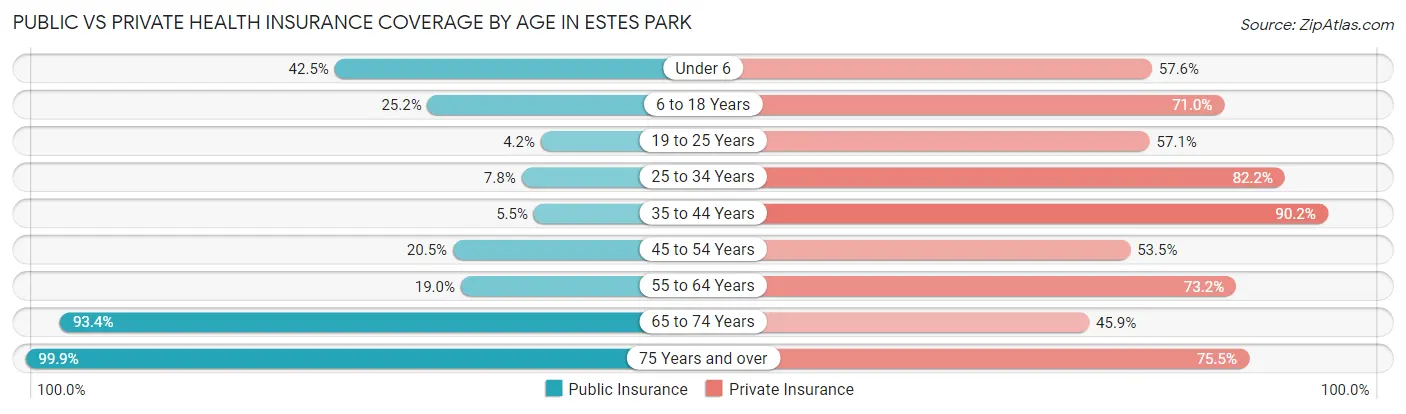
| Age Bracket | Public Insurance | Private Insurance |
| Under 6 | 59 (42.4%) | 80 (57.6%) |
| 6 to 18 Years | 86 (25.2%) | 242 (71.0%) |
| 19 to 25 Years | 12 (4.2%) | 164 (57.1%) |
| 25 to 34 Years | 45 (7.8%) | 476 (82.2%) |
| 35 to 44 Years | 19 (5.5%) | 312 (90.2%) |
| 45 to 54 Years | 165 (20.5%) | 431 (53.5%) |
| 55 to 64 Years | 198 (19.0%) | 761 (73.2%) |
| 65 to 74 Years | 1,565 (93.4%) | 769 (45.9%) |
| 75 Years and over | 657 (99.9%) | 497 (75.5%) |
| Total | 2,806 (47.8%) | 3,732 (63.6%) |
Disability Status by Sex by Age in Estes Park
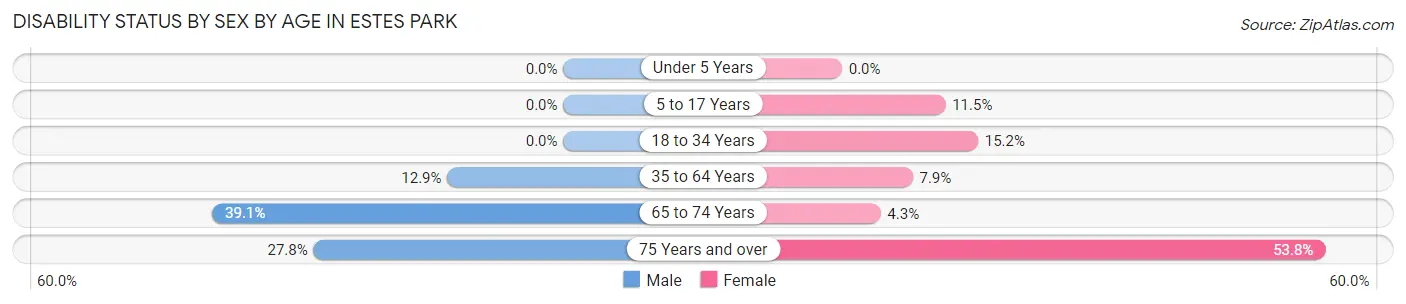
| Age Bracket | Male | Female |
| Under 5 Years | 0 (0.0%) | 0 (0.0%) |
| 5 to 17 Years | 0 (0.0%) | 22 (11.5%) |
| 18 to 34 Years | 0 (0.0%) | 50 (15.1%) |
| 35 to 64 Years | 111 (12.9%) | 105 (7.9%) |
| 65 to 74 Years | 300 (39.1%) | 39 (4.3%) |
| 75 Years and over | 74 (27.8%) | 211 (53.8%) |
Disability Class by Sex by Age in Estes Park
Disability Class: Hearing Difficulty
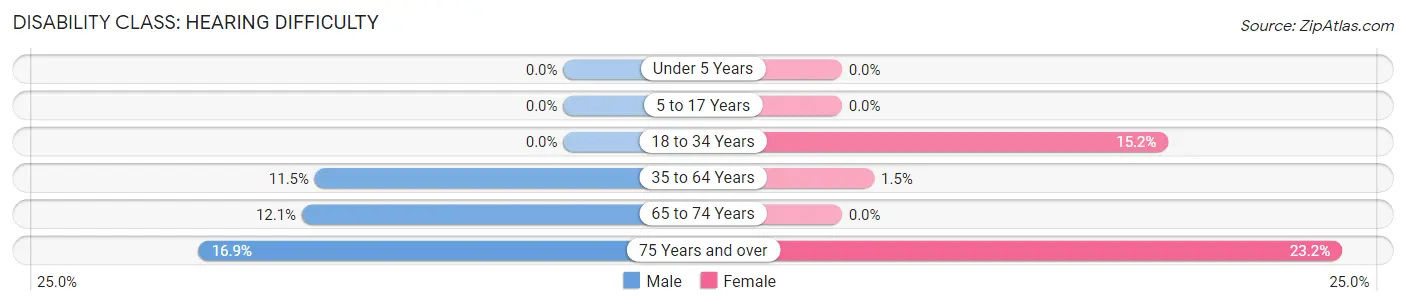
| Age Bracket | Male | Female |
| Under 5 Years | 0 (0.0%) | 0 (0.0%) |
| 5 to 17 Years | 0 (0.0%) | 0 (0.0%) |
| 18 to 34 Years | 0 (0.0%) | 50 (15.1%) |
| 35 to 64 Years | 99 (11.5%) | 20 (1.5%) |
| 65 to 74 Years | 93 (12.1%) | 0 (0.0%) |
| 75 Years and over | 45 (16.9%) | 91 (23.2%) |
Disability Class: Vision Difficulty
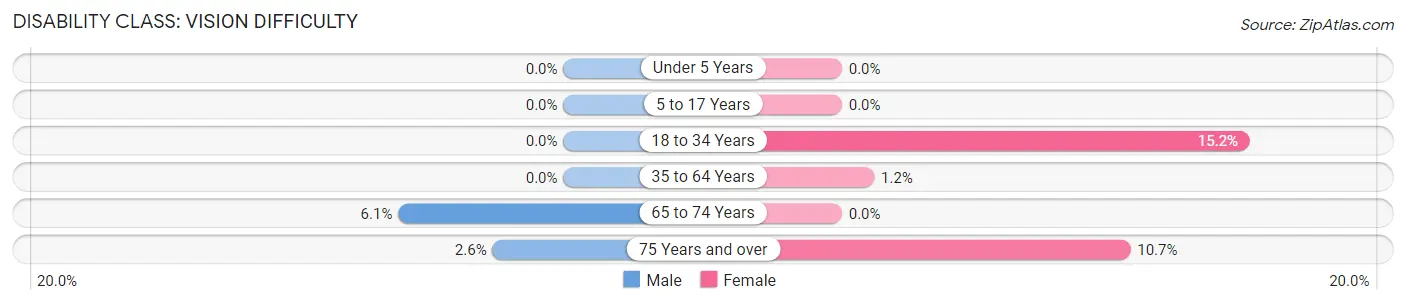
| Age Bracket | Male | Female |
| Under 5 Years | 0 (0.0%) | 0 (0.0%) |
| 5 to 17 Years | 0 (0.0%) | 0 (0.0%) |
| 18 to 34 Years | 0 (0.0%) | 50 (15.1%) |
| 35 to 64 Years | 0 (0.0%) | 16 (1.2%) |
| 65 to 74 Years | 47 (6.1%) | 0 (0.0%) |
| 75 Years and over | 7 (2.6%) | 42 (10.7%) |
Disability Class: Cognitive Difficulty
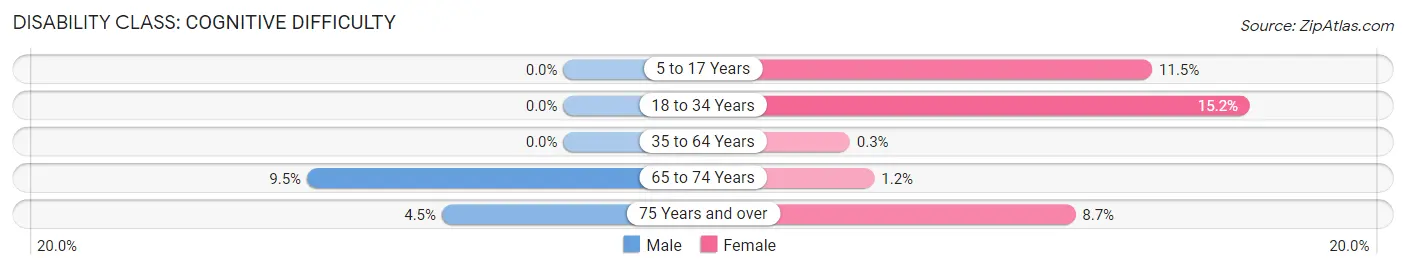
| Age Bracket | Male | Female |
| 5 to 17 Years | 0 (0.0%) | 22 (11.5%) |
| 18 to 34 Years | 0 (0.0%) | 50 (15.1%) |
| 35 to 64 Years | 0 (0.0%) | 4 (0.3%) |
| 65 to 74 Years | 73 (9.5%) | 11 (1.2%) |
| 75 Years and over | 12 (4.5%) | 34 (8.7%) |
Disability Class: Ambulatory Difficulty
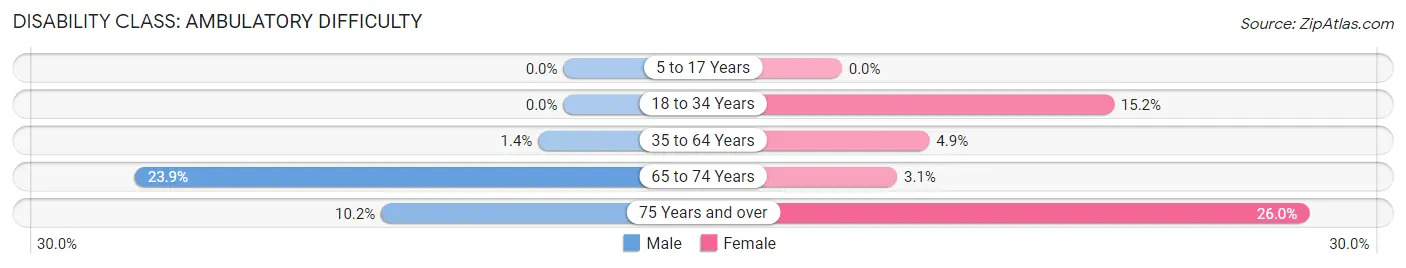
| Age Bracket | Male | Female |
| 5 to 17 Years | 0 (0.0%) | 0 (0.0%) |
| 18 to 34 Years | 0 (0.0%) | 50 (15.1%) |
| 35 to 64 Years | 12 (1.4%) | 65 (4.9%) |
| 65 to 74 Years | 183 (23.9%) | 28 (3.1%) |
| 75 Years and over | 27 (10.2%) | 102 (26.0%) |
Disability Class: Self-Care Difficulty
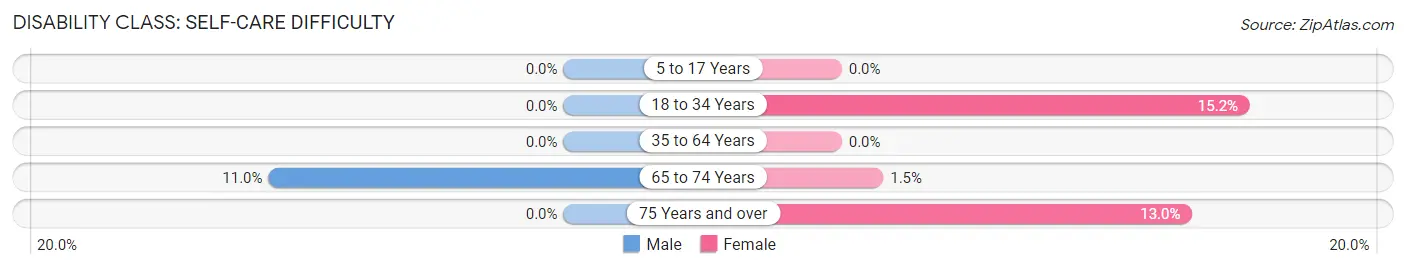
| Age Bracket | Male | Female |
| 5 to 17 Years | 0 (0.0%) | 0 (0.0%) |
| 18 to 34 Years | 0 (0.0%) | 50 (15.1%) |
| 35 to 64 Years | 0 (0.0%) | 0 (0.0%) |
| 65 to 74 Years | 84 (11.0%) | 14 (1.5%) |
| 75 Years and over | 0 (0.0%) | 51 (13.0%) |
Technology Access in Estes Park
Computing Device Access in Estes Park
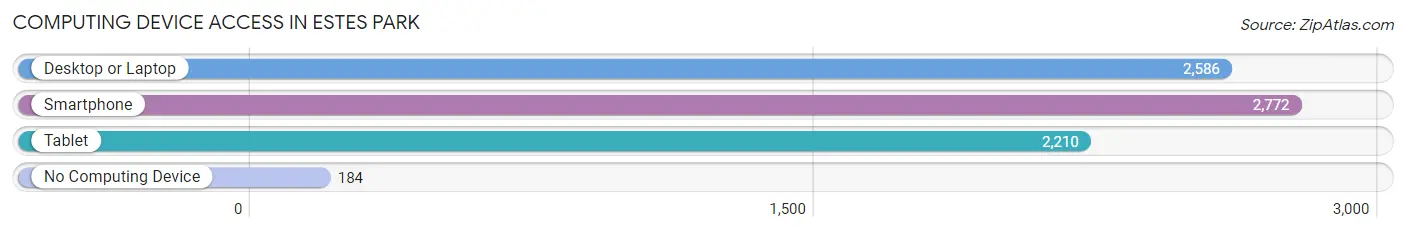
| Device Type | # Households | % Households |
| Desktop or Laptop | 2,586 | 81.7% |
| Smartphone | 2,772 | 87.6% |
| Tablet | 2,210 | 69.8% |
| No Computing Device | 184 | 5.8% |
| Total | 3,166 | 100.0% |
Internet Access in Estes Park
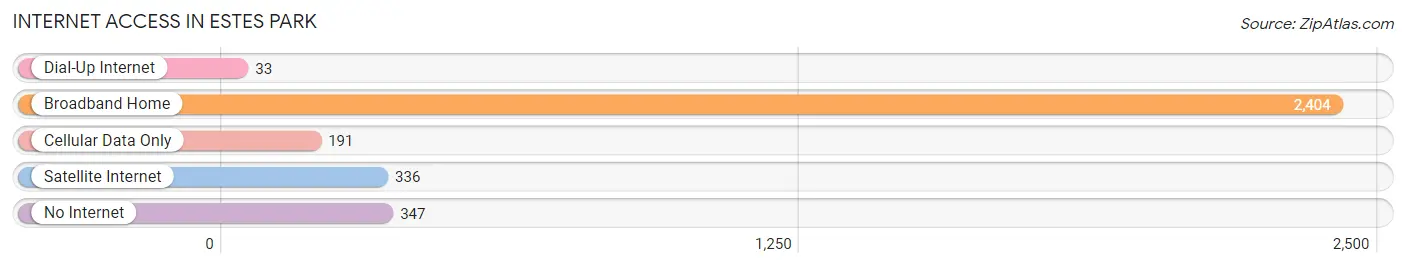
| Internet Type | # Households | % Households |
| Dial-Up Internet | 33 | 1.0% |
| Broadband Home | 2,404 | 75.9% |
| Cellular Data Only | 191 | 6.0% |
| Satellite Internet | 336 | 10.6% |
| No Internet | 347 | 11.0% |
| Total | 3,166 | 100.0% |
Estes Park Summary
Estes Park, Colorado is a small mountain town located in the Rocky Mountains of northern Colorado. It is situated at an elevation of 7,522 feet and is surrounded by the Rocky Mountain National Park. Estes Park is the gateway to the park and is a popular tourist destination for its stunning views, outdoor activities, and unique culture.
History
Estes Park was first settled in 1859 by Joel Estes, a mountain man who was drawn to the area by its beauty and potential for hunting and trapping. Estes built a cabin and began to farm the land, and soon other settlers began to arrive. The town was officially founded in 1864 and was named after Joel Estes.
In 1875, the town was incorporated and the first post office was established. The town grew slowly but steadily, and by the early 1900s, it had become a popular tourist destination. The first hotel was built in 1909, and the first road to the town was completed in 1913.
In 1915, the Rocky Mountain National Park was established, and Estes Park became the gateway to the park. The town experienced a boom in tourism, and by the 1920s, it had become a popular destination for outdoor enthusiasts.
Geography
Estes Park is located in the Rocky Mountains of northern Colorado, at an elevation of 7,522 feet. It is surrounded by the Rocky Mountain National Park, which covers an area of 415 square miles. The town is situated at the base of Longs Peak, the highest peak in the park.
The town is located on the Big Thompson River, which flows through the town and provides a source of recreation for visitors. The town is also surrounded by several lakes, including Lake Estes, Marys Lake, and Sprague Lake.
Economy
Estes Park’s economy is largely based on tourism. The town is a popular destination for outdoor enthusiasts, and it is home to several resorts, hotels, and restaurants. The town also has a thriving retail sector, with many shops and boutiques catering to tourists.
Estes Park is also home to several manufacturing companies, including a brewery, a distillery, and a woodworking shop. The town is also home to several technology companies, including a software development firm and a web design company.
Demographics
As of the 2010 census, Estes Park had a population of 5,858. The town has a median age of 44.7 years, and the median household income is $50,945. The town is predominantly white (93.3%), with small percentages of Hispanic (2.7%), African American (1.2%), and Asian (1.1%) residents.
Estes Park is a popular tourist destination, and the town’s population increases significantly during the summer months. The town is also home to a large number of retirees, who are drawn to the area for its stunning views and outdoor activities.
Common Questions
What is Per Capita Income in Estes Park?
Per Capita income in Estes Park is $55,282.
What is the Median Family Income in Estes Park?
Median Family Income in Estes Park is $92,100.
What is the Median Household income in Estes Park?
Median Household Income in Estes Park is $63,598.
What is Income or Wage Gap in Estes Park?
Income or Wage Gap in Estes Park is 33.5%.
Women in Estes Park earn 66.5 cents for every dollar earned by a man.
What is Inequality or Gini Index in Estes Park?
Inequality or Gini Index in Estes Park is 0.52.
What is the Total Population of Estes Park?
Total Population of Estes Park is 5,906.
What is the Total Male Population of Estes Park?
Total Male Population of Estes Park is 2,722.
What is the Total Female Population of Estes Park?
Total Female Population of Estes Park is 3,184.
What is the Ratio of Males per 100 Females in Estes Park?
There are 85.49 Males per 100 Females in Estes Park.
What is the Ratio of Females per 100 Males in Estes Park?
There are 116.97 Females per 100 Males in Estes Park.
What is the Median Population Age in Estes Park?
Median Population Age in Estes Park is 60.9 Years.
What is the Average Family Size in Estes Park
Average Family Size in Estes Park is 2.3 People.
What is the Average Household Size in Estes Park
Average Household Size in Estes Park is 1.8 People.
How Large is the Labor Force in Estes Park?
There are 2,770 People in the Labor Forcein in Estes Park.
What is the Percentage of People in the Labor Force in Estes Park?
50.6% of People are in the Labor Force in Estes Park.
What is the Unemployment Rate in Estes Park?
Unemployment Rate in Estes Park is 5.4%.