Poncha Springs, CO Map & Demographics
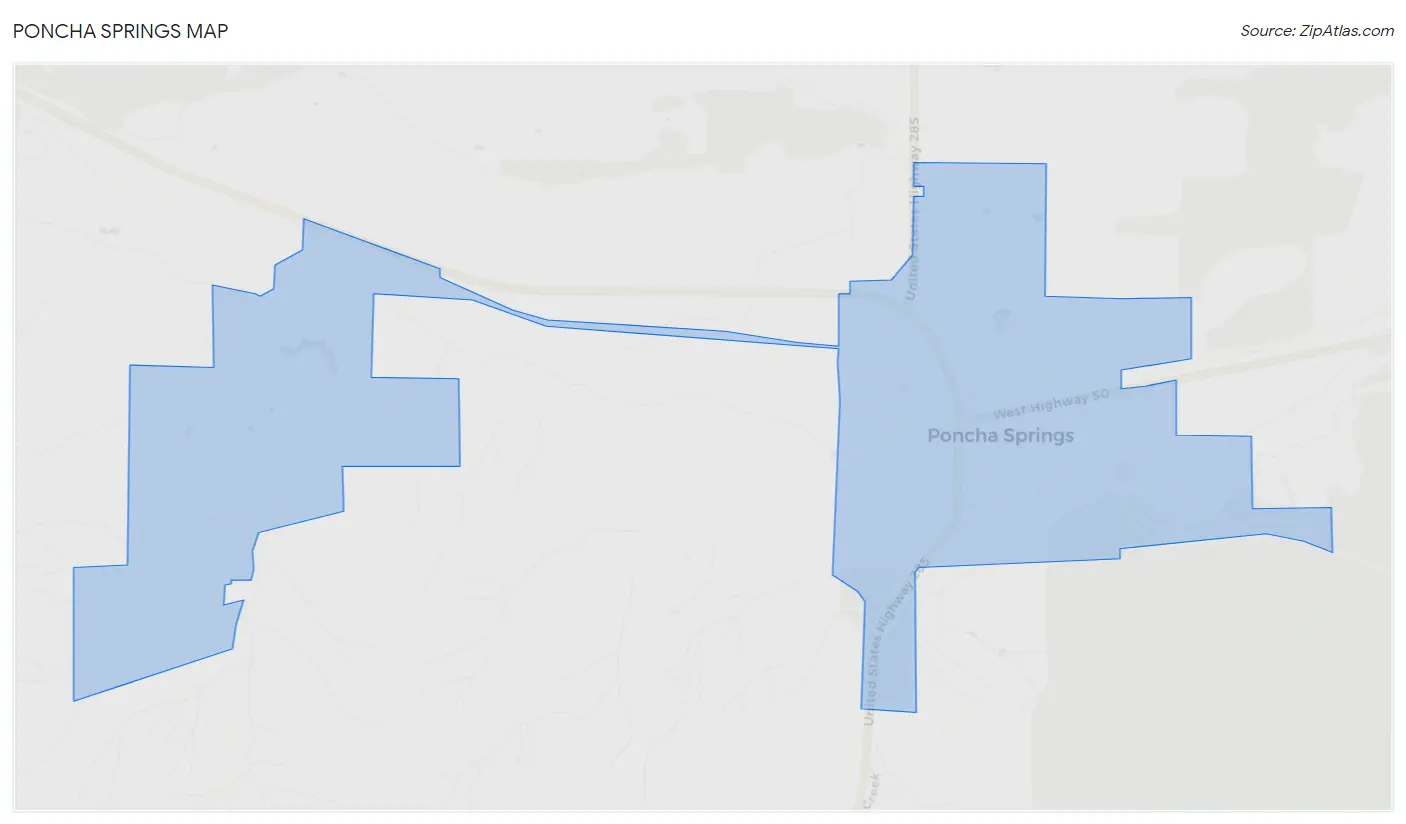
Poncha Springs Map
Poncha Springs Overview
$45,730
PER CAPITA INCOME
$97,813
AVG FAMILY INCOME
$69,015
AVG HOUSEHOLD INCOME
49.9%
WAGE / INCOME GAP [ % ]
50.1¢/ $1
WAGE / INCOME GAP [ $ ]
0.35
INEQUALITY / GINI INDEX
867
TOTAL POPULATION
430
MALE POPULATION
437
FEMALE POPULATION
98.40
MALES / 100 FEMALES
101.63
FEMALES / 100 MALES
51.3
MEDIAN AGE
2.4
AVG FAMILY SIZE
1.8
AVG HOUSEHOLD SIZE
574
LABOR FORCE [ PEOPLE ]
74.9%
PERCENT IN LABOR FORCE
Poncha Springs Zip Codes
Poncha Springs Area Codes
Income in Poncha Springs
Income Overview in Poncha Springs
Per Capita Income in Poncha Springs is $45,730, while median incomes of families and households are $97,813 and $69,015 respectively.
| Characteristic | Number | Measure |
| Per Capita Income | 867 | $45,730 |
| Median Family Income | 243 | $97,813 |
| Mean Family Income | 243 | $98,145 |
| Median Household Income | 478 | $69,015 |
| Mean Household Income | 478 | $80,836 |
| Income Deficit | 243 | $0 |
| Wage / Income Gap (%) | 867 | 49.94% |
| Wage / Income Gap ($) | 867 | 50.06¢ per $1 |
| Gini / Inequality Index | 867 | 0.35 |
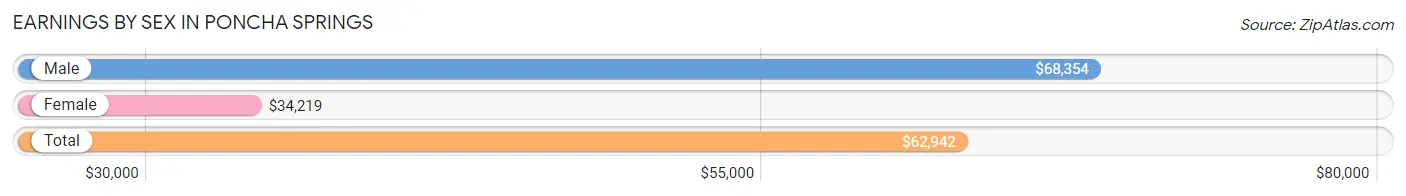
Earnings by Sex in Poncha Springs
Average Earnings in Poncha Springs are $62,942, $68,354 for men and $34,219 for women, a difference of 49.9%.
| Sex | Number | Average Earnings |
| Male | 278 (47.7%) | $68,354 |
| Female | 305 (52.3%) | $34,219 |
| Total | 583 (100.0%) | $62,942 |
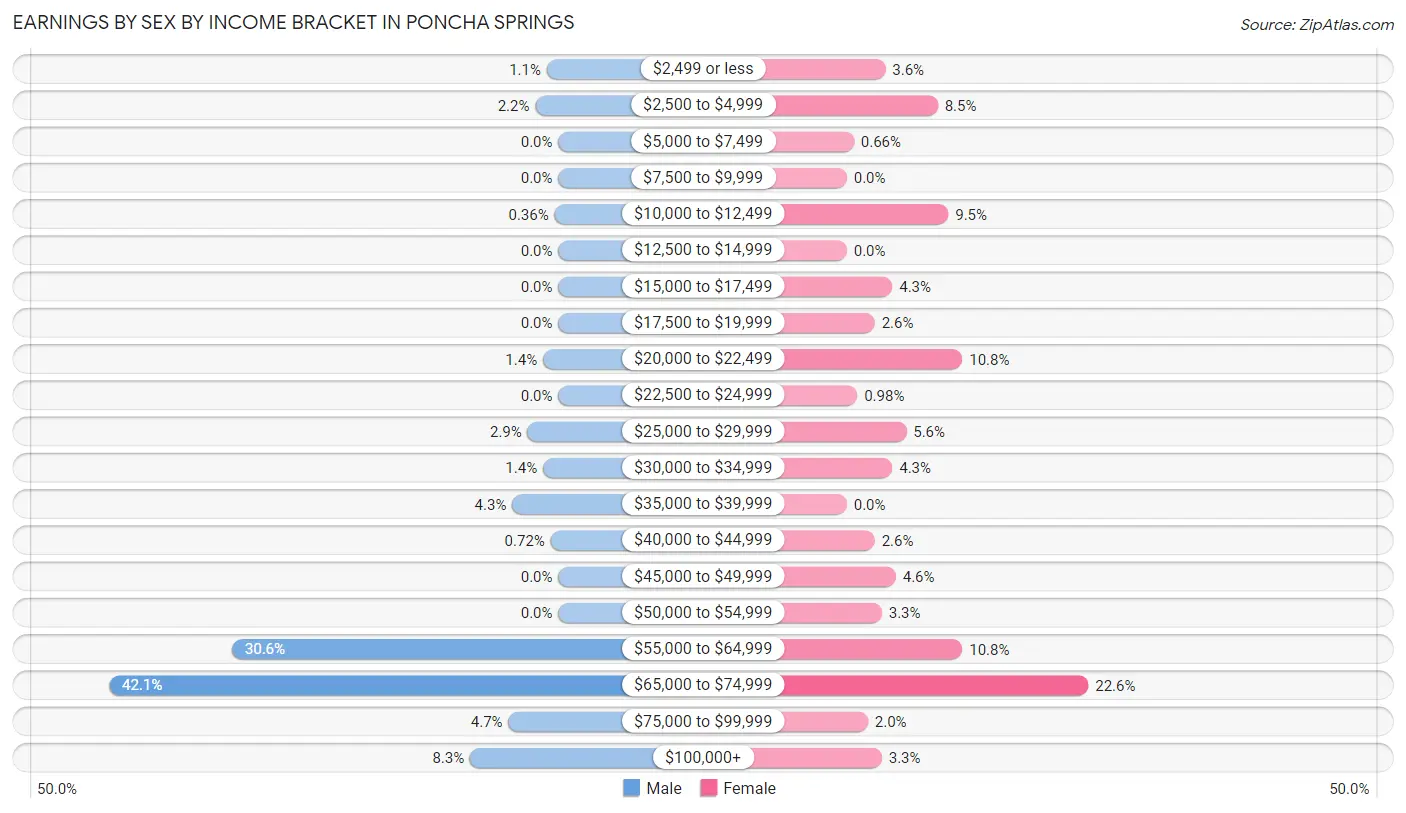
Earnings by Sex by Income Bracket in Poncha Springs
The most common earnings brackets in Poncha Springs are $65,000 to $74,999 for men (117 | 42.1%) and $65,000 to $74,999 for women (69 | 22.6%).
| Income | Male | Female |
| $2,499 or less | 3 (1.1%) | 11 (3.6%) |
| $2,500 to $4,999 | 6 (2.2%) | 26 (8.5%) |
| $5,000 to $7,499 | 0 (0.0%) | 2 (0.7%) |
| $7,500 to $9,999 | 0 (0.0%) | 0 (0.0%) |
| $10,000 to $12,499 | 1 (0.4%) | 29 (9.5%) |
| $12,500 to $14,999 | 0 (0.0%) | 0 (0.0%) |
| $15,000 to $17,499 | 0 (0.0%) | 13 (4.3%) |
| $17,500 to $19,999 | 0 (0.0%) | 8 (2.6%) |
| $20,000 to $22,499 | 4 (1.4%) | 33 (10.8%) |
| $22,500 to $24,999 | 0 (0.0%) | 3 (1.0%) |
| $25,000 to $29,999 | 8 (2.9%) | 17 (5.6%) |
| $30,000 to $34,999 | 4 (1.4%) | 13 (4.3%) |
| $35,000 to $39,999 | 12 (4.3%) | 0 (0.0%) |
| $40,000 to $44,999 | 2 (0.7%) | 8 (2.6%) |
| $45,000 to $49,999 | 0 (0.0%) | 14 (4.6%) |
| $50,000 to $54,999 | 0 (0.0%) | 10 (3.3%) |
| $55,000 to $64,999 | 85 (30.6%) | 33 (10.8%) |
| $65,000 to $74,999 | 117 (42.1%) | 69 (22.6%) |
| $75,000 to $99,999 | 13 (4.7%) | 6 (2.0%) |
| $100,000+ | 23 (8.3%) | 10 (3.3%) |
| Total | 278 (100.0%) | 305 (100.0%) |
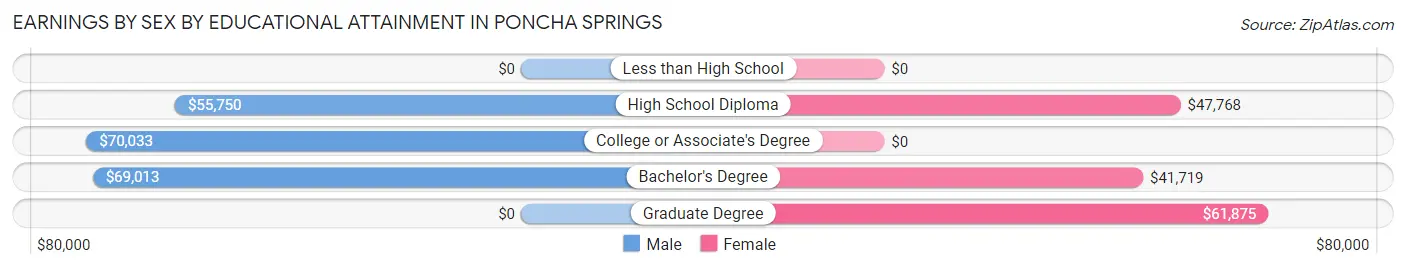
Earnings by Sex by Educational Attainment in Poncha Springs
Average earnings in Poncha Springs are $68,415 for men and $49,375 for women, a difference of 27.8%. Men with an educational attainment of college or associate's degree enjoy the highest average annual earnings of $70,033, while those with high school diploma education earn the least with $55,750. Women with an educational attainment of graduate degree earn the most with the average annual earnings of $61,875, while those with bachelor's degree education have the smallest earnings of $41,719.
| Educational Attainment | Male Income | Female Income |
| Less than High School | - | - |
| High School Diploma | $55,750 | $47,768 |
| College or Associate's Degree | $70,033 | $0 |
| Bachelor's Degree | $69,013 | $41,719 |
| Graduate Degree | - | - |
| Total | $68,415 | $49,375 |
Family Income in Poncha Springs
Family Income Brackets in Poncha Springs
According to the Poncha Springs family income data, there are 79 families falling into the $100,000 to $149,999 income range, which is the most common income bracket and makes up 32.5% of all families.
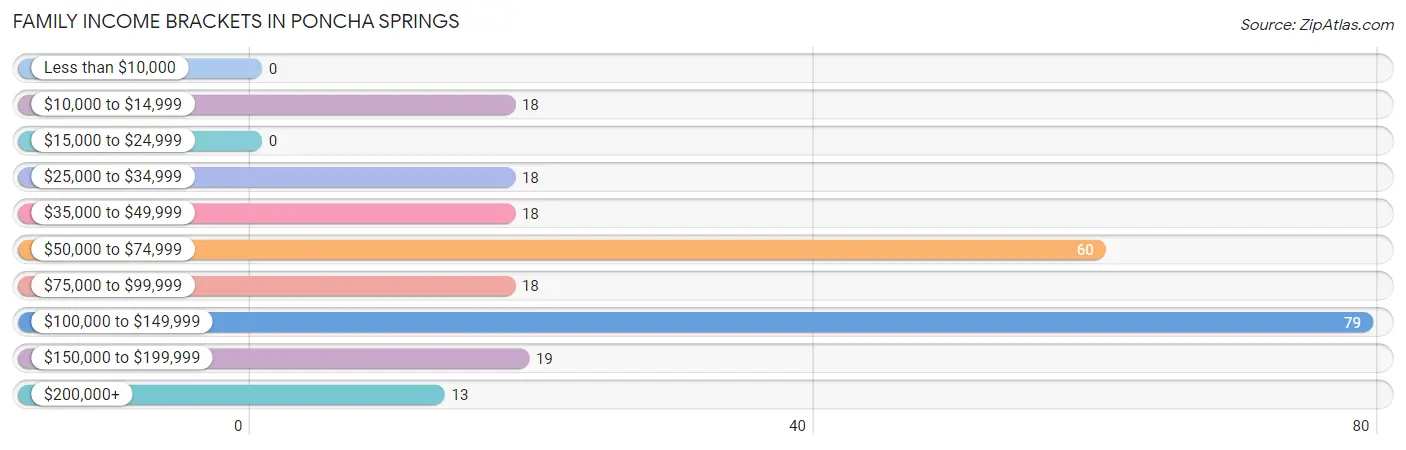
| Income Bracket | # Families | % Families |
| Less than $10,000 | 0 | 0.0% |
| $10,000 to $14,999 | 18 | 7.4% |
| $15,000 to $24,999 | 0 | 0.0% |
| $25,000 to $34,999 | 18 | 7.4% |
| $35,000 to $49,999 | 18 | 7.4% |
| $50,000 to $74,999 | 60 | 24.7% |
| $75,000 to $99,999 | 18 | 7.4% |
| $100,000 to $149,999 | 79 | 32.5% |
| $150,000 to $199,999 | 19 | 7.8% |
| $200,000+ | 13 | 5.3% |
Family Income by Famaliy Size in Poncha Springs
4-person families (27 | 11.1%) account for the highest median family income in Poncha Springs with $165,673 per family, while 4-person families (27 | 11.1%) have the highest median income of $41,418 per family member.
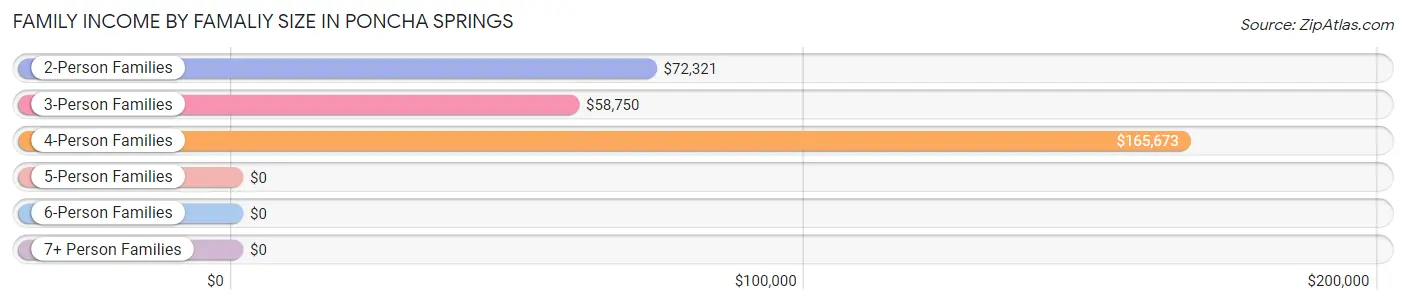
| Income Bracket | # Families | Median Income |
| 2-Person Families | 193 (79.4%) | $72,321 |
| 3-Person Families | 23 (9.5%) | $58,750 |
| 4-Person Families | 27 (11.1%) | $165,673 |
| 5-Person Families | 0 (0.0%) | $0 |
| 6-Person Families | 0 (0.0%) | $0 |
| 7+ Person Families | 0 (0.0%) | $0 |
| Total | 243 (100.0%) | $97,813 |
Family Income by Number of Earners in Poncha Springs
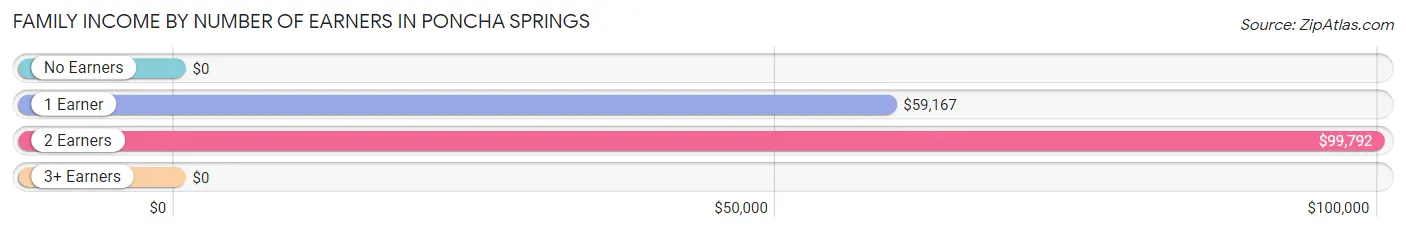
| Number of Earners | # Families | Median Income |
| No Earners | 36 (14.8%) | $0 |
| 1 Earner | 56 (23.1%) | $59,167 |
| 2 Earners | 128 (52.7%) | $99,792 |
| 3+ Earners | 23 (9.5%) | $0 |
| Total | 243 (100.0%) | $97,813 |
Household Income in Poncha Springs
Household Income Brackets in Poncha Springs
With 140 households falling in the category, the $50,000 to $74,999 income range is the most frequent in Poncha Springs, accounting for 29.3% of all households. In contrast, only 11 households (2.3%) fall into the less than $10,000 income bracket, making it the least populous group.
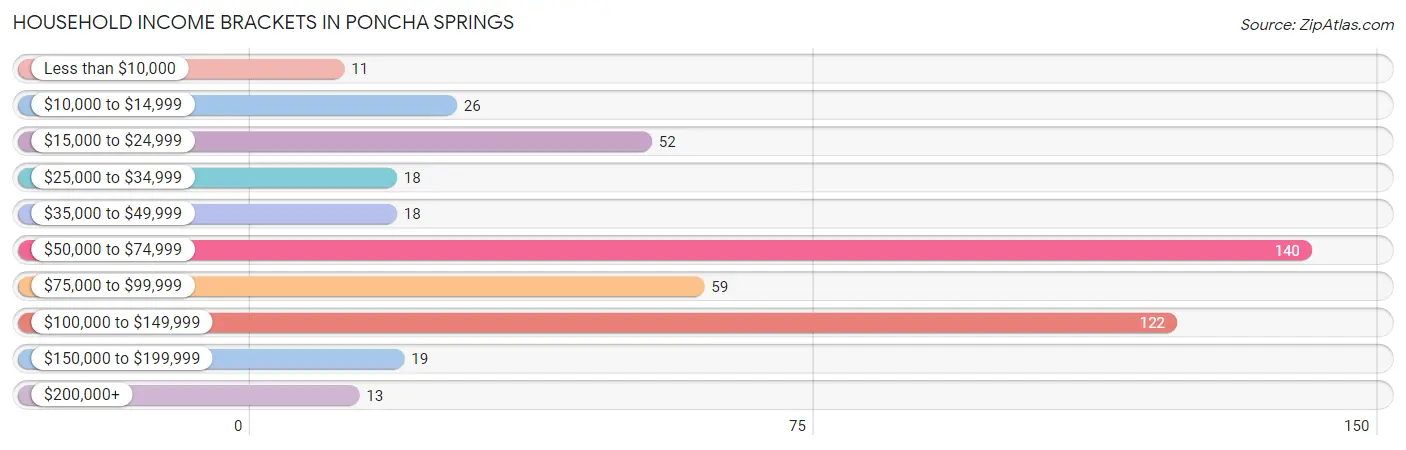
| Income Bracket | # Households | % Households |
| Less than $10,000 | 11 | 2.3% |
| $10,000 to $14,999 | 26 | 5.4% |
| $15,000 to $24,999 | 52 | 10.9% |
| $25,000 to $34,999 | 18 | 3.8% |
| $35,000 to $49,999 | 18 | 3.8% |
| $50,000 to $74,999 | 140 | 29.3% |
| $75,000 to $99,999 | 59 | 12.3% |
| $100,000 to $149,999 | 122 | 25.5% |
| $150,000 to $199,999 | 19 | 4.0% |
| $200,000+ | 13 | 2.7% |
Household Income by Householder Age in Poncha Springs
The median household income in Poncha Springs is $69,015, with the highest median household income of $69,129 found in the 45 to 64 years age bracket for the primary householder. A total of 203 households (42.5%) fall into this category. Meanwhile, the 15 to 24 years age bracket for the primary householder has the lowest median household income of $0, with 29 households (6.1%) in this group.
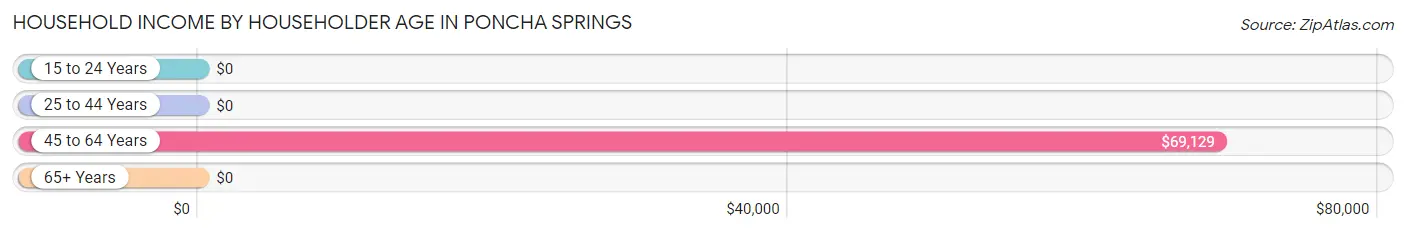
| Income Bracket | # Households | Median Income |
| 15 to 24 Years | 29 (6.1%) | $0 |
| 25 to 44 Years | 112 (23.4%) | $0 |
| 45 to 64 Years | 203 (42.5%) | $69,129 |
| 65+ Years | 134 (28.0%) | $0 |
| Total | 478 (100.0%) | $69,015 |
Poverty in Poncha Springs
Income Below Poverty by Sex and Age in Poncha Springs
With 6.5% poverty level for males and 15.8% for females among the residents of Poncha Springs, 65 to 74 year old males and 18 to 24 year old females are the most vulnerable to poverty, with 26 males (26.5%) and 42 females (100.0%) in their respective age groups living below the poverty level.
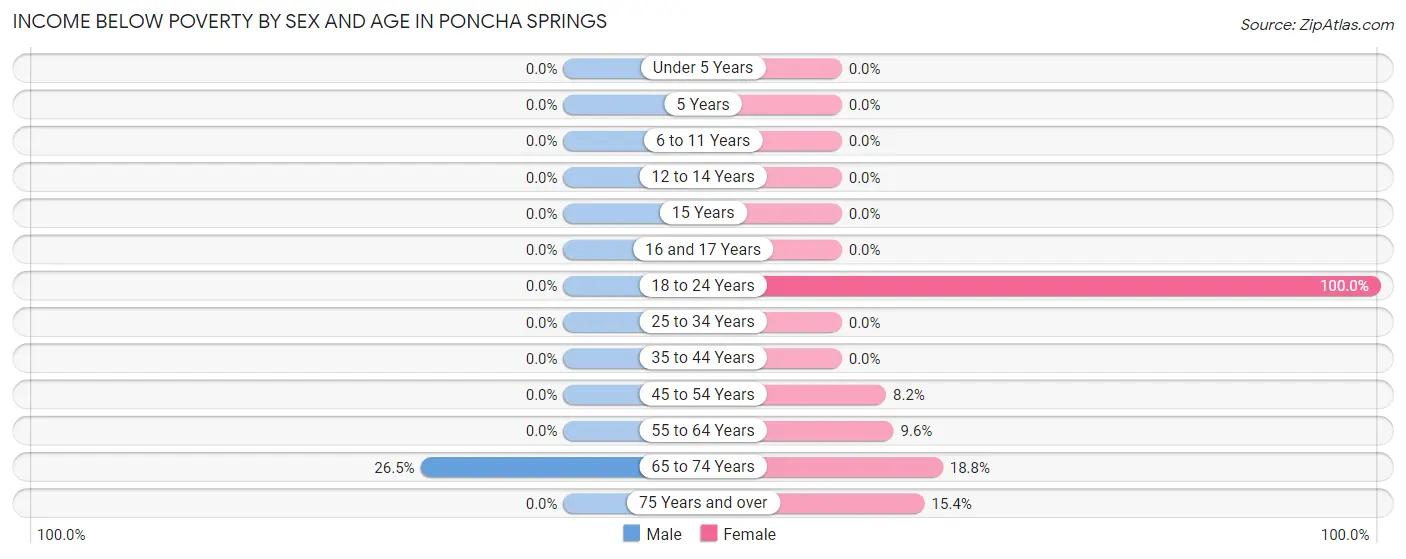
| Age Bracket | Male | Female |
| Under 5 Years | 0 (0.0%) | 0 (0.0%) |
| 5 Years | 0 (0.0%) | 0 (0.0%) |
| 6 to 11 Years | 0 (0.0%) | 0 (0.0%) |
| 12 to 14 Years | 0 (0.0%) | 0 (0.0%) |
| 15 Years | 0 (0.0%) | 0 (0.0%) |
| 16 and 17 Years | 0 (0.0%) | 0 (0.0%) |
| 18 to 24 Years | 0 (0.0%) | 42 (100.0%) |
| 25 to 34 Years | 0 (0.0%) | 0 (0.0%) |
| 35 to 44 Years | 0 (0.0%) | 0 (0.0%) |
| 45 to 54 Years | 0 (0.0%) | 6 (8.2%) |
| 55 to 64 Years | 0 (0.0%) | 10 (9.6%) |
| 65 to 74 Years | 26 (26.5%) | 9 (18.8%) |
| 75 Years and over | 0 (0.0%) | 2 (15.4%) |
| Total | 26 (6.5%) | 69 (15.8%) |
Income Above Poverty by Sex and Age in Poncha Springs
According to the poverty statistics in Poncha Springs, males aged 6 to 11 years and females aged under 5 years are the age groups that are most secure financially, with 100.0% of males and 100.0% of females in these age groups living above the poverty line.
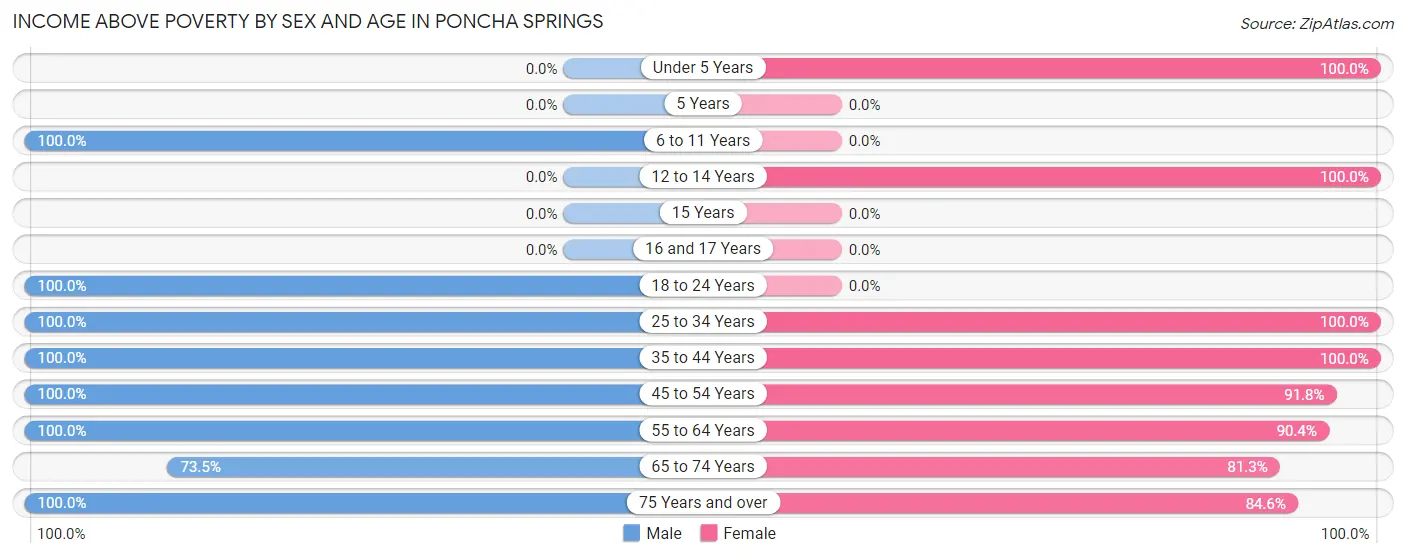
| Age Bracket | Male | Female |
| Under 5 Years | 0 (0.0%) | 37 (100.0%) |
| 5 Years | 0 (0.0%) | 0 (0.0%) |
| 6 to 11 Years | 9 (100.0%) | 0 (0.0%) |
| 12 to 14 Years | 0 (0.0%) | 26 (100.0%) |
| 15 Years | 0 (0.0%) | 0 (0.0%) |
| 16 and 17 Years | 0 (0.0%) | 0 (0.0%) |
| 18 to 24 Years | 2 (100.0%) | 0 (0.0%) |
| 25 to 34 Years | 43 (100.0%) | 36 (100.0%) |
| 35 to 44 Years | 95 (100.0%) | 58 (100.0%) |
| 45 to 54 Years | 95 (100.0%) | 67 (91.8%) |
| 55 to 64 Years | 43 (100.0%) | 94 (90.4%) |
| 65 to 74 Years | 72 (73.5%) | 39 (81.2%) |
| 75 Years and over | 16 (100.0%) | 11 (84.6%) |
| Total | 375 (93.5%) | 368 (84.2%) |
Income Below Poverty Among Married-Couple Families in Poncha Springs
The poverty statistics for married-couple families in Poncha Springs show that 8.2% or 18 of the total 220 families live below the poverty line. Families with no children have the highest poverty rate of 9.3%, comprising of 18 families. On the other hand, families with 1 or 2 children have the lowest poverty rate of 0.0%, which includes 0 families.
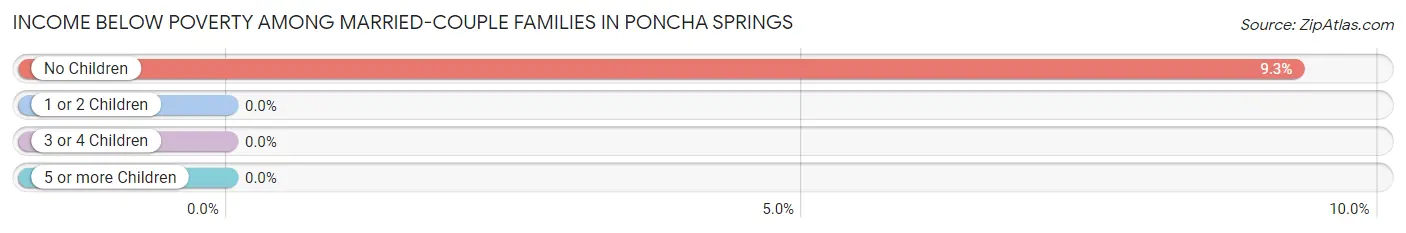
| Children | Above Poverty | Below Poverty |
| No Children | 176 (90.7%) | 18 (9.3%) |
| 1 or 2 Children | 26 (100.0%) | 0 (0.0%) |
| 3 or 4 Children | 0 (0.0%) | 0 (0.0%) |
| 5 or more Children | 0 (0.0%) | 0 (0.0%) |
| Total | 202 (91.8%) | 18 (8.2%) |
Income Below Poverty Among Single-Parent Households in Poncha Springs
| Children | Single Father | Single Mother |
| No Children | 0 (0.0%) | 0 (0.0%) |
| 1 or 2 Children | 0 (0.0%) | 0 (0.0%) |
| 3 or 4 Children | 0 (0.0%) | 0 (0.0%) |
| 5 or more Children | 0 (0.0%) | 0 (0.0%) |
| Total | 0 (0.0%) | 0 (0.0%) |
Income Below Poverty Among Married-Couple vs Single-Parent Households in Poncha Springs
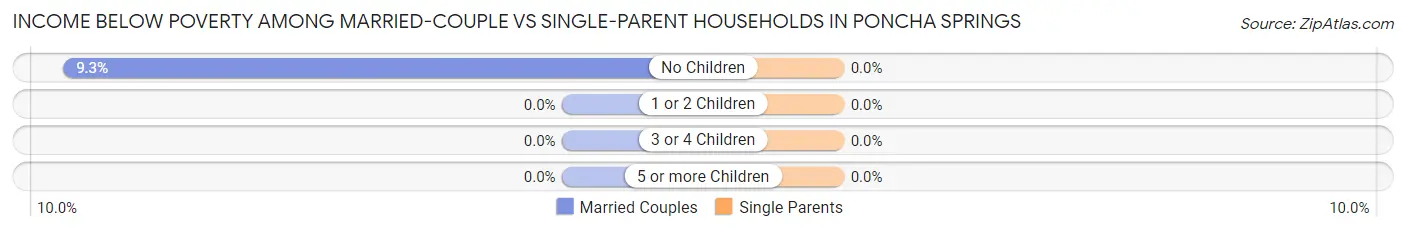
| Children | Married-Couple Families | Single-Parent Households |
| No Children | 18 (9.3%) | 0 (0.0%) |
| 1 or 2 Children | 0 (0.0%) | 0 (0.0%) |
| 3 or 4 Children | 0 (0.0%) | 0 (0.0%) |
| 5 or more Children | 0 (0.0%) | 0 (0.0%) |
| Total | 18 (8.2%) | 0 (0.0%) |
Race in Poncha Springs
The most populous races in Poncha Springs are White / Caucasian (761 | 87.8%), Hispanic or Latino (133 | 15.3%), and Two or more Races (98 | 11.3%).
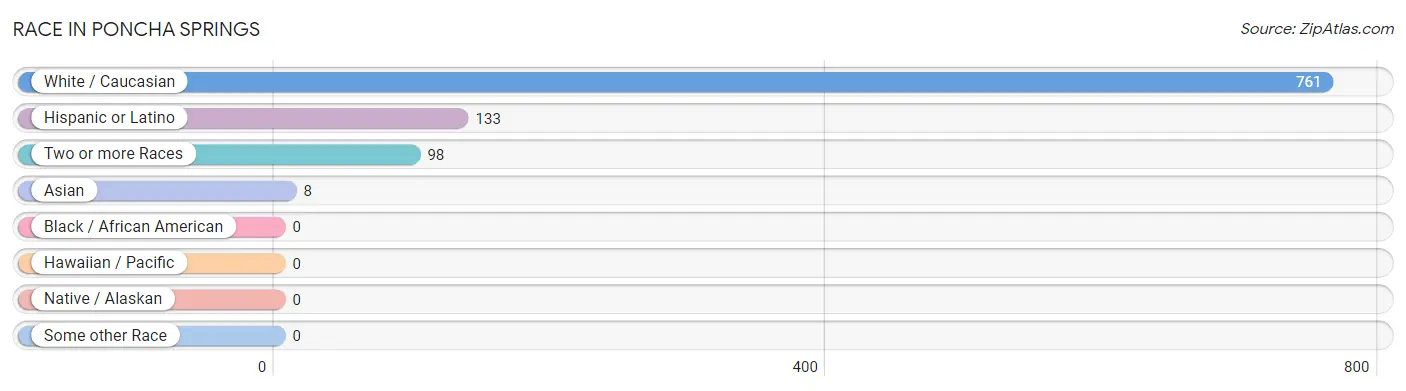
| Race | # Population | % Population |
| Asian | 8 | 0.9% |
| Black / African American | 0 | 0.0% |
| Hawaiian / Pacific | 0 | 0.0% |
| Hispanic or Latino | 133 | 15.3% |
| Native / Alaskan | 0 | 0.0% |
| White / Caucasian | 761 | 87.8% |
| Two or more Races | 98 | 11.3% |
| Some other Race | 0 | 0.0% |
| Total | 867 | 100.0% |
Ancestry in Poncha Springs
The most populous ancestries reported in Poncha Springs are German (328 | 37.8%), English (182 | 21.0%), Italian (138 | 15.9%), Mexican (133 | 15.3%), and Irish (92 | 10.6%), together accounting for 100.7% of all Poncha Springs residents.
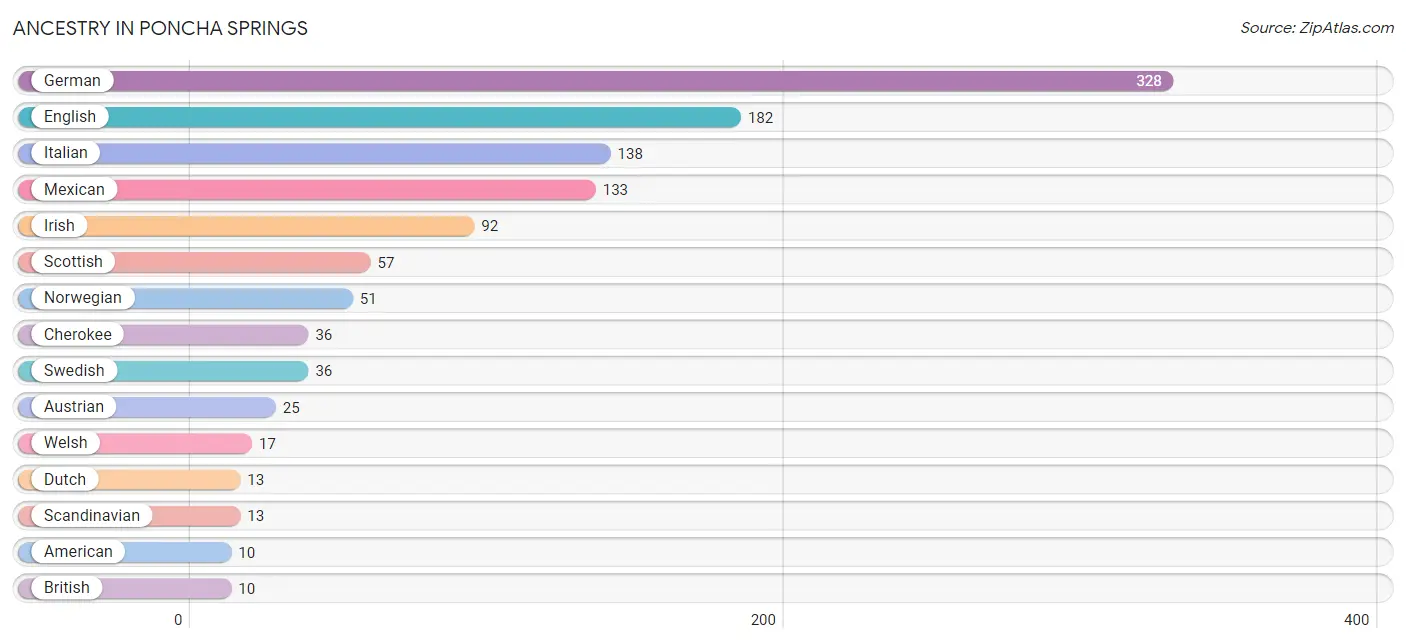
| Ancestry | # Population | % Population |
| American | 10 | 1.1% |
| Austrian | 25 | 2.9% |
| Bhutanese | 8 | 0.9% |
| British | 10 | 1.1% |
| Cherokee | 36 | 4.2% |
| Czech | 8 | 0.9% |
| Dutch | 13 | 1.5% |
| English | 182 | 21.0% |
| European | 4 | 0.5% |
| German | 328 | 37.8% |
| Greek | 8 | 0.9% |
| Irish | 92 | 10.6% |
| Italian | 138 | 15.9% |
| Mexican | 133 | 15.3% |
| Norwegian | 51 | 5.9% |
| Scandinavian | 13 | 1.5% |
| Scotch-Irish | 9 | 1.0% |
| Scottish | 57 | 6.6% |
| Slovene | 5 | 0.6% |
| Swedish | 36 | 4.2% |
| Welsh | 17 | 2.0% | View All 21 Rows |
Immigrants in Poncha Springs
The most numerous immigrant groups reported in Poncha Springs came from , and Canada (7 | 0.8%), together accounting for 0.8% of all Poncha Springs residents.

| Immigration Origin | # Population | % Population |
| Canada | 7 | 0.8% | View All 1 Rows |
Sex and Age in Poncha Springs
Sex and Age in Poncha Springs
The most populous age groups in Poncha Springs are 40 to 44 Years (85 | 19.8%) for men and 55 to 59 Years (54 | 12.4%) for women.
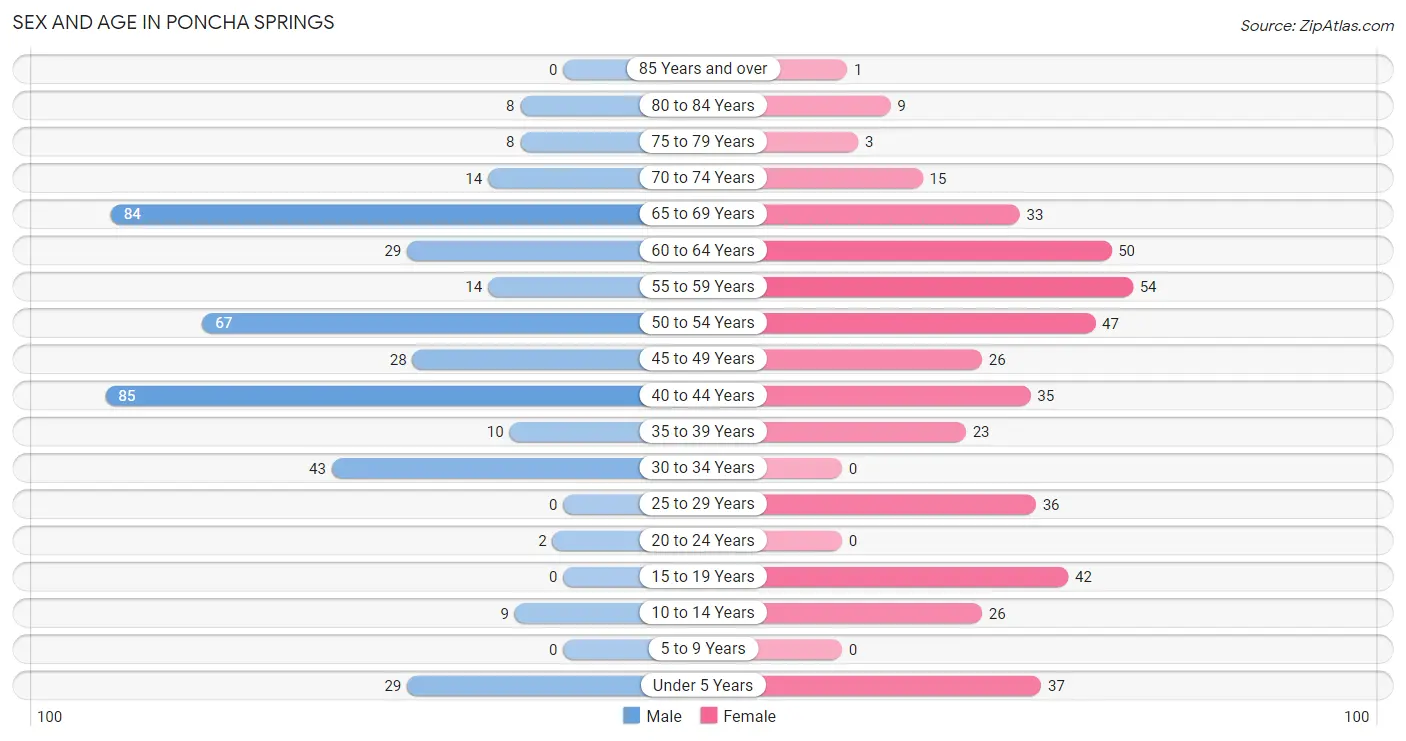
| Age Bracket | Male | Female |
| Under 5 Years | 29 (6.7%) | 37 (8.5%) |
| 5 to 9 Years | 0 (0.0%) | 0 (0.0%) |
| 10 to 14 Years | 9 (2.1%) | 26 (5.9%) |
| 15 to 19 Years | 0 (0.0%) | 42 (9.6%) |
| 20 to 24 Years | 2 (0.5%) | 0 (0.0%) |
| 25 to 29 Years | 0 (0.0%) | 36 (8.2%) |
| 30 to 34 Years | 43 (10.0%) | 0 (0.0%) |
| 35 to 39 Years | 10 (2.3%) | 23 (5.3%) |
| 40 to 44 Years | 85 (19.8%) | 35 (8.0%) |
| 45 to 49 Years | 28 (6.5%) | 26 (5.9%) |
| 50 to 54 Years | 67 (15.6%) | 47 (10.8%) |
| 55 to 59 Years | 14 (3.3%) | 54 (12.4%) |
| 60 to 64 Years | 29 (6.7%) | 50 (11.4%) |
| 65 to 69 Years | 84 (19.5%) | 33 (7.5%) |
| 70 to 74 Years | 14 (3.3%) | 15 (3.4%) |
| 75 to 79 Years | 8 (1.9%) | 3 (0.7%) |
| 80 to 84 Years | 8 (1.9%) | 9 (2.1%) |
| 85 Years and over | 0 (0.0%) | 1 (0.2%) |
| Total | 430 (100.0%) | 437 (100.0%) |
Families and Households in Poncha Springs
Median Family Size in Poncha Springs
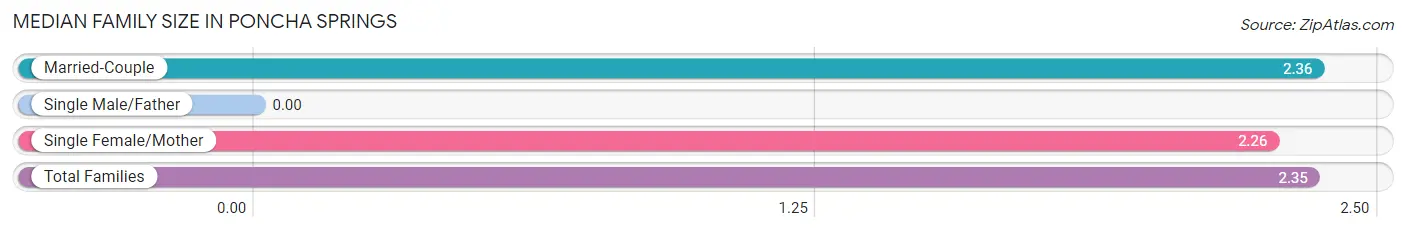
| Family Type | # Families | Family Size |
| Married-Couple | 220 (90.5%) | 2.36 |
| Single Male/Father | 0 (0.0%) | - |
| Single Female/Mother | 23 (9.5%) | 2.26 |
| Total Families | 243 (100.0%) | 2.35 |
Median Household Size in Poncha Springs
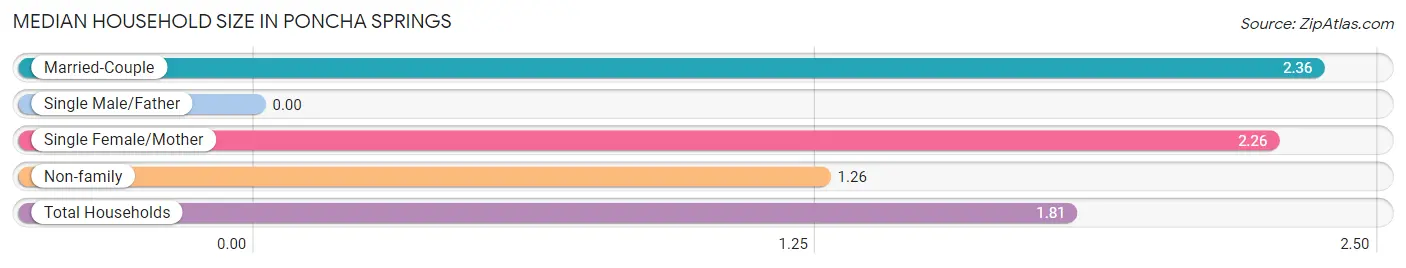
| Household Type | # Households | Household Size |
| Married-Couple | 220 (46.0%) | 2.36 |
| Single Male/Father | 0 (0.0%) | - |
| Single Female/Mother | 23 (4.8%) | 2.26 |
| Non-family | 235 (49.2%) | 1.26 |
| Total Households | 478 (100.0%) | 1.81 |
Household Size by Marriage Status in Poncha Springs
Out of a total of 478 households in Poncha Springs, 243 (50.8%) are family households, while 235 (49.2%) are nonfamily households. The most numerous type of family households are 2-person households, comprising 193, and the most common type of nonfamily households are 1-person households, comprising 128.
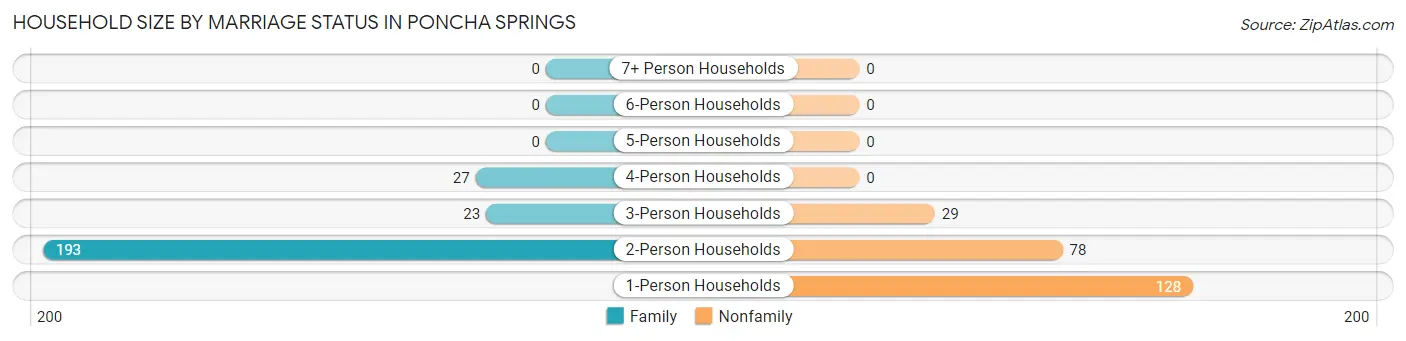
| Household Size | Family Households | Nonfamily Households |
| 1-Person Households | - | 128 (26.8%) |
| 2-Person Households | 193 (40.4%) | 78 (16.3%) |
| 3-Person Households | 23 (4.8%) | 29 (6.1%) |
| 4-Person Households | 27 (5.7%) | 0 (0.0%) |
| 5-Person Households | 0 (0.0%) | 0 (0.0%) |
| 6-Person Households | 0 (0.0%) | 0 (0.0%) |
| 7+ Person Households | 0 (0.0%) | 0 (0.0%) |
| Total | 243 (50.8%) | 235 (49.2%) |
Female Fertility in Poncha Springs
Fertility by Age in Poncha Springs
| Age Bracket | Women with Births | Births / 1,000 Women |
| 15 to 19 years | 0 (0.0%) | 0.0 |
| 20 to 34 years | 0 (0.0%) | 0.0 |
| 35 to 50 years | 0 (0.0%) | 0.0 |
| Total | 0 (0.0%) | 0.0 |
Fertility by Age by Marriage Status in Poncha Springs
| Age Bracket | Married | Unmarried |
| 15 to 19 years | 0 (0.0%) | 0 (0.0%) |
| 20 to 34 years | 0 (0.0%) | 0 (0.0%) |
| 35 to 50 years | 0 (0.0%) | 0 (0.0%) |
| Total | 0 (0.0%) | 0 (0.0%) |
Fertility by Education in Poncha Springs
| Educational Attainment | Women with Births | Births / 1,000 Women |
| Less than High School | 0 (0.0%) | 0.0 |
| High School Diploma | 0 (0.0%) | 0.0 |
| College or Associate's Degree | 0 (0.0%) | 0.0 |
| Bachelor's Degree | 0 (0.0%) | 0.0 |
| Graduate Degree | 0 (0.0%) | 0.0 |
| Total | 0 (0.0%) | 0.0 |
Fertility by Education by Marriage Status in Poncha Springs
| Educational Attainment | Married | Unmarried |
| Less than High School | 0 (0.0%) | 0 (0.0%) |
| High School Diploma | 0 (0.0%) | 0 (0.0%) |
| College or Associate's Degree | 0 (0.0%) | 0 (0.0%) |
| Bachelor's Degree | 0 (0.0%) | 0 (0.0%) |
| Graduate Degree | 0 (0.0%) | 0 (0.0%) |
| Total | 0 (0.0%) | 0 (0.0%) |
Employment Characteristics in Poncha Springs
Employment by Class of Employer in Poncha Springs
Among the 572 employed individuals in Poncha Springs, private company employees (237 | 41.4%), self-employed (incorporated) (96 | 16.8%), and local government employees (81 | 14.2%) make up the most common classes of employment.
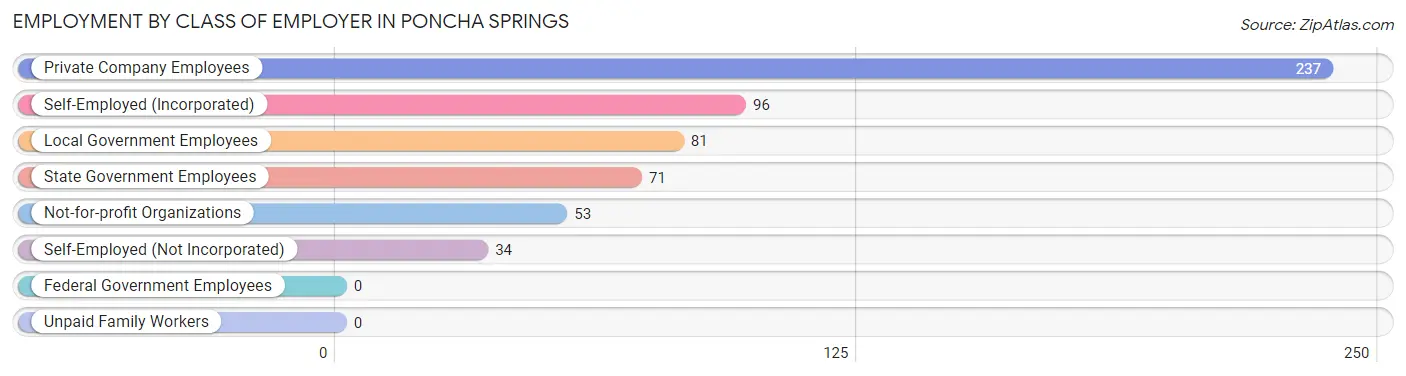
| Employer Class | # Employees | % Employees |
| Private Company Employees | 237 | 41.4% |
| Self-Employed (Incorporated) | 96 | 16.8% |
| Self-Employed (Not Incorporated) | 34 | 5.9% |
| Not-for-profit Organizations | 53 | 9.3% |
| Local Government Employees | 81 | 14.2% |
| State Government Employees | 71 | 12.4% |
| Federal Government Employees | 0 | 0.0% |
| Unpaid Family Workers | 0 | 0.0% |
| Total | 572 | 100.0% |
Employment Status by Age in Poncha Springs
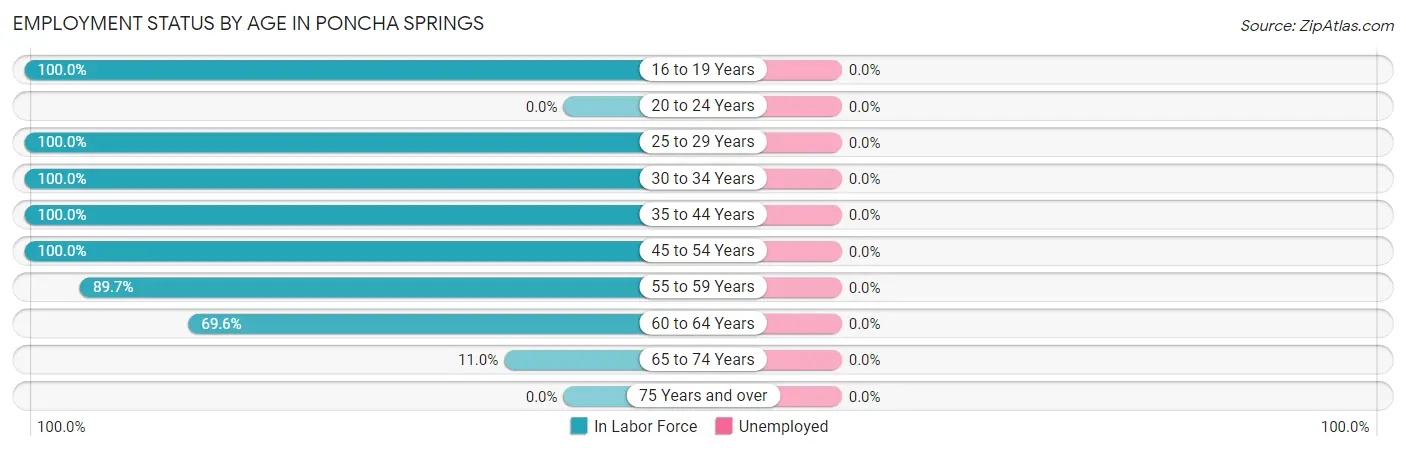
| Age Bracket | In Labor Force | Unemployed |
| 16 to 19 Years | 42 (100.0%) | 0 (0.0%) |
| 20 to 24 Years | 0 (0.0%) | 0 (0.0%) |
| 25 to 29 Years | 36 (100.0%) | 0 (0.0%) |
| 30 to 34 Years | 43 (100.0%) | 0 (0.0%) |
| 35 to 44 Years | 153 (100.0%) | 0 (0.0%) |
| 45 to 54 Years | 168 (100.0%) | 0 (0.0%) |
| 55 to 59 Years | 61 (89.7%) | 0 (0.0%) |
| 60 to 64 Years | 55 (69.6%) | 0 (0.0%) |
| 65 to 74 Years | 16 (11.0%) | 0 (0.0%) |
| 75 Years and over | 0 (0.0%) | 0 (0.0%) |
| Total | 574 (74.9%) | 0 (0.0%) |
Employment Status by Educational Attainment in Poncha Springs
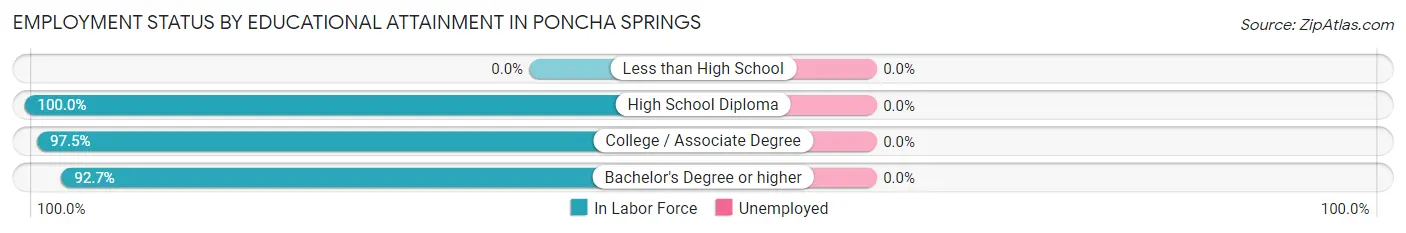
| Educational Attainment | In Labor Force | Unemployed |
| Less than High School | 0 (0.0%) | 0 (0.0%) |
| High School Diploma | 60 (100.0%) | 0 (0.0%) |
| College / Associate Degree | 277 (97.5%) | 0 (0.0%) |
| Bachelor's Degree or higher | 179 (92.7%) | 0 (0.0%) |
| Total | 516 (94.3%) | 0 (0.0%) |
Employment Occupations by Sex in Poncha Springs
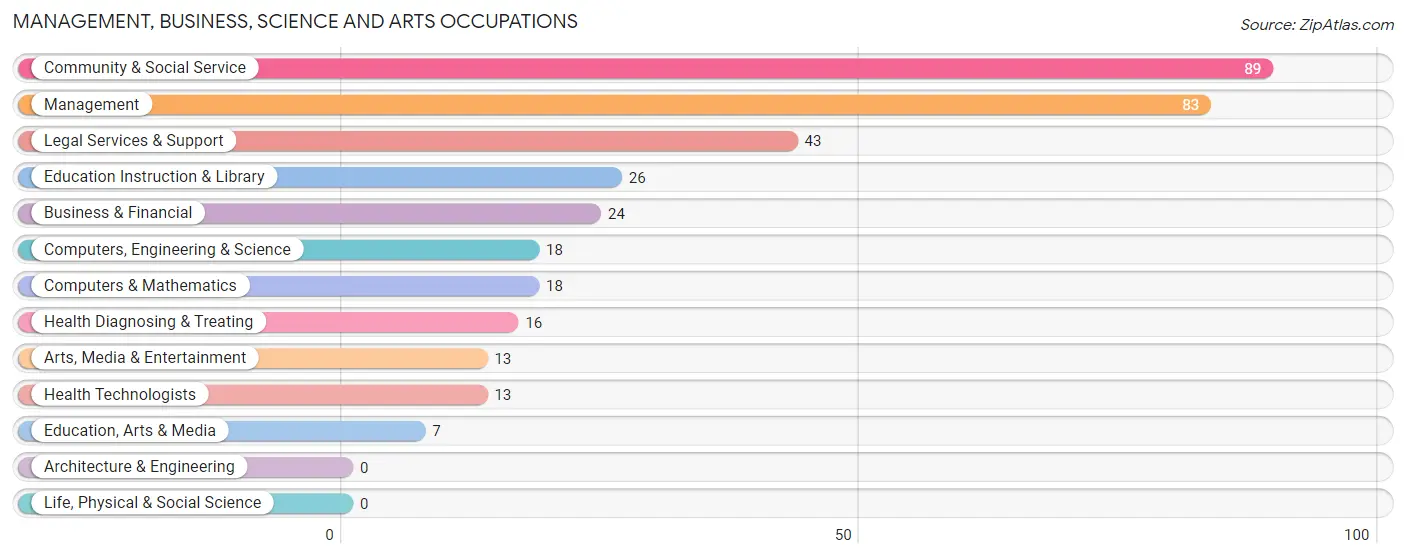
Management, Business, Science and Arts Occupations
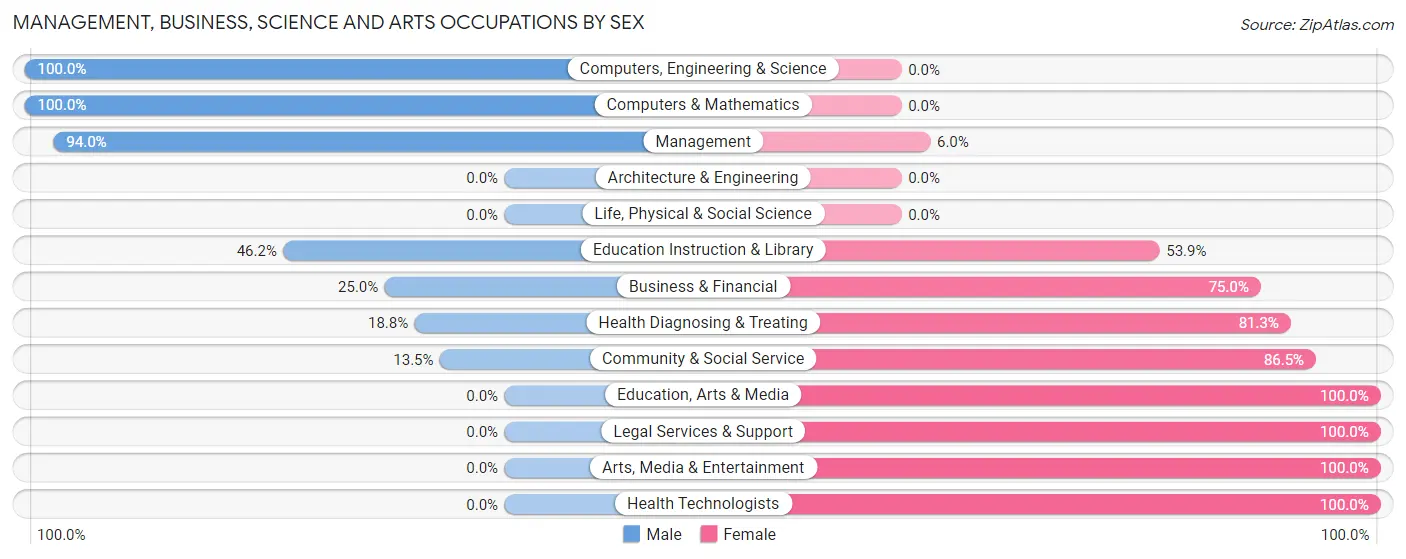
The most common Management, Business, Science and Arts occupations in Poncha Springs are Community & Social Service (89 | 15.5%), Management (83 | 14.5%), Legal Services & Support (43 | 7.5%), Education Instruction & Library (26 | 4.5%), and Business & Financial (24 | 4.2%).
Management, Business, Science and Arts Occupations by Sex
Within the Management, Business, Science and Arts occupations in Poncha Springs, the most male-oriented occupations are Computers, Engineering & Science (100.0%), Computers & Mathematics (100.0%), and Management (94.0%), while the most female-oriented occupations are Education, Arts & Media (100.0%), Legal Services & Support (100.0%), and Arts, Media & Entertainment (100.0%).
| Occupation | Male | Female |
| Management | 78 (94.0%) | 5 (6.0%) |
| Business & Financial | 6 (25.0%) | 18 (75.0%) |
| Computers, Engineering & Science | 18 (100.0%) | 0 (0.0%) |
| Computers & Mathematics | 18 (100.0%) | 0 (0.0%) |
| Architecture & Engineering | 0 (0.0%) | 0 (0.0%) |
| Life, Physical & Social Science | 0 (0.0%) | 0 (0.0%) |
| Community & Social Service | 12 (13.5%) | 77 (86.5%) |
| Education, Arts & Media | 0 (0.0%) | 7 (100.0%) |
| Legal Services & Support | 0 (0.0%) | 43 (100.0%) |
| Education Instruction & Library | 12 (46.2%) | 14 (53.8%) |
| Arts, Media & Entertainment | 0 (0.0%) | 13 (100.0%) |
| Health Diagnosing & Treating | 3 (18.8%) | 13 (81.2%) |
| Health Technologists | 0 (0.0%) | 13 (100.0%) |
| Total (Category) | 117 (50.9%) | 113 (49.1%) |
| Total (Overall) | 269 (46.9%) | 305 (53.1%) |
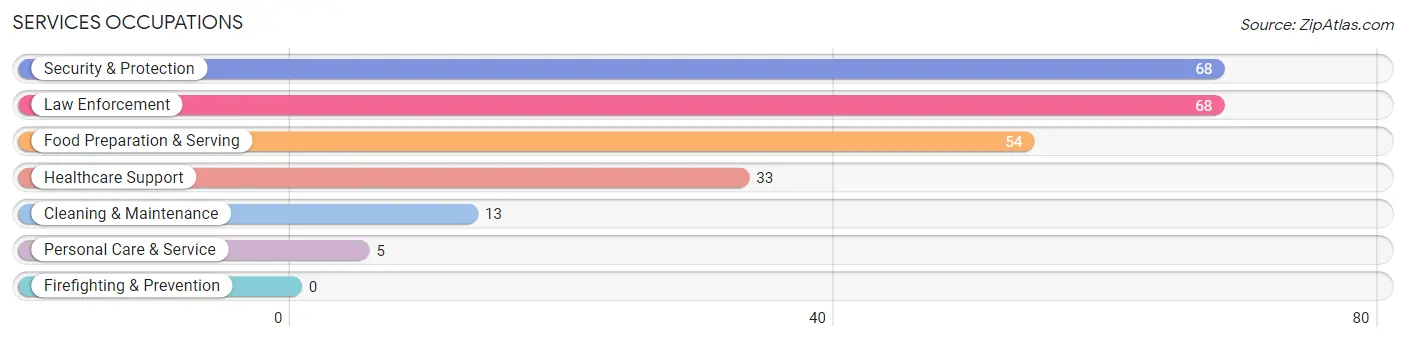
Services Occupations
The most common Services occupations in Poncha Springs are Security & Protection (68 | 11.8%), Law Enforcement (68 | 11.8%), Food Preparation & Serving (54 | 9.4%), Healthcare Support (33 | 5.8%), and Cleaning & Maintenance (13 | 2.3%).
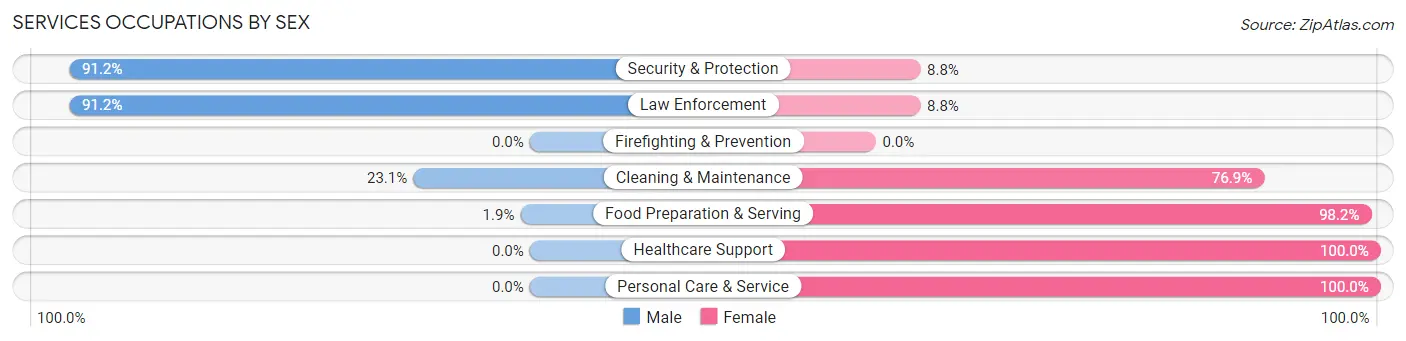
Services Occupations by Sex
Within the Services occupations in Poncha Springs, the most male-oriented occupations are Security & Protection (91.2%), Law Enforcement (91.2%), and Cleaning & Maintenance (23.1%), while the most female-oriented occupations are Healthcare Support (100.0%), Personal Care & Service (100.0%), and Food Preparation & Serving (98.2%).
| Occupation | Male | Female |
| Healthcare Support | 0 (0.0%) | 33 (100.0%) |
| Security & Protection | 62 (91.2%) | 6 (8.8%) |
| Firefighting & Prevention | 0 (0.0%) | 0 (0.0%) |
| Law Enforcement | 62 (91.2%) | 6 (8.8%) |
| Food Preparation & Serving | 1 (1.8%) | 53 (98.2%) |
| Cleaning & Maintenance | 3 (23.1%) | 10 (76.9%) |
| Personal Care & Service | 0 (0.0%) | 5 (100.0%) |
| Total (Category) | 66 (38.2%) | 107 (61.9%) |
| Total (Overall) | 269 (46.9%) | 305 (53.1%) |
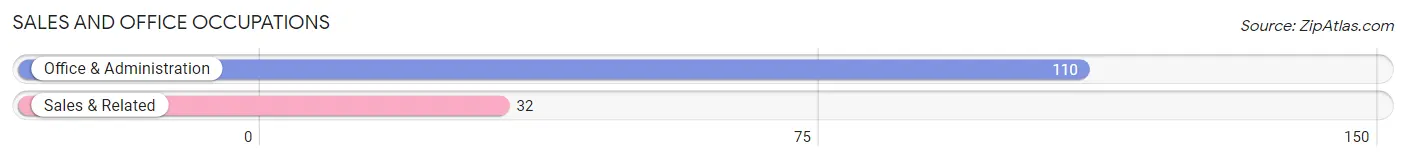
Sales and Office Occupations
The most common Sales and Office occupations in Poncha Springs are Office & Administration (110 | 19.2%), and Sales & Related (32 | 5.6%).
Sales and Office Occupations by Sex
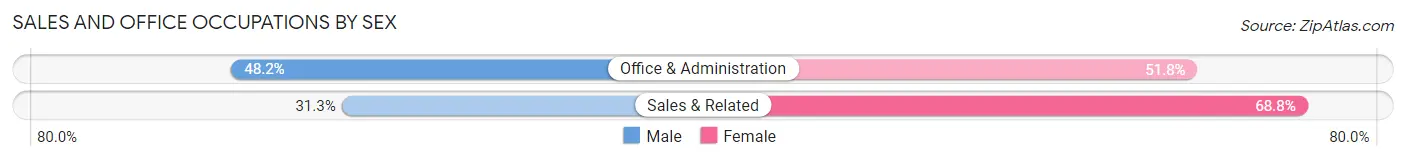
| Occupation | Male | Female |
| Sales & Related | 10 (31.2%) | 22 (68.8%) |
| Office & Administration | 53 (48.2%) | 57 (51.8%) |
| Total (Category) | 63 (44.4%) | 79 (55.6%) |
| Total (Overall) | 269 (46.9%) | 305 (53.1%) |
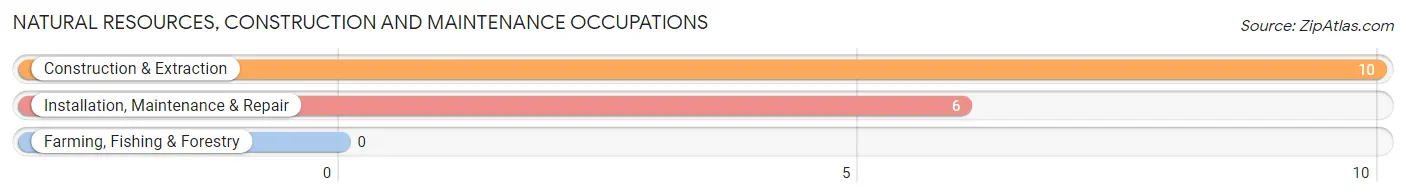
Natural Resources, Construction and Maintenance Occupations
The most common Natural Resources, Construction and Maintenance occupations in Poncha Springs are Construction & Extraction (10 | 1.7%), and Installation, Maintenance & Repair (6 | 1.1%).
Natural Resources, Construction and Maintenance Occupations by Sex
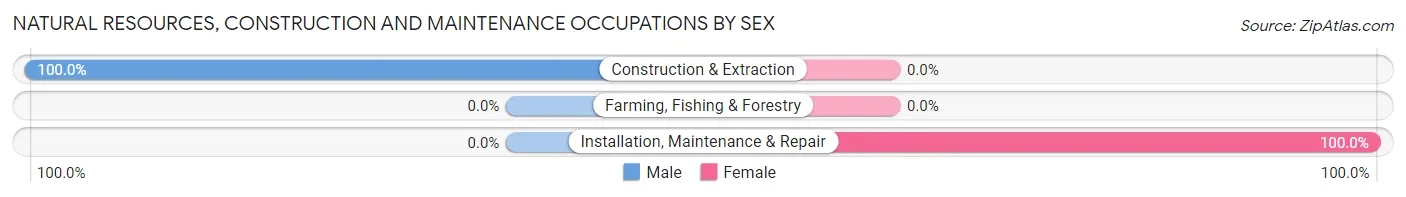
| Occupation | Male | Female |
| Farming, Fishing & Forestry | 0 (0.0%) | 0 (0.0%) |
| Construction & Extraction | 10 (100.0%) | 0 (0.0%) |
| Installation, Maintenance & Repair | 0 (0.0%) | 6 (100.0%) |
| Total (Category) | 10 (62.5%) | 6 (37.5%) |
| Total (Overall) | 269 (46.9%) | 305 (53.1%) |
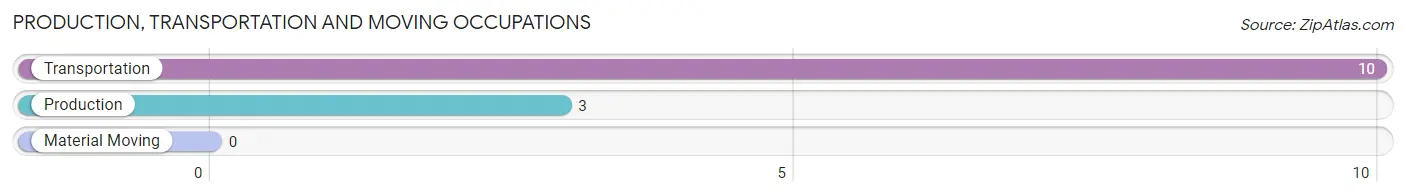
Production, Transportation and Moving Occupations
The most common Production, Transportation and Moving occupations in Poncha Springs are Transportation (10 | 1.7%), and Production (3 | 0.5%).
Production, Transportation and Moving Occupations by Sex
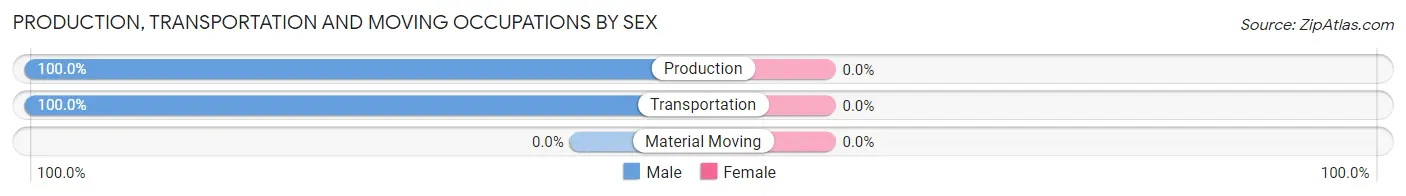
| Occupation | Male | Female |
| Production | 3 (100.0%) | 0 (0.0%) |
| Transportation | 10 (100.0%) | 0 (0.0%) |
| Material Moving | 0 (0.0%) | 0 (0.0%) |
| Total (Category) | 13 (100.0%) | 0 (0.0%) |
| Total (Overall) | 269 (46.9%) | 305 (53.1%) |
Employment Industries by Sex in Poncha Springs
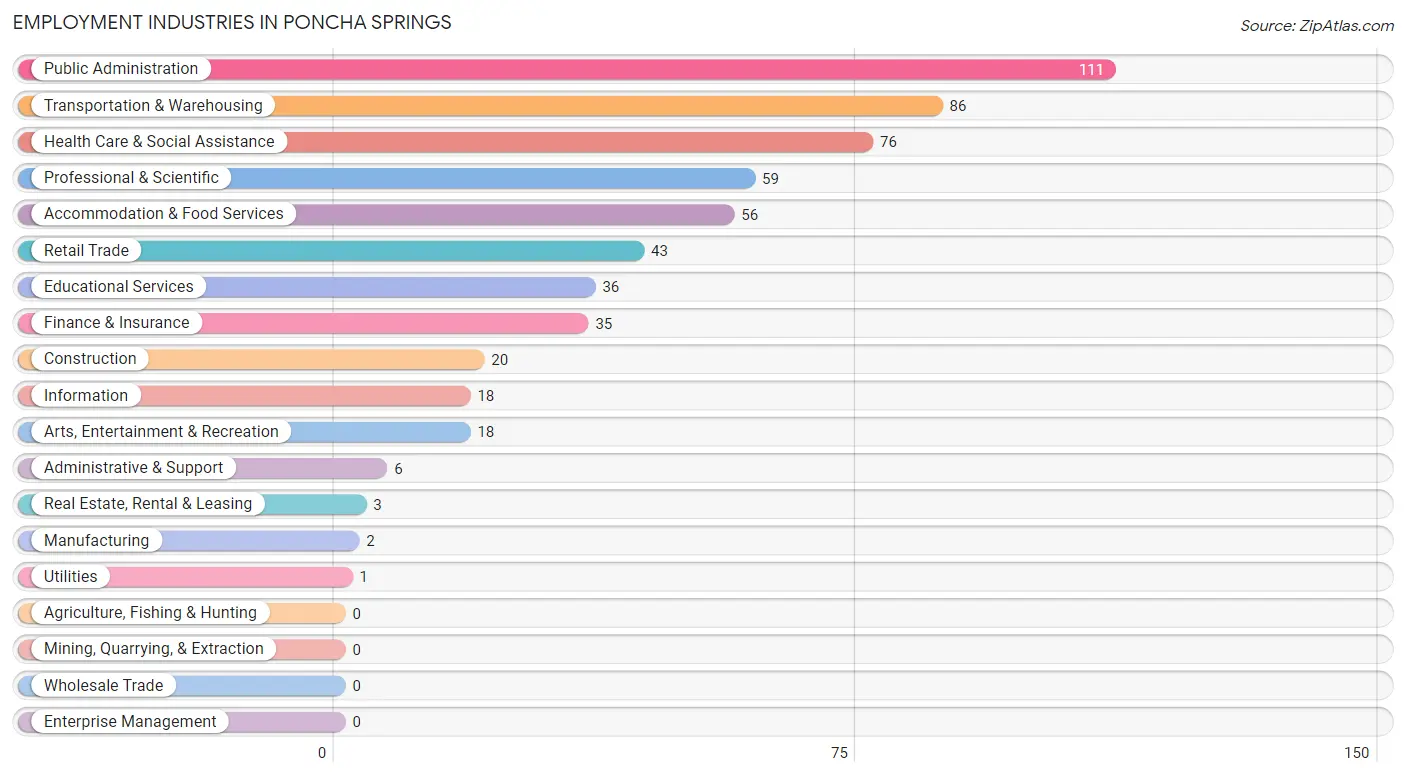
Employment Industries in Poncha Springs
The major employment industries in Poncha Springs include Public Administration (111 | 19.3%), Transportation & Warehousing (86 | 15.0%), Health Care & Social Assistance (76 | 13.2%), Professional & Scientific (59 | 10.3%), and Accommodation & Food Services (56 | 9.8%).
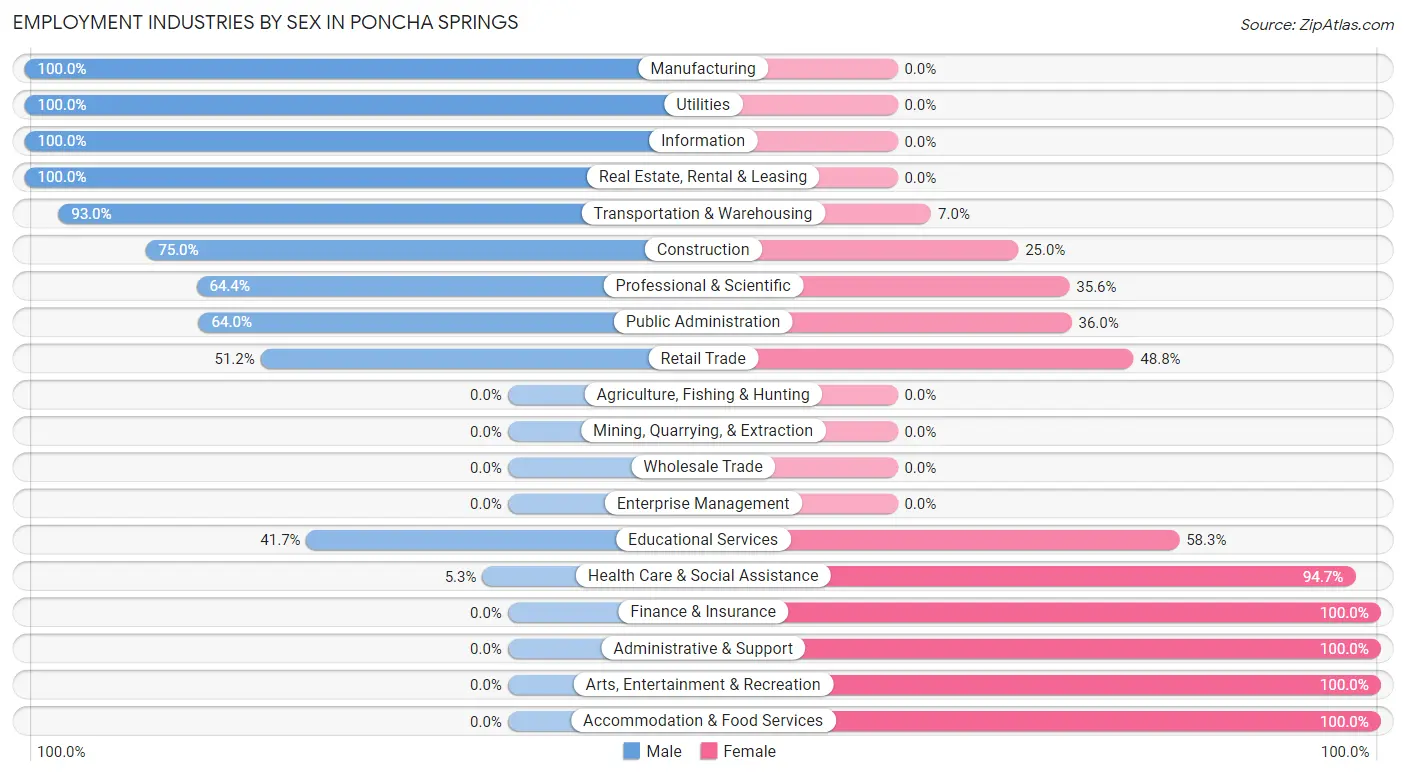
Employment Industries by Sex in Poncha Springs
The Poncha Springs industries that see more men than women are Manufacturing (100.0%), Utilities (100.0%), and Information (100.0%), whereas the industries that tend to have a higher number of women are Finance & Insurance (100.0%), Administrative & Support (100.0%), and Arts, Entertainment & Recreation (100.0%).
| Industry | Male | Female |
| Agriculture, Fishing & Hunting | 0 (0.0%) | 0 (0.0%) |
| Mining, Quarrying, & Extraction | 0 (0.0%) | 0 (0.0%) |
| Construction | 15 (75.0%) | 5 (25.0%) |
| Manufacturing | 2 (100.0%) | 0 (0.0%) |
| Wholesale Trade | 0 (0.0%) | 0 (0.0%) |
| Retail Trade | 22 (51.2%) | 21 (48.8%) |
| Transportation & Warehousing | 80 (93.0%) | 6 (7.0%) |
| Utilities | 1 (100.0%) | 0 (0.0%) |
| Information | 18 (100.0%) | 0 (0.0%) |
| Finance & Insurance | 0 (0.0%) | 35 (100.0%) |
| Real Estate, Rental & Leasing | 3 (100.0%) | 0 (0.0%) |
| Professional & Scientific | 38 (64.4%) | 21 (35.6%) |
| Enterprise Management | 0 (0.0%) | 0 (0.0%) |
| Administrative & Support | 0 (0.0%) | 6 (100.0%) |
| Educational Services | 15 (41.7%) | 21 (58.3%) |
| Health Care & Social Assistance | 4 (5.3%) | 72 (94.7%) |
| Arts, Entertainment & Recreation | 0 (0.0%) | 18 (100.0%) |
| Accommodation & Food Services | 0 (0.0%) | 56 (100.0%) |
| Public Administration | 71 (64.0%) | 40 (36.0%) |
| Total | 269 (46.9%) | 305 (53.1%) |
Education in Poncha Springs
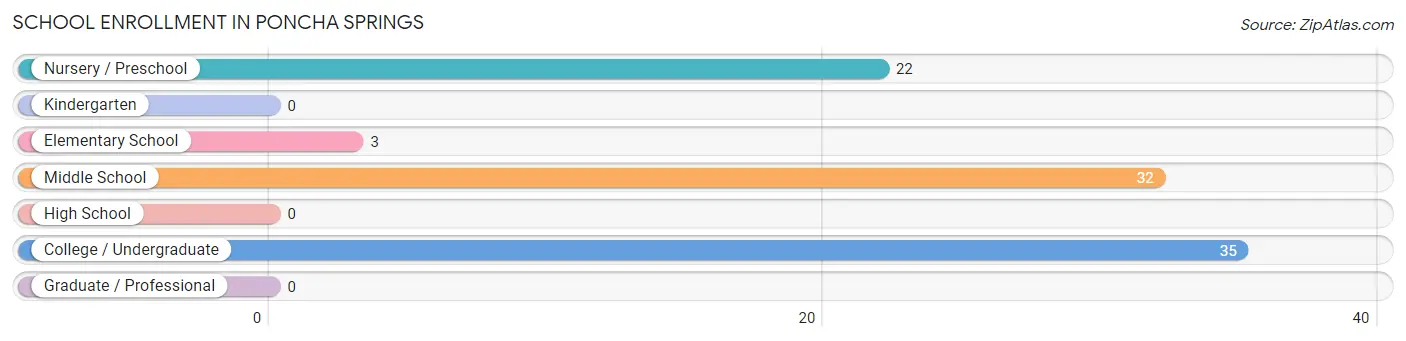
School Enrollment in Poncha Springs
The most common levels of schooling among the 92 students in Poncha Springs are college / undergraduate (35 | 38.0%), middle school (32 | 34.8%), and nursery / preschool (22 | 23.9%).
| School Level | # Students | % Students |
| Nursery / Preschool | 22 | 23.9% |
| Kindergarten | 0 | 0.0% |
| Elementary School | 3 | 3.3% |
| Middle School | 32 | 34.8% |
| High School | 0 | 0.0% |
| College / Undergraduate | 35 | 38.0% |
| Graduate / Professional | 0 | 0.0% |
| Total | 92 | 100.0% |
School Enrollment by Age by Funding Source in Poncha Springs
Out of a total of 92 students who are enrolled in schools in Poncha Springs, 22 (23.9%) attend a private institution, while the remaining 70 (76.1%) are enrolled in public schools. The age group of 3 to 4 year olds has the highest likelihood of being enrolled in private schools, with 22 (100.0% in the age bracket) enrolled. Conversely, the age group of 10 to 14 year olds has the lowest likelihood of being enrolled in a private school, with 35 (100.0% in the age bracket) attending a public institution.
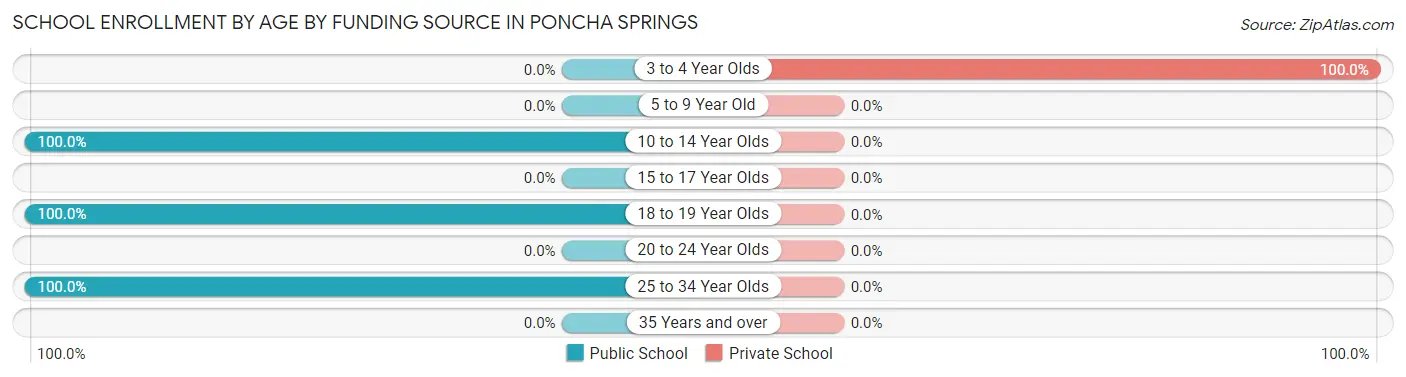
| Age Bracket | Public School | Private School |
| 3 to 4 Year Olds | 0 (0.0%) | 22 (100.0%) |
| 5 to 9 Year Old | 0 (0.0%) | 0 (0.0%) |
| 10 to 14 Year Olds | 35 (100.0%) | 0 (0.0%) |
| 15 to 17 Year Olds | 0 (0.0%) | 0 (0.0%) |
| 18 to 19 Year Olds | 29 (100.0%) | 0 (0.0%) |
| 20 to 24 Year Olds | 0 (0.0%) | 0 (0.0%) |
| 25 to 34 Year Olds | 6 (100.0%) | 0 (0.0%) |
| 35 Years and over | 0 (0.0%) | 0 (0.0%) |
| Total | 70 (76.1%) | 22 (23.9%) |
Educational Attainment by Field of Study in Poncha Springs
Business (107 | 38.5%), education (42 | 15.1%), science & technology (26 | 9.3%), visual & performing arts (17 | 6.1%), and computers & mathematics (16 | 5.8%) are the most common fields of study among 278 individuals in Poncha Springs who have obtained a bachelor's degree or higher.
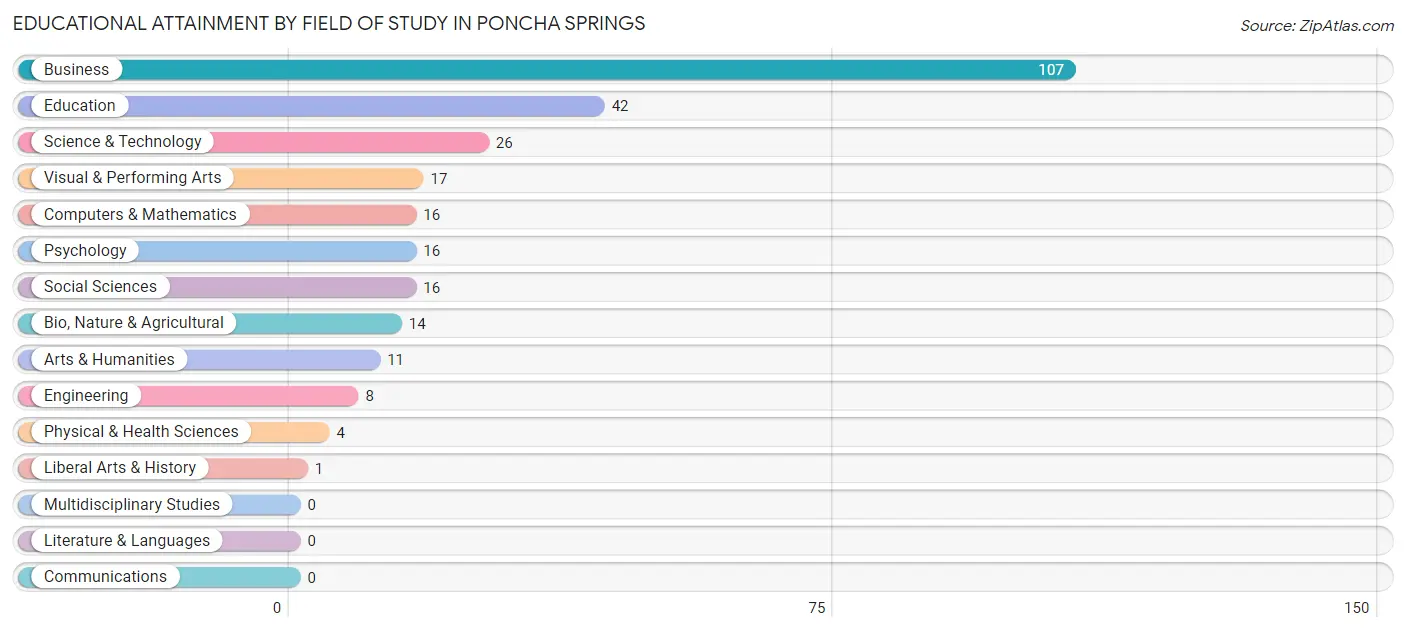
| Field of Study | # Graduates | % Graduates |
| Computers & Mathematics | 16 | 5.8% |
| Bio, Nature & Agricultural | 14 | 5.0% |
| Physical & Health Sciences | 4 | 1.4% |
| Psychology | 16 | 5.8% |
| Social Sciences | 16 | 5.8% |
| Engineering | 8 | 2.9% |
| Multidisciplinary Studies | 0 | 0.0% |
| Science & Technology | 26 | 9.3% |
| Business | 107 | 38.5% |
| Education | 42 | 15.1% |
| Literature & Languages | 0 | 0.0% |
| Liberal Arts & History | 1 | 0.4% |
| Visual & Performing Arts | 17 | 6.1% |
| Communications | 0 | 0.0% |
| Arts & Humanities | 11 | 4.0% |
| Total | 278 | 100.0% |
Transportation & Commute in Poncha Springs
Vehicle Availability by Sex in Poncha Springs
The most prevalent vehicle ownership categories in Poncha Springs are males with 2 vehicles (137, accounting for 50.9%) and females with 2 vehicles (184, making up 45.2%).
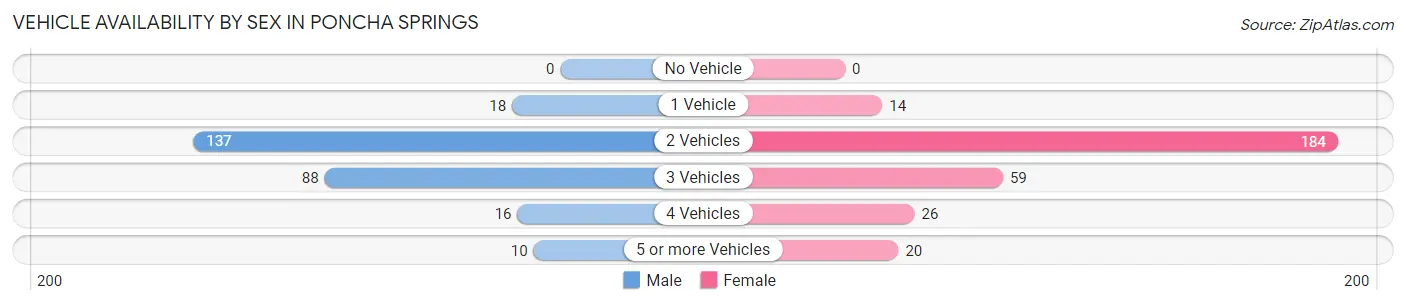
| Vehicles Available | Male | Female |
| No Vehicle | 0 (0.0%) | 0 (0.0%) |
| 1 Vehicle | 18 (6.7%) | 14 (4.6%) |
| 2 Vehicles | 137 (50.9%) | 184 (60.7%) |
| 3 Vehicles | 88 (32.7%) | 59 (19.5%) |
| 4 Vehicles | 16 (5.9%) | 26 (8.6%) |
| 5 or more Vehicles | 10 (3.7%) | 20 (6.6%) |
| Total | 269 (100.0%) | 303 (100.0%) |
Commute Time in Poncha Springs
The most frequently occuring commute durations in Poncha Springs are 10 to 14 minutes (234 commuters, 48.4%), 5 to 9 minutes (124 commuters, 25.7%), and 25 to 29 minutes (62 commuters, 12.8%).
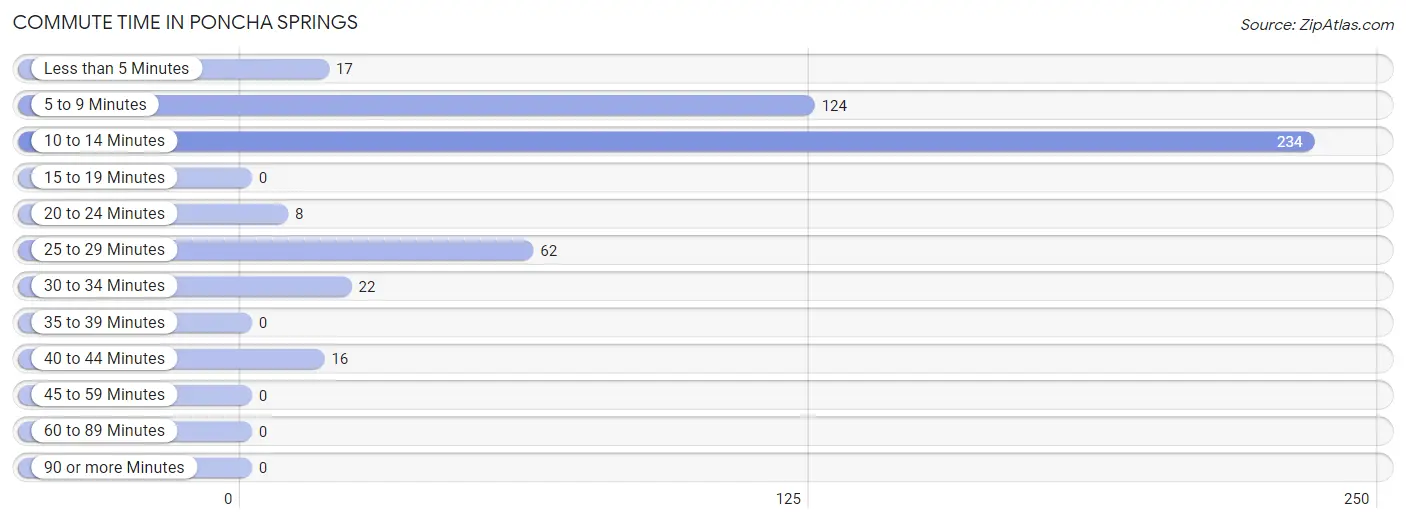
| Commute Time | # Commuters | % Commuters |
| Less than 5 Minutes | 17 | 3.5% |
| 5 to 9 Minutes | 124 | 25.7% |
| 10 to 14 Minutes | 234 | 48.4% |
| 15 to 19 Minutes | 0 | 0.0% |
| 20 to 24 Minutes | 8 | 1.7% |
| 25 to 29 Minutes | 62 | 12.8% |
| 30 to 34 Minutes | 22 | 4.5% |
| 35 to 39 Minutes | 0 | 0.0% |
| 40 to 44 Minutes | 16 | 3.3% |
| 45 to 59 Minutes | 0 | 0.0% |
| 60 to 89 Minutes | 0 | 0.0% |
| 90 or more Minutes | 0 | 0.0% |
Commute Time by Sex in Poncha Springs
The most common commute times in Poncha Springs are 10 to 14 minutes (105 commuters, 50.5%) for males and 10 to 14 minutes (129 commuters, 46.9%) for females.
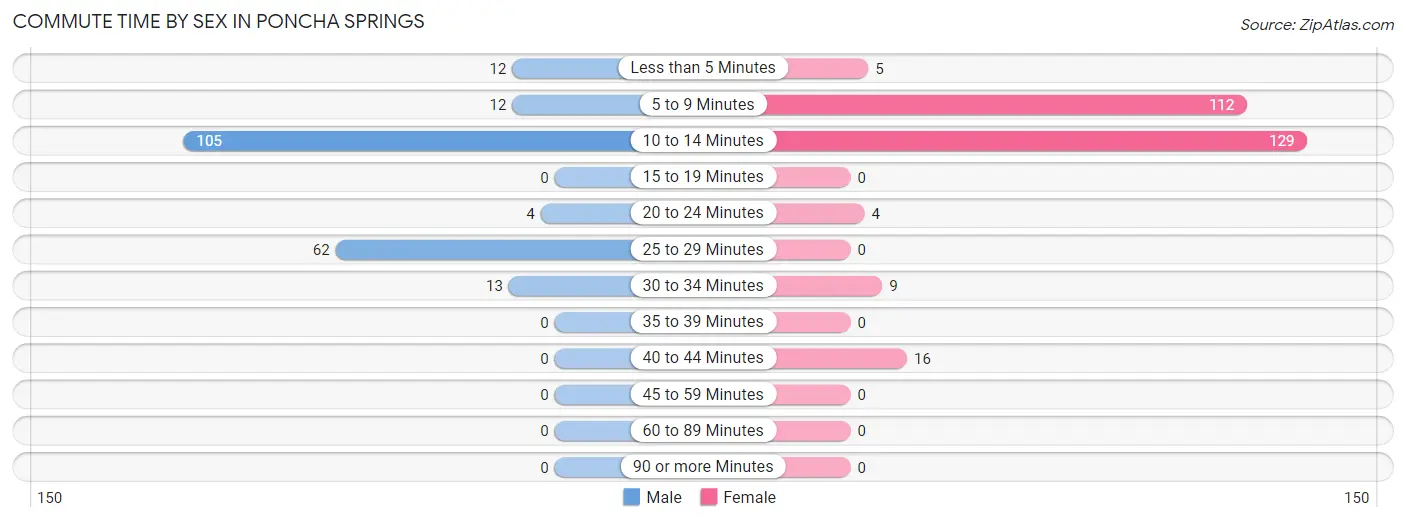
| Commute Time | Male | Female |
| Less than 5 Minutes | 12 (5.8%) | 5 (1.8%) |
| 5 to 9 Minutes | 12 (5.8%) | 112 (40.7%) |
| 10 to 14 Minutes | 105 (50.5%) | 129 (46.9%) |
| 15 to 19 Minutes | 0 (0.0%) | 0 (0.0%) |
| 20 to 24 Minutes | 4 (1.9%) | 4 (1.5%) |
| 25 to 29 Minutes | 62 (29.8%) | 0 (0.0%) |
| 30 to 34 Minutes | 13 (6.2%) | 9 (3.3%) |
| 35 to 39 Minutes | 0 (0.0%) | 0 (0.0%) |
| 40 to 44 Minutes | 0 (0.0%) | 16 (5.8%) |
| 45 to 59 Minutes | 0 (0.0%) | 0 (0.0%) |
| 60 to 89 Minutes | 0 (0.0%) | 0 (0.0%) |
| 90 or more Minutes | 0 (0.0%) | 0 (0.0%) |
Time of Departure to Work by Sex in Poncha Springs
The most frequent times of departure to work in Poncha Springs are 7:00 AM to 7:29 AM (87, 41.8%) for males and 7:30 AM to 7:59 AM (89, 32.4%) for females.
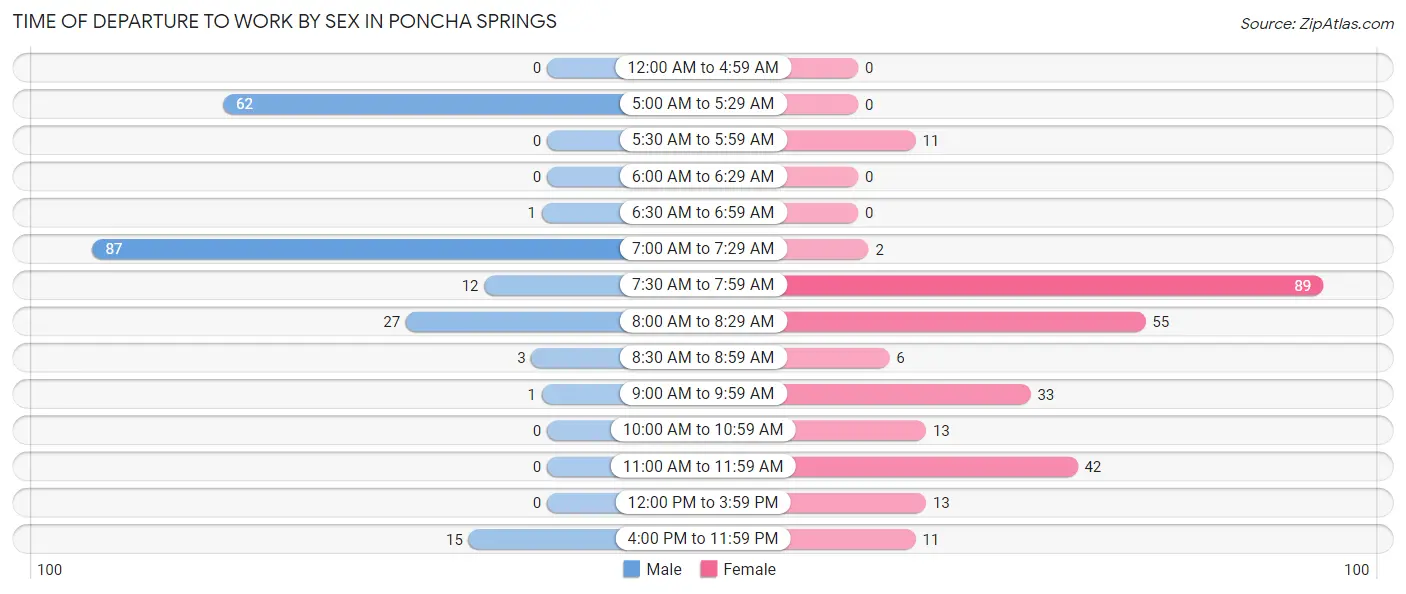
| Time of Departure | Male | Female |
| 12:00 AM to 4:59 AM | 0 (0.0%) | 0 (0.0%) |
| 5:00 AM to 5:29 AM | 62 (29.8%) | 0 (0.0%) |
| 5:30 AM to 5:59 AM | 0 (0.0%) | 11 (4.0%) |
| 6:00 AM to 6:29 AM | 0 (0.0%) | 0 (0.0%) |
| 6:30 AM to 6:59 AM | 1 (0.5%) | 0 (0.0%) |
| 7:00 AM to 7:29 AM | 87 (41.8%) | 2 (0.7%) |
| 7:30 AM to 7:59 AM | 12 (5.8%) | 89 (32.4%) |
| 8:00 AM to 8:29 AM | 27 (13.0%) | 55 (20.0%) |
| 8:30 AM to 8:59 AM | 3 (1.4%) | 6 (2.2%) |
| 9:00 AM to 9:59 AM | 1 (0.5%) | 33 (12.0%) |
| 10:00 AM to 10:59 AM | 0 (0.0%) | 13 (4.7%) |
| 11:00 AM to 11:59 AM | 0 (0.0%) | 42 (15.3%) |
| 12:00 PM to 3:59 PM | 0 (0.0%) | 13 (4.7%) |
| 4:00 PM to 11:59 PM | 15 (7.2%) | 11 (4.0%) |
| Total | 208 (100.0%) | 275 (100.0%) |
Housing Occupancy in Poncha Springs
Occupancy by Ownership in Poncha Springs
Of the total 478 dwellings in Poncha Springs, owner-occupied units account for 412 (86.2%), while renter-occupied units make up 66 (13.8%).
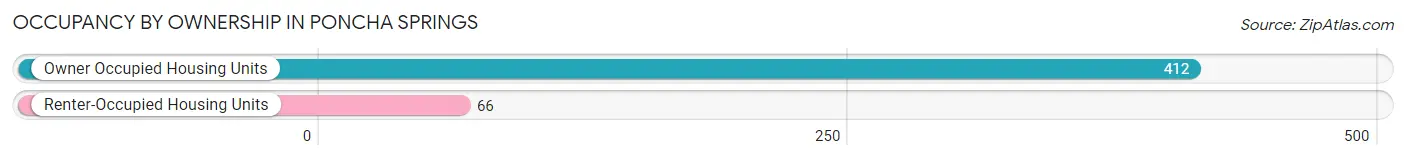
| Occupancy | # Housing Units | % Housing Units |
| Owner Occupied Housing Units | 412 | 86.2% |
| Renter-Occupied Housing Units | 66 | 13.8% |
| Total Occupied Housing Units | 478 | 100.0% |
Occupancy by Household Size in Poncha Springs
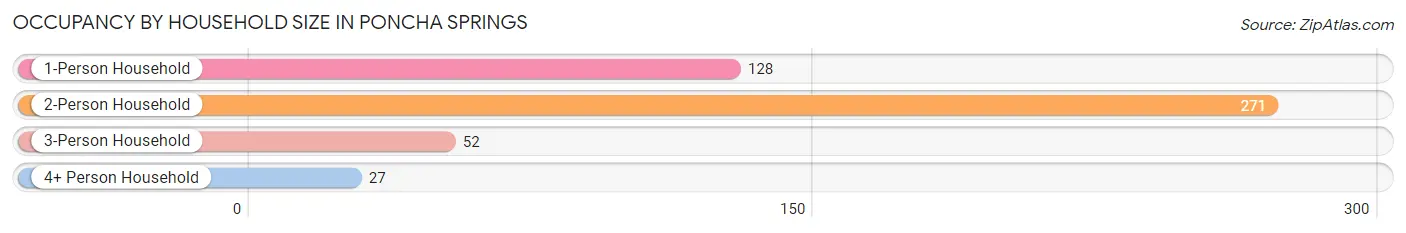
| Household Size | # Housing Units | % Housing Units |
| 1-Person Household | 128 | 26.8% |
| 2-Person Household | 271 | 56.7% |
| 3-Person Household | 52 | 10.9% |
| 4+ Person Household | 27 | 5.7% |
| Total Housing Units | 478 | 100.0% |
Occupancy by Ownership by Household Size in Poncha Springs
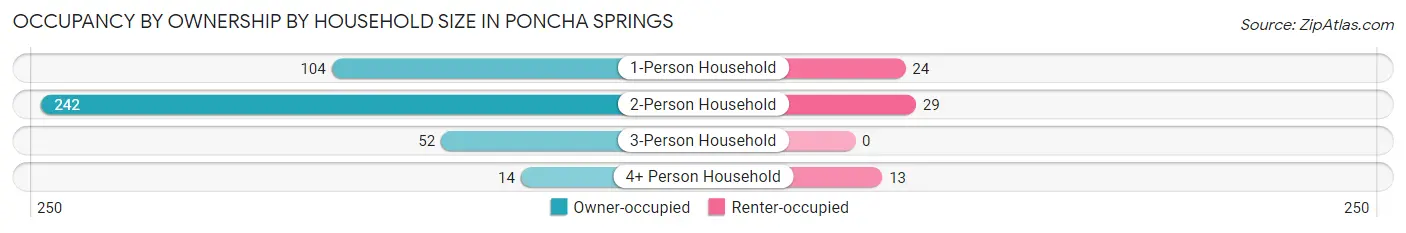
| Household Size | Owner-occupied | Renter-occupied |
| 1-Person Household | 104 (81.2%) | 24 (18.8%) |
| 2-Person Household | 242 (89.3%) | 29 (10.7%) |
| 3-Person Household | 52 (100.0%) | 0 (0.0%) |
| 4+ Person Household | 14 (51.8%) | 13 (48.1%) |
| Total Housing Units | 412 (86.2%) | 66 (13.8%) |
Occupancy by Educational Attainment in Poncha Springs
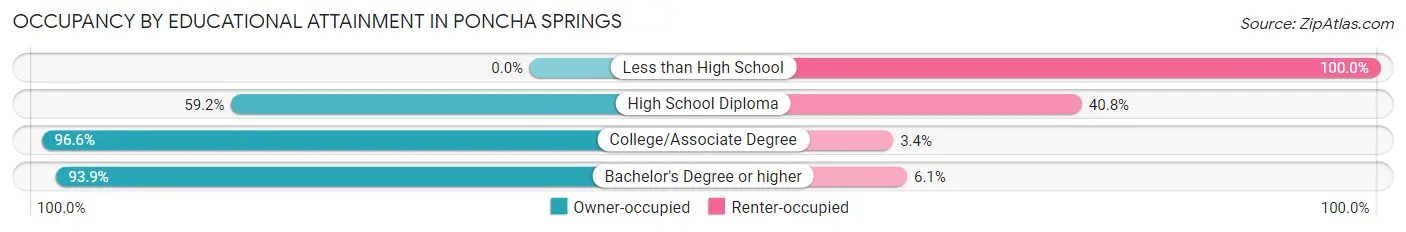
| Household Size | Owner-occupied | Renter-occupied |
| Less than High School | 0 (0.0%) | 18 (100.0%) |
| High School Diploma | 45 (59.2%) | 31 (40.8%) |
| College/Associate Degree | 229 (96.6%) | 8 (3.4%) |
| Bachelor's Degree or higher | 138 (93.9%) | 9 (6.1%) |
Occupancy by Age of Householder in Poncha Springs
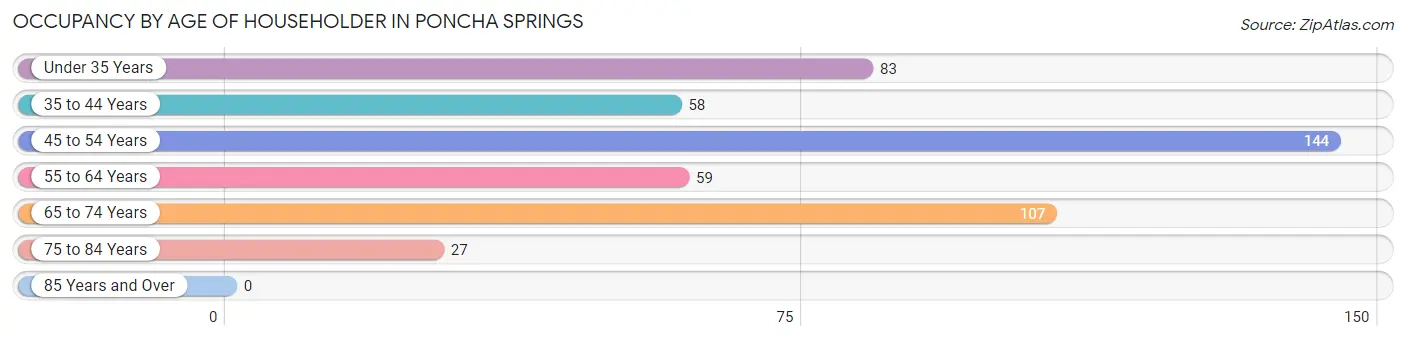
| Age Bracket | # Households | % Households |
| Under 35 Years | 83 | 17.4% |
| 35 to 44 Years | 58 | 12.1% |
| 45 to 54 Years | 144 | 30.1% |
| 55 to 64 Years | 59 | 12.3% |
| 65 to 74 Years | 107 | 22.4% |
| 75 to 84 Years | 27 | 5.7% |
| 85 Years and Over | 0 | 0.0% |
| Total | 478 | 100.0% |
Housing Finances in Poncha Springs
Median Income by Occupancy in Poncha Springs
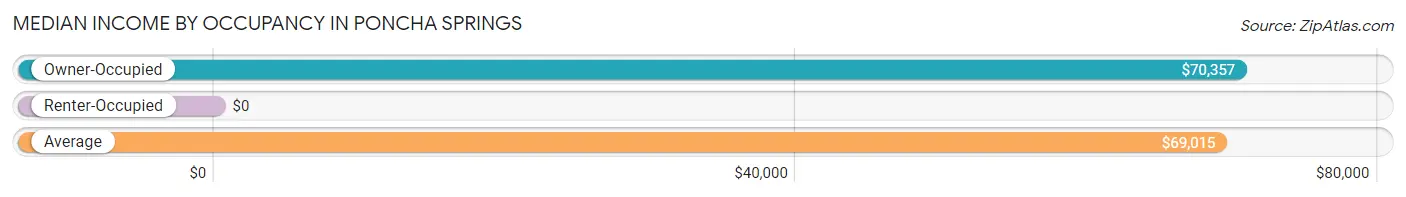
| Occupancy Type | # Households | Median Income |
| Owner-Occupied | 412 (86.2%) | $70,357 |
| Renter-Occupied | 66 (13.8%) | $0 |
| Average | 478 (100.0%) | $69,015 |
Occupancy by Householder Income Bracket in Poncha Springs
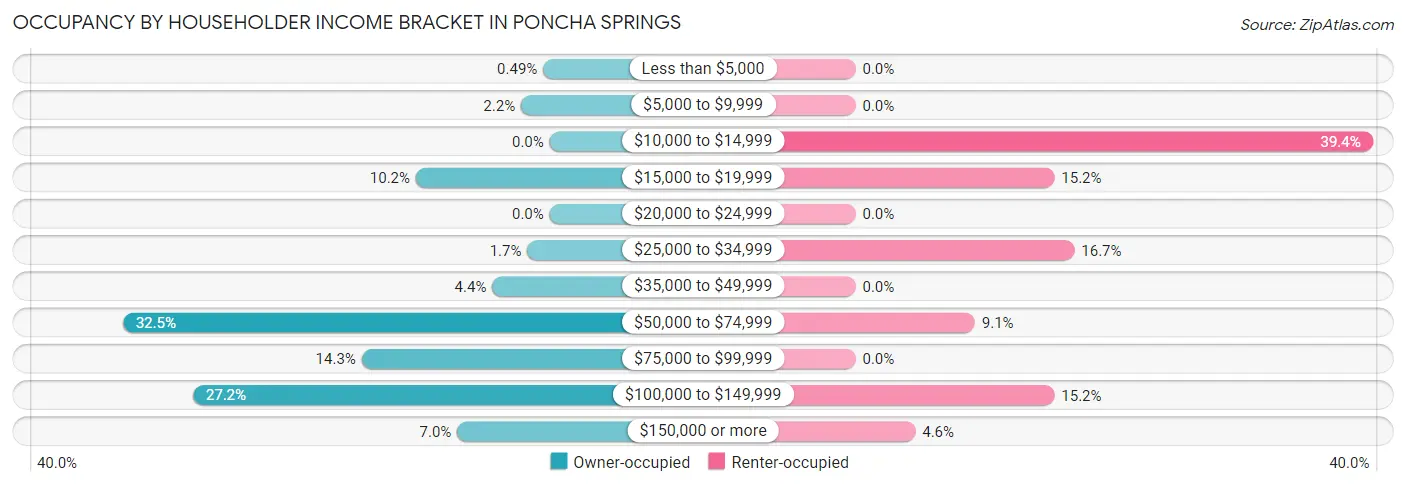
| Income Bracket | Owner-occupied | Renter-occupied |
| Less than $5,000 | 2 (0.5%) | 0 (0.0%) |
| $5,000 to $9,999 | 9 (2.2%) | 0 (0.0%) |
| $10,000 to $14,999 | 0 (0.0%) | 26 (39.4%) |
| $15,000 to $19,999 | 42 (10.2%) | 10 (15.1%) |
| $20,000 to $24,999 | 0 (0.0%) | 0 (0.0%) |
| $25,000 to $34,999 | 7 (1.7%) | 11 (16.7%) |
| $35,000 to $49,999 | 18 (4.4%) | 0 (0.0%) |
| $50,000 to $74,999 | 134 (32.5%) | 6 (9.1%) |
| $75,000 to $99,999 | 59 (14.3%) | 0 (0.0%) |
| $100,000 to $149,999 | 112 (27.2%) | 10 (15.1%) |
| $150,000 or more | 29 (7.0%) | 3 (4.5%) |
| Total | 412 (100.0%) | 66 (100.0%) |
Monthly Housing Cost Tiers in Poncha Springs
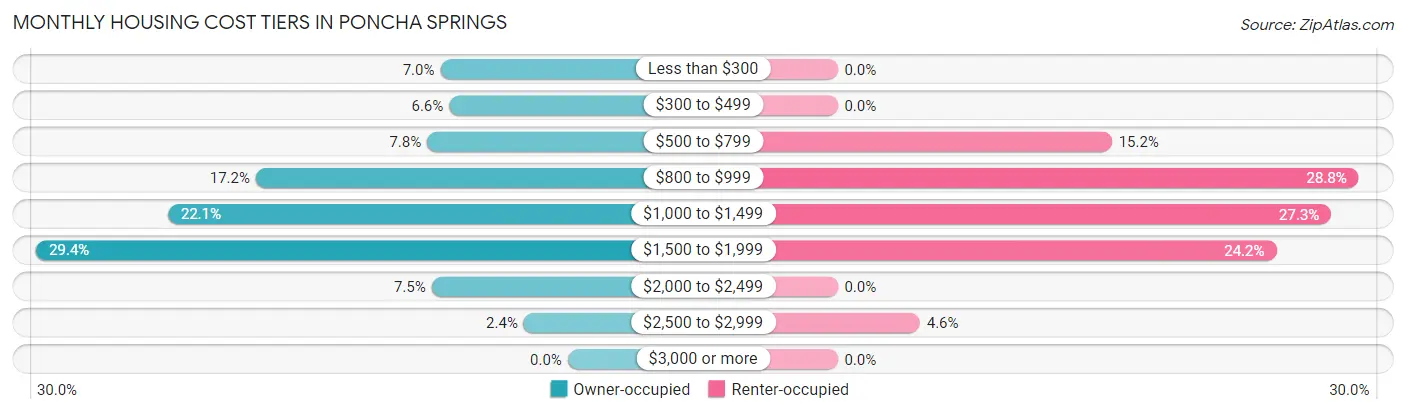
| Monthly Cost | Owner-occupied | Renter-occupied |
| Less than $300 | 29 (7.0%) | 0 (0.0%) |
| $300 to $499 | 27 (6.6%) | 0 (0.0%) |
| $500 to $799 | 32 (7.8%) | 10 (15.1%) |
| $800 to $999 | 71 (17.2%) | 19 (28.8%) |
| $1,000 to $1,499 | 91 (22.1%) | 18 (27.3%) |
| $1,500 to $1,999 | 121 (29.4%) | 16 (24.2%) |
| $2,000 to $2,499 | 31 (7.5%) | 0 (0.0%) |
| $2,500 to $2,999 | 10 (2.4%) | 3 (4.5%) |
| $3,000 or more | 0 (0.0%) | 0 (0.0%) |
| Total | 412 (100.0%) | 66 (100.0%) |
Physical Housing Characteristics in Poncha Springs
Housing Structures in Poncha Springs
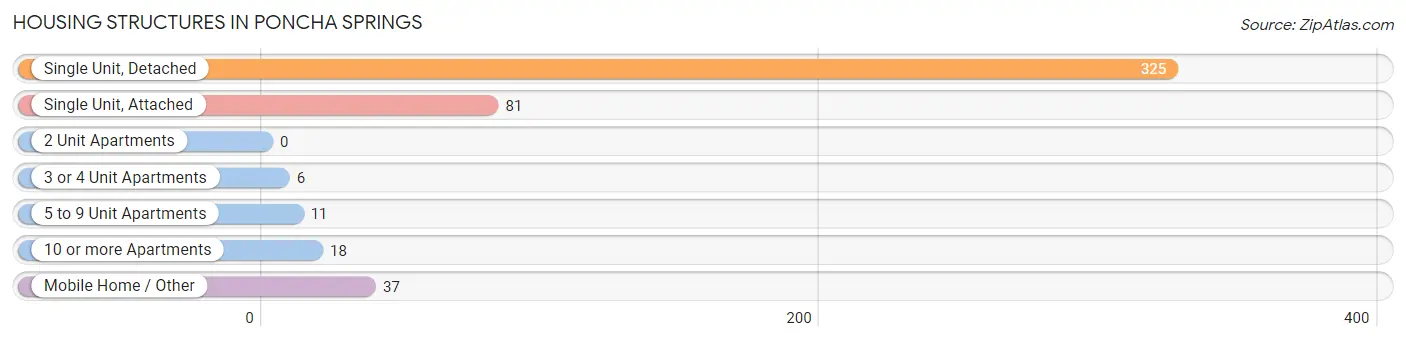
| Structure Type | # Housing Units | % Housing Units |
| Single Unit, Detached | 325 | 68.0% |
| Single Unit, Attached | 81 | 17.0% |
| 2 Unit Apartments | 0 | 0.0% |
| 3 or 4 Unit Apartments | 6 | 1.3% |
| 5 to 9 Unit Apartments | 11 | 2.3% |
| 10 or more Apartments | 18 | 3.8% |
| Mobile Home / Other | 37 | 7.7% |
| Total | 478 | 100.0% |
Housing Structures by Occupancy in Poncha Springs
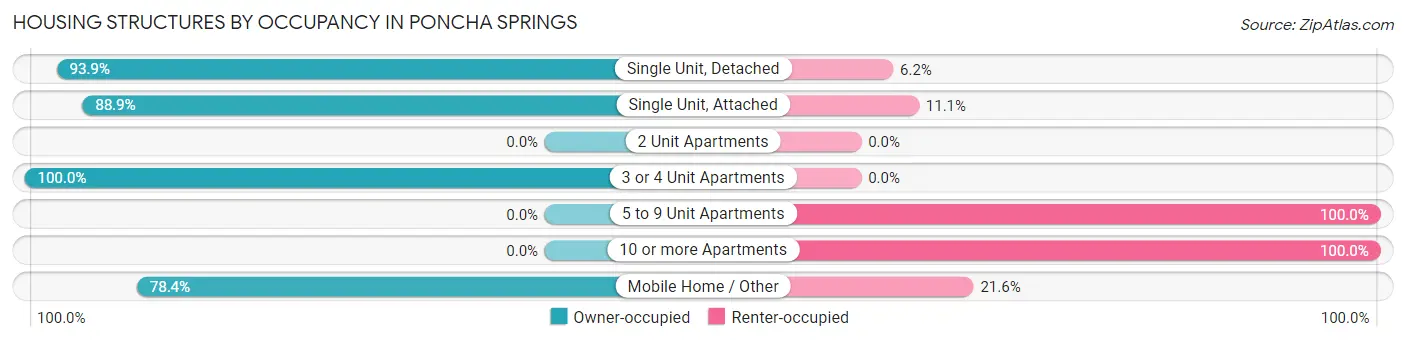
| Structure Type | Owner-occupied | Renter-occupied |
| Single Unit, Detached | 305 (93.9%) | 20 (6.1%) |
| Single Unit, Attached | 72 (88.9%) | 9 (11.1%) |
| 2 Unit Apartments | 0 (0.0%) | 0 (0.0%) |
| 3 or 4 Unit Apartments | 6 (100.0%) | 0 (0.0%) |
| 5 to 9 Unit Apartments | 0 (0.0%) | 11 (100.0%) |
| 10 or more Apartments | 0 (0.0%) | 18 (100.0%) |
| Mobile Home / Other | 29 (78.4%) | 8 (21.6%) |
| Total | 412 (86.2%) | 66 (13.8%) |
Housing Structures by Number of Rooms in Poncha Springs
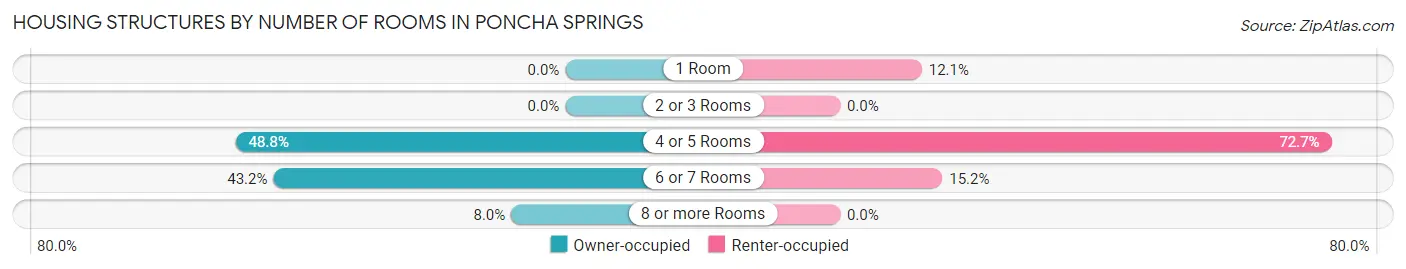
| Number of Rooms | Owner-occupied | Renter-occupied |
| 1 Room | 0 (0.0%) | 8 (12.1%) |
| 2 or 3 Rooms | 0 (0.0%) | 0 (0.0%) |
| 4 or 5 Rooms | 201 (48.8%) | 48 (72.7%) |
| 6 or 7 Rooms | 178 (43.2%) | 10 (15.1%) |
| 8 or more Rooms | 33 (8.0%) | 0 (0.0%) |
| Total | 412 (100.0%) | 66 (100.0%) |
Housing Structure by Heating Type in Poncha Springs
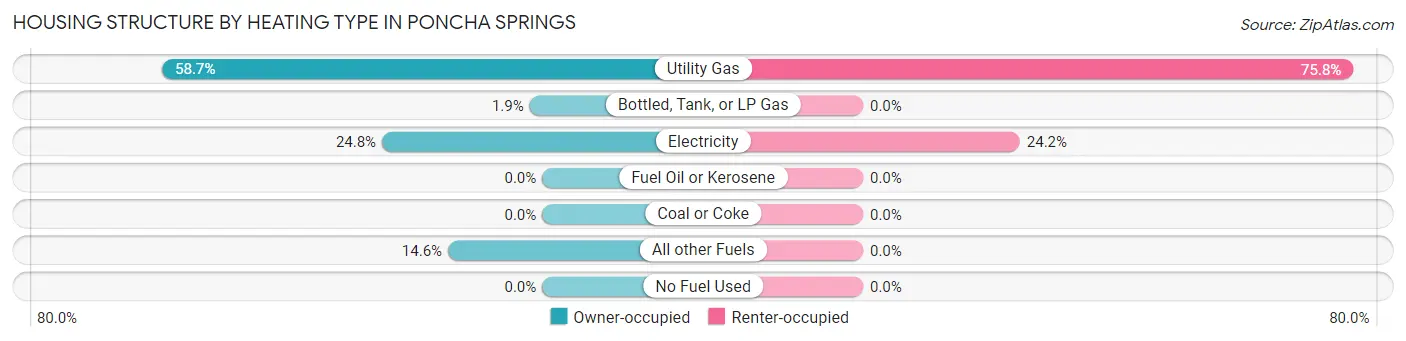
| Heating Type | Owner-occupied | Renter-occupied |
| Utility Gas | 242 (58.7%) | 50 (75.8%) |
| Bottled, Tank, or LP Gas | 8 (1.9%) | 0 (0.0%) |
| Electricity | 102 (24.8%) | 16 (24.2%) |
| Fuel Oil or Kerosene | 0 (0.0%) | 0 (0.0%) |
| Coal or Coke | 0 (0.0%) | 0 (0.0%) |
| All other Fuels | 60 (14.6%) | 0 (0.0%) |
| No Fuel Used | 0 (0.0%) | 0 (0.0%) |
| Total | 412 (100.0%) | 66 (100.0%) |
Household Vehicle Usage in Poncha Springs
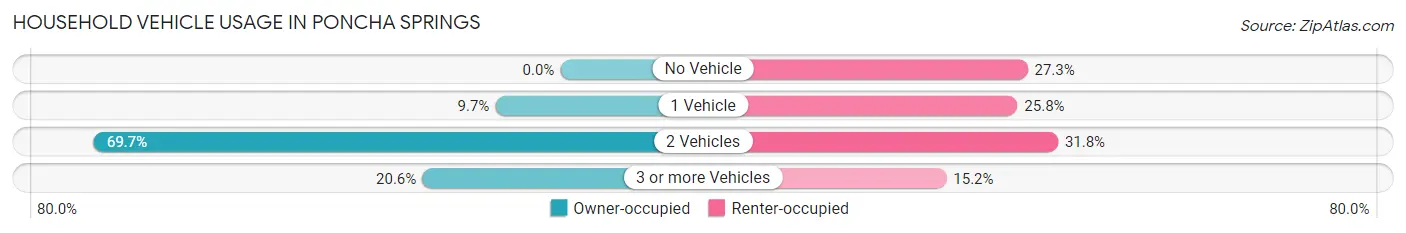
| Vehicles per Household | Owner-occupied | Renter-occupied |
| No Vehicle | 0 (0.0%) | 18 (27.3%) |
| 1 Vehicle | 40 (9.7%) | 17 (25.8%) |
| 2 Vehicles | 287 (69.7%) | 21 (31.8%) |
| 3 or more Vehicles | 85 (20.6%) | 10 (15.1%) |
| Total | 412 (100.0%) | 66 (100.0%) |
Real Estate & Mortgages in Poncha Springs
Real Estate and Mortgage Overview in Poncha Springs
| Characteristic | Without Mortgage | With Mortgage |
| Housing Units | 84 | 328 |
| Median Property Value | - | - |
| Median Household Income | $60,000 | $29 |
| Monthly Housing Costs | $388 | $0 |
| Real Estate Taxes | - | - |
Property Value by Mortgage Status in Poncha Springs
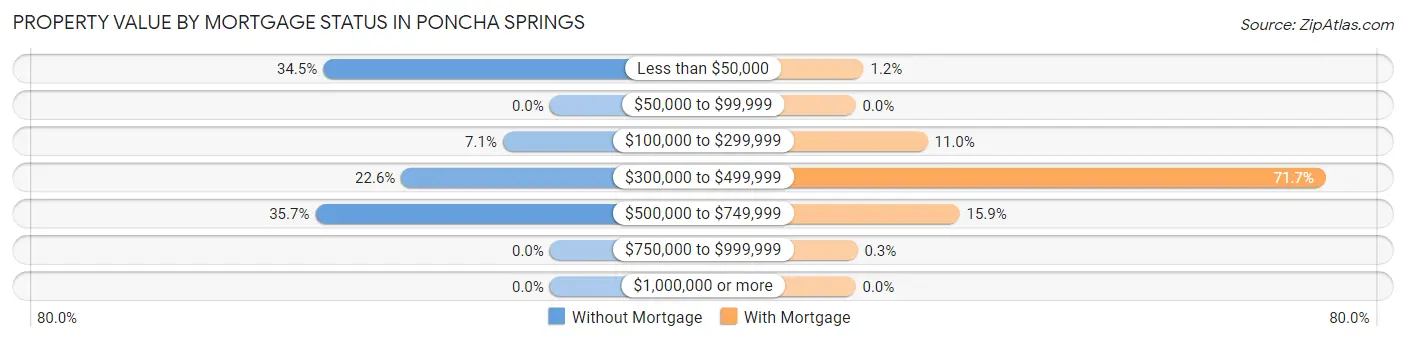
| Property Value | Without Mortgage | With Mortgage |
| Less than $50,000 | 29 (34.5%) | 4 (1.2%) |
| $50,000 to $99,999 | 0 (0.0%) | 0 (0.0%) |
| $100,000 to $299,999 | 6 (7.1%) | 36 (11.0%) |
| $300,000 to $499,999 | 19 (22.6%) | 235 (71.7%) |
| $500,000 to $749,999 | 30 (35.7%) | 52 (15.9%) |
| $750,000 to $999,999 | 0 (0.0%) | 1 (0.3%) |
| $1,000,000 or more | 0 (0.0%) | 0 (0.0%) |
| Total | 84 (100.0%) | 328 (100.0%) |
Household Income by Mortgage Status in Poncha Springs
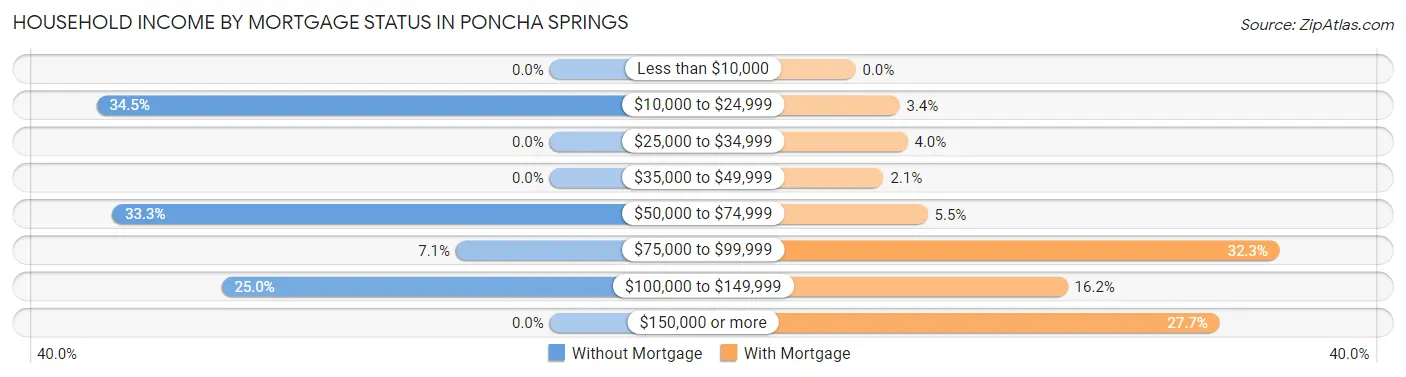
| Household Income | Without Mortgage | With Mortgage |
| Less than $10,000 | 0 (0.0%) | 0 (0.0%) |
| $10,000 to $24,999 | 29 (34.5%) | 11 (3.4%) |
| $25,000 to $34,999 | 0 (0.0%) | 13 (4.0%) |
| $35,000 to $49,999 | 0 (0.0%) | 7 (2.1%) |
| $50,000 to $74,999 | 28 (33.3%) | 18 (5.5%) |
| $75,000 to $99,999 | 6 (7.1%) | 106 (32.3%) |
| $100,000 to $149,999 | 21 (25.0%) | 53 (16.2%) |
| $150,000 or more | 0 (0.0%) | 91 (27.7%) |
| Total | 84 (100.0%) | 328 (100.0%) |
Property Value to Household Income Ratio in Poncha Springs
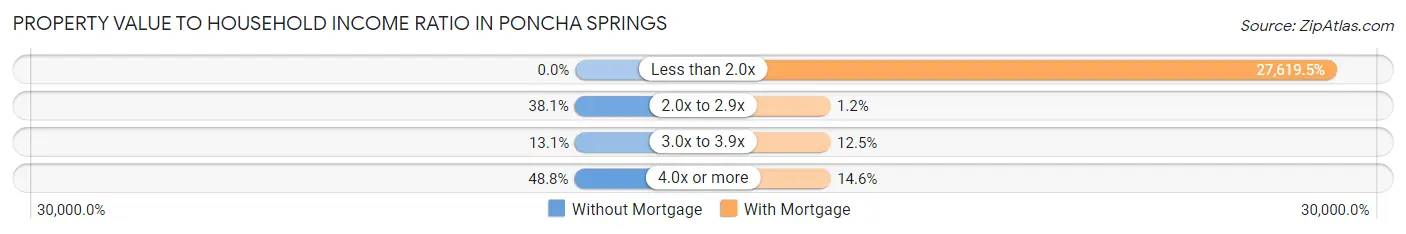
| Value-to-Income Ratio | Without Mortgage | With Mortgage |
| Less than 2.0x | 0 (0.0%) | 90,592 (27,619.5%) |
| 2.0x to 2.9x | 32 (38.1%) | 4 (1.2%) |
| 3.0x to 3.9x | 11 (13.1%) | 41 (12.5%) |
| 4.0x or more | 41 (48.8%) | 48 (14.6%) |
| Total | 84 (100.0%) | 328 (100.0%) |
Real Estate Taxes by Mortgage Status in Poncha Springs
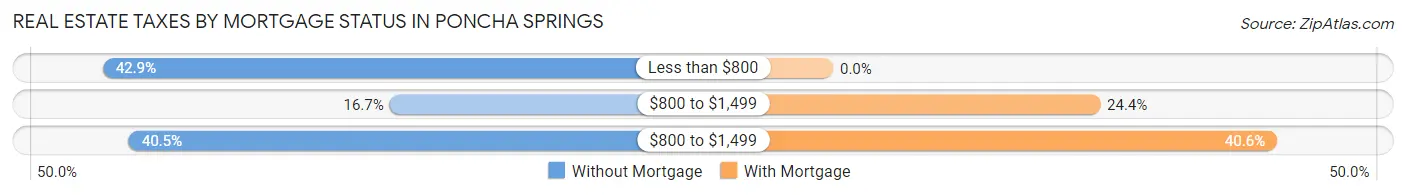
| Property Taxes | Without Mortgage | With Mortgage |
| Less than $800 | 36 (42.9%) | 0 (0.0%) |
| $800 to $1,499 | 14 (16.7%) | 80 (24.4%) |
| $800 to $1,499 | 34 (40.5%) | 133 (40.6%) |
| Total | 84 (100.0%) | 328 (100.0%) |
Health & Disability in Poncha Springs
Health Insurance Coverage by Age in Poncha Springs
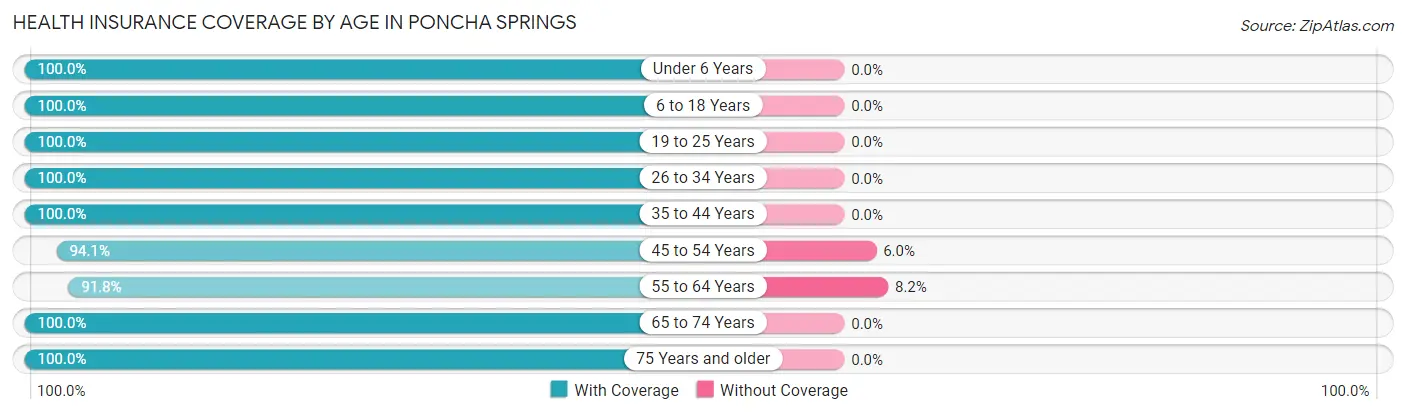
| Age Bracket | With Coverage | Without Coverage |
| Under 6 Years | 66 (100.0%) | 0 (0.0%) |
| 6 to 18 Years | 77 (100.0%) | 0 (0.0%) |
| 19 to 25 Years | 13 (100.0%) | 0 (0.0%) |
| 26 to 34 Years | 68 (100.0%) | 0 (0.0%) |
| 35 to 44 Years | 153 (100.0%) | 0 (0.0%) |
| 45 to 54 Years | 158 (94.1%) | 10 (5.9%) |
| 55 to 64 Years | 135 (91.8%) | 12 (8.2%) |
| 65 to 74 Years | 146 (100.0%) | 0 (0.0%) |
| 75 Years and older | 29 (100.0%) | 0 (0.0%) |
| Total | 845 (97.5%) | 22 (2.5%) |
Health Insurance Coverage by Citizenship Status in Poncha Springs
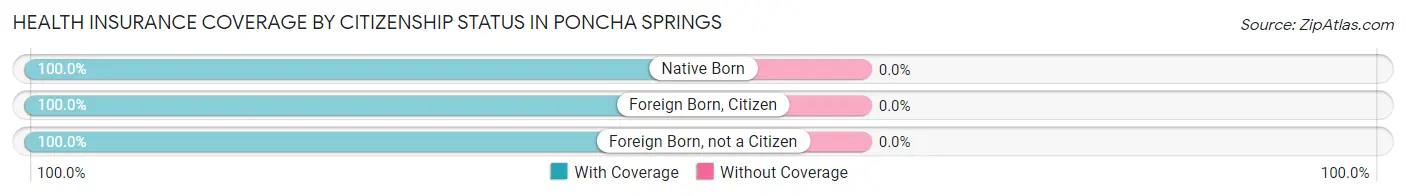
| Citizenship Status | With Coverage | Without Coverage |
| Native Born | 66 (100.0%) | 0 (0.0%) |
| Foreign Born, Citizen | 77 (100.0%) | 0 (0.0%) |
| Foreign Born, not a Citizen | 13 (100.0%) | 0 (0.0%) |
Health Insurance Coverage by Household Income in Poncha Springs
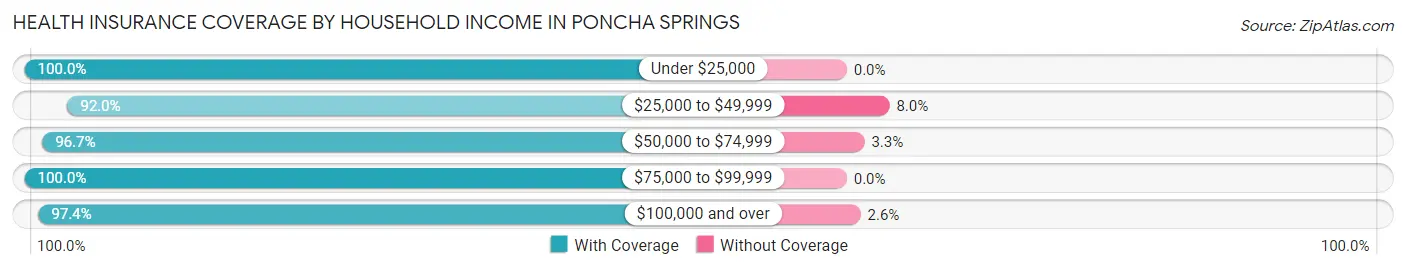
| Household Income | With Coverage | Without Coverage |
| Under $25,000 | 141 (100.0%) | 0 (0.0%) |
| $25,000 to $49,999 | 69 (92.0%) | 6 (8.0%) |
| $50,000 to $74,999 | 175 (96.7%) | 6 (3.3%) |
| $75,000 to $99,999 | 83 (100.0%) | 0 (0.0%) |
| $100,000 and over | 377 (97.4%) | 10 (2.6%) |
Public vs Private Health Insurance Coverage by Age in Poncha Springs
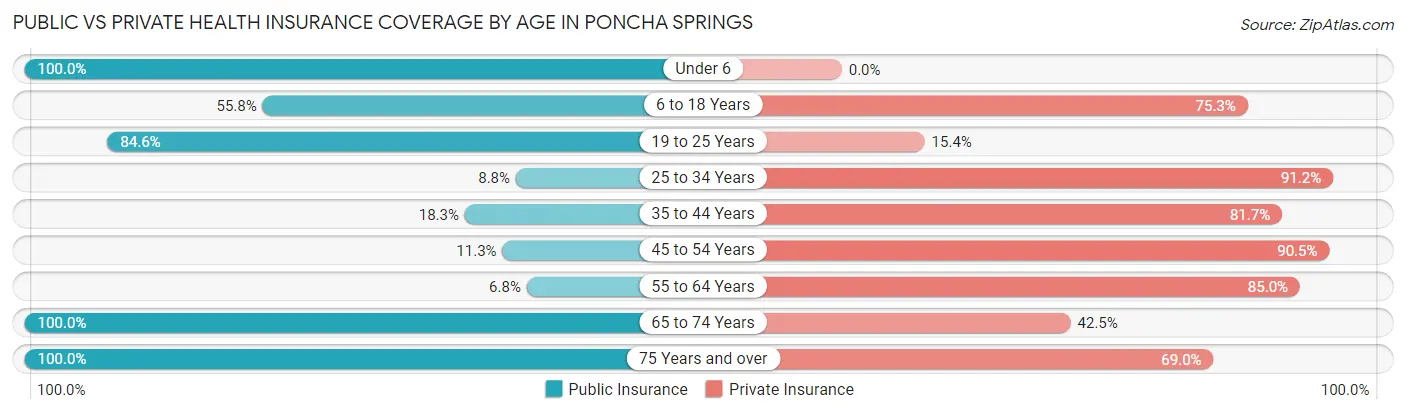
| Age Bracket | Public Insurance | Private Insurance |
| Under 6 | 66 (100.0%) | 0 (0.0%) |
| 6 to 18 Years | 43 (55.8%) | 58 (75.3%) |
| 19 to 25 Years | 11 (84.6%) | 2 (15.4%) |
| 25 to 34 Years | 6 (8.8%) | 62 (91.2%) |
| 35 to 44 Years | 28 (18.3%) | 125 (81.7%) |
| 45 to 54 Years | 19 (11.3%) | 152 (90.5%) |
| 55 to 64 Years | 10 (6.8%) | 125 (85.0%) |
| 65 to 74 Years | 146 (100.0%) | 62 (42.5%) |
| 75 Years and over | 29 (100.0%) | 20 (69.0%) |
| Total | 358 (41.3%) | 606 (69.9%) |
Disability Status by Sex by Age in Poncha Springs
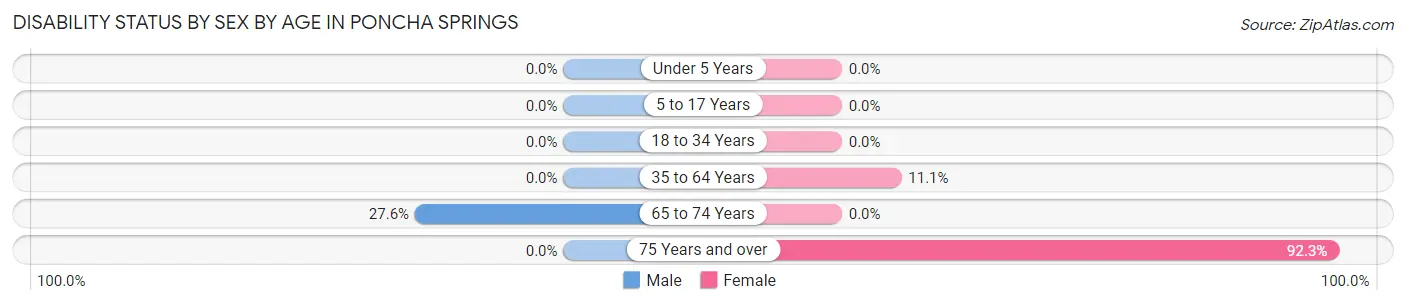
| Age Bracket | Male | Female |
| Under 5 Years | 0 (0.0%) | 0 (0.0%) |
| 5 to 17 Years | 0 (0.0%) | 0 (0.0%) |
| 18 to 34 Years | 0 (0.0%) | 0 (0.0%) |
| 35 to 64 Years | 0 (0.0%) | 26 (11.1%) |
| 65 to 74 Years | 27 (27.6%) | 0 (0.0%) |
| 75 Years and over | 0 (0.0%) | 12 (92.3%) |
Disability Class by Sex by Age in Poncha Springs
Disability Class: Hearing Difficulty
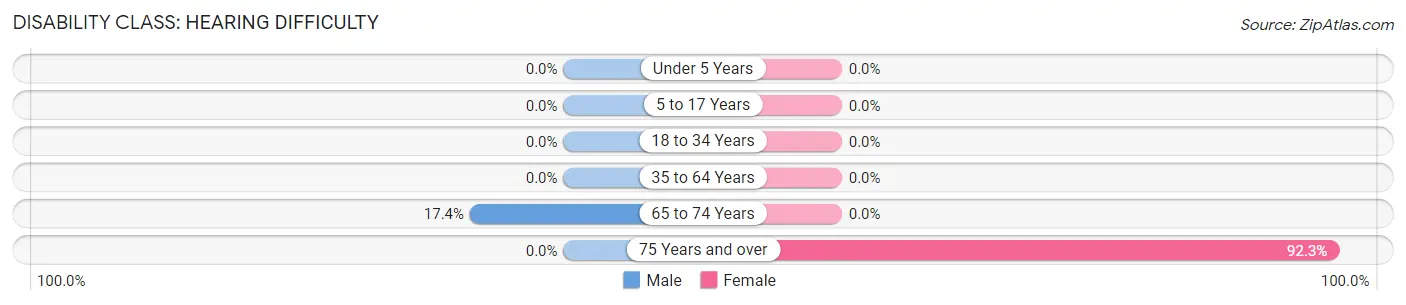
| Age Bracket | Male | Female |
| Under 5 Years | 0 (0.0%) | 0 (0.0%) |
| 5 to 17 Years | 0 (0.0%) | 0 (0.0%) |
| 18 to 34 Years | 0 (0.0%) | 0 (0.0%) |
| 35 to 64 Years | 0 (0.0%) | 0 (0.0%) |
| 65 to 74 Years | 17 (17.3%) | 0 (0.0%) |
| 75 Years and over | 0 (0.0%) | 12 (92.3%) |
Disability Class: Vision Difficulty
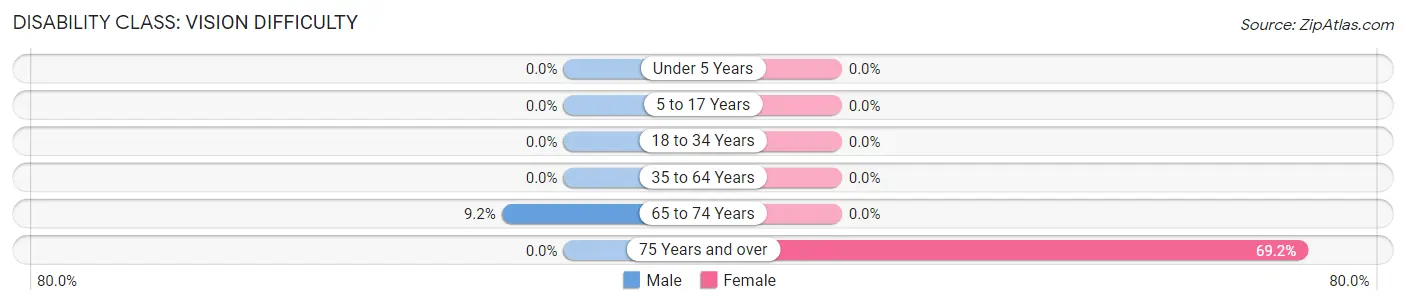
| Age Bracket | Male | Female |
| Under 5 Years | 0 (0.0%) | 0 (0.0%) |
| 5 to 17 Years | 0 (0.0%) | 0 (0.0%) |
| 18 to 34 Years | 0 (0.0%) | 0 (0.0%) |
| 35 to 64 Years | 0 (0.0%) | 0 (0.0%) |
| 65 to 74 Years | 9 (9.2%) | 0 (0.0%) |
| 75 Years and over | 0 (0.0%) | 9 (69.2%) |
Disability Class: Cognitive Difficulty
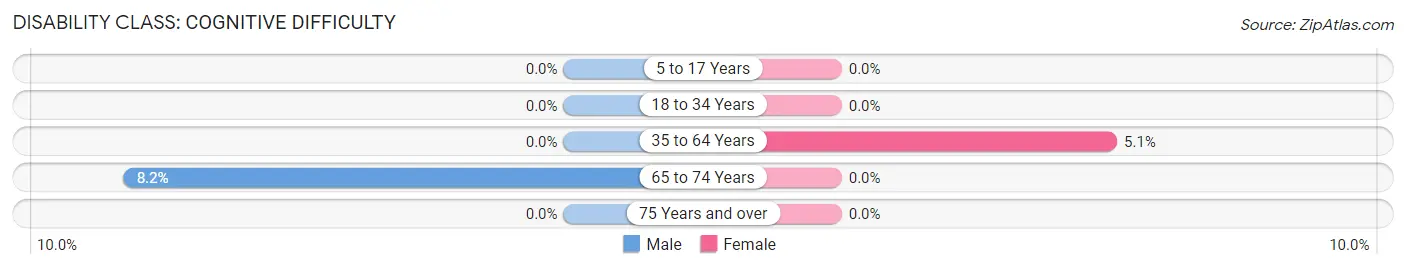
| Age Bracket | Male | Female |
| 5 to 17 Years | 0 (0.0%) | 0 (0.0%) |
| 18 to 34 Years | 0 (0.0%) | 0 (0.0%) |
| 35 to 64 Years | 0 (0.0%) | 12 (5.1%) |
| 65 to 74 Years | 8 (8.2%) | 0 (0.0%) |
| 75 Years and over | 0 (0.0%) | 0 (0.0%) |
Disability Class: Ambulatory Difficulty
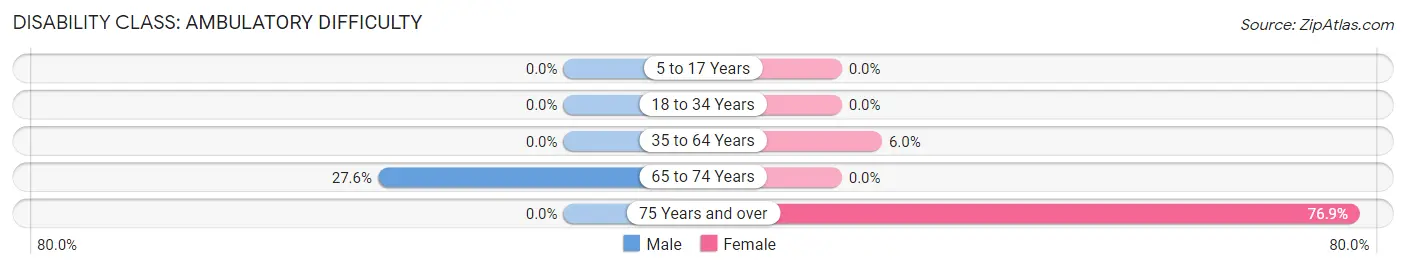
| Age Bracket | Male | Female |
| 5 to 17 Years | 0 (0.0%) | 0 (0.0%) |
| 18 to 34 Years | 0 (0.0%) | 0 (0.0%) |
| 35 to 64 Years | 0 (0.0%) | 14 (6.0%) |
| 65 to 74 Years | 27 (27.6%) | 0 (0.0%) |
| 75 Years and over | 0 (0.0%) | 10 (76.9%) |
Disability Class: Self-Care Difficulty
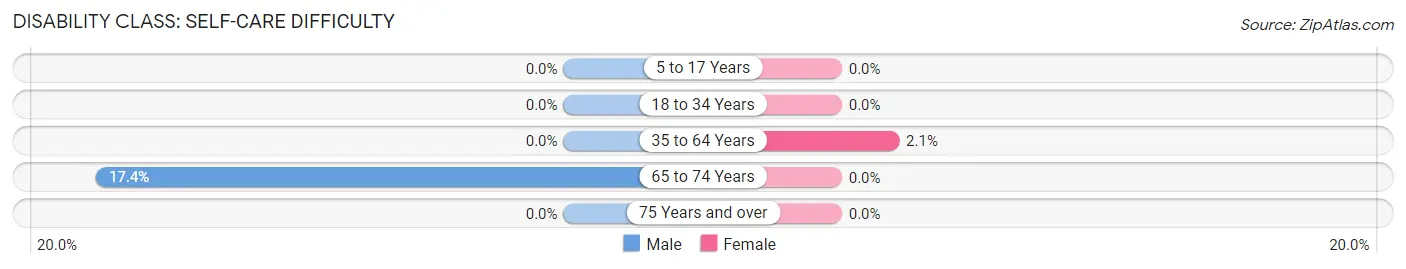
| Age Bracket | Male | Female |
| 5 to 17 Years | 0 (0.0%) | 0 (0.0%) |
| 18 to 34 Years | 0 (0.0%) | 0 (0.0%) |
| 35 to 64 Years | 0 (0.0%) | 5 (2.1%) |
| 65 to 74 Years | 17 (17.3%) | 0 (0.0%) |
| 75 Years and over | 0 (0.0%) | 0 (0.0%) |
Technology Access in Poncha Springs
Computing Device Access in Poncha Springs
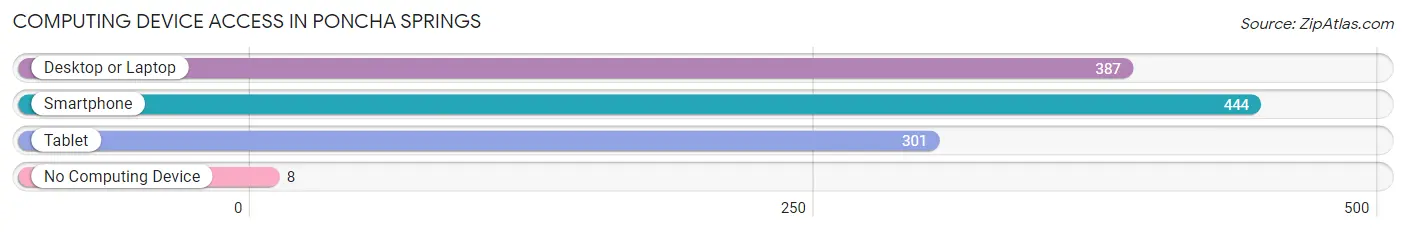
| Device Type | # Households | % Households |
| Desktop or Laptop | 387 | 81.0% |
| Smartphone | 444 | 92.9% |
| Tablet | 301 | 63.0% |
| No Computing Device | 8 | 1.7% |
| Total | 478 | 100.0% |
Internet Access in Poncha Springs
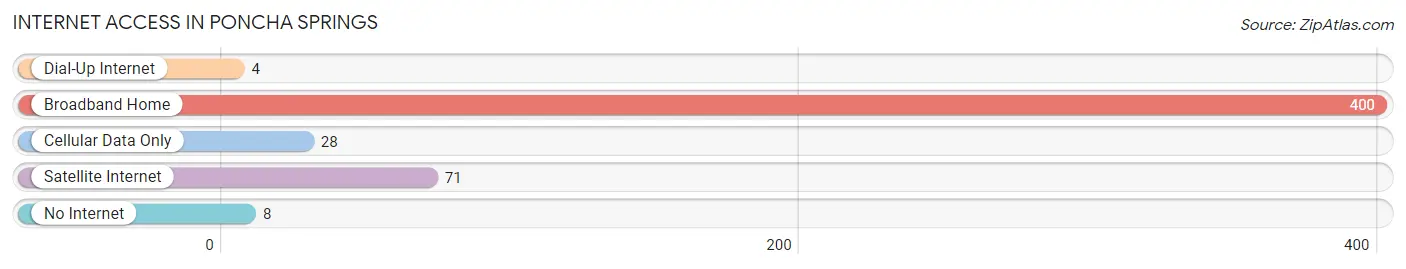
| Internet Type | # Households | % Households |
| Dial-Up Internet | 4 | 0.8% |
| Broadband Home | 400 | 83.7% |
| Cellular Data Only | 28 | 5.9% |
| Satellite Internet | 71 | 14.8% |
| No Internet | 8 | 1.7% |
| Total | 478 | 100.0% |
Poncha Springs Summary
Poncha Springs is a small town located in Chaffee County, Colorado, United States. It is situated in the Upper Arkansas River Valley, at the base of the Sangre de Cristo Mountains. The town is located along U.S. Highway 285, approximately 20 miles south of Salida and 40 miles north of Alamosa. The population of Poncha Springs was 645 at the 2010 census.
History
The area around Poncha Springs has been inhabited for thousands of years. The Ute Indians were the first known inhabitants of the area, and they used the hot springs for medicinal purposes. The town was founded in 1879 by a group of settlers from Kansas. The town was named after Chief Poncha, a Ute Indian chief who lived in the area.
The town quickly grew and became an important stop on the Denver and Rio Grande Railroad. The railroad brought in new settlers and businesses, and the town soon had a post office, a school, a hotel, and several stores.
In the early 1900s, the town was a popular destination for tourists who wanted to take advantage of the hot springs. The town was also known for its fruit orchards, which produced apples, peaches, and pears.
Geography
Poncha Springs is located in the Upper Arkansas River Valley, at the base of the Sangre de Cristo Mountains. The town is situated along U.S. Highway 285, approximately 20 miles south of Salida and 40 miles north of Alamosa.
The town is located at an elevation of 7,845 feet (2,392 m). The climate is semi-arid, with hot summers and cold winters. The average annual precipitation is 12.5 inches (318 mm).
Economy
The economy of Poncha Springs is largely based on tourism. The town is a popular destination for outdoor enthusiasts, who come to take advantage of the nearby mountains and rivers. The town is also home to several hot springs, which attract visitors from all over the world.
The town is also home to several businesses, including restaurants, hotels, and retail stores. The town is also home to several small manufacturing companies, which produce a variety of products, including furniture, clothing, and electronics.
Demographics
As of the 2010 census, the population of Poncha Springs was 645. The racial makeup of the town was 94.2% White, 0.2% African American, 0.9% Native American, 0.2% Asian, 0.2% Pacific Islander, 2.3% from other races, and 2.2% from two or more races. Hispanic or Latino of any race were 8.2% of the population.
The median income for a household in the town was $37,500, and the median income for a family was $41,250. The per capita income for the town was $19,845. About 11.2% of families and 14.2% of the population were below the poverty line, including 18.2% of those under age 18 and none of those age 65 or over.
Common Questions
What is Per Capita Income in Poncha Springs?
Per Capita income in Poncha Springs is $45,730.
What is the Median Family Income in Poncha Springs?
Median Family Income in Poncha Springs is $97,813.
What is the Median Household income in Poncha Springs?
Median Household Income in Poncha Springs is $69,015.
What is Income or Wage Gap in Poncha Springs?
Income or Wage Gap in Poncha Springs is 49.9%.
Women in Poncha Springs earn 50.1 cents for every dollar earned by a man.
What is Inequality or Gini Index in Poncha Springs?
Inequality or Gini Index in Poncha Springs is 0.35.
What is the Total Population of Poncha Springs?
Total Population of Poncha Springs is 867.
What is the Total Male Population of Poncha Springs?
Total Male Population of Poncha Springs is 430.
What is the Total Female Population of Poncha Springs?
Total Female Population of Poncha Springs is 437.
What is the Ratio of Males per 100 Females in Poncha Springs?
There are 98.40 Males per 100 Females in Poncha Springs.
What is the Ratio of Females per 100 Males in Poncha Springs?
There are 101.63 Females per 100 Males in Poncha Springs.
What is the Median Population Age in Poncha Springs?
Median Population Age in Poncha Springs is 51.3 Years.
What is the Average Family Size in Poncha Springs
Average Family Size in Poncha Springs is 2.4 People.
What is the Average Household Size in Poncha Springs
Average Household Size in Poncha Springs is 1.8 People.
How Large is the Labor Force in Poncha Springs?
There are 574 People in the Labor Forcein in Poncha Springs.
What is the Percentage of People in the Labor Force in Poncha Springs?
74.9% of People are in the Labor Force in Poncha Springs.