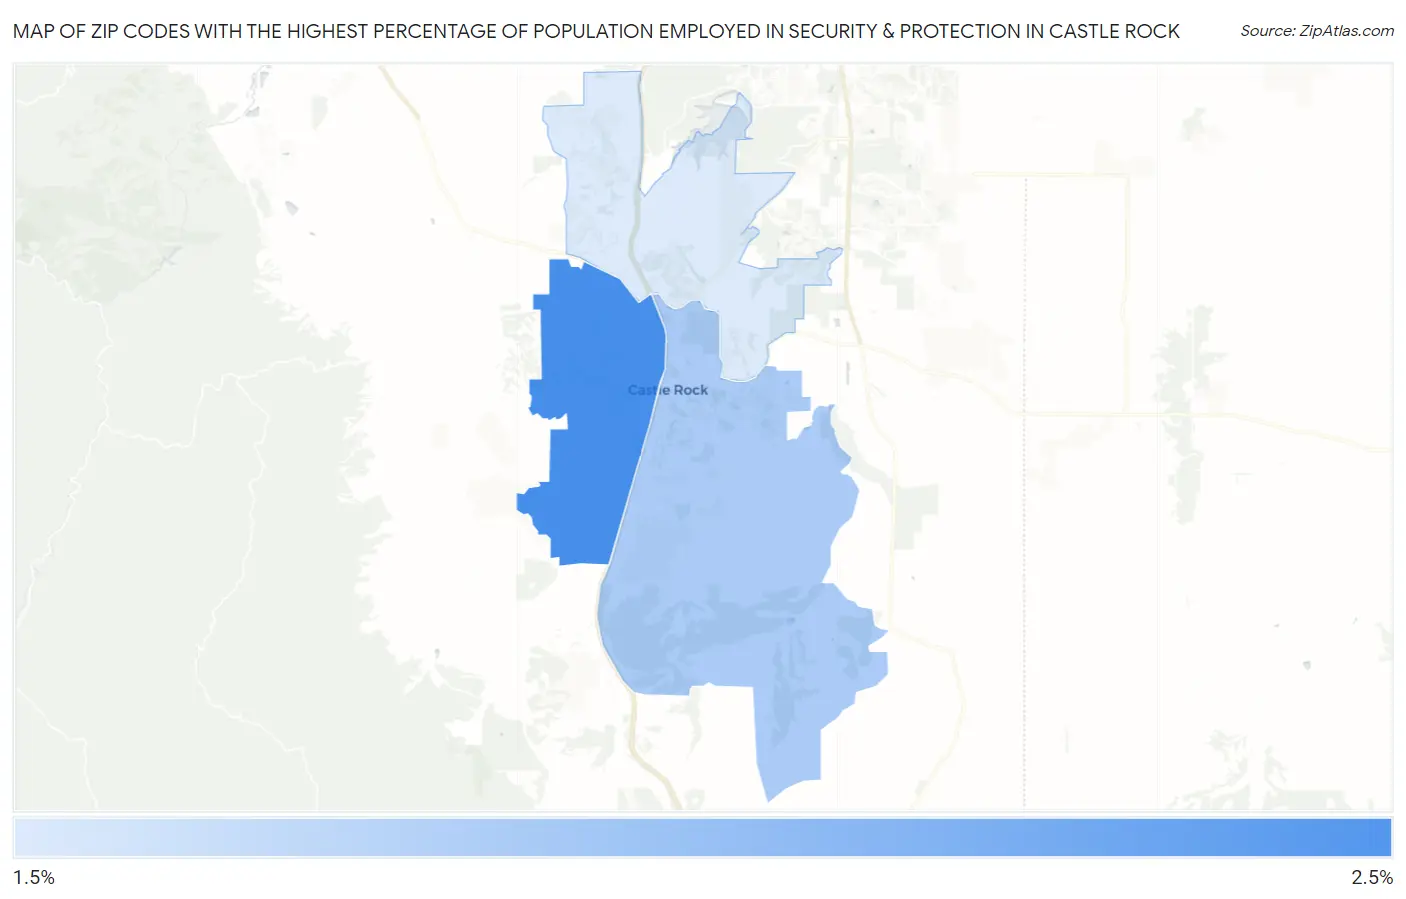
Zip Codes with the Highest Percentage of Population Employed in Security & Protection in Castle Rock, CO
RELATED REPORTS & OPTIONS
Security & Protection
Castle Rock
Compare Zip Codes
Map of Zip Codes with the Highest Percentage of Population Employed in Security & Protection in Castle Rock
1.8%
2.3%
Zip Codes with the Highest Percentage of Population Employed in Security & Protection in Castle Rock, CO
| Zip Code | % Employed | vs State | vs National | |
| 1. | 80109 | 2.3% | 2.0%(+0.333)#161 | 2.1%(+0.189)#10,413 |
| 2. | 80104 | 2.0% | 2.0%(+0.003)#199 | 2.1%(-0.141)#12,507 |
| 3. | 80108 | 1.8% | 2.0%(-0.165)#214 | 2.1%(-0.308)#13,641 |
1
Common Questions
What are the Top Zip Codes with the Highest Percentage of Population Employed in Security & Protection in Castle Rock, CO?
Top Zip Codes with the Highest Percentage of Population Employed in Security & Protection in Castle Rock, CO are:
What zip code has the Highest Percentage of Population Employed in Security & Protection in Castle Rock, CO?
80109 has the Highest Percentage of Population Employed in Security & Protection in Castle Rock, CO with 2.3%.
What is the Percentage of Population Employed in Security & Protection in Castle Rock, CO?
Percentage of Population Employed in Security & Protection in Castle Rock is 2.2%.
What is the Percentage of Population Employed in Security & Protection in Colorado?
Percentage of Population Employed in Security & Protection in Colorado is 2.0%.
What is the Percentage of Population Employed in Security & Protection in the United States?
Percentage of Population Employed in Security & Protection in the United States is 2.1%.