Zip Codes with the Highest Percentage of Population Employed in Security & Protection in Broomfield, CO
RELATED REPORTS & OPTIONS
Security & Protection
Broomfield
Compare Zip Codes
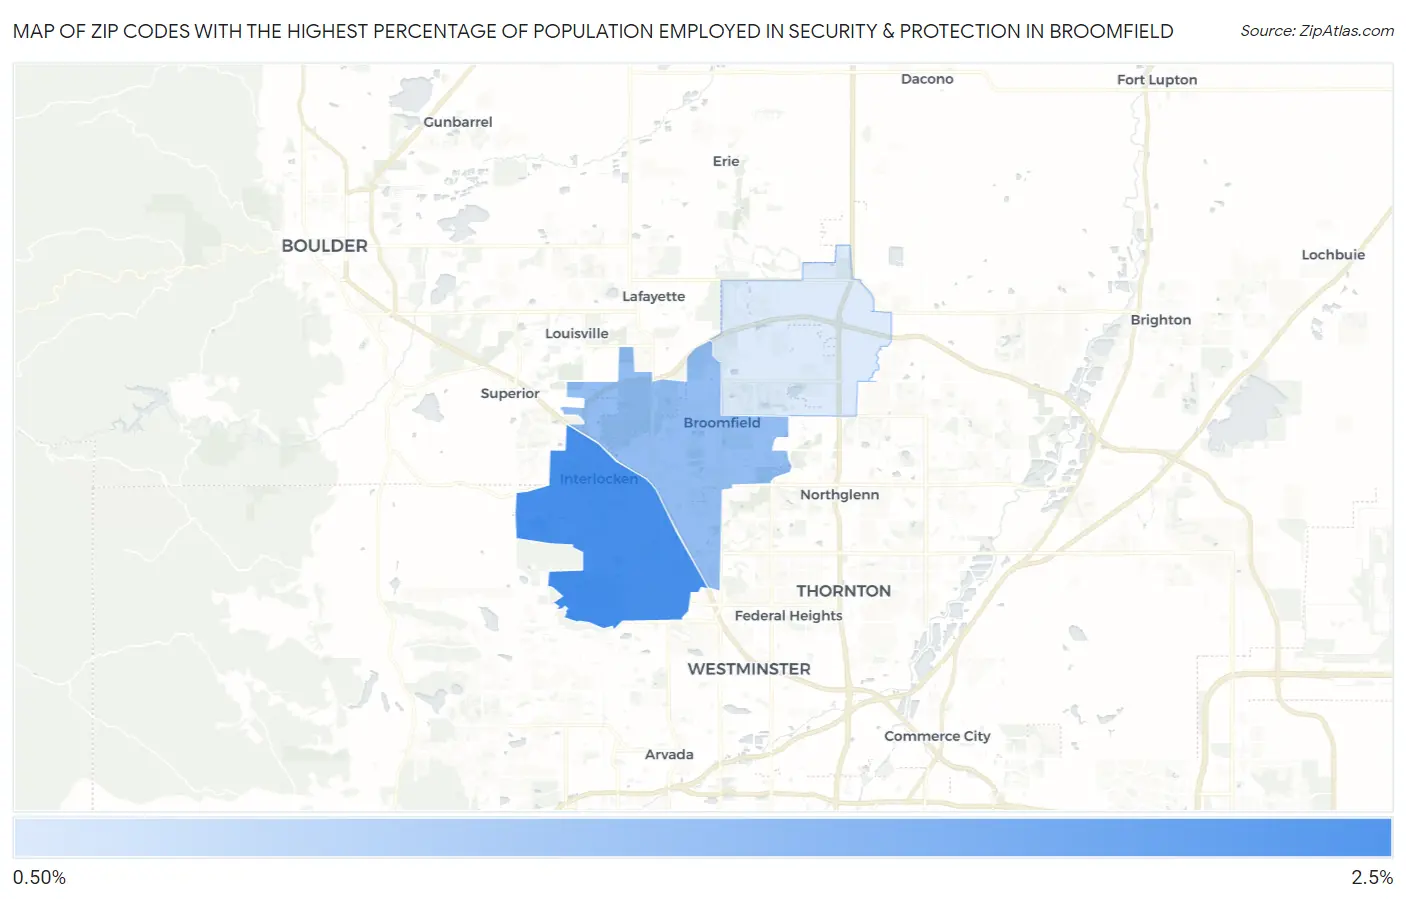
Map of Zip Codes with the Highest Percentage of Population Employed in Security & Protection in Broomfield
1.3%
2.4%
Zip Codes with the Highest Percentage of Population Employed in Security & Protection in Broomfield, CO
| Zip Code | % Employed | vs State | vs National | |
| 1. | 80021 | 2.4% | 2.0%(+0.377)#158 | 2.1%(+0.234)#10,144 |
| 2. | 80020 | 1.8% | 2.0%(-0.172)#215 | 2.1%(-0.315)#13,692 |
| 3. | 80023 | 1.3% | 2.0%(-0.713)#289 | 2.1%(-0.857)#17,813 |
1
Common Questions
What are the Top Zip Codes with the Highest Percentage of Population Employed in Security & Protection in Broomfield, CO?
Top Zip Codes with the Highest Percentage of Population Employed in Security & Protection in Broomfield, CO are:
What zip code has the Highest Percentage of Population Employed in Security & Protection in Broomfield, CO?
80021 has the Highest Percentage of Population Employed in Security & Protection in Broomfield, CO with 2.4%.
What is the Percentage of Population Employed in Security & Protection in Broomfield, CO?
Percentage of Population Employed in Security & Protection in Broomfield is 1.5%.
What is the Percentage of Population Employed in Security & Protection in Colorado?
Percentage of Population Employed in Security & Protection in Colorado is 2.0%.
What is the Percentage of Population Employed in Security & Protection in the United States?
Percentage of Population Employed in Security & Protection in the United States is 2.1%.