La Jara, CO Map & Demographics
La Jara Map
La Jara Overview
$23,686
PER CAPITA INCOME
$42,381
AVG FAMILY INCOME
$43,333
AVG HOUSEHOLD INCOME
19.5%
WAGE / INCOME GAP [ % ]
80.5¢/ $1
WAGE / INCOME GAP [ $ ]
0.41
INEQUALITY / GINI INDEX
669
TOTAL POPULATION
302
MALE POPULATION
367
FEMALE POPULATION
82.29
MALES / 100 FEMALES
121.52
FEMALES / 100 MALES
34.4
MEDIAN AGE
3.2
AVG FAMILY SIZE
2.4
AVG HOUSEHOLD SIZE
284
LABOR FORCE [ PEOPLE ]
60.7%
PERCENT IN LABOR FORCE
15.1%
UNEMPLOYMENT RATE
La Jara Zip Codes
La Jara Area Codes
Income in La Jara
Income Overview in La Jara
Per Capita Income in La Jara is $23,686, while median incomes of families and households are $42,381 and $43,333 respectively.
| Characteristic | Number | Measure |
| Per Capita Income | 669 | $23,686 |
| Median Family Income | 162 | $42,381 |
| Mean Family Income | 162 | $58,625 |
| Median Household Income | 268 | $43,333 |
| Mean Household Income | 268 | $58,189 |
| Income Deficit | 162 | $0 |
| Wage / Income Gap (%) | 669 | 19.48% |
| Wage / Income Gap ($) | 669 | 80.52¢ per $1 |
| Gini / Inequality Index | 669 | 0.41 |
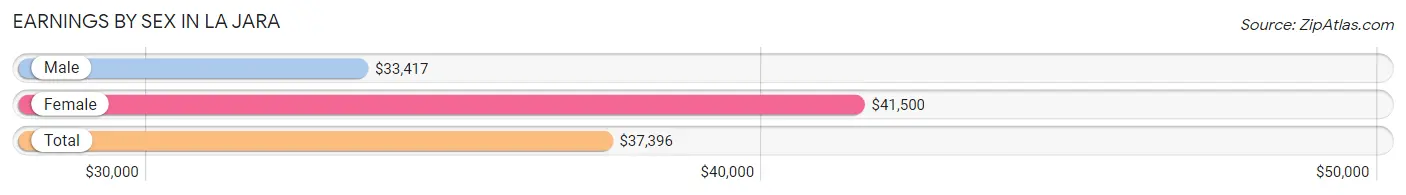
Earnings by Sex in La Jara
Average Earnings in La Jara are $37,396, $33,417 for men and $41,500 for women, a difference of 19.5%.
| Sex | Number | Average Earnings |
| Male | 125 (43.9%) | $33,417 |
| Female | 160 (56.1%) | $41,500 |
| Total | 285 (100.0%) | $37,396 |
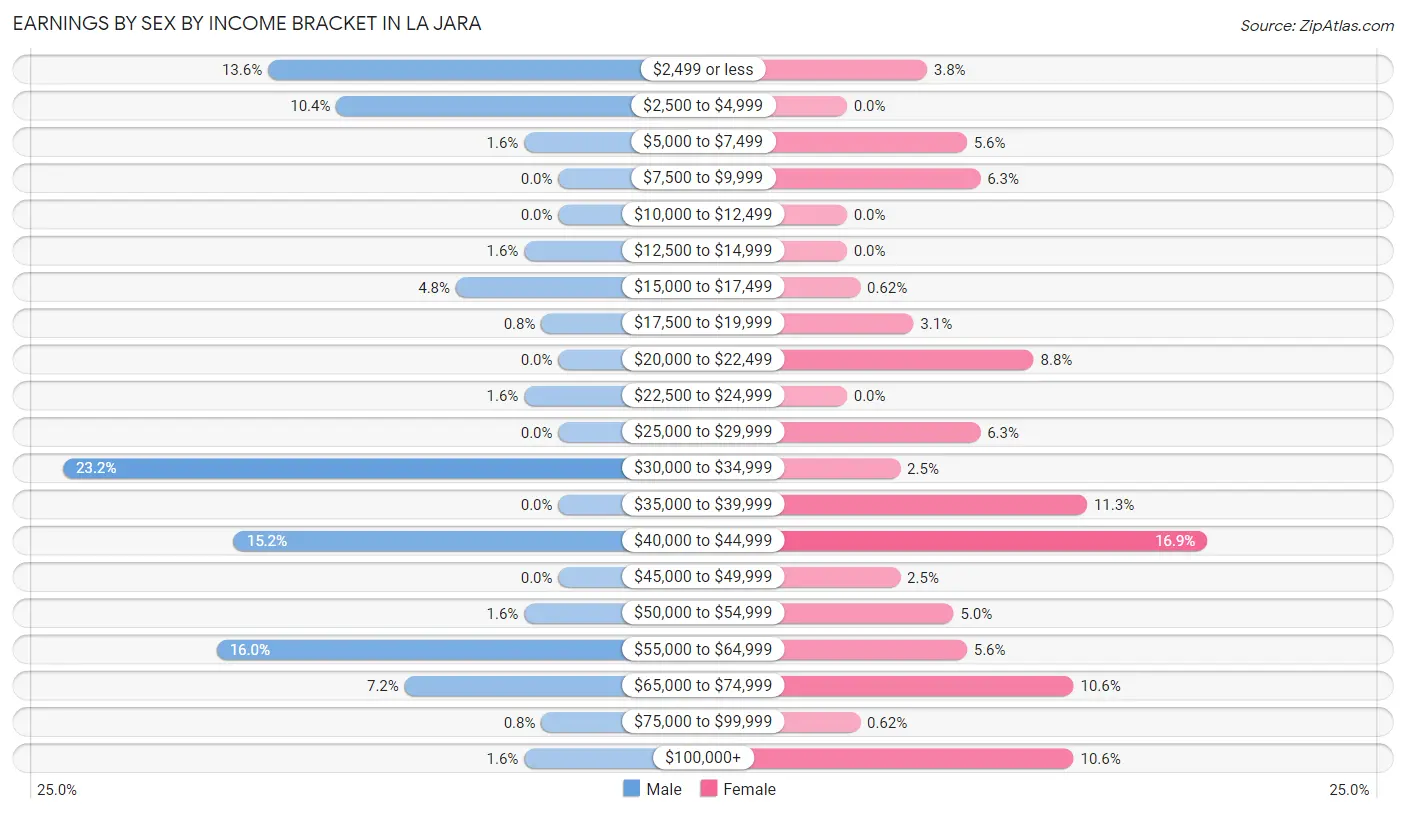
Earnings by Sex by Income Bracket in La Jara
The most common earnings brackets in La Jara are $30,000 to $34,999 for men (29 | 23.2%) and $40,000 to $44,999 for women (27 | 16.9%).
| Income | Male | Female |
| $2,499 or less | 17 (13.6%) | 6 (3.7%) |
| $2,500 to $4,999 | 13 (10.4%) | 0 (0.0%) |
| $5,000 to $7,499 | 2 (1.6%) | 9 (5.6%) |
| $7,500 to $9,999 | 0 (0.0%) | 10 (6.2%) |
| $10,000 to $12,499 | 0 (0.0%) | 0 (0.0%) |
| $12,500 to $14,999 | 2 (1.6%) | 0 (0.0%) |
| $15,000 to $17,499 | 6 (4.8%) | 1 (0.6%) |
| $17,500 to $19,999 | 1 (0.8%) | 5 (3.1%) |
| $20,000 to $22,499 | 0 (0.0%) | 14 (8.7%) |
| $22,500 to $24,999 | 2 (1.6%) | 0 (0.0%) |
| $25,000 to $29,999 | 0 (0.0%) | 10 (6.2%) |
| $30,000 to $34,999 | 29 (23.2%) | 4 (2.5%) |
| $35,000 to $39,999 | 0 (0.0%) | 18 (11.3%) |
| $40,000 to $44,999 | 19 (15.2%) | 27 (16.9%) |
| $45,000 to $49,999 | 0 (0.0%) | 4 (2.5%) |
| $50,000 to $54,999 | 2 (1.6%) | 8 (5.0%) |
| $55,000 to $64,999 | 20 (16.0%) | 9 (5.6%) |
| $65,000 to $74,999 | 9 (7.2%) | 17 (10.6%) |
| $75,000 to $99,999 | 1 (0.8%) | 1 (0.6%) |
| $100,000+ | 2 (1.6%) | 17 (10.6%) |
| Total | 125 (100.0%) | 160 (100.0%) |
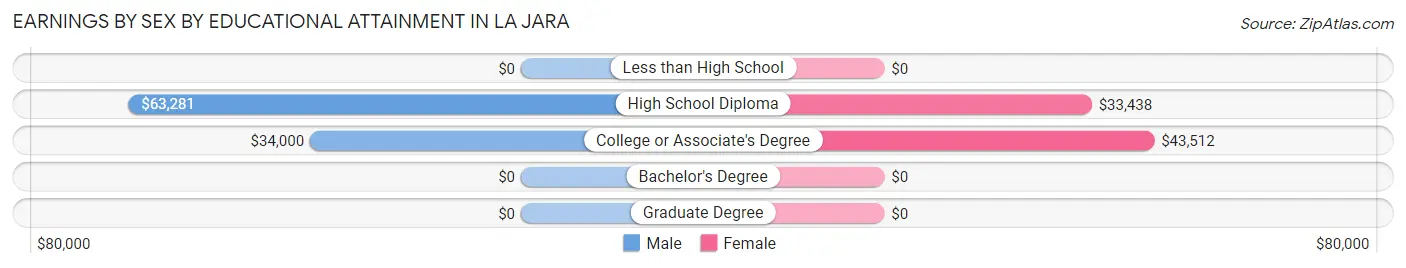
Earnings by Sex by Educational Attainment in La Jara
Average earnings in La Jara are $33,583 for men and $43,636 for women, a difference of 23.0%. Men with an educational attainment of high school diploma enjoy the highest average annual earnings of $63,281, while those with college or associate's degree education earn the least with $34,000. Women with an educational attainment of college or associate's degree earn the most with the average annual earnings of $43,512, while those with high school diploma education have the smallest earnings of $33,438.
| Educational Attainment | Male Income | Female Income |
| Less than High School | - | - |
| High School Diploma | $63,281 | $33,438 |
| College or Associate's Degree | $34,000 | $43,512 |
| Bachelor's Degree | - | - |
| Graduate Degree | - | - |
| Total | $33,583 | $43,636 |
Family Income in La Jara
Family Income Brackets in La Jara
According to the La Jara family income data, there are 30 families falling into the $35,000 to $49,999 income range, which is the most common income bracket and makes up 18.5% of all families. Conversely, the $200,000+ income bracket is the least frequent group with only 1 families (0.6%) belonging to this category.
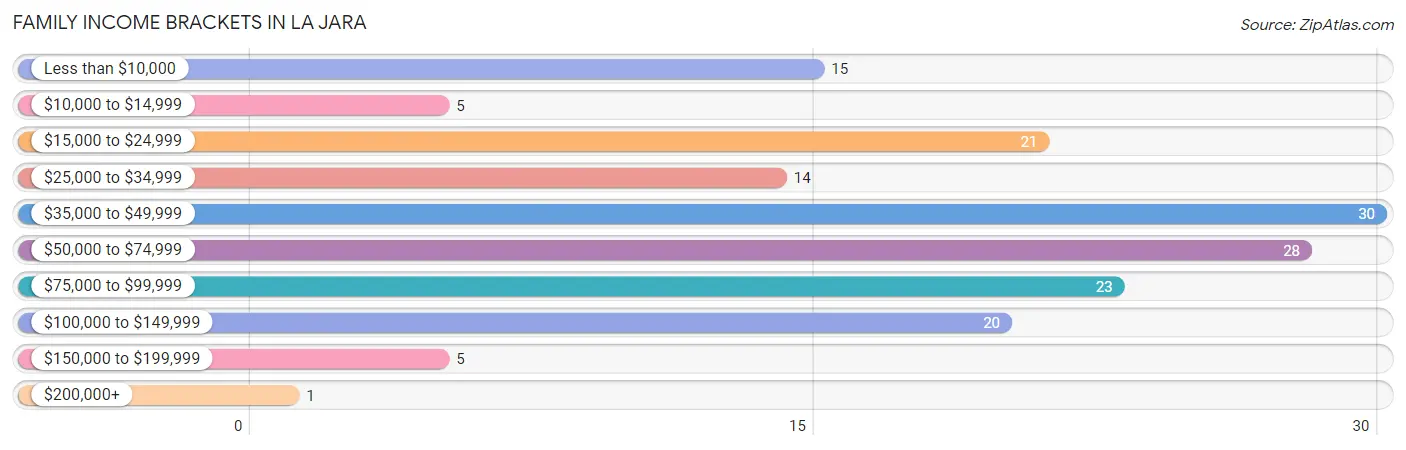
| Income Bracket | # Families | % Families |
| Less than $10,000 | 15 | 9.3% |
| $10,000 to $14,999 | 5 | 3.1% |
| $15,000 to $24,999 | 21 | 13.0% |
| $25,000 to $34,999 | 14 | 8.6% |
| $35,000 to $49,999 | 30 | 18.5% |
| $50,000 to $74,999 | 28 | 17.3% |
| $75,000 to $99,999 | 23 | 14.2% |
| $100,000 to $149,999 | 20 | 12.3% |
| $150,000 to $199,999 | 5 | 3.1% |
| $200,000+ | 1 | 0.6% |
Family Income by Famaliy Size in La Jara
3-person families (33 | 20.4%) account for the highest median family income in La Jara with $96,750 per family, while 3-person families (33 | 20.4%) have the highest median income of $32,250 per family member.
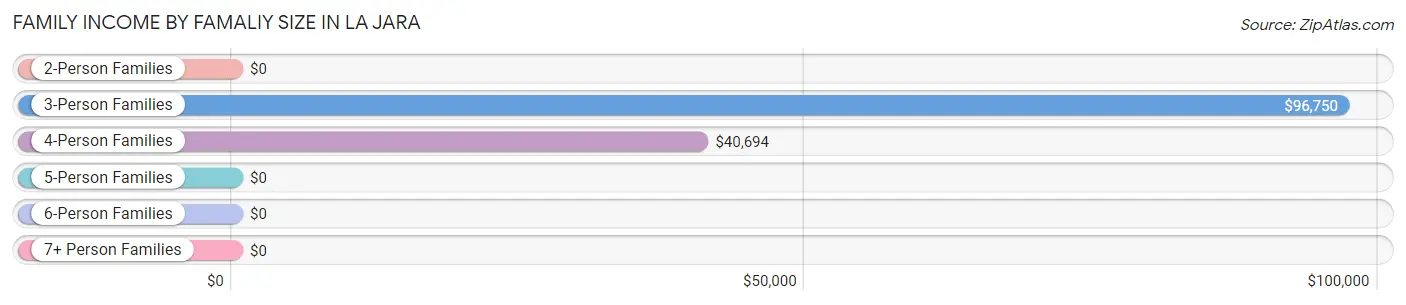
| Income Bracket | # Families | Median Income |
| 2-Person Families | 55 (34.0%) | $0 |
| 3-Person Families | 33 (20.4%) | $96,750 |
| 4-Person Families | 38 (23.5%) | $40,694 |
| 5-Person Families | 4 (2.5%) | $0 |
| 6-Person Families | 15 (9.3%) | $0 |
| 7+ Person Families | 17 (10.5%) | $0 |
| Total | 162 (100.0%) | $42,381 |
Family Income by Number of Earners in La Jara
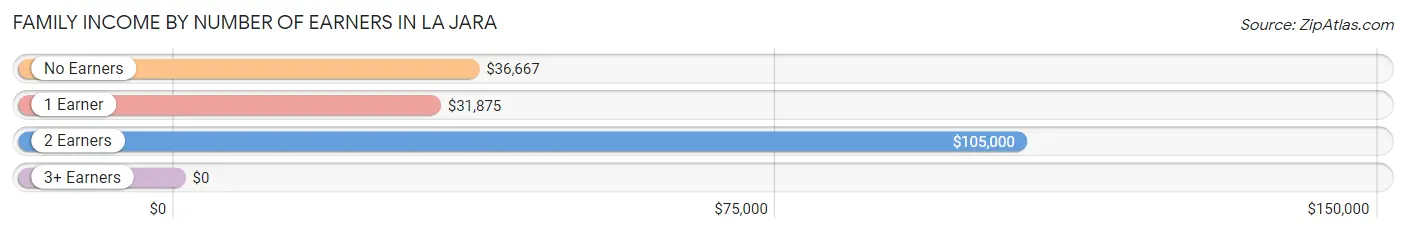
| Number of Earners | # Families | Median Income |
| No Earners | 14 (8.6%) | $36,667 |
| 1 Earner | 98 (60.5%) | $31,875 |
| 2 Earners | 42 (25.9%) | $105,000 |
| 3+ Earners | 8 (4.9%) | $0 |
| Total | 162 (100.0%) | $42,381 |
Household Income in La Jara
Household Income Brackets in La Jara
With 45 households falling in the category, the $25,000 to $34,999 income range is the most frequent in La Jara, accounting for 16.8% of all households. In contrast, only 1 households (0.4%) fall into the $200,000+ income bracket, making it the least populous group.
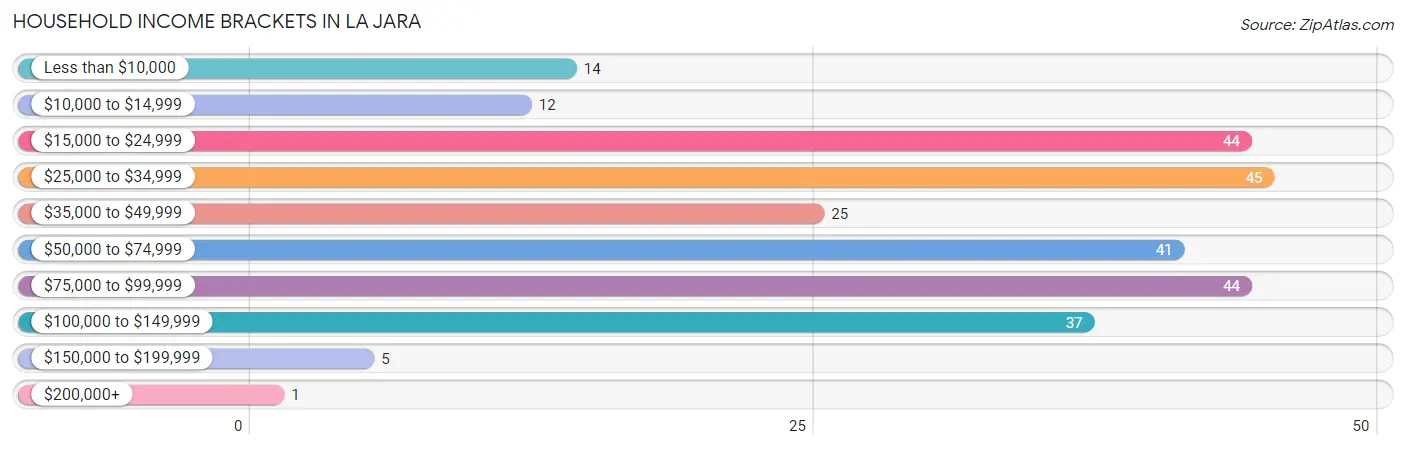
| Income Bracket | # Households | % Households |
| Less than $10,000 | 14 | 5.2% |
| $10,000 to $14,999 | 12 | 4.5% |
| $15,000 to $24,999 | 44 | 16.4% |
| $25,000 to $34,999 | 45 | 16.8% |
| $35,000 to $49,999 | 25 | 9.3% |
| $50,000 to $74,999 | 41 | 15.3% |
| $75,000 to $99,999 | 44 | 16.4% |
| $100,000 to $149,999 | 37 | 13.8% |
| $150,000 to $199,999 | 5 | 1.9% |
| $200,000+ | 1 | 0.4% |
Household Income by Householder Age in La Jara
The median household income in La Jara is $43,333, with the highest median household income of $85,000 found in the 45 to 64 years age bracket for the primary householder. A total of 102 households (38.1%) fall into this category. Meanwhile, the 15 to 24 years age bracket for the primary householder has the lowest median household income of $0, with 20 households (7.5%) in this group.
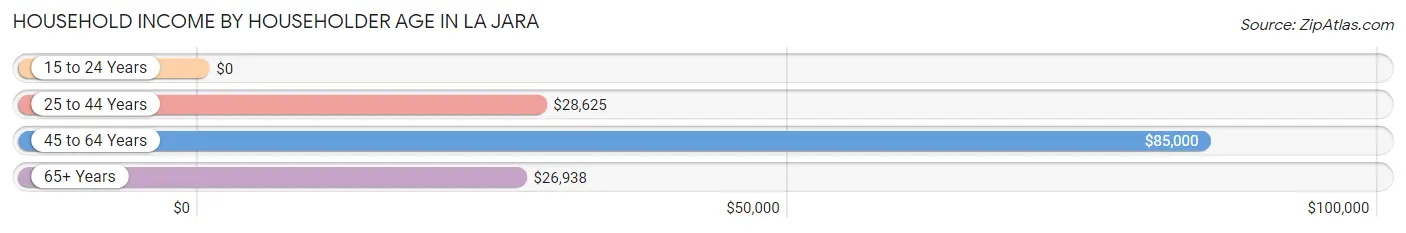
| Income Bracket | # Households | Median Income |
| 15 to 24 Years | 20 (7.5%) | $0 |
| 25 to 44 Years | 75 (28.0%) | $28,625 |
| 45 to 64 Years | 102 (38.1%) | $85,000 |
| 65+ Years | 71 (26.5%) | $26,938 |
| Total | 268 (100.0%) | $43,333 |
Poverty in La Jara
Income Below Poverty by Sex and Age in La Jara
With 24.2% poverty level for males and 25.9% for females among the residents of La Jara, 12 to 14 year old males and 5 year old females are the most vulnerable to poverty, with 12 males (75.0%) and 4 females (80.0%) in their respective age groups living below the poverty level.
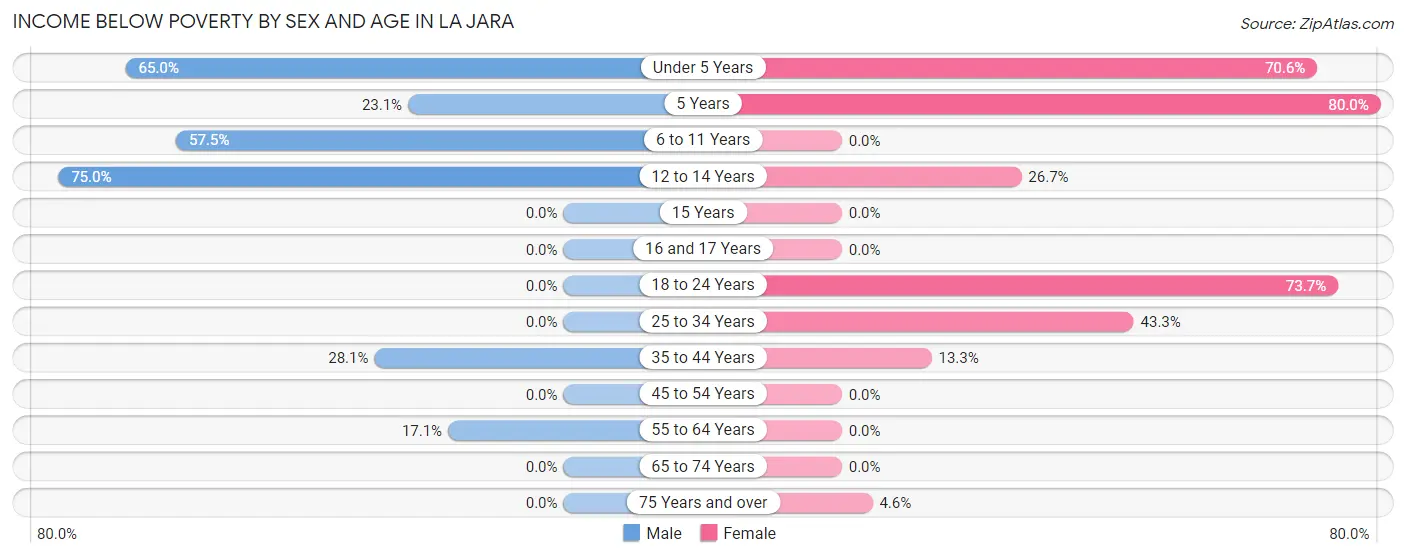
| Age Bracket | Male | Female |
| Under 5 Years | 13 (65.0%) | 24 (70.6%) |
| 5 Years | 3 (23.1%) | 4 (80.0%) |
| 6 to 11 Years | 23 (57.5%) | 0 (0.0%) |
| 12 to 14 Years | 12 (75.0%) | 8 (26.7%) |
| 15 Years | 0 (0.0%) | 0 (0.0%) |
| 16 and 17 Years | 0 (0.0%) | 0 (0.0%) |
| 18 to 24 Years | 0 (0.0%) | 28 (73.7%) |
| 25 to 34 Years | 0 (0.0%) | 26 (43.3%) |
| 35 to 44 Years | 16 (28.1%) | 4 (13.3%) |
| 45 to 54 Years | 0 (0.0%) | 0 (0.0%) |
| 55 to 64 Years | 6 (17.1%) | 0 (0.0%) |
| 65 to 74 Years | 0 (0.0%) | 0 (0.0%) |
| 75 Years and over | 0 (0.0%) | 1 (4.5%) |
| Total | 73 (24.2%) | 95 (25.9%) |
Income Above Poverty by Sex and Age in La Jara
According to the poverty statistics in La Jara, males aged 15 years and females aged 6 to 11 years are the age groups that are most secure financially, with 100.0% of males and 100.0% of females in these age groups living above the poverty line.
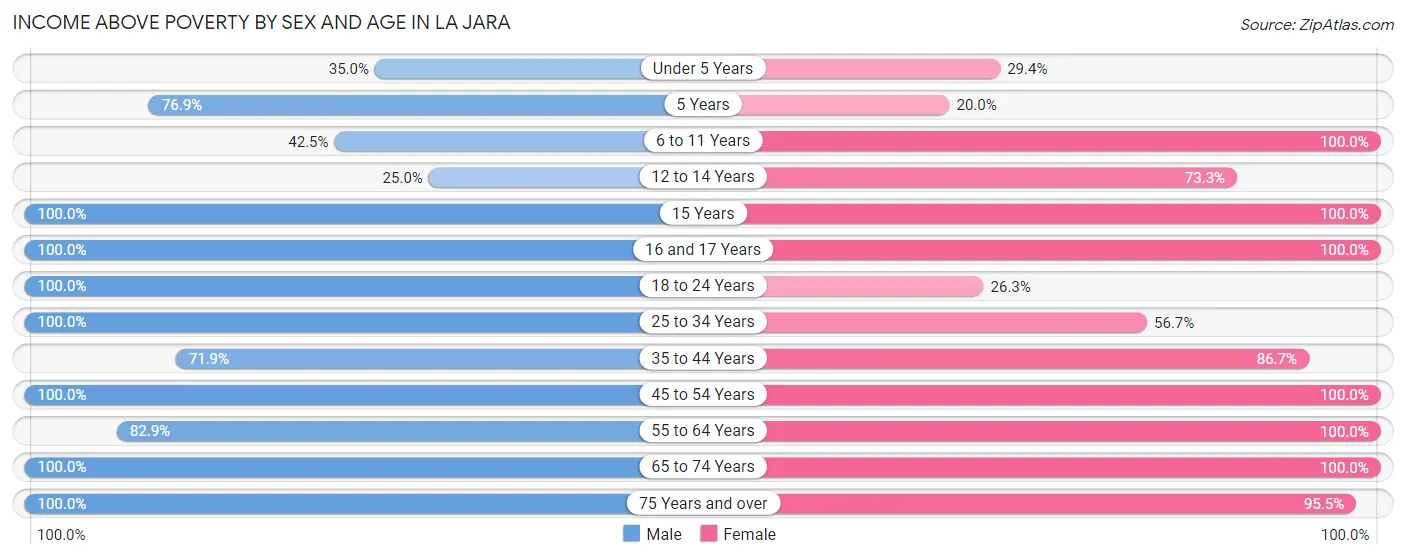
| Age Bracket | Male | Female |
| Under 5 Years | 7 (35.0%) | 10 (29.4%) |
| 5 Years | 10 (76.9%) | 1 (20.0%) |
| 6 to 11 Years | 17 (42.5%) | 26 (100.0%) |
| 12 to 14 Years | 4 (25.0%) | 22 (73.3%) |
| 15 Years | 4 (100.0%) | 13 (100.0%) |
| 16 and 17 Years | 13 (100.0%) | 1 (100.0%) |
| 18 to 24 Years | 20 (100.0%) | 10 (26.3%) |
| 25 to 34 Years | 6 (100.0%) | 34 (56.7%) |
| 35 to 44 Years | 41 (71.9%) | 26 (86.7%) |
| 45 to 54 Years | 21 (100.0%) | 42 (100.0%) |
| 55 to 64 Years | 29 (82.9%) | 41 (100.0%) |
| 65 to 74 Years | 44 (100.0%) | 25 (100.0%) |
| 75 Years and over | 13 (100.0%) | 21 (95.5%) |
| Total | 229 (75.8%) | 272 (74.1%) |
Income Below Poverty Among Married-Couple Families in La Jara
The poverty statistics for married-couple families in La Jara show that 11.6% or 11 of the total 95 families live below the poverty line. Families with 5 or more children have the highest poverty rate of 77.8%, comprising of 7 families. On the other hand, families with no children have the lowest poverty rate of 0.0%, which includes 0 families.
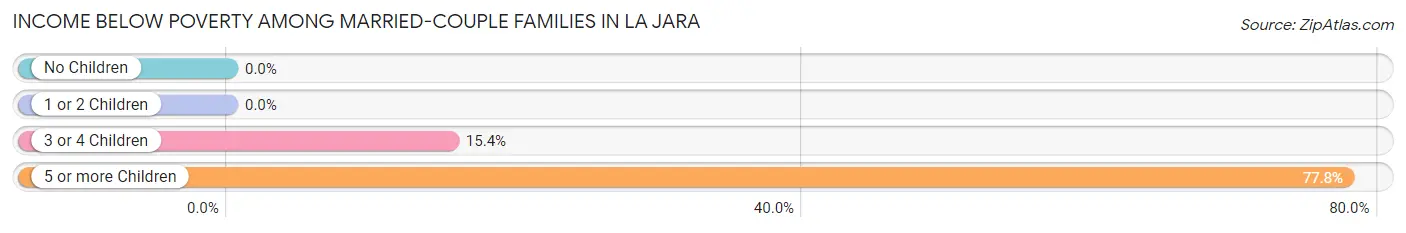
| Children | Above Poverty | Below Poverty |
| No Children | 46 (100.0%) | 0 (0.0%) |
| 1 or 2 Children | 14 (100.0%) | 0 (0.0%) |
| 3 or 4 Children | 22 (84.6%) | 4 (15.4%) |
| 5 or more Children | 2 (22.2%) | 7 (77.8%) |
| Total | 84 (88.4%) | 11 (11.6%) |
Income Below Poverty Among Single-Parent Households in La Jara
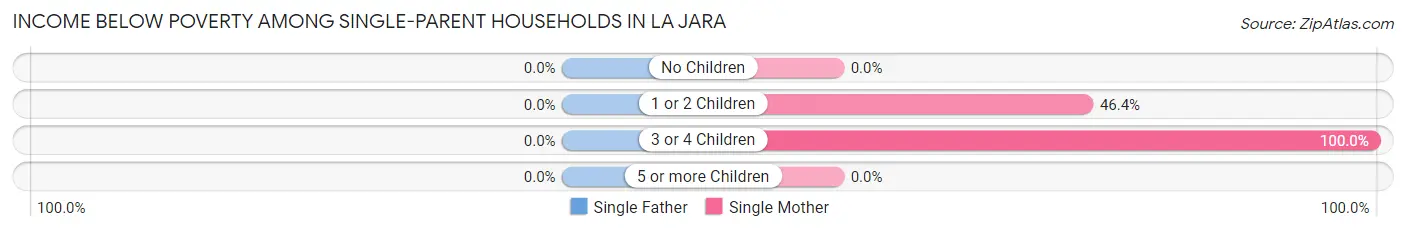
| Children | Single Father | Single Mother |
| No Children | 0 (0.0%) | 0 (0.0%) |
| 1 or 2 Children | 0 (0.0%) | 13 (46.4%) |
| 3 or 4 Children | 0 (0.0%) | 14 (100.0%) |
| 5 or more Children | 0 (0.0%) | 0 (0.0%) |
| Total | 0 (0.0%) | 27 (57.5%) |
Income Below Poverty Among Married-Couple vs Single-Parent Households in La Jara
The poverty data for La Jara shows that 11 of the married-couple family households (11.6%) and 27 of the single-parent households (40.3%) are living below the poverty level. Within the married-couple family households, those with 5 or more children have the highest poverty rate, with 7 households (77.8%) falling below the poverty line. Among the single-parent households, those with 1 or 2 children have the highest poverty rate, with 13 household (46.4%) living below poverty.
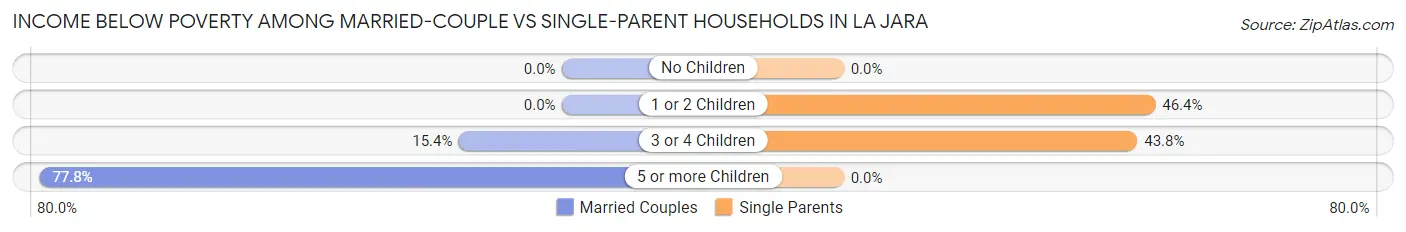
| Children | Married-Couple Families | Single-Parent Households |
| No Children | 0 (0.0%) | 0 (0.0%) |
| 1 or 2 Children | 0 (0.0%) | 13 (46.4%) |
| 3 or 4 Children | 4 (15.4%) | 14 (43.8%) |
| 5 or more Children | 7 (77.8%) | 0 (0.0%) |
| Total | 11 (11.6%) | 27 (40.3%) |
Race in La Jara
The most populous races in La Jara are White / Caucasian (502 | 75.0%), Hispanic or Latino (394 | 58.9%), and Two or more Races (133 | 19.9%).
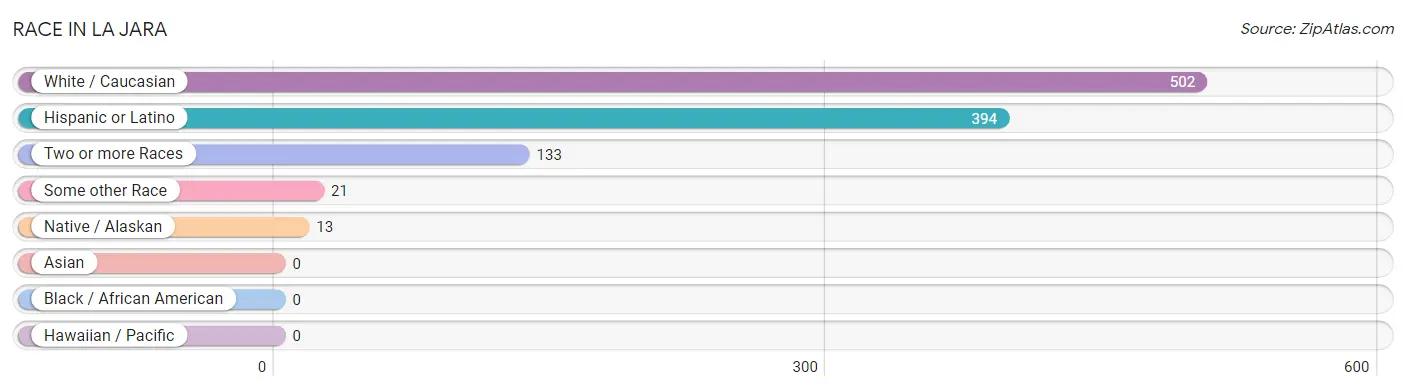
| Race | # Population | % Population |
| Asian | 0 | 0.0% |
| Black / African American | 0 | 0.0% |
| Hawaiian / Pacific | 0 | 0.0% |
| Hispanic or Latino | 394 | 58.9% |
| Native / Alaskan | 13 | 1.9% |
| White / Caucasian | 502 | 75.0% |
| Two or more Races | 133 | 19.9% |
| Some other Race | 21 | 3.1% |
| Total | 669 | 100.0% |
Ancestry in La Jara
The most populous ancestries reported in La Jara are Mexican (233 | 34.8%), German (85 | 12.7%), Spanish (76 | 11.4%), Spaniard (59 | 8.8%), and American (41 | 6.1%), together accounting for 73.9% of all La Jara residents.
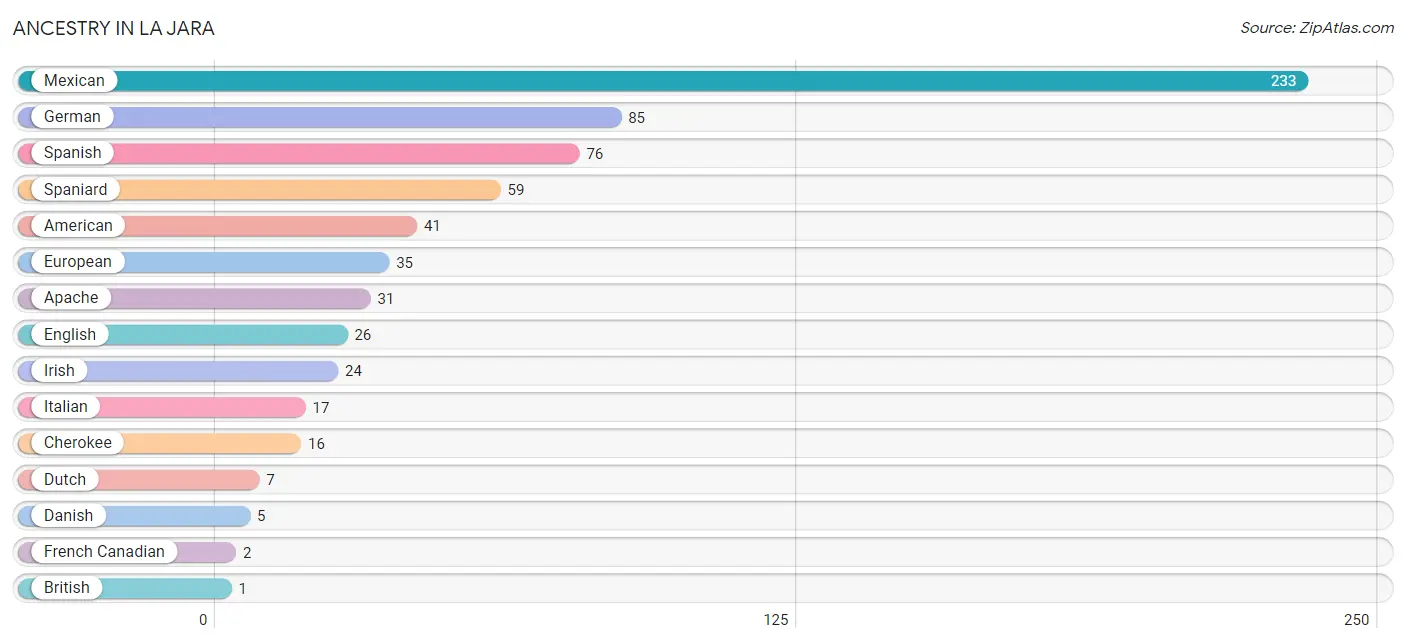
| Ancestry | # Population | % Population |
| American | 41 | 6.1% |
| Apache | 31 | 4.6% |
| British | 1 | 0.2% |
| Cherokee | 16 | 2.4% |
| Danish | 5 | 0.7% |
| Dutch | 7 | 1.1% |
| English | 26 | 3.9% |
| European | 35 | 5.2% |
| French Canadian | 2 | 0.3% |
| German | 85 | 12.7% |
| Irish | 24 | 3.6% |
| Italian | 17 | 2.5% |
| Mexican | 233 | 34.8% |
| Spaniard | 59 | 8.8% |
| Spanish | 76 | 11.4% | View All 15 Rows |
Immigrants in La Jara
The most numerous immigrant groups reported in La Jara came from Central America (20 | 3.0%), Latin America (20 | 3.0%), and Mexico (20 | 3.0%), together accounting for 9.0% of all La Jara residents.
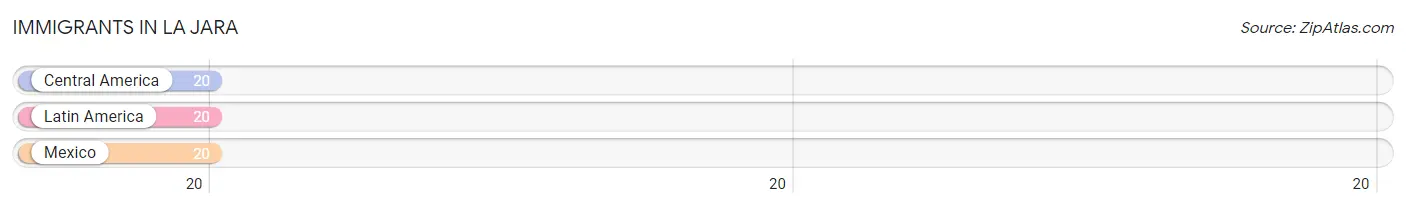
| Immigration Origin | # Population | % Population |
| Central America | 20 | 3.0% |
| Latin America | 20 | 3.0% |
| Mexico | 20 | 3.0% | View All 3 Rows |
Sex and Age in La Jara
Sex and Age in La Jara
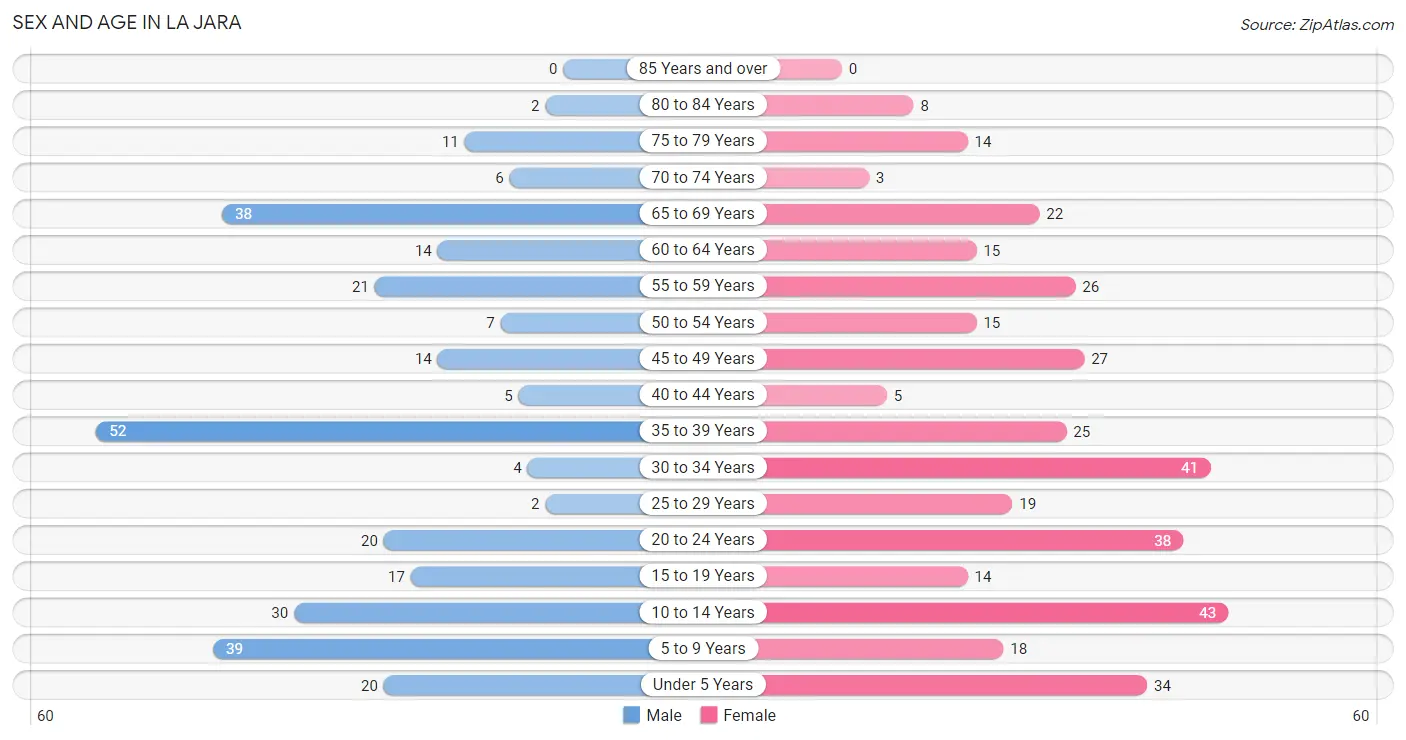
The most populous age groups in La Jara are 35 to 39 Years (52 | 17.2%) for men and 10 to 14 Years (43 | 11.7%) for women.
| Age Bracket | Male | Female |
| Under 5 Years | 20 (6.6%) | 34 (9.3%) |
| 5 to 9 Years | 39 (12.9%) | 18 (4.9%) |
| 10 to 14 Years | 30 (9.9%) | 43 (11.7%) |
| 15 to 19 Years | 17 (5.6%) | 14 (3.8%) |
| 20 to 24 Years | 20 (6.6%) | 38 (10.3%) |
| 25 to 29 Years | 2 (0.7%) | 19 (5.2%) |
| 30 to 34 Years | 4 (1.3%) | 41 (11.2%) |
| 35 to 39 Years | 52 (17.2%) | 25 (6.8%) |
| 40 to 44 Years | 5 (1.7%) | 5 (1.4%) |
| 45 to 49 Years | 14 (4.6%) | 27 (7.4%) |
| 50 to 54 Years | 7 (2.3%) | 15 (4.1%) |
| 55 to 59 Years | 21 (7.0%) | 26 (7.1%) |
| 60 to 64 Years | 14 (4.6%) | 15 (4.1%) |
| 65 to 69 Years | 38 (12.6%) | 22 (6.0%) |
| 70 to 74 Years | 6 (2.0%) | 3 (0.8%) |
| 75 to 79 Years | 11 (3.6%) | 14 (3.8%) |
| 80 to 84 Years | 2 (0.7%) | 8 (2.2%) |
| 85 Years and over | 0 (0.0%) | 0 (0.0%) |
| Total | 302 (100.0%) | 367 (100.0%) |
Families and Households in La Jara
Median Family Size in La Jara
The median family size in La Jara is 3.18 persons per family, with married-couple families (95 | 58.6%) accounting for the largest median family size of 3.74 persons per family. On the other hand, single male/father families (20 | 12.3%) represent the smallest median family size with 1.95 persons per family.
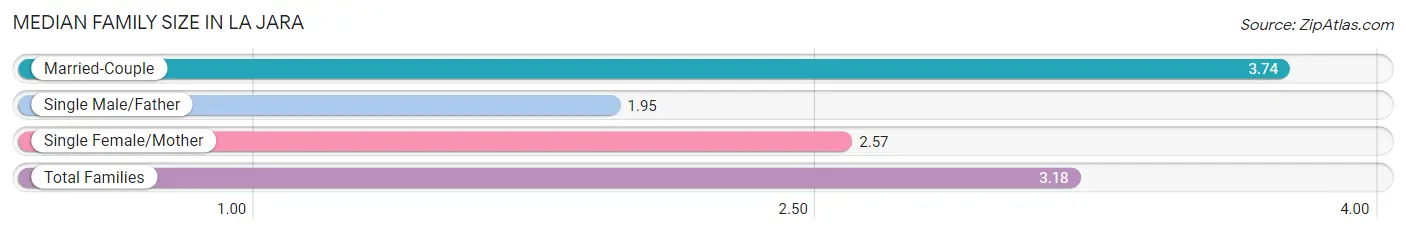
| Family Type | # Families | Family Size |
| Married-Couple | 95 (58.6%) | 3.74 |
| Single Male/Father | 20 (12.3%) | 1.95 |
| Single Female/Mother | 47 (29.0%) | 2.57 |
| Total Families | 162 (100.0%) | 3.18 |
Median Household Size in La Jara
The median household size in La Jara is 2.38 persons per household, with married-couple households (95 | 35.4%) accounting for the largest median household size of 3.74 persons per household. non-family households (106 | 39.6%) represent the smallest median household size with 1.01 persons per household.
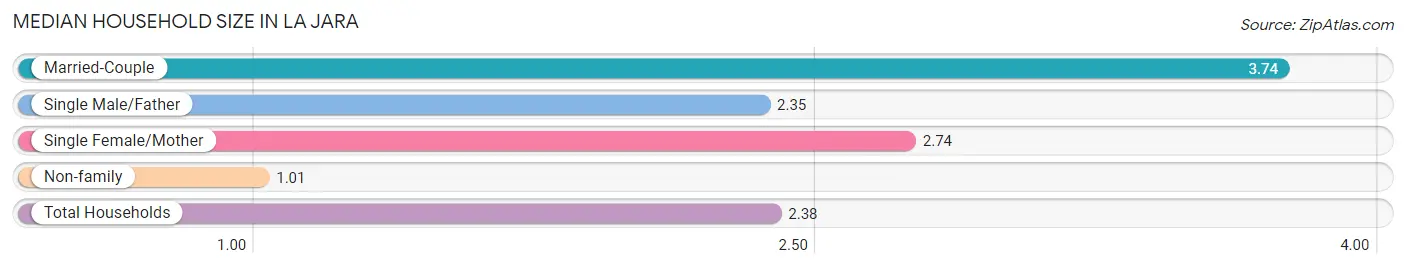
| Household Type | # Households | Household Size |
| Married-Couple | 95 (35.4%) | 3.74 |
| Single Male/Father | 20 (7.5%) | 2.35 |
| Single Female/Mother | 47 (17.5%) | 2.74 |
| Non-family | 106 (39.6%) | 1.01 |
| Total Households | 268 (100.0%) | 2.38 |
Household Size by Marriage Status in La Jara
Out of a total of 268 households in La Jara, 162 (60.5%) are family households, while 106 (39.6%) are nonfamily households. The most numerous type of family households are 2-person households, comprising 55, and the most common type of nonfamily households are 1-person households, comprising 104.
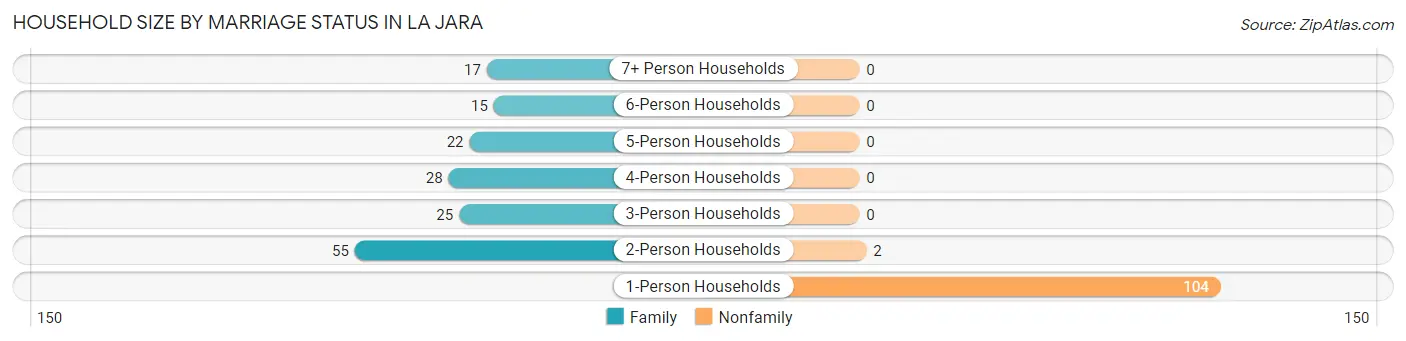
| Household Size | Family Households | Nonfamily Households |
| 1-Person Households | - | 104 (38.8%) |
| 2-Person Households | 55 (20.5%) | 2 (0.7%) |
| 3-Person Households | 25 (9.3%) | 0 (0.0%) |
| 4-Person Households | 28 (10.4%) | 0 (0.0%) |
| 5-Person Households | 22 (8.2%) | 0 (0.0%) |
| 6-Person Households | 15 (5.6%) | 0 (0.0%) |
| 7+ Person Households | 17 (6.3%) | 0 (0.0%) |
| Total | 162 (60.5%) | 106 (39.6%) |
Female Fertility in La Jara
Fertility by Age in La Jara
Average fertility rate in La Jara is 47.0 births per 1,000 women. Women in the age bracket of 35 to 50 years have the highest fertility rate with 69.0 births per 1,000 women. Women in the age bracket of 20 to 34 years acount for 50.0% of all women with births.
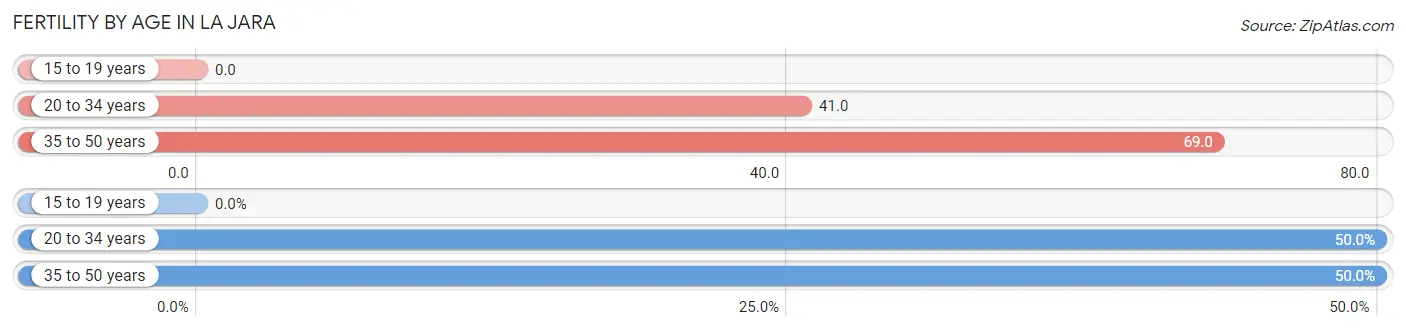
| Age Bracket | Women with Births | Births / 1,000 Women |
| 15 to 19 years | 0 (0.0%) | 0.0 |
| 20 to 34 years | 4 (50.0%) | 41.0 |
| 35 to 50 years | 4 (50.0%) | 69.0 |
| Total | 8 (100.0%) | 47.0 |
Fertility by Age by Marriage Status in La Jara
50.0% of women with births (8) in La Jara are married. The highest percentage of unmarried women with births falls into 20 to 34 years age bracket with 100.0% of them unmarried at the time of birth, while the lowest percentage of unmarried women with births belong to 35 to 50 years age bracket with 0.0% of them unmarried.
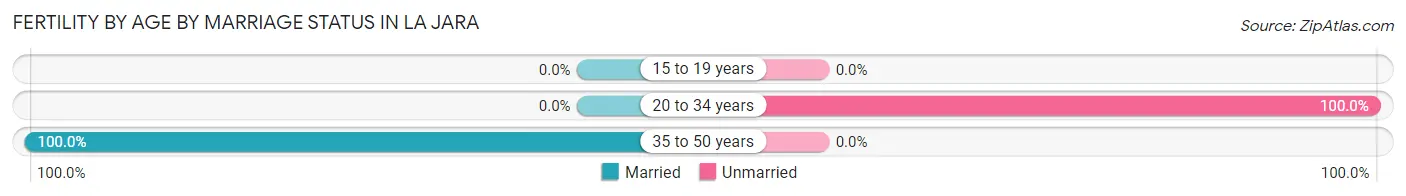
| Age Bracket | Married | Unmarried |
| 15 to 19 years | 0 (0.0%) | 0 (0.0%) |
| 20 to 34 years | 0 (0.0%) | 4 (100.0%) |
| 35 to 50 years | 4 (100.0%) | 0 (0.0%) |
| Total | 4 (50.0%) | 4 (50.0%) |
Fertility by Education in La Jara
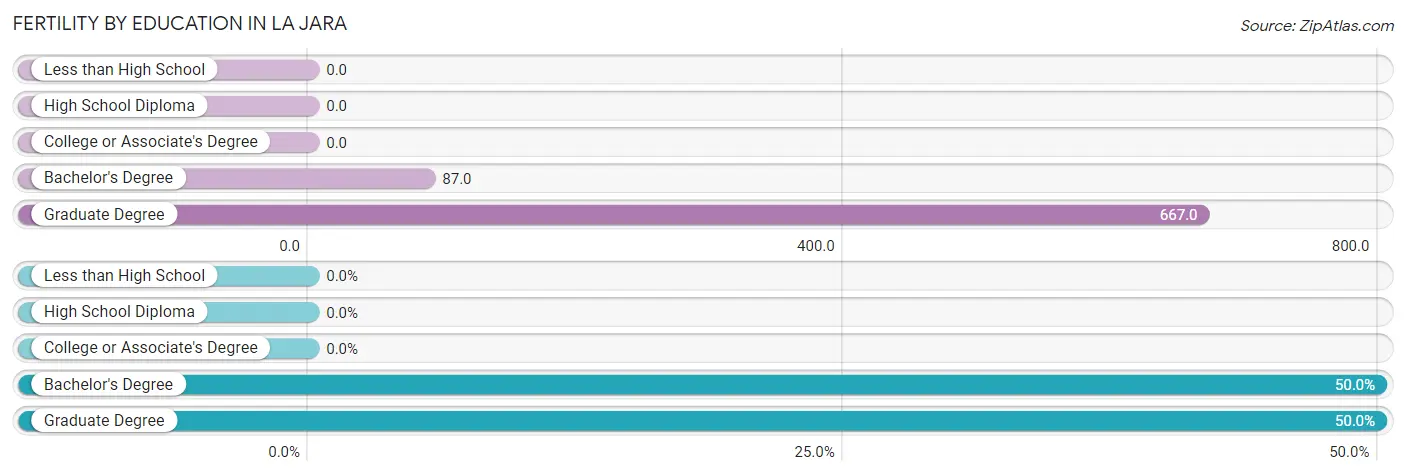
| Educational Attainment | Women with Births | Births / 1,000 Women |
| Less than High School | 0 (0.0%) | 0.0 |
| High School Diploma | 0 (0.0%) | 0.0 |
| College or Associate's Degree | 0 (0.0%) | 0.0 |
| Bachelor's Degree | 4 (50.0%) | 87.0 |
| Graduate Degree | 4 (50.0%) | 667.0 |
| Total | 8 (100.0%) | 47.0 |
Fertility by Education by Marriage Status in La Jara
50.0% of women with births in La Jara are unmarried. Women with the educational attainment of graduate degree are most likely to be married with 100.0% of them married at childbirth, while women with the educational attainment of bachelor's degree are least likely to be married with 100.0% of them unmarried at childbirth.
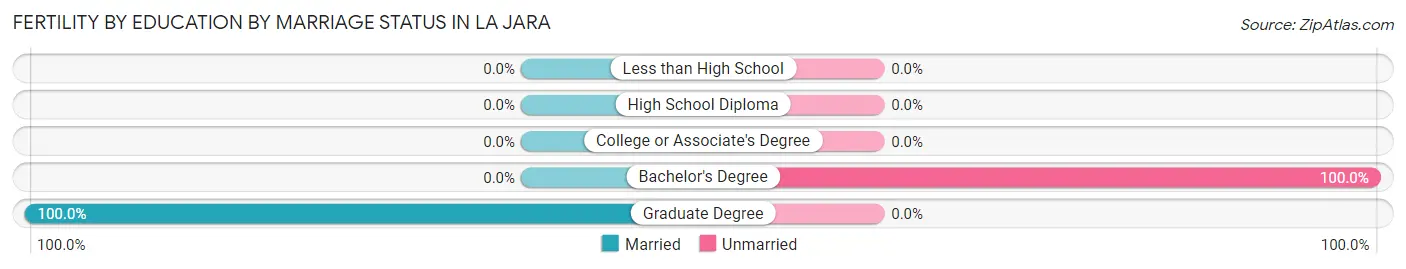
| Educational Attainment | Married | Unmarried |
| Less than High School | 0 (0.0%) | 0 (0.0%) |
| High School Diploma | 0 (0.0%) | 0 (0.0%) |
| College or Associate's Degree | 0 (0.0%) | 0 (0.0%) |
| Bachelor's Degree | 0 (0.0%) | 4 (100.0%) |
| Graduate Degree | 4 (100.0%) | 0 (0.0%) |
| Total | 4 (50.0%) | 4 (50.0%) |
Employment Characteristics in La Jara
Employment by Class of Employer in La Jara
Among the 241 employed individuals in La Jara, private company employees (100 | 41.5%), local government employees (74 | 30.7%), and self-employed (not incorporated) (25 | 10.4%) make up the most common classes of employment.
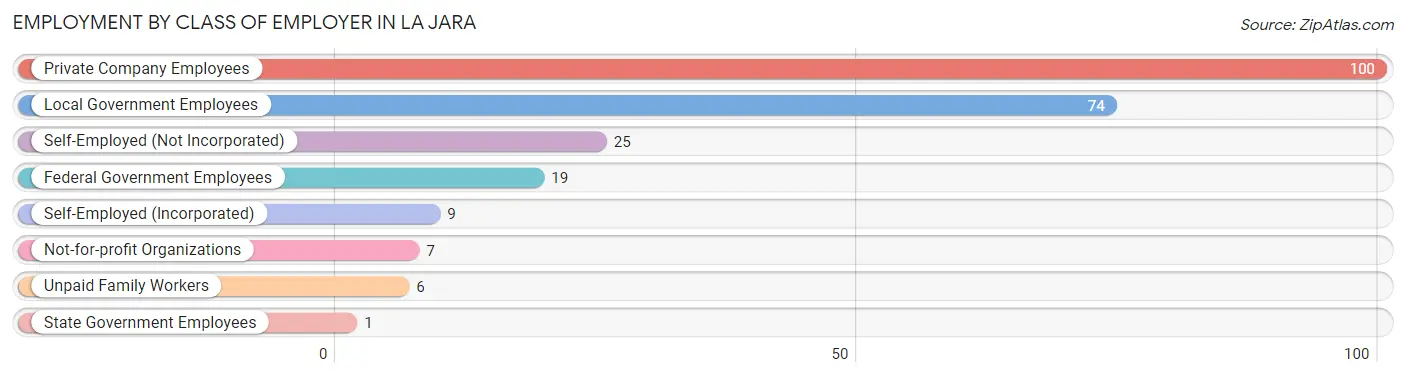
| Employer Class | # Employees | % Employees |
| Private Company Employees | 100 | 41.5% |
| Self-Employed (Incorporated) | 9 | 3.7% |
| Self-Employed (Not Incorporated) | 25 | 10.4% |
| Not-for-profit Organizations | 7 | 2.9% |
| Local Government Employees | 74 | 30.7% |
| State Government Employees | 1 | 0.4% |
| Federal Government Employees | 19 | 7.9% |
| Unpaid Family Workers | 6 | 2.5% |
| Total | 241 | 100.0% |
Employment Status by Age in La Jara
According to the labor force statistics for La Jara, out of the total population over 16 years of age (468), 60.7% or 284 individuals are in the labor force, with 15.1% or 43 of them unemployed. The age group with the highest labor force participation rate is 25 to 29 years, with 100.0% or 21 individuals in the labor force. Within the labor force, the 16 to 19 years age range has the highest percentage of unemployed individuals, with 100.0% or 6 of them being unemployed.
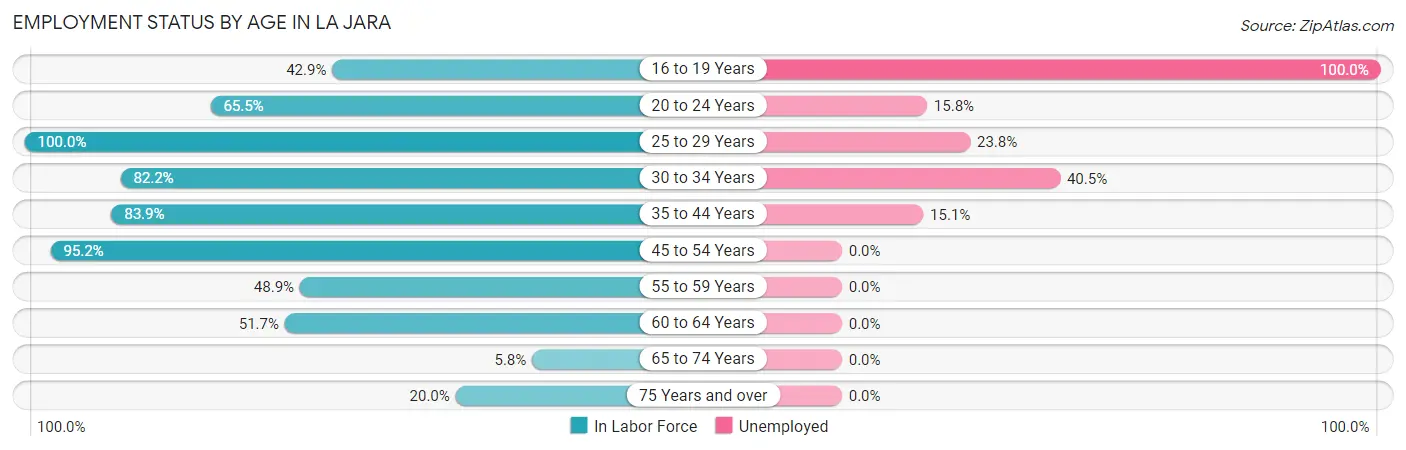
| Age Bracket | In Labor Force | Unemployed |
| 16 to 19 Years | 6 (42.9%) | 6 (100.0%) |
| 20 to 24 Years | 38 (65.5%) | 6 (15.8%) |
| 25 to 29 Years | 21 (100.0%) | 5 (23.8%) |
| 30 to 34 Years | 37 (82.2%) | 15 (40.5%) |
| 35 to 44 Years | 73 (83.9%) | 11 (15.1%) |
| 45 to 54 Years | 60 (95.2%) | 0 (0.0%) |
| 55 to 59 Years | 23 (48.9%) | 0 (0.0%) |
| 60 to 64 Years | 15 (51.7%) | 0 (0.0%) |
| 65 to 74 Years | 4 (5.8%) | 0 (0.0%) |
| 75 Years and over | 7 (20.0%) | 0 (0.0%) |
| Total | 284 (60.7%) | 43 (15.1%) |
Employment Status by Educational Attainment in La Jara
According to labor force statistics for La Jara, 78.4% of individuals (229) out of the total population between 25 and 64 years of age (292) are in the labor force, with 13.5% or 31 of them being unemployed. The group with the highest labor force participation rate are those with the educational attainment of less than high school, with 100.0% or 12 individuals in the labor force. Within the labor force, individuals with less than high school education have the highest percentage of unemployment, with 91.7% or 11 of them being unemployed.
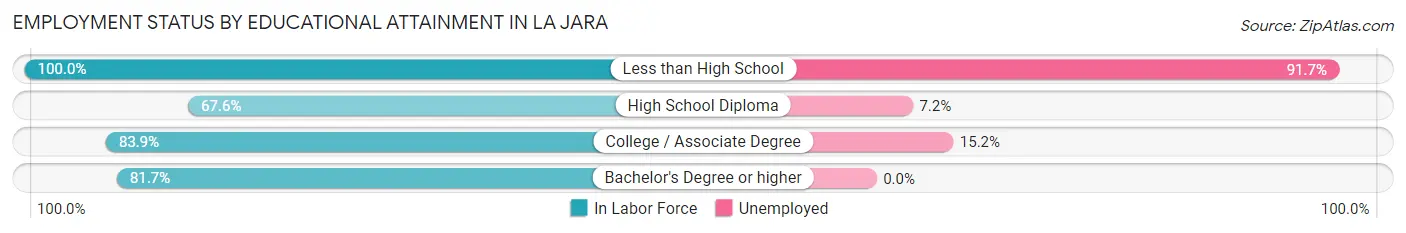
| Educational Attainment | In Labor Force | Unemployed |
| Less than High School | 12 (100.0%) | 11 (91.7%) |
| High School Diploma | 69 (67.6%) | 7 (7.2%) |
| College / Associate Degree | 99 (83.9%) | 18 (15.2%) |
| Bachelor's Degree or higher | 49 (81.7%) | 0 (0.0%) |
| Total | 229 (78.4%) | 39 (13.5%) |
Employment Occupations by Sex in La Jara
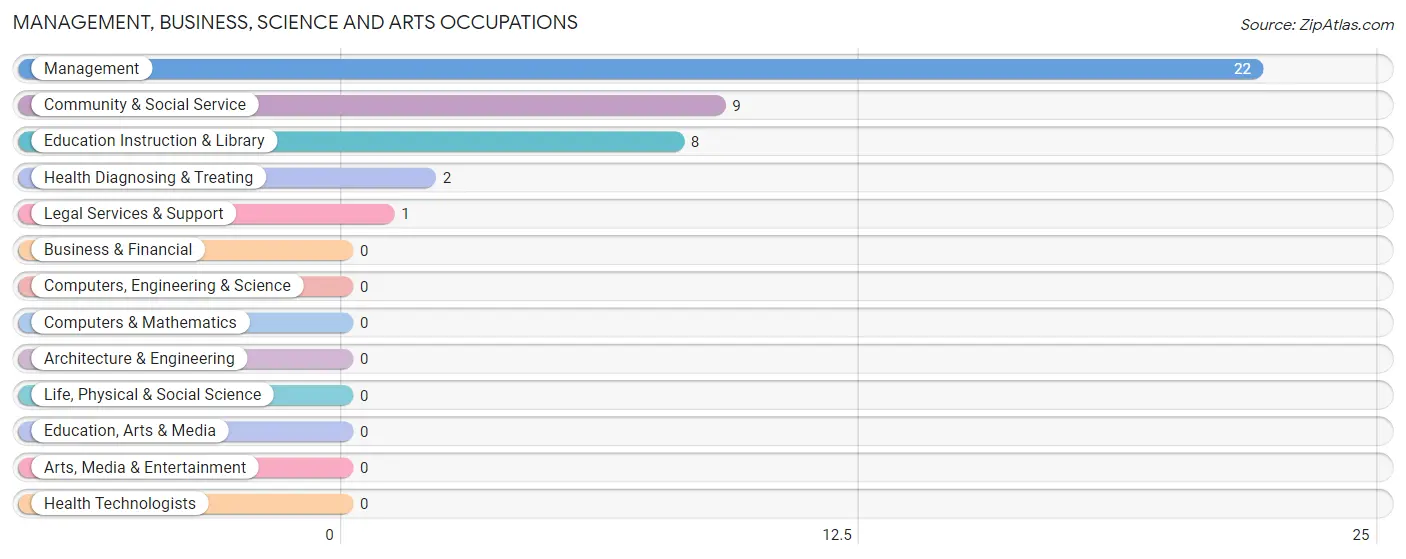
Management, Business, Science and Arts Occupations
The most common Management, Business, Science and Arts occupations in La Jara are Management (22 | 9.1%), Community & Social Service (9 | 3.7%), Education Instruction & Library (8 | 3.3%), Health Diagnosing & Treating (2 | 0.8%), and Legal Services & Support (1 | 0.4%).
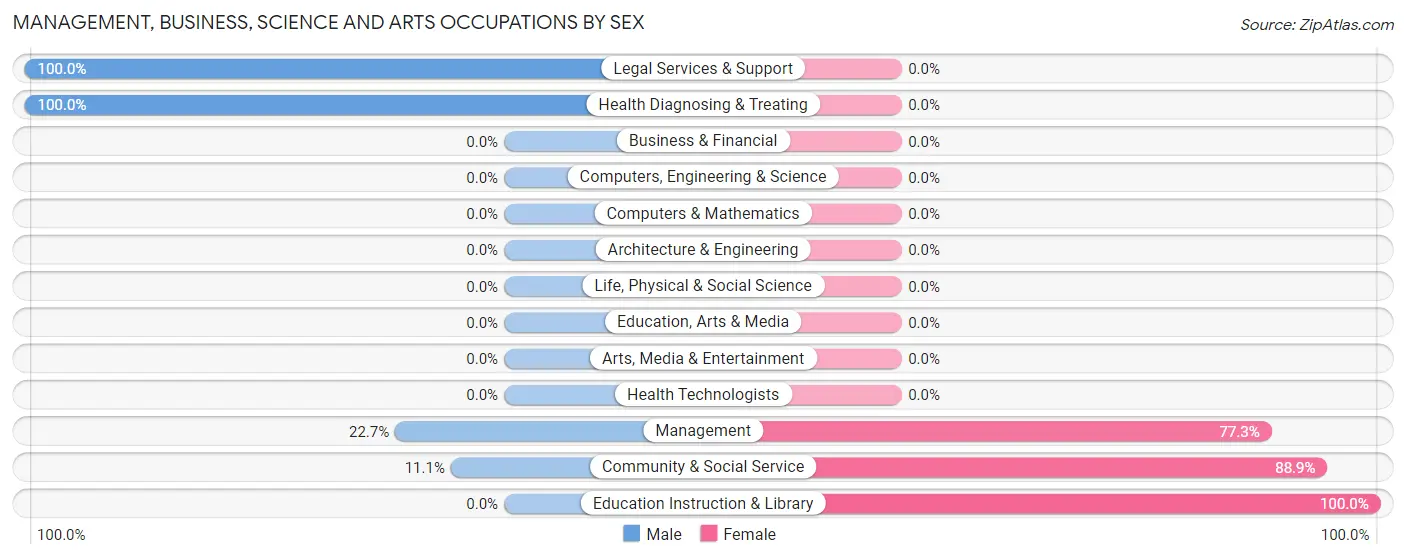
Management, Business, Science and Arts Occupations by Sex
Within the Management, Business, Science and Arts occupations in La Jara, the most male-oriented occupations are Legal Services & Support (100.0%), Health Diagnosing & Treating (100.0%), and Management (22.7%), while the most female-oriented occupations are Education Instruction & Library (100.0%), Community & Social Service (88.9%), and Management (77.3%).
| Occupation | Male | Female |
| Management | 5 (22.7%) | 17 (77.3%) |
| Business & Financial | 0 (0.0%) | 0 (0.0%) |
| Computers, Engineering & Science | 0 (0.0%) | 0 (0.0%) |
| Computers & Mathematics | 0 (0.0%) | 0 (0.0%) |
| Architecture & Engineering | 0 (0.0%) | 0 (0.0%) |
| Life, Physical & Social Science | 0 (0.0%) | 0 (0.0%) |
| Community & Social Service | 1 (11.1%) | 8 (88.9%) |
| Education, Arts & Media | 0 (0.0%) | 0 (0.0%) |
| Legal Services & Support | 1 (100.0%) | 0 (0.0%) |
| Education Instruction & Library | 0 (0.0%) | 8 (100.0%) |
| Arts, Media & Entertainment | 0 (0.0%) | 0 (0.0%) |
| Health Diagnosing & Treating | 2 (100.0%) | 0 (0.0%) |
| Health Technologists | 0 (0.0%) | 0 (0.0%) |
| Total (Category) | 8 (24.2%) | 25 (75.8%) |
| Total (Overall) | 104 (43.1%) | 137 (56.9%) |
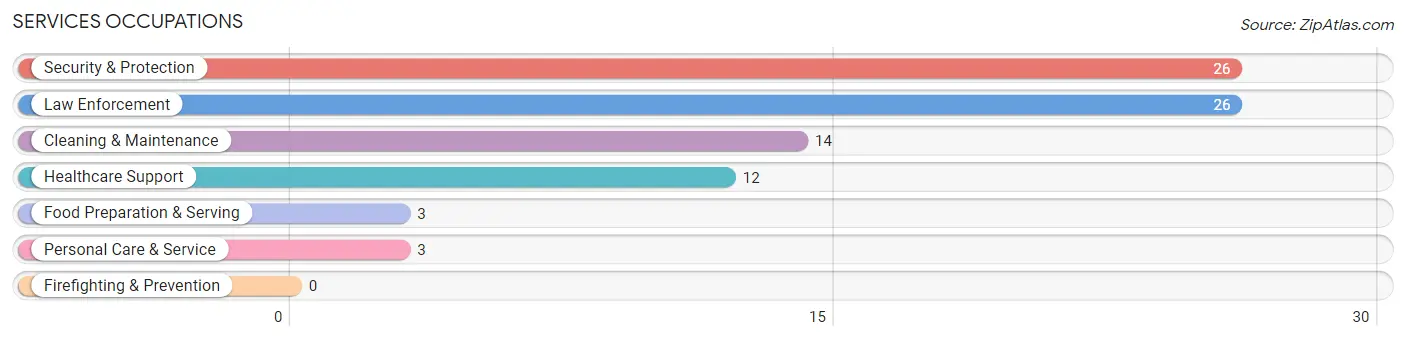
Services Occupations
The most common Services occupations in La Jara are Security & Protection (26 | 10.8%), Law Enforcement (26 | 10.8%), Cleaning & Maintenance (14 | 5.8%), Healthcare Support (12 | 5.0%), and Food Preparation & Serving (3 | 1.2%).
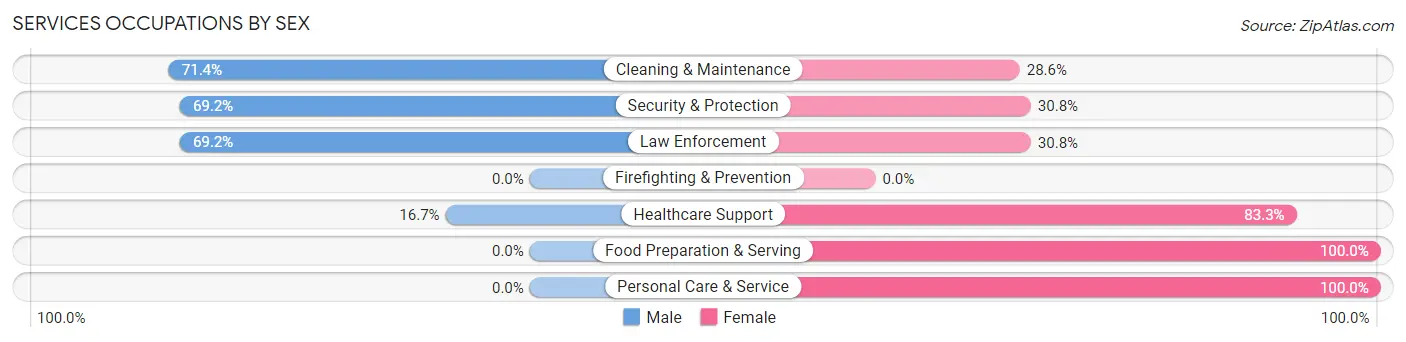
Services Occupations by Sex
Within the Services occupations in La Jara, the most male-oriented occupations are Cleaning & Maintenance (71.4%), Security & Protection (69.2%), and Law Enforcement (69.2%), while the most female-oriented occupations are Food Preparation & Serving (100.0%), Personal Care & Service (100.0%), and Healthcare Support (83.3%).
| Occupation | Male | Female |
| Healthcare Support | 2 (16.7%) | 10 (83.3%) |
| Security & Protection | 18 (69.2%) | 8 (30.8%) |
| Firefighting & Prevention | 0 (0.0%) | 0 (0.0%) |
| Law Enforcement | 18 (69.2%) | 8 (30.8%) |
| Food Preparation & Serving | 0 (0.0%) | 3 (100.0%) |
| Cleaning & Maintenance | 10 (71.4%) | 4 (28.6%) |
| Personal Care & Service | 0 (0.0%) | 3 (100.0%) |
| Total (Category) | 30 (51.7%) | 28 (48.3%) |
| Total (Overall) | 104 (43.1%) | 137 (56.9%) |
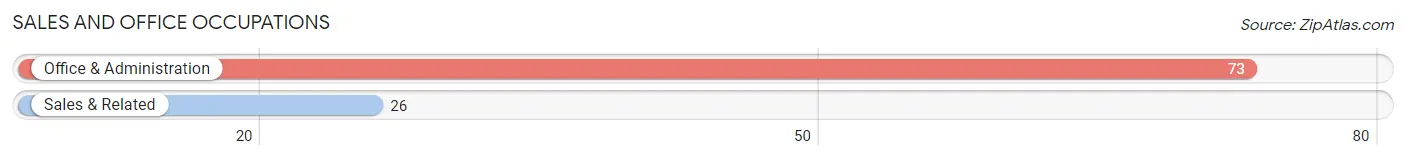
Sales and Office Occupations
The most common Sales and Office occupations in La Jara are Office & Administration (73 | 30.3%), and Sales & Related (26 | 10.8%).
Sales and Office Occupations by Sex
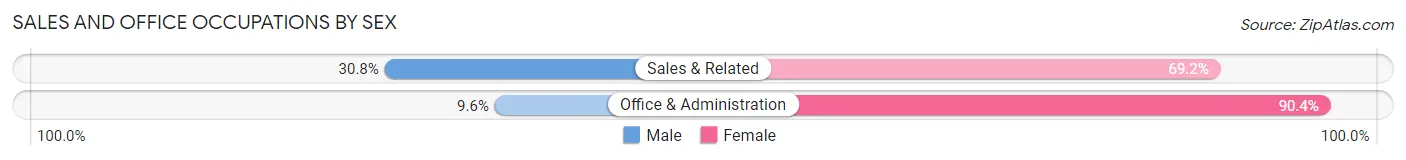
| Occupation | Male | Female |
| Sales & Related | 8 (30.8%) | 18 (69.2%) |
| Office & Administration | 7 (9.6%) | 66 (90.4%) |
| Total (Category) | 15 (15.1%) | 84 (84.9%) |
| Total (Overall) | 104 (43.1%) | 137 (56.9%) |
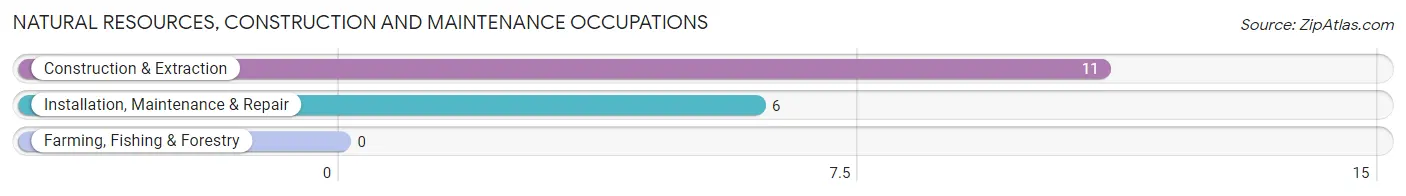
Natural Resources, Construction and Maintenance Occupations
The most common Natural Resources, Construction and Maintenance occupations in La Jara are Construction & Extraction (11 | 4.6%), and Installation, Maintenance & Repair (6 | 2.5%).
Natural Resources, Construction and Maintenance Occupations by Sex
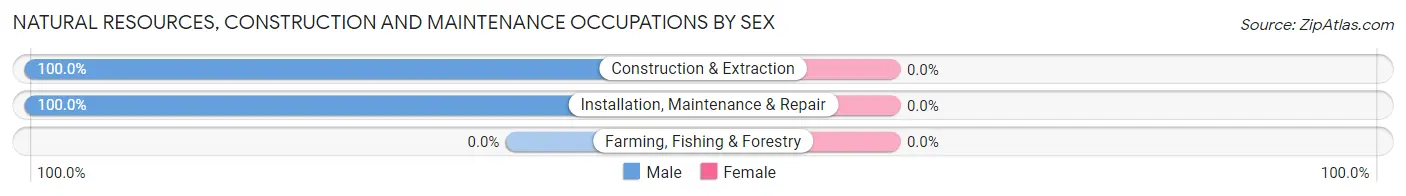
| Occupation | Male | Female |
| Farming, Fishing & Forestry | 0 (0.0%) | 0 (0.0%) |
| Construction & Extraction | 11 (100.0%) | 0 (0.0%) |
| Installation, Maintenance & Repair | 6 (100.0%) | 0 (0.0%) |
| Total (Category) | 17 (100.0%) | 0 (0.0%) |
| Total (Overall) | 104 (43.1%) | 137 (56.9%) |
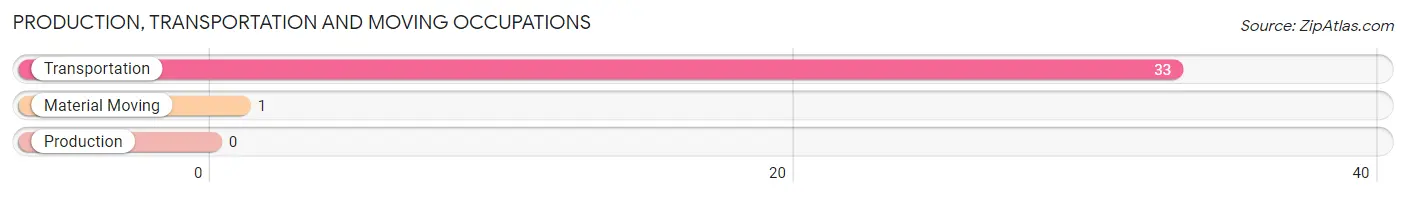
Production, Transportation and Moving Occupations
The most common Production, Transportation and Moving occupations in La Jara are Transportation (33 | 13.7%), and Material Moving (1 | 0.4%).
Production, Transportation and Moving Occupations by Sex
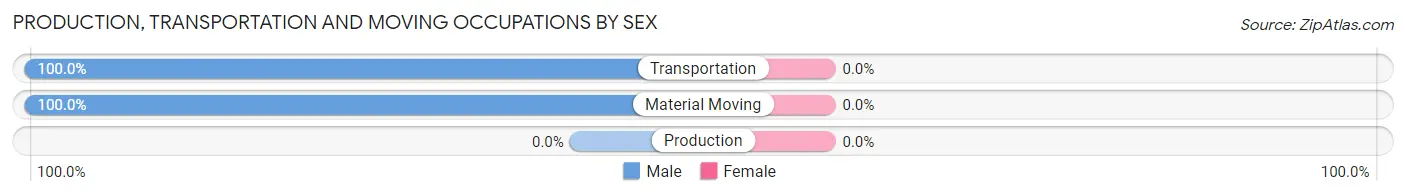
| Occupation | Male | Female |
| Production | 0 (0.0%) | 0 (0.0%) |
| Transportation | 33 (100.0%) | 0 (0.0%) |
| Material Moving | 1 (100.0%) | 0 (0.0%) |
| Total (Category) | 34 (100.0%) | 0 (0.0%) |
| Total (Overall) | 104 (43.1%) | 137 (56.9%) |
Employment Industries by Sex in La Jara
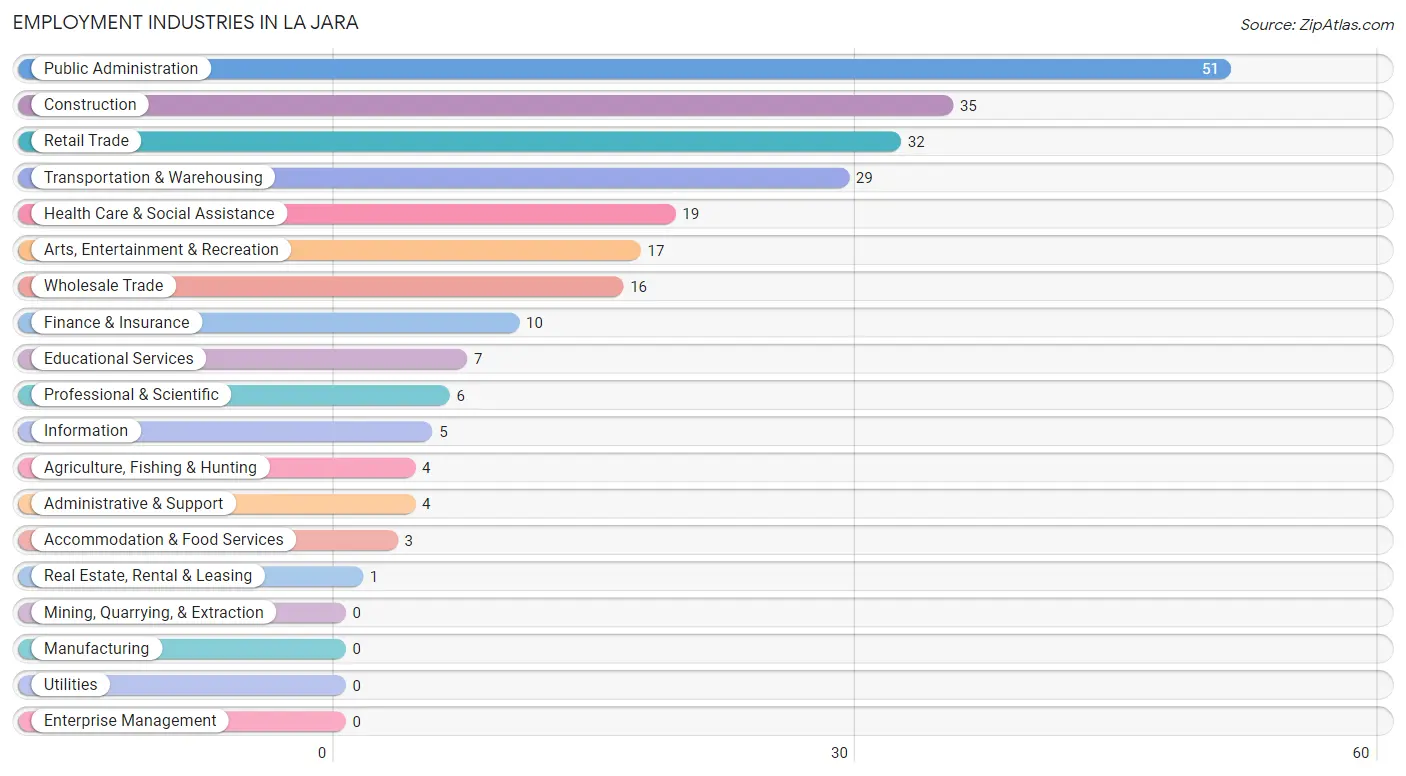
Employment Industries in La Jara
The major employment industries in La Jara include Public Administration (51 | 21.2%), Construction (35 | 14.5%), Retail Trade (32 | 13.3%), Transportation & Warehousing (29 | 12.0%), and Health Care & Social Assistance (19 | 7.9%).
Employment Industries by Sex in La Jara
The La Jara industries that see more men than women are Agriculture, Fishing & Hunting (100.0%), Wholesale Trade (100.0%), and Professional & Scientific (83.3%), whereas the industries that tend to have a higher number of women are Real Estate, Rental & Leasing (100.0%), Administrative & Support (100.0%), and Educational Services (100.0%).
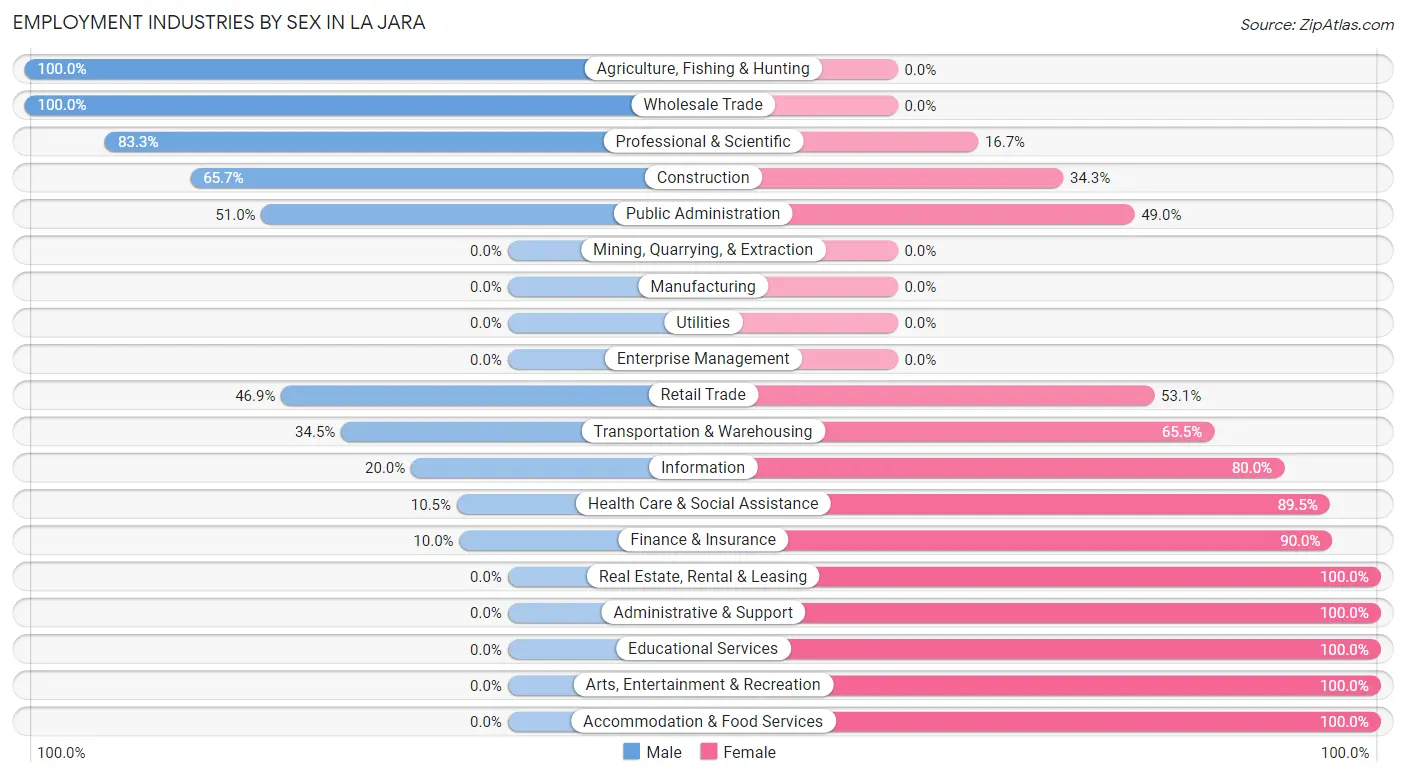
| Industry | Male | Female |
| Agriculture, Fishing & Hunting | 4 (100.0%) | 0 (0.0%) |
| Mining, Quarrying, & Extraction | 0 (0.0%) | 0 (0.0%) |
| Construction | 23 (65.7%) | 12 (34.3%) |
| Manufacturing | 0 (0.0%) | 0 (0.0%) |
| Wholesale Trade | 16 (100.0%) | 0 (0.0%) |
| Retail Trade | 15 (46.9%) | 17 (53.1%) |
| Transportation & Warehousing | 10 (34.5%) | 19 (65.5%) |
| Utilities | 0 (0.0%) | 0 (0.0%) |
| Information | 1 (20.0%) | 4 (80.0%) |
| Finance & Insurance | 1 (10.0%) | 9 (90.0%) |
| Real Estate, Rental & Leasing | 0 (0.0%) | 1 (100.0%) |
| Professional & Scientific | 5 (83.3%) | 1 (16.7%) |
| Enterprise Management | 0 (0.0%) | 0 (0.0%) |
| Administrative & Support | 0 (0.0%) | 4 (100.0%) |
| Educational Services | 0 (0.0%) | 7 (100.0%) |
| Health Care & Social Assistance | 2 (10.5%) | 17 (89.5%) |
| Arts, Entertainment & Recreation | 0 (0.0%) | 17 (100.0%) |
| Accommodation & Food Services | 0 (0.0%) | 3 (100.0%) |
| Public Administration | 26 (51.0%) | 25 (49.0%) |
| Total | 104 (43.1%) | 137 (56.9%) |
Education in La Jara
School Enrollment in La Jara
The most common levels of schooling among the 162 students in La Jara are middle school (67 | 41.4%), elementary school (32 | 19.8%), and high school (27 | 16.7%).
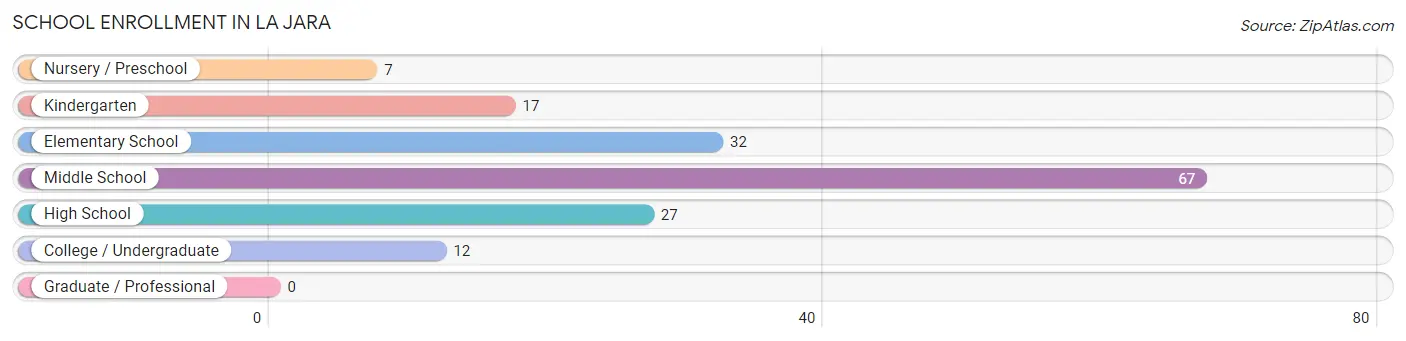
| School Level | # Students | % Students |
| Nursery / Preschool | 7 | 4.3% |
| Kindergarten | 17 | 10.5% |
| Elementary School | 32 | 19.8% |
| Middle School | 67 | 41.4% |
| High School | 27 | 16.7% |
| College / Undergraduate | 12 | 7.4% |
| Graduate / Professional | 0 | 0.0% |
| Total | 162 | 100.0% |
School Enrollment by Age by Funding Source in La Jara
Out of a total of 162 students who are enrolled in schools in La Jara, 16 (9.9%) attend a private institution, while the remaining 146 (90.1%) are enrolled in public schools. The age group of 3 to 4 year olds has the highest likelihood of being enrolled in private schools, with 4 (100.0% in the age bracket) enrolled. Conversely, the age group of 10 to 14 year olds has the lowest likelihood of being enrolled in a private school, with 69 (100.0% in the age bracket) attending a public institution.
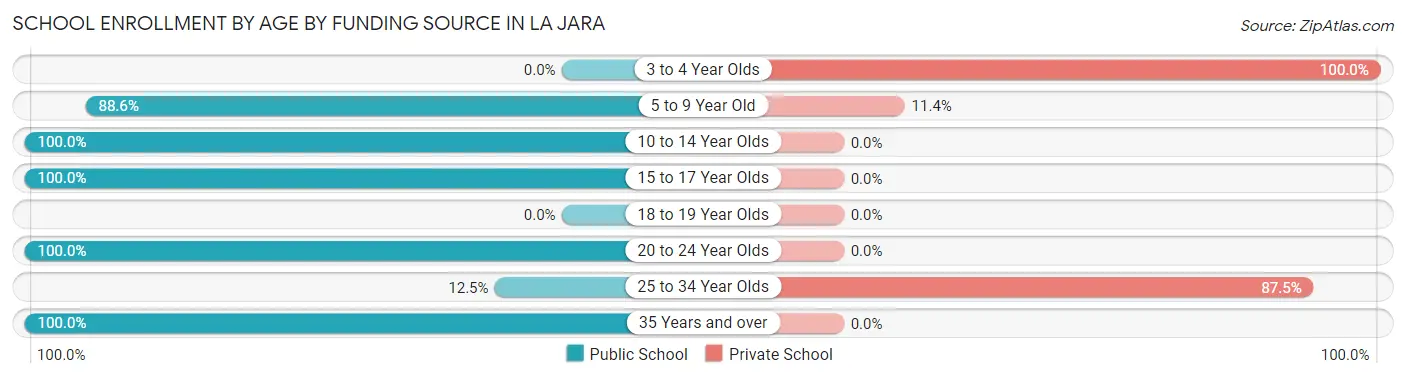
| Age Bracket | Public School | Private School |
| 3 to 4 Year Olds | 0 (0.0%) | 4 (100.0%) |
| 5 to 9 Year Old | 39 (88.6%) | 5 (11.4%) |
| 10 to 14 Year Olds | 69 (100.0%) | 0 (0.0%) |
| 15 to 17 Year Olds | 31 (100.0%) | 0 (0.0%) |
| 18 to 19 Year Olds | 0 (0.0%) | 0 (0.0%) |
| 20 to 24 Year Olds | 4 (100.0%) | 0 (0.0%) |
| 25 to 34 Year Olds | 1 (12.5%) | 7 (87.5%) |
| 35 Years and over | 2 (100.0%) | 0 (0.0%) |
| Total | 146 (90.1%) | 16 (9.9%) |
Educational Attainment by Field of Study in La Jara
Education (26 | 31.7%), arts & humanities (20 | 24.4%), business (15 | 18.3%), social sciences (9 | 11.0%), and computers & mathematics (4 | 4.9%) are the most common fields of study among 82 individuals in La Jara who have obtained a bachelor's degree or higher.
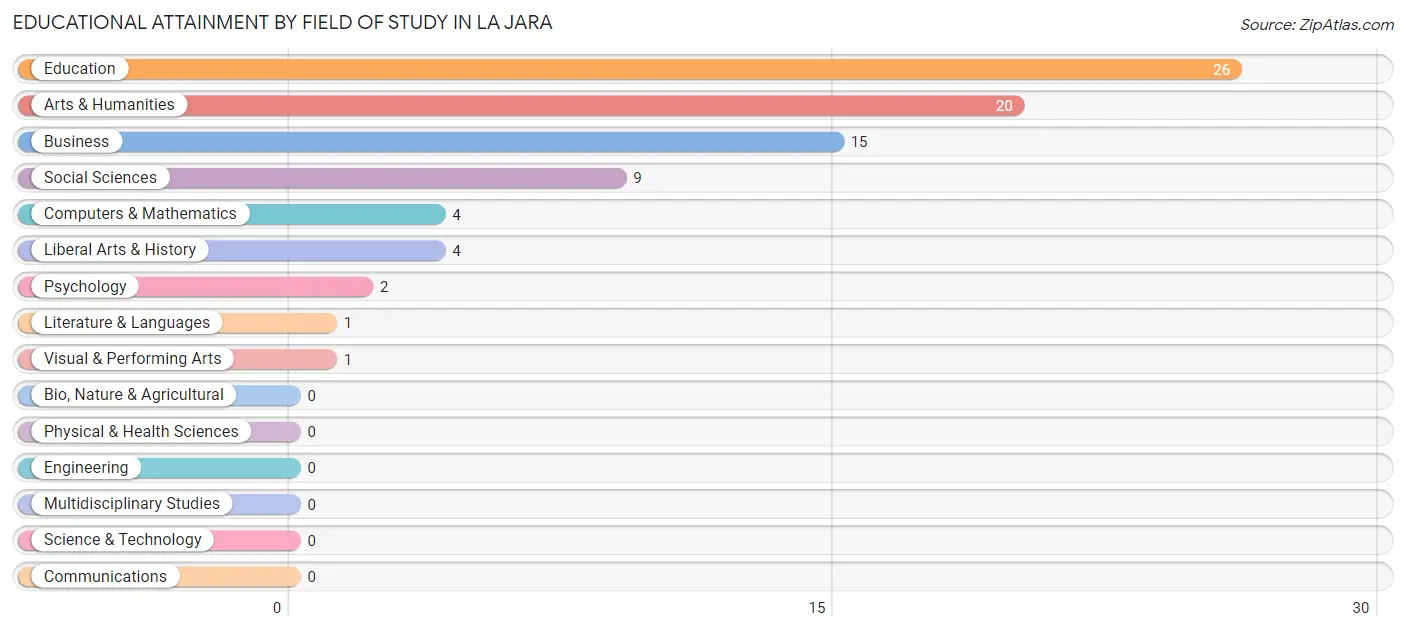
| Field of Study | # Graduates | % Graduates |
| Computers & Mathematics | 4 | 4.9% |
| Bio, Nature & Agricultural | 0 | 0.0% |
| Physical & Health Sciences | 0 | 0.0% |
| Psychology | 2 | 2.4% |
| Social Sciences | 9 | 11.0% |
| Engineering | 0 | 0.0% |
| Multidisciplinary Studies | 0 | 0.0% |
| Science & Technology | 0 | 0.0% |
| Business | 15 | 18.3% |
| Education | 26 | 31.7% |
| Literature & Languages | 1 | 1.2% |
| Liberal Arts & History | 4 | 4.9% |
| Visual & Performing Arts | 1 | 1.2% |
| Communications | 0 | 0.0% |
| Arts & Humanities | 20 | 24.4% |
| Total | 82 | 100.0% |
Transportation & Commute in La Jara
Vehicle Availability by Sex in La Jara
The most prevalent vehicle ownership categories in La Jara are males with 2 vehicles (43, accounting for 41.3%) and females with 2 vehicles (37, making up 31.4%).
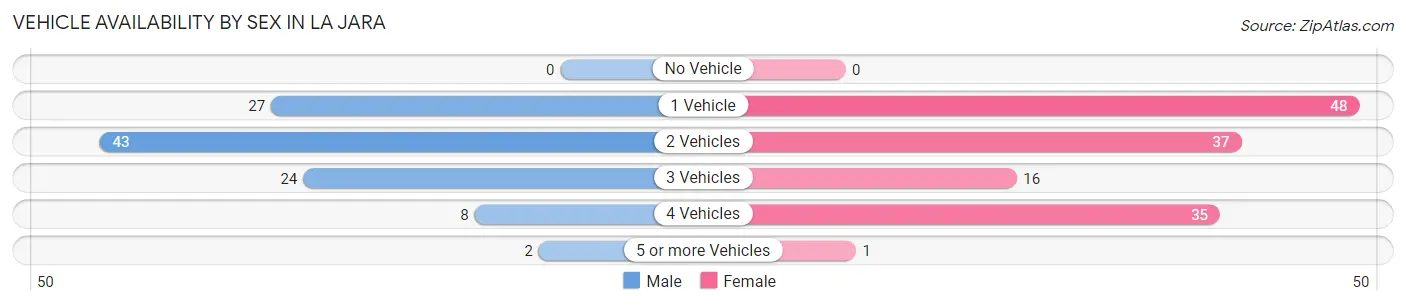
| Vehicles Available | Male | Female |
| No Vehicle | 0 (0.0%) | 0 (0.0%) |
| 1 Vehicle | 27 (26.0%) | 48 (35.0%) |
| 2 Vehicles | 43 (41.3%) | 37 (27.0%) |
| 3 Vehicles | 24 (23.1%) | 16 (11.7%) |
| 4 Vehicles | 8 (7.7%) | 35 (25.6%) |
| 5 or more Vehicles | 2 (1.9%) | 1 (0.7%) |
| Total | 104 (100.0%) | 137 (100.0%) |
Commute Time in La Jara
The most frequently occuring commute durations in La Jara are less than 5 minutes (49 commuters, 22.7%), 5 to 9 minutes (45 commuters, 20.8%), and 20 to 24 minutes (29 commuters, 13.4%).
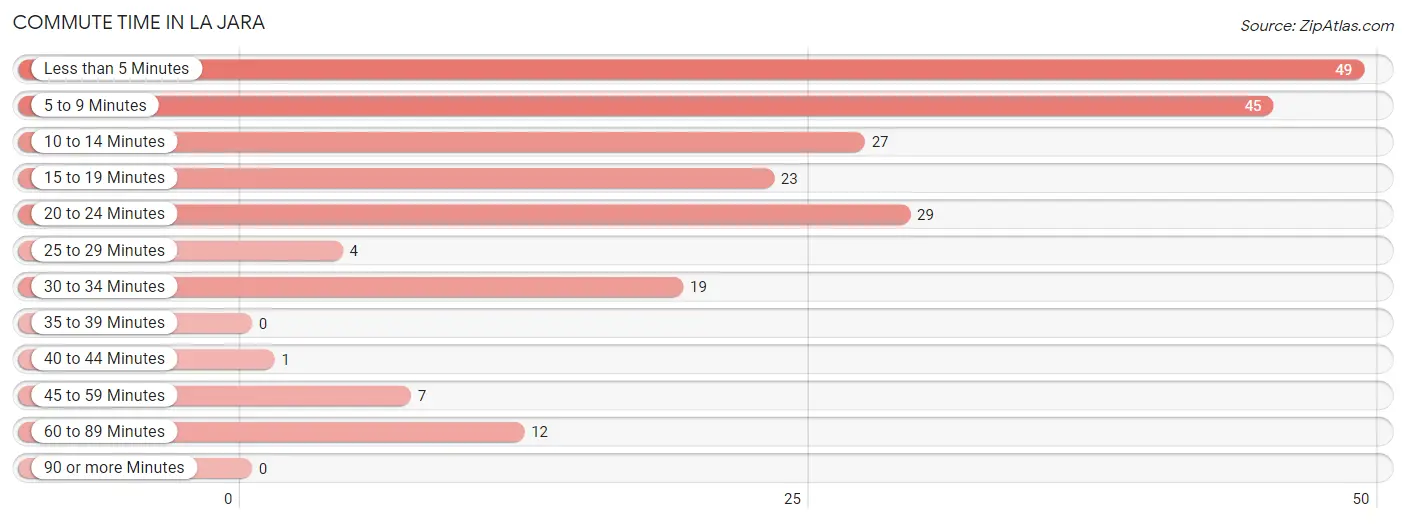
| Commute Time | # Commuters | % Commuters |
| Less than 5 Minutes | 49 | 22.7% |
| 5 to 9 Minutes | 45 | 20.8% |
| 10 to 14 Minutes | 27 | 12.5% |
| 15 to 19 Minutes | 23 | 10.6% |
| 20 to 24 Minutes | 29 | 13.4% |
| 25 to 29 Minutes | 4 | 1.8% |
| 30 to 34 Minutes | 19 | 8.8% |
| 35 to 39 Minutes | 0 | 0.0% |
| 40 to 44 Minutes | 1 | 0.5% |
| 45 to 59 Minutes | 7 | 3.2% |
| 60 to 89 Minutes | 12 | 5.6% |
| 90 or more Minutes | 0 | 0.0% |
Commute Time by Sex in La Jara
The most common commute times in La Jara are less than 5 minutes (26 commuters, 29.9%) for males and 5 to 9 minutes (45 commuters, 34.9%) for females.
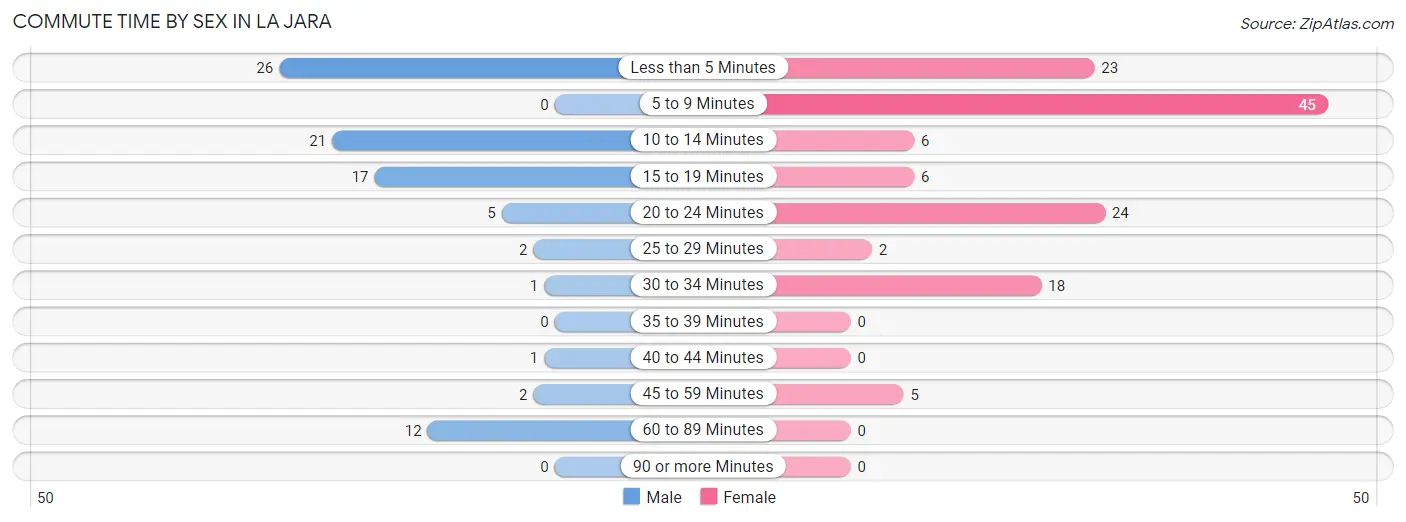
| Commute Time | Male | Female |
| Less than 5 Minutes | 26 (29.9%) | 23 (17.8%) |
| 5 to 9 Minutes | 0 (0.0%) | 45 (34.9%) |
| 10 to 14 Minutes | 21 (24.1%) | 6 (4.6%) |
| 15 to 19 Minutes | 17 (19.5%) | 6 (4.6%) |
| 20 to 24 Minutes | 5 (5.8%) | 24 (18.6%) |
| 25 to 29 Minutes | 2 (2.3%) | 2 (1.5%) |
| 30 to 34 Minutes | 1 (1.1%) | 18 (14.0%) |
| 35 to 39 Minutes | 0 (0.0%) | 0 (0.0%) |
| 40 to 44 Minutes | 1 (1.1%) | 0 (0.0%) |
| 45 to 59 Minutes | 2 (2.3%) | 5 (3.9%) |
| 60 to 89 Minutes | 12 (13.8%) | 0 (0.0%) |
| 90 or more Minutes | 0 (0.0%) | 0 (0.0%) |
Time of Departure to Work by Sex in La Jara
The most frequent times of departure to work in La Jara are 7:30 AM to 7:59 AM (22, 25.3%) for males and 7:00 AM to 7:29 AM (34, 26.4%) for females.
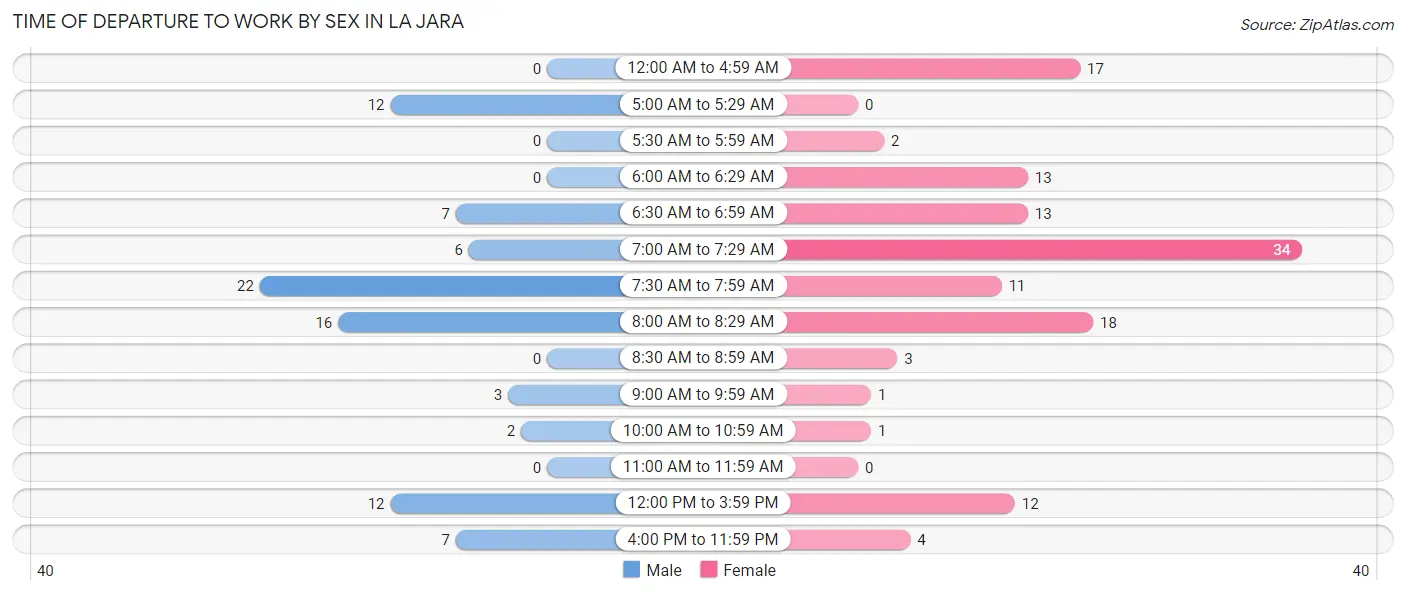
| Time of Departure | Male | Female |
| 12:00 AM to 4:59 AM | 0 (0.0%) | 17 (13.2%) |
| 5:00 AM to 5:29 AM | 12 (13.8%) | 0 (0.0%) |
| 5:30 AM to 5:59 AM | 0 (0.0%) | 2 (1.5%) |
| 6:00 AM to 6:29 AM | 0 (0.0%) | 13 (10.1%) |
| 6:30 AM to 6:59 AM | 7 (8.1%) | 13 (10.1%) |
| 7:00 AM to 7:29 AM | 6 (6.9%) | 34 (26.4%) |
| 7:30 AM to 7:59 AM | 22 (25.3%) | 11 (8.5%) |
| 8:00 AM to 8:29 AM | 16 (18.4%) | 18 (14.0%) |
| 8:30 AM to 8:59 AM | 0 (0.0%) | 3 (2.3%) |
| 9:00 AM to 9:59 AM | 3 (3.5%) | 1 (0.8%) |
| 10:00 AM to 10:59 AM | 2 (2.3%) | 1 (0.8%) |
| 11:00 AM to 11:59 AM | 0 (0.0%) | 0 (0.0%) |
| 12:00 PM to 3:59 PM | 12 (13.8%) | 12 (9.3%) |
| 4:00 PM to 11:59 PM | 7 (8.1%) | 4 (3.1%) |
| Total | 87 (100.0%) | 129 (100.0%) |
Housing Occupancy in La Jara
Occupancy by Ownership in La Jara
Of the total 268 dwellings in La Jara, owner-occupied units account for 178 (66.4%), while renter-occupied units make up 90 (33.6%).
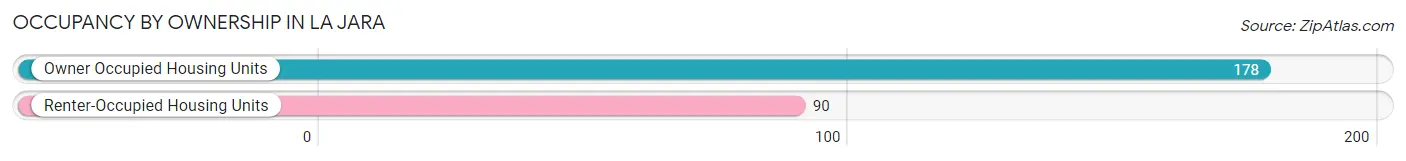
| Occupancy | # Housing Units | % Housing Units |
| Owner Occupied Housing Units | 178 | 66.4% |
| Renter-Occupied Housing Units | 90 | 33.6% |
| Total Occupied Housing Units | 268 | 100.0% |
Occupancy by Household Size in La Jara
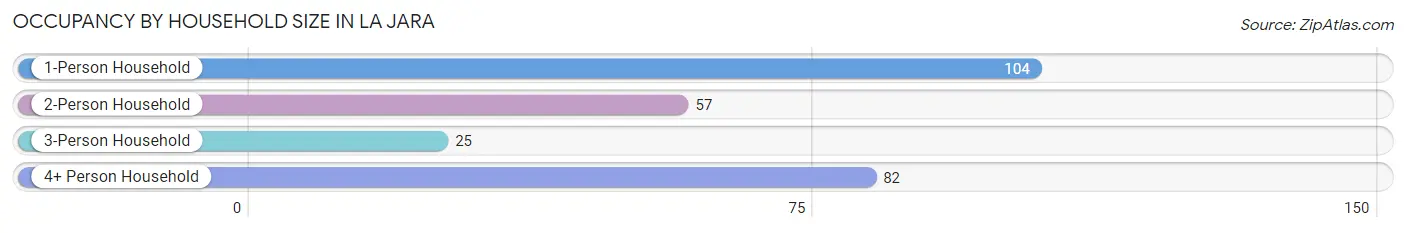
| Household Size | # Housing Units | % Housing Units |
| 1-Person Household | 104 | 38.8% |
| 2-Person Household | 57 | 21.3% |
| 3-Person Household | 25 | 9.3% |
| 4+ Person Household | 82 | 30.6% |
| Total Housing Units | 268 | 100.0% |
Occupancy by Ownership by Household Size in La Jara
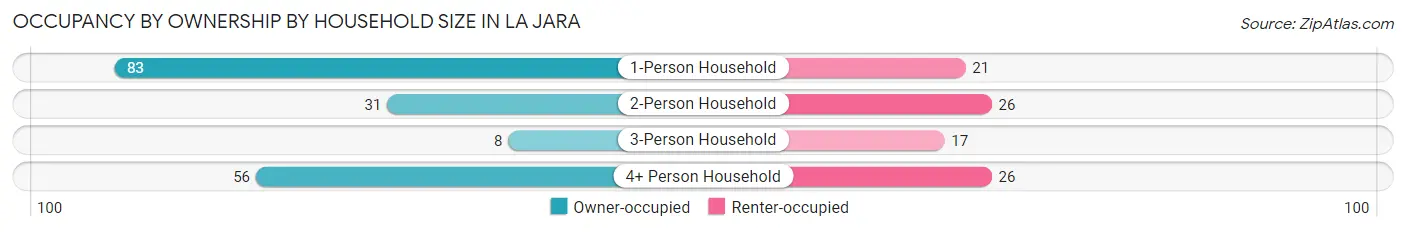
| Household Size | Owner-occupied | Renter-occupied |
| 1-Person Household | 83 (79.8%) | 21 (20.2%) |
| 2-Person Household | 31 (54.4%) | 26 (45.6%) |
| 3-Person Household | 8 (32.0%) | 17 (68.0%) |
| 4+ Person Household | 56 (68.3%) | 26 (31.7%) |
| Total Housing Units | 178 (66.4%) | 90 (33.6%) |
Occupancy by Educational Attainment in La Jara
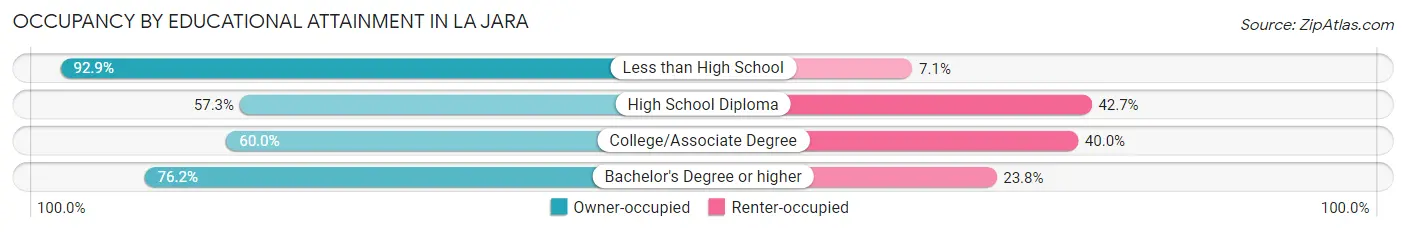
| Household Size | Owner-occupied | Renter-occupied |
| Less than High School | 26 (92.9%) | 2 (7.1%) |
| High School Diploma | 47 (57.3%) | 35 (42.7%) |
| College/Associate Degree | 57 (60.0%) | 38 (40.0%) |
| Bachelor's Degree or higher | 48 (76.2%) | 15 (23.8%) |
Occupancy by Age of Householder in La Jara
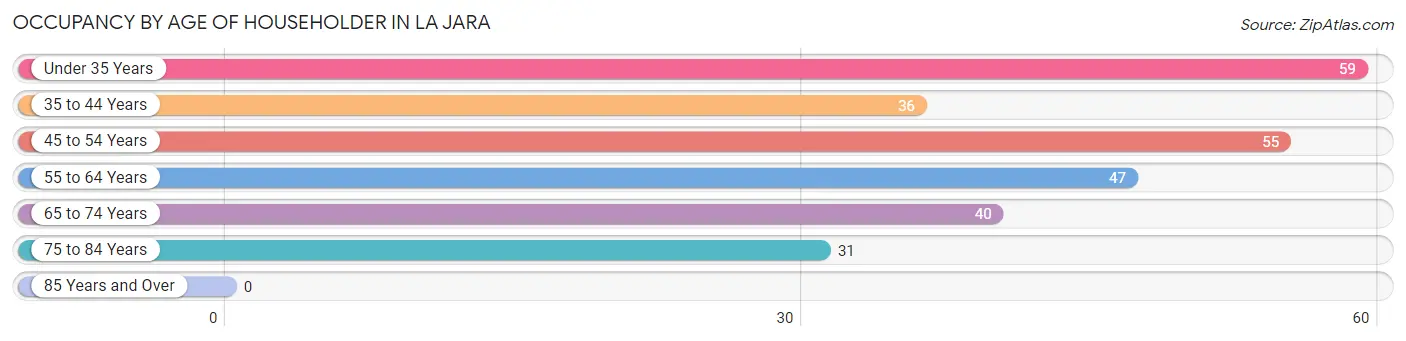
| Age Bracket | # Households | % Households |
| Under 35 Years | 59 | 22.0% |
| 35 to 44 Years | 36 | 13.4% |
| 45 to 54 Years | 55 | 20.5% |
| 55 to 64 Years | 47 | 17.5% |
| 65 to 74 Years | 40 | 14.9% |
| 75 to 84 Years | 31 | 11.6% |
| 85 Years and Over | 0 | 0.0% |
| Total | 268 | 100.0% |
Housing Finances in La Jara
Median Income by Occupancy in La Jara
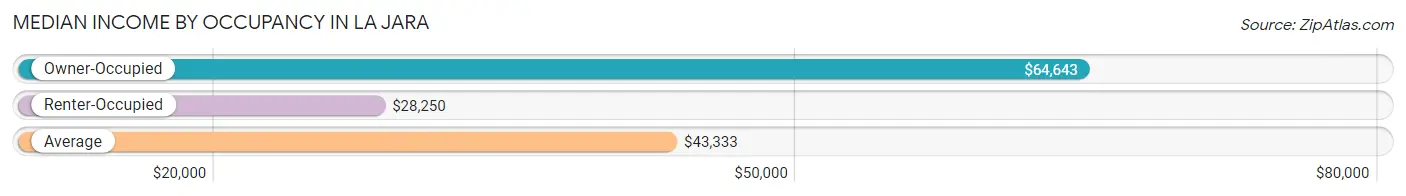
| Occupancy Type | # Households | Median Income |
| Owner-Occupied | 178 (66.4%) | $64,643 |
| Renter-Occupied | 90 (33.6%) | $28,250 |
| Average | 268 (100.0%) | $43,333 |
Occupancy by Householder Income Bracket in La Jara
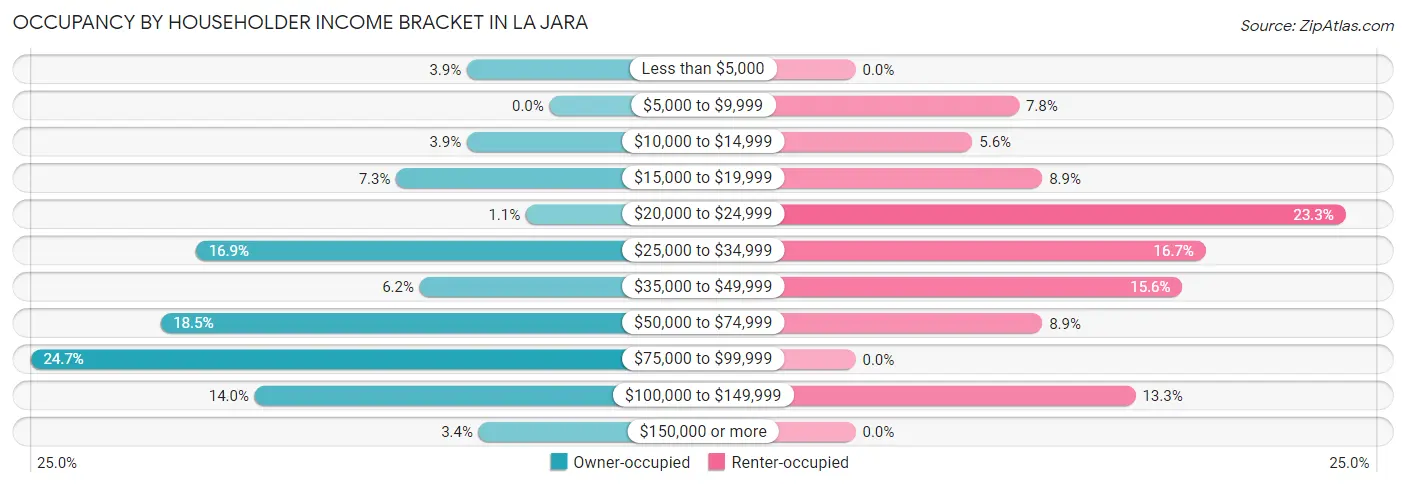
| Income Bracket | Owner-occupied | Renter-occupied |
| Less than $5,000 | 7 (3.9%) | 0 (0.0%) |
| $5,000 to $9,999 | 0 (0.0%) | 7 (7.8%) |
| $10,000 to $14,999 | 7 (3.9%) | 5 (5.6%) |
| $15,000 to $19,999 | 13 (7.3%) | 8 (8.9%) |
| $20,000 to $24,999 | 2 (1.1%) | 21 (23.3%) |
| $25,000 to $34,999 | 30 (16.9%) | 15 (16.7%) |
| $35,000 to $49,999 | 11 (6.2%) | 14 (15.6%) |
| $50,000 to $74,999 | 33 (18.5%) | 8 (8.9%) |
| $75,000 to $99,999 | 44 (24.7%) | 0 (0.0%) |
| $100,000 to $149,999 | 25 (14.0%) | 12 (13.3%) |
| $150,000 or more | 6 (3.4%) | 0 (0.0%) |
| Total | 178 (100.0%) | 90 (100.0%) |
Monthly Housing Cost Tiers in La Jara
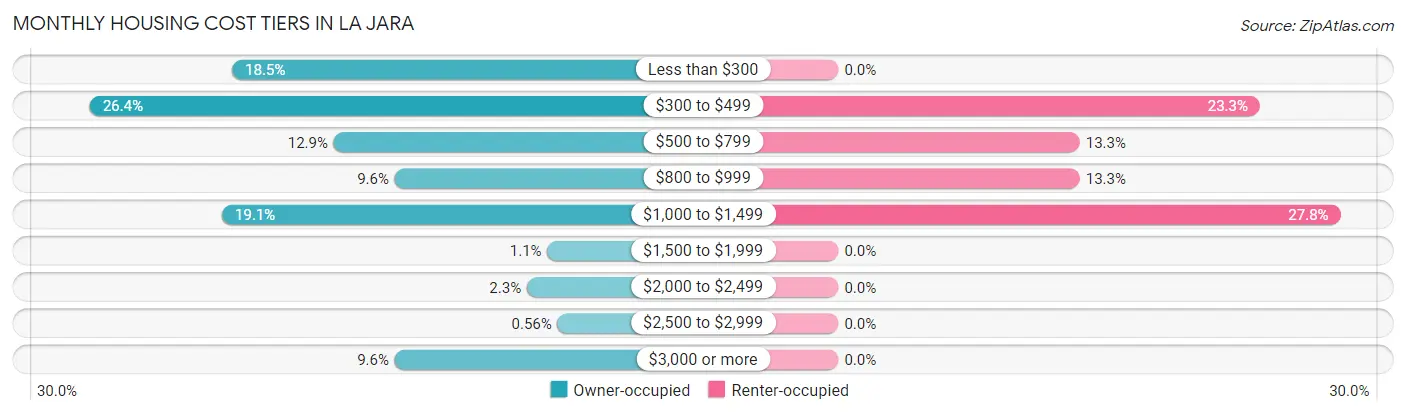
| Monthly Cost | Owner-occupied | Renter-occupied |
| Less than $300 | 33 (18.5%) | 0 (0.0%) |
| $300 to $499 | 47 (26.4%) | 21 (23.3%) |
| $500 to $799 | 23 (12.9%) | 12 (13.3%) |
| $800 to $999 | 17 (9.6%) | 12 (13.3%) |
| $1,000 to $1,499 | 34 (19.1%) | 25 (27.8%) |
| $1,500 to $1,999 | 2 (1.1%) | 0 (0.0%) |
| $2,000 to $2,499 | 4 (2.2%) | 0 (0.0%) |
| $2,500 to $2,999 | 1 (0.6%) | 0 (0.0%) |
| $3,000 or more | 17 (9.6%) | 0 (0.0%) |
| Total | 178 (100.0%) | 90 (100.0%) |
Physical Housing Characteristics in La Jara
Housing Structures in La Jara
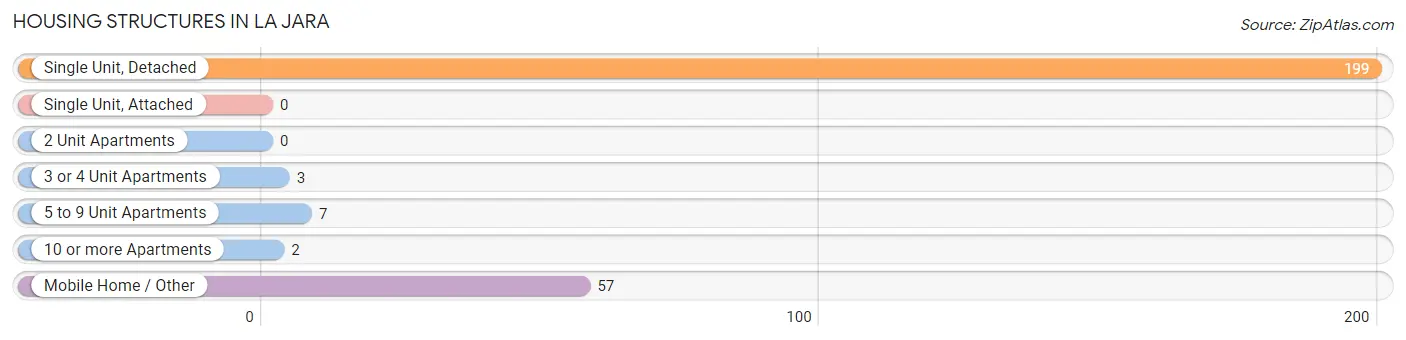
| Structure Type | # Housing Units | % Housing Units |
| Single Unit, Detached | 199 | 74.3% |
| Single Unit, Attached | 0 | 0.0% |
| 2 Unit Apartments | 0 | 0.0% |
| 3 or 4 Unit Apartments | 3 | 1.1% |
| 5 to 9 Unit Apartments | 7 | 2.6% |
| 10 or more Apartments | 2 | 0.7% |
| Mobile Home / Other | 57 | 21.3% |
| Total | 268 | 100.0% |
Housing Structures by Occupancy in La Jara
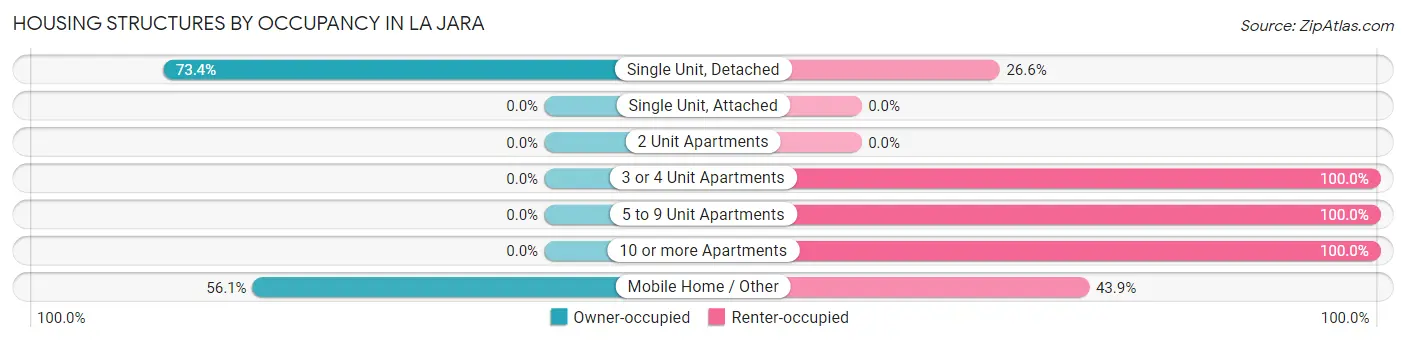
| Structure Type | Owner-occupied | Renter-occupied |
| Single Unit, Detached | 146 (73.4%) | 53 (26.6%) |
| Single Unit, Attached | 0 (0.0%) | 0 (0.0%) |
| 2 Unit Apartments | 0 (0.0%) | 0 (0.0%) |
| 3 or 4 Unit Apartments | 0 (0.0%) | 3 (100.0%) |
| 5 to 9 Unit Apartments | 0 (0.0%) | 7 (100.0%) |
| 10 or more Apartments | 0 (0.0%) | 2 (100.0%) |
| Mobile Home / Other | 32 (56.1%) | 25 (43.9%) |
| Total | 178 (66.4%) | 90 (33.6%) |
Housing Structures by Number of Rooms in La Jara
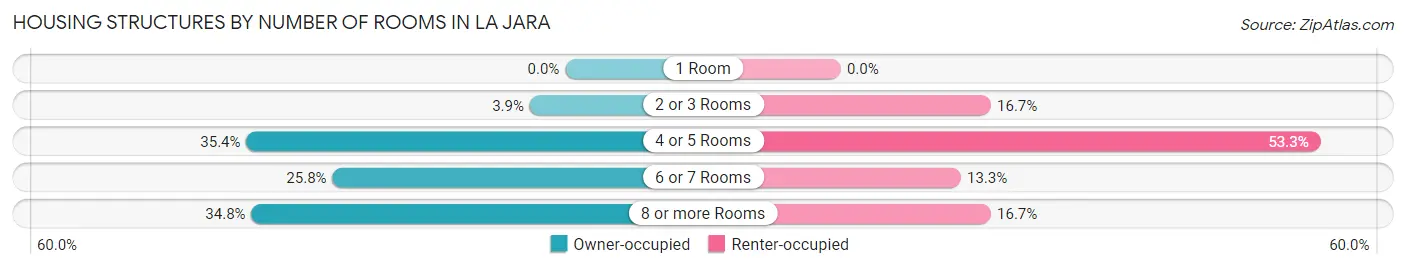
| Number of Rooms | Owner-occupied | Renter-occupied |
| 1 Room | 0 (0.0%) | 0 (0.0%) |
| 2 or 3 Rooms | 7 (3.9%) | 15 (16.7%) |
| 4 or 5 Rooms | 63 (35.4%) | 48 (53.3%) |
| 6 or 7 Rooms | 46 (25.8%) | 12 (13.3%) |
| 8 or more Rooms | 62 (34.8%) | 15 (16.7%) |
| Total | 178 (100.0%) | 90 (100.0%) |
Housing Structure by Heating Type in La Jara
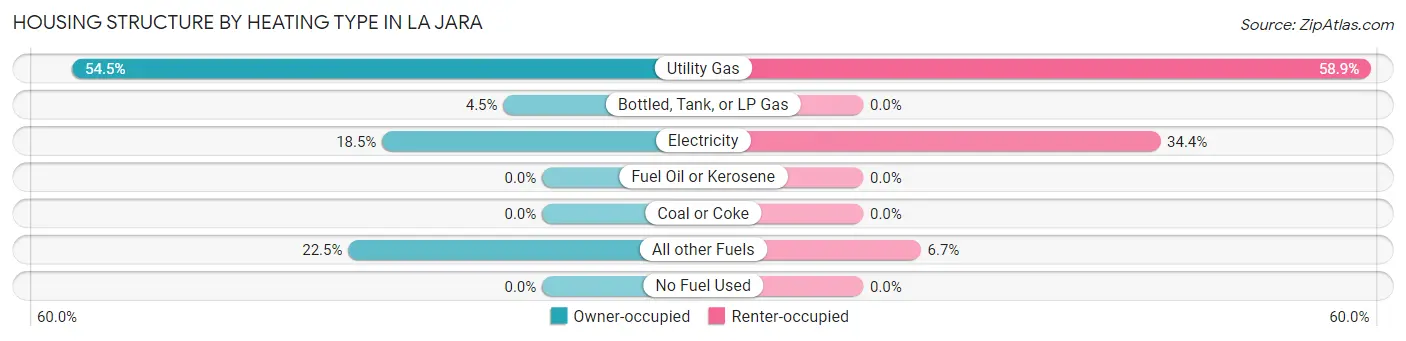
| Heating Type | Owner-occupied | Renter-occupied |
| Utility Gas | 97 (54.5%) | 53 (58.9%) |
| Bottled, Tank, or LP Gas | 8 (4.5%) | 0 (0.0%) |
| Electricity | 33 (18.5%) | 31 (34.4%) |
| Fuel Oil or Kerosene | 0 (0.0%) | 0 (0.0%) |
| Coal or Coke | 0 (0.0%) | 0 (0.0%) |
| All other Fuels | 40 (22.5%) | 6 (6.7%) |
| No Fuel Used | 0 (0.0%) | 0 (0.0%) |
| Total | 178 (100.0%) | 90 (100.0%) |
Household Vehicle Usage in La Jara
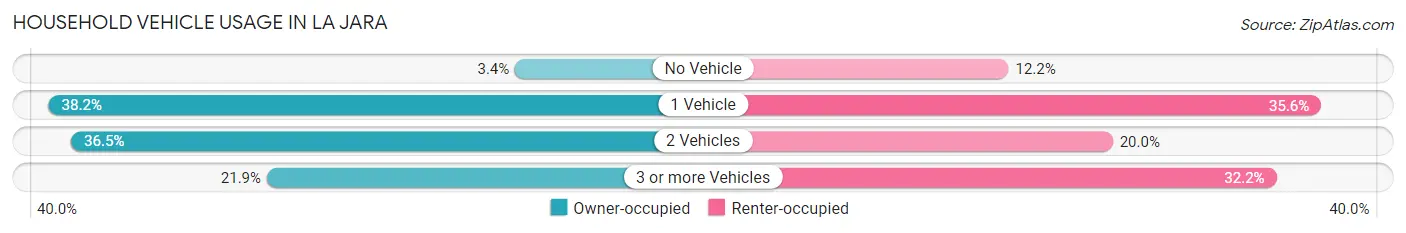
| Vehicles per Household | Owner-occupied | Renter-occupied |
| No Vehicle | 6 (3.4%) | 11 (12.2%) |
| 1 Vehicle | 68 (38.2%) | 32 (35.6%) |
| 2 Vehicles | 65 (36.5%) | 18 (20.0%) |
| 3 or more Vehicles | 39 (21.9%) | 29 (32.2%) |
| Total | 178 (100.0%) | 90 (100.0%) |
Real Estate & Mortgages in La Jara
Real Estate and Mortgage Overview in La Jara
| Characteristic | Without Mortgage | With Mortgage |
| Housing Units | 93 | 85 |
| Median Property Value | $99,400 | $163,700 |
| Median Household Income | $36,250 | $5 |
| Monthly Housing Costs | $326 | $17 |
| Real Estate Taxes | $467 | $0 |
Property Value by Mortgage Status in La Jara
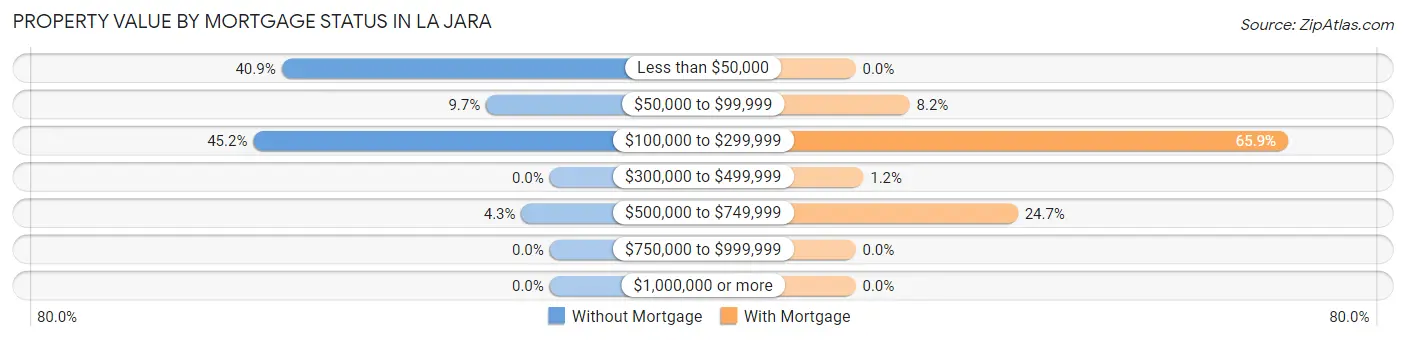
| Property Value | Without Mortgage | With Mortgage |
| Less than $50,000 | 38 (40.9%) | 0 (0.0%) |
| $50,000 to $99,999 | 9 (9.7%) | 7 (8.2%) |
| $100,000 to $299,999 | 42 (45.2%) | 56 (65.9%) |
| $300,000 to $499,999 | 0 (0.0%) | 1 (1.2%) |
| $500,000 to $749,999 | 4 (4.3%) | 21 (24.7%) |
| $750,000 to $999,999 | 0 (0.0%) | 0 (0.0%) |
| $1,000,000 or more | 0 (0.0%) | 0 (0.0%) |
| Total | 93 (100.0%) | 85 (100.0%) |
Household Income by Mortgage Status in La Jara
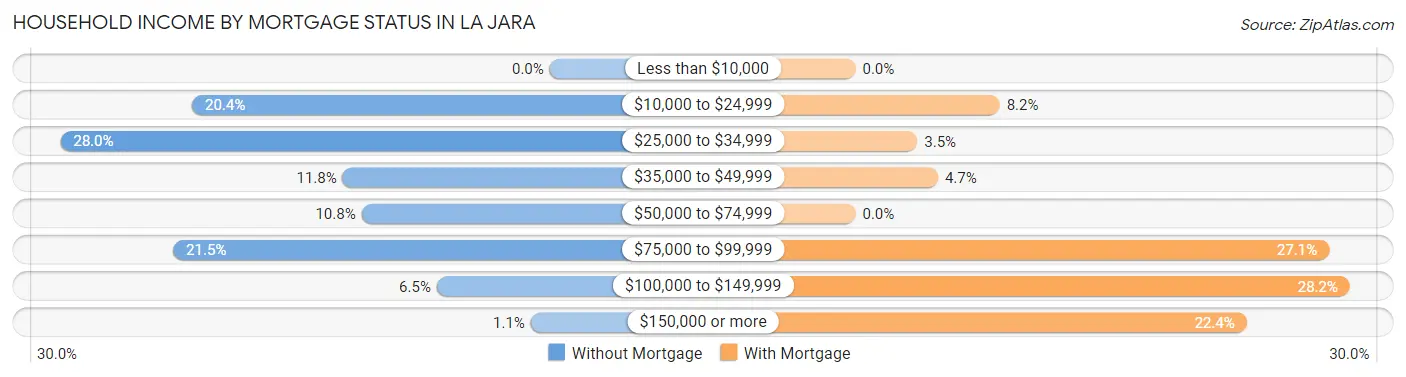
| Household Income | Without Mortgage | With Mortgage |
| Less than $10,000 | 0 (0.0%) | 0 (0.0%) |
| $10,000 to $24,999 | 19 (20.4%) | 7 (8.2%) |
| $25,000 to $34,999 | 26 (28.0%) | 3 (3.5%) |
| $35,000 to $49,999 | 11 (11.8%) | 4 (4.7%) |
| $50,000 to $74,999 | 10 (10.7%) | 0 (0.0%) |
| $75,000 to $99,999 | 20 (21.5%) | 23 (27.1%) |
| $100,000 to $149,999 | 6 (6.5%) | 24 (28.2%) |
| $150,000 or more | 1 (1.1%) | 19 (22.4%) |
| Total | 93 (100.0%) | 85 (100.0%) |
Property Value to Household Income Ratio in La Jara
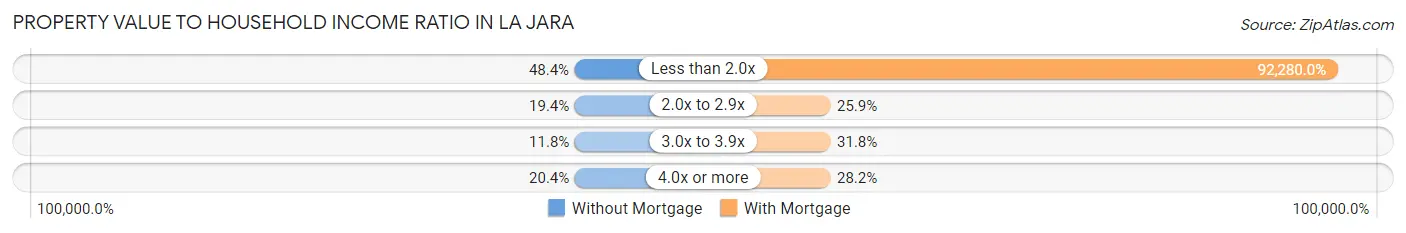
| Value-to-Income Ratio | Without Mortgage | With Mortgage |
| Less than 2.0x | 45 (48.4%) | 78,438 (92,280.0%) |
| 2.0x to 2.9x | 18 (19.4%) | 22 (25.9%) |
| 3.0x to 3.9x | 11 (11.8%) | 27 (31.8%) |
| 4.0x or more | 19 (20.4%) | 24 (28.2%) |
| Total | 93 (100.0%) | 85 (100.0%) |
Real Estate Taxes by Mortgage Status in La Jara
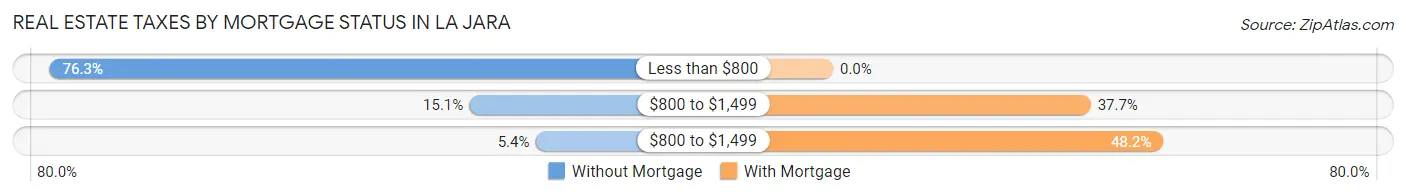
| Property Taxes | Without Mortgage | With Mortgage |
| Less than $800 | 71 (76.3%) | 0 (0.0%) |
| $800 to $1,499 | 14 (15.0%) | 32 (37.7%) |
| $800 to $1,499 | 5 (5.4%) | 41 (48.2%) |
| Total | 93 (100.0%) | 85 (100.0%) |
Health & Disability in La Jara
Health Insurance Coverage by Age in La Jara
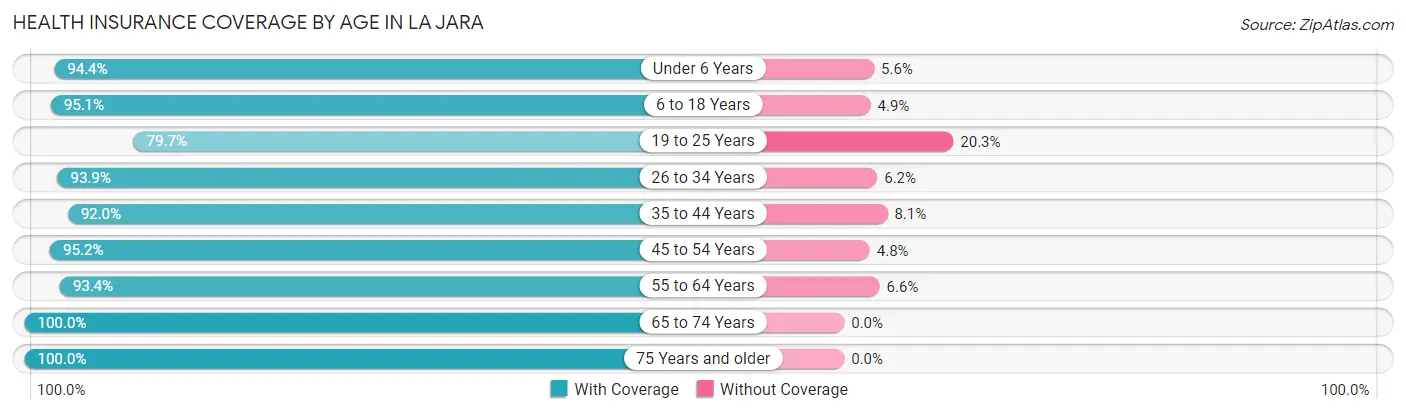
| Age Bracket | With Coverage | Without Coverage |
| Under 6 Years | 68 (94.4%) | 4 (5.6%) |
| 6 to 18 Years | 136 (95.1%) | 7 (4.9%) |
| 19 to 25 Years | 47 (79.7%) | 12 (20.3%) |
| 26 to 34 Years | 61 (93.9%) | 4 (6.1%) |
| 35 to 44 Years | 80 (91.9%) | 7 (8.1%) |
| 45 to 54 Years | 60 (95.2%) | 3 (4.8%) |
| 55 to 64 Years | 71 (93.4%) | 5 (6.6%) |
| 65 to 74 Years | 69 (100.0%) | 0 (0.0%) |
| 75 Years and older | 35 (100.0%) | 0 (0.0%) |
| Total | 627 (93.7%) | 42 (6.3%) |
Health Insurance Coverage by Citizenship Status in La Jara
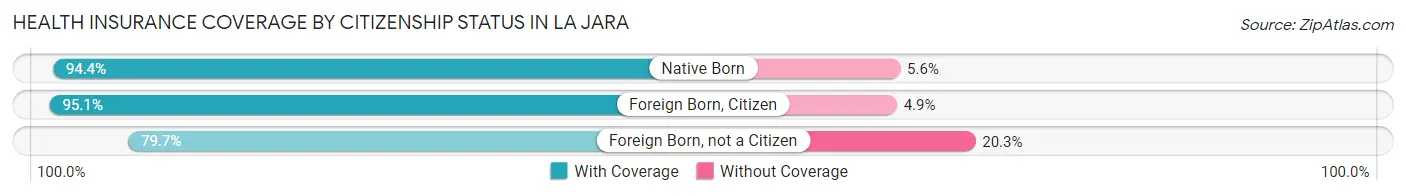
| Citizenship Status | With Coverage | Without Coverage |
| Native Born | 68 (94.4%) | 4 (5.6%) |
| Foreign Born, Citizen | 136 (95.1%) | 7 (4.9%) |
| Foreign Born, not a Citizen | 47 (79.7%) | 12 (20.3%) |
Health Insurance Coverage by Household Income in La Jara
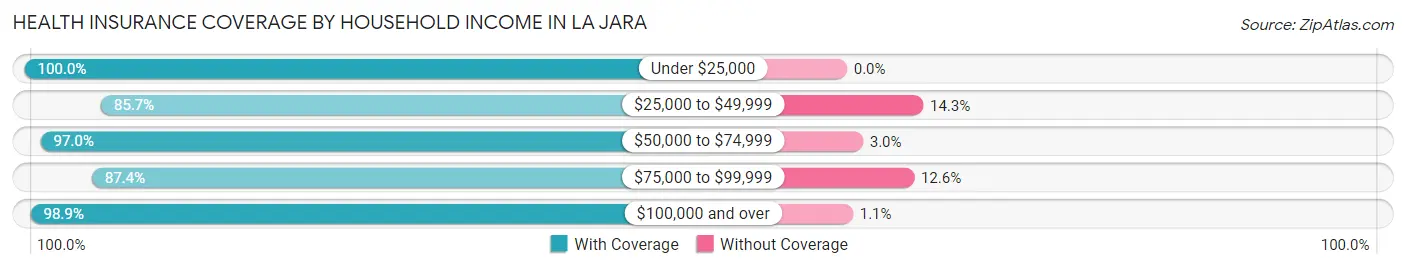
| Household Income | With Coverage | Without Coverage |
| Under $25,000 | 140 (100.0%) | 0 (0.0%) |
| $25,000 to $49,999 | 120 (85.7%) | 20 (14.3%) |
| $50,000 to $74,999 | 130 (97.0%) | 4 (3.0%) |
| $75,000 to $99,999 | 118 (87.4%) | 17 (12.6%) |
| $100,000 and over | 88 (98.9%) | 1 (1.1%) |
Public vs Private Health Insurance Coverage by Age in La Jara
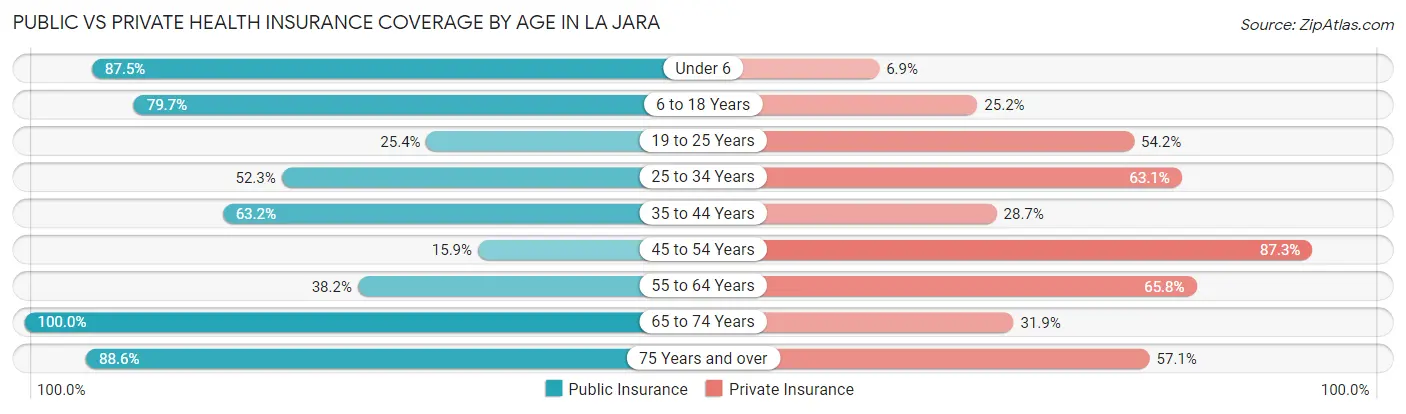
| Age Bracket | Public Insurance | Private Insurance |
| Under 6 | 63 (87.5%) | 5 (6.9%) |
| 6 to 18 Years | 114 (79.7%) | 36 (25.2%) |
| 19 to 25 Years | 15 (25.4%) | 32 (54.2%) |
| 25 to 34 Years | 34 (52.3%) | 41 (63.1%) |
| 35 to 44 Years | 55 (63.2%) | 25 (28.7%) |
| 45 to 54 Years | 10 (15.9%) | 55 (87.3%) |
| 55 to 64 Years | 29 (38.2%) | 50 (65.8%) |
| 65 to 74 Years | 69 (100.0%) | 22 (31.9%) |
| 75 Years and over | 31 (88.6%) | 20 (57.1%) |
| Total | 420 (62.8%) | 286 (42.7%) |
Disability Status by Sex by Age in La Jara
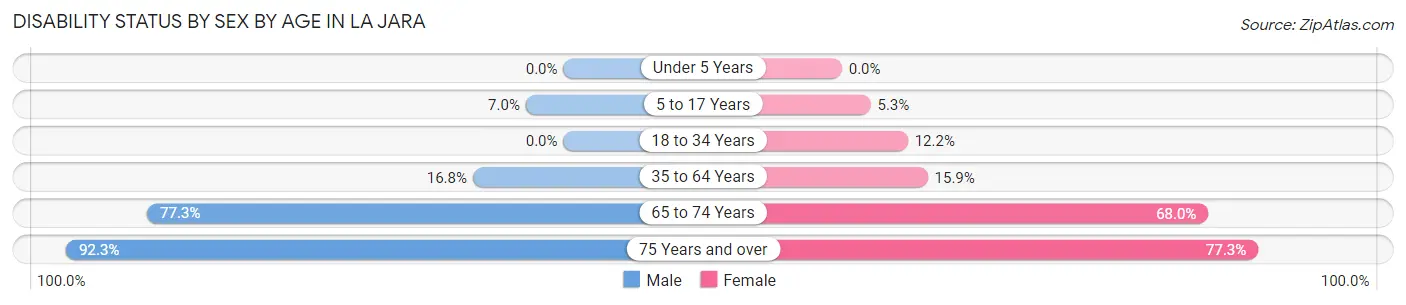
| Age Bracket | Male | Female |
| Under 5 Years | 0 (0.0%) | 0 (0.0%) |
| 5 to 17 Years | 6 (7.0%) | 4 (5.3%) |
| 18 to 34 Years | 0 (0.0%) | 12 (12.2%) |
| 35 to 64 Years | 19 (16.8%) | 18 (15.9%) |
| 65 to 74 Years | 34 (77.3%) | 17 (68.0%) |
| 75 Years and over | 12 (92.3%) | 17 (77.3%) |
Disability Class by Sex by Age in La Jara
Disability Class: Hearing Difficulty
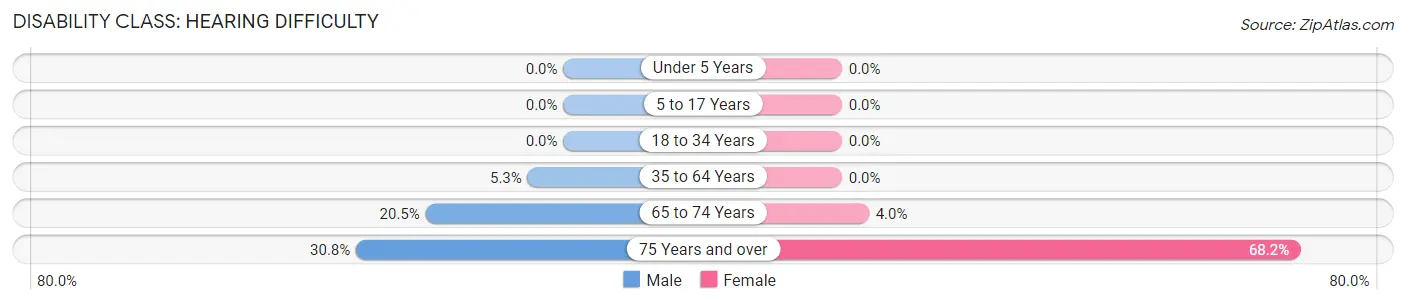
| Age Bracket | Male | Female |
| Under 5 Years | 0 (0.0%) | 0 (0.0%) |
| 5 to 17 Years | 0 (0.0%) | 0 (0.0%) |
| 18 to 34 Years | 0 (0.0%) | 0 (0.0%) |
| 35 to 64 Years | 6 (5.3%) | 0 (0.0%) |
| 65 to 74 Years | 9 (20.4%) | 1 (4.0%) |
| 75 Years and over | 4 (30.8%) | 15 (68.2%) |
Disability Class: Vision Difficulty
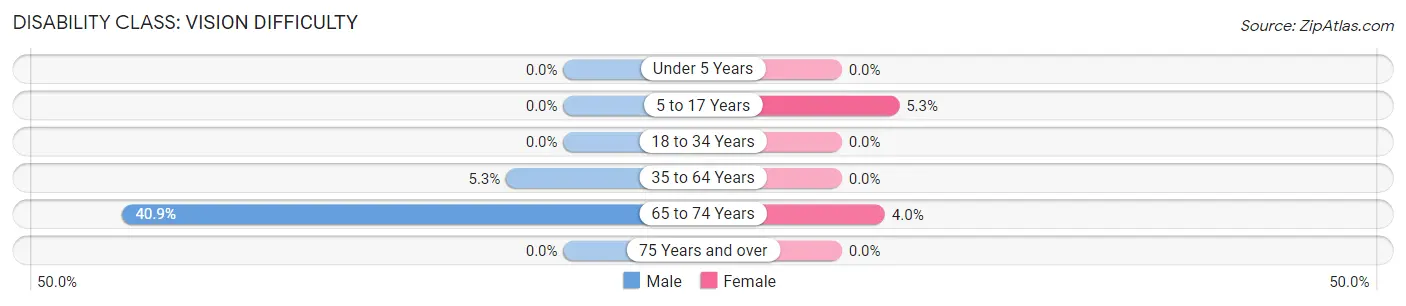
| Age Bracket | Male | Female |
| Under 5 Years | 0 (0.0%) | 0 (0.0%) |
| 5 to 17 Years | 0 (0.0%) | 4 (5.3%) |
| 18 to 34 Years | 0 (0.0%) | 0 (0.0%) |
| 35 to 64 Years | 6 (5.3%) | 0 (0.0%) |
| 65 to 74 Years | 18 (40.9%) | 1 (4.0%) |
| 75 Years and over | 0 (0.0%) | 0 (0.0%) |
Disability Class: Cognitive Difficulty
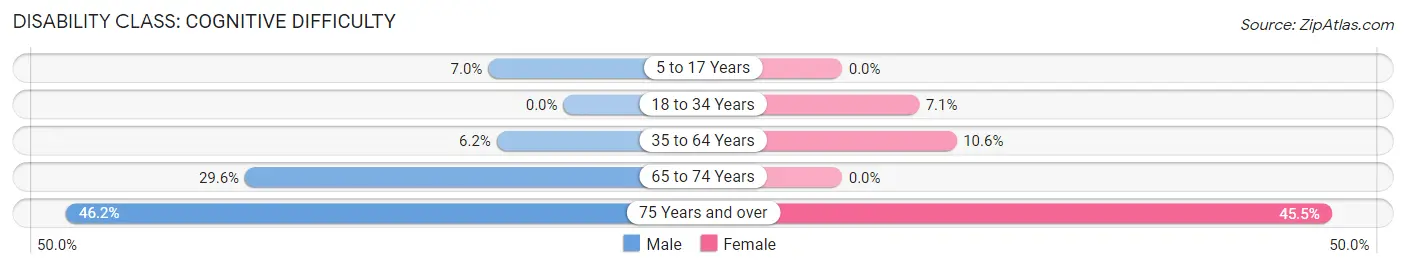
| Age Bracket | Male | Female |
| 5 to 17 Years | 6 (7.0%) | 0 (0.0%) |
| 18 to 34 Years | 0 (0.0%) | 7 (7.1%) |
| 35 to 64 Years | 7 (6.2%) | 12 (10.6%) |
| 65 to 74 Years | 13 (29.5%) | 0 (0.0%) |
| 75 Years and over | 6 (46.2%) | 10 (45.5%) |
Disability Class: Ambulatory Difficulty
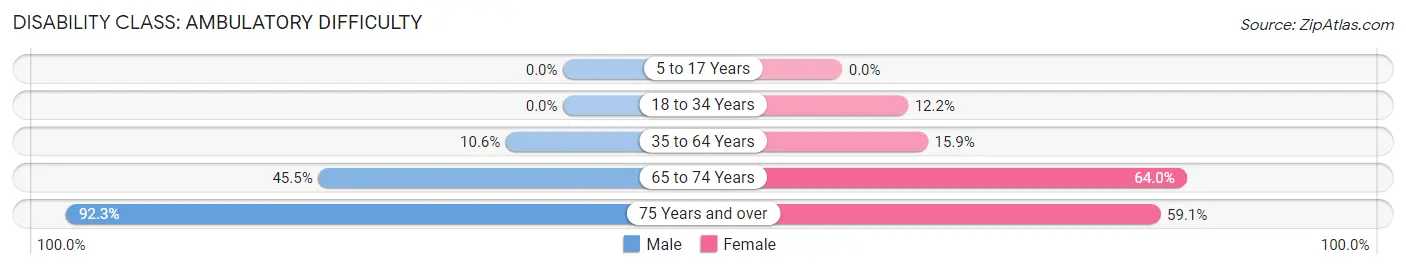
| Age Bracket | Male | Female |
| 5 to 17 Years | 0 (0.0%) | 0 (0.0%) |
| 18 to 34 Years | 0 (0.0%) | 12 (12.2%) |
| 35 to 64 Years | 12 (10.6%) | 18 (15.9%) |
| 65 to 74 Years | 20 (45.5%) | 16 (64.0%) |
| 75 Years and over | 12 (92.3%) | 13 (59.1%) |
Disability Class: Self-Care Difficulty
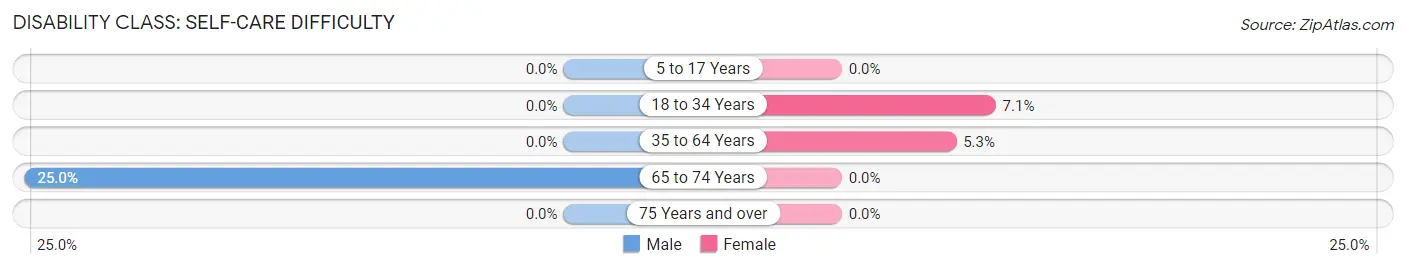
| Age Bracket | Male | Female |
| 5 to 17 Years | 0 (0.0%) | 0 (0.0%) |
| 18 to 34 Years | 0 (0.0%) | 7 (7.1%) |
| 35 to 64 Years | 0 (0.0%) | 6 (5.3%) |
| 65 to 74 Years | 11 (25.0%) | 0 (0.0%) |
| 75 Years and over | 0 (0.0%) | 0 (0.0%) |
Technology Access in La Jara
Computing Device Access in La Jara
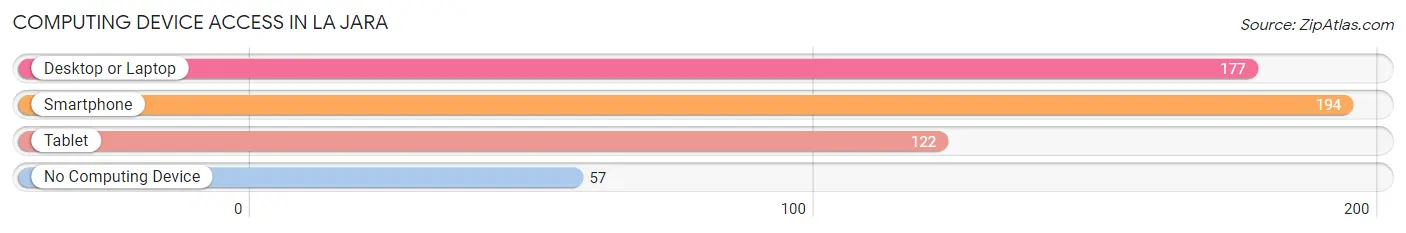
| Device Type | # Households | % Households |
| Desktop or Laptop | 177 | 66.0% |
| Smartphone | 194 | 72.4% |
| Tablet | 122 | 45.5% |
| No Computing Device | 57 | 21.3% |
| Total | 268 | 100.0% |
Internet Access in La Jara
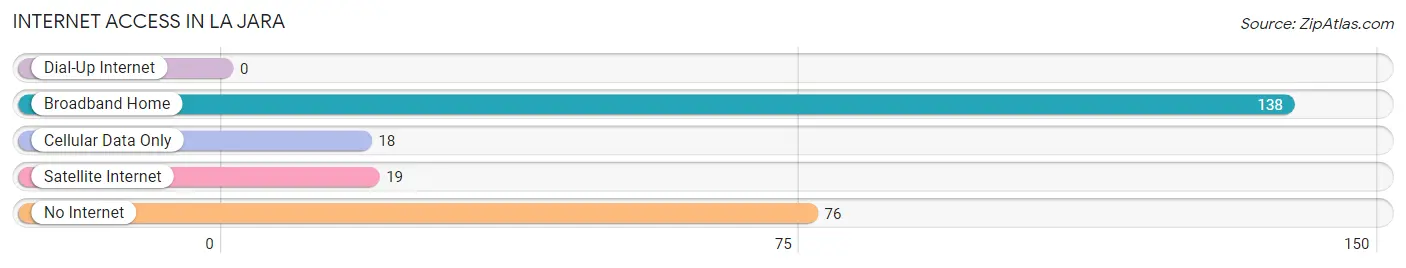
| Internet Type | # Households | % Households |
| Dial-Up Internet | 0 | 0.0% |
| Broadband Home | 138 | 51.5% |
| Cellular Data Only | 18 | 6.7% |
| Satellite Internet | 19 | 7.1% |
| No Internet | 76 | 28.4% |
| Total | 268 | 100.0% |
La Jara Summary
La Jara is a small town located in the San Luis Valley of Colorado. It is situated in the southwestern part of the state, about 90 miles south of Denver. The town was founded in 1876 and is the county seat of Conejos County. La Jara has a population of 1,845 people, according to the 2010 census.
History
La Jara was founded in 1876 by a group of settlers from New Mexico. The town was named after the Spanish word for “the jar,” which was a type of pottery made by the local Native Americans. The town was originally a farming community, and the settlers grew wheat, corn, and other crops.
In the late 1800s, La Jara became a stop on the Denver and Rio Grande Railroad. This allowed the town to become a trading center for the surrounding area. The railroad also brought in new settlers, and the population of La Jara began to grow.
In the early 1900s, La Jara became a center for the local coal mining industry. The town was home to several coal mines, and the miners provided much of the town’s income. The coal industry declined in the mid-1900s, and the town’s economy shifted to agriculture and tourism.
Geography
La Jara is located in the San Luis Valley of Colorado. The valley is a large, flat basin surrounded by mountains on all sides. The town is situated at an elevation of 7,400 feet, and the surrounding area is mostly flat.
The climate in La Jara is semi-arid, with hot summers and cold winters. The average annual temperature is around 50 degrees Fahrenheit, and the average annual precipitation is around 12 inches.
Economy
The economy of La Jara is largely based on agriculture and tourism. The town is home to several farms, which produce wheat, corn, hay, and other crops. The town is also a popular tourist destination, and visitors come to enjoy the area’s natural beauty and outdoor activities.
The town is also home to several small businesses, including restaurants, shops, and other services. The town is also home to a branch of the Conejos County Bank, which provides banking services to the local community.
Demographics
According to the 2010 census, La Jara has a population of 1,845 people. The town is predominantly Hispanic, with over 90% of the population identifying as Hispanic or Latino. The median household income is $31,250, and the median age is 33.
La Jara is a small, rural town with a close-knit community. The town is home to several churches, and the local schools are highly rated. The town is also home to several parks and recreational areas, which provide a variety of outdoor activities for residents and visitors alike.
Common Questions
What is Per Capita Income in La Jara?
Per Capita income in La Jara is $23,686.
What is the Median Family Income in La Jara?
Median Family Income in La Jara is $42,381.
What is the Median Household income in La Jara?
Median Household Income in La Jara is $43,333.
What is Income or Wage Gap in La Jara?
Income or Wage Gap in La Jara is 19.5%.
Women in La Jara earn 80.5 cents for every dollar earned by a man.
What is Inequality or Gini Index in La Jara?
Inequality or Gini Index in La Jara is 0.41.
What is the Total Population of La Jara?
Total Population of La Jara is 669.
What is the Total Male Population of La Jara?
Total Male Population of La Jara is 302.
What is the Total Female Population of La Jara?
Total Female Population of La Jara is 367.
What is the Ratio of Males per 100 Females in La Jara?
There are 82.29 Males per 100 Females in La Jara.
What is the Ratio of Females per 100 Males in La Jara?
There are 121.52 Females per 100 Males in La Jara.
What is the Median Population Age in La Jara?
Median Population Age in La Jara is 34.4 Years.
What is the Average Family Size in La Jara
Average Family Size in La Jara is 3.2 People.
What is the Average Household Size in La Jara
Average Household Size in La Jara is 2.4 People.
How Large is the Labor Force in La Jara?
There are 284 People in the Labor Forcein in La Jara.
What is the Percentage of People in the Labor Force in La Jara?
60.7% of People are in the Labor Force in La Jara.
What is the Unemployment Rate in La Jara?
Unemployment Rate in La Jara is 15.1%.