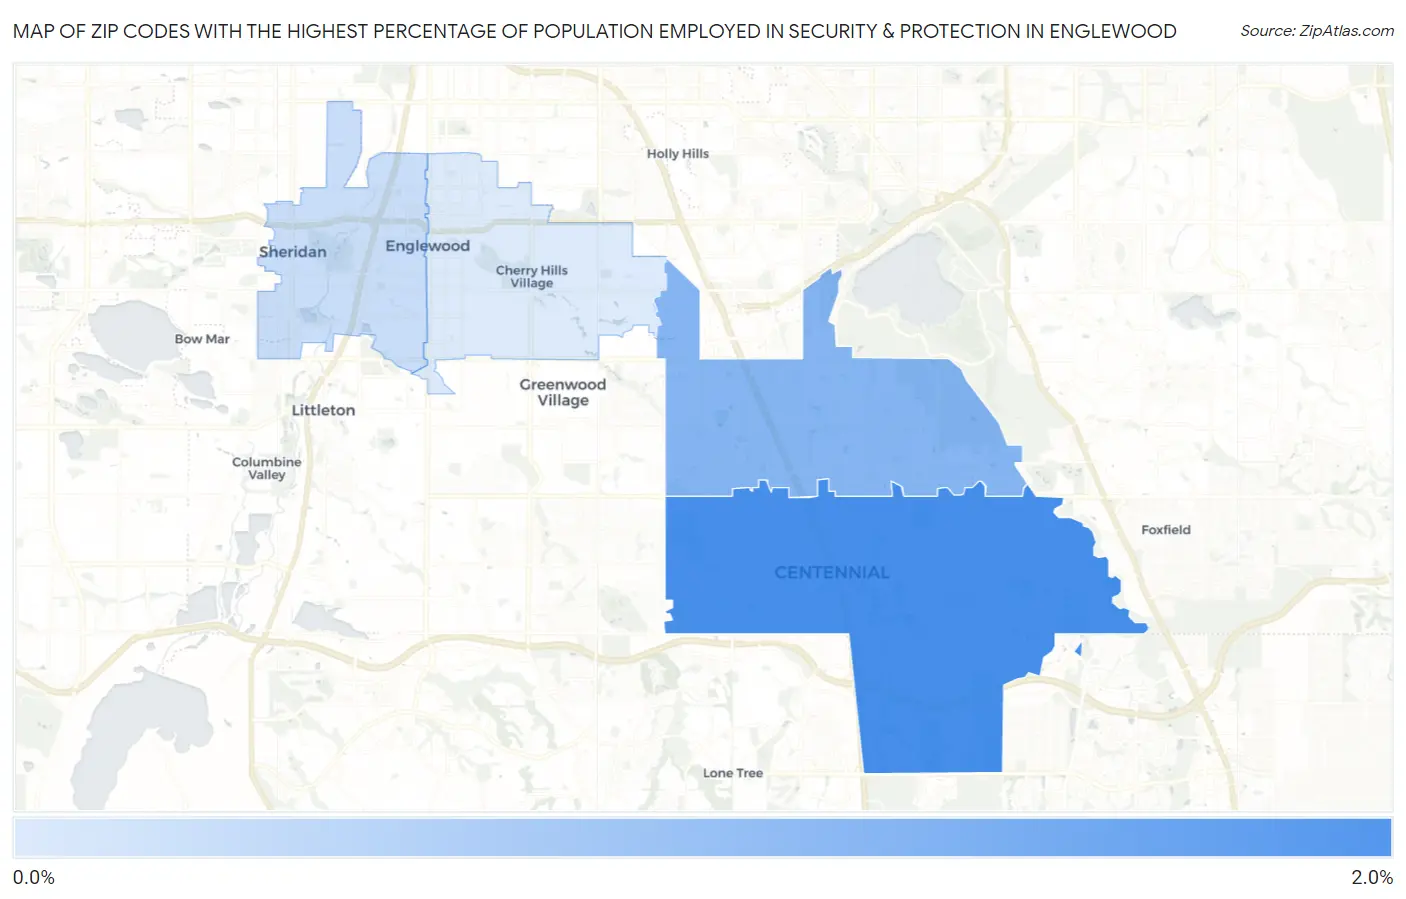
Zip Codes with the Highest Percentage of Population Employed in Security & Protection in Englewood, CO
RELATED REPORTS & OPTIONS
Security & Protection
Englewood
Compare Zip Codes
Map of Zip Codes with the Highest Percentage of Population Employed in Security & Protection in Englewood
0.84%
1.6%
Zip Codes with the Highest Percentage of Population Employed in Security & Protection in Englewood, CO
| Zip Code | % Employed | vs State | vs National | |
| 1. | 80112 | 1.6% | 2.0%(-0.374)#245 | 2.1%(-0.517)#15,173 |
| 2. | 80111 | 1.3% | 2.0%(-0.707)#288 | 2.1%(-0.850)#17,742 |
| 3. | 80110 | 0.95% | 2.0%(-1.06)#332 | 2.1%(-1.20)#20,441 |
| 4. | 80113 | 0.84% | 2.0%(-1.16)#341 | 2.1%(-1.30)#21,144 |
1
Common Questions
What are the Top 3 Zip Codes with the Highest Percentage of Population Employed in Security & Protection in Englewood, CO?
Top 3 Zip Codes with the Highest Percentage of Population Employed in Security & Protection in Englewood, CO are:
What zip code has the Highest Percentage of Population Employed in Security & Protection in Englewood, CO?
80112 has the Highest Percentage of Population Employed in Security & Protection in Englewood, CO with 1.6%.
What is the Percentage of Population Employed in Security & Protection in Englewood, CO?
Percentage of Population Employed in Security & Protection in Englewood is 0.98%.
What is the Percentage of Population Employed in Security & Protection in Colorado?
Percentage of Population Employed in Security & Protection in Colorado is 2.0%.
What is the Percentage of Population Employed in Security & Protection in the United States?
Percentage of Population Employed in Security & Protection in the United States is 2.1%.