Buena Vista, CO Map & Demographics
Buena Vista Map
Buena Vista Overview
$29,335
PER CAPITA INCOME
$52,437
AVG FAMILY INCOME
$58,168
AVG HOUSEHOLD INCOME
45.8%
WAGE / INCOME GAP [ % ]
54.2¢/ $1
WAGE / INCOME GAP [ $ ]
0.41
INEQUALITY / GINI INDEX
2,887
TOTAL POPULATION
1,555
MALE POPULATION
1,332
FEMALE POPULATION
116.74
MALES / 100 FEMALES
85.66
FEMALES / 100 MALES
33.3
MEDIAN AGE
2.7
AVG FAMILY SIZE
2.2
AVG HOUSEHOLD SIZE
1,930
LABOR FORCE [ PEOPLE ]
82.4%
PERCENT IN LABOR FORCE
16.8%
UNEMPLOYMENT RATE
Buena Vista Zip Codes
Buena Vista Area Codes
Income in Buena Vista
Income Overview in Buena Vista
Per Capita Income in Buena Vista is $29,335, while median incomes of families and households are $52,437 and $58,168 respectively.
| Characteristic | Number | Measure |
| Per Capita Income | 2,887 | $29,335 |
| Median Family Income | 604 | $52,437 |
| Mean Family Income | 604 | $63,848 |
| Median Household Income | 1,319 | $58,168 |
| Mean Household Income | 1,319 | $71,721 |
| Income Deficit | 604 | $0 |
| Wage / Income Gap (%) | 2,887 | 45.79% |
| Wage / Income Gap ($) | 2,887 | 54.21¢ per $1 |
| Gini / Inequality Index | 2,887 | 0.41 |
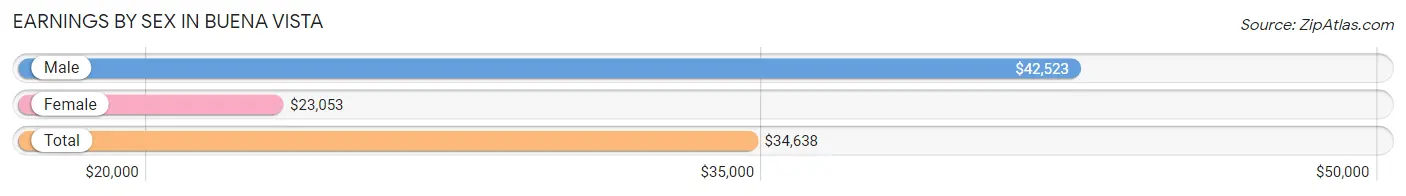
Earnings by Sex in Buena Vista
Average Earnings in Buena Vista are $34,638, $42,523 for men and $23,053 for women, a difference of 45.8%.
| Sex | Number | Average Earnings |
| Male | 1,031 (60.4%) | $42,523 |
| Female | 675 (39.6%) | $23,053 |
| Total | 1,706 (100.0%) | $34,638 |
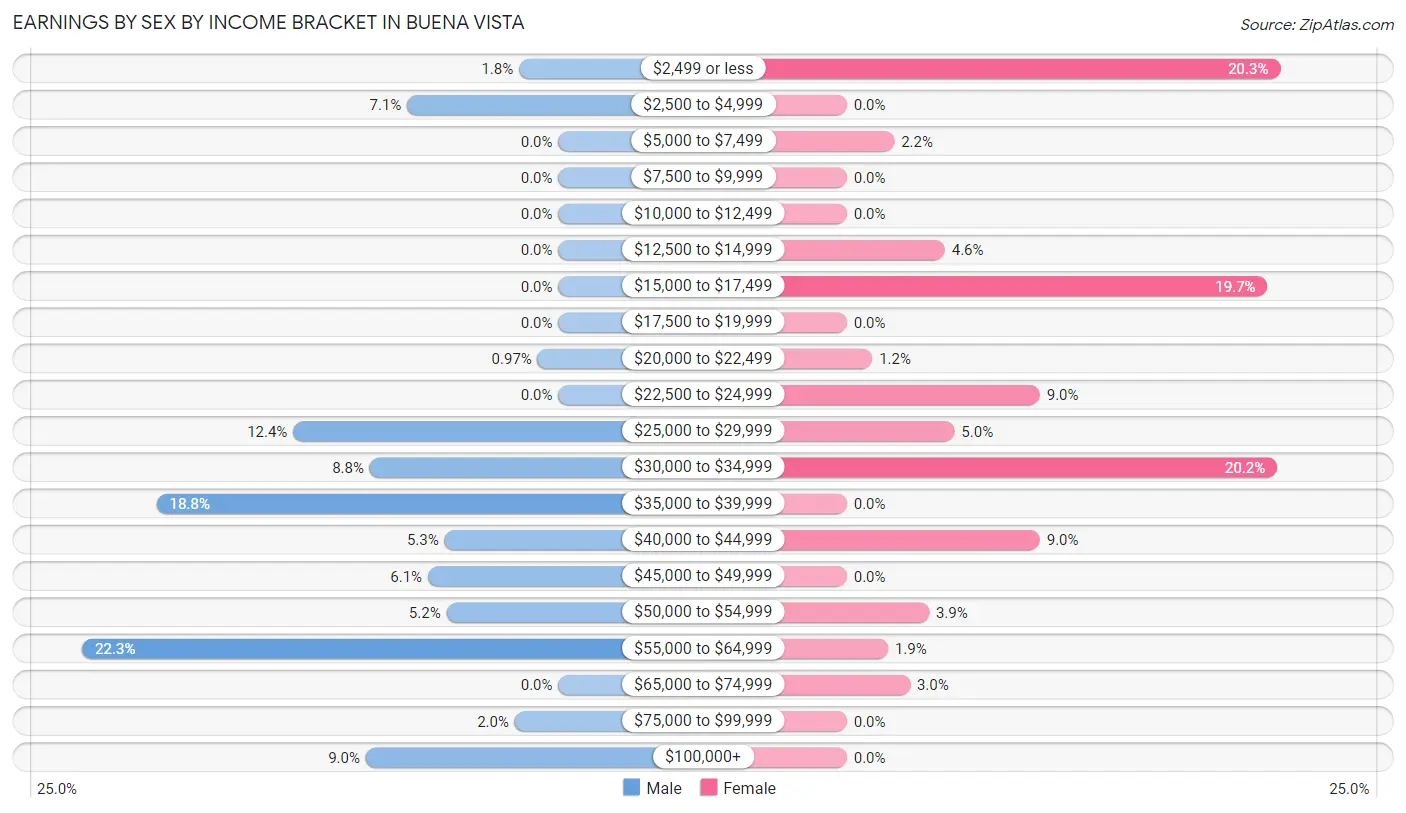
Earnings by Sex by Income Bracket in Buena Vista
The most common earnings brackets in Buena Vista are $55,000 to $64,999 for men (230 | 22.3%) and $2,499 or less for women (137 | 20.3%).
| Income | Male | Female |
| $2,499 or less | 19 (1.8%) | 137 (20.3%) |
| $2,500 to $4,999 | 73 (7.1%) | 0 (0.0%) |
| $5,000 to $7,499 | 0 (0.0%) | 15 (2.2%) |
| $7,500 to $9,999 | 0 (0.0%) | 0 (0.0%) |
| $10,000 to $12,499 | 0 (0.0%) | 0 (0.0%) |
| $12,500 to $14,999 | 0 (0.0%) | 31 (4.6%) |
| $15,000 to $17,499 | 0 (0.0%) | 133 (19.7%) |
| $17,500 to $19,999 | 0 (0.0%) | 0 (0.0%) |
| $20,000 to $22,499 | 10 (1.0%) | 8 (1.2%) |
| $22,500 to $24,999 | 0 (0.0%) | 61 (9.0%) |
| $25,000 to $29,999 | 128 (12.4%) | 34 (5.0%) |
| $30,000 to $34,999 | 91 (8.8%) | 136 (20.2%) |
| $35,000 to $39,999 | 194 (18.8%) | 0 (0.0%) |
| $40,000 to $44,999 | 55 (5.3%) | 61 (9.0%) |
| $45,000 to $49,999 | 63 (6.1%) | 0 (0.0%) |
| $50,000 to $54,999 | 54 (5.2%) | 26 (3.8%) |
| $55,000 to $64,999 | 230 (22.3%) | 13 (1.9%) |
| $65,000 to $74,999 | 0 (0.0%) | 20 (3.0%) |
| $75,000 to $99,999 | 21 (2.0%) | 0 (0.0%) |
| $100,000+ | 93 (9.0%) | 0 (0.0%) |
| Total | 1,031 (100.0%) | 675 (100.0%) |
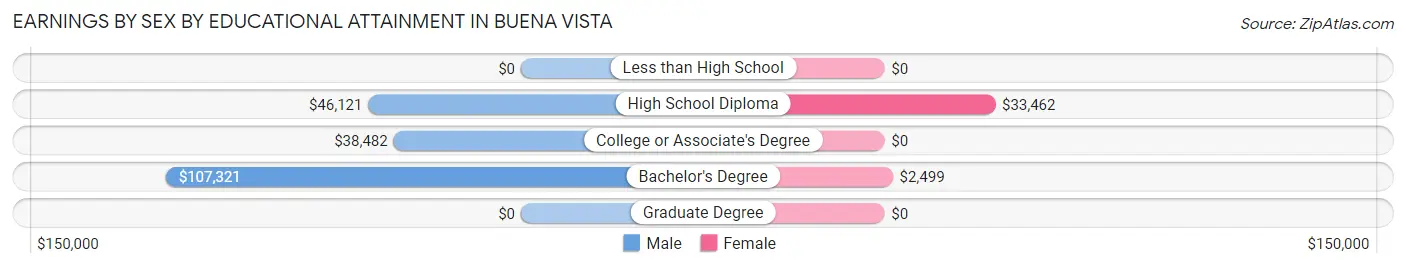
Earnings by Sex by Educational Attainment in Buena Vista
Average earnings in Buena Vista are $39,787 for men and $24,365 for women, a difference of 38.8%. Men with an educational attainment of bachelor's degree enjoy the highest average annual earnings of $107,321, while those with college or associate's degree education earn the least with $38,482. Women with an educational attainment of high school diploma earn the most with the average annual earnings of $33,462, while those with bachelor's degree education have the smallest earnings of $2,499.
| Educational Attainment | Male Income | Female Income |
| Less than High School | - | - |
| High School Diploma | $46,121 | $33,462 |
| College or Associate's Degree | $38,482 | $0 |
| Bachelor's Degree | $107,321 | $2,499 |
| Graduate Degree | - | - |
| Total | $39,787 | $24,365 |
Family Income in Buena Vista
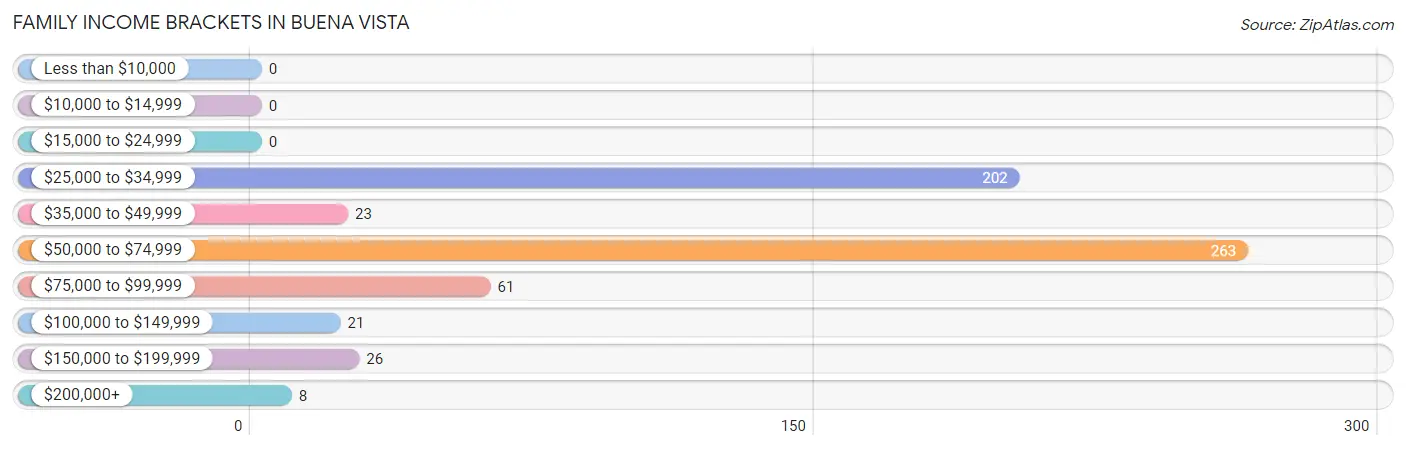
Family Income Brackets in Buena Vista
According to the Buena Vista family income data, there are 263 families falling into the $50,000 to $74,999 income range, which is the most common income bracket and makes up 43.5% of all families.
| Income Bracket | # Families | % Families |
| Less than $10,000 | 0 | 0.0% |
| $10,000 to $14,999 | 0 | 0.0% |
| $15,000 to $24,999 | 0 | 0.0% |
| $25,000 to $34,999 | 202 | 33.4% |
| $35,000 to $49,999 | 23 | 3.8% |
| $50,000 to $74,999 | 263 | 43.5% |
| $75,000 to $99,999 | 61 | 10.1% |
| $100,000 to $149,999 | 21 | 3.5% |
| $150,000 to $199,999 | 26 | 4.3% |
| $200,000+ | 8 | 1.3% |
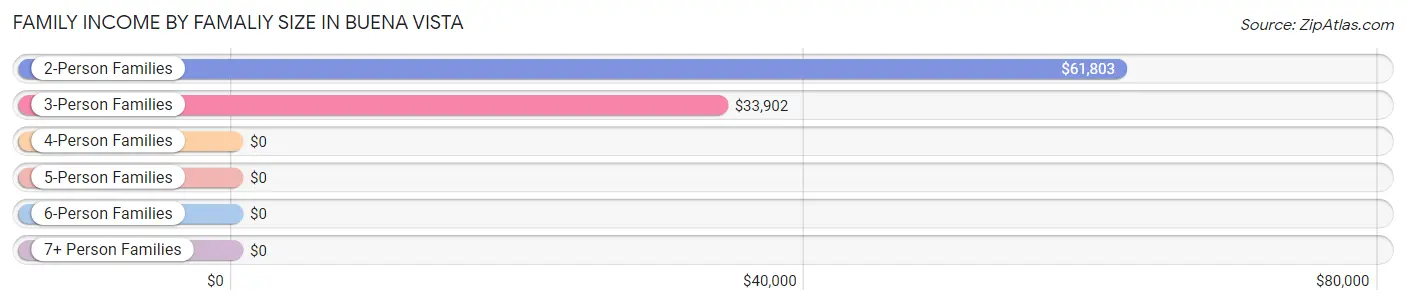
Family Income by Famaliy Size in Buena Vista
2-person families (276 | 45.7%) account for the highest median family income in Buena Vista with $61,803 per family, while 2-person families (276 | 45.7%) have the highest median income of $30,902 per family member.
| Income Bracket | # Families | Median Income |
| 2-Person Families | 276 (45.7%) | $61,803 |
| 3-Person Families | 281 (46.5%) | $33,902 |
| 4-Person Families | 47 (7.8%) | $0 |
| 5-Person Families | 0 (0.0%) | $0 |
| 6-Person Families | 0 (0.0%) | $0 |
| 7+ Person Families | 0 (0.0%) | $0 |
| Total | 604 (100.0%) | $52,437 |
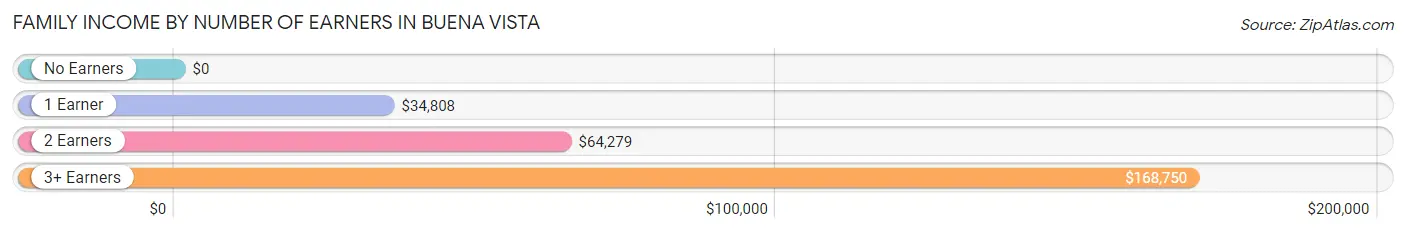
Family Income by Number of Earners in Buena Vista
| Number of Earners | # Families | Median Income |
| No Earners | 28 (4.6%) | $0 |
| 1 Earner | 316 (52.3%) | $34,808 |
| 2 Earners | 231 (38.3%) | $64,279 |
| 3+ Earners | 29 (4.8%) | $168,750 |
| Total | 604 (100.0%) | $52,437 |
Household Income in Buena Vista
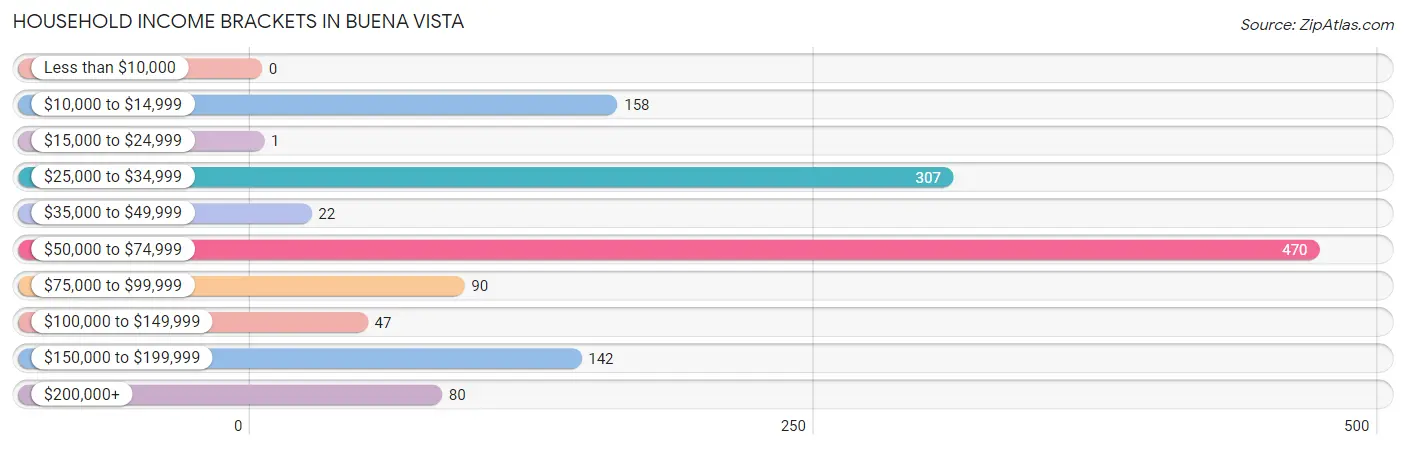
Household Income Brackets in Buena Vista
With 470 households falling in the category, the $50,000 to $74,999 income range is the most frequent in Buena Vista, accounting for 35.6% of all households.
| Income Bracket | # Households | % Households |
| Less than $10,000 | 0 | 0.0% |
| $10,000 to $14,999 | 158 | 12.0% |
| $15,000 to $24,999 | 1 | 0.1% |
| $25,000 to $34,999 | 307 | 23.3% |
| $35,000 to $49,999 | 22 | 1.7% |
| $50,000 to $74,999 | 470 | 35.6% |
| $75,000 to $99,999 | 90 | 6.8% |
| $100,000 to $149,999 | 47 | 3.6% |
| $150,000 to $199,999 | 142 | 10.8% |
| $200,000+ | 80 | 6.1% |
Household Income by Householder Age in Buena Vista
The median household income in Buena Vista is $58,168, with the highest median household income of $60,061 found in the 25 to 44 years age bracket for the primary householder. A total of 513 households (38.9%) fall into this category. Meanwhile, the 15 to 24 years age bracket for the primary householder has the lowest median household income of $0, with 117 households (8.9%) in this group.
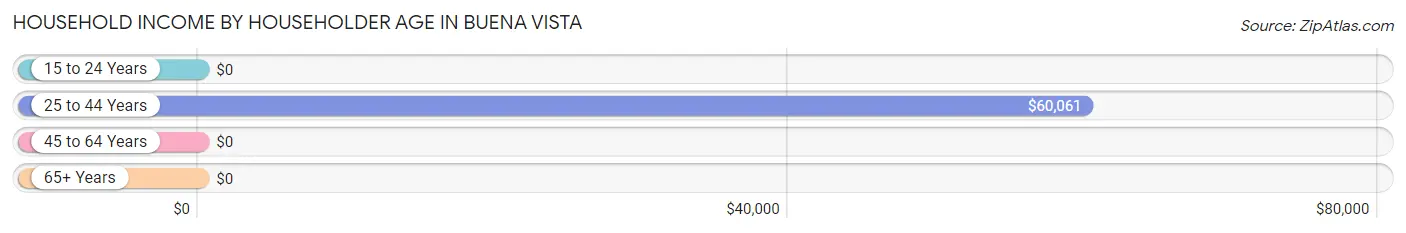
| Income Bracket | # Households | Median Income |
| 15 to 24 Years | 117 (8.9%) | $0 |
| 25 to 44 Years | 513 (38.9%) | $60,061 |
| 45 to 64 Years | 532 (40.3%) | $0 |
| 65+ Years | 157 (11.9%) | $0 |
| Total | 1,319 (100.0%) | $58,168 |
Poverty in Buena Vista
Income Below Poverty by Sex and Age in Buena Vista
With 10.7% poverty level for males and 13.1% for females among the residents of Buena Vista, 55 to 64 year old males and 75 year old and over females are the most vulnerable to poverty, with 112 males (33.6%) and 46 females (97.9%) in their respective age groups living below the poverty level.
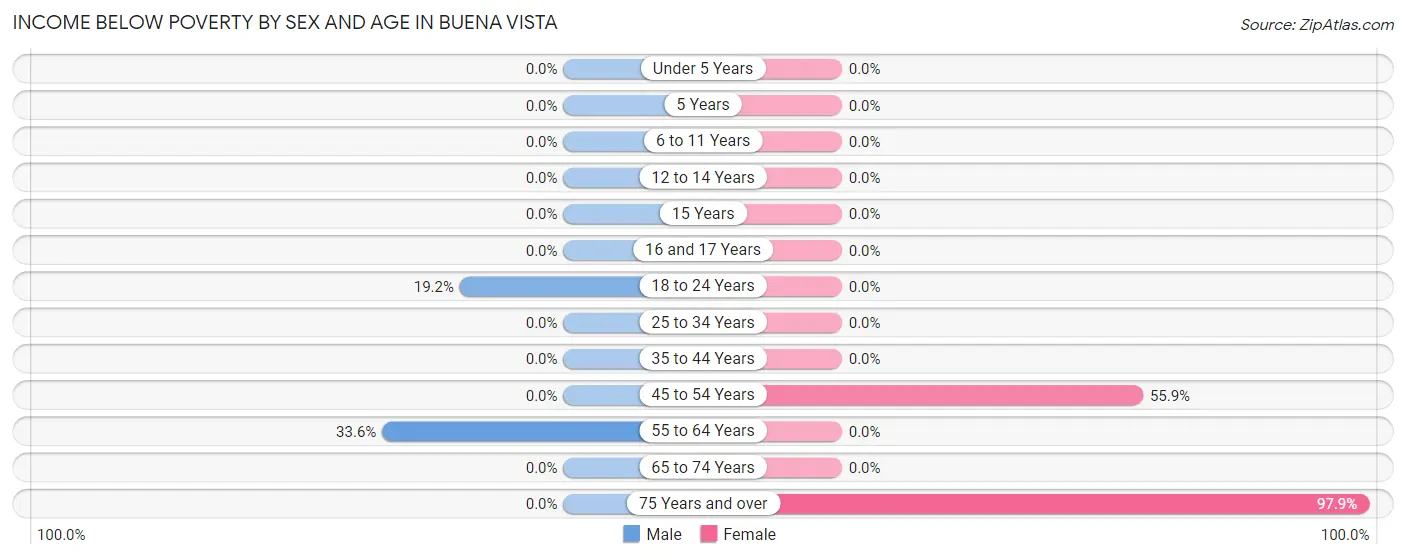
| Age Bracket | Male | Female |
| Under 5 Years | 0 (0.0%) | 0 (0.0%) |
| 5 Years | 0 (0.0%) | 0 (0.0%) |
| 6 to 11 Years | 0 (0.0%) | 0 (0.0%) |
| 12 to 14 Years | 0 (0.0%) | 0 (0.0%) |
| 15 Years | 0 (0.0%) | 0 (0.0%) |
| 16 and 17 Years | 0 (0.0%) | 0 (0.0%) |
| 18 to 24 Years | 54 (19.2%) | 0 (0.0%) |
| 25 to 34 Years | 0 (0.0%) | 0 (0.0%) |
| 35 to 44 Years | 0 (0.0%) | 0 (0.0%) |
| 45 to 54 Years | 0 (0.0%) | 128 (55.9%) |
| 55 to 64 Years | 112 (33.6%) | 0 (0.0%) |
| 65 to 74 Years | 0 (0.0%) | 0 (0.0%) |
| 75 Years and over | 0 (0.0%) | 46 (97.9%) |
| Total | 166 (10.7%) | 174 (13.1%) |
Income Above Poverty by Sex and Age in Buena Vista
According to the poverty statistics in Buena Vista, males aged 6 to 11 years and females aged under 5 years are the age groups that are most secure financially, with 100.0% of males and 100.0% of females in these age groups living above the poverty line.
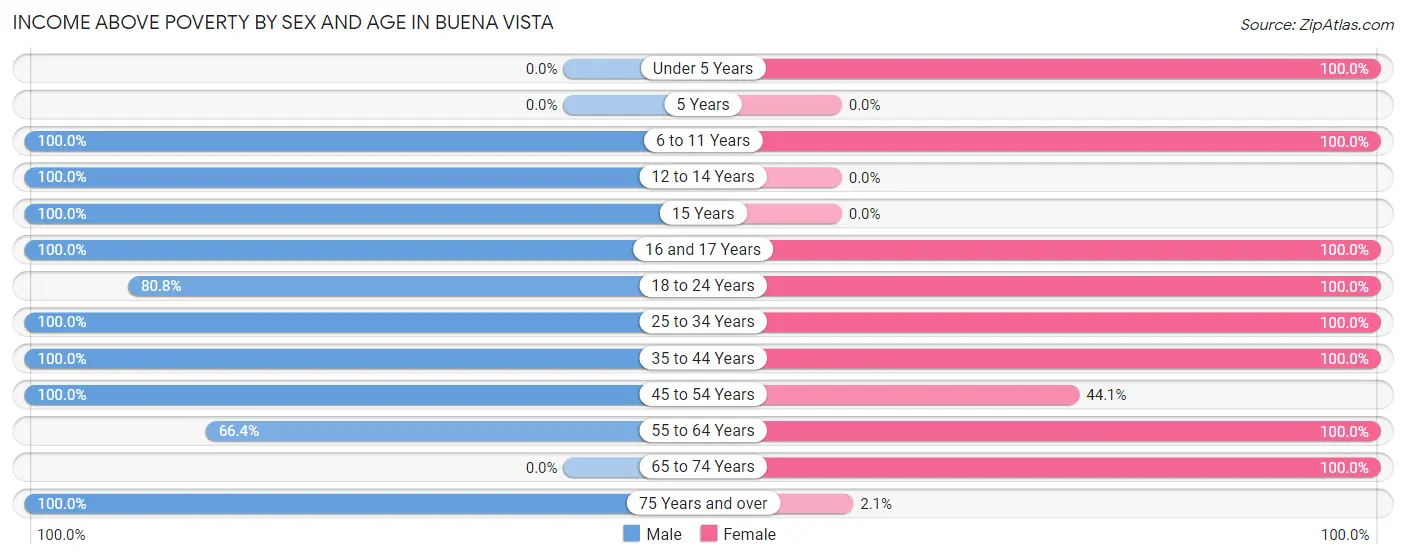
| Age Bracket | Male | Female |
| Under 5 Years | 0 (0.0%) | 52 (100.0%) |
| 5 Years | 0 (0.0%) | 0 (0.0%) |
| 6 to 11 Years | 156 (100.0%) | 242 (100.0%) |
| 12 to 14 Years | 72 (100.0%) | 0 (0.0%) |
| 15 Years | 23 (100.0%) | 0 (0.0%) |
| 16 and 17 Years | 71 (100.0%) | 19 (100.0%) |
| 18 to 24 Years | 227 (80.8%) | 55 (100.0%) |
| 25 to 34 Years | 168 (100.0%) | 344 (100.0%) |
| 35 to 44 Years | 300 (100.0%) | 61 (100.0%) |
| 45 to 54 Years | 144 (100.0%) | 101 (44.1%) |
| 55 to 64 Years | 221 (66.4%) | 149 (100.0%) |
| 65 to 74 Years | 0 (0.0%) | 134 (100.0%) |
| 75 Years and over | 7 (100.0%) | 1 (2.1%) |
| Total | 1,389 (89.3%) | 1,158 (86.9%) |
Income Below Poverty Among Married-Couple Families in Buena Vista
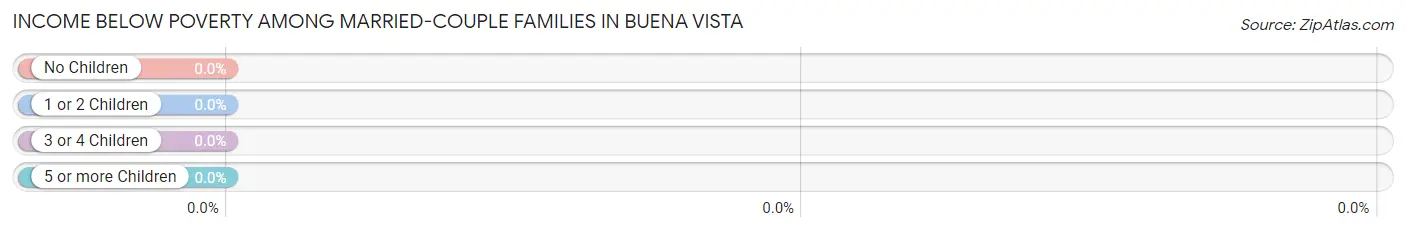
| Children | Above Poverty | Below Poverty |
| No Children | 276 (100.0%) | 0 (0.0%) |
| 1 or 2 Children | 66 (100.0%) | 0 (0.0%) |
| 3 or 4 Children | 0 (0.0%) | 0 (0.0%) |
| 5 or more Children | 0 (0.0%) | 0 (0.0%) |
| Total | 342 (100.0%) | 0 (0.0%) |
Income Below Poverty Among Single-Parent Households in Buena Vista
| Children | Single Father | Single Mother |
| No Children | 0 (0.0%) | 0 (0.0%) |
| 1 or 2 Children | 0 (0.0%) | 0 (0.0%) |
| 3 or 4 Children | 0 (0.0%) | 0 (0.0%) |
| 5 or more Children | 0 (0.0%) | 0 (0.0%) |
| Total | 0 (0.0%) | 0 (0.0%) |
Income Below Poverty Among Married-Couple vs Single-Parent Households in Buena Vista
| Children | Married-Couple Families | Single-Parent Households |
| No Children | 0 (0.0%) | 0 (0.0%) |
| 1 or 2 Children | 0 (0.0%) | 0 (0.0%) |
| 3 or 4 Children | 0 (0.0%) | 0 (0.0%) |
| 5 or more Children | 0 (0.0%) | 0 (0.0%) |
| Total | 0 (0.0%) | 0 (0.0%) |
Race in Buena Vista
The most populous races in Buena Vista are White / Caucasian (2,793 | 96.7%), Hawaiian / Pacific (74 | 2.6%), and Hispanic or Latino (42 | 1.5%).
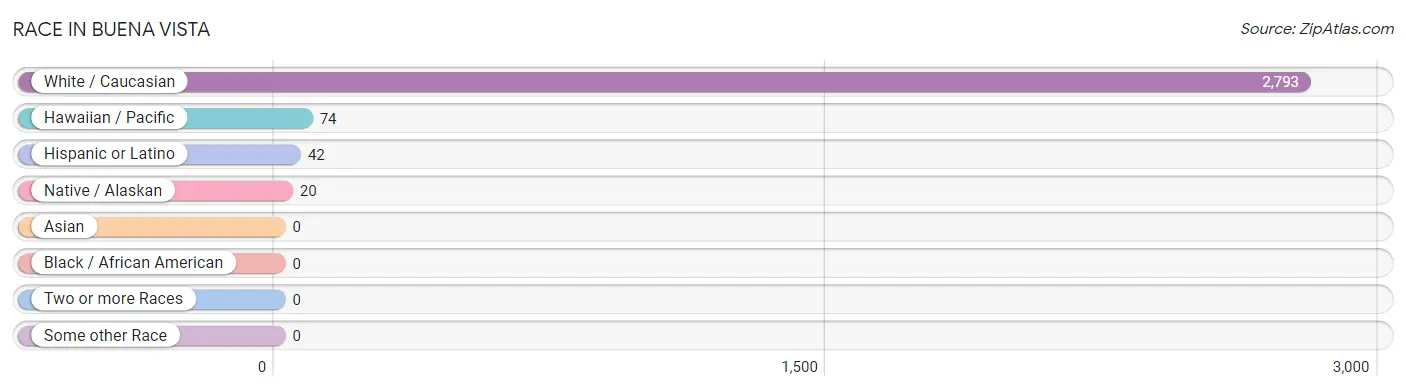
| Race | # Population | % Population |
| Asian | 0 | 0.0% |
| Black / African American | 0 | 0.0% |
| Hawaiian / Pacific | 74 | 2.6% |
| Hispanic or Latino | 42 | 1.5% |
| Native / Alaskan | 20 | 0.7% |
| White / Caucasian | 2,793 | 96.7% |
| Two or more Races | 0 | 0.0% |
| Some other Race | 0 | 0.0% |
| Total | 2,887 | 100.0% |
Ancestry in Buena Vista
The most populous ancestries reported in Buena Vista are German (679 | 23.5%), Italian (218 | 7.5%), European (208 | 7.2%), Irish (177 | 6.1%), and English (170 | 5.9%), together accounting for 50.3% of all Buena Vista residents.
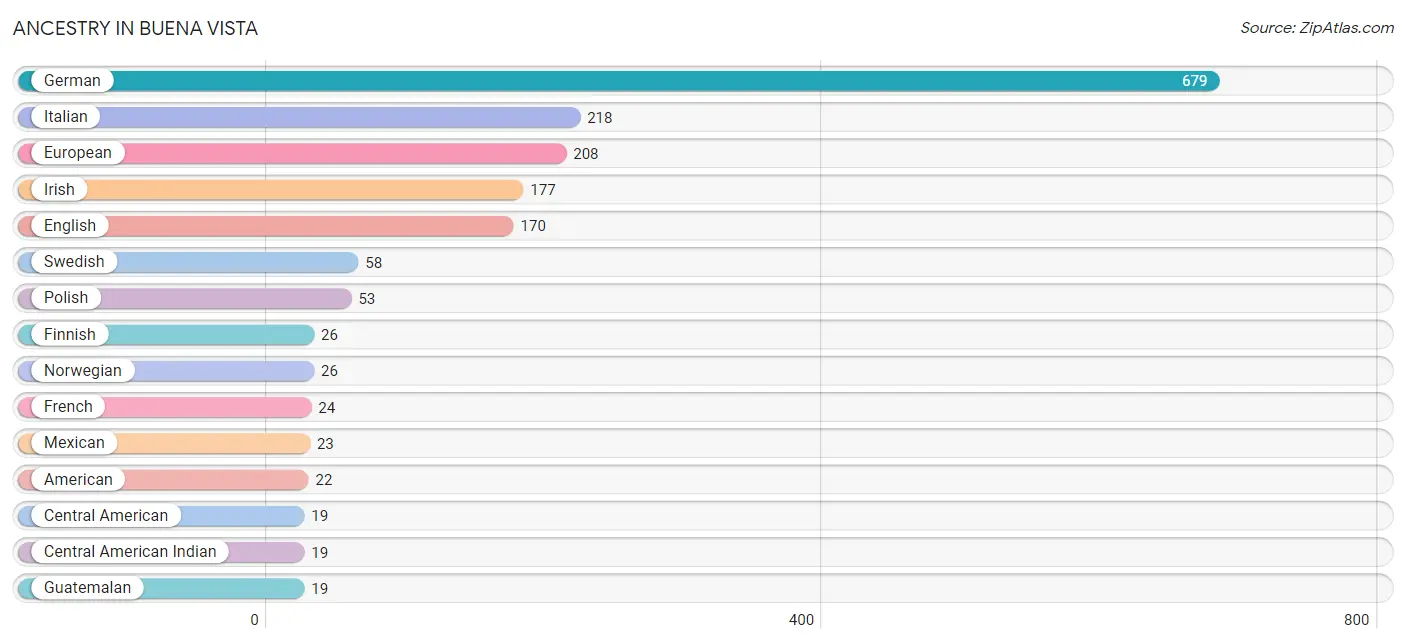
| Ancestry | # Population | % Population |
| American | 22 | 0.8% |
| Central American | 19 | 0.7% |
| Central American Indian | 19 | 0.7% |
| English | 170 | 5.9% |
| European | 208 | 7.2% |
| Finnish | 26 | 0.9% |
| French | 24 | 0.8% |
| German | 679 | 23.5% |
| Guatemalan | 19 | 0.7% |
| Irish | 177 | 6.1% |
| Italian | 218 | 7.5% |
| Mexican | 23 | 0.8% |
| Norwegian | 26 | 0.9% |
| Polish | 53 | 1.8% |
| Scottish | 7 | 0.2% |
| Swedish | 58 | 2.0% | View All 16 Rows |
Immigrants in Buena Vista
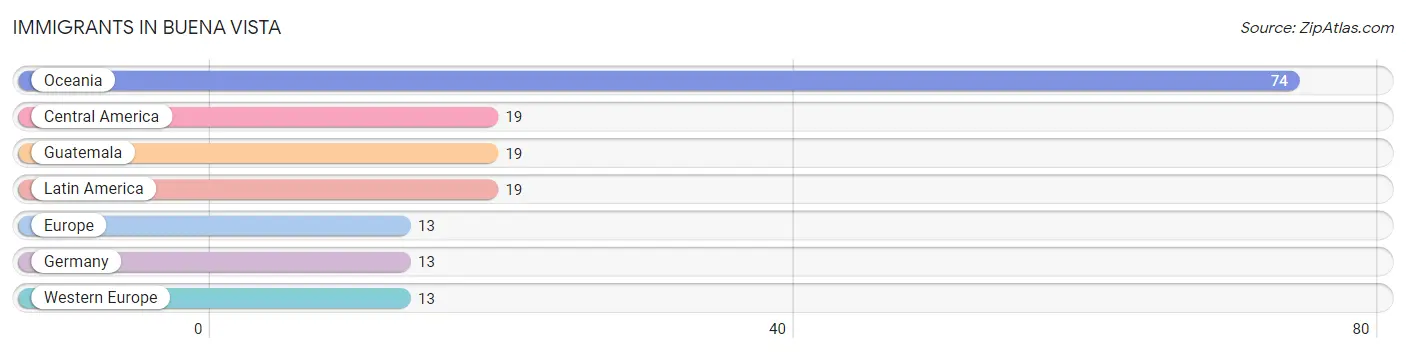
The most numerous immigrant groups reported in Buena Vista came from Oceania (74 | 2.6%), Central America (19 | 0.7%), Guatemala (19 | 0.7%), Latin America (19 | 0.7%), and Europe (13 | 0.4%), together accounting for 5.0% of all Buena Vista residents.
| Immigration Origin | # Population | % Population |
| Central America | 19 | 0.7% |
| Europe | 13 | 0.4% |
| Germany | 13 | 0.4% |
| Guatemala | 19 | 0.7% |
| Latin America | 19 | 0.7% |
| Oceania | 74 | 2.6% |
| Western Europe | 13 | 0.4% | View All 7 Rows |
Sex and Age in Buena Vista
Sex and Age in Buena Vista
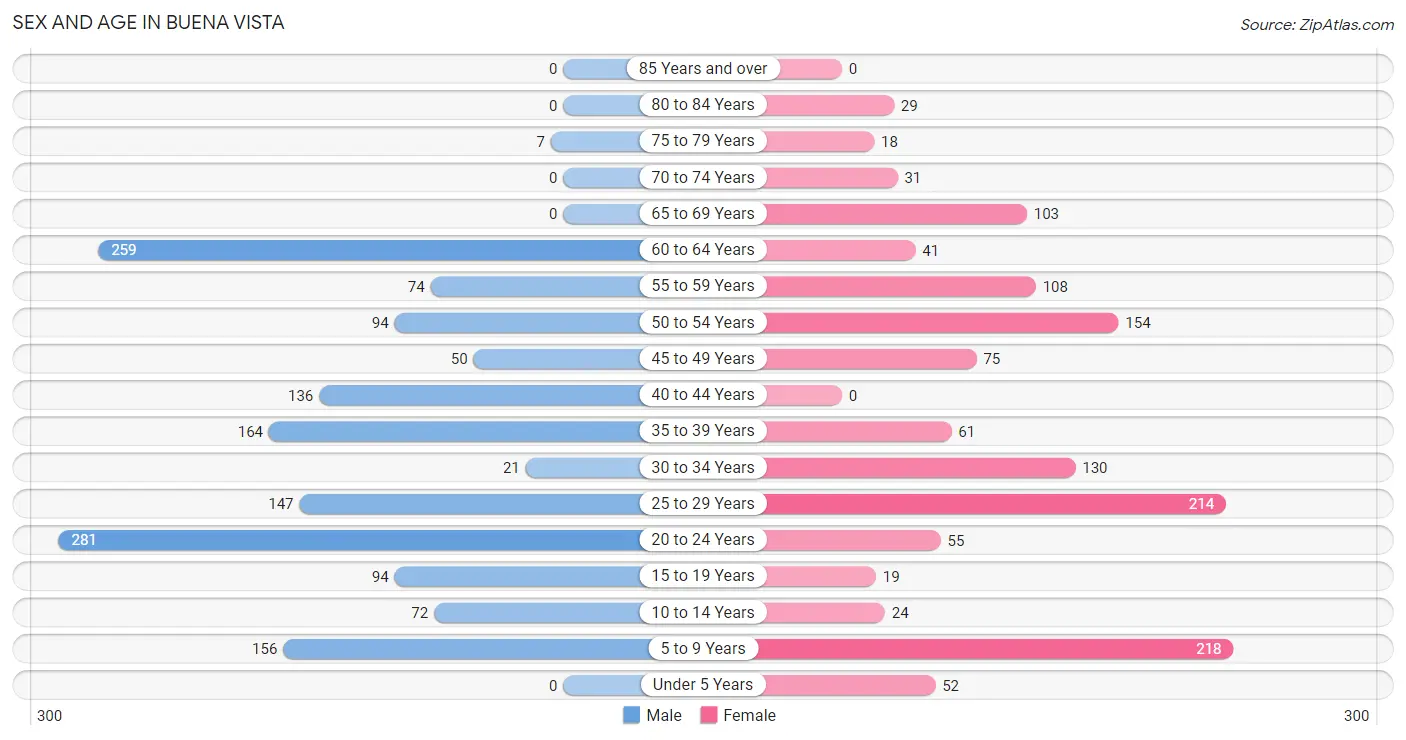
The most populous age groups in Buena Vista are 20 to 24 Years (281 | 18.1%) for men and 5 to 9 Years (218 | 16.4%) for women.
| Age Bracket | Male | Female |
| Under 5 Years | 0 (0.0%) | 52 (3.9%) |
| 5 to 9 Years | 156 (10.0%) | 218 (16.4%) |
| 10 to 14 Years | 72 (4.6%) | 24 (1.8%) |
| 15 to 19 Years | 94 (6.0%) | 19 (1.4%) |
| 20 to 24 Years | 281 (18.1%) | 55 (4.1%) |
| 25 to 29 Years | 147 (9.5%) | 214 (16.1%) |
| 30 to 34 Years | 21 (1.3%) | 130 (9.8%) |
| 35 to 39 Years | 164 (10.5%) | 61 (4.6%) |
| 40 to 44 Years | 136 (8.7%) | 0 (0.0%) |
| 45 to 49 Years | 50 (3.2%) | 75 (5.6%) |
| 50 to 54 Years | 94 (6.0%) | 154 (11.6%) |
| 55 to 59 Years | 74 (4.8%) | 108 (8.1%) |
| 60 to 64 Years | 259 (16.7%) | 41 (3.1%) |
| 65 to 69 Years | 0 (0.0%) | 103 (7.7%) |
| 70 to 74 Years | 0 (0.0%) | 31 (2.3%) |
| 75 to 79 Years | 7 (0.4%) | 18 (1.3%) |
| 80 to 84 Years | 0 (0.0%) | 29 (2.2%) |
| 85 Years and over | 0 (0.0%) | 0 (0.0%) |
| Total | 1,555 (100.0%) | 1,332 (100.0%) |
Families and Households in Buena Vista
Median Family Size in Buena Vista
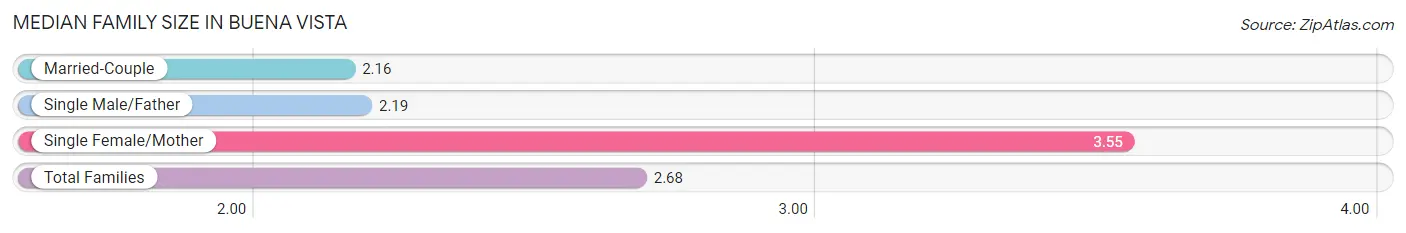
The median family size in Buena Vista is 2.68 persons per family, with single female/mother families (226 | 37.4%) accounting for the largest median family size of 3.55 persons per family. On the other hand, married-couple families (342 | 56.6%) represent the smallest median family size with 2.16 persons per family.
| Family Type | # Families | Family Size |
| Married-Couple | 342 (56.6%) | 2.16 |
| Single Male/Father | 36 (6.0%) | 2.19 |
| Single Female/Mother | 226 (37.4%) | 3.55 |
| Total Families | 604 (100.0%) | 2.68 |
Median Household Size in Buena Vista
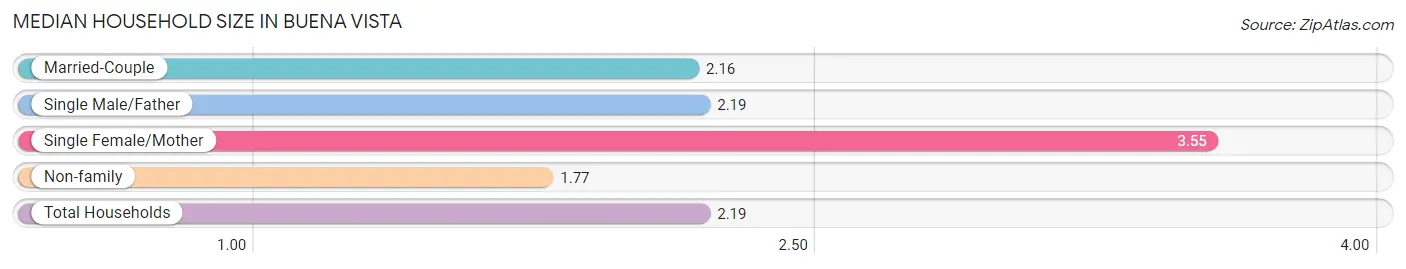
The median household size in Buena Vista is 2.19 persons per household, with single female/mother households (226 | 17.1%) accounting for the largest median household size of 3.55 persons per household. non-family households (715 | 54.2%) represent the smallest median household size with 1.77 persons per household.
| Household Type | # Households | Household Size |
| Married-Couple | 342 (25.9%) | 2.16 |
| Single Male/Father | 36 (2.7%) | 2.19 |
| Single Female/Mother | 226 (17.1%) | 3.55 |
| Non-family | 715 (54.2%) | 1.77 |
| Total Households | 1,319 (100.0%) | 2.19 |
Household Size by Marriage Status in Buena Vista
Out of a total of 1,319 households in Buena Vista, 604 (45.8%) are family households, while 715 (54.2%) are nonfamily households. The most numerous type of family households are 3-person households, comprising 281, and the most common type of nonfamily households are 1-person households, comprising 264.
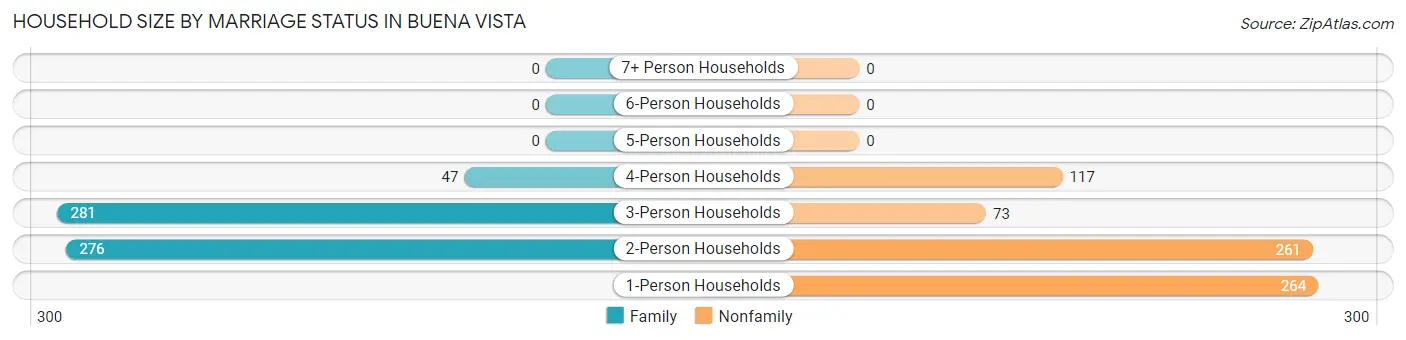
| Household Size | Family Households | Nonfamily Households |
| 1-Person Households | - | 264 (20.0%) |
| 2-Person Households | 276 (20.9%) | 261 (19.8%) |
| 3-Person Households | 281 (21.3%) | 73 (5.5%) |
| 4-Person Households | 47 (3.6%) | 117 (8.9%) |
| 5-Person Households | 0 (0.0%) | 0 (0.0%) |
| 6-Person Households | 0 (0.0%) | 0 (0.0%) |
| 7+ Person Households | 0 (0.0%) | 0 (0.0%) |
| Total | 604 (45.8%) | 715 (54.2%) |
Female Fertility in Buena Vista
Fertility by Age in Buena Vista
| Age Bracket | Women with Births | Births / 1,000 Women |
| 15 to 19 years | 0 (0.0%) | 0.0 |
| 20 to 34 years | 0 (0.0%) | 0.0 |
| 35 to 50 years | 0 (0.0%) | 0.0 |
| Total | 0 (0.0%) | 0.0 |
Fertility by Age by Marriage Status in Buena Vista
| Age Bracket | Married | Unmarried |
| 15 to 19 years | 0 (0.0%) | 0 (0.0%) |
| 20 to 34 years | 0 (0.0%) | 0 (0.0%) |
| 35 to 50 years | 0 (0.0%) | 0 (0.0%) |
| Total | 0 (0.0%) | 0 (0.0%) |
Fertility by Education in Buena Vista
| Educational Attainment | Women with Births | Births / 1,000 Women |
| Less than High School | 0 (0.0%) | 0.0 |
| High School Diploma | 0 (0.0%) | 0.0 |
| College or Associate's Degree | 0 (0.0%) | 0.0 |
| Bachelor's Degree | 0 (0.0%) | 0.0 |
| Graduate Degree | 0 (0.0%) | 0.0 |
| Total | 0 (0.0%) | 0.0 |
Fertility by Education by Marriage Status in Buena Vista
| Educational Attainment | Married | Unmarried |
| Less than High School | 0 (0.0%) | 0 (0.0%) |
| High School Diploma | 0 (0.0%) | 0 (0.0%) |
| College or Associate's Degree | 0 (0.0%) | 0 (0.0%) |
| Bachelor's Degree | 0 (0.0%) | 0 (0.0%) |
| Graduate Degree | 0 (0.0%) | 0 (0.0%) |
| Total | 0 (0.0%) | 0 (0.0%) |
Employment Characteristics in Buena Vista
Employment by Class of Employer in Buena Vista
Among the 1,572 employed individuals in Buena Vista, private company employees (1,243 | 79.1%), federal government employees (115 | 7.3%), and local government employees (73 | 4.6%) make up the most common classes of employment.
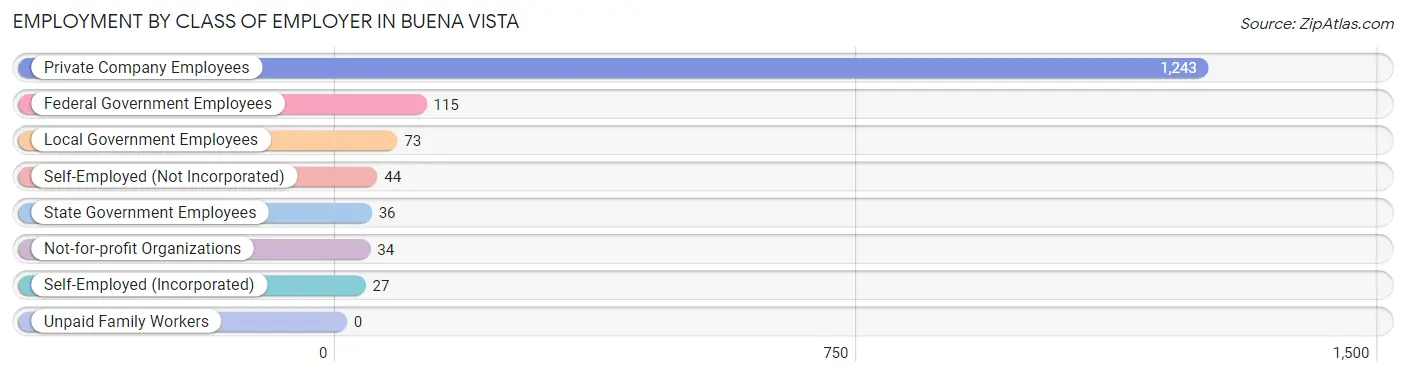
| Employer Class | # Employees | % Employees |
| Private Company Employees | 1,243 | 79.1% |
| Self-Employed (Incorporated) | 27 | 1.7% |
| Self-Employed (Not Incorporated) | 44 | 2.8% |
| Not-for-profit Organizations | 34 | 2.2% |
| Local Government Employees | 73 | 4.6% |
| State Government Employees | 36 | 2.3% |
| Federal Government Employees | 115 | 7.3% |
| Unpaid Family Workers | 0 | 0.0% |
| Total | 1,572 | 100.0% |
Employment Status by Age in Buena Vista
According to the labor force statistics for Buena Vista, out of the total population over 16 years of age (2,342), 82.4% or 1,930 individuals are in the labor force, with 16.8% or 324 of them unemployed. The age group with the highest labor force participation rate is 20 to 24 years, with 100.0% or 336 individuals in the labor force. Within the labor force, the 16 to 19 years age range has the highest percentage of unemployed individuals, with 100.0% or 38 of them being unemployed.
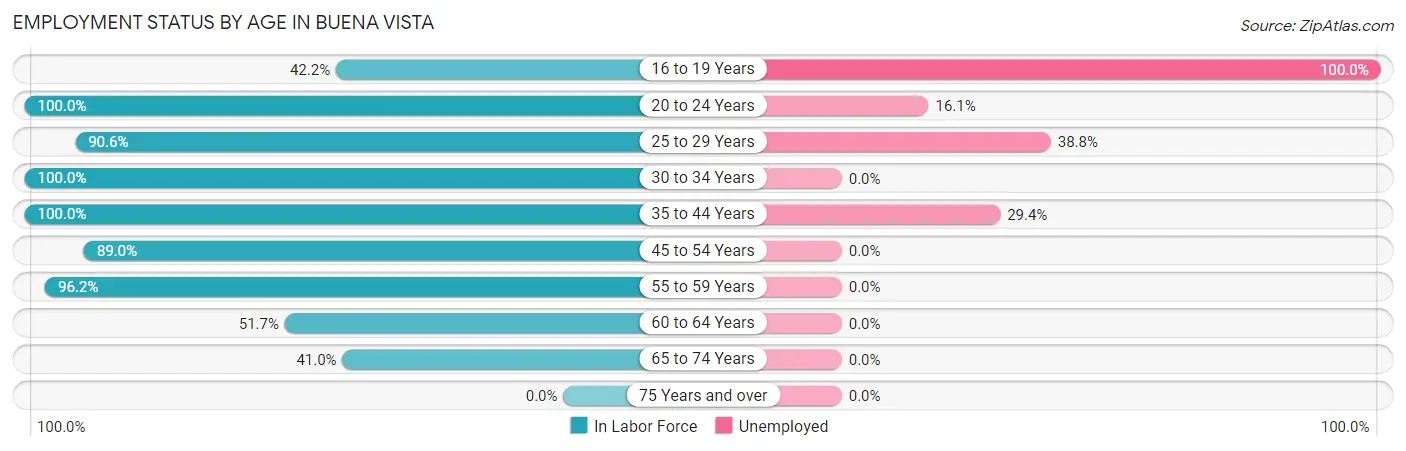
| Age Bracket | In Labor Force | Unemployed |
| 16 to 19 Years | 38 (42.2%) | 38 (100.0%) |
| 20 to 24 Years | 336 (100.0%) | 54 (16.1%) |
| 25 to 29 Years | 327 (90.6%) | 127 (38.8%) |
| 30 to 34 Years | 151 (100.0%) | 0 (0.0%) |
| 35 to 44 Years | 361 (100.0%) | 106 (29.4%) |
| 45 to 54 Years | 332 (89.0%) | 0 (0.0%) |
| 55 to 59 Years | 175 (96.2%) | 0 (0.0%) |
| 60 to 64 Years | 155 (51.7%) | 0 (0.0%) |
| 65 to 74 Years | 55 (41.0%) | 0 (0.0%) |
| 75 Years and over | 0 (0.0%) | 0 (0.0%) |
| Total | 1,930 (82.4%) | 324 (16.8%) |
Employment Status by Educational Attainment in Buena Vista
According to labor force statistics for Buena Vista, 86.9% of individuals (1,502) out of the total population between 25 and 64 years of age (1,728) are in the labor force, with 15.5% or 233 of them being unemployed. The group with the highest labor force participation rate are those with the educational attainment of high school diploma, with 94.6% or 590 individuals in the labor force. Within the labor force, individuals with bachelor's degree or higher education have the highest percentage of unemployment, with 22.1% or 127 of them being unemployed.
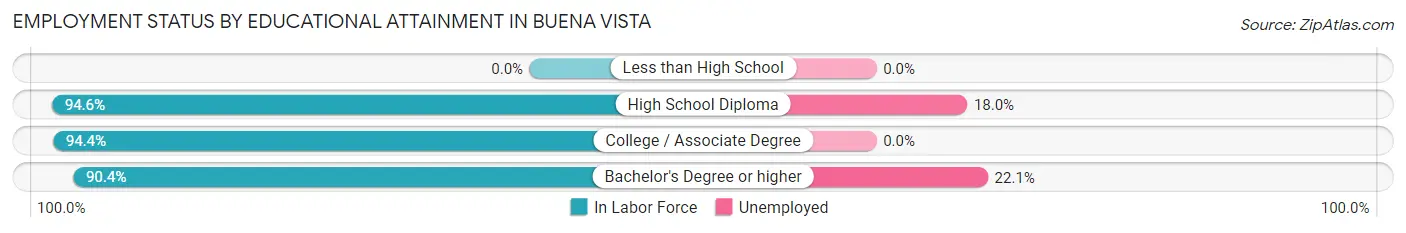
| Educational Attainment | In Labor Force | Unemployed |
| Less than High School | 0 (0.0%) | 0 (0.0%) |
| High School Diploma | 590 (94.6%) | 112 (18.0%) |
| College / Associate Degree | 336 (94.4%) | 0 (0.0%) |
| Bachelor's Degree or higher | 575 (90.4%) | 141 (22.1%) |
| Total | 1,502 (86.9%) | 268 (15.5%) |
Employment Occupations by Sex in Buena Vista
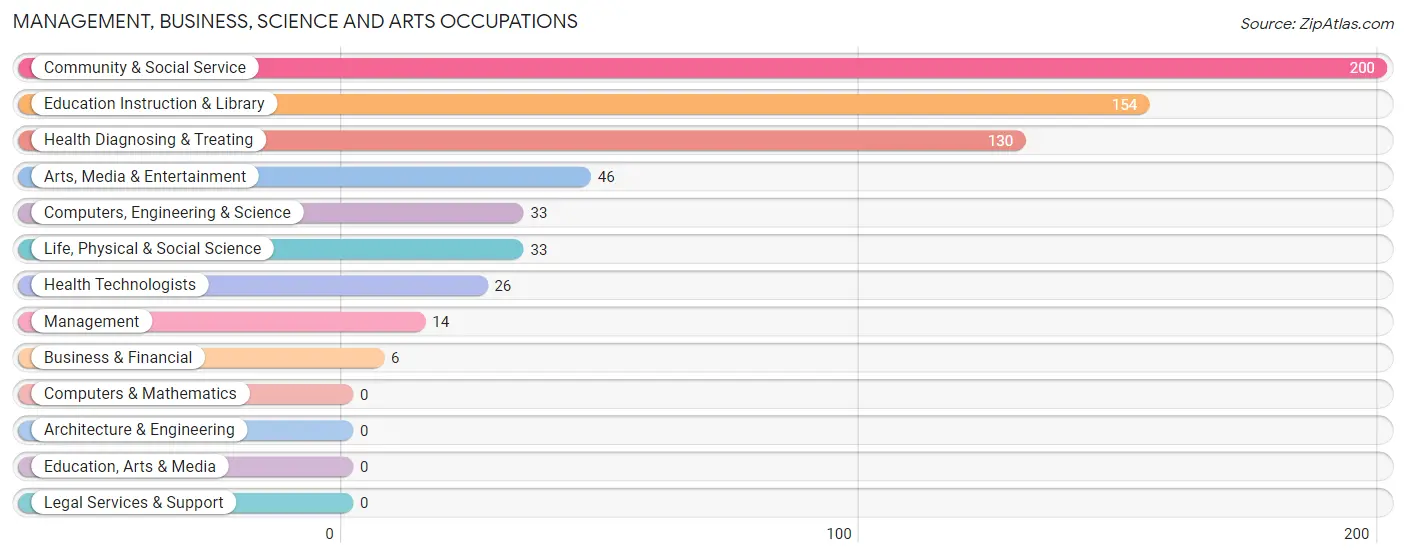
Management, Business, Science and Arts Occupations
The most common Management, Business, Science and Arts occupations in Buena Vista are Community & Social Service (200 | 12.5%), Education Instruction & Library (154 | 9.6%), Health Diagnosing & Treating (130 | 8.1%), Arts, Media & Entertainment (46 | 2.9%), and Computers, Engineering & Science (33 | 2.1%).
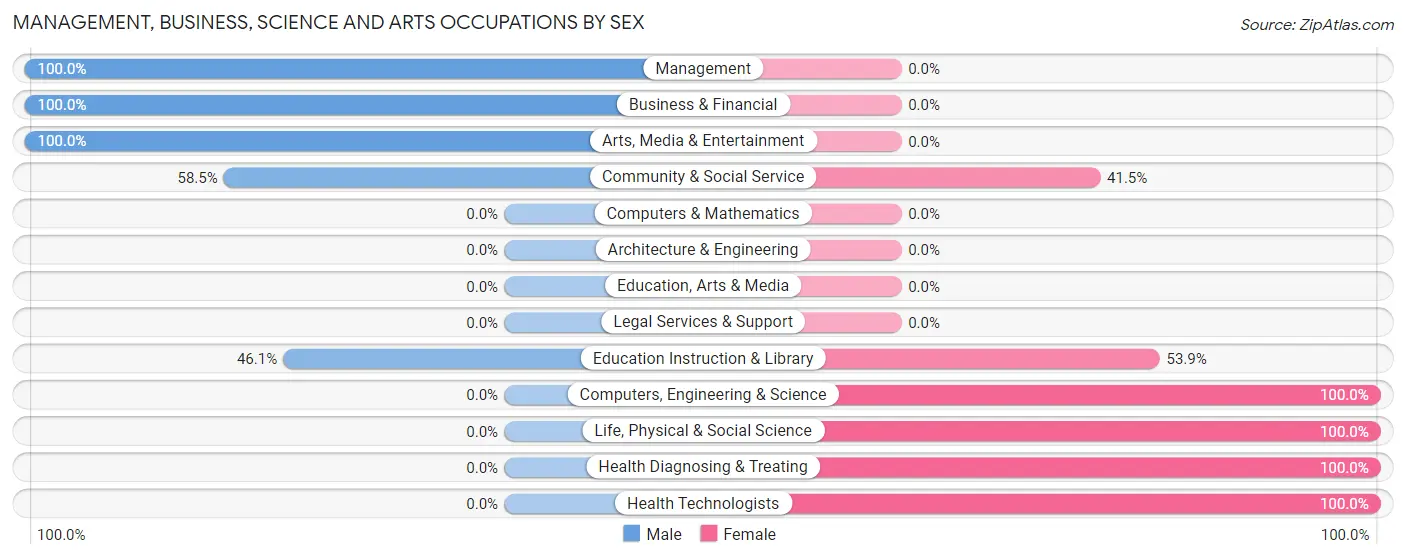
Management, Business, Science and Arts Occupations by Sex
Within the Management, Business, Science and Arts occupations in Buena Vista, the most male-oriented occupations are Management (100.0%), Business & Financial (100.0%), and Arts, Media & Entertainment (100.0%), while the most female-oriented occupations are Computers, Engineering & Science (100.0%), Life, Physical & Social Science (100.0%), and Health Diagnosing & Treating (100.0%).
| Occupation | Male | Female |
| Management | 14 (100.0%) | 0 (0.0%) |
| Business & Financial | 6 (100.0%) | 0 (0.0%) |
| Computers, Engineering & Science | 0 (0.0%) | 33 (100.0%) |
| Computers & Mathematics | 0 (0.0%) | 0 (0.0%) |
| Architecture & Engineering | 0 (0.0%) | 0 (0.0%) |
| Life, Physical & Social Science | 0 (0.0%) | 33 (100.0%) |
| Community & Social Service | 117 (58.5%) | 83 (41.5%) |
| Education, Arts & Media | 0 (0.0%) | 0 (0.0%) |
| Legal Services & Support | 0 (0.0%) | 0 (0.0%) |
| Education Instruction & Library | 71 (46.1%) | 83 (53.9%) |
| Arts, Media & Entertainment | 46 (100.0%) | 0 (0.0%) |
| Health Diagnosing & Treating | 0 (0.0%) | 130 (100.0%) |
| Health Technologists | 0 (0.0%) | 26 (100.0%) |
| Total (Category) | 137 (35.8%) | 246 (64.2%) |
| Total (Overall) | 939 (58.5%) | 666 (41.5%) |
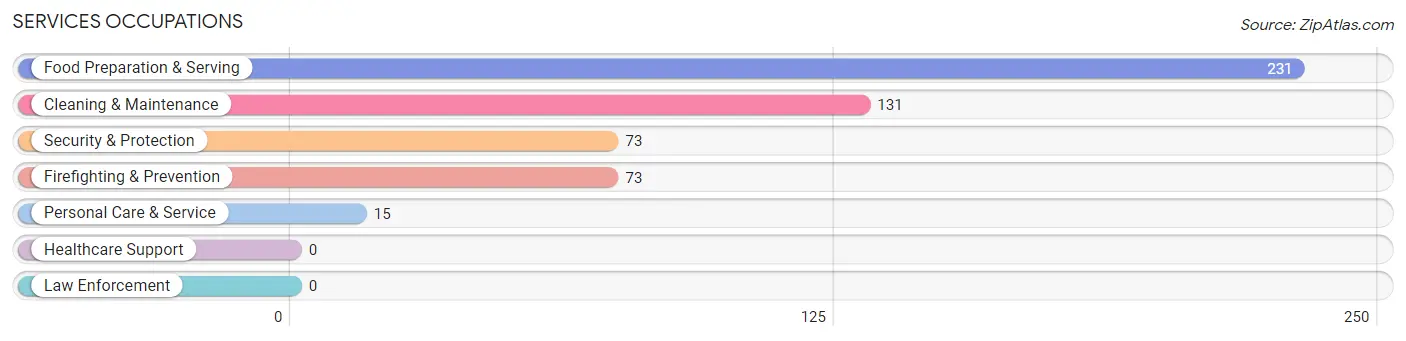
Services Occupations
The most common Services occupations in Buena Vista are Food Preparation & Serving (231 | 14.4%), Cleaning & Maintenance (131 | 8.2%), Security & Protection (73 | 4.5%), Firefighting & Prevention (73 | 4.5%), and Personal Care & Service (15 | 0.9%).
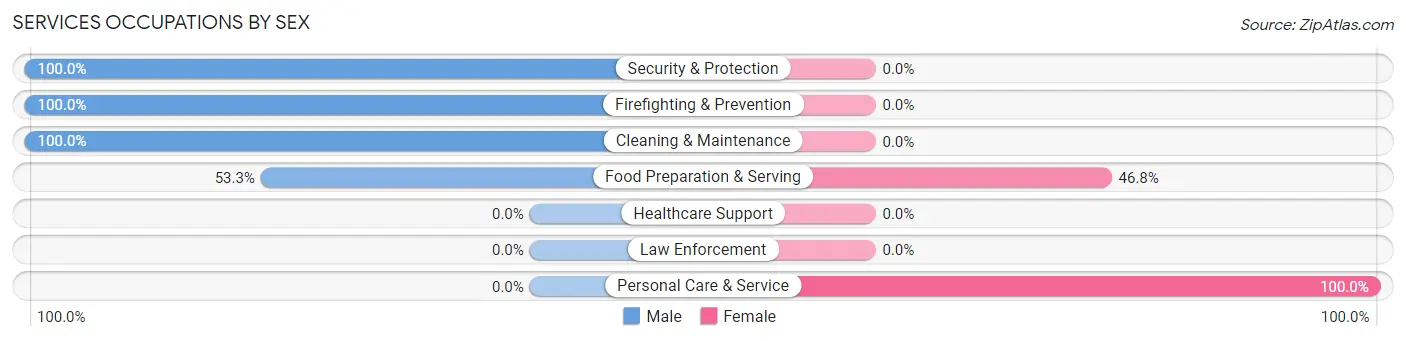
Services Occupations by Sex
Within the Services occupations in Buena Vista, the most male-oriented occupations are Security & Protection (100.0%), Firefighting & Prevention (100.0%), and Cleaning & Maintenance (100.0%), while the most female-oriented occupations are Personal Care & Service (100.0%), and Food Preparation & Serving (46.8%).
| Occupation | Male | Female |
| Healthcare Support | 0 (0.0%) | 0 (0.0%) |
| Security & Protection | 73 (100.0%) | 0 (0.0%) |
| Firefighting & Prevention | 73 (100.0%) | 0 (0.0%) |
| Law Enforcement | 0 (0.0%) | 0 (0.0%) |
| Food Preparation & Serving | 123 (53.2%) | 108 (46.8%) |
| Cleaning & Maintenance | 131 (100.0%) | 0 (0.0%) |
| Personal Care & Service | 0 (0.0%) | 15 (100.0%) |
| Total (Category) | 327 (72.7%) | 123 (27.3%) |
| Total (Overall) | 939 (58.5%) | 666 (41.5%) |
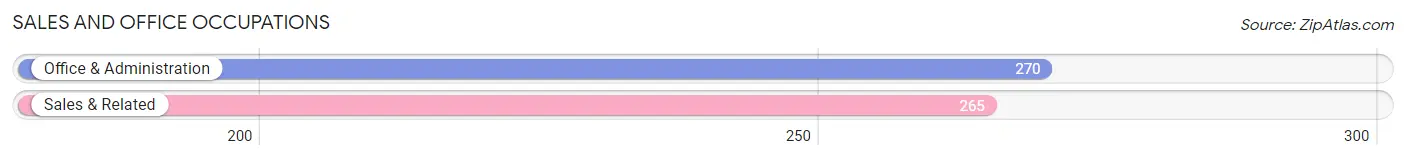
Sales and Office Occupations
The most common Sales and Office occupations in Buena Vista are Office & Administration (270 | 16.8%), and Sales & Related (265 | 16.5%).
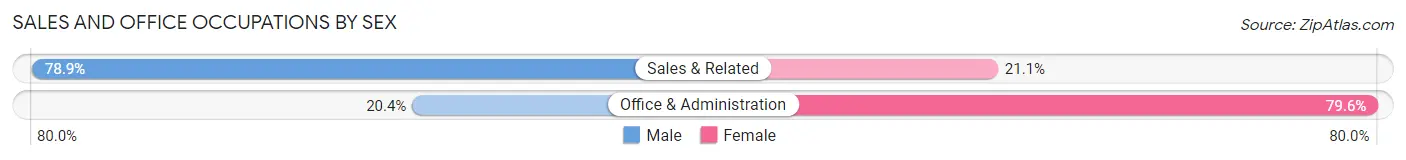
Sales and Office Occupations by Sex
| Occupation | Male | Female |
| Sales & Related | 209 (78.9%) | 56 (21.1%) |
| Office & Administration | 55 (20.4%) | 215 (79.6%) |
| Total (Category) | 264 (49.3%) | 271 (50.6%) |
| Total (Overall) | 939 (58.5%) | 666 (41.5%) |
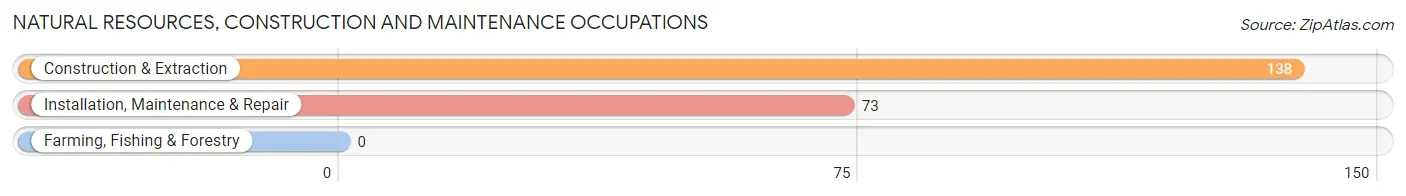
Natural Resources, Construction and Maintenance Occupations
The most common Natural Resources, Construction and Maintenance occupations in Buena Vista are Construction & Extraction (138 | 8.6%), and Installation, Maintenance & Repair (73 | 4.5%).
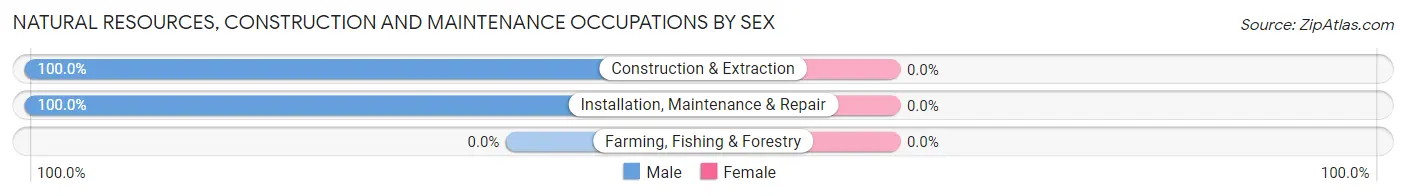
Natural Resources, Construction and Maintenance Occupations by Sex
| Occupation | Male | Female |
| Farming, Fishing & Forestry | 0 (0.0%) | 0 (0.0%) |
| Construction & Extraction | 138 (100.0%) | 0 (0.0%) |
| Installation, Maintenance & Repair | 73 (100.0%) | 0 (0.0%) |
| Total (Category) | 211 (100.0%) | 0 (0.0%) |
| Total (Overall) | 939 (58.5%) | 666 (41.5%) |
Production, Transportation and Moving Occupations
The most common Production, Transportation and Moving occupations in Buena Vista are , and Material Moving (26 | 1.6%).
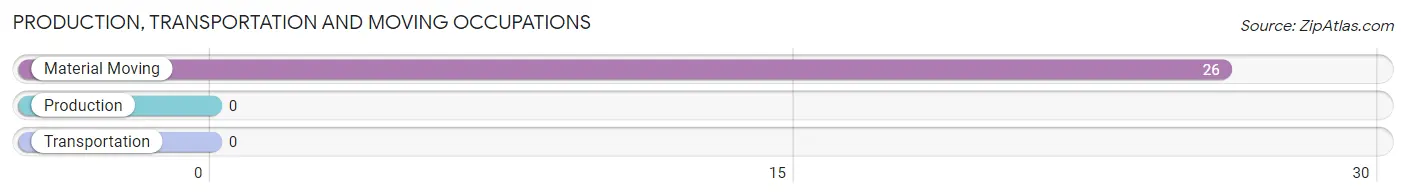
Production, Transportation and Moving Occupations by Sex
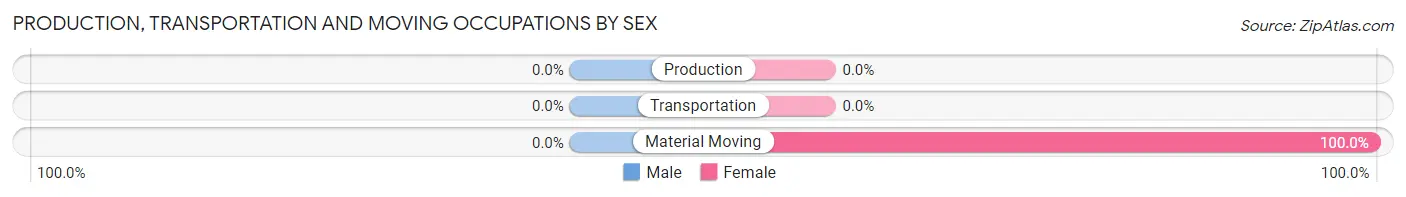
| Occupation | Male | Female |
| Production | 0 (0.0%) | 0 (0.0%) |
| Transportation | 0 (0.0%) | 0 (0.0%) |
| Material Moving | 0 (0.0%) | 26 (100.0%) |
| Total (Category) | 0 (0.0%) | 26 (100.0%) |
| Total (Overall) | 939 (58.5%) | 666 (41.5%) |
Employment Industries by Sex in Buena Vista
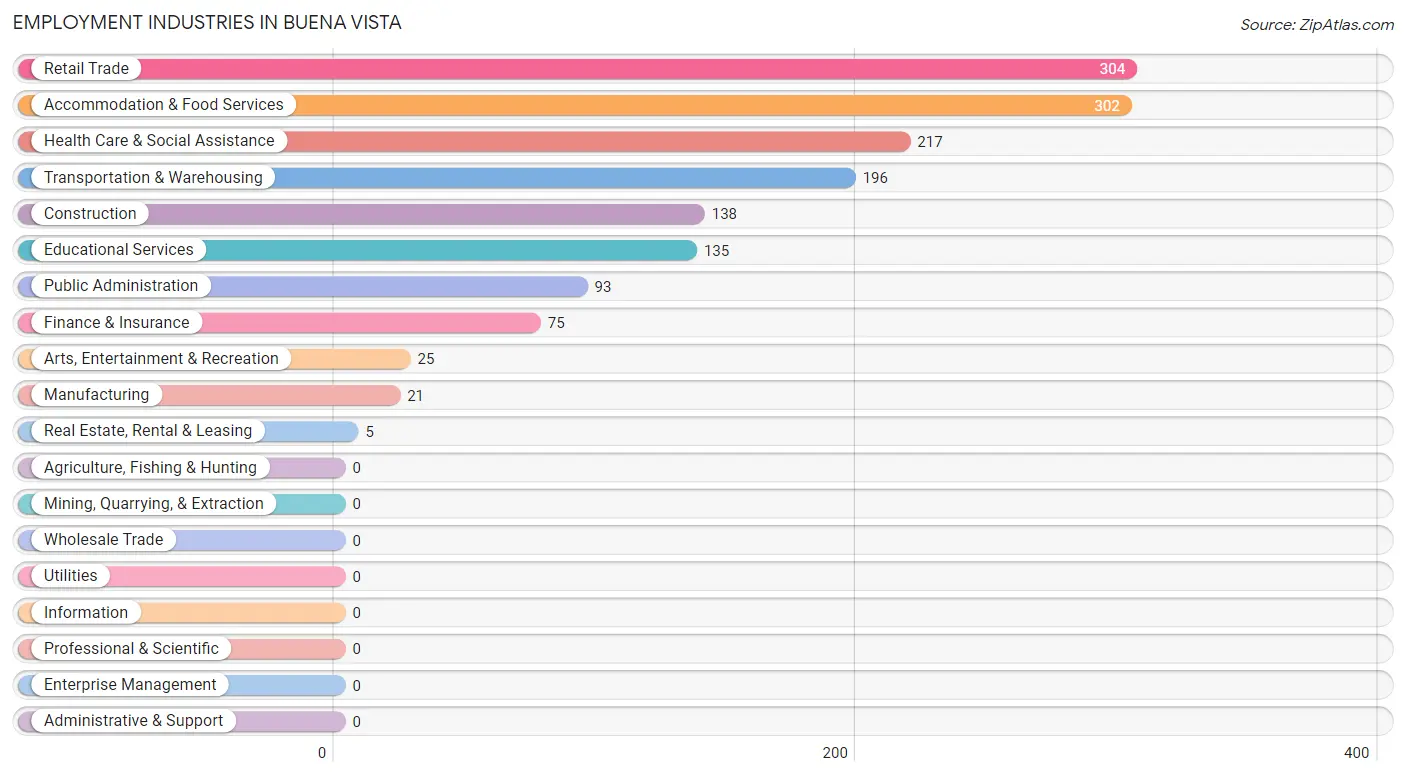
Employment Industries in Buena Vista
The major employment industries in Buena Vista include Retail Trade (304 | 18.9%), Accommodation & Food Services (302 | 18.8%), Health Care & Social Assistance (217 | 13.5%), Transportation & Warehousing (196 | 12.2%), and Construction (138 | 8.6%).
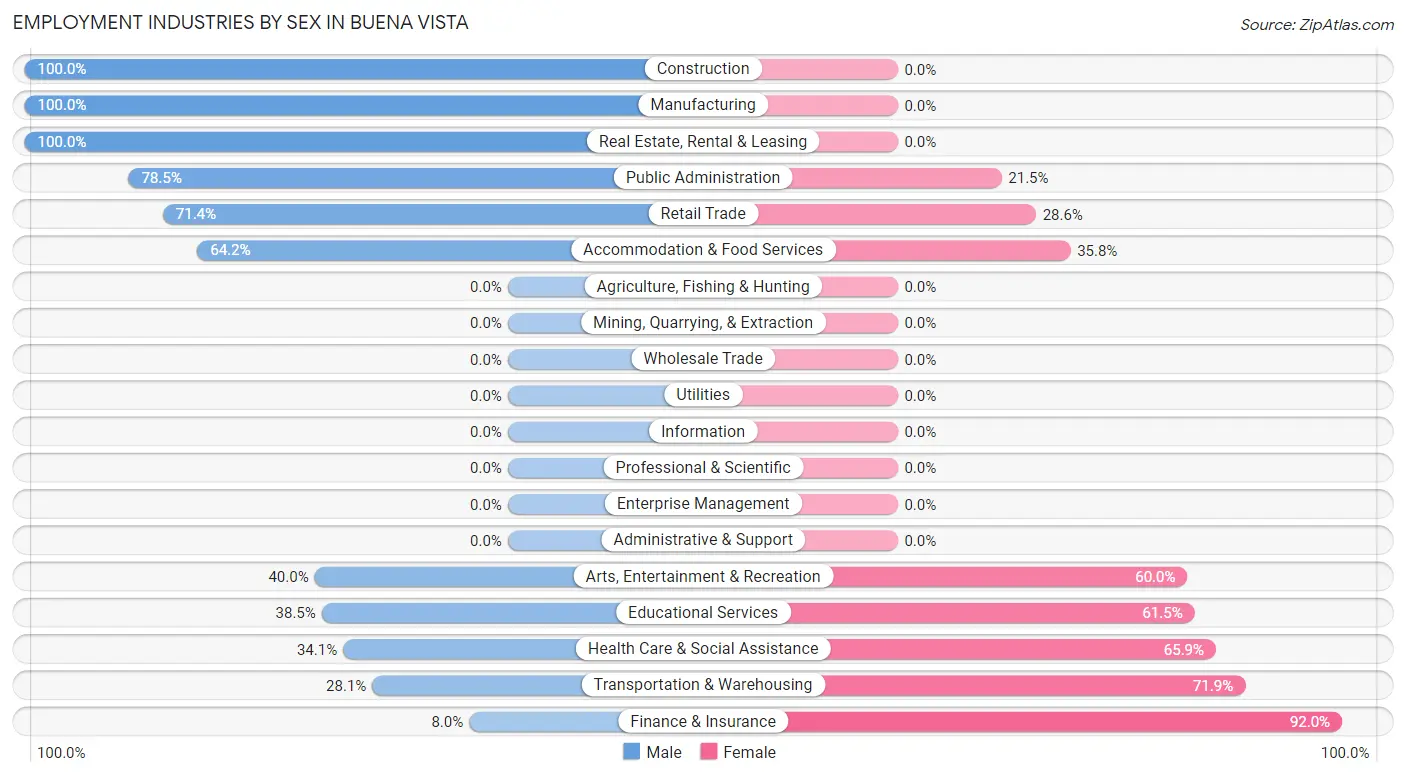
Employment Industries by Sex in Buena Vista
The Buena Vista industries that see more men than women are Construction (100.0%), Manufacturing (100.0%), and Real Estate, Rental & Leasing (100.0%), whereas the industries that tend to have a higher number of women are Finance & Insurance (92.0%), Transportation & Warehousing (71.9%), and Health Care & Social Assistance (65.9%).
| Industry | Male | Female |
| Agriculture, Fishing & Hunting | 0 (0.0%) | 0 (0.0%) |
| Mining, Quarrying, & Extraction | 0 (0.0%) | 0 (0.0%) |
| Construction | 138 (100.0%) | 0 (0.0%) |
| Manufacturing | 21 (100.0%) | 0 (0.0%) |
| Wholesale Trade | 0 (0.0%) | 0 (0.0%) |
| Retail Trade | 217 (71.4%) | 87 (28.6%) |
| Transportation & Warehousing | 55 (28.1%) | 141 (71.9%) |
| Utilities | 0 (0.0%) | 0 (0.0%) |
| Information | 0 (0.0%) | 0 (0.0%) |
| Finance & Insurance | 6 (8.0%) | 69 (92.0%) |
| Real Estate, Rental & Leasing | 5 (100.0%) | 0 (0.0%) |
| Professional & Scientific | 0 (0.0%) | 0 (0.0%) |
| Enterprise Management | 0 (0.0%) | 0 (0.0%) |
| Administrative & Support | 0 (0.0%) | 0 (0.0%) |
| Educational Services | 52 (38.5%) | 83 (61.5%) |
| Health Care & Social Assistance | 74 (34.1%) | 143 (65.9%) |
| Arts, Entertainment & Recreation | 10 (40.0%) | 15 (60.0%) |
| Accommodation & Food Services | 194 (64.2%) | 108 (35.8%) |
| Public Administration | 73 (78.5%) | 20 (21.5%) |
| Total | 939 (58.5%) | 666 (41.5%) |
Education in Buena Vista
School Enrollment in Buena Vista
The most common levels of schooling among the 690 students in Buena Vista are elementary school (351 | 50.9%), high school (113 | 16.4%), and middle school (96 | 13.9%).
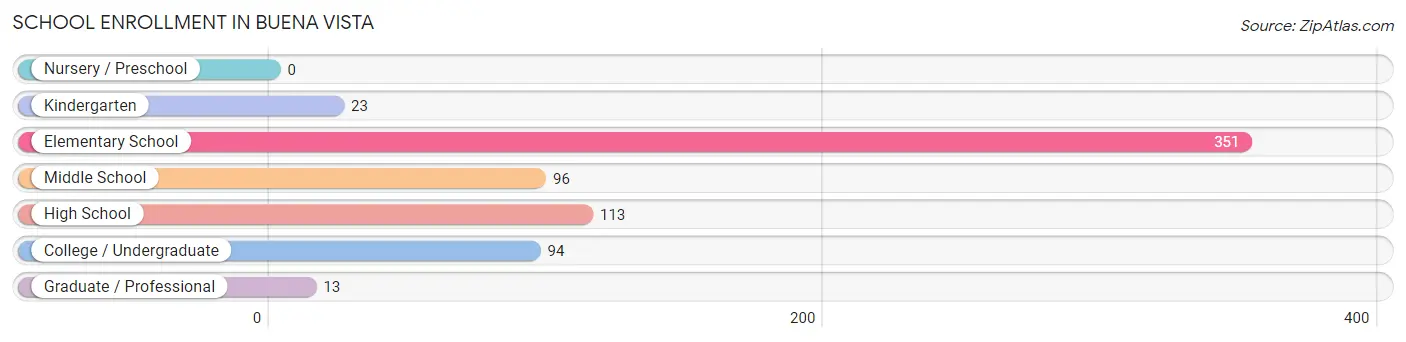
| School Level | # Students | % Students |
| Nursery / Preschool | 0 | 0.0% |
| Kindergarten | 23 | 3.3% |
| Elementary School | 351 | 50.9% |
| Middle School | 96 | 13.9% |
| High School | 113 | 16.4% |
| College / Undergraduate | 94 | 13.6% |
| Graduate / Professional | 13 | 1.9% |
| Total | 690 | 100.0% |
School Enrollment by Age by Funding Source in Buena Vista
Out of a total of 690 students who are enrolled in schools in Buena Vista, 112 (16.2%) attend a private institution, while the remaining 578 (83.8%) are enrolled in public schools. The age group of 10 to 14 year olds has the highest likelihood of being enrolled in private schools, with 72 (75.0% in the age bracket) enrolled. Conversely, the age group of 5 to 9 year old has the lowest likelihood of being enrolled in a private school, with 374 (100.0% in the age bracket) attending a public institution.
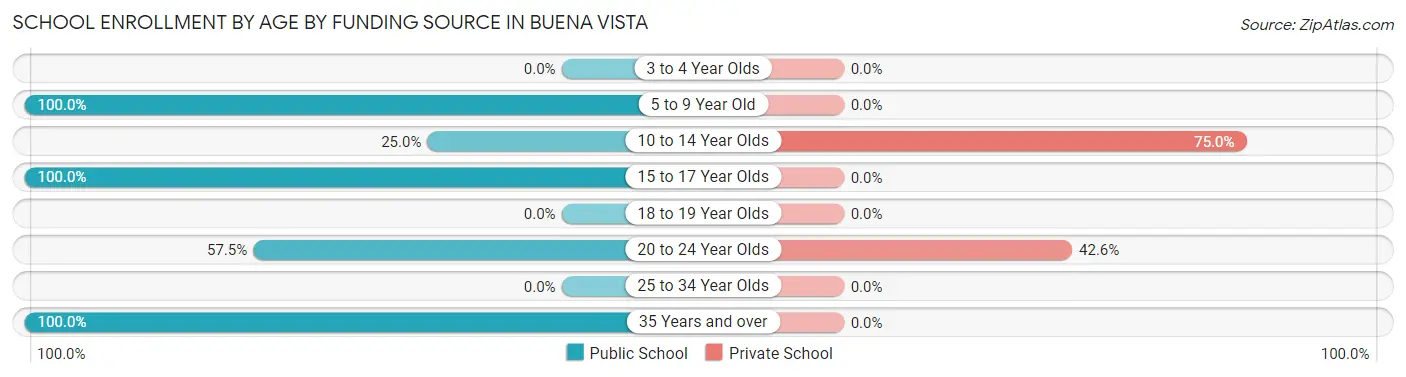
| Age Bracket | Public School | Private School |
| 3 to 4 Year Olds | 0 (0.0%) | 0 (0.0%) |
| 5 to 9 Year Old | 374 (100.0%) | 0 (0.0%) |
| 10 to 14 Year Olds | 24 (25.0%) | 72 (75.0%) |
| 15 to 17 Year Olds | 113 (100.0%) | 0 (0.0%) |
| 18 to 19 Year Olds | 0 (0.0%) | 0 (0.0%) |
| 20 to 24 Year Olds | 54 (57.5%) | 40 (42.5%) |
| 25 to 34 Year Olds | 0 (0.0%) | 0 (0.0%) |
| 35 Years and over | 13 (100.0%) | 0 (0.0%) |
| Total | 578 (83.8%) | 112 (16.2%) |
Educational Attainment by Field of Study in Buena Vista
Education (232 | 31.0%), science & technology (149 | 19.9%), arts & humanities (90 | 12.0%), social sciences (82 | 11.0%), and business (54 | 7.2%) are the most common fields of study among 748 individuals in Buena Vista who have obtained a bachelor's degree or higher.
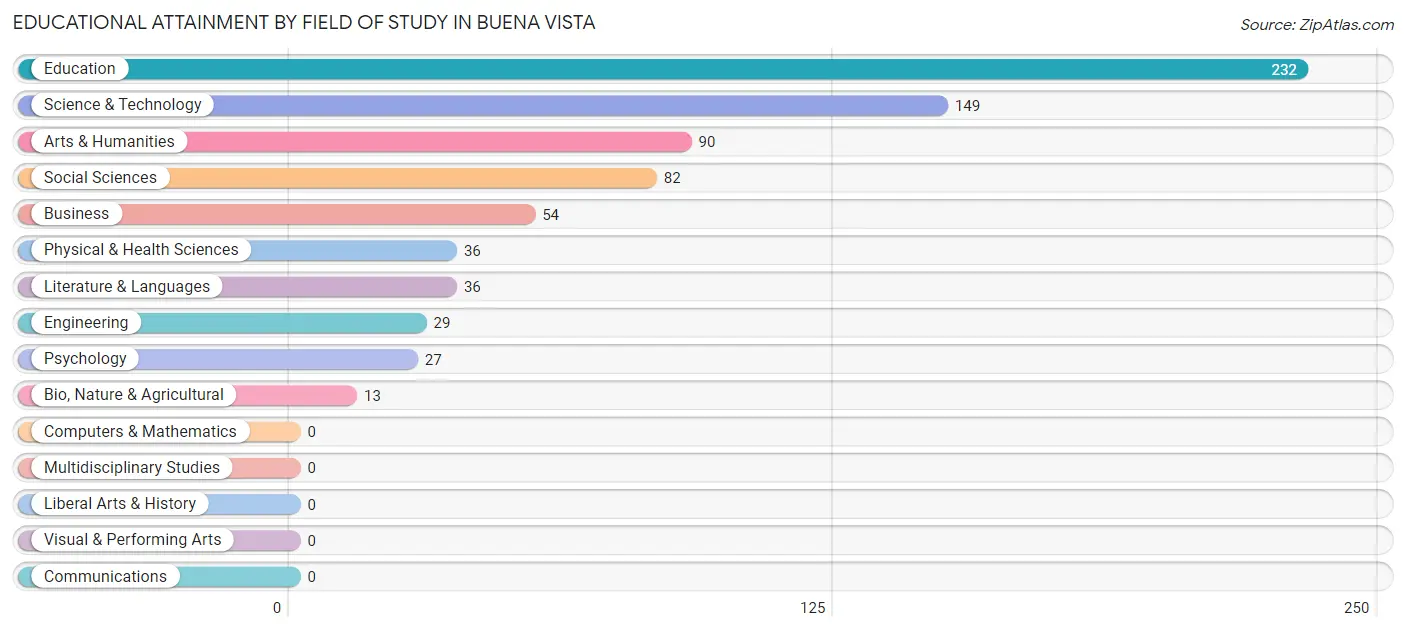
| Field of Study | # Graduates | % Graduates |
| Computers & Mathematics | 0 | 0.0% |
| Bio, Nature & Agricultural | 13 | 1.7% |
| Physical & Health Sciences | 36 | 4.8% |
| Psychology | 27 | 3.6% |
| Social Sciences | 82 | 11.0% |
| Engineering | 29 | 3.9% |
| Multidisciplinary Studies | 0 | 0.0% |
| Science & Technology | 149 | 19.9% |
| Business | 54 | 7.2% |
| Education | 232 | 31.0% |
| Literature & Languages | 36 | 4.8% |
| Liberal Arts & History | 0 | 0.0% |
| Visual & Performing Arts | 0 | 0.0% |
| Communications | 0 | 0.0% |
| Arts & Humanities | 90 | 12.0% |
| Total | 748 | 100.0% |
Transportation & Commute in Buena Vista
Vehicle Availability by Sex in Buena Vista
The most prevalent vehicle ownership categories in Buena Vista are males with 3 vehicles (425, accounting for 46.9%) and females with 3 vehicles (347, making up 63.8%).
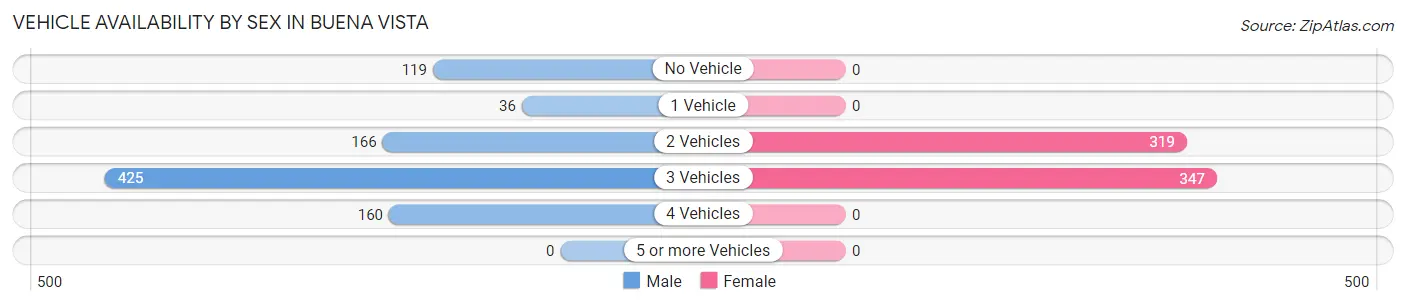
| Vehicles Available | Male | Female |
| No Vehicle | 119 (13.1%) | 0 (0.0%) |
| 1 Vehicle | 36 (4.0%) | 0 (0.0%) |
| 2 Vehicles | 166 (18.3%) | 319 (47.9%) |
| 3 Vehicles | 425 (46.9%) | 347 (52.1%) |
| 4 Vehicles | 160 (17.7%) | 0 (0.0%) |
| 5 or more Vehicles | 0 (0.0%) | 0 (0.0%) |
| Total | 906 (100.0%) | 666 (100.0%) |
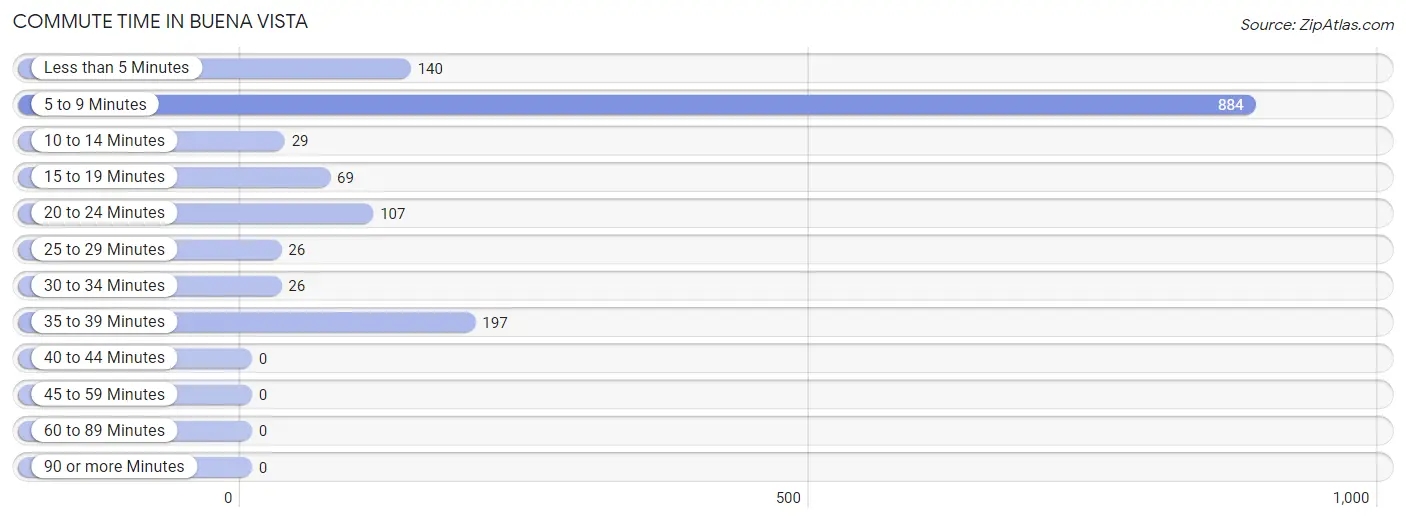
Commute Time in Buena Vista
The most frequently occuring commute durations in Buena Vista are 5 to 9 minutes (884 commuters, 59.8%), 35 to 39 minutes (197 commuters, 13.3%), and less than 5 minutes (140 commuters, 9.5%).
| Commute Time | # Commuters | % Commuters |
| Less than 5 Minutes | 140 | 9.5% |
| 5 to 9 Minutes | 884 | 59.8% |
| 10 to 14 Minutes | 29 | 2.0% |
| 15 to 19 Minutes | 69 | 4.7% |
| 20 to 24 Minutes | 107 | 7.2% |
| 25 to 29 Minutes | 26 | 1.8% |
| 30 to 34 Minutes | 26 | 1.8% |
| 35 to 39 Minutes | 197 | 13.3% |
| 40 to 44 Minutes | 0 | 0.0% |
| 45 to 59 Minutes | 0 | 0.0% |
| 60 to 89 Minutes | 0 | 0.0% |
| 90 or more Minutes | 0 | 0.0% |
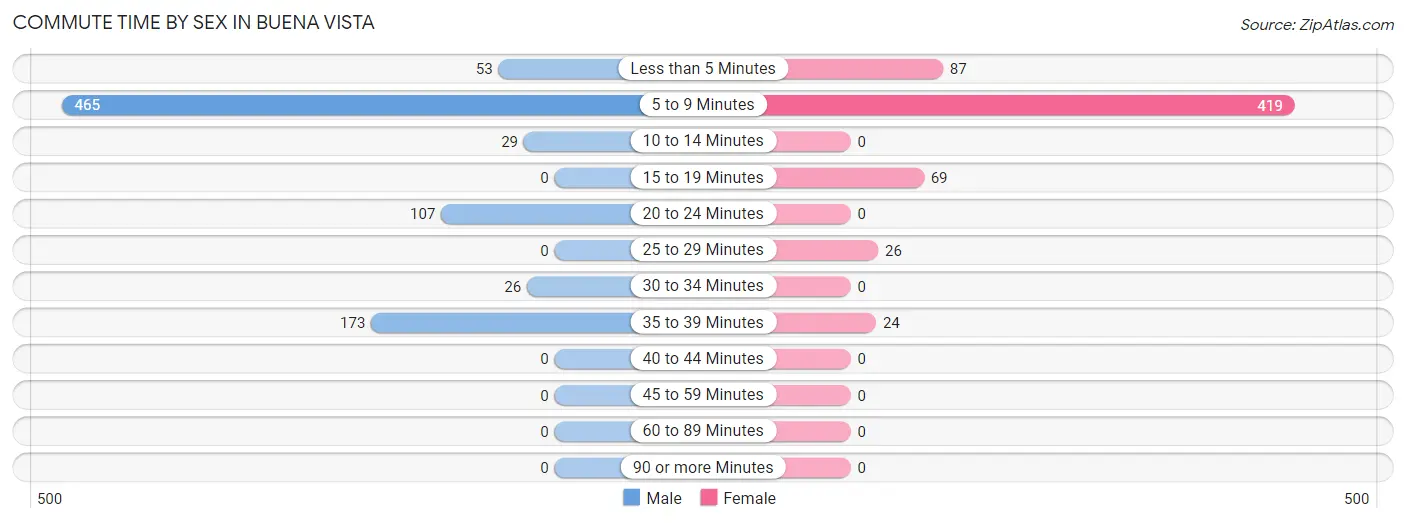
Commute Time by Sex in Buena Vista
The most common commute times in Buena Vista are 5 to 9 minutes (465 commuters, 54.5%) for males and 5 to 9 minutes (419 commuters, 67.0%) for females.
| Commute Time | Male | Female |
| Less than 5 Minutes | 53 (6.2%) | 87 (13.9%) |
| 5 to 9 Minutes | 465 (54.5%) | 419 (67.0%) |
| 10 to 14 Minutes | 29 (3.4%) | 0 (0.0%) |
| 15 to 19 Minutes | 0 (0.0%) | 69 (11.0%) |
| 20 to 24 Minutes | 107 (12.5%) | 0 (0.0%) |
| 25 to 29 Minutes | 0 (0.0%) | 26 (4.2%) |
| 30 to 34 Minutes | 26 (3.0%) | 0 (0.0%) |
| 35 to 39 Minutes | 173 (20.3%) | 24 (3.8%) |
| 40 to 44 Minutes | 0 (0.0%) | 0 (0.0%) |
| 45 to 59 Minutes | 0 (0.0%) | 0 (0.0%) |
| 60 to 89 Minutes | 0 (0.0%) | 0 (0.0%) |
| 90 or more Minutes | 0 (0.0%) | 0 (0.0%) |
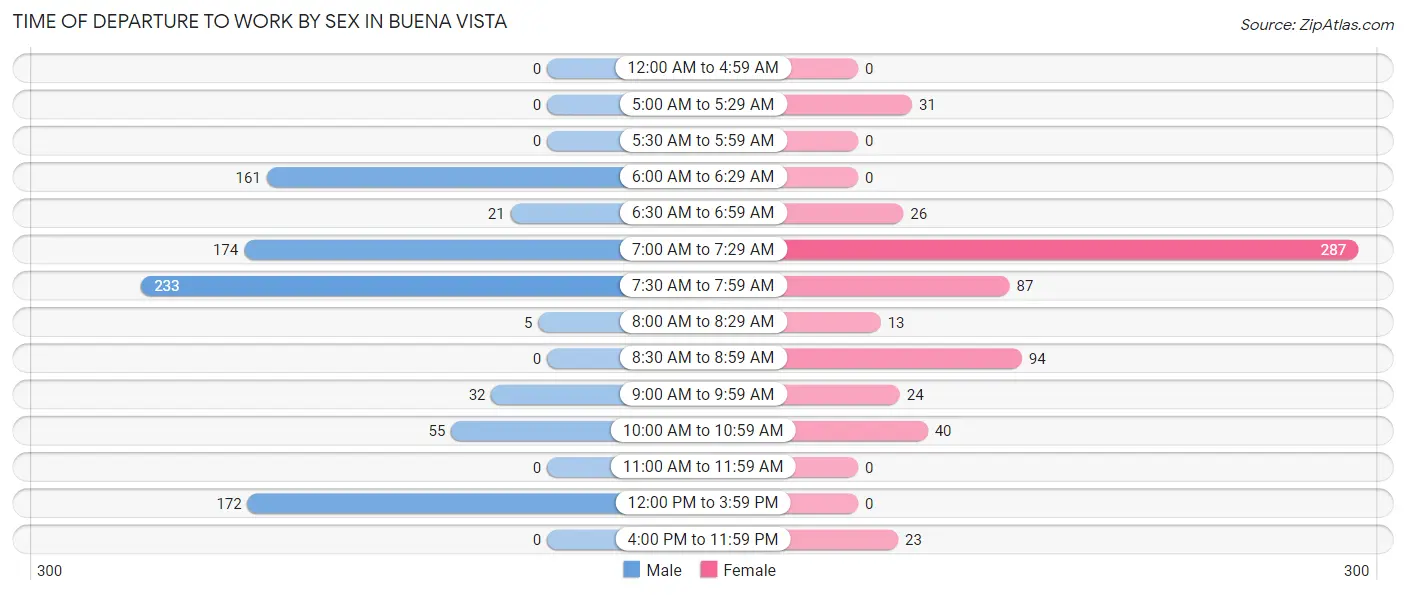
Time of Departure to Work by Sex in Buena Vista
The most frequent times of departure to work in Buena Vista are 7:30 AM to 7:59 AM (233, 27.3%) for males and 7:00 AM to 7:29 AM (287, 45.9%) for females.
| Time of Departure | Male | Female |
| 12:00 AM to 4:59 AM | 0 (0.0%) | 0 (0.0%) |
| 5:00 AM to 5:29 AM | 0 (0.0%) | 31 (5.0%) |
| 5:30 AM to 5:59 AM | 0 (0.0%) | 0 (0.0%) |
| 6:00 AM to 6:29 AM | 161 (18.9%) | 0 (0.0%) |
| 6:30 AM to 6:59 AM | 21 (2.5%) | 26 (4.2%) |
| 7:00 AM to 7:29 AM | 174 (20.4%) | 287 (45.9%) |
| 7:30 AM to 7:59 AM | 233 (27.3%) | 87 (13.9%) |
| 8:00 AM to 8:29 AM | 5 (0.6%) | 13 (2.1%) |
| 8:30 AM to 8:59 AM | 0 (0.0%) | 94 (15.0%) |
| 9:00 AM to 9:59 AM | 32 (3.7%) | 24 (3.8%) |
| 10:00 AM to 10:59 AM | 55 (6.5%) | 40 (6.4%) |
| 11:00 AM to 11:59 AM | 0 (0.0%) | 0 (0.0%) |
| 12:00 PM to 3:59 PM | 172 (20.2%) | 0 (0.0%) |
| 4:00 PM to 11:59 PM | 0 (0.0%) | 23 (3.7%) |
| Total | 853 (100.0%) | 625 (100.0%) |
Housing Occupancy in Buena Vista
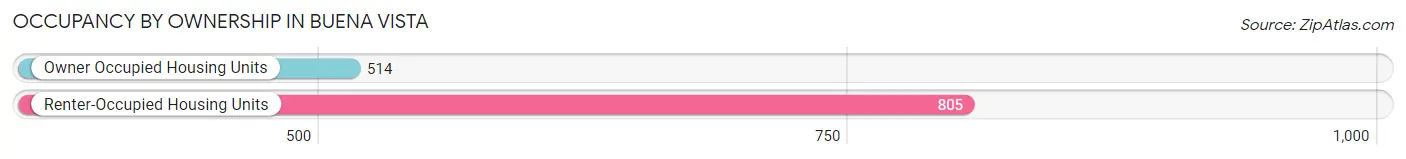
Occupancy by Ownership in Buena Vista
Of the total 1,319 dwellings in Buena Vista, owner-occupied units account for 514 (39.0%), while renter-occupied units make up 805 (61.0%).
| Occupancy | # Housing Units | % Housing Units |
| Owner Occupied Housing Units | 514 | 39.0% |
| Renter-Occupied Housing Units | 805 | 61.0% |
| Total Occupied Housing Units | 1,319 | 100.0% |
Occupancy by Household Size in Buena Vista
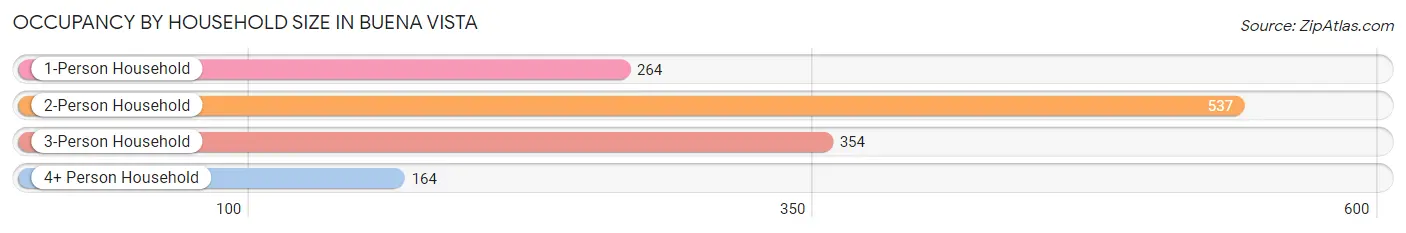
| Household Size | # Housing Units | % Housing Units |
| 1-Person Household | 264 | 20.0% |
| 2-Person Household | 537 | 40.7% |
| 3-Person Household | 354 | 26.8% |
| 4+ Person Household | 164 | 12.4% |
| Total Housing Units | 1,319 | 100.0% |
Occupancy by Ownership by Household Size in Buena Vista
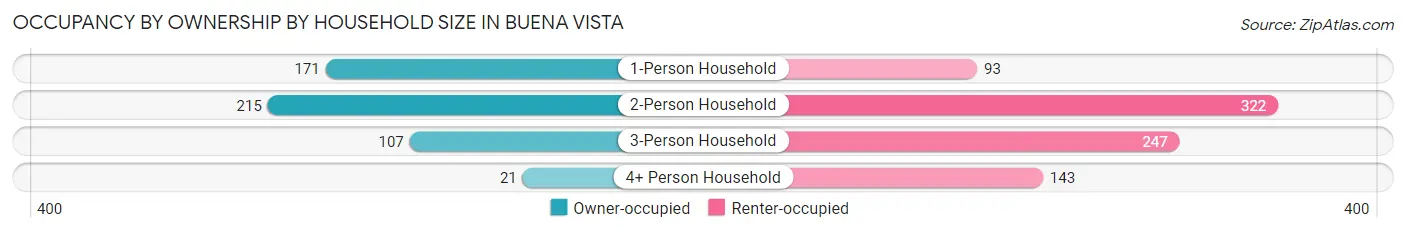
| Household Size | Owner-occupied | Renter-occupied |
| 1-Person Household | 171 (64.8%) | 93 (35.2%) |
| 2-Person Household | 215 (40.0%) | 322 (60.0%) |
| 3-Person Household | 107 (30.2%) | 247 (69.8%) |
| 4+ Person Household | 21 (12.8%) | 143 (87.2%) |
| Total Housing Units | 514 (39.0%) | 805 (61.0%) |
Occupancy by Educational Attainment in Buena Vista
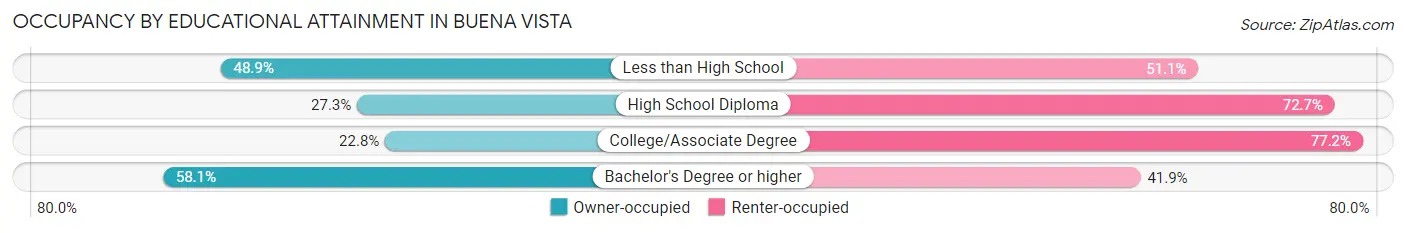
| Household Size | Owner-occupied | Renter-occupied |
| Less than High School | 112 (48.9%) | 117 (51.1%) |
| High School Diploma | 151 (27.3%) | 403 (72.7%) |
| College/Associate Degree | 39 (22.8%) | 132 (77.2%) |
| Bachelor's Degree or higher | 212 (58.1%) | 153 (41.9%) |
Occupancy by Age of Householder in Buena Vista
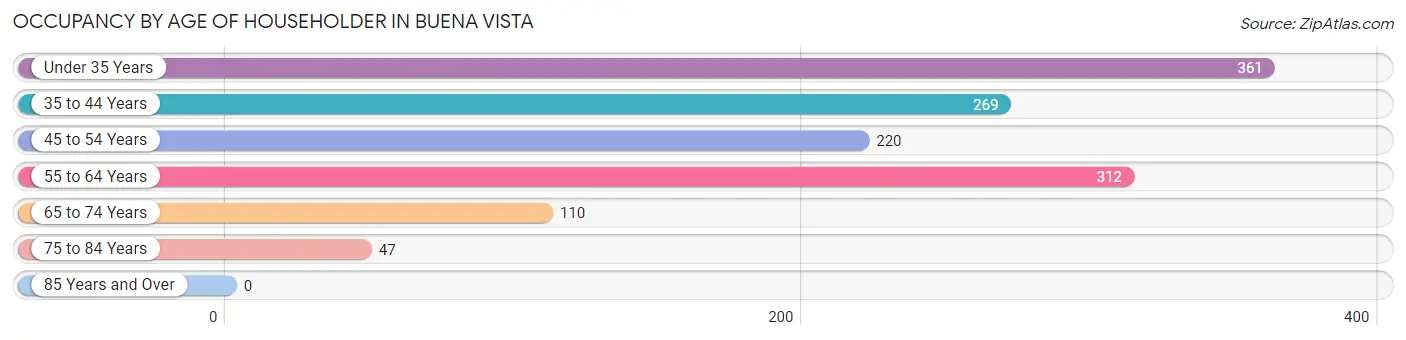
| Age Bracket | # Households | % Households |
| Under 35 Years | 361 | 27.4% |
| 35 to 44 Years | 269 | 20.4% |
| 45 to 54 Years | 220 | 16.7% |
| 55 to 64 Years | 312 | 23.6% |
| 65 to 74 Years | 110 | 8.3% |
| 75 to 84 Years | 47 | 3.6% |
| 85 Years and Over | 0 | 0.0% |
| Total | 1,319 | 100.0% |
Housing Finances in Buena Vista
Median Income by Occupancy in Buena Vista
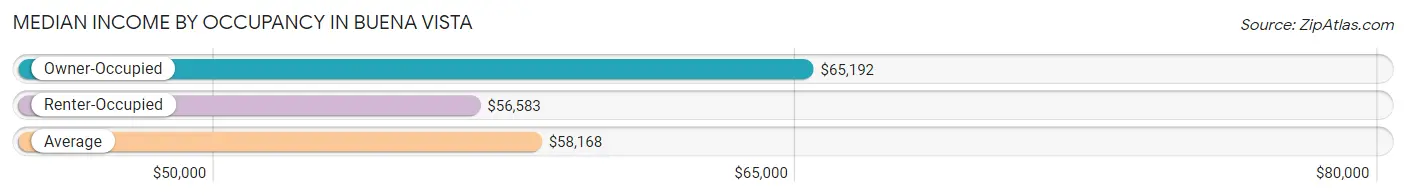
| Occupancy Type | # Households | Median Income |
| Owner-Occupied | 514 (39.0%) | $65,192 |
| Renter-Occupied | 805 (61.0%) | $56,583 |
| Average | 1,319 (100.0%) | $58,168 |
Occupancy by Householder Income Bracket in Buena Vista
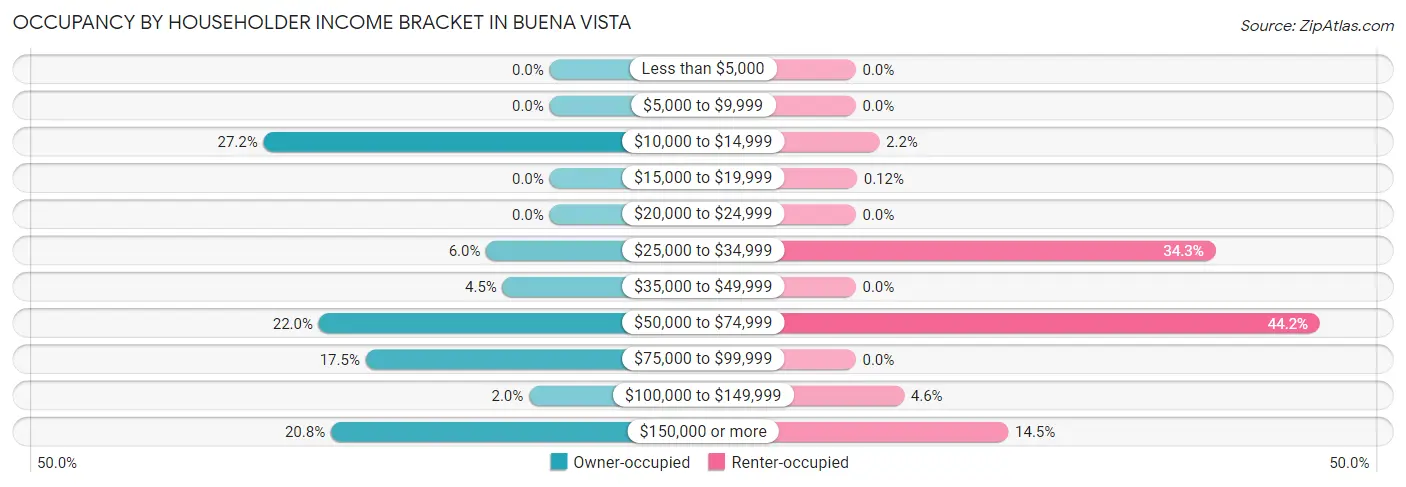
| Income Bracket | Owner-occupied | Renter-occupied |
| Less than $5,000 | 0 (0.0%) | 0 (0.0%) |
| $5,000 to $9,999 | 0 (0.0%) | 0 (0.0%) |
| $10,000 to $14,999 | 140 (27.2%) | 18 (2.2%) |
| $15,000 to $19,999 | 0 (0.0%) | 1 (0.1%) |
| $20,000 to $24,999 | 0 (0.0%) | 0 (0.0%) |
| $25,000 to $34,999 | 31 (6.0%) | 276 (34.3%) |
| $35,000 to $49,999 | 23 (4.5%) | 0 (0.0%) |
| $50,000 to $74,999 | 113 (22.0%) | 356 (44.2%) |
| $75,000 to $99,999 | 90 (17.5%) | 0 (0.0%) |
| $100,000 to $149,999 | 10 (1.9%) | 37 (4.6%) |
| $150,000 or more | 107 (20.8%) | 117 (14.5%) |
| Total | 514 (100.0%) | 805 (100.0%) |
Monthly Housing Cost Tiers in Buena Vista
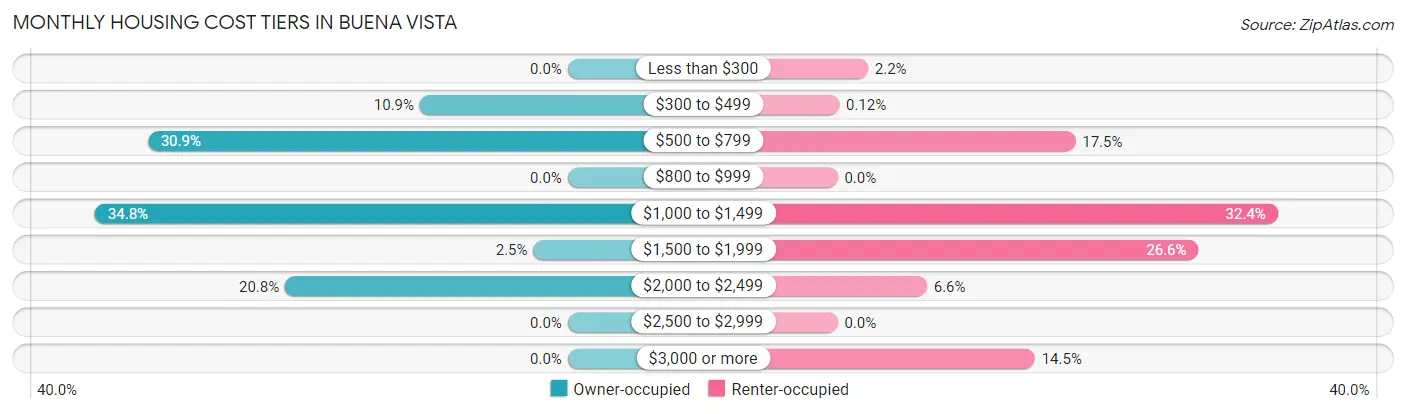
| Monthly Cost | Owner-occupied | Renter-occupied |
| Less than $300 | 0 (0.0%) | 18 (2.2%) |
| $300 to $499 | 56 (10.9%) | 1 (0.1%) |
| $500 to $799 | 159 (30.9%) | 141 (17.5%) |
| $800 to $999 | 0 (0.0%) | 0 (0.0%) |
| $1,000 to $1,499 | 179 (34.8%) | 261 (32.4%) |
| $1,500 to $1,999 | 13 (2.5%) | 214 (26.6%) |
| $2,000 to $2,499 | 107 (20.8%) | 53 (6.6%) |
| $2,500 to $2,999 | 0 (0.0%) | 0 (0.0%) |
| $3,000 or more | 0 (0.0%) | 117 (14.5%) |
| Total | 514 (100.0%) | 805 (100.0%) |
Physical Housing Characteristics in Buena Vista
Housing Structures in Buena Vista
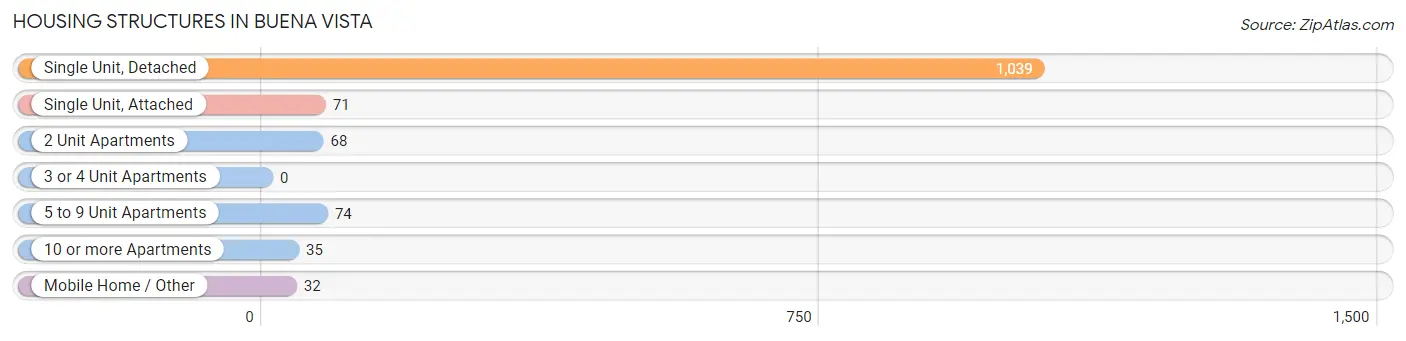
| Structure Type | # Housing Units | % Housing Units |
| Single Unit, Detached | 1,039 | 78.8% |
| Single Unit, Attached | 71 | 5.4% |
| 2 Unit Apartments | 68 | 5.2% |
| 3 or 4 Unit Apartments | 0 | 0.0% |
| 5 to 9 Unit Apartments | 74 | 5.6% |
| 10 or more Apartments | 35 | 2.6% |
| Mobile Home / Other | 32 | 2.4% |
| Total | 1,319 | 100.0% |
Housing Structures by Occupancy in Buena Vista
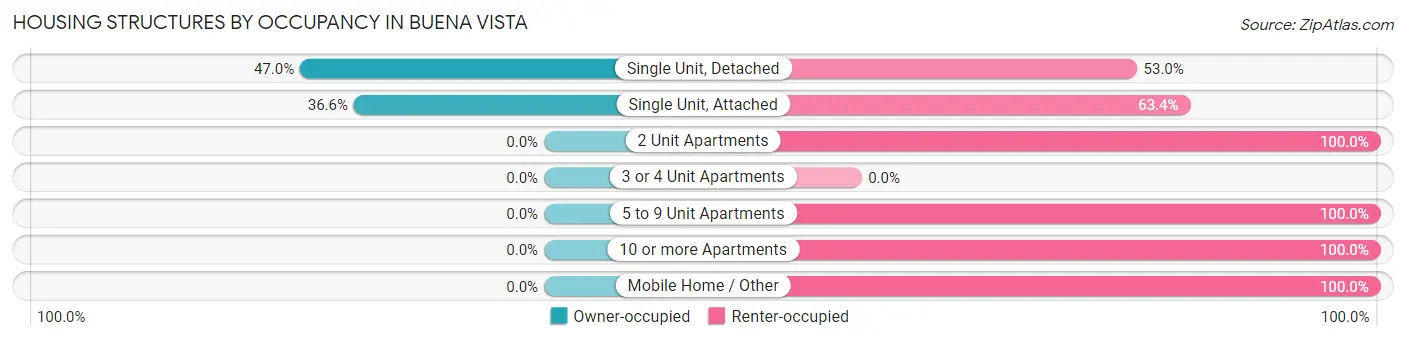
| Structure Type | Owner-occupied | Renter-occupied |
| Single Unit, Detached | 488 (47.0%) | 551 (53.0%) |
| Single Unit, Attached | 26 (36.6%) | 45 (63.4%) |
| 2 Unit Apartments | 0 (0.0%) | 68 (100.0%) |
| 3 or 4 Unit Apartments | 0 (0.0%) | 0 (0.0%) |
| 5 to 9 Unit Apartments | 0 (0.0%) | 74 (100.0%) |
| 10 or more Apartments | 0 (0.0%) | 35 (100.0%) |
| Mobile Home / Other | 0 (0.0%) | 32 (100.0%) |
| Total | 514 (39.0%) | 805 (61.0%) |
Housing Structures by Number of Rooms in Buena Vista
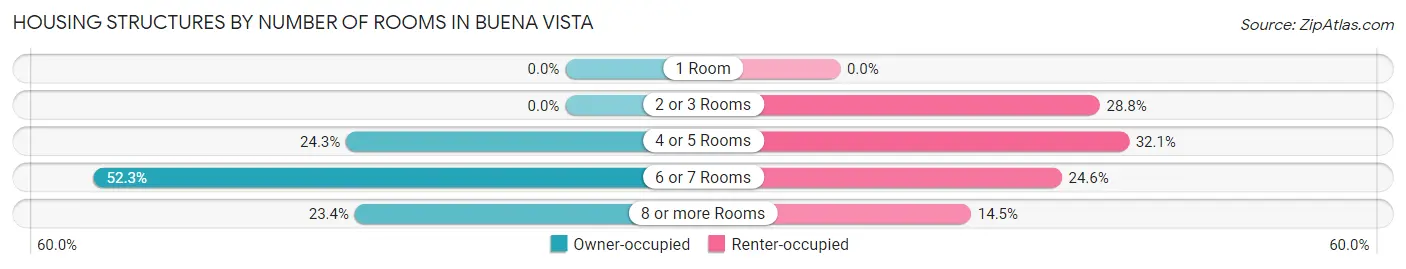
| Number of Rooms | Owner-occupied | Renter-occupied |
| 1 Room | 0 (0.0%) | 0 (0.0%) |
| 2 or 3 Rooms | 0 (0.0%) | 232 (28.8%) |
| 4 or 5 Rooms | 125 (24.3%) | 258 (32.1%) |
| 6 or 7 Rooms | 269 (52.3%) | 198 (24.6%) |
| 8 or more Rooms | 120 (23.4%) | 117 (14.5%) |
| Total | 514 (100.0%) | 805 (100.0%) |
Housing Structure by Heating Type in Buena Vista
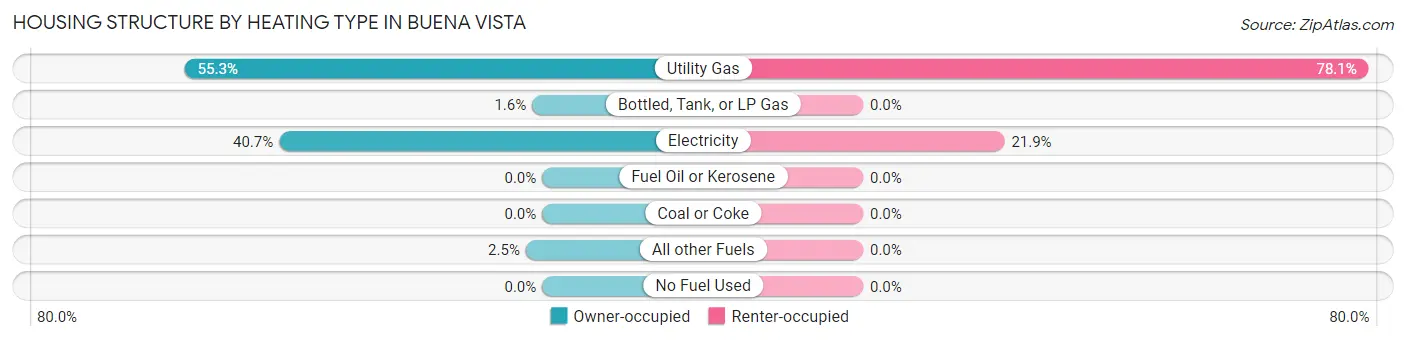
| Heating Type | Owner-occupied | Renter-occupied |
| Utility Gas | 284 (55.2%) | 629 (78.1%) |
| Bottled, Tank, or LP Gas | 8 (1.6%) | 0 (0.0%) |
| Electricity | 209 (40.7%) | 176 (21.9%) |
| Fuel Oil or Kerosene | 0 (0.0%) | 0 (0.0%) |
| Coal or Coke | 0 (0.0%) | 0 (0.0%) |
| All other Fuels | 13 (2.5%) | 0 (0.0%) |
| No Fuel Used | 0 (0.0%) | 0 (0.0%) |
| Total | 514 (100.0%) | 805 (100.0%) |
Household Vehicle Usage in Buena Vista
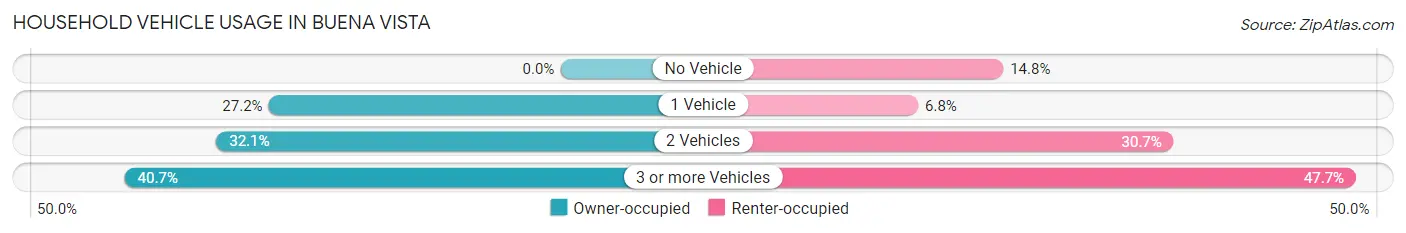
| Vehicles per Household | Owner-occupied | Renter-occupied |
| No Vehicle | 0 (0.0%) | 119 (14.8%) |
| 1 Vehicle | 140 (27.2%) | 55 (6.8%) |
| 2 Vehicles | 165 (32.1%) | 247 (30.7%) |
| 3 or more Vehicles | 209 (40.7%) | 384 (47.7%) |
| Total | 514 (100.0%) | 805 (100.0%) |
Real Estate & Mortgages in Buena Vista
Real Estate and Mortgage Overview in Buena Vista
| Characteristic | Without Mortgage | With Mortgage |
| Housing Units | 74 | 440 |
| Median Property Value | $559,200 | $407,900 |
| Median Household Income | - | - |
| Monthly Housing Costs | $454 | $0 |
| Real Estate Taxes | $1,280 | $0 |
Property Value by Mortgage Status in Buena Vista
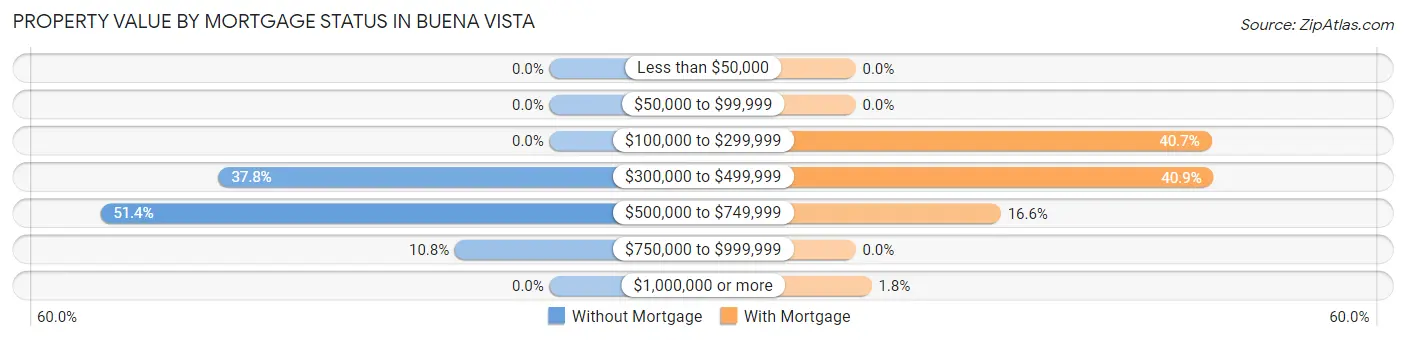
| Property Value | Without Mortgage | With Mortgage |
| Less than $50,000 | 0 (0.0%) | 0 (0.0%) |
| $50,000 to $99,999 | 0 (0.0%) | 0 (0.0%) |
| $100,000 to $299,999 | 0 (0.0%) | 179 (40.7%) |
| $300,000 to $499,999 | 28 (37.8%) | 180 (40.9%) |
| $500,000 to $749,999 | 38 (51.3%) | 73 (16.6%) |
| $750,000 to $999,999 | 8 (10.8%) | 0 (0.0%) |
| $1,000,000 or more | 0 (0.0%) | 8 (1.8%) |
| Total | 74 (100.0%) | 440 (100.0%) |
Household Income by Mortgage Status in Buena Vista
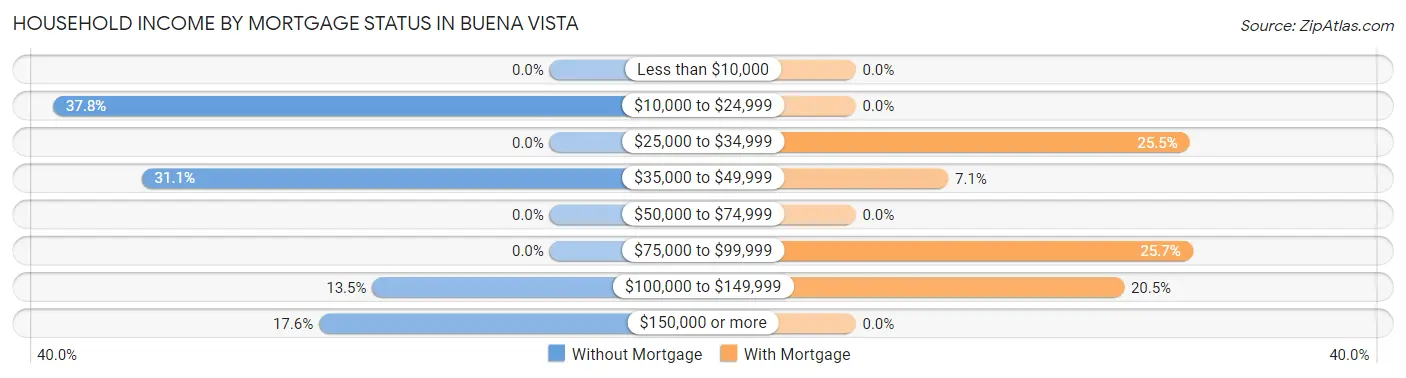
| Household Income | Without Mortgage | With Mortgage |
| Less than $10,000 | 0 (0.0%) | 0 (0.0%) |
| $10,000 to $24,999 | 28 (37.8%) | 0 (0.0%) |
| $25,000 to $34,999 | 0 (0.0%) | 112 (25.5%) |
| $35,000 to $49,999 | 23 (31.1%) | 31 (7.0%) |
| $50,000 to $74,999 | 0 (0.0%) | 0 (0.0%) |
| $75,000 to $99,999 | 0 (0.0%) | 113 (25.7%) |
| $100,000 to $149,999 | 10 (13.5%) | 90 (20.4%) |
| $150,000 or more | 13 (17.6%) | 0 (0.0%) |
| Total | 74 (100.0%) | 440 (100.0%) |
Property Value to Household Income Ratio in Buena Vista
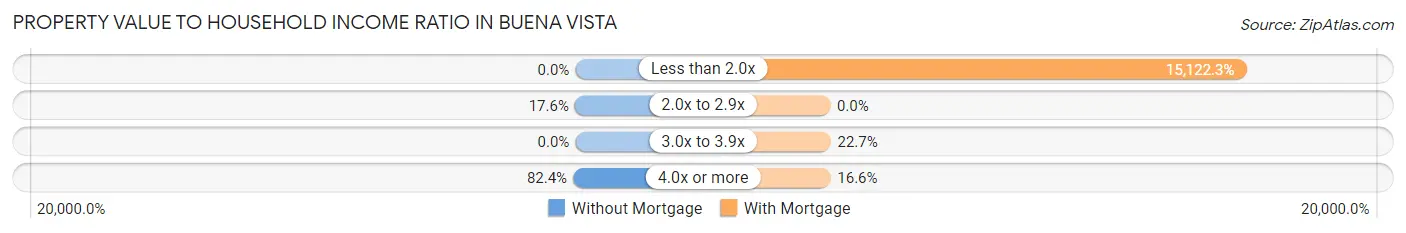
| Value-to-Income Ratio | Without Mortgage | With Mortgage |
| Less than 2.0x | 0 (0.0%) | 66,538 (15,122.3%) |
| 2.0x to 2.9x | 13 (17.6%) | 0 (0.0%) |
| 3.0x to 3.9x | 0 (0.0%) | 100 (22.7%) |
| 4.0x or more | 61 (82.4%) | 73 (16.6%) |
| Total | 74 (100.0%) | 440 (100.0%) |
Real Estate Taxes by Mortgage Status in Buena Vista
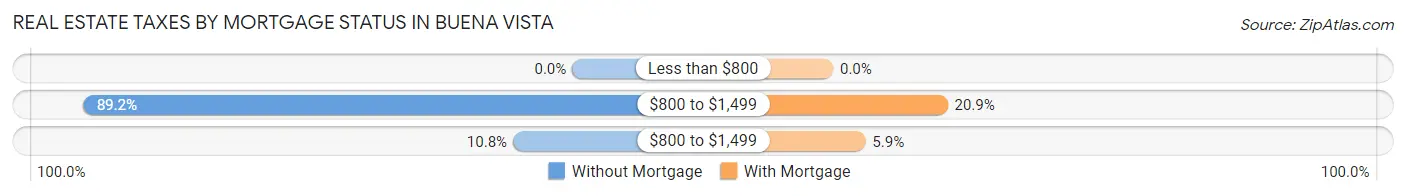
| Property Taxes | Without Mortgage | With Mortgage |
| Less than $800 | 0 (0.0%) | 0 (0.0%) |
| $800 to $1,499 | 66 (89.2%) | 92 (20.9%) |
| $800 to $1,499 | 8 (10.8%) | 26 (5.9%) |
| Total | 74 (100.0%) | 440 (100.0%) |
Health & Disability in Buena Vista
Health Insurance Coverage by Age in Buena Vista
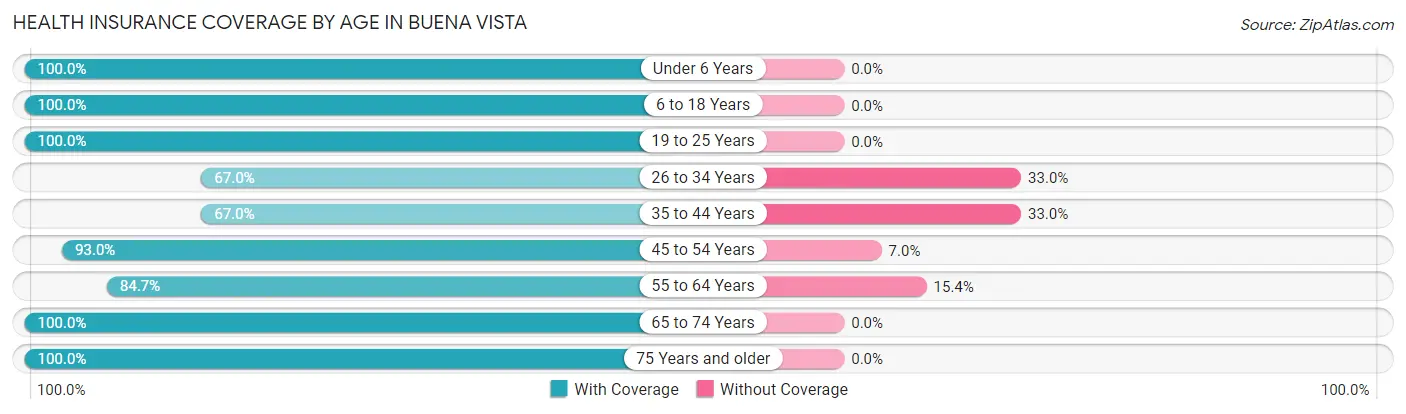
| Age Bracket | With Coverage | Without Coverage |
| Under 6 Years | 52 (100.0%) | 0 (0.0%) |
| 6 to 18 Years | 583 (100.0%) | 0 (0.0%) |
| 19 to 25 Years | 372 (100.0%) | 0 (0.0%) |
| 26 to 34 Years | 319 (67.0%) | 157 (33.0%) |
| 35 to 44 Years | 242 (67.0%) | 119 (33.0%) |
| 45 to 54 Years | 347 (93.0%) | 26 (7.0%) |
| 55 to 64 Years | 408 (84.7%) | 74 (15.3%) |
| 65 to 74 Years | 134 (100.0%) | 0 (0.0%) |
| 75 Years and older | 54 (100.0%) | 0 (0.0%) |
| Total | 2,511 (87.0%) | 376 (13.0%) |
Health Insurance Coverage by Citizenship Status in Buena Vista
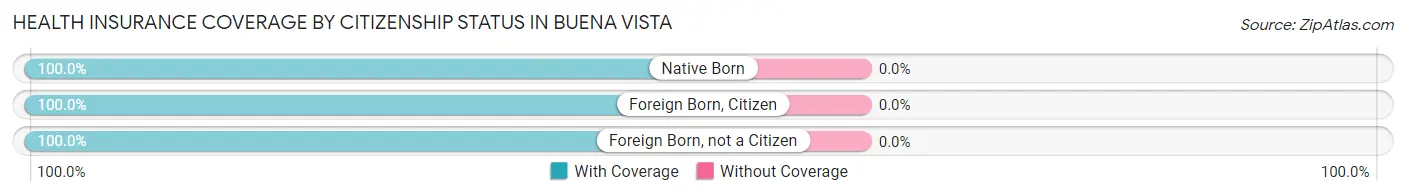
| Citizenship Status | With Coverage | Without Coverage |
| Native Born | 52 (100.0%) | 0 (0.0%) |
| Foreign Born, Citizen | 583 (100.0%) | 0 (0.0%) |
| Foreign Born, not a Citizen | 372 (100.0%) | 0 (0.0%) |
Health Insurance Coverage by Household Income in Buena Vista
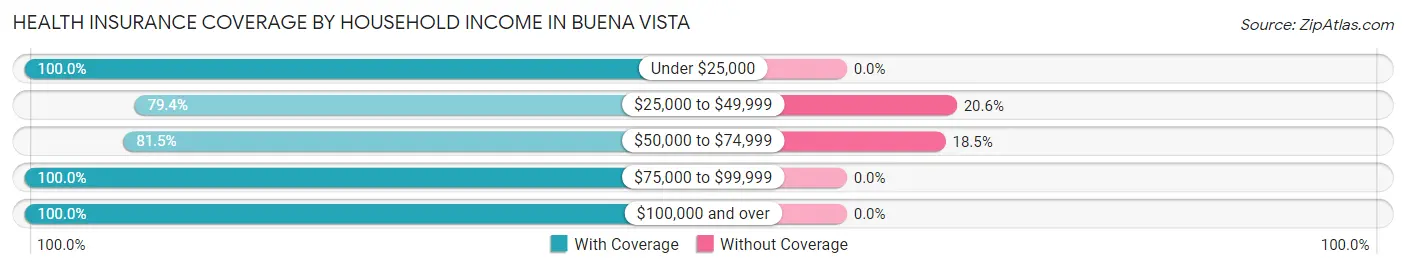
| Household Income | With Coverage | Without Coverage |
| Under $25,000 | 159 (100.0%) | 0 (0.0%) |
| $25,000 to $49,999 | 686 (79.4%) | 178 (20.6%) |
| $50,000 to $74,999 | 872 (81.5%) | 198 (18.5%) |
| $75,000 to $99,999 | 168 (100.0%) | 0 (0.0%) |
| $100,000 and over | 626 (100.0%) | 0 (0.0%) |
Public vs Private Health Insurance Coverage by Age in Buena Vista
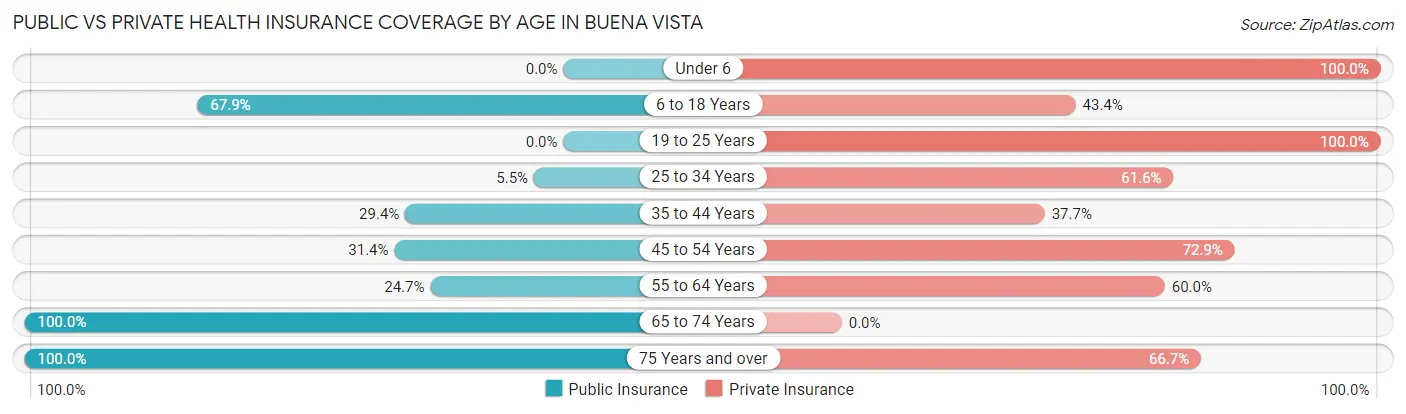
| Age Bracket | Public Insurance | Private Insurance |
| Under 6 | 0 (0.0%) | 52 (100.0%) |
| 6 to 18 Years | 396 (67.9%) | 253 (43.4%) |
| 19 to 25 Years | 0 (0.0%) | 372 (100.0%) |
| 25 to 34 Years | 26 (5.5%) | 293 (61.6%) |
| 35 to 44 Years | 106 (29.4%) | 136 (37.7%) |
| 45 to 54 Years | 117 (31.4%) | 272 (72.9%) |
| 55 to 64 Years | 119 (24.7%) | 289 (60.0%) |
| 65 to 74 Years | 134 (100.0%) | 0 (0.0%) |
| 75 Years and over | 54 (100.0%) | 36 (66.7%) |
| Total | 952 (33.0%) | 1,703 (59.0%) |
Disability Status by Sex by Age in Buena Vista
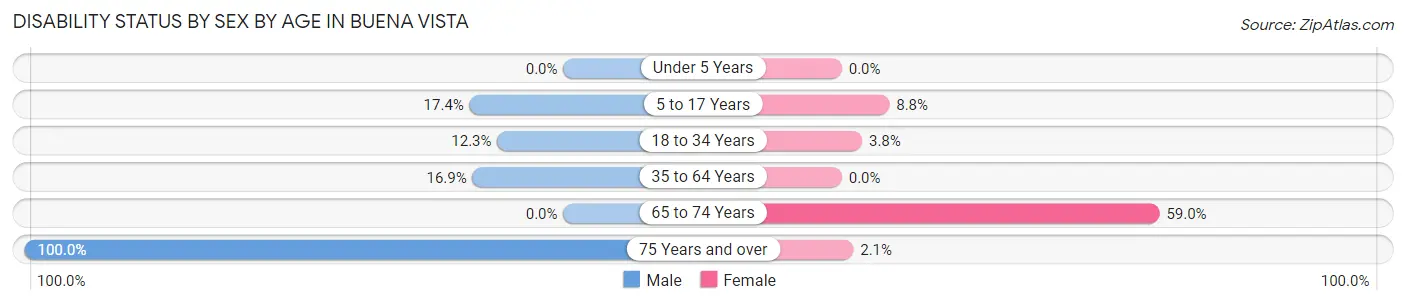
| Age Bracket | Male | Female |
| Under 5 Years | 0 (0.0%) | 0 (0.0%) |
| 5 to 17 Years | 56 (17.4%) | 23 (8.8%) |
| 18 to 34 Years | 55 (12.2%) | 15 (3.8%) |
| 35 to 64 Years | 131 (16.9%) | 0 (0.0%) |
| 65 to 74 Years | 0 (0.0%) | 79 (59.0%) |
| 75 Years and over | 7 (100.0%) | 1 (2.1%) |
Disability Class by Sex by Age in Buena Vista
Disability Class: Hearing Difficulty
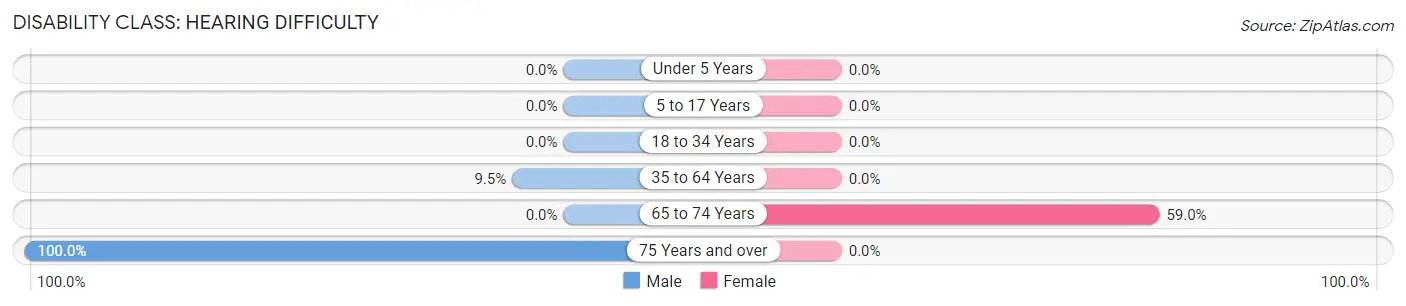
| Age Bracket | Male | Female |
| Under 5 Years | 0 (0.0%) | 0 (0.0%) |
| 5 to 17 Years | 0 (0.0%) | 0 (0.0%) |
| 18 to 34 Years | 0 (0.0%) | 0 (0.0%) |
| 35 to 64 Years | 74 (9.5%) | 0 (0.0%) |
| 65 to 74 Years | 0 (0.0%) | 79 (59.0%) |
| 75 Years and over | 7 (100.0%) | 0 (0.0%) |
Disability Class: Vision Difficulty
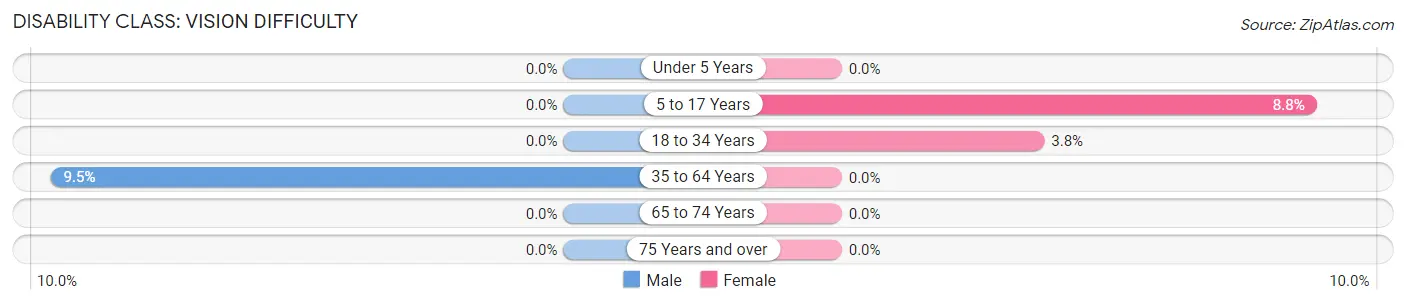
| Age Bracket | Male | Female |
| Under 5 Years | 0 (0.0%) | 0 (0.0%) |
| 5 to 17 Years | 0 (0.0%) | 23 (8.8%) |
| 18 to 34 Years | 0 (0.0%) | 15 (3.8%) |
| 35 to 64 Years | 74 (9.5%) | 0 (0.0%) |
| 65 to 74 Years | 0 (0.0%) | 0 (0.0%) |
| 75 Years and over | 0 (0.0%) | 0 (0.0%) |
Disability Class: Cognitive Difficulty
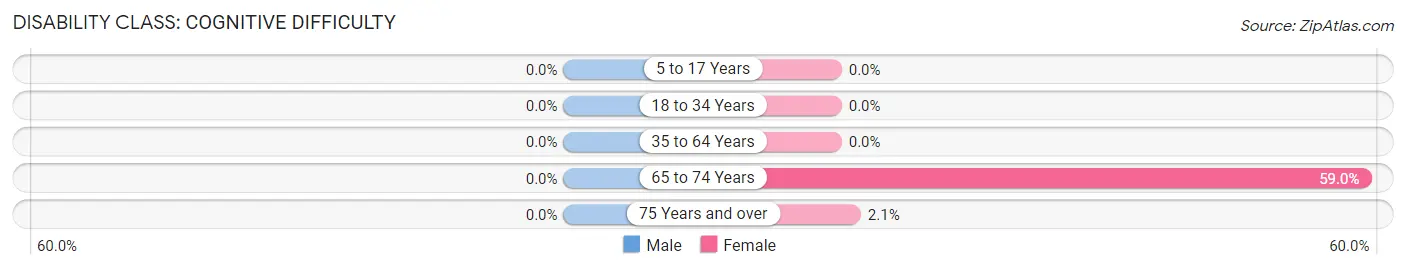
| Age Bracket | Male | Female |
| 5 to 17 Years | 0 (0.0%) | 0 (0.0%) |
| 18 to 34 Years | 0 (0.0%) | 0 (0.0%) |
| 35 to 64 Years | 0 (0.0%) | 0 (0.0%) |
| 65 to 74 Years | 0 (0.0%) | 79 (59.0%) |
| 75 Years and over | 0 (0.0%) | 1 (2.1%) |
Disability Class: Ambulatory Difficulty
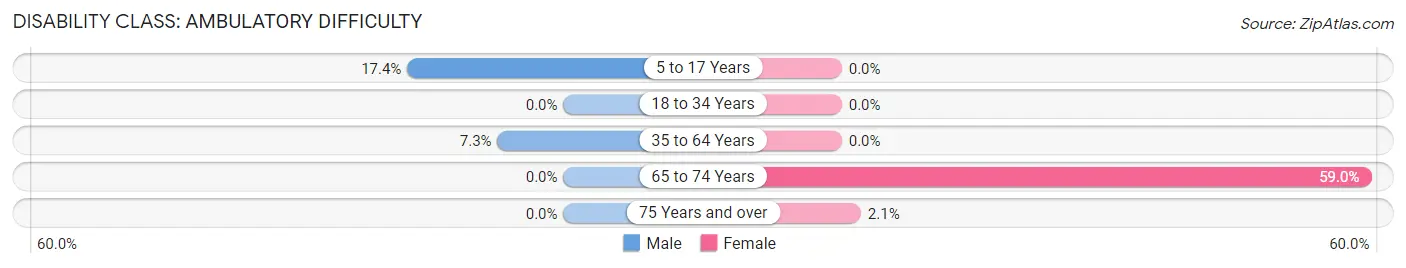
| Age Bracket | Male | Female |
| 5 to 17 Years | 56 (17.4%) | 0 (0.0%) |
| 18 to 34 Years | 0 (0.0%) | 0 (0.0%) |
| 35 to 64 Years | 57 (7.3%) | 0 (0.0%) |
| 65 to 74 Years | 0 (0.0%) | 79 (59.0%) |
| 75 Years and over | 0 (0.0%) | 1 (2.1%) |
Disability Class: Self-Care Difficulty
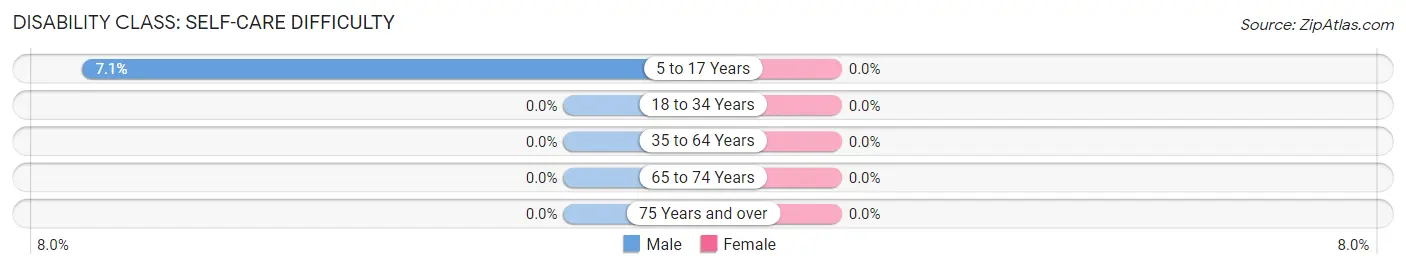
| Age Bracket | Male | Female |
| 5 to 17 Years | 23 (7.1%) | 0 (0.0%) |
| 18 to 34 Years | 0 (0.0%) | 0 (0.0%) |
| 35 to 64 Years | 0 (0.0%) | 0 (0.0%) |
| 65 to 74 Years | 0 (0.0%) | 0 (0.0%) |
| 75 Years and over | 0 (0.0%) | 0 (0.0%) |
Technology Access in Buena Vista
Computing Device Access in Buena Vista
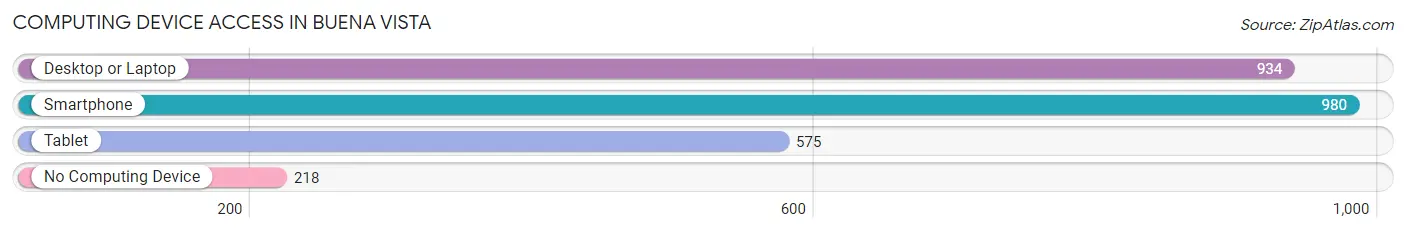
| Device Type | # Households | % Households |
| Desktop or Laptop | 934 | 70.8% |
| Smartphone | 980 | 74.3% |
| Tablet | 575 | 43.6% |
| No Computing Device | 218 | 16.5% |
| Total | 1,319 | 100.0% |
Internet Access in Buena Vista
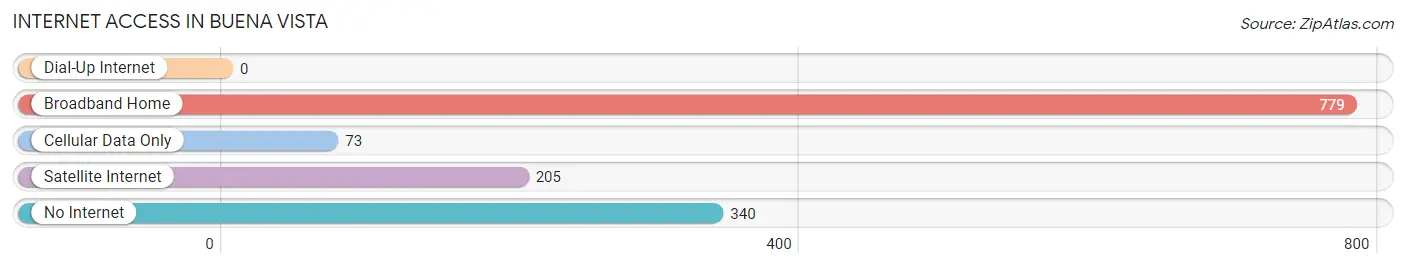
| Internet Type | # Households | % Households |
| Dial-Up Internet | 0 | 0.0% |
| Broadband Home | 779 | 59.1% |
| Cellular Data Only | 73 | 5.5% |
| Satellite Internet | 205 | 15.5% |
| No Internet | 340 | 25.8% |
| Total | 1,319 | 100.0% |
Buena Vista Summary
Buena Vista, Colorado is a small town located in the heart of the Rocky Mountains in Chaffee County. It is situated at an elevation of 7,965 feet and is surrounded by the Collegiate Peaks, the Arkansas River, and the Sawatch Range. The town was founded in 1879 and has a population of 2,617 as of the 2010 census.
History
The town of Buena Vista was founded in 1879 by a group of settlers from Leadville, Colorado. The town was named after the nearby Buena Vista Lake, which was named by explorer Zebulon Pike in 1806. The town was originally a mining camp, but quickly grew into a bustling community with a variety of businesses, including a hotel, a general store, a saloon, and a post office.
In the late 1800s, the town was a popular destination for tourists, who came to enjoy the scenery and the outdoor activities. The town was also a popular stop for the Denver and Rio Grande Railroad, which ran through the town until the 1950s.
Geography
Buena Vista is located in the heart of the Rocky Mountains in Chaffee County, Colorado. It is situated at an elevation of 7,965 feet and is surrounded by the Collegiate Peaks, the Arkansas River, and the Sawatch Range. The town is located approximately 100 miles southwest of Denver and is accessible by US Highway 24.
The town is located in a valley surrounded by mountains, and is known for its spectacular views of the Collegiate Peaks. The town is also home to several lakes, including Twin Lakes, Clear Creek Reservoir, and Turquoise Lake.
Economy
The economy of Buena Vista is largely based on tourism. The town is a popular destination for outdoor enthusiasts, who come to enjoy the scenery and the outdoor activities. The town is also home to several ski resorts, including Monarch Mountain and Ski Cooper.
The town is also home to several businesses, including restaurants, hotels, and retail stores. The town is also home to several manufacturing companies, including a brewery and a distillery.
Demographics
As of the 2010 census, the population of Buena Vista was 2,617. The racial makeup of the town was 95.3% White, 0.3% African American, 0.7% Native American, 0.7% Asian, 0.1% Pacific Islander, 1.2% from other races, and 1.9% from two or more races. Hispanic or Latino of any race were 4.2% of the population.
The median income for a household in the town was $37,917, and the median income for a family was $45,000. The per capita income for the town was $20,945. About 11.2% of families and 14.2% of the population were below the poverty line, including 18.2% of those under age 18 and 8.3% of those age 65 or over.
Common Questions
What is Per Capita Income in Buena Vista?
Per Capita income in Buena Vista is $29,335.
What is the Median Family Income in Buena Vista?
Median Family Income in Buena Vista is $52,437.
What is the Median Household income in Buena Vista?
Median Household Income in Buena Vista is $58,168.
What is Income or Wage Gap in Buena Vista?
Income or Wage Gap in Buena Vista is 45.8%.
Women in Buena Vista earn 54.2 cents for every dollar earned by a man.
What is Inequality or Gini Index in Buena Vista?
Inequality or Gini Index in Buena Vista is 0.41.
What is the Total Population of Buena Vista?
Total Population of Buena Vista is 2,887.
What is the Total Male Population of Buena Vista?
Total Male Population of Buena Vista is 1,555.
What is the Total Female Population of Buena Vista?
Total Female Population of Buena Vista is 1,332.
What is the Ratio of Males per 100 Females in Buena Vista?
There are 116.74 Males per 100 Females in Buena Vista.
What is the Ratio of Females per 100 Males in Buena Vista?
There are 85.66 Females per 100 Males in Buena Vista.
What is the Median Population Age in Buena Vista?
Median Population Age in Buena Vista is 33.3 Years.
What is the Average Family Size in Buena Vista
Average Family Size in Buena Vista is 2.7 People.
What is the Average Household Size in Buena Vista
Average Household Size in Buena Vista is 2.2 People.
How Large is the Labor Force in Buena Vista?
There are 1,930 People in the Labor Forcein in Buena Vista.
What is the Percentage of People in the Labor Force in Buena Vista?
82.4% of People are in the Labor Force in Buena Vista.
What is the Unemployment Rate in Buena Vista?
Unemployment Rate in Buena Vista is 16.8%.