Red Cliff, CO Map & Demographics
Red Cliff Map
Red Cliff Overview
$47,129
PER CAPITA INCOME
$150,833
AVG FAMILY INCOME
$74,688
AVG HOUSEHOLD INCOME
31.4%
WAGE / INCOME GAP [ % ]
68.6¢/ $1
WAGE / INCOME GAP [ $ ]
0.34
INEQUALITY / GINI INDEX
292
TOTAL POPULATION
159
MALE POPULATION
133
FEMALE POPULATION
119.55
MALES / 100 FEMALES
83.65
FEMALES / 100 MALES
42.6
MEDIAN AGE
3.0
AVG FAMILY SIZE
2.4
AVG HOUSEHOLD SIZE
182
LABOR FORCE [ PEOPLE ]
78.4%
PERCENT IN LABOR FORCE
Red Cliff Zip Codes
Red Cliff Area Codes
Income in Red Cliff
Income Overview in Red Cliff
Per Capita Income in Red Cliff is $47,129, while median incomes of families and households are $150,833 and $74,688 respectively.
| Characteristic | Number | Measure |
| Per Capita Income | 292 | $47,129 |
| Median Family Income | 66 | $150,833 |
| Mean Family Income | 66 | $134,502 |
| Median Household Income | 121 | $74,688 |
| Mean Household Income | 121 | $107,278 |
| Income Deficit | 66 | $0 |
| Wage / Income Gap (%) | 292 | 31.38% |
| Wage / Income Gap ($) | 292 | 68.62¢ per $1 |
| Gini / Inequality Index | 292 | 0.34 |
Earnings by Sex in Red Cliff
Average Earnings in Red Cliff are $48,929, $62,500 for men and $42,885 for women, a difference of 31.4%.
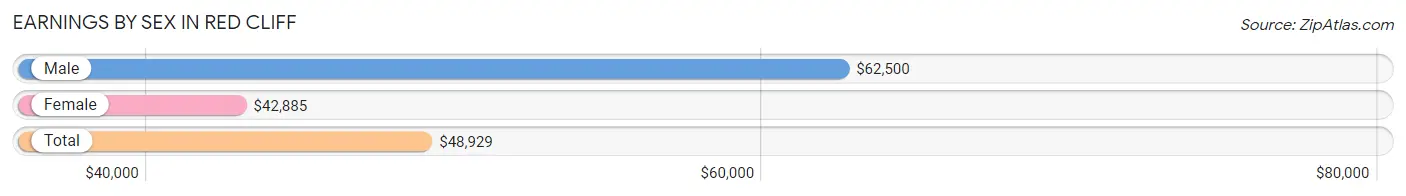
| Sex | Number | Average Earnings |
| Male | 98 (47.6%) | $62,500 |
| Female | 108 (52.4%) | $42,885 |
| Total | 206 (100.0%) | $48,929 |
Earnings by Sex by Income Bracket in Red Cliff
The most common earnings brackets in Red Cliff are $100,000+ for men (28 | 28.6%) and $25,000 to $29,999 for women (23 | 21.3%).
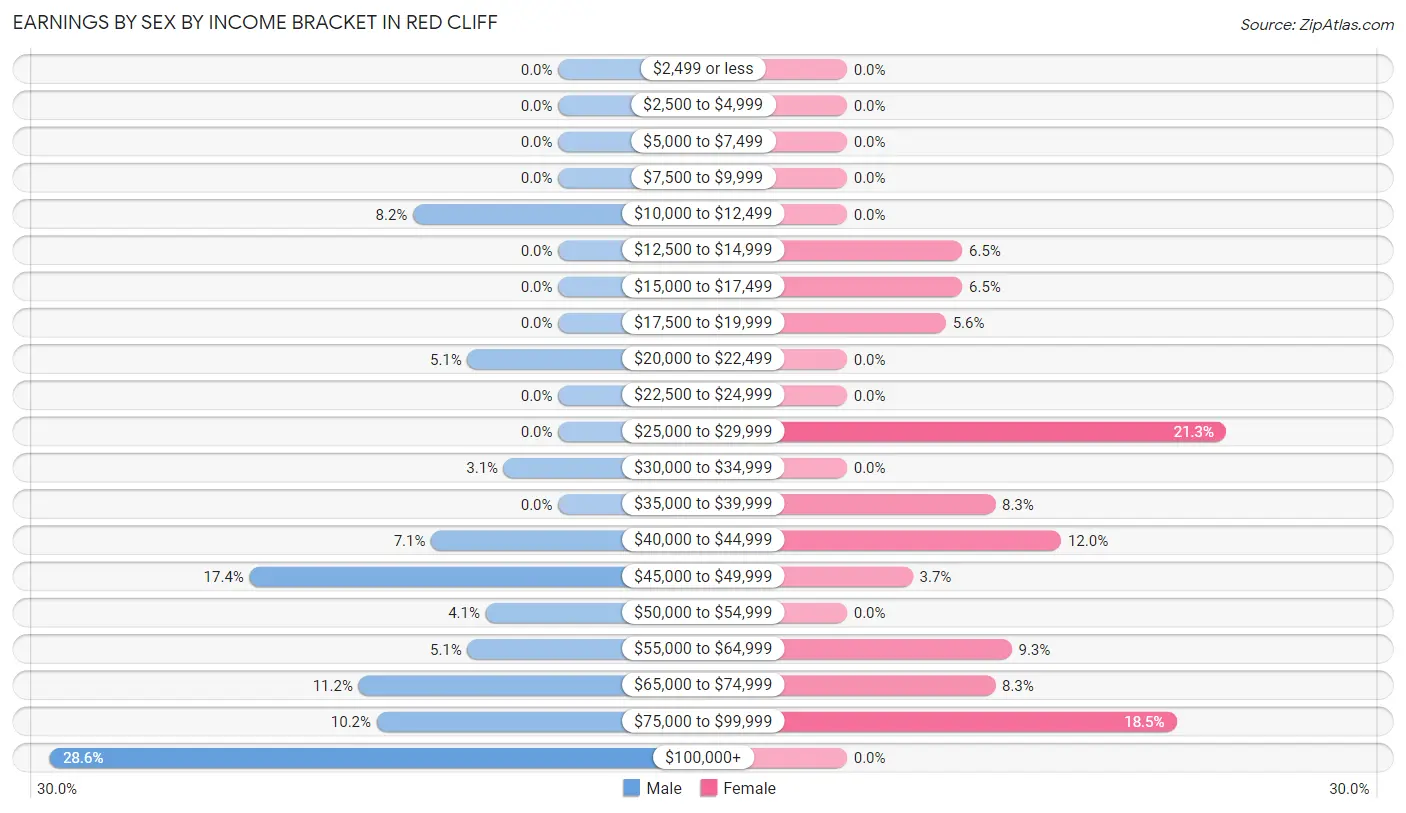
| Income | Male | Female |
| $2,499 or less | 0 (0.0%) | 0 (0.0%) |
| $2,500 to $4,999 | 0 (0.0%) | 0 (0.0%) |
| $5,000 to $7,499 | 0 (0.0%) | 0 (0.0%) |
| $7,500 to $9,999 | 0 (0.0%) | 0 (0.0%) |
| $10,000 to $12,499 | 8 (8.2%) | 0 (0.0%) |
| $12,500 to $14,999 | 0 (0.0%) | 7 (6.5%) |
| $15,000 to $17,499 | 0 (0.0%) | 7 (6.5%) |
| $17,500 to $19,999 | 0 (0.0%) | 6 (5.6%) |
| $20,000 to $22,499 | 5 (5.1%) | 0 (0.0%) |
| $22,500 to $24,999 | 0 (0.0%) | 0 (0.0%) |
| $25,000 to $29,999 | 0 (0.0%) | 23 (21.3%) |
| $30,000 to $34,999 | 3 (3.1%) | 0 (0.0%) |
| $35,000 to $39,999 | 0 (0.0%) | 9 (8.3%) |
| $40,000 to $44,999 | 7 (7.1%) | 13 (12.0%) |
| $45,000 to $49,999 | 17 (17.3%) | 4 (3.7%) |
| $50,000 to $54,999 | 4 (4.1%) | 0 (0.0%) |
| $55,000 to $64,999 | 5 (5.1%) | 10 (9.3%) |
| $65,000 to $74,999 | 11 (11.2%) | 9 (8.3%) |
| $75,000 to $99,999 | 10 (10.2%) | 20 (18.5%) |
| $100,000+ | 28 (28.6%) | 0 (0.0%) |
| Total | 98 (100.0%) | 108 (100.0%) |
Earnings by Sex by Educational Attainment in Red Cliff
Average earnings in Red Cliff are $62,500 for men and $44,135 for women, a difference of 29.4%. Men with an educational attainment of bachelor's degree enjoy the highest average annual earnings of $78,250, while those with college or associate's degree education earn the least with $70,833. Women with an educational attainment of bachelor's degree earn the most with the average annual earnings of $57,250, while those with bachelor's degree education have the smallest earnings of $57,250.
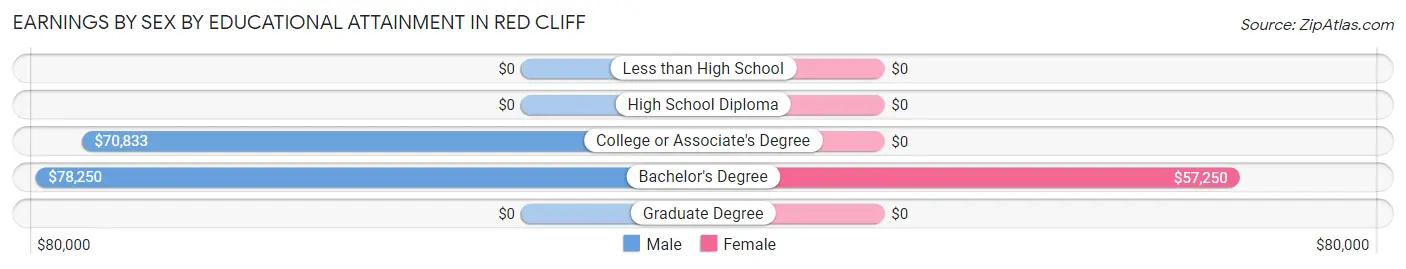
| Educational Attainment | Male Income | Female Income |
| Less than High School | - | - |
| High School Diploma | - | - |
| College or Associate's Degree | $70,833 | $0 |
| Bachelor's Degree | $78,250 | $57,250 |
| Graduate Degree | - | - |
| Total | $62,500 | $44,135 |
Family Income in Red Cliff
Family Income Brackets in Red Cliff
According to the Red Cliff family income data, there are 28 families falling into the $150,000 to $199,999 income range, which is the most common income bracket and makes up 42.4% of all families.
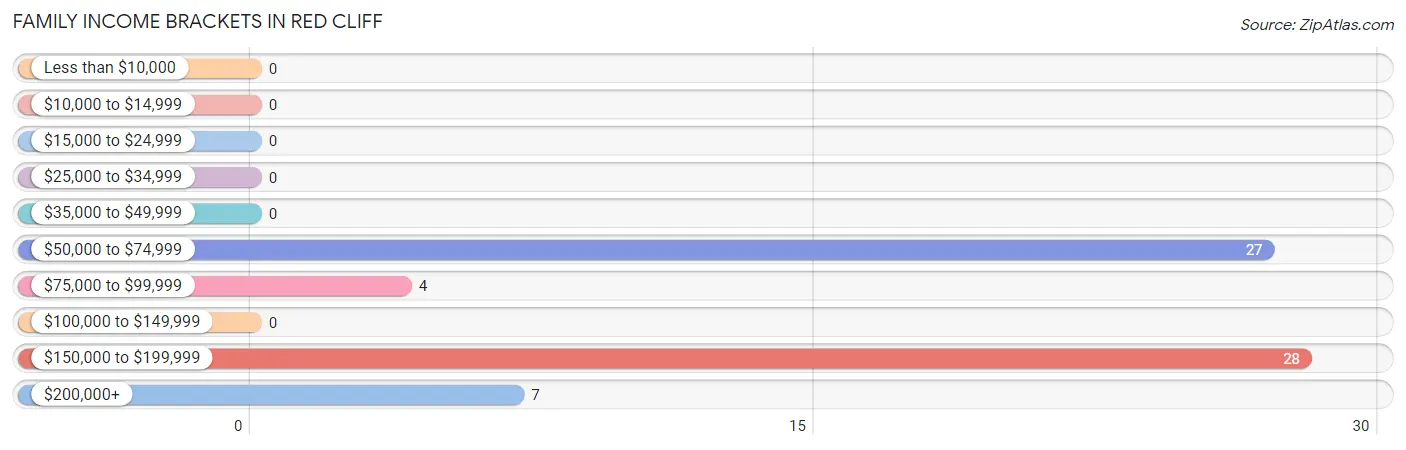
| Income Bracket | # Families | % Families |
| Less than $10,000 | 0 | 0.0% |
| $10,000 to $14,999 | 0 | 0.0% |
| $15,000 to $24,999 | 0 | 0.0% |
| $25,000 to $34,999 | 0 | 0.0% |
| $35,000 to $49,999 | 0 | 0.0% |
| $50,000 to $74,999 | 27 | 40.9% |
| $75,000 to $99,999 | 4 | 6.1% |
| $100,000 to $149,999 | 0 | 0.0% |
| $150,000 to $199,999 | 28 | 42.4% |
| $200,000+ | 7 | 10.6% |
Family Income by Famaliy Size in Red Cliff
| Income Bracket | # Families | Median Income |
| 2-Person Families | 27 (40.9%) | $0 |
| 3-Person Families | 28 (42.4%) | $0 |
| 4-Person Families | 8 (12.1%) | $0 |
| 5-Person Families | 0 (0.0%) | $0 |
| 6-Person Families | 3 (4.5%) | $0 |
| 7+ Person Families | 0 (0.0%) | $0 |
| Total | 66 (100.0%) | $150,833 |
Family Income by Number of Earners in Red Cliff
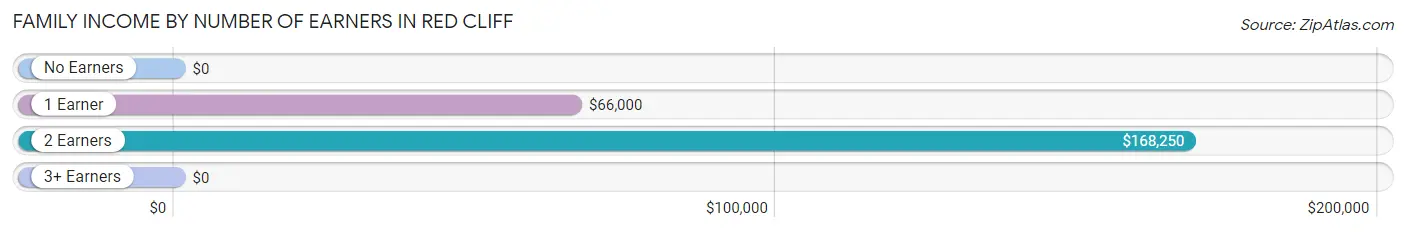
| Number of Earners | # Families | Median Income |
| No Earners | 4 (6.1%) | $0 |
| 1 Earner | 14 (21.2%) | $66,000 |
| 2 Earners | 44 (66.7%) | $168,250 |
| 3+ Earners | 4 (6.1%) | $0 |
| Total | 66 (100.0%) | $150,833 |
Household Income in Red Cliff
Household Income Brackets in Red Cliff
With 37 households falling in the category, the $50,000 to $74,999 income range is the most frequent in Red Cliff, accounting for 30.6% of all households.
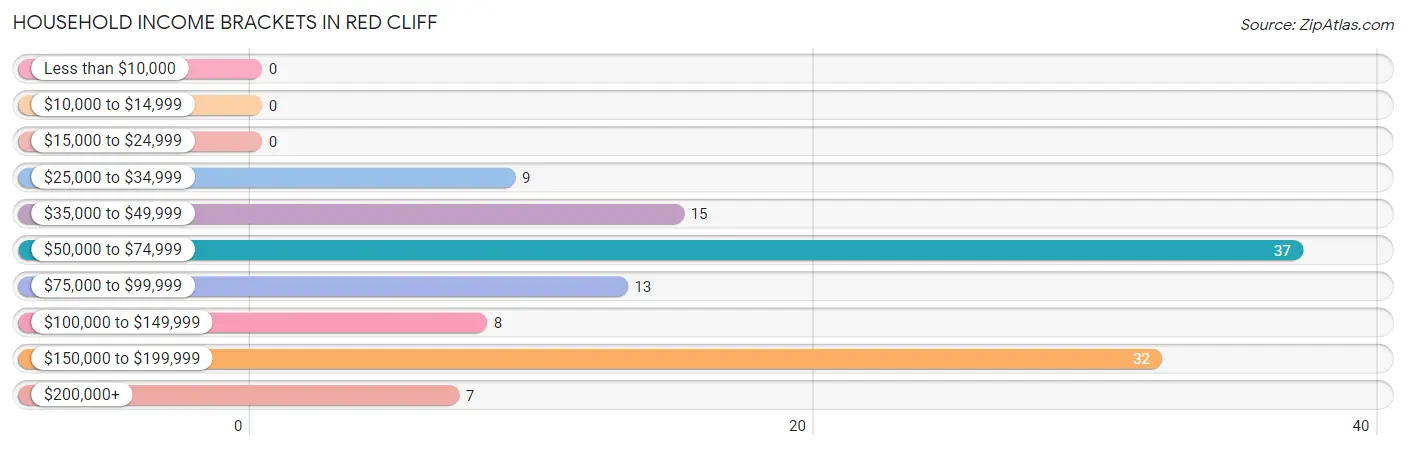
| Income Bracket | # Households | % Households |
| Less than $10,000 | 0 | 0.0% |
| $10,000 to $14,999 | 0 | 0.0% |
| $15,000 to $24,999 | 0 | 0.0% |
| $25,000 to $34,999 | 9 | 7.4% |
| $35,000 to $49,999 | 15 | 12.4% |
| $50,000 to $74,999 | 37 | 30.6% |
| $75,000 to $99,999 | 13 | 10.7% |
| $100,000 to $149,999 | 8 | 6.6% |
| $150,000 to $199,999 | 32 | 26.4% |
| $200,000+ | 7 | 5.8% |
Household Income by Householder Age in Red Cliff
The median household income in Red Cliff is $74,688, with the highest median household income of $148,000 found in the 25 to 44 years age bracket for the primary householder. A total of 42 households (34.7%) fall into this category.
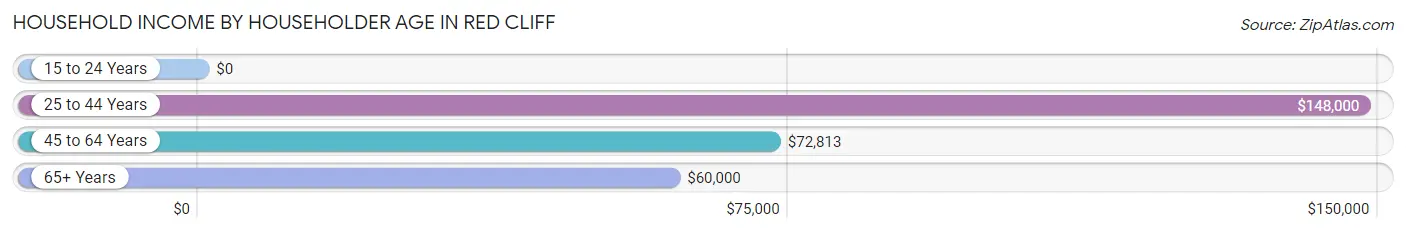
| Income Bracket | # Households | Median Income |
| 15 to 24 Years | 0 (0.0%) | $0 |
| 25 to 44 Years | 42 (34.7%) | $148,000 |
| 45 to 64 Years | 61 (50.4%) | $72,813 |
| 65+ Years | 18 (14.9%) | $60,000 |
| Total | 121 (100.0%) | $74,688 |
Poverty in Red Cliff
Income Below Poverty by Sex and Age in Red Cliff
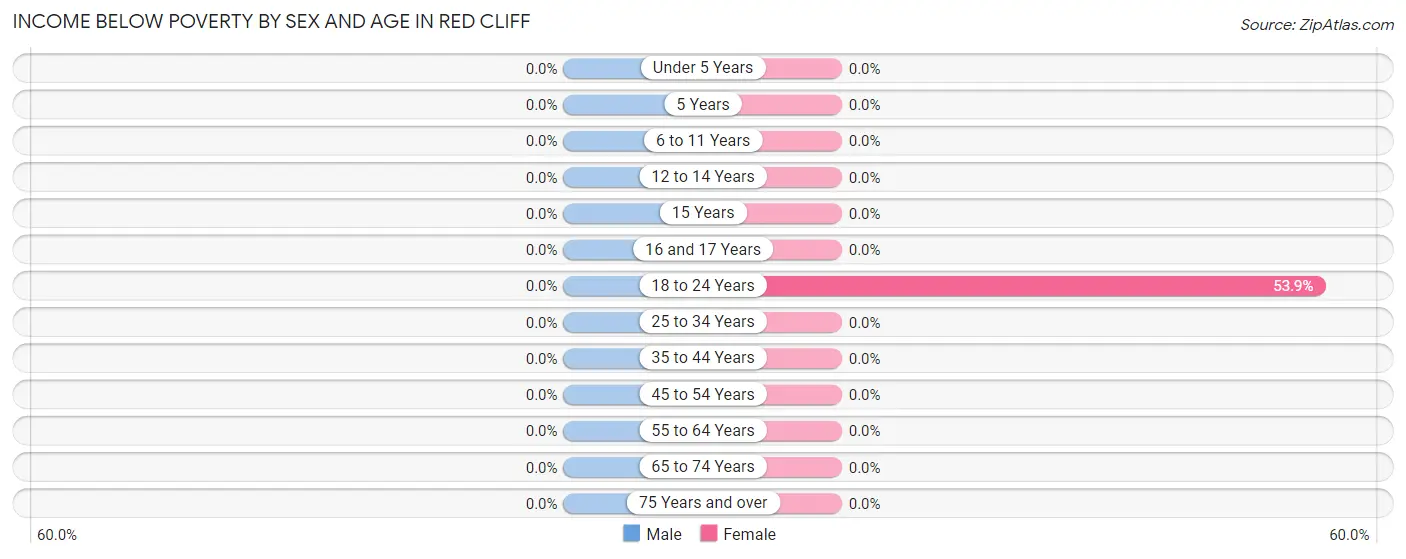
| Age Bracket | Male | Female |
| Under 5 Years | 0 (0.0%) | 0 (0.0%) |
| 5 Years | 0 (0.0%) | 0 (0.0%) |
| 6 to 11 Years | 0 (0.0%) | 0 (0.0%) |
| 12 to 14 Years | 0 (0.0%) | 0 (0.0%) |
| 15 Years | 0 (0.0%) | 0 (0.0%) |
| 16 and 17 Years | 0 (0.0%) | 0 (0.0%) |
| 18 to 24 Years | 0 (0.0%) | 7 (53.8%) |
| 25 to 34 Years | 0 (0.0%) | 0 (0.0%) |
| 35 to 44 Years | 0 (0.0%) | 0 (0.0%) |
| 45 to 54 Years | 0 (0.0%) | 0 (0.0%) |
| 55 to 64 Years | 0 (0.0%) | 0 (0.0%) |
| 65 to 74 Years | 0 (0.0%) | 0 (0.0%) |
| 75 Years and over | 0 (0.0%) | 0 (0.0%) |
| Total | 0 (0.0%) | 7 (5.3%) |
Income Above Poverty by Sex and Age in Red Cliff
According to the poverty statistics in Red Cliff, males aged under 5 years and females aged under 5 years are the age groups that are most secure financially, with 100.0% of males and 100.0% of females in these age groups living above the poverty line.
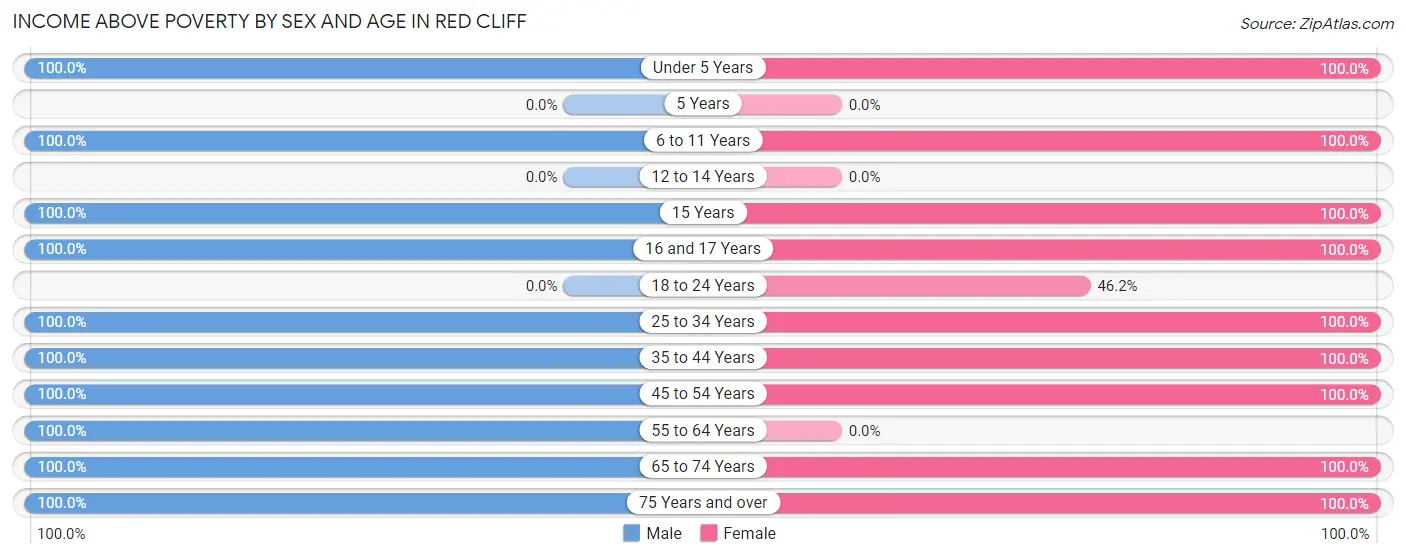
| Age Bracket | Male | Female |
| Under 5 Years | 17 (100.0%) | 6 (100.0%) |
| 5 Years | 0 (0.0%) | 0 (0.0%) |
| 6 to 11 Years | 19 (100.0%) | 4 (100.0%) |
| 12 to 14 Years | 0 (0.0%) | 0 (0.0%) |
| 15 Years | 7 (100.0%) | 7 (100.0%) |
| 16 and 17 Years | 3 (100.0%) | 3 (100.0%) |
| 18 to 24 Years | 0 (0.0%) | 6 (46.2%) |
| 25 to 34 Years | 16 (100.0%) | 19 (100.0%) |
| 35 to 44 Years | 22 (100.0%) | 22 (100.0%) |
| 45 to 54 Years | 40 (100.0%) | 36 (100.0%) |
| 55 to 64 Years | 18 (100.0%) | 0 (0.0%) |
| 65 to 74 Years | 13 (100.0%) | 9 (100.0%) |
| 75 Years and over | 4 (100.0%) | 14 (100.0%) |
| Total | 159 (100.0%) | 126 (94.7%) |
Income Below Poverty Among Married-Couple Families in Red Cliff
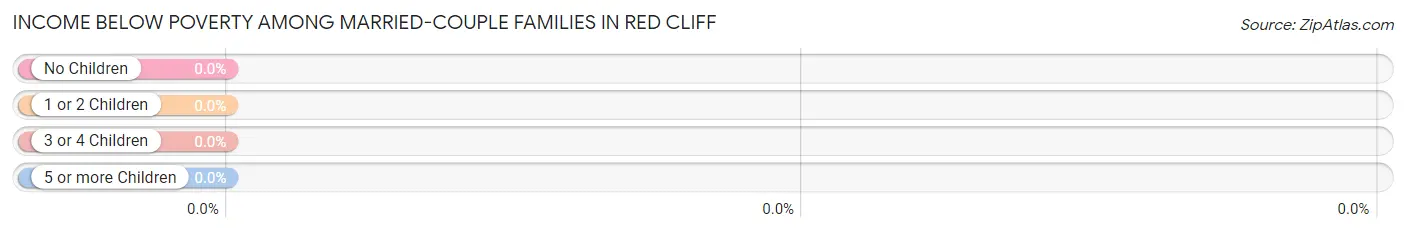
| Children | Above Poverty | Below Poverty |
| No Children | 18 (100.0%) | 0 (0.0%) |
| 1 or 2 Children | 27 (100.0%) | 0 (0.0%) |
| 3 or 4 Children | 3 (100.0%) | 0 (0.0%) |
| 5 or more Children | 0 (0.0%) | 0 (0.0%) |
| Total | 48 (100.0%) | 0 (0.0%) |
Income Below Poverty Among Single-Parent Households in Red Cliff
| Children | Single Father | Single Mother |
| No Children | 0 (0.0%) | 0 (0.0%) |
| 1 or 2 Children | 0 (0.0%) | 0 (0.0%) |
| 3 or 4 Children | 0 (0.0%) | 0 (0.0%) |
| 5 or more Children | 0 (0.0%) | 0 (0.0%) |
| Total | 0 (0.0%) | 0 (0.0%) |
Income Below Poverty Among Married-Couple vs Single-Parent Households in Red Cliff
| Children | Married-Couple Families | Single-Parent Households |
| No Children | 0 (0.0%) | 0 (0.0%) |
| 1 or 2 Children | 0 (0.0%) | 0 (0.0%) |
| 3 or 4 Children | 0 (0.0%) | 0 (0.0%) |
| 5 or more Children | 0 (0.0%) | 0 (0.0%) |
| Total | 0 (0.0%) | 0 (0.0%) |
Race in Red Cliff
The most populous races in Red Cliff are White / Caucasian (258 | 88.4%), Hispanic or Latino (75 | 25.7%), and Two or more Races (34 | 11.6%).
| Race | # Population | % Population |
| Asian | 0 | 0.0% |
| Black / African American | 0 | 0.0% |
| Hawaiian / Pacific | 0 | 0.0% |
| Hispanic or Latino | 75 | 25.7% |
| Native / Alaskan | 0 | 0.0% |
| White / Caucasian | 258 | 88.4% |
| Two or more Races | 34 | 11.6% |
| Some other Race | 0 | 0.0% |
| Total | 292 | 100.0% |
Ancestry in Red Cliff
The most populous ancestries reported in Red Cliff are Mexican (46 | 15.8%), European (33 | 11.3%), Norwegian (25 | 8.6%), Spaniard (20 | 6.9%), and Irish (17 | 5.8%), together accounting for 48.3% of all Red Cliff residents.
| Ancestry | # Population | % Population |
| Austrian | 12 | 4.1% |
| British | 14 | 4.8% |
| Danish | 4 | 1.4% |
| English | 12 | 4.1% |
| European | 33 | 11.3% |
| French | 6 | 2.1% |
| German | 9 | 3.1% |
| Hungarian | 5 | 1.7% |
| Irish | 17 | 5.8% |
| Italian | 2 | 0.7% |
| Mexican | 46 | 15.8% |
| Norwegian | 25 | 8.6% |
| Spaniard | 20 | 6.9% |
| Spanish | 9 | 3.1% | View All 14 Rows |
Immigrants in Red Cliff
The most numerous immigrant groups reported in Red Cliff came from Australia (7 | 2.4%), and Oceania (7 | 2.4%), together accounting for 4.8% of all Red Cliff residents.
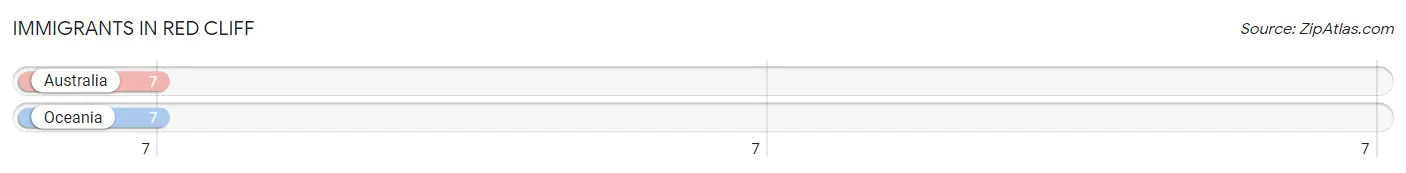
| Immigration Origin | # Population | % Population |
| Australia | 7 | 2.4% |
| Oceania | 7 | 2.4% | View All 2 Rows |
Sex and Age in Red Cliff
Sex and Age in Red Cliff
The most populous age groups in Red Cliff are 50 to 54 Years (23 | 14.5%) for men and 50 to 54 Years (22 | 16.5%) for women.
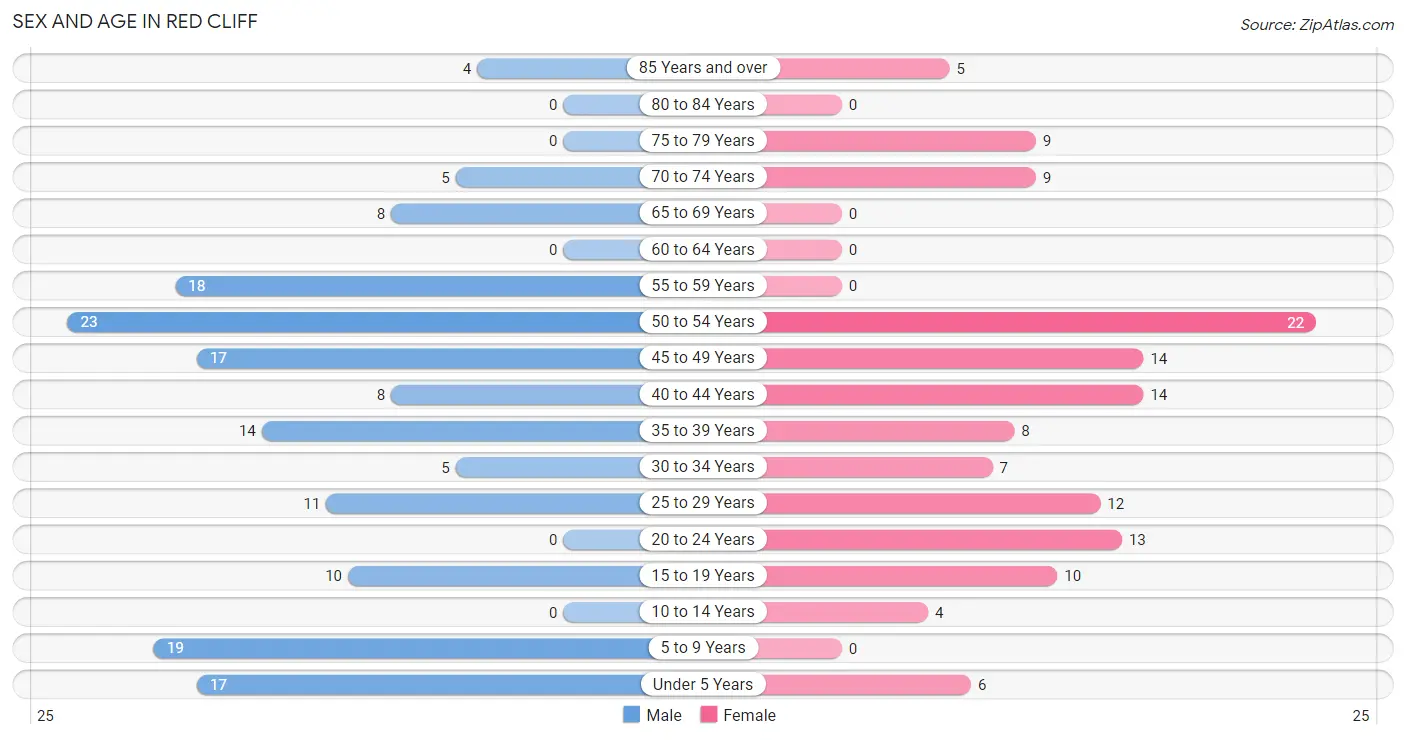
| Age Bracket | Male | Female |
| Under 5 Years | 17 (10.7%) | 6 (4.5%) |
| 5 to 9 Years | 19 (11.9%) | 0 (0.0%) |
| 10 to 14 Years | 0 (0.0%) | 4 (3.0%) |
| 15 to 19 Years | 10 (6.3%) | 10 (7.5%) |
| 20 to 24 Years | 0 (0.0%) | 13 (9.8%) |
| 25 to 29 Years | 11 (6.9%) | 12 (9.0%) |
| 30 to 34 Years | 5 (3.1%) | 7 (5.3%) |
| 35 to 39 Years | 14 (8.8%) | 8 (6.0%) |
| 40 to 44 Years | 8 (5.0%) | 14 (10.5%) |
| 45 to 49 Years | 17 (10.7%) | 14 (10.5%) |
| 50 to 54 Years | 23 (14.5%) | 22 (16.5%) |
| 55 to 59 Years | 18 (11.3%) | 0 (0.0%) |
| 60 to 64 Years | 0 (0.0%) | 0 (0.0%) |
| 65 to 69 Years | 8 (5.0%) | 0 (0.0%) |
| 70 to 74 Years | 5 (3.1%) | 9 (6.8%) |
| 75 to 79 Years | 0 (0.0%) | 9 (6.8%) |
| 80 to 84 Years | 0 (0.0%) | 0 (0.0%) |
| 85 Years and over | 4 (2.5%) | 5 (3.8%) |
| Total | 159 (100.0%) | 133 (100.0%) |
Families and Households in Red Cliff
Median Family Size in Red Cliff
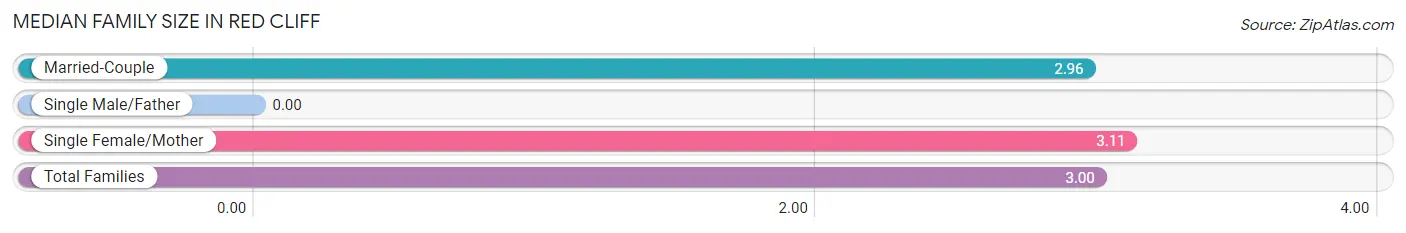
| Family Type | # Families | Family Size |
| Married-Couple | 48 (72.7%) | 2.96 |
| Single Male/Father | 0 (0.0%) | - |
| Single Female/Mother | 18 (27.3%) | 3.11 |
| Total Families | 66 (100.0%) | 3.00 |
Median Household Size in Red Cliff
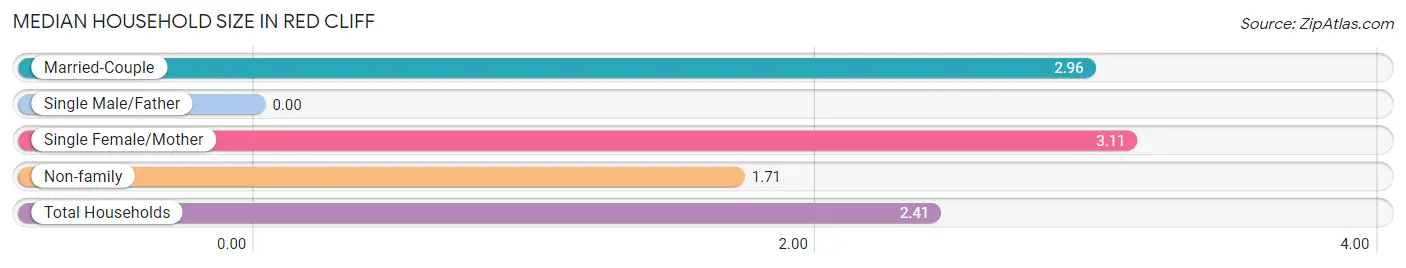
| Household Type | # Households | Household Size |
| Married-Couple | 48 (39.7%) | 2.96 |
| Single Male/Father | 0 (0.0%) | - |
| Single Female/Mother | 18 (14.9%) | 3.11 |
| Non-family | 55 (45.5%) | 1.71 |
| Total Households | 121 (100.0%) | 2.41 |
Household Size by Marriage Status in Red Cliff
Out of a total of 121 households in Red Cliff, 66 (54.5%) are family households, while 55 (45.5%) are nonfamily households. The most numerous type of family households are 3-person households, comprising 28, and the most common type of nonfamily households are 1-person households, comprising 39.
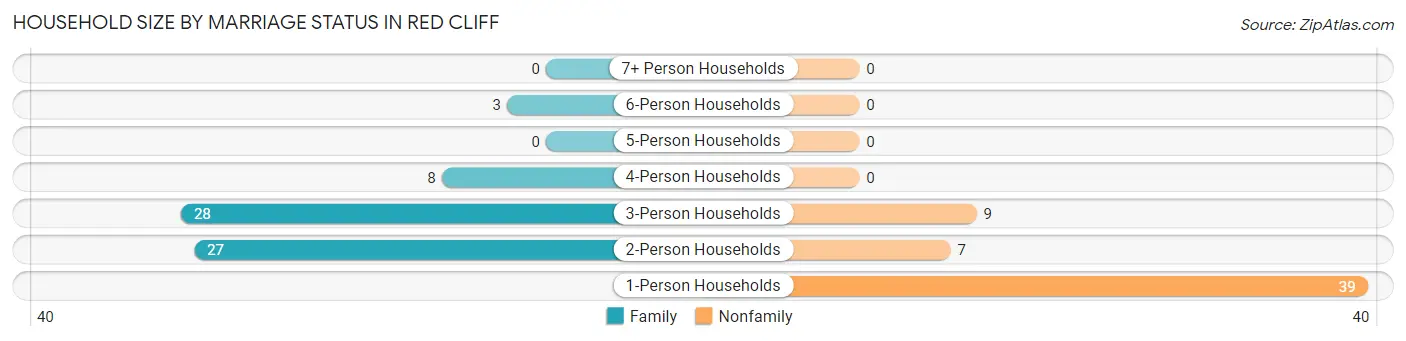
| Household Size | Family Households | Nonfamily Households |
| 1-Person Households | - | 39 (32.2%) |
| 2-Person Households | 27 (22.3%) | 7 (5.8%) |
| 3-Person Households | 28 (23.1%) | 9 (7.4%) |
| 4-Person Households | 8 (6.6%) | 0 (0.0%) |
| 5-Person Households | 0 (0.0%) | 0 (0.0%) |
| 6-Person Households | 3 (2.5%) | 0 (0.0%) |
| 7+ Person Households | 0 (0.0%) | 0 (0.0%) |
| Total | 66 (54.5%) | 55 (45.5%) |
Female Fertility in Red Cliff
Fertility by Age in Red Cliff
Average fertility rate in Red Cliff is 120.0 births per 1,000 women. Women in the age bracket of 35 to 50 years have the highest fertility rate with 244.0 births per 1,000 women. Women in the age bracket of 35 to 50 years acount for 100.0% of all women with births.
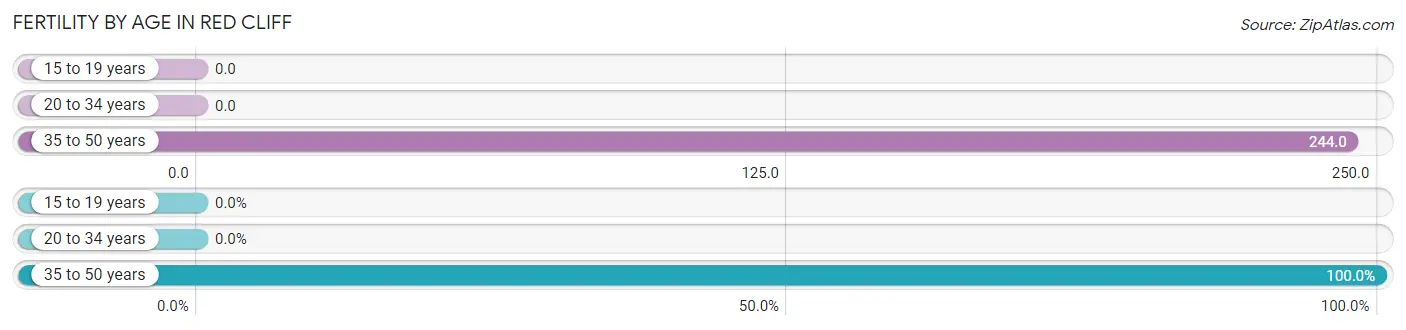
| Age Bracket | Women with Births | Births / 1,000 Women |
| 15 to 19 years | 0 (0.0%) | 0.0 |
| 20 to 34 years | 0 (0.0%) | 0.0 |
| 35 to 50 years | 10 (100.0%) | 244.0 |
| Total | 10 (100.0%) | 120.0 |
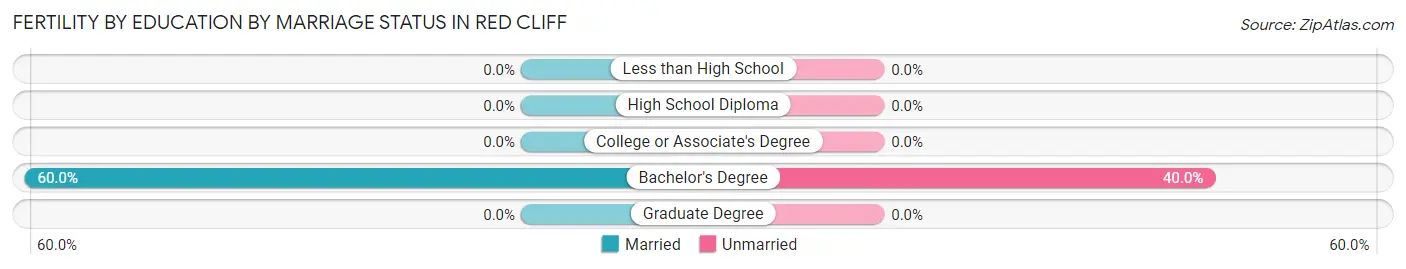
Fertility by Age by Marriage Status in Red Cliff
60.0% of women with births (10) in Red Cliff are married. The highest percentage of unmarried women with births falls into 35 to 50 years age bracket with 40.0% of them unmarried at the time of birth, while the lowest percentage of unmarried women with births belong to 35 to 50 years age bracket with 40.0% of them unmarried.
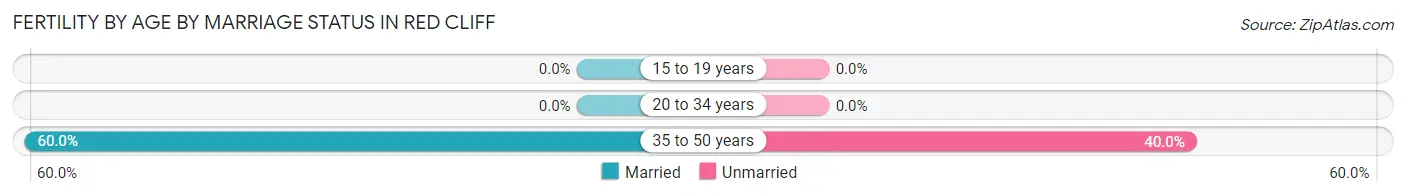
| Age Bracket | Married | Unmarried |
| 15 to 19 years | 0 (0.0%) | 0 (0.0%) |
| 20 to 34 years | 0 (0.0%) | 0 (0.0%) |
| 35 to 50 years | 6 (60.0%) | 4 (40.0%) |
| Total | 6 (60.0%) | 4 (40.0%) |
Fertility by Education in Red Cliff
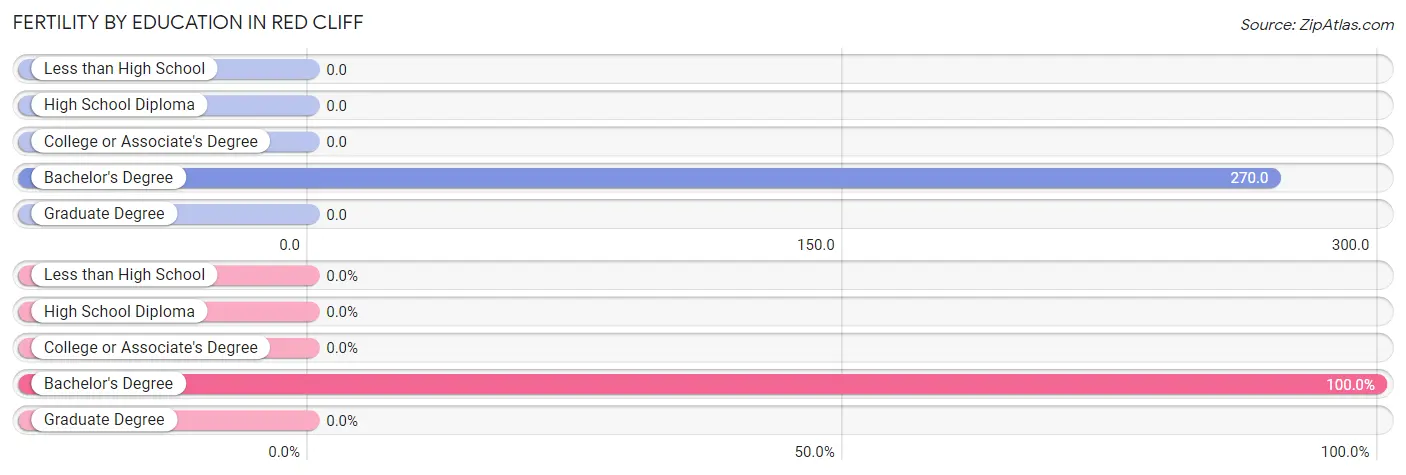
| Educational Attainment | Women with Births | Births / 1,000 Women |
| Less than High School | 0 (0.0%) | 0.0 |
| High School Diploma | 0 (0.0%) | 0.0 |
| College or Associate's Degree | 0 (0.0%) | 0.0 |
| Bachelor's Degree | 10 (100.0%) | 270.0 |
| Graduate Degree | 0 (0.0%) | 0.0 |
| Total | 10 (100.0%) | 120.0 |
Fertility by Education by Marriage Status in Red Cliff
40.0% of women with births in Red Cliff are unmarried. Women with the educational attainment of bachelor's degree are most likely to be married with 60.0% of them married at childbirth, while women with the educational attainment of bachelor's degree are least likely to be married with 40.0% of them unmarried at childbirth.
| Educational Attainment | Married | Unmarried |
| Less than High School | 0 (0.0%) | 0 (0.0%) |
| High School Diploma | 0 (0.0%) | 0 (0.0%) |
| College or Associate's Degree | 0 (0.0%) | 0 (0.0%) |
| Bachelor's Degree | 6 (60.0%) | 4 (40.0%) |
| Graduate Degree | 0 (0.0%) | 0 (0.0%) |
| Total | 6 (60.0%) | 4 (40.0%) |
Employment Characteristics in Red Cliff
Employment by Class of Employer in Red Cliff
Among the 179 employed individuals in Red Cliff, private company employees (114 | 63.7%), self-employed (incorporated) (29 | 16.2%), and not-for-profit organizations (12 | 6.7%) make up the most common classes of employment.
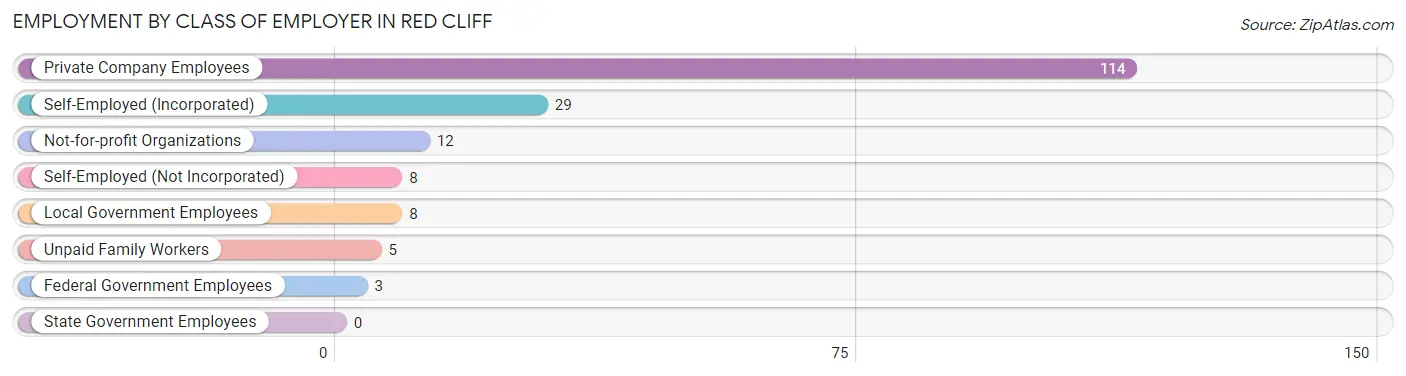
| Employer Class | # Employees | % Employees |
| Private Company Employees | 114 | 63.7% |
| Self-Employed (Incorporated) | 29 | 16.2% |
| Self-Employed (Not Incorporated) | 8 | 4.5% |
| Not-for-profit Organizations | 12 | 6.7% |
| Local Government Employees | 8 | 4.5% |
| State Government Employees | 0 | 0.0% |
| Federal Government Employees | 3 | 1.7% |
| Unpaid Family Workers | 5 | 2.8% |
| Total | 179 | 100.0% |
Employment Status by Age in Red Cliff
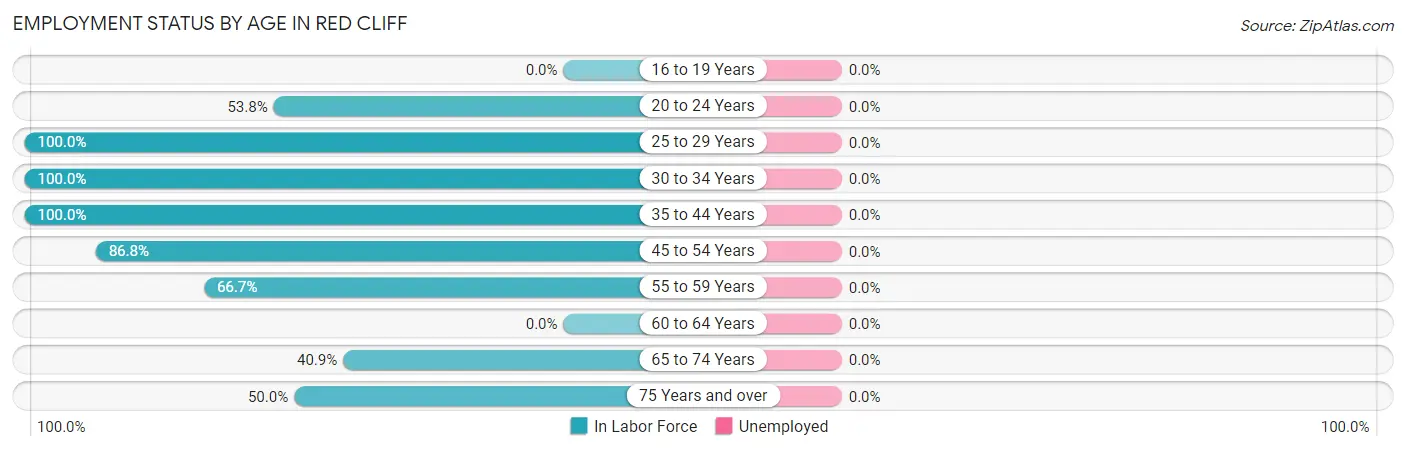
| Age Bracket | In Labor Force | Unemployed |
| 16 to 19 Years | 0 (0.0%) | 0 (0.0%) |
| 20 to 24 Years | 7 (53.8%) | 0 (0.0%) |
| 25 to 29 Years | 23 (100.0%) | 0 (0.0%) |
| 30 to 34 Years | 12 (100.0%) | 0 (0.0%) |
| 35 to 44 Years | 44 (100.0%) | 0 (0.0%) |
| 45 to 54 Years | 66 (86.8%) | 0 (0.0%) |
| 55 to 59 Years | 12 (66.7%) | 0 (0.0%) |
| 60 to 64 Years | 0 (0.0%) | 0 (0.0%) |
| 65 to 74 Years | 9 (40.9%) | 0 (0.0%) |
| 75 Years and over | 9 (50.0%) | 0 (0.0%) |
| Total | 182 (78.4%) | 0 (0.0%) |
Employment Status by Educational Attainment in Red Cliff
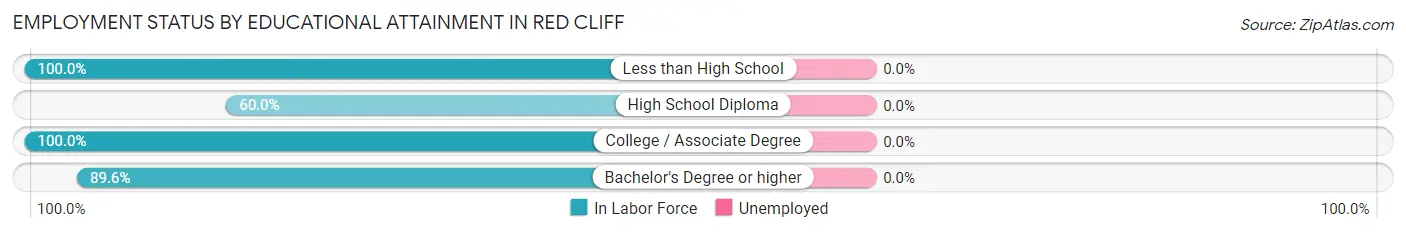
| Educational Attainment | In Labor Force | Unemployed |
| Less than High School | 3 (100.0%) | 0 (0.0%) |
| High School Diploma | 9 (60.0%) | 0 (0.0%) |
| College / Associate Degree | 59 (100.0%) | 0 (0.0%) |
| Bachelor's Degree or higher | 86 (89.6%) | 0 (0.0%) |
| Total | 157 (90.8%) | 0 (0.0%) |
Employment Occupations by Sex in Red Cliff
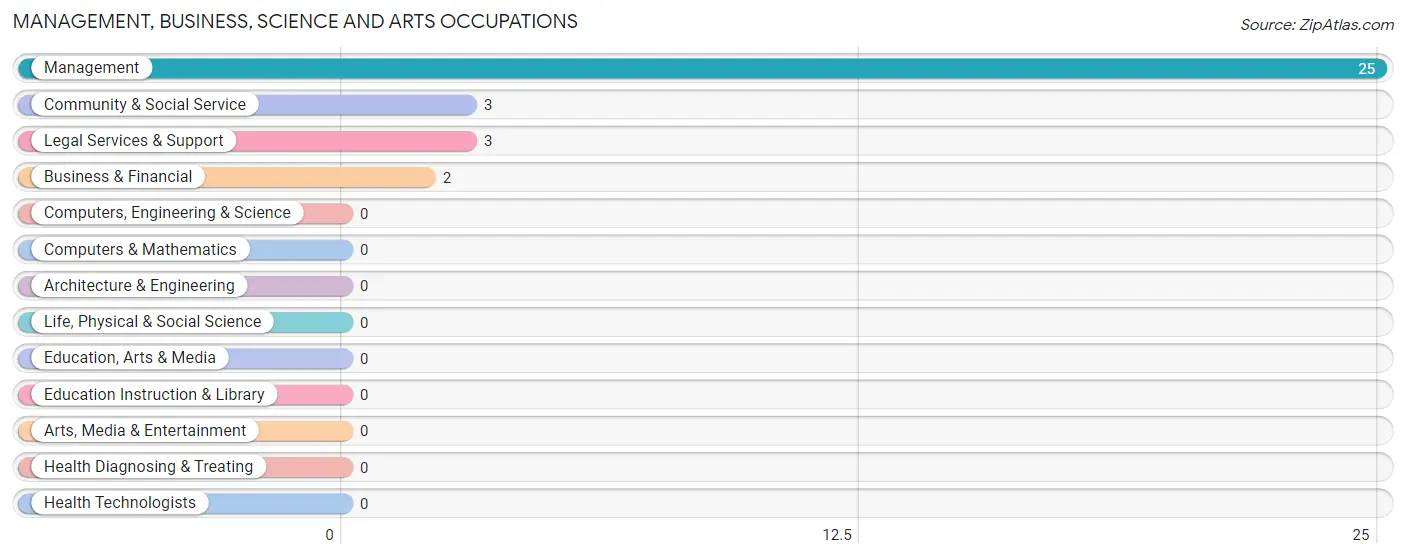
Management, Business, Science and Arts Occupations
The most common Management, Business, Science and Arts occupations in Red Cliff are Management (25 | 13.7%), Community & Social Service (3 | 1.7%), Legal Services & Support (3 | 1.7%), and Business & Financial (2 | 1.1%).
Management, Business, Science and Arts Occupations by Sex
Within the Management, Business, Science and Arts occupations in Red Cliff, the most male-oriented occupations are Community & Social Service (100.0%), and Legal Services & Support (100.0%), while the most female-oriented occupations are Management (100.0%), and Business & Financial (100.0%).
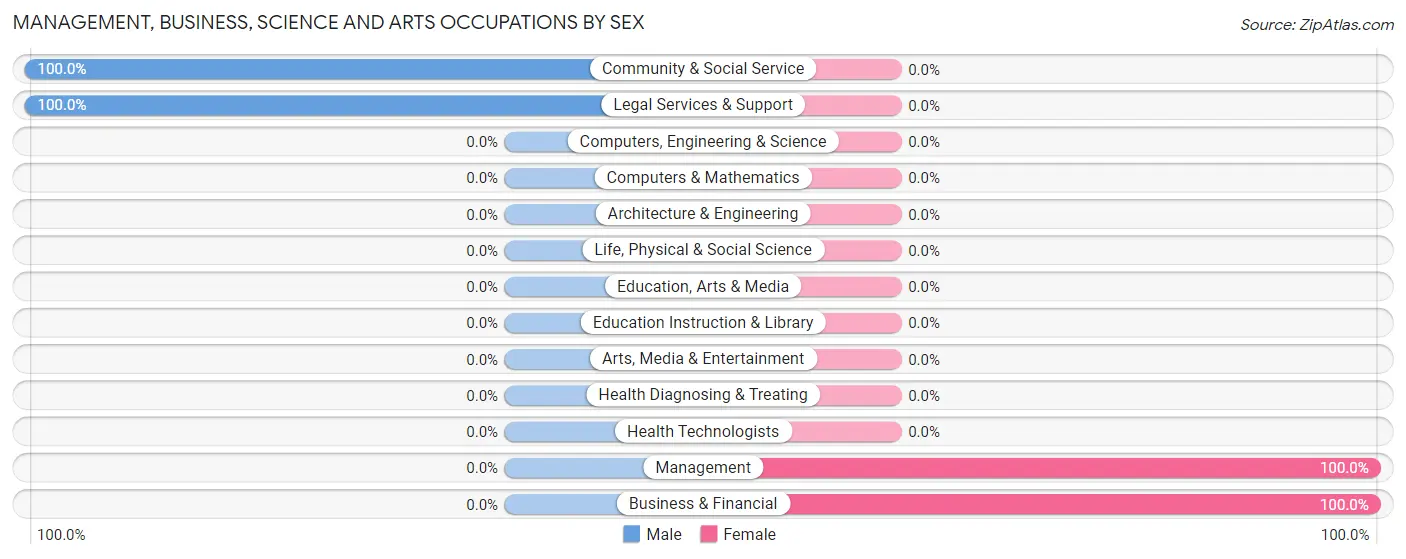
| Occupation | Male | Female |
| Management | 0 (0.0%) | 25 (100.0%) |
| Business & Financial | 0 (0.0%) | 2 (100.0%) |
| Computers, Engineering & Science | 0 (0.0%) | 0 (0.0%) |
| Computers & Mathematics | 0 (0.0%) | 0 (0.0%) |
| Architecture & Engineering | 0 (0.0%) | 0 (0.0%) |
| Life, Physical & Social Science | 0 (0.0%) | 0 (0.0%) |
| Community & Social Service | 3 (100.0%) | 0 (0.0%) |
| Education, Arts & Media | 0 (0.0%) | 0 (0.0%) |
| Legal Services & Support | 3 (100.0%) | 0 (0.0%) |
| Education Instruction & Library | 0 (0.0%) | 0 (0.0%) |
| Arts, Media & Entertainment | 0 (0.0%) | 0 (0.0%) |
| Health Diagnosing & Treating | 0 (0.0%) | 0 (0.0%) |
| Health Technologists | 0 (0.0%) | 0 (0.0%) |
| Total (Category) | 3 (10.0%) | 27 (90.0%) |
| Total (Overall) | 80 (44.0%) | 102 (56.0%) |
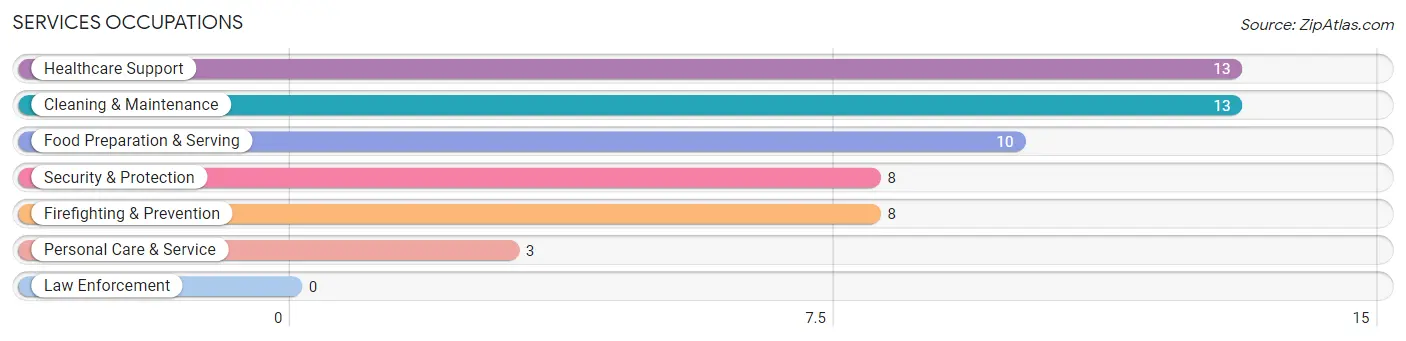
Services Occupations
The most common Services occupations in Red Cliff are Healthcare Support (13 | 7.1%), Cleaning & Maintenance (13 | 7.1%), Food Preparation & Serving (10 | 5.5%), Security & Protection (8 | 4.4%), and Firefighting & Prevention (8 | 4.4%).
Services Occupations by Sex
Within the Services occupations in Red Cliff, the most male-oriented occupations are Security & Protection (100.0%), Firefighting & Prevention (100.0%), and Personal Care & Service (100.0%), while the most female-oriented occupations are Food Preparation & Serving (100.0%), Cleaning & Maintenance (100.0%), and Healthcare Support (61.5%).
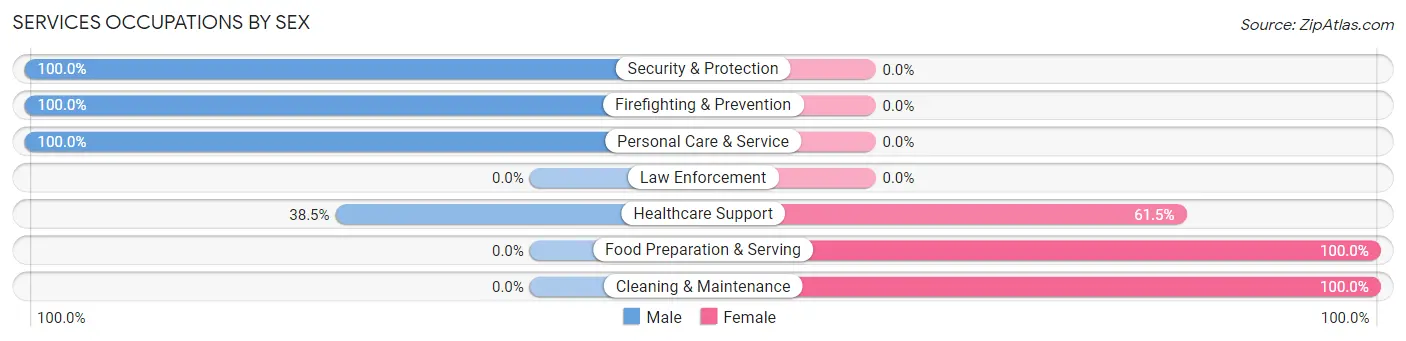
| Occupation | Male | Female |
| Healthcare Support | 5 (38.5%) | 8 (61.5%) |
| Security & Protection | 8 (100.0%) | 0 (0.0%) |
| Firefighting & Prevention | 8 (100.0%) | 0 (0.0%) |
| Law Enforcement | 0 (0.0%) | 0 (0.0%) |
| Food Preparation & Serving | 0 (0.0%) | 10 (100.0%) |
| Cleaning & Maintenance | 0 (0.0%) | 13 (100.0%) |
| Personal Care & Service | 3 (100.0%) | 0 (0.0%) |
| Total (Category) | 16 (34.0%) | 31 (66.0%) |
| Total (Overall) | 80 (44.0%) | 102 (56.0%) |
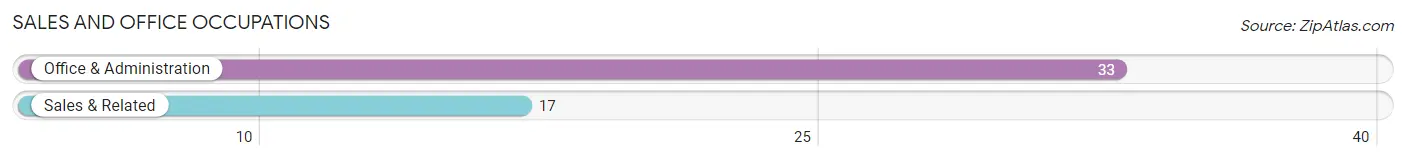
Sales and Office Occupations
The most common Sales and Office occupations in Red Cliff are Office & Administration (33 | 18.1%), and Sales & Related (17 | 9.3%).
Sales and Office Occupations by Sex
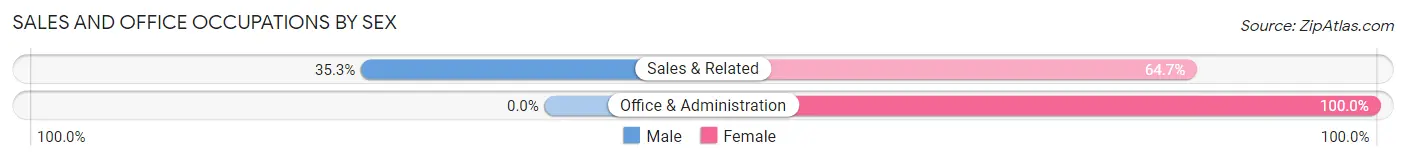
| Occupation | Male | Female |
| Sales & Related | 6 (35.3%) | 11 (64.7%) |
| Office & Administration | 0 (0.0%) | 33 (100.0%) |
| Total (Category) | 6 (12.0%) | 44 (88.0%) |
| Total (Overall) | 80 (44.0%) | 102 (56.0%) |
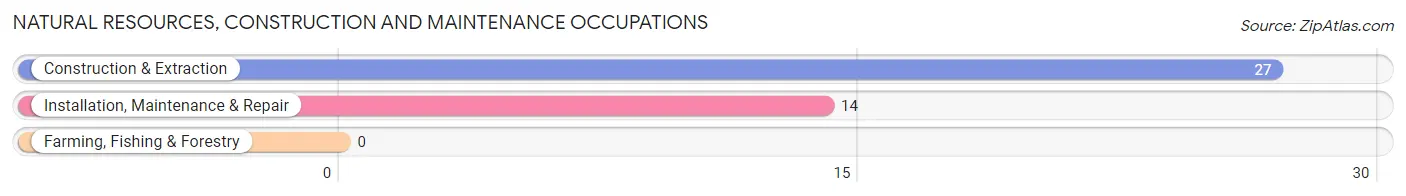
Natural Resources, Construction and Maintenance Occupations
The most common Natural Resources, Construction and Maintenance occupations in Red Cliff are Construction & Extraction (27 | 14.8%), and Installation, Maintenance & Repair (14 | 7.7%).
Natural Resources, Construction and Maintenance Occupations by Sex
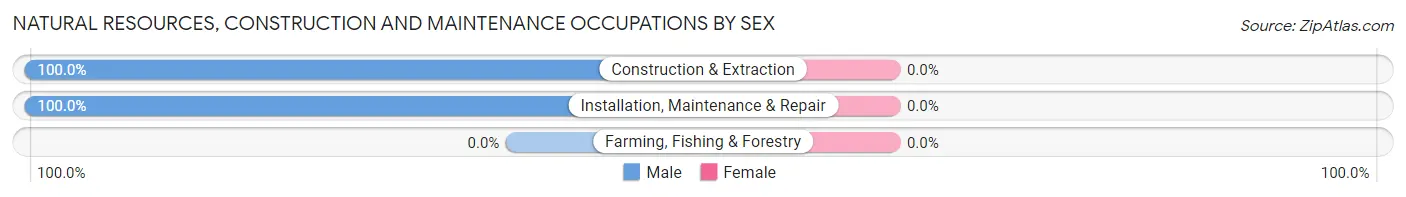
| Occupation | Male | Female |
| Farming, Fishing & Forestry | 0 (0.0%) | 0 (0.0%) |
| Construction & Extraction | 27 (100.0%) | 0 (0.0%) |
| Installation, Maintenance & Repair | 14 (100.0%) | 0 (0.0%) |
| Total (Category) | 41 (100.0%) | 0 (0.0%) |
| Total (Overall) | 80 (44.0%) | 102 (56.0%) |
Production, Transportation and Moving Occupations
The most common Production, Transportation and Moving occupations in Red Cliff are Production (10 | 5.5%), and Material Moving (4 | 2.2%).
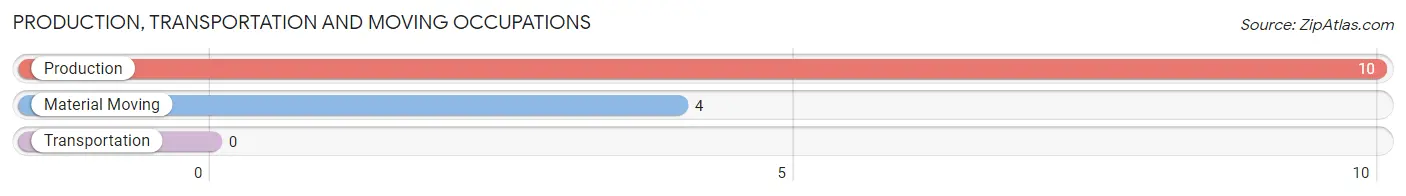
Production, Transportation and Moving Occupations by Sex
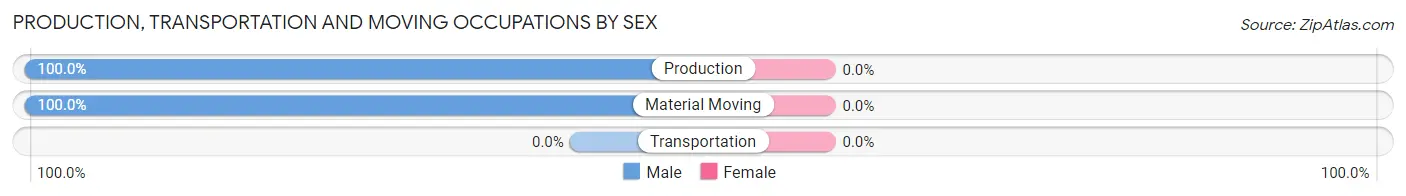
| Occupation | Male | Female |
| Production | 10 (100.0%) | 0 (0.0%) |
| Transportation | 0 (0.0%) | 0 (0.0%) |
| Material Moving | 4 (100.0%) | 0 (0.0%) |
| Total (Category) | 14 (100.0%) | 0 (0.0%) |
| Total (Overall) | 80 (44.0%) | 102 (56.0%) |
Employment Industries by Sex in Red Cliff
Employment Industries in Red Cliff
The major employment industries in Red Cliff include Accommodation & Food Services (35 | 19.2%), Arts, Entertainment & Recreation (34 | 18.7%), Retail Trade (22 | 12.1%), Construction (21 | 11.5%), and Health Care & Social Assistance (19 | 10.4%).
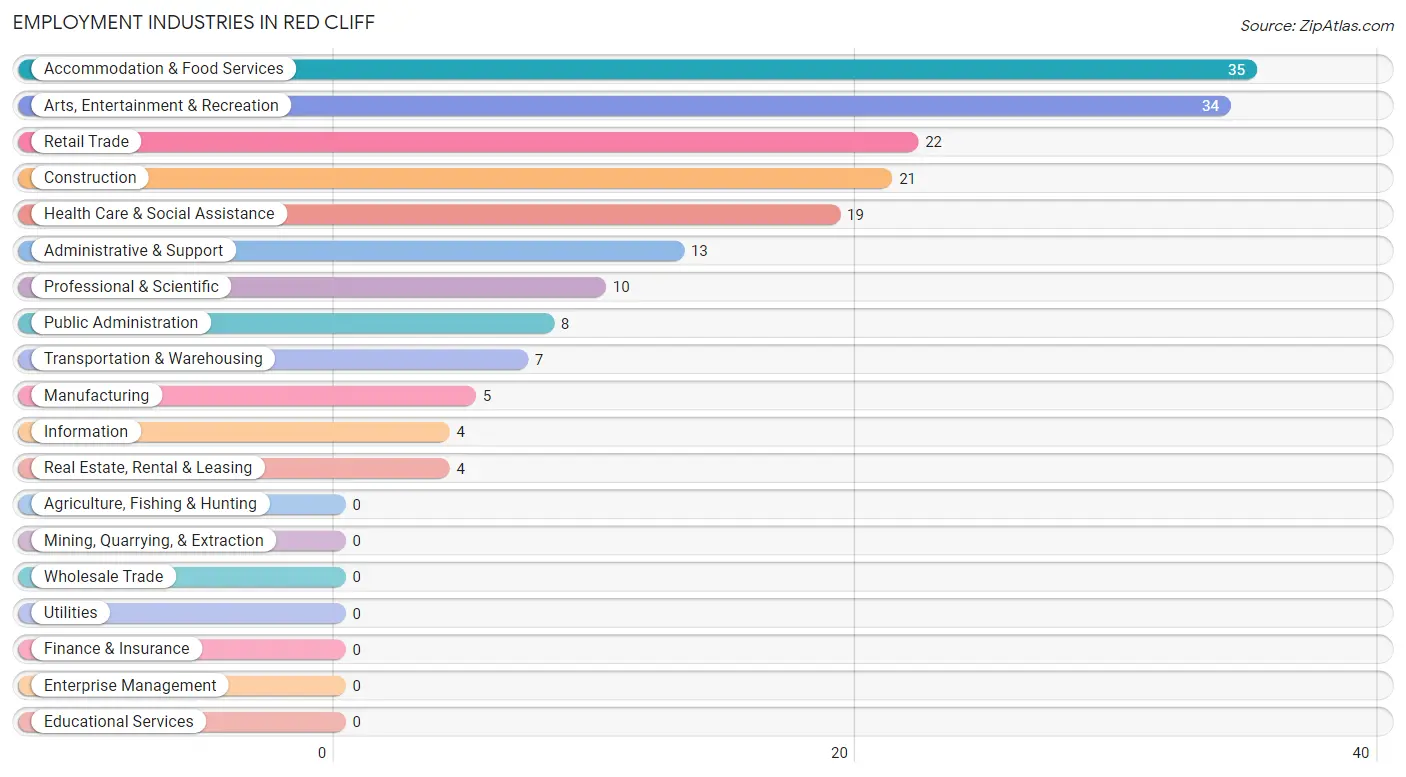
Employment Industries by Sex in Red Cliff
The Red Cliff industries that see more men than women are Construction (100.0%), Manufacturing (100.0%), and Information (100.0%), whereas the industries that tend to have a higher number of women are Real Estate, Rental & Leasing (100.0%), Administrative & Support (100.0%), and Accommodation & Food Services (85.7%).
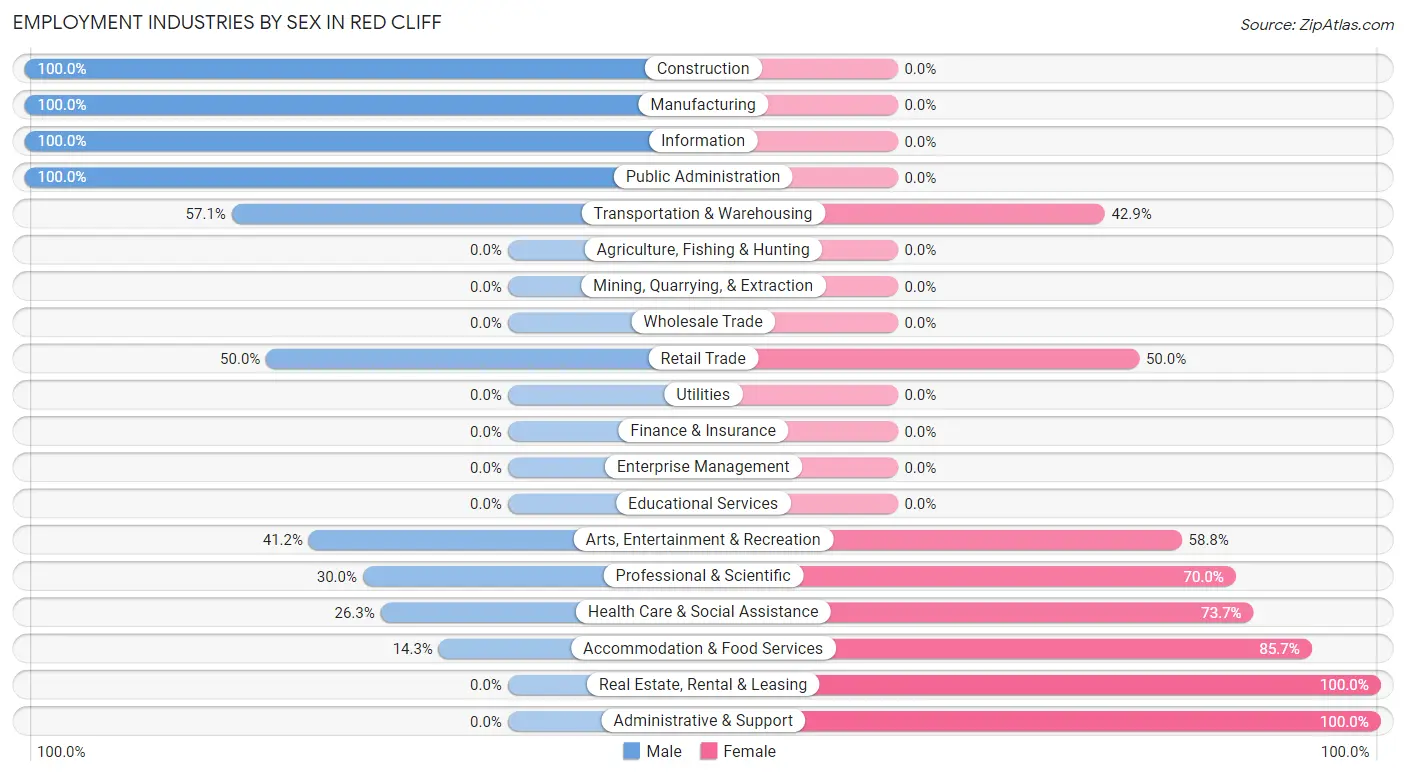
| Industry | Male | Female |
| Agriculture, Fishing & Hunting | 0 (0.0%) | 0 (0.0%) |
| Mining, Quarrying, & Extraction | 0 (0.0%) | 0 (0.0%) |
| Construction | 21 (100.0%) | 0 (0.0%) |
| Manufacturing | 5 (100.0%) | 0 (0.0%) |
| Wholesale Trade | 0 (0.0%) | 0 (0.0%) |
| Retail Trade | 11 (50.0%) | 11 (50.0%) |
| Transportation & Warehousing | 4 (57.1%) | 3 (42.9%) |
| Utilities | 0 (0.0%) | 0 (0.0%) |
| Information | 4 (100.0%) | 0 (0.0%) |
| Finance & Insurance | 0 (0.0%) | 0 (0.0%) |
| Real Estate, Rental & Leasing | 0 (0.0%) | 4 (100.0%) |
| Professional & Scientific | 3 (30.0%) | 7 (70.0%) |
| Enterprise Management | 0 (0.0%) | 0 (0.0%) |
| Administrative & Support | 0 (0.0%) | 13 (100.0%) |
| Educational Services | 0 (0.0%) | 0 (0.0%) |
| Health Care & Social Assistance | 5 (26.3%) | 14 (73.7%) |
| Arts, Entertainment & Recreation | 14 (41.2%) | 20 (58.8%) |
| Accommodation & Food Services | 5 (14.3%) | 30 (85.7%) |
| Public Administration | 8 (100.0%) | 0 (0.0%) |
| Total | 80 (44.0%) | 102 (56.0%) |
Education in Red Cliff
School Enrollment in Red Cliff
The most common levels of schooling among the 55 students in Red Cliff are high school (20 | 36.4%), kindergarten (12 | 21.8%), and elementary school (7 | 12.7%).
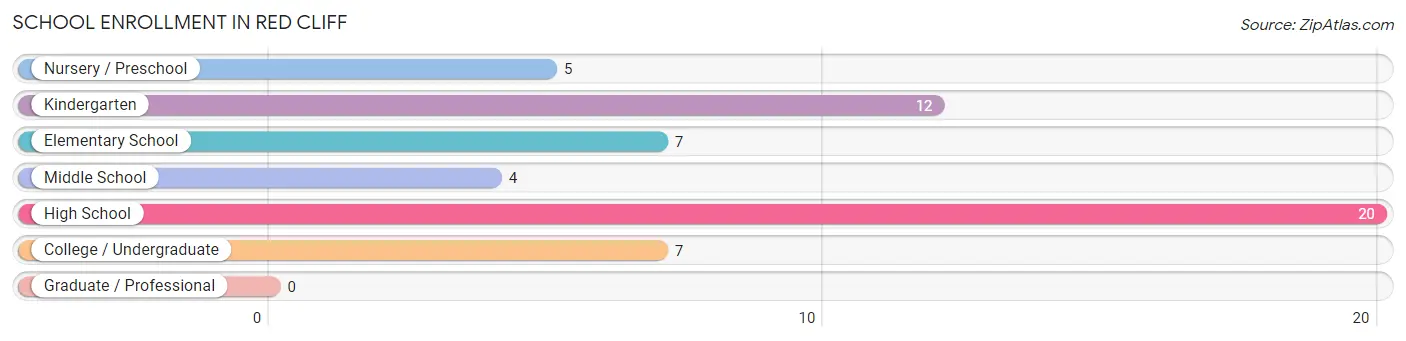
| School Level | # Students | % Students |
| Nursery / Preschool | 5 | 9.1% |
| Kindergarten | 12 | 21.8% |
| Elementary School | 7 | 12.7% |
| Middle School | 4 | 7.3% |
| High School | 20 | 36.4% |
| College / Undergraduate | 7 | 12.7% |
| Graduate / Professional | 0 | 0.0% |
| Total | 55 | 100.0% |
School Enrollment by Age by Funding Source in Red Cliff
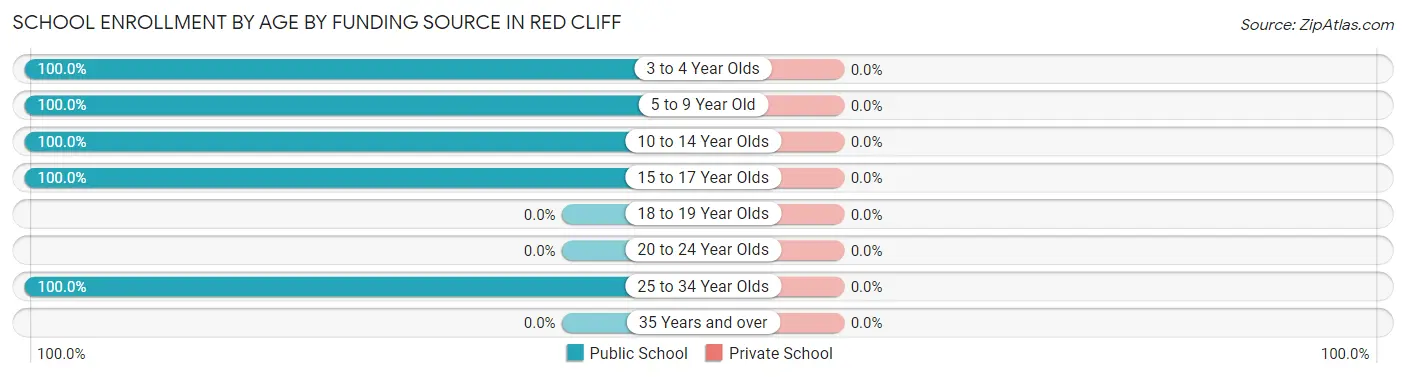
| Age Bracket | Public School | Private School |
| 3 to 4 Year Olds | 5 (100.0%) | 0 (0.0%) |
| 5 to 9 Year Old | 19 (100.0%) | 0 (0.0%) |
| 10 to 14 Year Olds | 4 (100.0%) | 0 (0.0%) |
| 15 to 17 Year Olds | 20 (100.0%) | 0 (0.0%) |
| 18 to 19 Year Olds | 0 (0.0%) | 0 (0.0%) |
| 20 to 24 Year Olds | 0 (0.0%) | 0 (0.0%) |
| 25 to 34 Year Olds | 7 (100.0%) | 0 (0.0%) |
| 35 Years and over | 0 (0.0%) | 0 (0.0%) |
| Total | 55 (100.0%) | 0 (0.0%) |
Educational Attainment by Field of Study in Red Cliff
Business (71 | 70.3%), visual & performing arts (8 | 7.9%), arts & humanities (8 | 7.9%), social sciences (5 | 5.0%), and engineering (5 | 5.0%) are the most common fields of study among 101 individuals in Red Cliff who have obtained a bachelor's degree or higher.
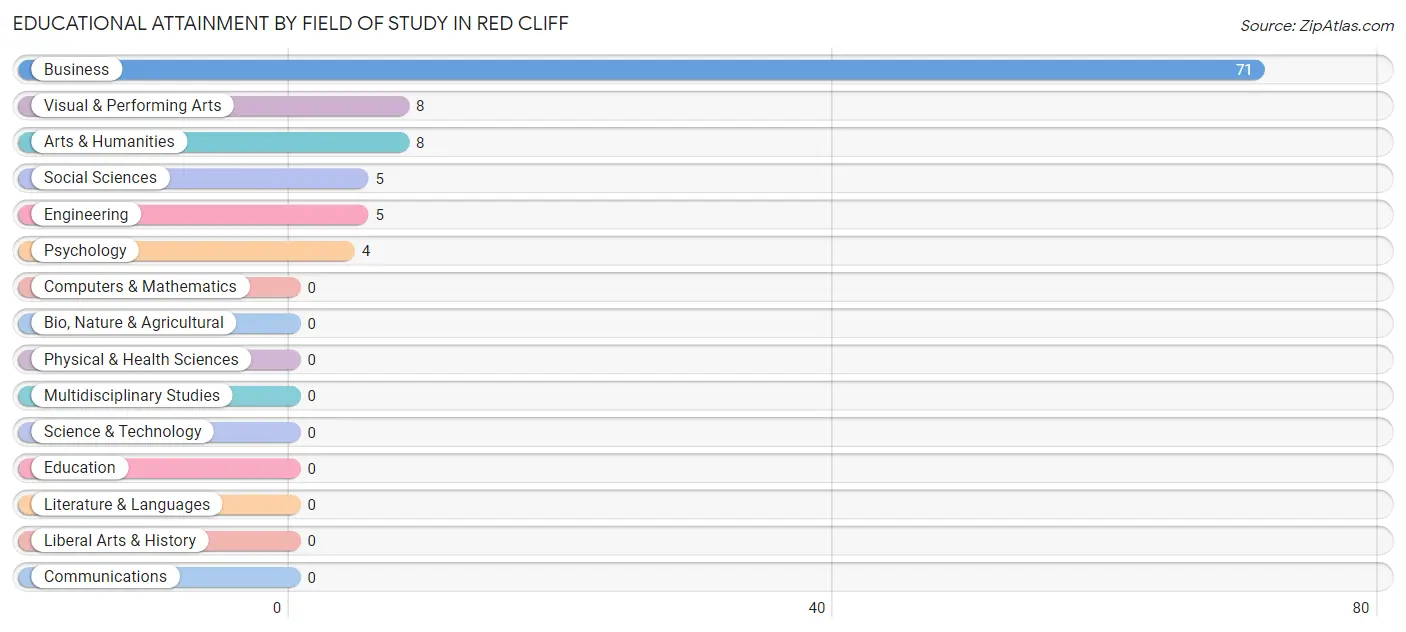
| Field of Study | # Graduates | % Graduates |
| Computers & Mathematics | 0 | 0.0% |
| Bio, Nature & Agricultural | 0 | 0.0% |
| Physical & Health Sciences | 0 | 0.0% |
| Psychology | 4 | 4.0% |
| Social Sciences | 5 | 5.0% |
| Engineering | 5 | 5.0% |
| Multidisciplinary Studies | 0 | 0.0% |
| Science & Technology | 0 | 0.0% |
| Business | 71 | 70.3% |
| Education | 0 | 0.0% |
| Literature & Languages | 0 | 0.0% |
| Liberal Arts & History | 0 | 0.0% |
| Visual & Performing Arts | 8 | 7.9% |
| Communications | 0 | 0.0% |
| Arts & Humanities | 8 | 7.9% |
| Total | 101 | 100.0% |
Transportation & Commute in Red Cliff
Vehicle Availability by Sex in Red Cliff
The most prevalent vehicle ownership categories in Red Cliff are males with 3 vehicles (42, accounting for 54.5%) and females with 3 vehicles (43, making up 41.2%).

| Vehicles Available | Male | Female |
| No Vehicle | 0 (0.0%) | 0 (0.0%) |
| 1 Vehicle | 0 (0.0%) | 14 (13.7%) |
| 2 Vehicles | 35 (45.5%) | 32 (31.4%) |
| 3 Vehicles | 42 (54.5%) | 43 (42.2%) |
| 4 Vehicles | 0 (0.0%) | 13 (12.8%) |
| 5 or more Vehicles | 0 (0.0%) | 0 (0.0%) |
| Total | 77 (100.0%) | 102 (100.0%) |
Commute Time in Red Cliff
The most frequently occuring commute durations in Red Cliff are 30 to 34 minutes (66 commuters, 36.9%), 15 to 19 minutes (33 commuters, 18.4%), and 25 to 29 minutes (28 commuters, 15.6%).
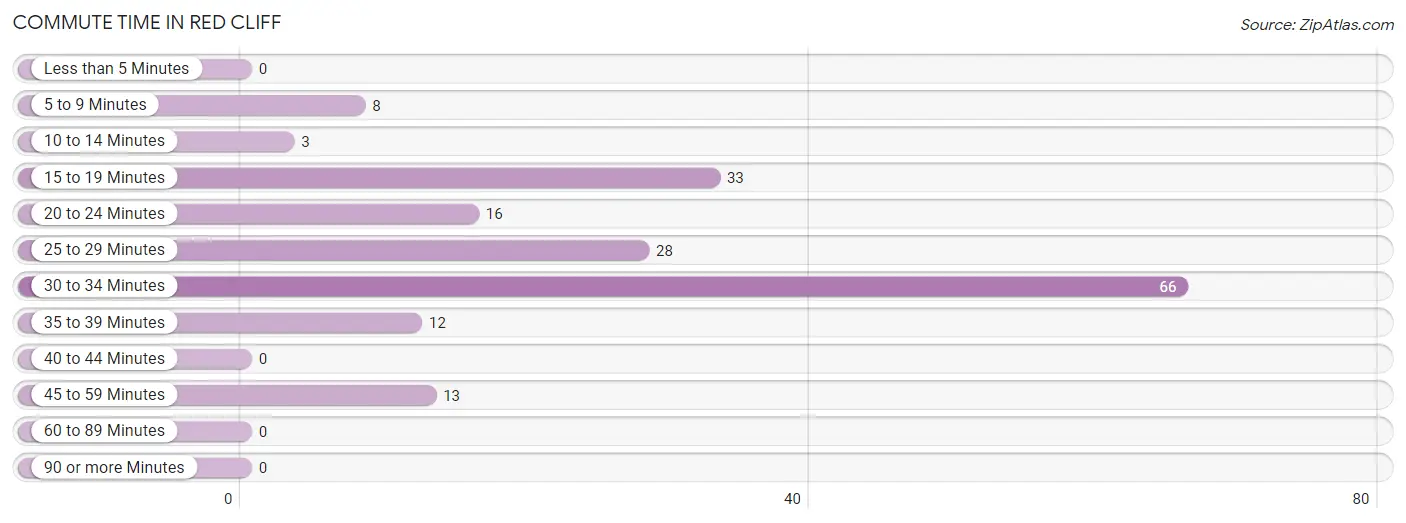
| Commute Time | # Commuters | % Commuters |
| Less than 5 Minutes | 0 | 0.0% |
| 5 to 9 Minutes | 8 | 4.5% |
| 10 to 14 Minutes | 3 | 1.7% |
| 15 to 19 Minutes | 33 | 18.4% |
| 20 to 24 Minutes | 16 | 8.9% |
| 25 to 29 Minutes | 28 | 15.6% |
| 30 to 34 Minutes | 66 | 36.9% |
| 35 to 39 Minutes | 12 | 6.7% |
| 40 to 44 Minutes | 0 | 0.0% |
| 45 to 59 Minutes | 13 | 7.3% |
| 60 to 89 Minutes | 0 | 0.0% |
| 90 or more Minutes | 0 | 0.0% |
Commute Time by Sex in Red Cliff
The most common commute times in Red Cliff are 30 to 34 minutes (25 commuters, 32.5%) for males and 30 to 34 minutes (41 commuters, 40.2%) for females.
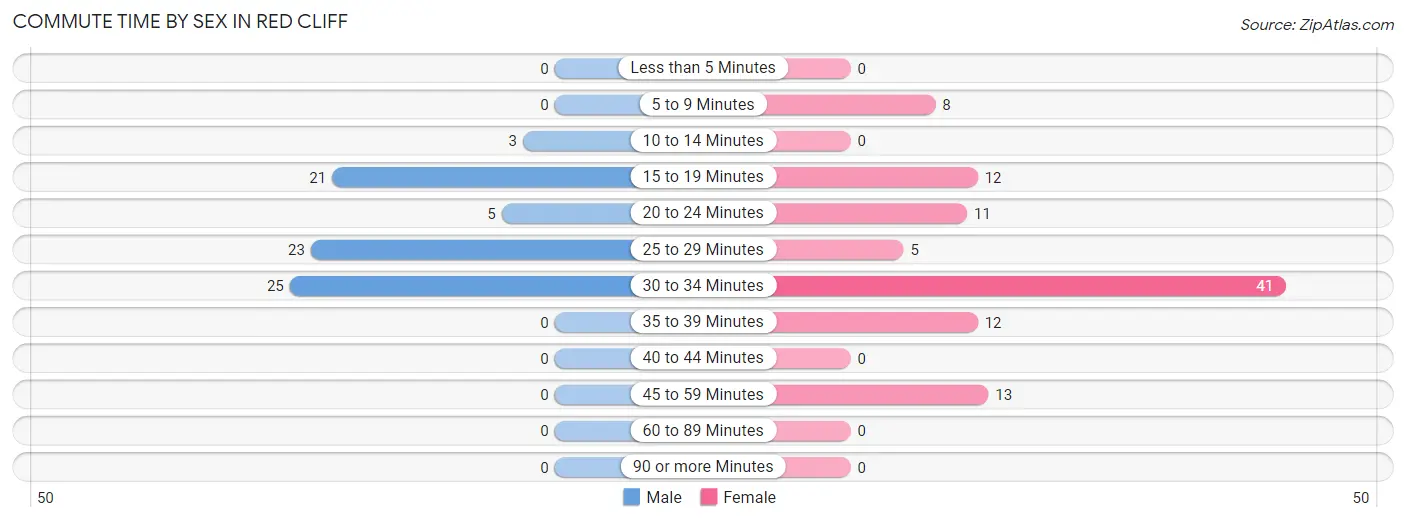
| Commute Time | Male | Female |
| Less than 5 Minutes | 0 (0.0%) | 0 (0.0%) |
| 5 to 9 Minutes | 0 (0.0%) | 8 (7.8%) |
| 10 to 14 Minutes | 3 (3.9%) | 0 (0.0%) |
| 15 to 19 Minutes | 21 (27.3%) | 12 (11.8%) |
| 20 to 24 Minutes | 5 (6.5%) | 11 (10.8%) |
| 25 to 29 Minutes | 23 (29.9%) | 5 (4.9%) |
| 30 to 34 Minutes | 25 (32.5%) | 41 (40.2%) |
| 35 to 39 Minutes | 0 (0.0%) | 12 (11.8%) |
| 40 to 44 Minutes | 0 (0.0%) | 0 (0.0%) |
| 45 to 59 Minutes | 0 (0.0%) | 13 (12.8%) |
| 60 to 89 Minutes | 0 (0.0%) | 0 (0.0%) |
| 90 or more Minutes | 0 (0.0%) | 0 (0.0%) |
Time of Departure to Work by Sex in Red Cliff
The most frequent times of departure to work in Red Cliff are 6:00 AM to 6:29 AM (20, 26.0%) for males and 9:00 AM to 9:59 AM (54, 52.9%) for females.
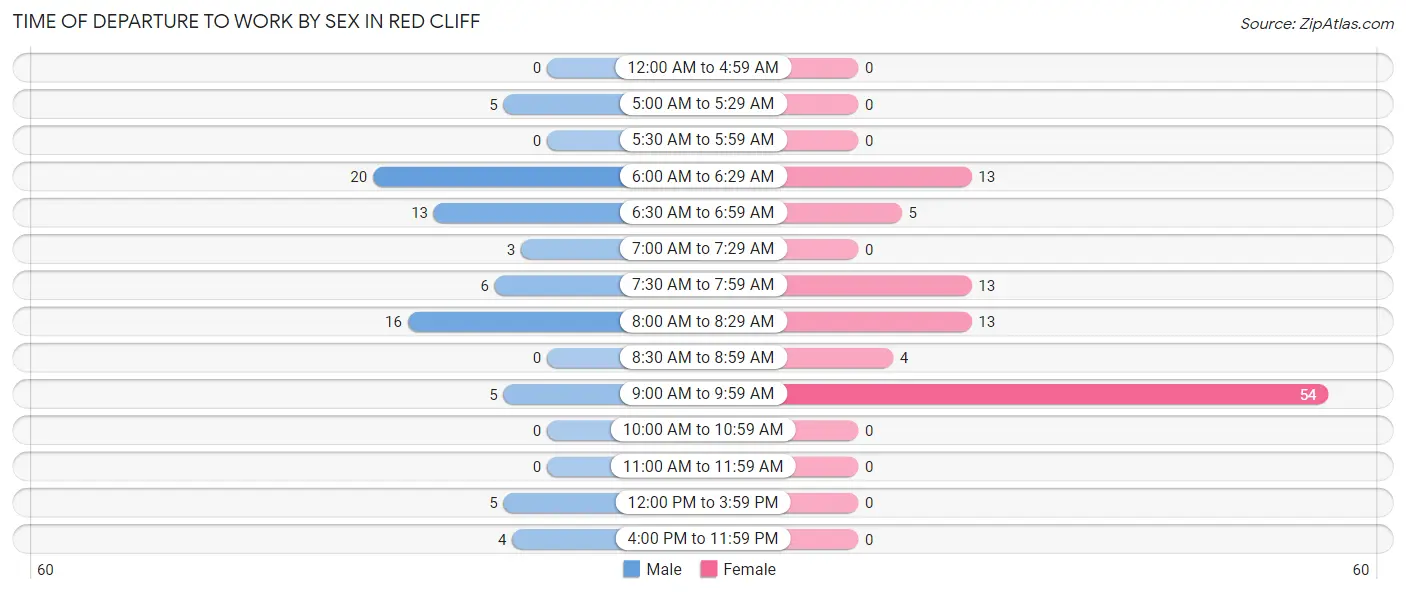
| Time of Departure | Male | Female |
| 12:00 AM to 4:59 AM | 0 (0.0%) | 0 (0.0%) |
| 5:00 AM to 5:29 AM | 5 (6.5%) | 0 (0.0%) |
| 5:30 AM to 5:59 AM | 0 (0.0%) | 0 (0.0%) |
| 6:00 AM to 6:29 AM | 20 (26.0%) | 13 (12.8%) |
| 6:30 AM to 6:59 AM | 13 (16.9%) | 5 (4.9%) |
| 7:00 AM to 7:29 AM | 3 (3.9%) | 0 (0.0%) |
| 7:30 AM to 7:59 AM | 6 (7.8%) | 13 (12.8%) |
| 8:00 AM to 8:29 AM | 16 (20.8%) | 13 (12.8%) |
| 8:30 AM to 8:59 AM | 0 (0.0%) | 4 (3.9%) |
| 9:00 AM to 9:59 AM | 5 (6.5%) | 54 (52.9%) |
| 10:00 AM to 10:59 AM | 0 (0.0%) | 0 (0.0%) |
| 11:00 AM to 11:59 AM | 0 (0.0%) | 0 (0.0%) |
| 12:00 PM to 3:59 PM | 5 (6.5%) | 0 (0.0%) |
| 4:00 PM to 11:59 PM | 4 (5.2%) | 0 (0.0%) |
| Total | 77 (100.0%) | 102 (100.0%) |
Housing Occupancy in Red Cliff
Occupancy by Ownership in Red Cliff
Of the total 121 dwellings in Red Cliff, owner-occupied units account for 89 (73.6%), while renter-occupied units make up 32 (26.5%).
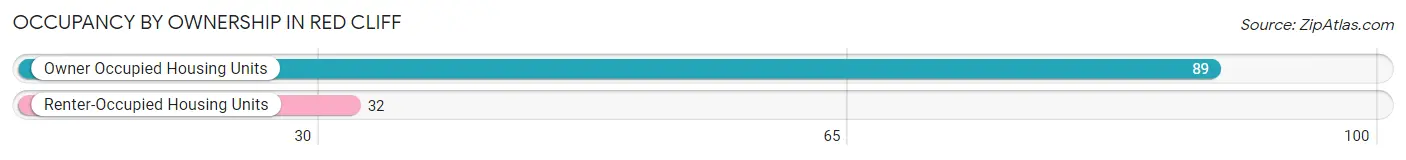
| Occupancy | # Housing Units | % Housing Units |
| Owner Occupied Housing Units | 89 | 73.6% |
| Renter-Occupied Housing Units | 32 | 26.5% |
| Total Occupied Housing Units | 121 | 100.0% |
Occupancy by Household Size in Red Cliff
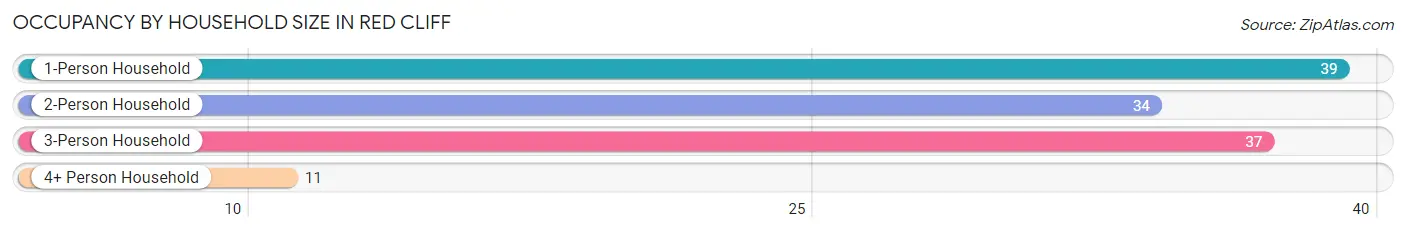
| Household Size | # Housing Units | % Housing Units |
| 1-Person Household | 39 | 32.2% |
| 2-Person Household | 34 | 28.1% |
| 3-Person Household | 37 | 30.6% |
| 4+ Person Household | 11 | 9.1% |
| Total Housing Units | 121 | 100.0% |
Occupancy by Ownership by Household Size in Red Cliff
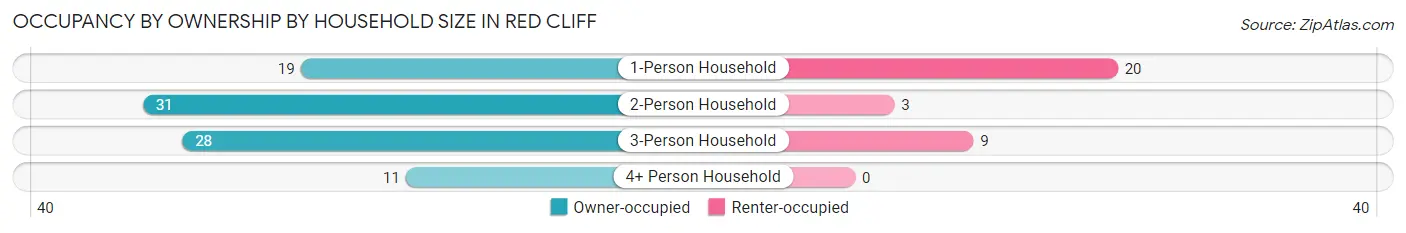
| Household Size | Owner-occupied | Renter-occupied |
| 1-Person Household | 19 (48.7%) | 20 (51.3%) |
| 2-Person Household | 31 (91.2%) | 3 (8.8%) |
| 3-Person Household | 28 (75.7%) | 9 (24.3%) |
| 4+ Person Household | 11 (100.0%) | 0 (0.0%) |
| Total Housing Units | 89 (73.6%) | 32 (26.5%) |
Occupancy by Educational Attainment in Red Cliff
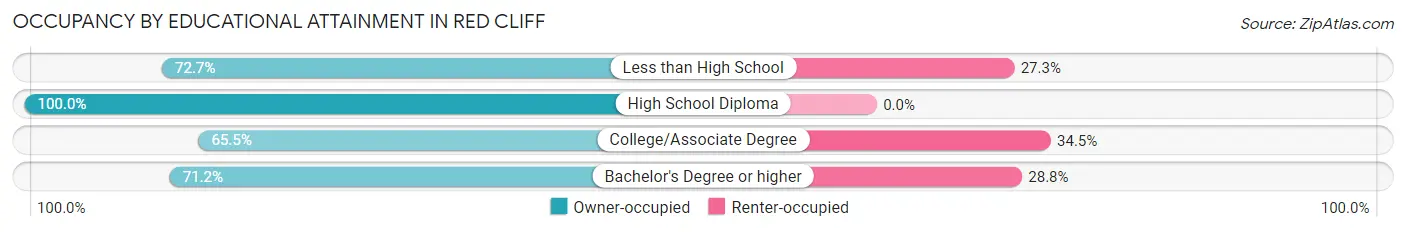
| Household Size | Owner-occupied | Renter-occupied |
| Less than High School | 8 (72.7%) | 3 (27.3%) |
| High School Diploma | 15 (100.0%) | 0 (0.0%) |
| College/Associate Degree | 19 (65.5%) | 10 (34.5%) |
| Bachelor's Degree or higher | 47 (71.2%) | 19 (28.8%) |
Occupancy by Age of Householder in Red Cliff
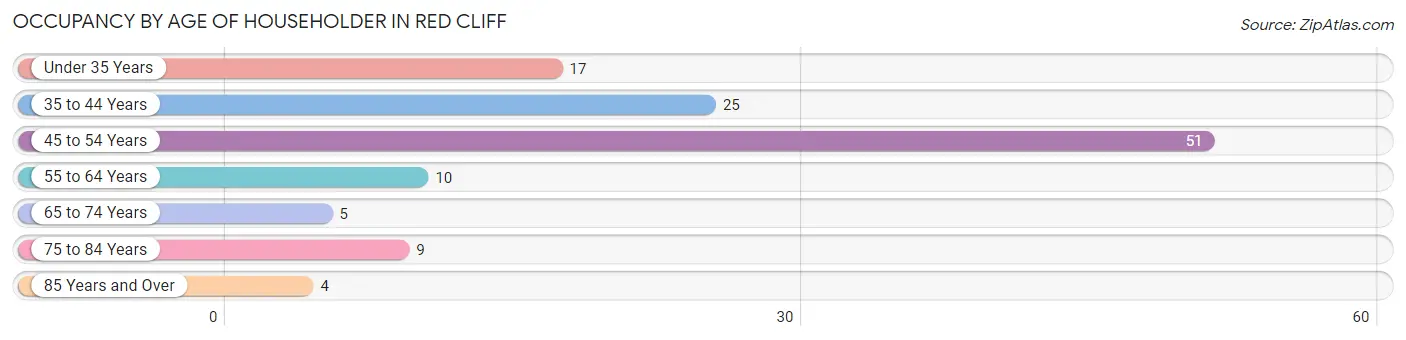
| Age Bracket | # Households | % Households |
| Under 35 Years | 17 | 14.1% |
| 35 to 44 Years | 25 | 20.7% |
| 45 to 54 Years | 51 | 42.1% |
| 55 to 64 Years | 10 | 8.3% |
| 65 to 74 Years | 5 | 4.1% |
| 75 to 84 Years | 9 | 7.4% |
| 85 Years and Over | 4 | 3.3% |
| Total | 121 | 100.0% |
Housing Finances in Red Cliff
Median Income by Occupancy in Red Cliff
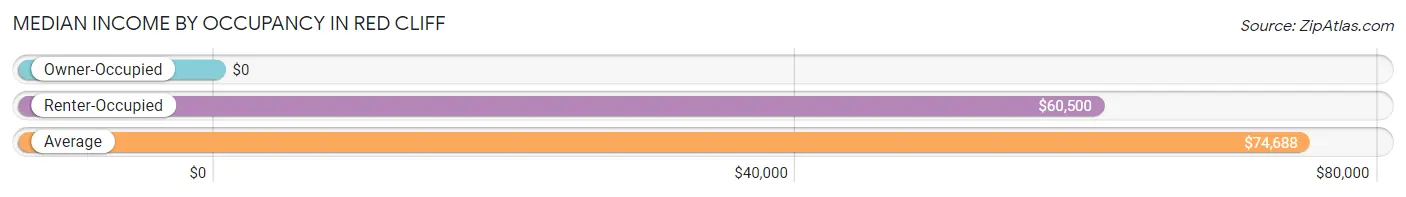
| Occupancy Type | # Households | Median Income |
| Owner-Occupied | 89 (73.6%) | $0 |
| Renter-Occupied | 32 (26.5%) | $60,500 |
| Average | 121 (100.0%) | $74,688 |
Occupancy by Householder Income Bracket in Red Cliff
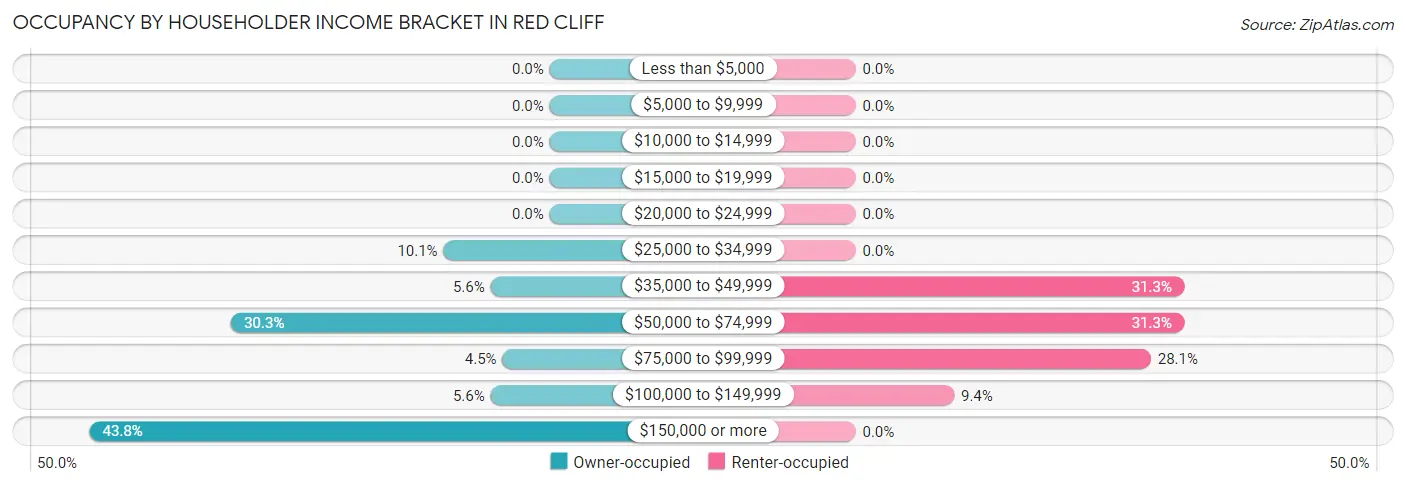
| Income Bracket | Owner-occupied | Renter-occupied |
| Less than $5,000 | 0 (0.0%) | 0 (0.0%) |
| $5,000 to $9,999 | 0 (0.0%) | 0 (0.0%) |
| $10,000 to $14,999 | 0 (0.0%) | 0 (0.0%) |
| $15,000 to $19,999 | 0 (0.0%) | 0 (0.0%) |
| $20,000 to $24,999 | 0 (0.0%) | 0 (0.0%) |
| $25,000 to $34,999 | 9 (10.1%) | 0 (0.0%) |
| $35,000 to $49,999 | 5 (5.6%) | 10 (31.2%) |
| $50,000 to $74,999 | 27 (30.3%) | 10 (31.2%) |
| $75,000 to $99,999 | 4 (4.5%) | 9 (28.1%) |
| $100,000 to $149,999 | 5 (5.6%) | 3 (9.4%) |
| $150,000 or more | 39 (43.8%) | 0 (0.0%) |
| Total | 89 (100.0%) | 32 (100.0%) |
Monthly Housing Cost Tiers in Red Cliff
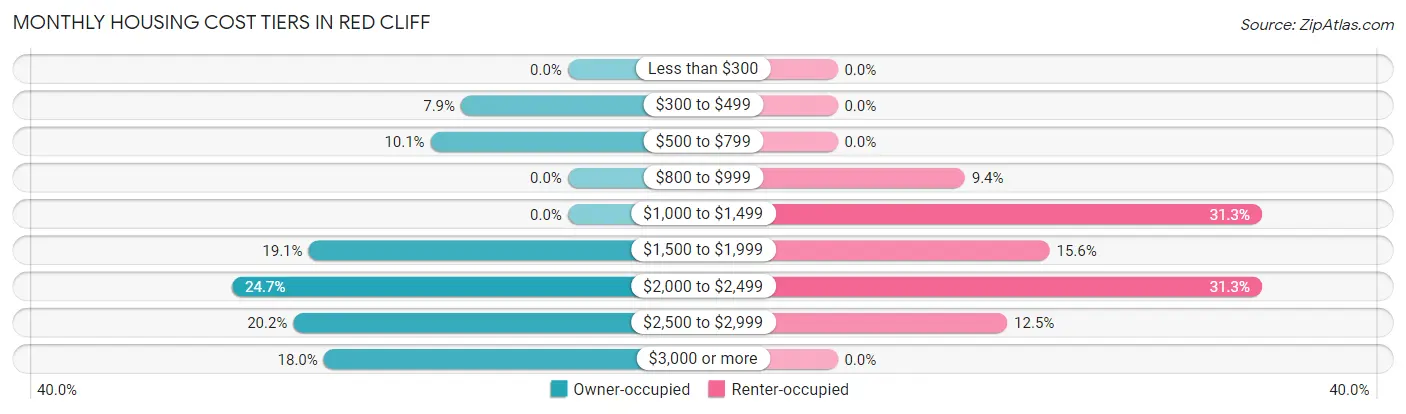
| Monthly Cost | Owner-occupied | Renter-occupied |
| Less than $300 | 0 (0.0%) | 0 (0.0%) |
| $300 to $499 | 7 (7.9%) | 0 (0.0%) |
| $500 to $799 | 9 (10.1%) | 0 (0.0%) |
| $800 to $999 | 0 (0.0%) | 3 (9.4%) |
| $1,000 to $1,499 | 0 (0.0%) | 10 (31.2%) |
| $1,500 to $1,999 | 17 (19.1%) | 5 (15.6%) |
| $2,000 to $2,499 | 22 (24.7%) | 10 (31.2%) |
| $2,500 to $2,999 | 18 (20.2%) | 4 (12.5%) |
| $3,000 or more | 16 (18.0%) | 0 (0.0%) |
| Total | 89 (100.0%) | 32 (100.0%) |
Physical Housing Characteristics in Red Cliff
Housing Structures in Red Cliff
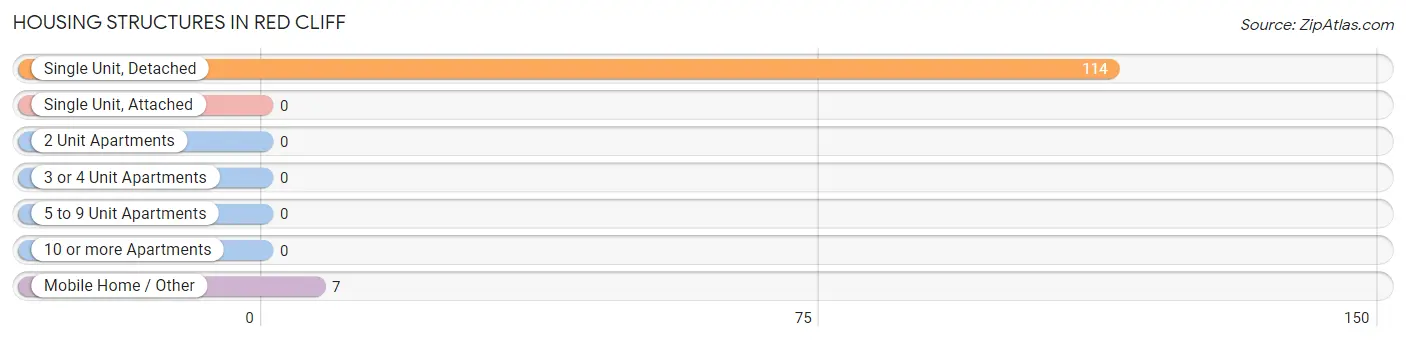
| Structure Type | # Housing Units | % Housing Units |
| Single Unit, Detached | 114 | 94.2% |
| Single Unit, Attached | 0 | 0.0% |
| 2 Unit Apartments | 0 | 0.0% |
| 3 or 4 Unit Apartments | 0 | 0.0% |
| 5 to 9 Unit Apartments | 0 | 0.0% |
| 10 or more Apartments | 0 | 0.0% |
| Mobile Home / Other | 7 | 5.8% |
| Total | 121 | 100.0% |
Housing Structures by Occupancy in Red Cliff
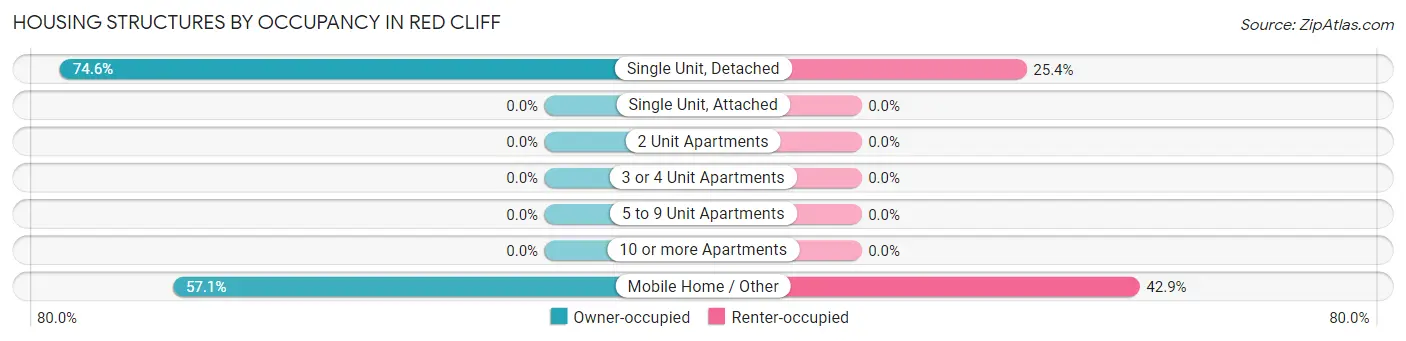
| Structure Type | Owner-occupied | Renter-occupied |
| Single Unit, Detached | 85 (74.6%) | 29 (25.4%) |
| Single Unit, Attached | 0 (0.0%) | 0 (0.0%) |
| 2 Unit Apartments | 0 (0.0%) | 0 (0.0%) |
| 3 or 4 Unit Apartments | 0 (0.0%) | 0 (0.0%) |
| 5 to 9 Unit Apartments | 0 (0.0%) | 0 (0.0%) |
| 10 or more Apartments | 0 (0.0%) | 0 (0.0%) |
| Mobile Home / Other | 4 (57.1%) | 3 (42.9%) |
| Total | 89 (73.6%) | 32 (26.5%) |
Housing Structures by Number of Rooms in Red Cliff
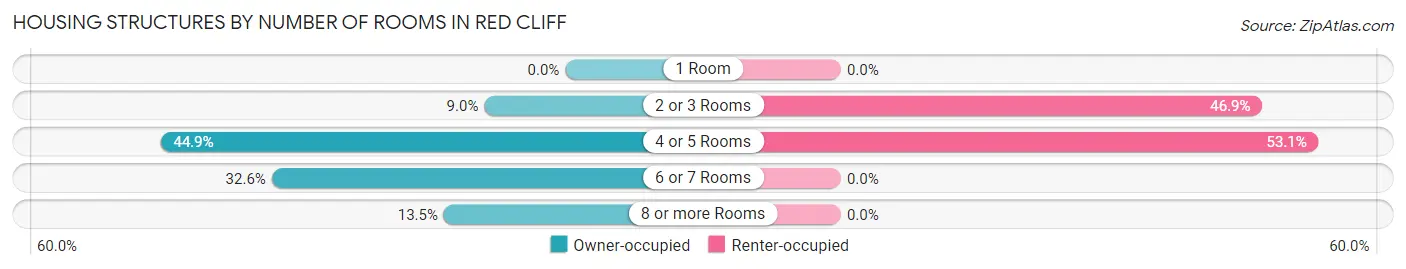
| Number of Rooms | Owner-occupied | Renter-occupied |
| 1 Room | 0 (0.0%) | 0 (0.0%) |
| 2 or 3 Rooms | 8 (9.0%) | 15 (46.9%) |
| 4 or 5 Rooms | 40 (44.9%) | 17 (53.1%) |
| 6 or 7 Rooms | 29 (32.6%) | 0 (0.0%) |
| 8 or more Rooms | 12 (13.5%) | 0 (0.0%) |
| Total | 89 (100.0%) | 32 (100.0%) |
Housing Structure by Heating Type in Red Cliff
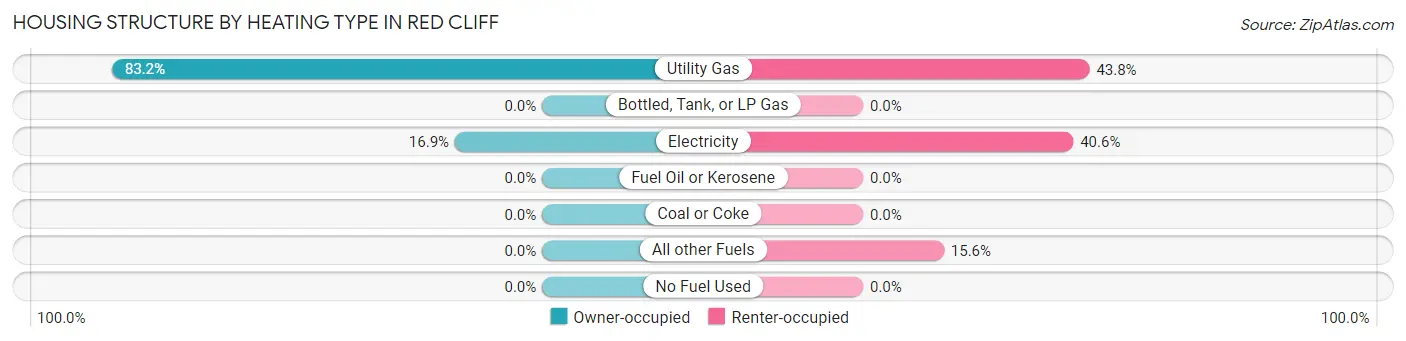
| Heating Type | Owner-occupied | Renter-occupied |
| Utility Gas | 74 (83.2%) | 14 (43.8%) |
| Bottled, Tank, or LP Gas | 0 (0.0%) | 0 (0.0%) |
| Electricity | 15 (16.9%) | 13 (40.6%) |
| Fuel Oil or Kerosene | 0 (0.0%) | 0 (0.0%) |
| Coal or Coke | 0 (0.0%) | 0 (0.0%) |
| All other Fuels | 0 (0.0%) | 5 (15.6%) |
| No Fuel Used | 0 (0.0%) | 0 (0.0%) |
| Total | 89 (100.0%) | 32 (100.0%) |
Household Vehicle Usage in Red Cliff
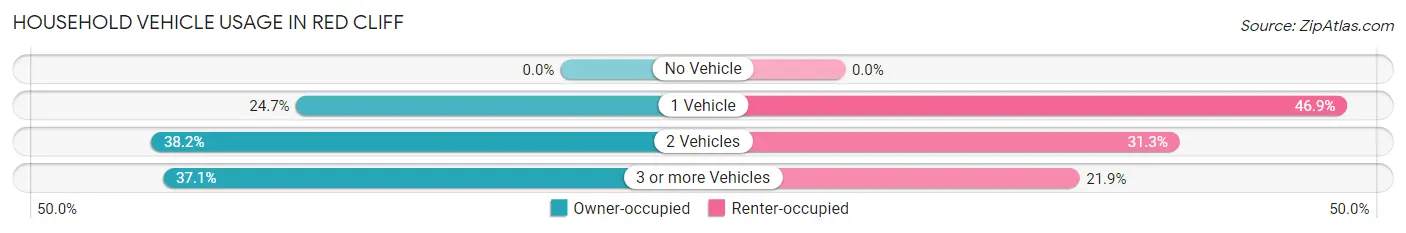
| Vehicles per Household | Owner-occupied | Renter-occupied |
| No Vehicle | 0 (0.0%) | 0 (0.0%) |
| 1 Vehicle | 22 (24.7%) | 15 (46.9%) |
| 2 Vehicles | 34 (38.2%) | 10 (31.2%) |
| 3 or more Vehicles | 33 (37.1%) | 7 (21.9%) |
| Total | 89 (100.0%) | 32 (100.0%) |
Real Estate & Mortgages in Red Cliff
Real Estate and Mortgage Overview in Red Cliff
| Characteristic | Without Mortgage | With Mortgage |
| Housing Units | 16 | 73 |
| Median Property Value | $500,000 | $684,000 |
| Median Household Income | - | - |
| Monthly Housing Costs | $711 | $16 |
| Real Estate Taxes | $1,625 | $0 |
Property Value by Mortgage Status in Red Cliff
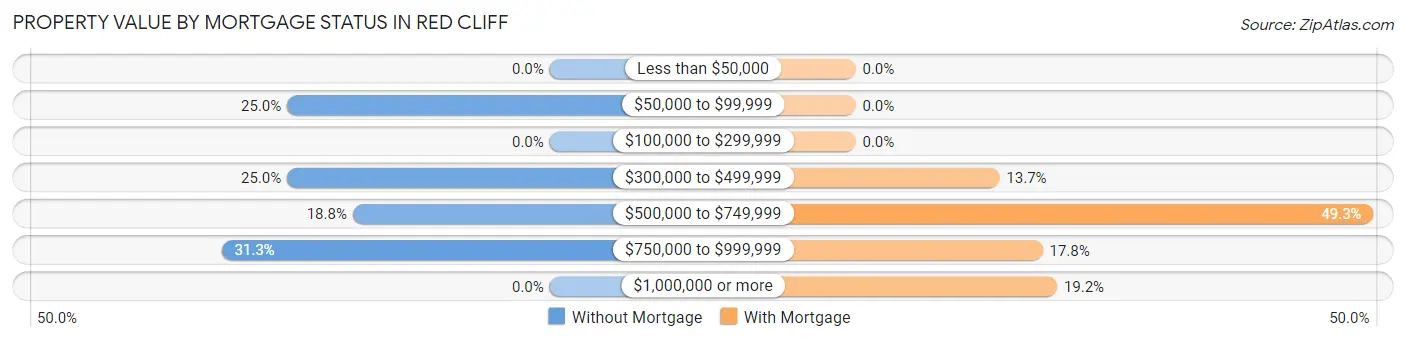
| Property Value | Without Mortgage | With Mortgage |
| Less than $50,000 | 0 (0.0%) | 0 (0.0%) |
| $50,000 to $99,999 | 4 (25.0%) | 0 (0.0%) |
| $100,000 to $299,999 | 0 (0.0%) | 0 (0.0%) |
| $300,000 to $499,999 | 4 (25.0%) | 10 (13.7%) |
| $500,000 to $749,999 | 3 (18.8%) | 36 (49.3%) |
| $750,000 to $999,999 | 5 (31.2%) | 13 (17.8%) |
| $1,000,000 or more | 0 (0.0%) | 14 (19.2%) |
| Total | 16 (100.0%) | 73 (100.0%) |
Household Income by Mortgage Status in Red Cliff
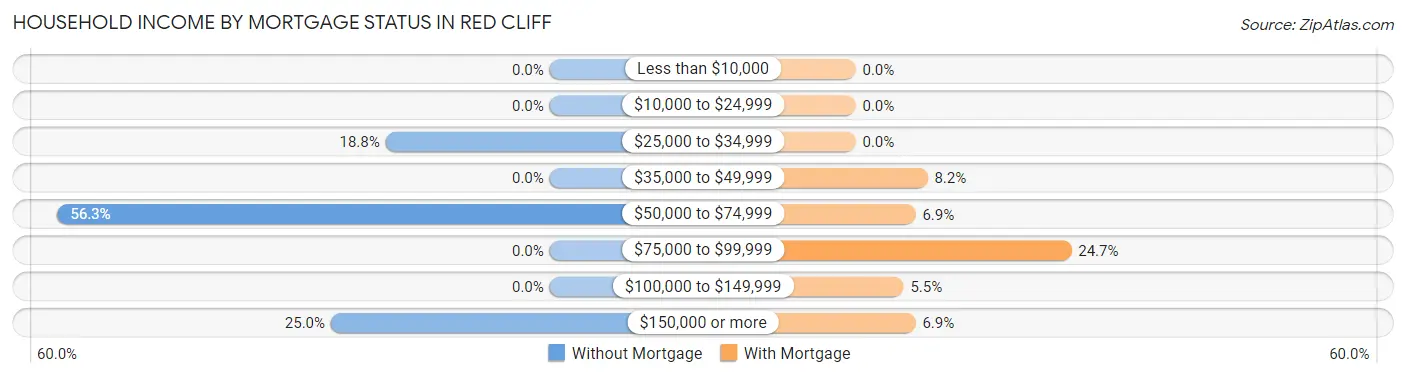
| Household Income | Without Mortgage | With Mortgage |
| Less than $10,000 | 0 (0.0%) | 0 (0.0%) |
| $10,000 to $24,999 | 0 (0.0%) | 0 (0.0%) |
| $25,000 to $34,999 | 3 (18.8%) | 0 (0.0%) |
| $35,000 to $49,999 | 0 (0.0%) | 6 (8.2%) |
| $50,000 to $74,999 | 9 (56.2%) | 5 (6.9%) |
| $75,000 to $99,999 | 0 (0.0%) | 18 (24.7%) |
| $100,000 to $149,999 | 0 (0.0%) | 4 (5.5%) |
| $150,000 or more | 4 (25.0%) | 5 (6.9%) |
| Total | 16 (100.0%) | 73 (100.0%) |
Property Value to Household Income Ratio in Red Cliff
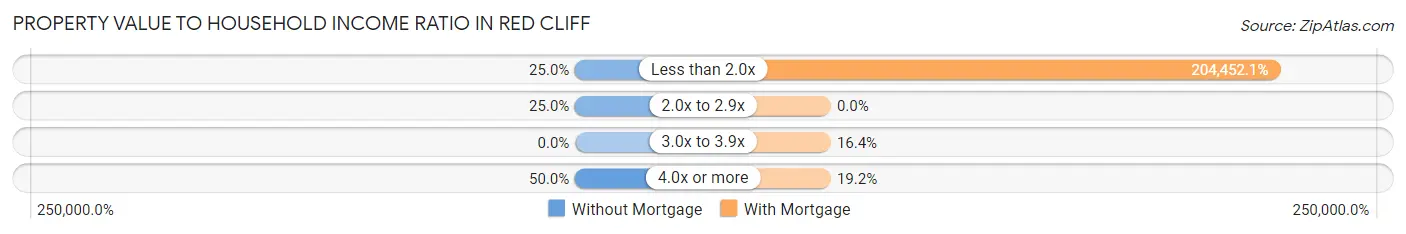
| Value-to-Income Ratio | Without Mortgage | With Mortgage |
| Less than 2.0x | 4 (25.0%) | 149,250 (204,452.1%) |
| 2.0x to 2.9x | 4 (25.0%) | 0 (0.0%) |
| 3.0x to 3.9x | 0 (0.0%) | 12 (16.4%) |
| 4.0x or more | 8 (50.0%) | 14 (19.2%) |
| Total | 16 (100.0%) | 73 (100.0%) |
Real Estate Taxes by Mortgage Status in Red Cliff
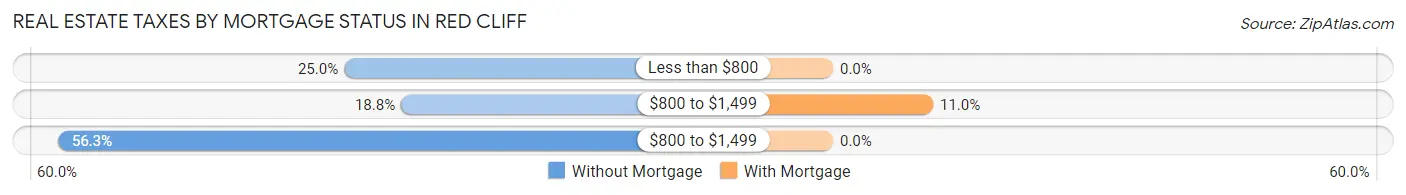
| Property Taxes | Without Mortgage | With Mortgage |
| Less than $800 | 4 (25.0%) | 0 (0.0%) |
| $800 to $1,499 | 3 (18.8%) | 8 (11.0%) |
| $800 to $1,499 | 9 (56.2%) | 0 (0.0%) |
| Total | 16 (100.0%) | 73 (100.0%) |
Health & Disability in Red Cliff
Health Insurance Coverage by Age in Red Cliff
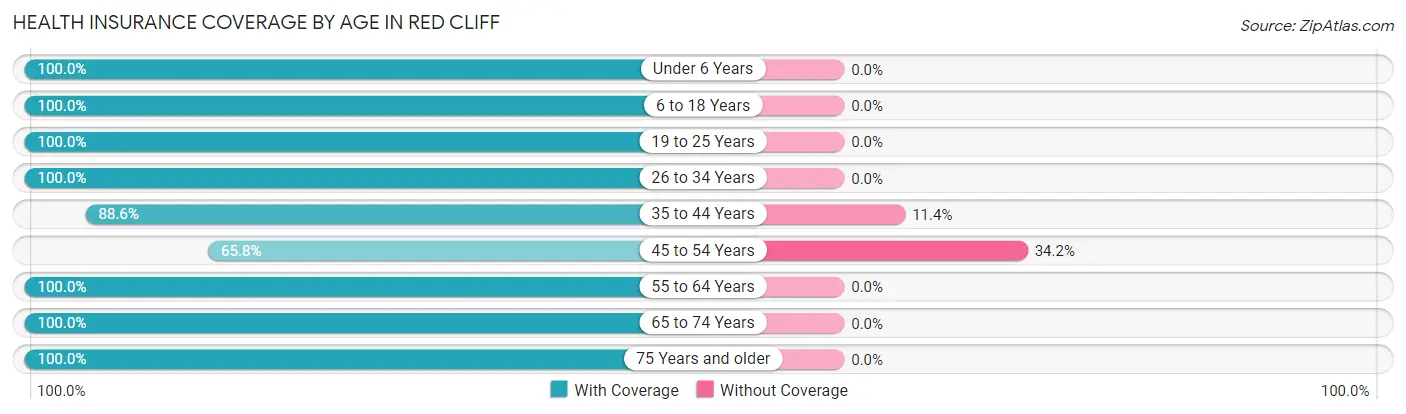
| Age Bracket | With Coverage | Without Coverage |
| Under 6 Years | 23 (100.0%) | 0 (0.0%) |
| 6 to 18 Years | 43 (100.0%) | 0 (0.0%) |
| 19 to 25 Years | 20 (100.0%) | 0 (0.0%) |
| 26 to 34 Years | 28 (100.0%) | 0 (0.0%) |
| 35 to 44 Years | 39 (88.6%) | 5 (11.4%) |
| 45 to 54 Years | 50 (65.8%) | 26 (34.2%) |
| 55 to 64 Years | 18 (100.0%) | 0 (0.0%) |
| 65 to 74 Years | 22 (100.0%) | 0 (0.0%) |
| 75 Years and older | 18 (100.0%) | 0 (0.0%) |
| Total | 261 (89.4%) | 31 (10.6%) |
Health Insurance Coverage by Citizenship Status in Red Cliff
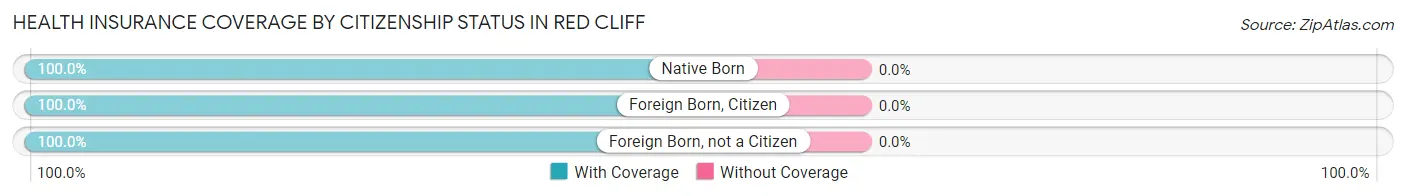
| Citizenship Status | With Coverage | Without Coverage |
| Native Born | 23 (100.0%) | 0 (0.0%) |
| Foreign Born, Citizen | 43 (100.0%) | 0 (0.0%) |
| Foreign Born, not a Citizen | 20 (100.0%) | 0 (0.0%) |
Health Insurance Coverage by Household Income in Red Cliff
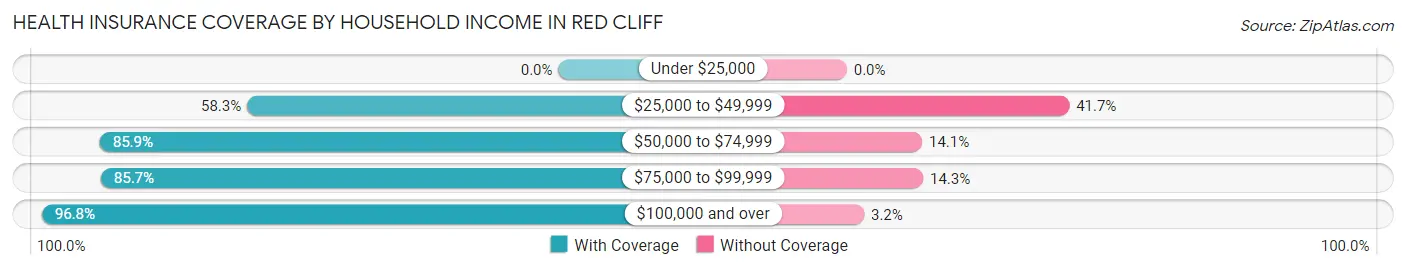
| Household Income | With Coverage | Without Coverage |
| Under $25,000 | 0 (0.0%) | 0 (0.0%) |
| $25,000 to $49,999 | 14 (58.3%) | 10 (41.7%) |
| $50,000 to $74,999 | 67 (85.9%) | 11 (14.1%) |
| $75,000 to $99,999 | 30 (85.7%) | 5 (14.3%) |
| $100,000 and over | 150 (96.8%) | 5 (3.2%) |
Public vs Private Health Insurance Coverage by Age in Red Cliff
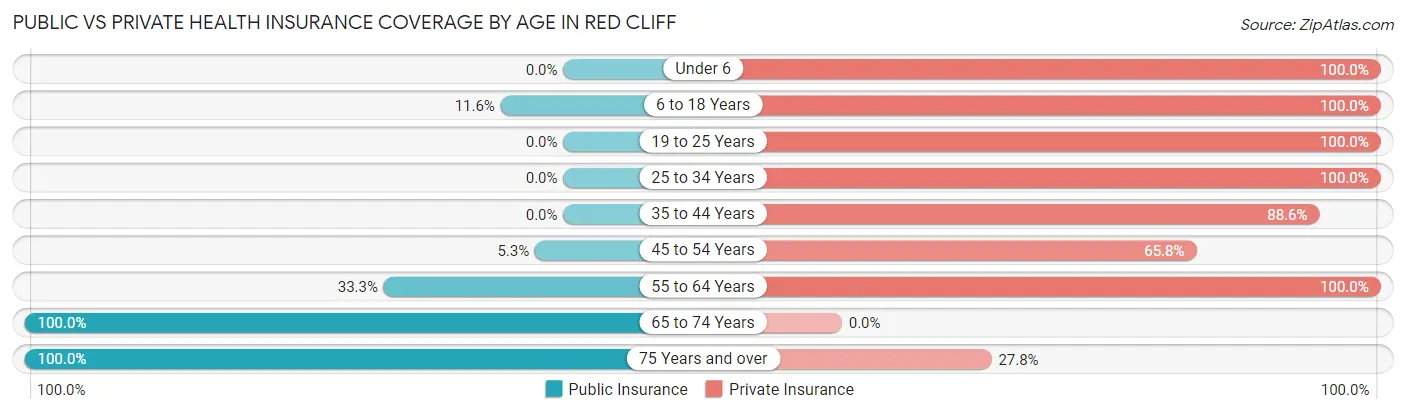
| Age Bracket | Public Insurance | Private Insurance |
| Under 6 | 0 (0.0%) | 23 (100.0%) |
| 6 to 18 Years | 5 (11.6%) | 43 (100.0%) |
| 19 to 25 Years | 0 (0.0%) | 20 (100.0%) |
| 25 to 34 Years | 0 (0.0%) | 28 (100.0%) |
| 35 to 44 Years | 0 (0.0%) | 39 (88.6%) |
| 45 to 54 Years | 4 (5.3%) | 50 (65.8%) |
| 55 to 64 Years | 6 (33.3%) | 18 (100.0%) |
| 65 to 74 Years | 22 (100.0%) | 0 (0.0%) |
| 75 Years and over | 18 (100.0%) | 5 (27.8%) |
| Total | 55 (18.8%) | 226 (77.4%) |
Disability Status by Sex by Age in Red Cliff
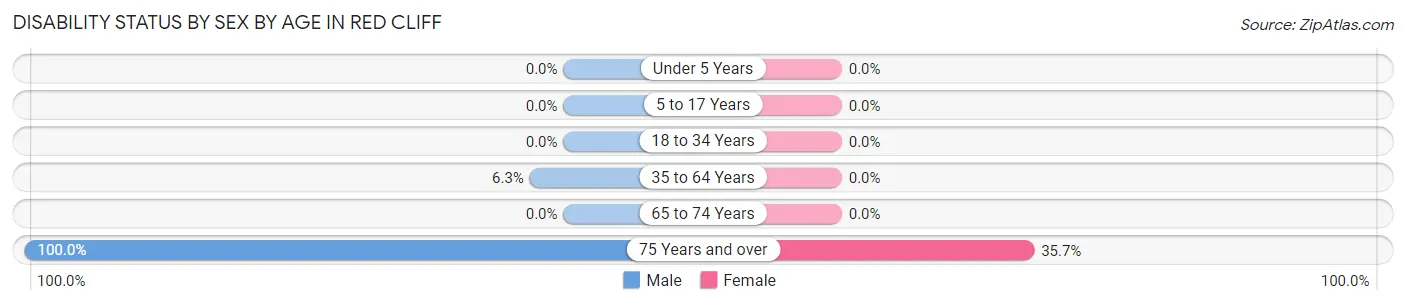
| Age Bracket | Male | Female |
| Under 5 Years | 0 (0.0%) | 0 (0.0%) |
| 5 to 17 Years | 0 (0.0%) | 0 (0.0%) |
| 18 to 34 Years | 0 (0.0%) | 0 (0.0%) |
| 35 to 64 Years | 5 (6.2%) | 0 (0.0%) |
| 65 to 74 Years | 0 (0.0%) | 0 (0.0%) |
| 75 Years and over | 4 (100.0%) | 5 (35.7%) |
Disability Class by Sex by Age in Red Cliff
Disability Class: Hearing Difficulty
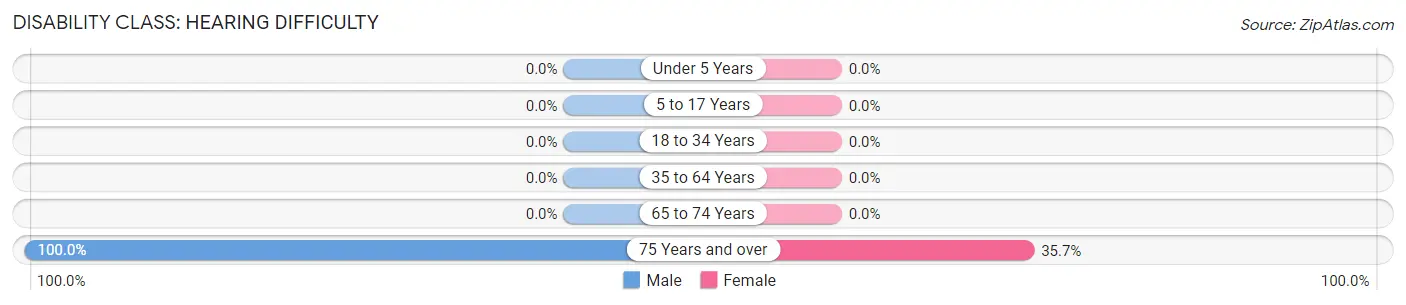
| Age Bracket | Male | Female |
| Under 5 Years | 0 (0.0%) | 0 (0.0%) |
| 5 to 17 Years | 0 (0.0%) | 0 (0.0%) |
| 18 to 34 Years | 0 (0.0%) | 0 (0.0%) |
| 35 to 64 Years | 0 (0.0%) | 0 (0.0%) |
| 65 to 74 Years | 0 (0.0%) | 0 (0.0%) |
| 75 Years and over | 4 (100.0%) | 5 (35.7%) |
Disability Class: Vision Difficulty
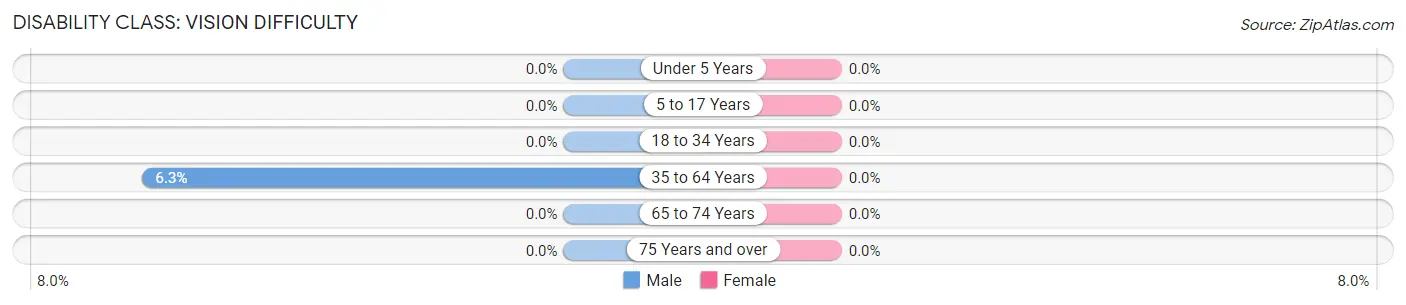
| Age Bracket | Male | Female |
| Under 5 Years | 0 (0.0%) | 0 (0.0%) |
| 5 to 17 Years | 0 (0.0%) | 0 (0.0%) |
| 18 to 34 Years | 0 (0.0%) | 0 (0.0%) |
| 35 to 64 Years | 5 (6.2%) | 0 (0.0%) |
| 65 to 74 Years | 0 (0.0%) | 0 (0.0%) |
| 75 Years and over | 0 (0.0%) | 0 (0.0%) |
Disability Class: Cognitive Difficulty
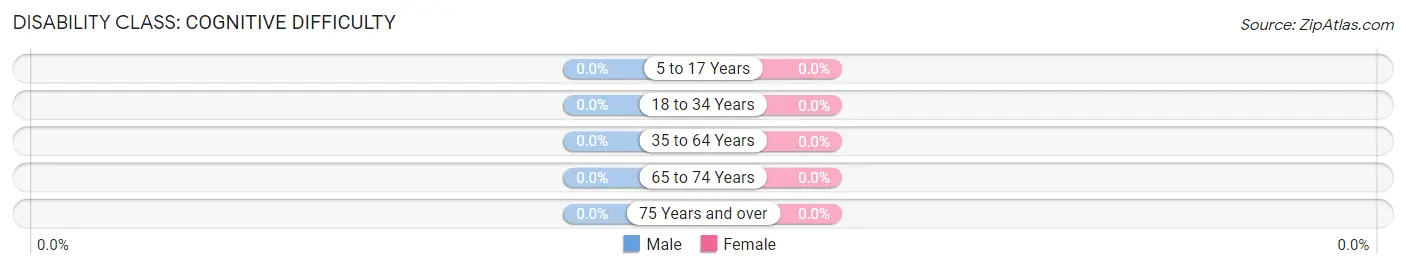
| Age Bracket | Male | Female |
| 5 to 17 Years | 0 (0.0%) | 0 (0.0%) |
| 18 to 34 Years | 0 (0.0%) | 0 (0.0%) |
| 35 to 64 Years | 0 (0.0%) | 0 (0.0%) |
| 65 to 74 Years | 0 (0.0%) | 0 (0.0%) |
| 75 Years and over | 0 (0.0%) | 0 (0.0%) |
Disability Class: Ambulatory Difficulty
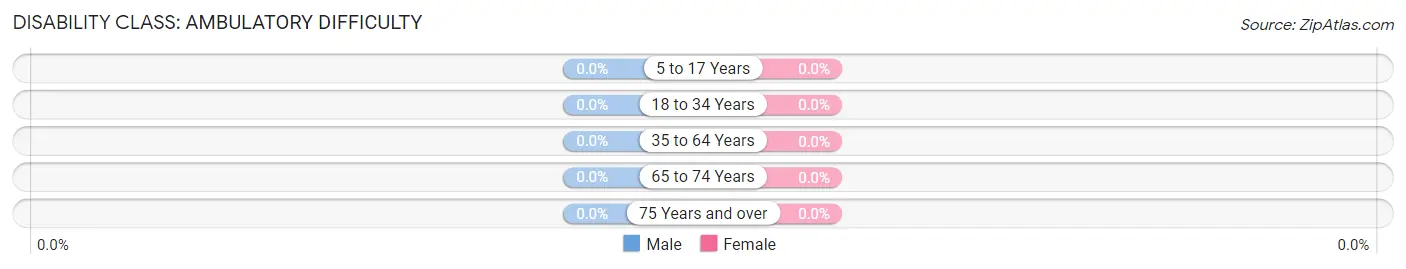
| Age Bracket | Male | Female |
| 5 to 17 Years | 0 (0.0%) | 0 (0.0%) |
| 18 to 34 Years | 0 (0.0%) | 0 (0.0%) |
| 35 to 64 Years | 0 (0.0%) | 0 (0.0%) |
| 65 to 74 Years | 0 (0.0%) | 0 (0.0%) |
| 75 Years and over | 0 (0.0%) | 0 (0.0%) |
Disability Class: Self-Care Difficulty
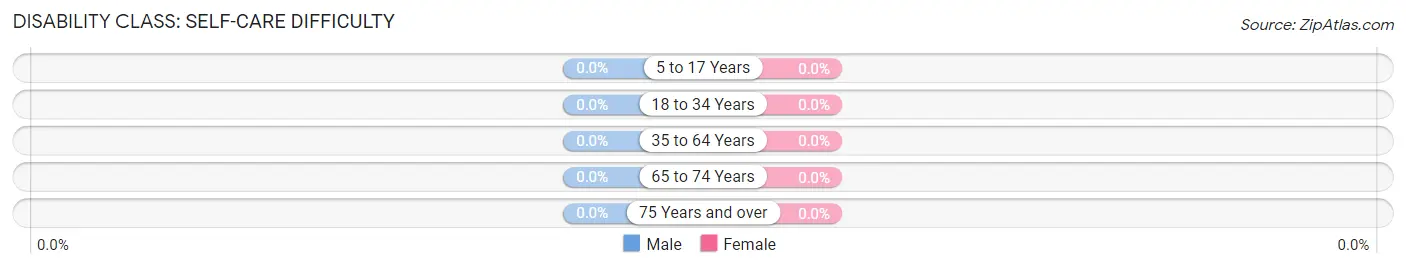
| Age Bracket | Male | Female |
| 5 to 17 Years | 0 (0.0%) | 0 (0.0%) |
| 18 to 34 Years | 0 (0.0%) | 0 (0.0%) |
| 35 to 64 Years | 0 (0.0%) | 0 (0.0%) |
| 65 to 74 Years | 0 (0.0%) | 0 (0.0%) |
| 75 Years and over | 0 (0.0%) | 0 (0.0%) |
Technology Access in Red Cliff
Computing Device Access in Red Cliff
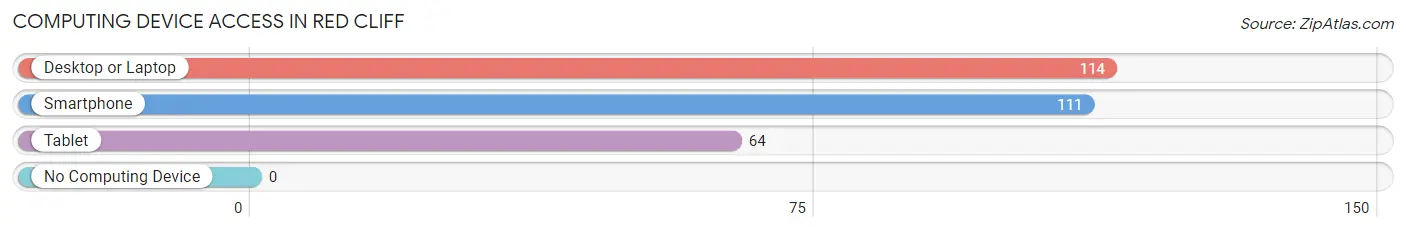
| Device Type | # Households | % Households |
| Desktop or Laptop | 114 | 94.2% |
| Smartphone | 111 | 91.7% |
| Tablet | 64 | 52.9% |
| No Computing Device | 0 | 0.0% |
| Total | 121 | 100.0% |
Internet Access in Red Cliff
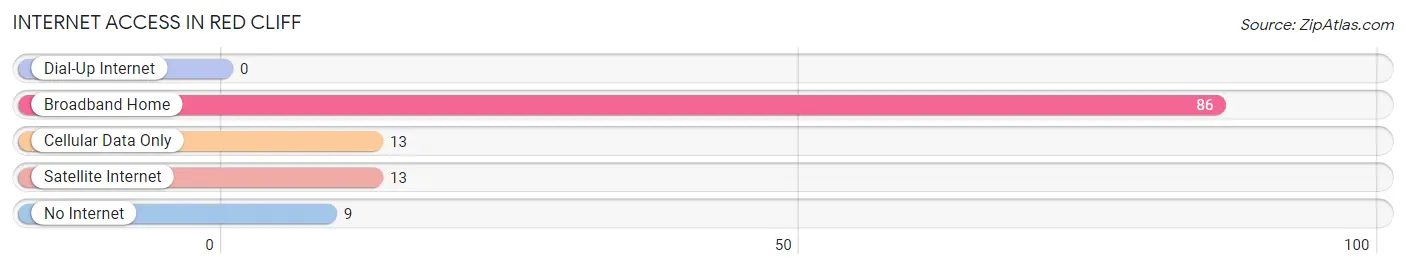
| Internet Type | # Households | % Households |
| Dial-Up Internet | 0 | 0.0% |
| Broadband Home | 86 | 71.1% |
| Cellular Data Only | 13 | 10.7% |
| Satellite Internet | 13 | 10.7% |
| No Internet | 9 | 7.4% |
| Total | 121 | 100.0% |
Red Cliff Summary
Cliff, Colorado is a small town located in the San Luis Valley in the south-central part of the state. It is situated at the base of the Sangre de Cristo Mountains, and is surrounded by the Rio Grande National Forest. The town was founded in 1881 by a group of settlers from the nearby town of Del Norte. The town was named after the nearby cliffs, which were formed by the Rio Grande River.
Geography
Cliff, Colorado is located in the San Luis Valley, which is a large intermontane basin located in the south-central part of the state. The valley is surrounded by the Sangre de Cristo Mountains to the east, the San Juan Mountains to the west, and the San Juan National Forest to the north. The Rio Grande River runs through the valley, and is the main source of water for the town. The town is situated at an elevation of 7,500 feet, and has a total area of 0.6 square miles.
Climate
Cliff, Colorado has a semi-arid climate, with hot summers and cold winters. The average high temperature in the summer is around 85°F, and the average low temperature in the winter is around 10°F. The town receives an average of 16 inches of precipitation per year, with most of it falling in the form of snow.
Demographics
As of the 2010 census, the population of Cliff, Colorado was 545. The racial makeup of the town was 95.2% White, 0.2% African American, 0.7% Native American, 0.2% Asian, 0.2% Pacific Islander, 1.3% from other races, and 2.2% from two or more races. Hispanic or Latino of any race were 4.2% of the population.
Economy
The economy of Cliff, Colorado is largely based on agriculture and tourism. The town is home to several farms, which produce a variety of crops, including potatoes, alfalfa, and hay. The town is also home to several tourist attractions, including the Rio Grande National Forest, the San Luis Valley Museum, and the Great Sand Dunes National Park.
The town is also home to several small businesses, including restaurants, shops, and a gas station. The town is served by the San Luis Valley Regional Airport, which provides air service to Denver and other nearby cities.
Conclusion
Cliff, Colorado is a small town located in the San Luis Valley in the south-central part of the state. It is surrounded by the Rio Grande National Forest and the Sangre de Cristo Mountains, and is home to several farms and tourist attractions. The town has a semi-arid climate, with hot summers and cold winters. As of the 2010 census, the population of Cliff, Colorado was 545. The economy of the town is largely based on agriculture and tourism.
Common Questions
What is Per Capita Income in Red Cliff?
Per Capita income in Red Cliff is $47,129.
What is the Median Family Income in Red Cliff?
Median Family Income in Red Cliff is $150,833.
What is the Median Household income in Red Cliff?
Median Household Income in Red Cliff is $74,688.
What is Income or Wage Gap in Red Cliff?
Income or Wage Gap in Red Cliff is 31.4%.
Women in Red Cliff earn 68.6 cents for every dollar earned by a man.
What is Inequality or Gini Index in Red Cliff?
Inequality or Gini Index in Red Cliff is 0.34.
What is the Total Population of Red Cliff?
Total Population of Red Cliff is 292.
What is the Total Male Population of Red Cliff?
Total Male Population of Red Cliff is 159.
What is the Total Female Population of Red Cliff?
Total Female Population of Red Cliff is 133.
What is the Ratio of Males per 100 Females in Red Cliff?
There are 119.55 Males per 100 Females in Red Cliff.
What is the Ratio of Females per 100 Males in Red Cliff?
There are 83.65 Females per 100 Males in Red Cliff.
What is the Median Population Age in Red Cliff?
Median Population Age in Red Cliff is 42.6 Years.
What is the Average Family Size in Red Cliff
Average Family Size in Red Cliff is 3.0 People.
What is the Average Household Size in Red Cliff
Average Household Size in Red Cliff is 2.4 People.
How Large is the Labor Force in Red Cliff?
There are 182 People in the Labor Forcein in Red Cliff.
What is the Percentage of People in the Labor Force in Red Cliff?
78.4% of People are in the Labor Force in Red Cliff.