Williamsburg, CO Map & Demographics
Williamsburg Map
Williamsburg Overview
$26,211
PER CAPITA INCOME
$72,500
AVG FAMILY INCOME
$66,875
AVG HOUSEHOLD INCOME
1.7%
WAGE / INCOME GAP [ % ]
98.3¢/ $1
WAGE / INCOME GAP [ $ ]
0.39
INEQUALITY / GINI INDEX
810
TOTAL POPULATION
465
MALE POPULATION
345
FEMALE POPULATION
134.78
MALES / 100 FEMALES
74.19
FEMALES / 100 MALES
40.6
MEDIAN AGE
3.3
AVG FAMILY SIZE
2.9
AVG HOUSEHOLD SIZE
374
LABOR FORCE [ PEOPLE ]
53.2%
PERCENT IN LABOR FORCE
4.3%
UNEMPLOYMENT RATE
Income in Williamsburg
Income Overview in Williamsburg
Per Capita Income in Williamsburg is $26,211, while median incomes of families and households are $72,500 and $66,875 respectively.
| Characteristic | Number | Measure |
| Per Capita Income | 810 | $26,211 |
| Median Family Income | 210 | $72,500 |
| Mean Family Income | 210 | $74,080 |
| Median Household Income | 283 | $66,875 |
| Mean Household Income | 283 | $73,817 |
| Income Deficit | 210 | $0 |
| Wage / Income Gap (%) | 810 | 1.71% |
| Wage / Income Gap ($) | 810 | 98.29¢ per $1 |
| Gini / Inequality Index | 810 | 0.39 |
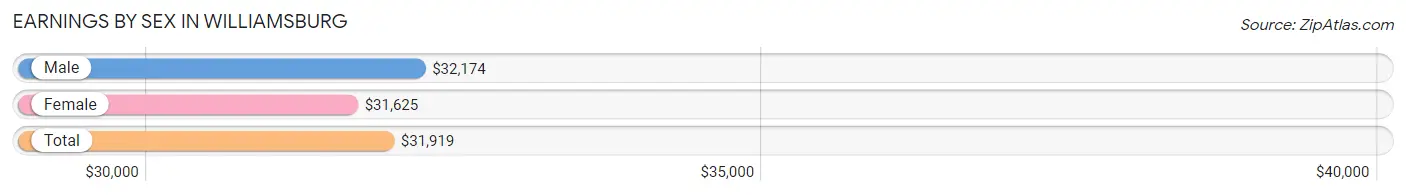
Earnings by Sex in Williamsburg
Average Earnings in Williamsburg are $31,919, $32,174 for men and $31,625 for women, a difference of 1.7%.
| Sex | Number | Average Earnings |
| Male | 222 (56.9%) | $32,174 |
| Female | 168 (43.1%) | $31,625 |
| Total | 390 (100.0%) | $31,919 |
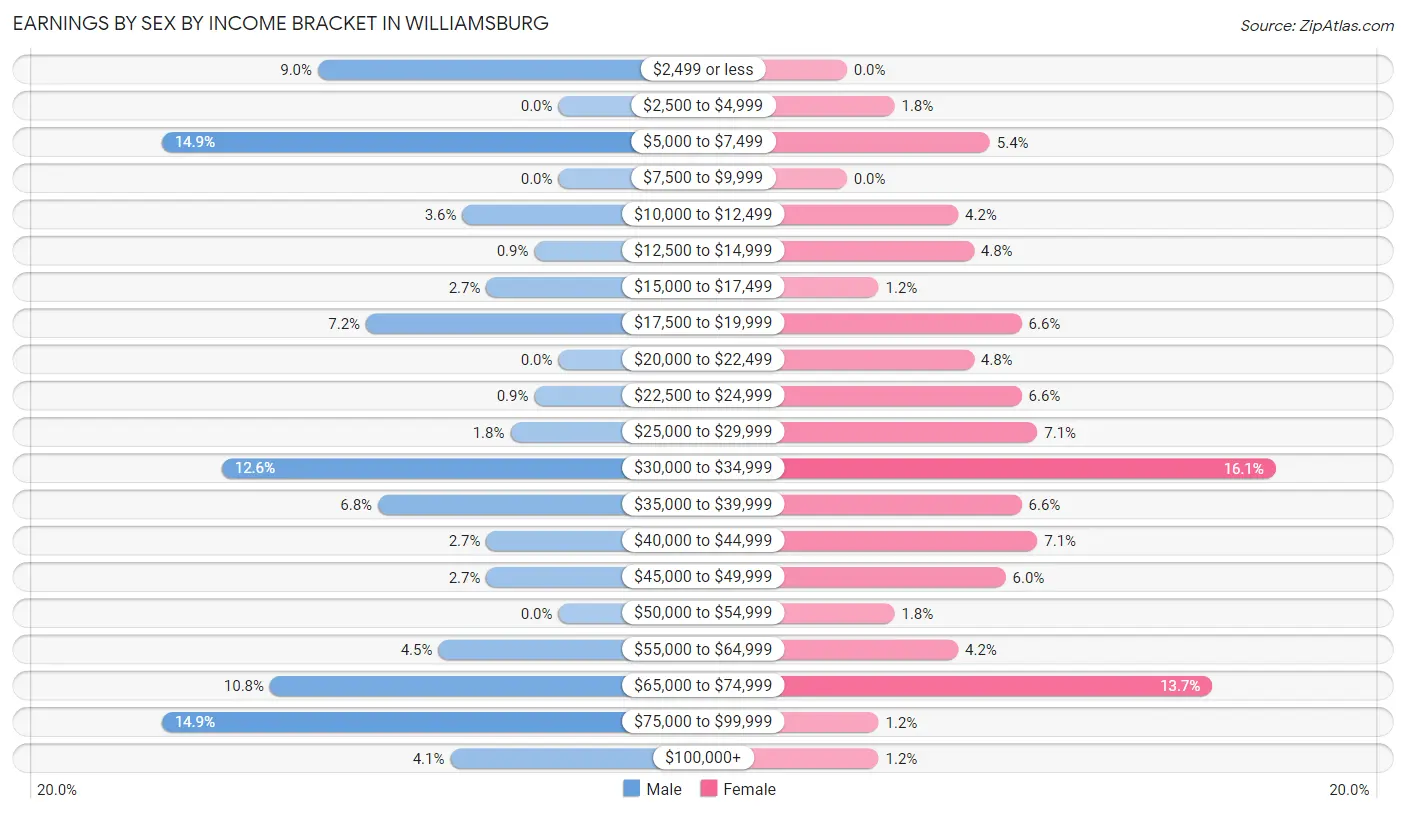
Earnings by Sex by Income Bracket in Williamsburg
The most common earnings brackets in Williamsburg are $5,000 to $7,499 for men (33 | 14.9%) and $30,000 to $34,999 for women (27 | 16.1%).
| Income | Male | Female |
| $2,499 or less | 20 (9.0%) | 0 (0.0%) |
| $2,500 to $4,999 | 0 (0.0%) | 3 (1.8%) |
| $5,000 to $7,499 | 33 (14.9%) | 9 (5.4%) |
| $7,500 to $9,999 | 0 (0.0%) | 0 (0.0%) |
| $10,000 to $12,499 | 8 (3.6%) | 7 (4.2%) |
| $12,500 to $14,999 | 2 (0.9%) | 8 (4.8%) |
| $15,000 to $17,499 | 6 (2.7%) | 2 (1.2%) |
| $17,500 to $19,999 | 16 (7.2%) | 11 (6.6%) |
| $20,000 to $22,499 | 0 (0.0%) | 8 (4.8%) |
| $22,500 to $24,999 | 2 (0.9%) | 11 (6.6%) |
| $25,000 to $29,999 | 4 (1.8%) | 12 (7.1%) |
| $30,000 to $34,999 | 28 (12.6%) | 27 (16.1%) |
| $35,000 to $39,999 | 15 (6.8%) | 11 (6.6%) |
| $40,000 to $44,999 | 6 (2.7%) | 12 (7.1%) |
| $45,000 to $49,999 | 6 (2.7%) | 10 (5.9%) |
| $50,000 to $54,999 | 0 (0.0%) | 3 (1.8%) |
| $55,000 to $64,999 | 10 (4.5%) | 7 (4.2%) |
| $65,000 to $74,999 | 24 (10.8%) | 23 (13.7%) |
| $75,000 to $99,999 | 33 (14.9%) | 2 (1.2%) |
| $100,000+ | 9 (4.1%) | 2 (1.2%) |
| Total | 222 (100.0%) | 168 (100.0%) |
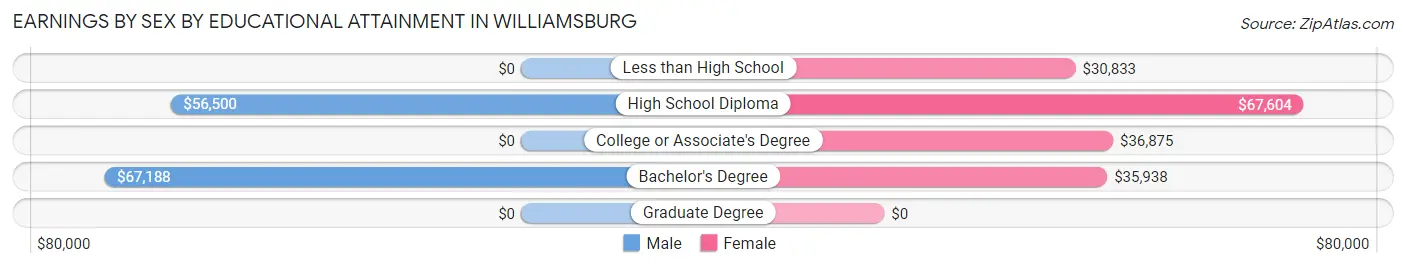
Earnings by Sex by Educational Attainment in Williamsburg
Average earnings in Williamsburg are $49,375 for men and $35,682 for women, a difference of 27.7%. Men with an educational attainment of bachelor's degree enjoy the highest average annual earnings of $67,188, while those with high school diploma education earn the least with $56,500. Women with an educational attainment of high school diploma earn the most with the average annual earnings of $67,604, while those with less than high school education have the smallest earnings of $30,833.
| Educational Attainment | Male Income | Female Income |
| Less than High School | - | - |
| High School Diploma | $56,500 | $67,604 |
| College or Associate's Degree | - | - |
| Bachelor's Degree | $67,188 | $35,938 |
| Graduate Degree | - | - |
| Total | $49,375 | $35,682 |
Family Income in Williamsburg
Family Income Brackets in Williamsburg
According to the Williamsburg family income data, there are 54 families falling into the $75,000 to $99,999 income range, which is the most common income bracket and makes up 25.7% of all families. Conversely, the $200,000+ income bracket is the least frequent group with only 3 families (1.4%) belonging to this category.
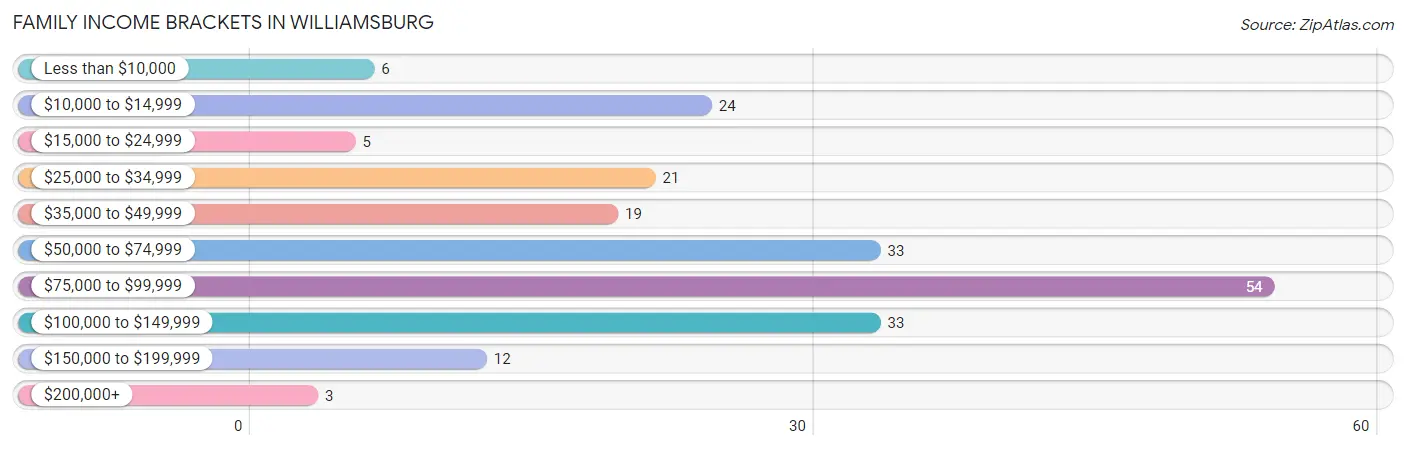
| Income Bracket | # Families | % Families |
| Less than $10,000 | 6 | 2.9% |
| $10,000 to $14,999 | 24 | 11.4% |
| $15,000 to $24,999 | 5 | 2.4% |
| $25,000 to $34,999 | 21 | 10.0% |
| $35,000 to $49,999 | 19 | 9.0% |
| $50,000 to $74,999 | 33 | 15.7% |
| $75,000 to $99,999 | 54 | 25.7% |
| $100,000 to $149,999 | 33 | 15.7% |
| $150,000 to $199,999 | 12 | 5.7% |
| $200,000+ | 3 | 1.4% |
Family Income by Famaliy Size in Williamsburg
4-person families (8 | 3.8%) account for the highest median family income in Williamsburg with $82,500 per family, while 2-person families (122 | 58.1%) have the highest median income of $27,143 per family member.
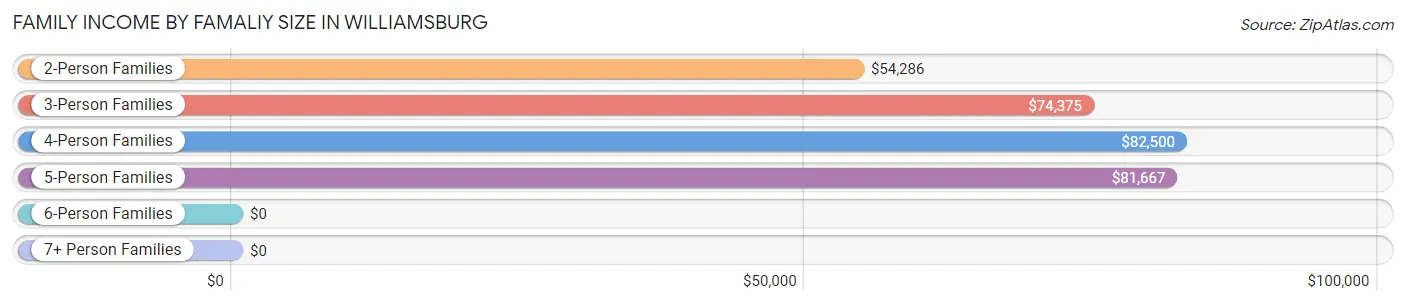
| Income Bracket | # Families | Median Income |
| 2-Person Families | 122 (58.1%) | $54,286 |
| 3-Person Families | 39 (18.6%) | $74,375 |
| 4-Person Families | 8 (3.8%) | $82,500 |
| 5-Person Families | 30 (14.3%) | $81,667 |
| 6-Person Families | 2 (0.9%) | $0 |
| 7+ Person Families | 9 (4.3%) | $0 |
| Total | 210 (100.0%) | $72,500 |
Family Income by Number of Earners in Williamsburg
The median family income in Williamsburg is $72,500, with families comprising 3+ earners (22) having the highest median family income of $125,278, while families with no earners (44) have the lowest median family income of $40,000, accounting for 10.5% and 20.9% of families, respectively.
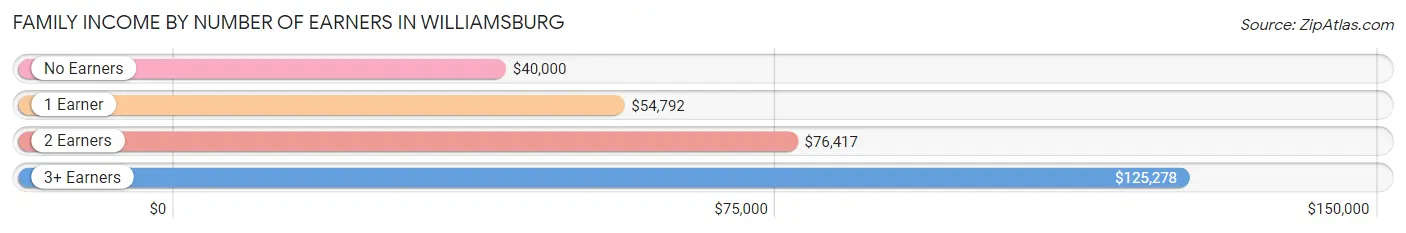
| Number of Earners | # Families | Median Income |
| No Earners | 44 (20.9%) | $40,000 |
| 1 Earner | 51 (24.3%) | $54,792 |
| 2 Earners | 93 (44.3%) | $76,417 |
| 3+ Earners | 22 (10.5%) | $125,278 |
| Total | 210 (100.0%) | $72,500 |
Household Income in Williamsburg
Household Income Brackets in Williamsburg
With 54 households falling in the category, the $75,000 to $99,999 income range is the most frequent in Williamsburg, accounting for 19.1% of all households. In contrast, only 3 households (1.1%) fall into the $200,000+ income bracket, making it the least populous group.
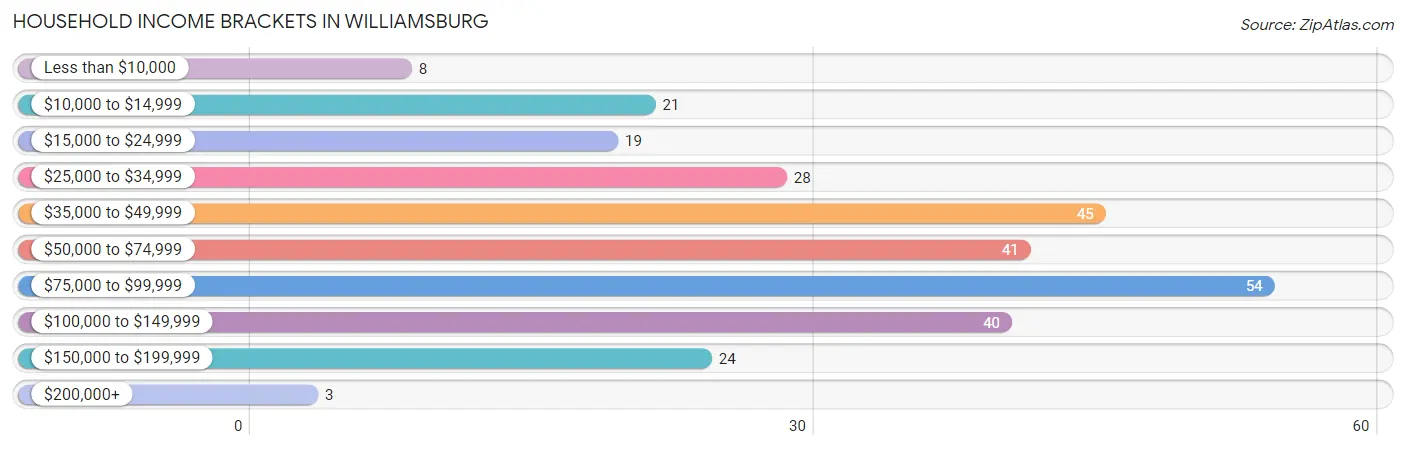
| Income Bracket | # Households | % Households |
| Less than $10,000 | 8 | 2.8% |
| $10,000 to $14,999 | 21 | 7.4% |
| $15,000 to $24,999 | 19 | 6.7% |
| $25,000 to $34,999 | 28 | 9.9% |
| $35,000 to $49,999 | 45 | 15.9% |
| $50,000 to $74,999 | 41 | 14.5% |
| $75,000 to $99,999 | 54 | 19.1% |
| $100,000 to $149,999 | 40 | 14.1% |
| $150,000 to $199,999 | 24 | 8.5% |
| $200,000+ | 3 | 1.1% |
Household Income by Householder Age in Williamsburg
The median household income in Williamsburg is $66,875, with the highest median household income of $76,667 found in the 25 to 44 years age bracket for the primary householder. A total of 58 households (20.5%) fall into this category. Meanwhile, the 15 to 24 years age bracket for the primary householder has the lowest median household income of $0, with 23 households (8.1%) in this group.
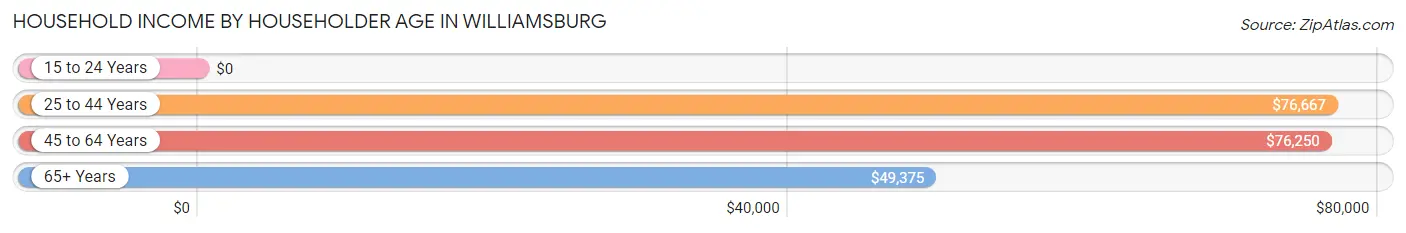
| Income Bracket | # Households | Median Income |
| 15 to 24 Years | 23 (8.1%) | $0 |
| 25 to 44 Years | 58 (20.5%) | $76,667 |
| 45 to 64 Years | 112 (39.6%) | $76,250 |
| 65+ Years | 90 (31.8%) | $49,375 |
| Total | 283 (100.0%) | $66,875 |
Poverty in Williamsburg
Income Below Poverty by Sex and Age in Williamsburg
With 16.1% poverty level for males and 9.3% for females among the residents of Williamsburg, 12 to 14 year old males and 45 to 54 year old females are the most vulnerable to poverty, with 9 males (47.4%) and 11 females (23.9%) in their respective age groups living below the poverty level.
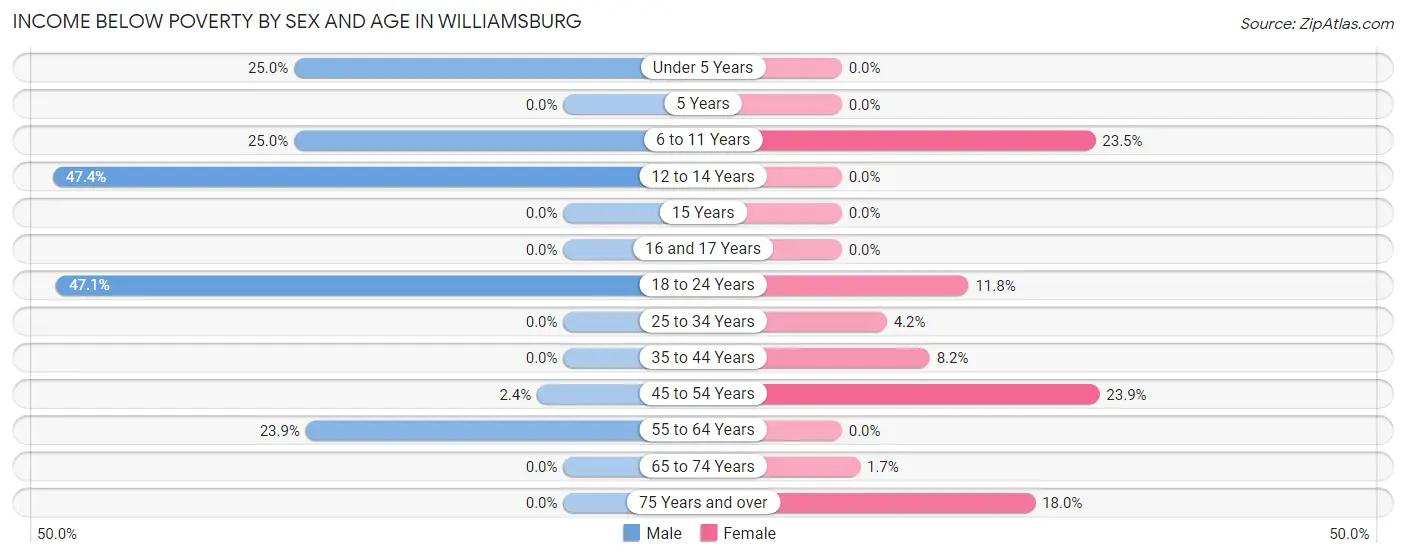
| Age Bracket | Male | Female |
| Under 5 Years | 9 (25.0%) | 0 (0.0%) |
| 5 Years | 0 (0.0%) | 0 (0.0%) |
| 6 to 11 Years | 5 (25.0%) | 4 (23.5%) |
| 12 to 14 Years | 9 (47.4%) | 0 (0.0%) |
| 15 Years | 0 (0.0%) | 0 (0.0%) |
| 16 and 17 Years | 0 (0.0%) | 0 (0.0%) |
| 18 to 24 Years | 40 (47.1%) | 4 (11.8%) |
| 25 to 34 Years | 0 (0.0%) | 1 (4.2%) |
| 35 to 44 Years | 0 (0.0%) | 4 (8.2%) |
| 45 to 54 Years | 1 (2.4%) | 11 (23.9%) |
| 55 to 64 Years | 11 (23.9%) | 0 (0.0%) |
| 65 to 74 Years | 0 (0.0%) | 1 (1.7%) |
| 75 Years and over | 0 (0.0%) | 7 (17.9%) |
| Total | 75 (16.1%) | 32 (9.3%) |
Income Above Poverty by Sex and Age in Williamsburg
According to the poverty statistics in Williamsburg, males aged 15 years and females aged under 5 years are the age groups that are most secure financially, with 100.0% of males and 100.0% of females in these age groups living above the poverty line.
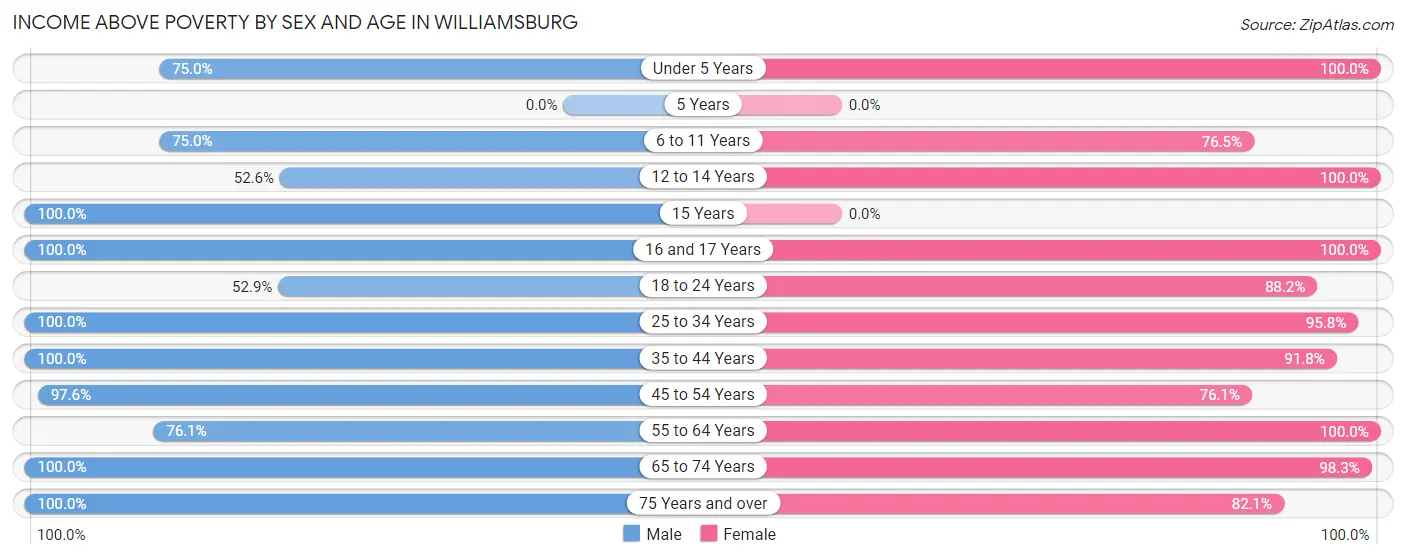
| Age Bracket | Male | Female |
| Under 5 Years | 27 (75.0%) | 3 (100.0%) |
| 5 Years | 0 (0.0%) | 0 (0.0%) |
| 6 to 11 Years | 15 (75.0%) | 13 (76.5%) |
| 12 to 14 Years | 10 (52.6%) | 2 (100.0%) |
| 15 Years | 10 (100.0%) | 0 (0.0%) |
| 16 and 17 Years | 27 (100.0%) | 4 (100.0%) |
| 18 to 24 Years | 45 (52.9%) | 30 (88.2%) |
| 25 to 34 Years | 73 (100.0%) | 23 (95.8%) |
| 35 to 44 Years | 39 (100.0%) | 45 (91.8%) |
| 45 to 54 Years | 40 (97.6%) | 35 (76.1%) |
| 55 to 64 Years | 35 (76.1%) | 68 (100.0%) |
| 65 to 74 Years | 53 (100.0%) | 58 (98.3%) |
| 75 Years and over | 16 (100.0%) | 32 (82.1%) |
| Total | 390 (83.9%) | 313 (90.7%) |
Income Below Poverty Among Married-Couple Families in Williamsburg
The poverty statistics for married-couple families in Williamsburg show that 2.8% or 4 of the total 143 families live below the poverty line. Families with 3 or 4 children have the highest poverty rate of 20.0%, comprising of 4 families. On the other hand, families with no children have the lowest poverty rate of 0.0%, which includes 0 families.
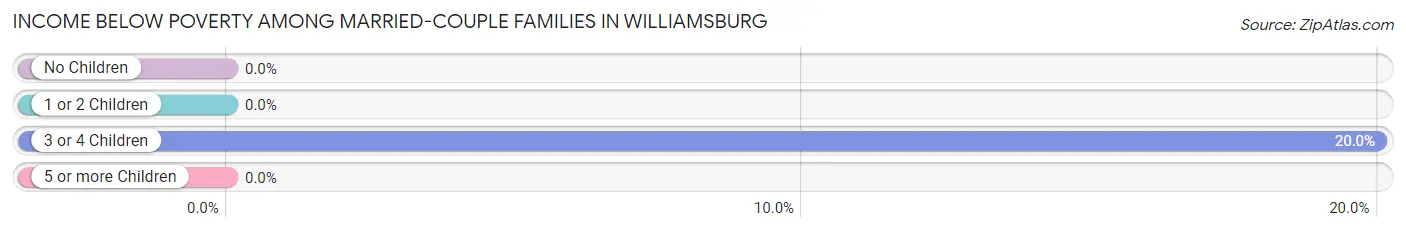
| Children | Above Poverty | Below Poverty |
| No Children | 98 (100.0%) | 0 (0.0%) |
| 1 or 2 Children | 25 (100.0%) | 0 (0.0%) |
| 3 or 4 Children | 16 (80.0%) | 4 (20.0%) |
| 5 or more Children | 0 (0.0%) | 0 (0.0%) |
| Total | 139 (97.2%) | 4 (2.8%) |
Income Below Poverty Among Single-Parent Households in Williamsburg
According to the poverty data in Williamsburg, 81.8% or 18 single-father households and 26.7% or 12 single-mother households are living below the poverty line. Among single-father households, those with no children have the highest poverty rate, with 18 households (90.0%) experiencing poverty. Likewise, among single-mother households, those with 1 or 2 children have the highest poverty rate, with 7 households (53.8%) falling below the poverty line.
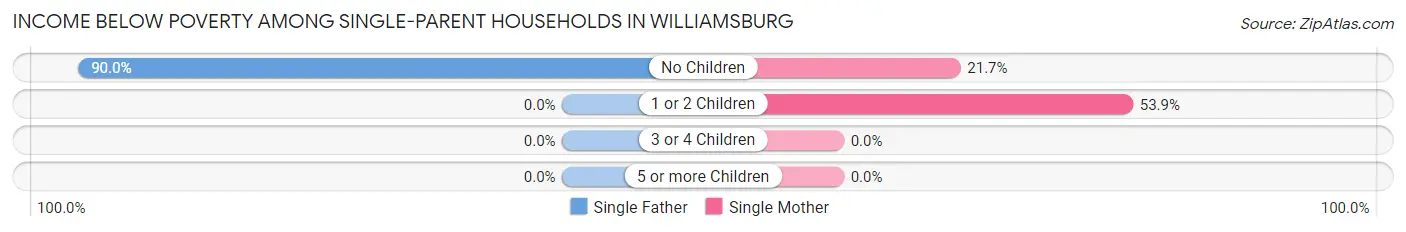
| Children | Single Father | Single Mother |
| No Children | 18 (90.0%) | 5 (21.7%) |
| 1 or 2 Children | 0 (0.0%) | 7 (53.8%) |
| 3 or 4 Children | 0 (0.0%) | 0 (0.0%) |
| 5 or more Children | 0 (0.0%) | 0 (0.0%) |
| Total | 18 (81.8%) | 12 (26.7%) |
Income Below Poverty Among Married-Couple vs Single-Parent Households in Williamsburg
The poverty data for Williamsburg shows that 4 of the married-couple family households (2.8%) and 30 of the single-parent households (44.8%) are living below the poverty level. Within the married-couple family households, those with 3 or 4 children have the highest poverty rate, with 4 households (20.0%) falling below the poverty line. Among the single-parent households, those with no children have the highest poverty rate, with 23 household (53.5%) living below poverty.
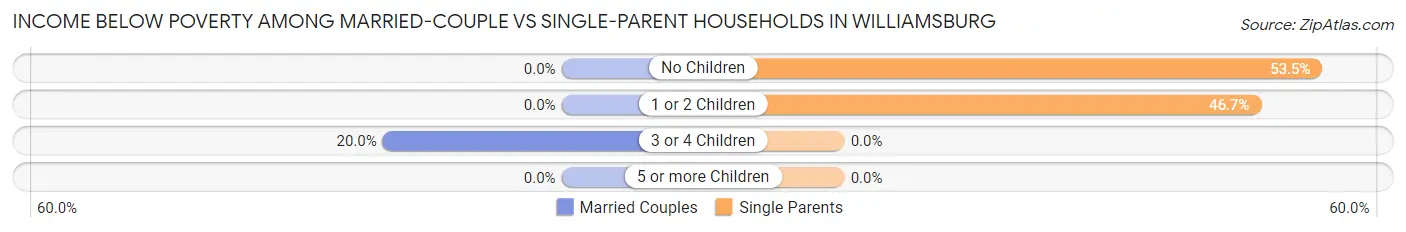
| Children | Married-Couple Families | Single-Parent Households |
| No Children | 0 (0.0%) | 23 (53.5%) |
| 1 or 2 Children | 0 (0.0%) | 7 (46.7%) |
| 3 or 4 Children | 4 (20.0%) | 0 (0.0%) |
| 5 or more Children | 0 (0.0%) | 0 (0.0%) |
| Total | 4 (2.8%) | 30 (44.8%) |
Race in Williamsburg
The most populous races in Williamsburg are White / Caucasian (784 | 96.8%), Hispanic or Latino (73 | 9.0%), and Two or more Races (16 | 2.0%).
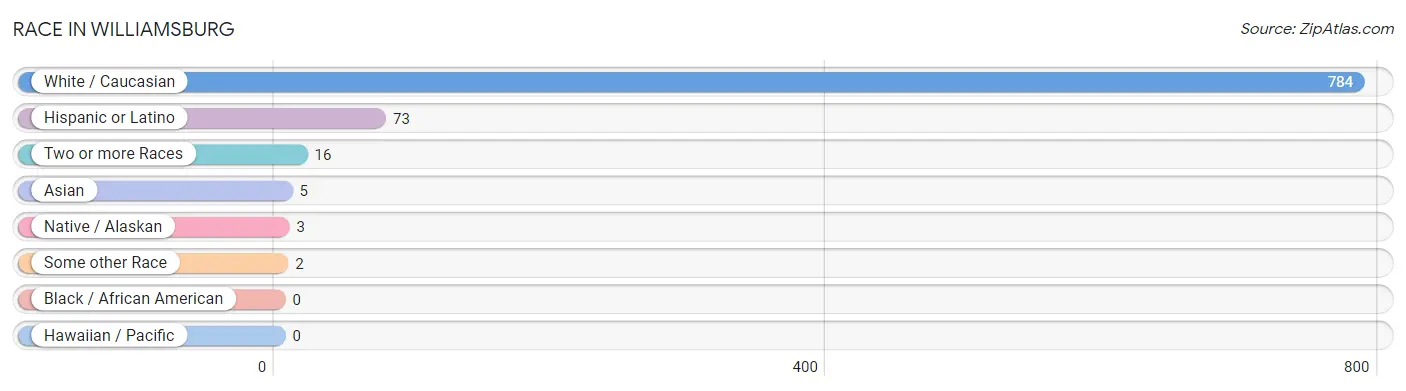
| Race | # Population | % Population |
| Asian | 5 | 0.6% |
| Black / African American | 0 | 0.0% |
| Hawaiian / Pacific | 0 | 0.0% |
| Hispanic or Latino | 73 | 9.0% |
| Native / Alaskan | 3 | 0.4% |
| White / Caucasian | 784 | 96.8% |
| Two or more Races | 16 | 2.0% |
| Some other Race | 2 | 0.3% |
| Total | 810 | 100.0% |
Ancestry in Williamsburg
The most populous ancestries reported in Williamsburg are German (287 | 35.4%), Irish (153 | 18.9%), English (55 | 6.8%), American (45 | 5.6%), and Spaniard (37 | 4.6%), together accounting for 71.2% of all Williamsburg residents.
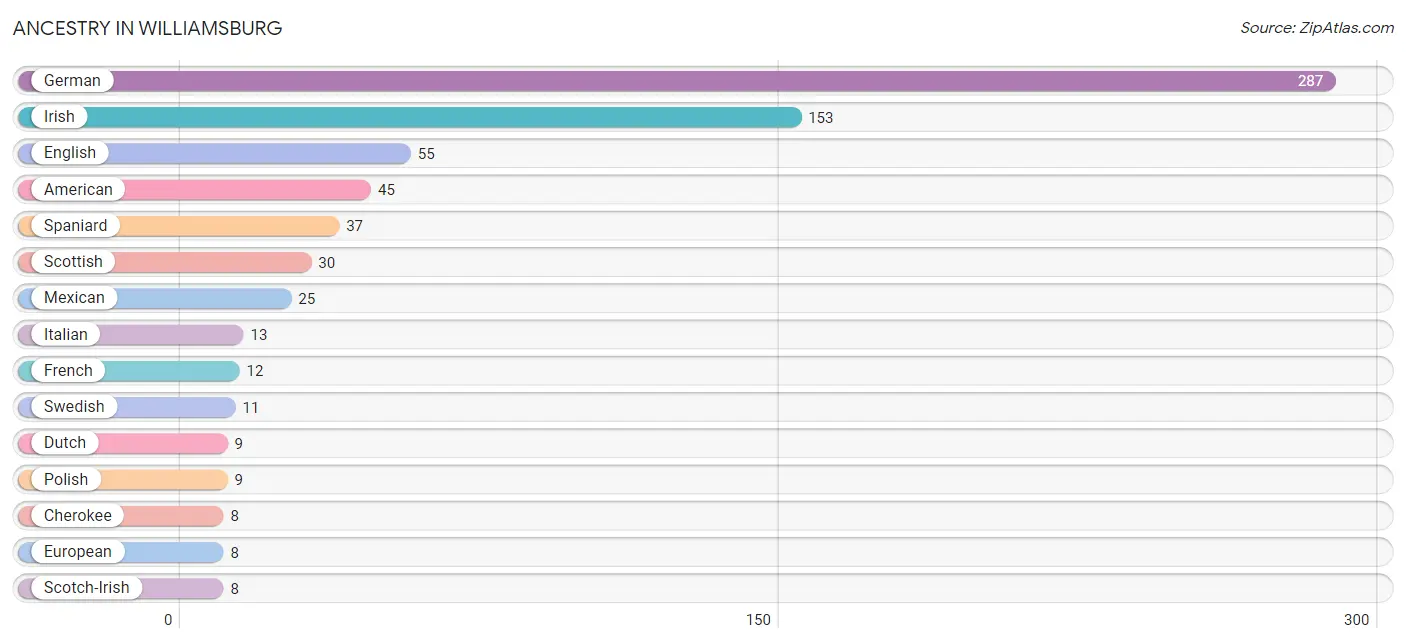
| Ancestry | # Population | % Population |
| American | 45 | 5.6% |
| Arab | 1 | 0.1% |
| Blackfeet | 1 | 0.1% |
| British | 2 | 0.3% |
| Burmese | 1 | 0.1% |
| Cherokee | 8 | 1.0% |
| Choctaw | 4 | 0.5% |
| Comanche | 3 | 0.4% |
| Dutch | 9 | 1.1% |
| Eastern European | 3 | 0.4% |
| English | 55 | 6.8% |
| European | 8 | 1.0% |
| French | 12 | 1.5% |
| German | 287 | 35.4% |
| Hungarian | 2 | 0.3% |
| Irish | 153 | 18.9% |
| Italian | 13 | 1.6% |
| Korean | 5 | 0.6% |
| Lebanese | 1 | 0.1% |
| Mexican | 25 | 3.1% |
| Northern European | 1 | 0.1% |
| Norwegian | 2 | 0.3% |
| Polish | 9 | 1.1% |
| Scotch-Irish | 8 | 1.0% |
| Scottish | 30 | 3.7% |
| Slavic | 4 | 0.5% |
| Slovene | 2 | 0.3% |
| Spaniard | 37 | 4.6% |
| Spanish | 6 | 0.7% |
| Spanish American | 3 | 0.4% |
| Swedish | 11 | 1.4% |
| Ute | 1 | 0.1% | View All 32 Rows |
Immigrants in Williamsburg
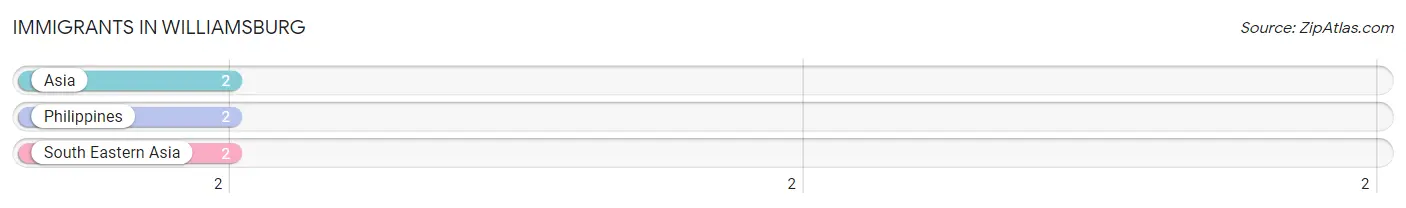
The most numerous immigrant groups reported in Williamsburg came from Asia (2 | 0.3%), Philippines (2 | 0.3%), and South Eastern Asia (2 | 0.3%), together accounting for 0.7% of all Williamsburg residents.
| Immigration Origin | # Population | % Population |
| Asia | 2 | 0.3% |
| Philippines | 2 | 0.3% |
| South Eastern Asia | 2 | 0.3% | View All 3 Rows |
Sex and Age in Williamsburg
Sex and Age in Williamsburg
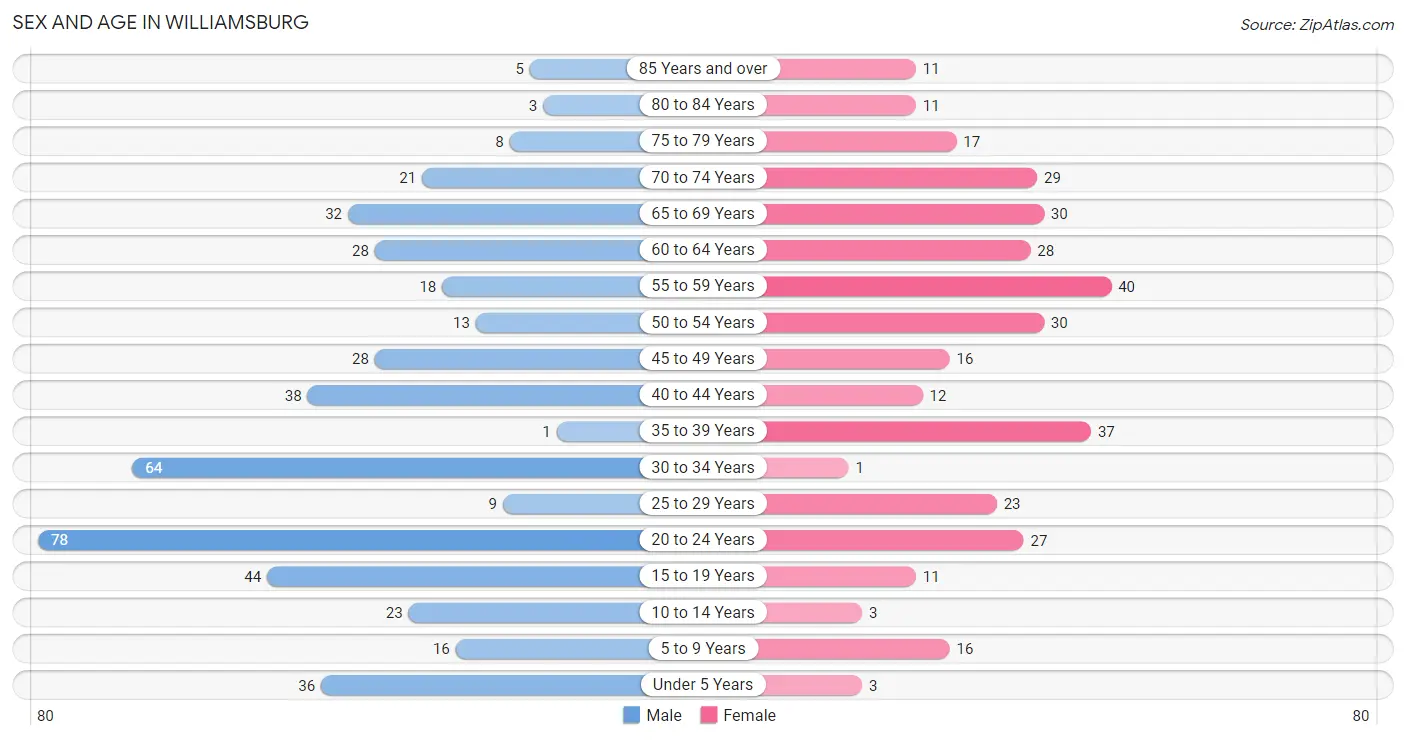
The most populous age groups in Williamsburg are 20 to 24 Years (78 | 16.8%) for men and 55 to 59 Years (40 | 11.6%) for women.
| Age Bracket | Male | Female |
| Under 5 Years | 36 (7.7%) | 3 (0.9%) |
| 5 to 9 Years | 16 (3.4%) | 16 (4.6%) |
| 10 to 14 Years | 23 (5.0%) | 3 (0.9%) |
| 15 to 19 Years | 44 (9.5%) | 11 (3.2%) |
| 20 to 24 Years | 78 (16.8%) | 27 (7.8%) |
| 25 to 29 Years | 9 (1.9%) | 23 (6.7%) |
| 30 to 34 Years | 64 (13.8%) | 1 (0.3%) |
| 35 to 39 Years | 1 (0.2%) | 37 (10.7%) |
| 40 to 44 Years | 38 (8.2%) | 12 (3.5%) |
| 45 to 49 Years | 28 (6.0%) | 16 (4.6%) |
| 50 to 54 Years | 13 (2.8%) | 30 (8.7%) |
| 55 to 59 Years | 18 (3.9%) | 40 (11.6%) |
| 60 to 64 Years | 28 (6.0%) | 28 (8.1%) |
| 65 to 69 Years | 32 (6.9%) | 30 (8.7%) |
| 70 to 74 Years | 21 (4.5%) | 29 (8.4%) |
| 75 to 79 Years | 8 (1.7%) | 17 (4.9%) |
| 80 to 84 Years | 3 (0.6%) | 11 (3.2%) |
| 85 Years and over | 5 (1.1%) | 11 (3.2%) |
| Total | 465 (100.0%) | 345 (100.0%) |
Families and Households in Williamsburg
Median Family Size in Williamsburg
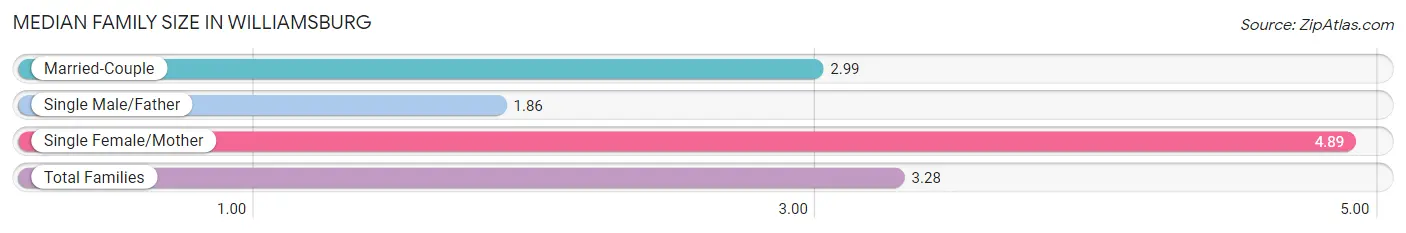
The median family size in Williamsburg is 3.28 persons per family, with single female/mother families (45 | 21.4%) accounting for the largest median family size of 4.89 persons per family. On the other hand, single male/father families (22 | 10.5%) represent the smallest median family size with 1.86 persons per family.
| Family Type | # Families | Family Size |
| Married-Couple | 143 (68.1%) | 2.99 |
| Single Male/Father | 22 (10.5%) | 1.86 |
| Single Female/Mother | 45 (21.4%) | 4.89 |
| Total Families | 210 (100.0%) | 3.28 |
Median Household Size in Williamsburg
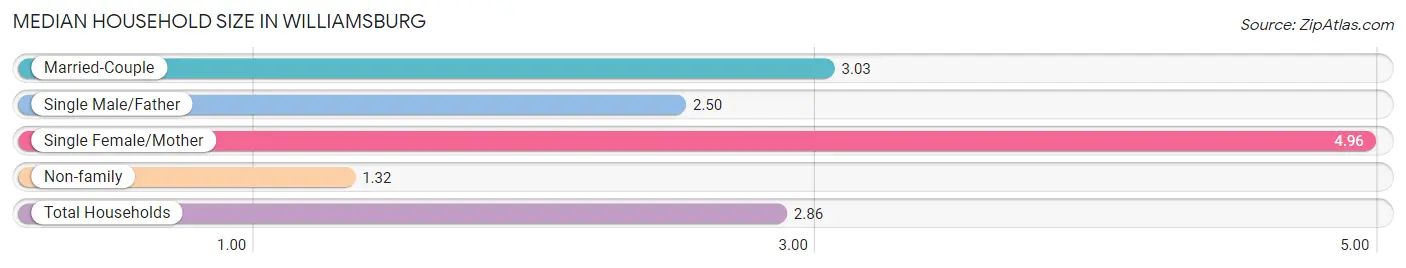
The median household size in Williamsburg is 2.86 persons per household, with single female/mother households (45 | 15.9%) accounting for the largest median household size of 4.96 persons per household. non-family households (73 | 25.8%) represent the smallest median household size with 1.32 persons per household.
| Household Type | # Households | Household Size |
| Married-Couple | 143 (50.5%) | 3.03 |
| Single Male/Father | 22 (7.8%) | 2.50 |
| Single Female/Mother | 45 (15.9%) | 4.96 |
| Non-family | 73 (25.8%) | 1.32 |
| Total Households | 283 (100.0%) | 2.86 |
Household Size by Marriage Status in Williamsburg
Out of a total of 283 households in Williamsburg, 210 (74.2%) are family households, while 73 (25.8%) are nonfamily households. The most numerous type of family households are 2-person households, comprising 97, and the most common type of nonfamily households are 1-person households, comprising 56.
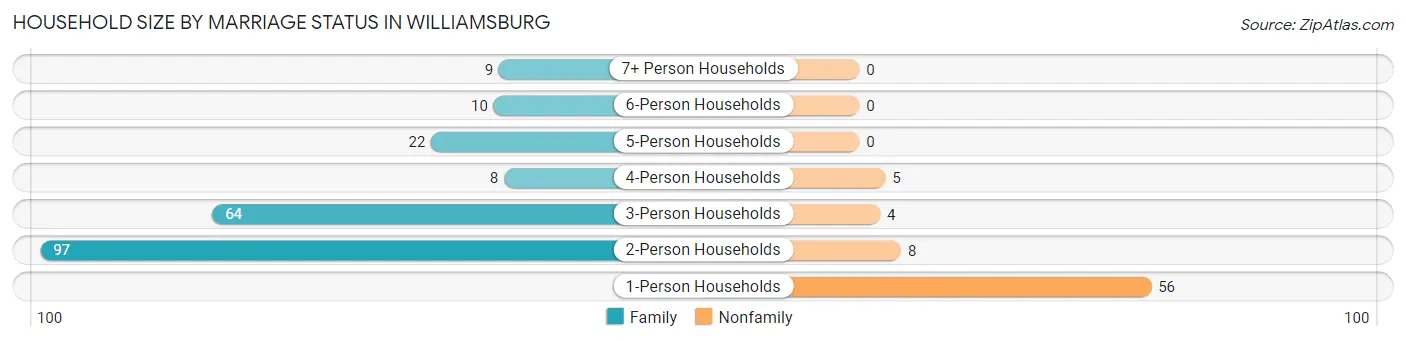
| Household Size | Family Households | Nonfamily Households |
| 1-Person Households | - | 56 (19.8%) |
| 2-Person Households | 97 (34.3%) | 8 (2.8%) |
| 3-Person Households | 64 (22.6%) | 4 (1.4%) |
| 4-Person Households | 8 (2.8%) | 5 (1.8%) |
| 5-Person Households | 22 (7.8%) | 0 (0.0%) |
| 6-Person Households | 10 (3.5%) | 0 (0.0%) |
| 7+ Person Households | 9 (3.2%) | 0 (0.0%) |
| Total | 210 (74.2%) | 73 (25.8%) |
Female Fertility in Williamsburg
Fertility by Age in Williamsburg
Average fertility rate in Williamsburg is 39.0 births per 1,000 women. Women in the age bracket of 35 to 50 years have the highest fertility rate with 46.0 births per 1,000 women. Women in the age bracket of 35 to 50 years acount for 60.0% of all women with births.
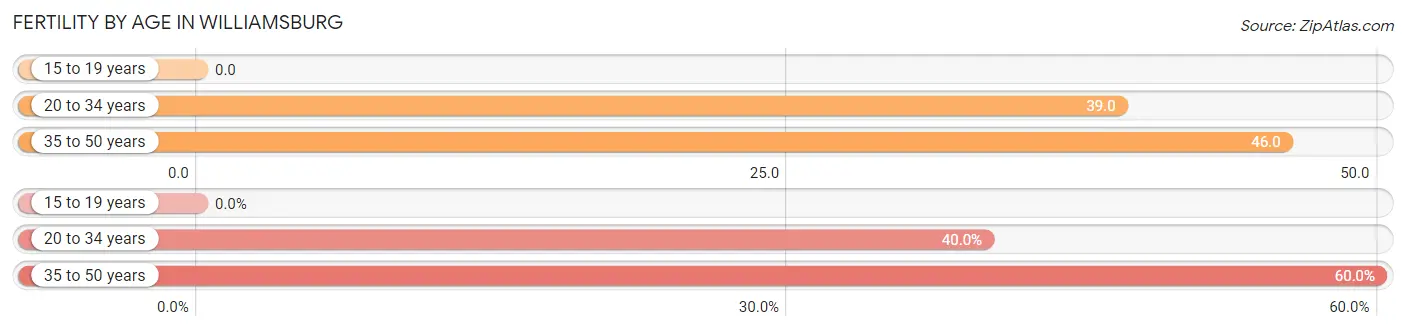
| Age Bracket | Women with Births | Births / 1,000 Women |
| 15 to 19 years | 0 (0.0%) | 0.0 |
| 20 to 34 years | 2 (40.0%) | 39.0 |
| 35 to 50 years | 3 (60.0%) | 46.0 |
| Total | 5 (100.0%) | 39.0 |
Fertility by Age by Marriage Status in Williamsburg
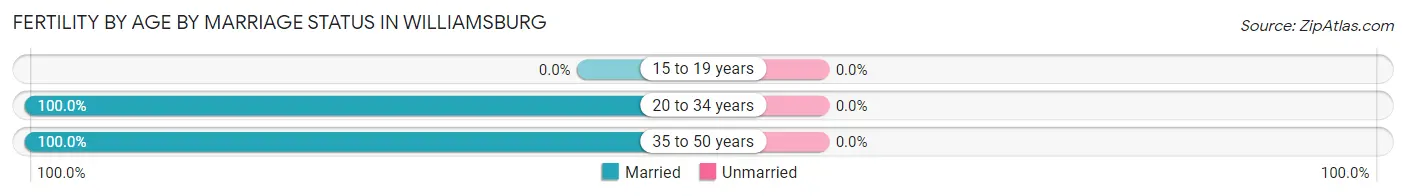
| Age Bracket | Married | Unmarried |
| 15 to 19 years | 0 (0.0%) | 0 (0.0%) |
| 20 to 34 years | 2 (100.0%) | 0 (0.0%) |
| 35 to 50 years | 3 (100.0%) | 0 (0.0%) |
| Total | 5 (100.0%) | 0 (0.0%) |
Fertility by Education in Williamsburg
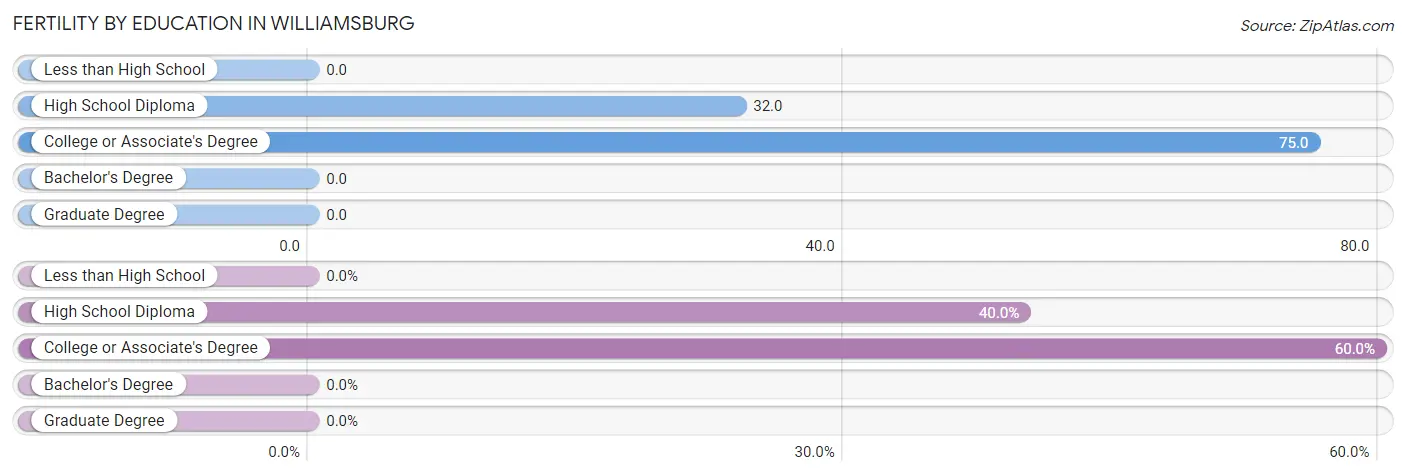
| Educational Attainment | Women with Births | Births / 1,000 Women |
| Less than High School | 0 (0.0%) | 0.0 |
| High School Diploma | 2 (40.0%) | 32.0 |
| College or Associate's Degree | 3 (60.0%) | 75.0 |
| Bachelor's Degree | 0 (0.0%) | 0.0 |
| Graduate Degree | 0 (0.0%) | 0.0 |
| Total | 5 (100.0%) | 39.0 |
Fertility by Education by Marriage Status in Williamsburg
| Educational Attainment | Married | Unmarried |
| Less than High School | 0 (0.0%) | 0 (0.0%) |
| High School Diploma | 2 (100.0%) | 0 (0.0%) |
| College or Associate's Degree | 3 (100.0%) | 0 (0.0%) |
| Bachelor's Degree | 0 (0.0%) | 0 (0.0%) |
| Graduate Degree | 0 (0.0%) | 0 (0.0%) |
| Total | 5 (100.0%) | 0 (0.0%) |
Employment Characteristics in Williamsburg
Employment by Class of Employer in Williamsburg
Among the 358 employed individuals in Williamsburg, private company employees (257 | 71.8%), state government employees (40 | 11.2%), and federal government employees (36 | 10.1%) make up the most common classes of employment.
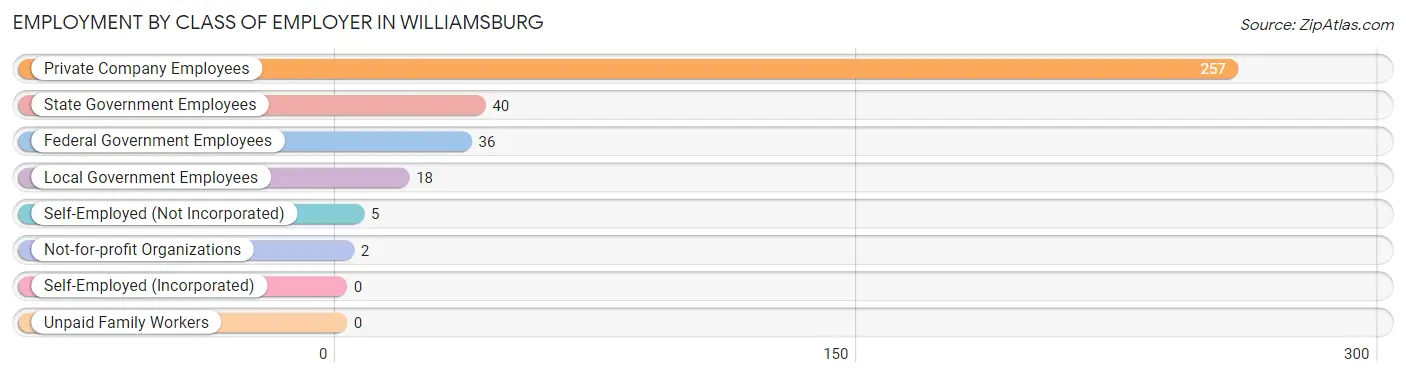
| Employer Class | # Employees | % Employees |
| Private Company Employees | 257 | 71.8% |
| Self-Employed (Incorporated) | 0 | 0.0% |
| Self-Employed (Not Incorporated) | 5 | 1.4% |
| Not-for-profit Organizations | 2 | 0.6% |
| Local Government Employees | 18 | 5.0% |
| State Government Employees | 40 | 11.2% |
| Federal Government Employees | 36 | 10.1% |
| Unpaid Family Workers | 0 | 0.0% |
| Total | 358 | 100.0% |
Employment Status by Age in Williamsburg
According to the labor force statistics for Williamsburg, out of the total population over 16 years of age (703), 53.2% or 374 individuals are in the labor force, with 4.3% or 16 of them unemployed. The age group with the highest labor force participation rate is 25 to 29 years, with 100.0% or 32 individuals in the labor force. Within the labor force, the 16 to 19 years age range has the highest percentage of unemployed individuals, with 57.1% or 8 of them being unemployed.
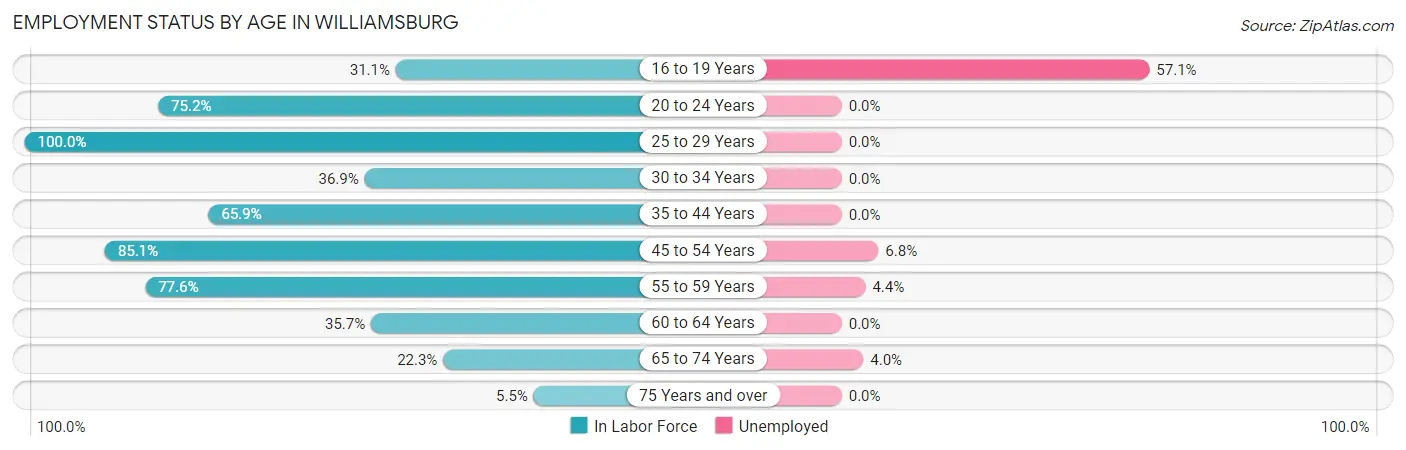
| Age Bracket | In Labor Force | Unemployed |
| 16 to 19 Years | 14 (31.1%) | 8 (57.1%) |
| 20 to 24 Years | 79 (75.2%) | 0 (0.0%) |
| 25 to 29 Years | 32 (100.0%) | 0 (0.0%) |
| 30 to 34 Years | 24 (36.9%) | 0 (0.0%) |
| 35 to 44 Years | 58 (65.9%) | 0 (0.0%) |
| 45 to 54 Years | 74 (85.1%) | 5 (6.8%) |
| 55 to 59 Years | 45 (77.6%) | 2 (4.4%) |
| 60 to 64 Years | 20 (35.7%) | 0 (0.0%) |
| 65 to 74 Years | 25 (22.3%) | 1 (4.0%) |
| 75 Years and over | 3 (5.5%) | 0 (0.0%) |
| Total | 374 (53.2%) | 16 (4.3%) |
Employment Status by Educational Attainment in Williamsburg
According to labor force statistics for Williamsburg, 65.5% of individuals (253) out of the total population between 25 and 64 years of age (386) are in the labor force, with 2.8% or 7 of them being unemployed. The group with the highest labor force participation rate are those with the educational attainment of less than high school, with 80.4% or 37 individuals in the labor force. Within the labor force, individuals with less than high school education have the highest percentage of unemployment, with 10.8% or 4 of them being unemployed.
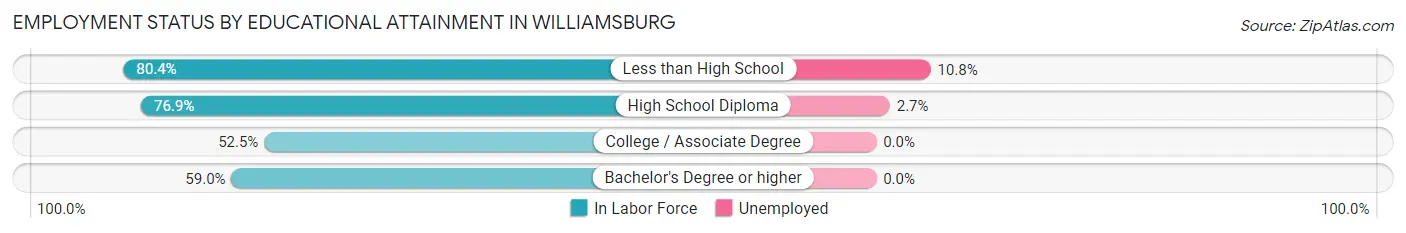
| Educational Attainment | In Labor Force | Unemployed |
| Less than High School | 37 (80.4%) | 5 (10.8%) |
| High School Diploma | 110 (76.9%) | 4 (2.7%) |
| College / Associate Degree | 83 (52.5%) | 0 (0.0%) |
| Bachelor's Degree or higher | 23 (59.0%) | 0 (0.0%) |
| Total | 253 (65.5%) | 11 (2.8%) |
Employment Occupations by Sex in Williamsburg
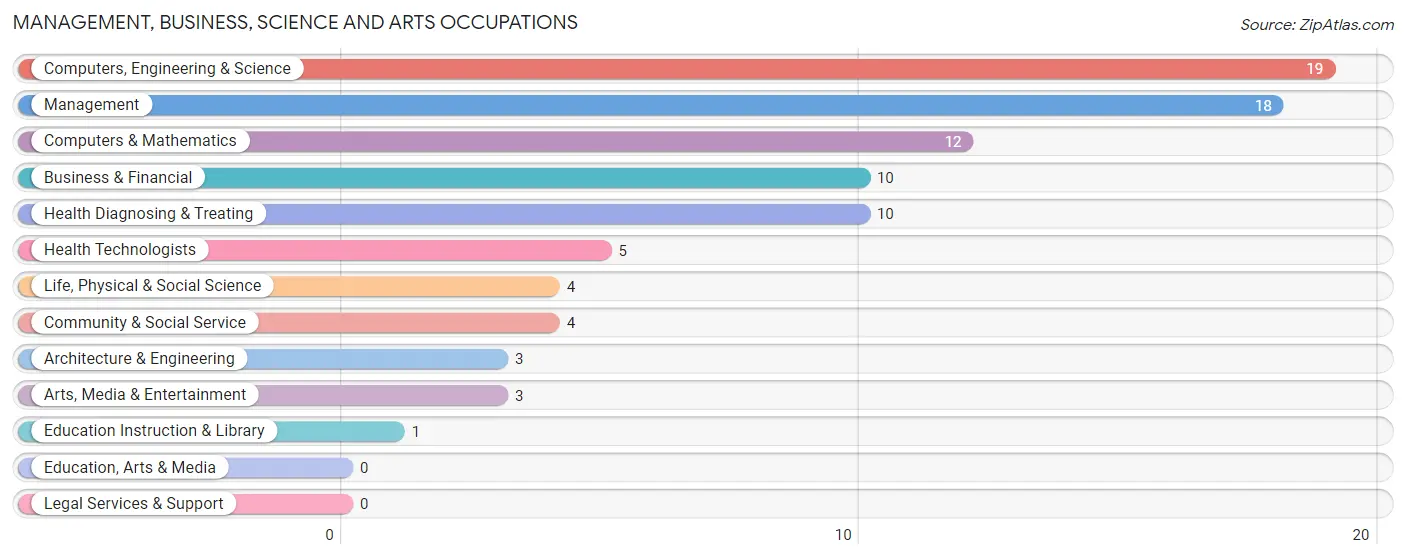
Management, Business, Science and Arts Occupations
The most common Management, Business, Science and Arts occupations in Williamsburg are Computers, Engineering & Science (19 | 5.4%), Management (18 | 5.1%), Computers & Mathematics (12 | 3.4%), Business & Financial (10 | 2.8%), and Health Diagnosing & Treating (10 | 2.8%).
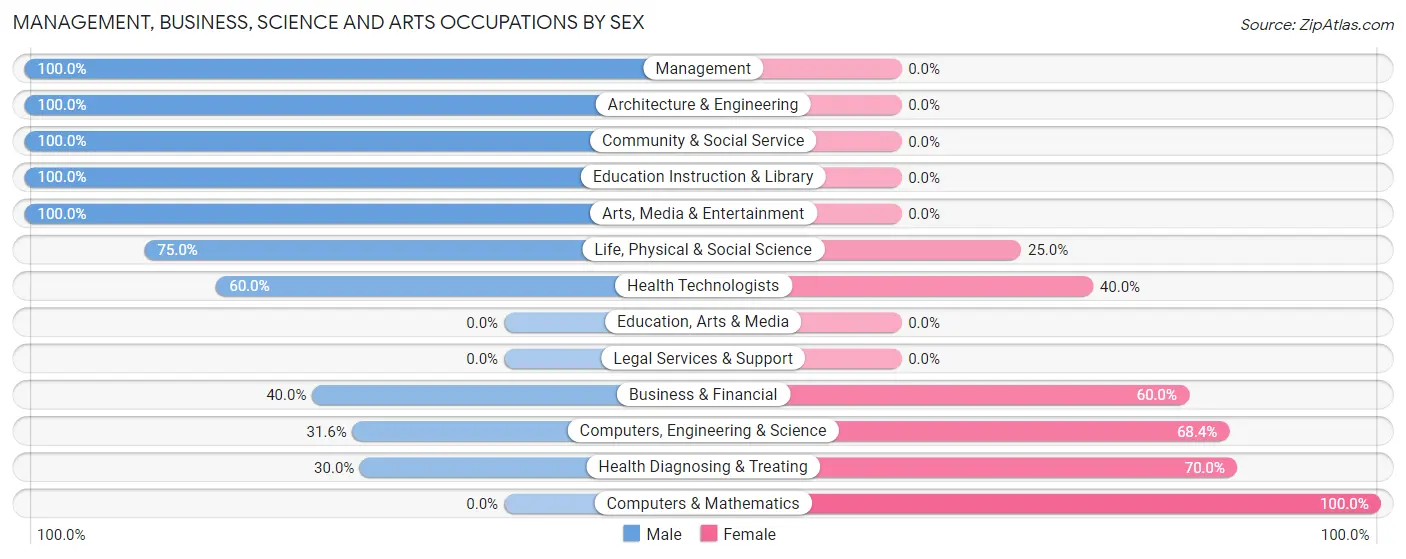
Management, Business, Science and Arts Occupations by Sex
Within the Management, Business, Science and Arts occupations in Williamsburg, the most male-oriented occupations are Management (100.0%), Architecture & Engineering (100.0%), and Community & Social Service (100.0%), while the most female-oriented occupations are Computers & Mathematics (100.0%), Health Diagnosing & Treating (70.0%), and Computers, Engineering & Science (68.4%).
| Occupation | Male | Female |
| Management | 18 (100.0%) | 0 (0.0%) |
| Business & Financial | 4 (40.0%) | 6 (60.0%) |
| Computers, Engineering & Science | 6 (31.6%) | 13 (68.4%) |
| Computers & Mathematics | 0 (0.0%) | 12 (100.0%) |
| Architecture & Engineering | 3 (100.0%) | 0 (0.0%) |
| Life, Physical & Social Science | 3 (75.0%) | 1 (25.0%) |
| Community & Social Service | 4 (100.0%) | 0 (0.0%) |
| Education, Arts & Media | 0 (0.0%) | 0 (0.0%) |
| Legal Services & Support | 0 (0.0%) | 0 (0.0%) |
| Education Instruction & Library | 1 (100.0%) | 0 (0.0%) |
| Arts, Media & Entertainment | 3 (100.0%) | 0 (0.0%) |
| Health Diagnosing & Treating | 3 (30.0%) | 7 (70.0%) |
| Health Technologists | 3 (60.0%) | 2 (40.0%) |
| Total (Category) | 35 (57.4%) | 26 (42.6%) |
| Total (Overall) | 199 (56.4%) | 154 (43.6%) |
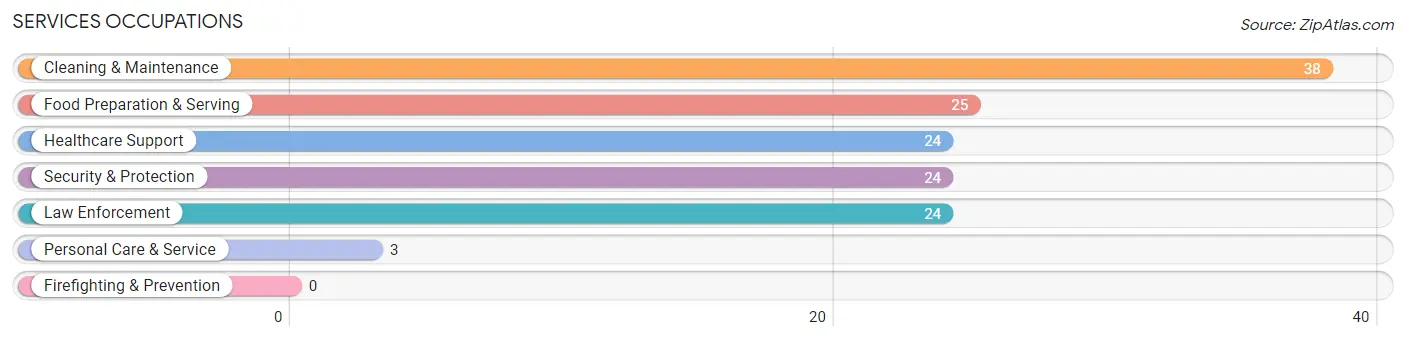
Services Occupations
The most common Services occupations in Williamsburg are Cleaning & Maintenance (38 | 10.8%), Food Preparation & Serving (25 | 7.1%), Healthcare Support (24 | 6.8%), Security & Protection (24 | 6.8%), and Law Enforcement (24 | 6.8%).
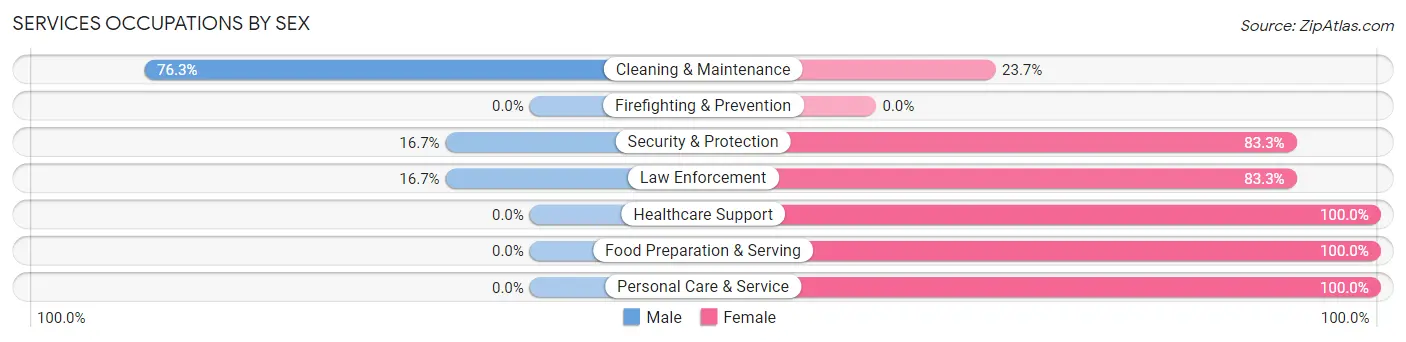
Services Occupations by Sex
Within the Services occupations in Williamsburg, the most male-oriented occupations are Cleaning & Maintenance (76.3%), Security & Protection (16.7%), and Law Enforcement (16.7%), while the most female-oriented occupations are Healthcare Support (100.0%), Food Preparation & Serving (100.0%), and Personal Care & Service (100.0%).
| Occupation | Male | Female |
| Healthcare Support | 0 (0.0%) | 24 (100.0%) |
| Security & Protection | 4 (16.7%) | 20 (83.3%) |
| Firefighting & Prevention | 0 (0.0%) | 0 (0.0%) |
| Law Enforcement | 4 (16.7%) | 20 (83.3%) |
| Food Preparation & Serving | 0 (0.0%) | 25 (100.0%) |
| Cleaning & Maintenance | 29 (76.3%) | 9 (23.7%) |
| Personal Care & Service | 0 (0.0%) | 3 (100.0%) |
| Total (Category) | 33 (28.9%) | 81 (71.1%) |
| Total (Overall) | 199 (56.4%) | 154 (43.6%) |
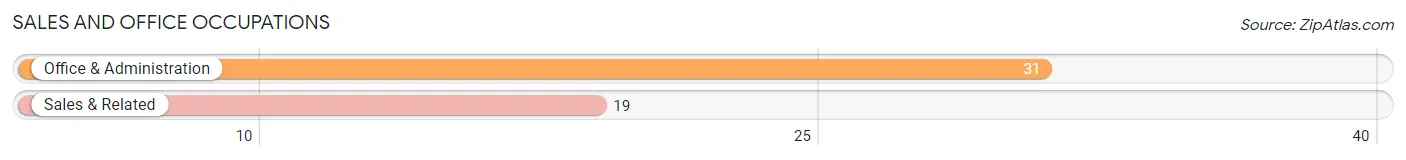
Sales and Office Occupations
The most common Sales and Office occupations in Williamsburg are Office & Administration (31 | 8.8%), and Sales & Related (19 | 5.4%).
Sales and Office Occupations by Sex
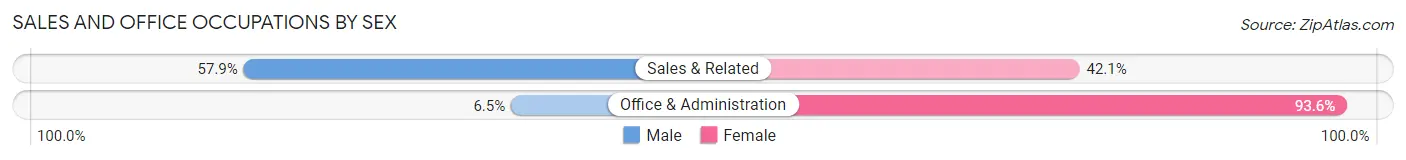
| Occupation | Male | Female |
| Sales & Related | 11 (57.9%) | 8 (42.1%) |
| Office & Administration | 2 (6.5%) | 29 (93.5%) |
| Total (Category) | 13 (26.0%) | 37 (74.0%) |
| Total (Overall) | 199 (56.4%) | 154 (43.6%) |
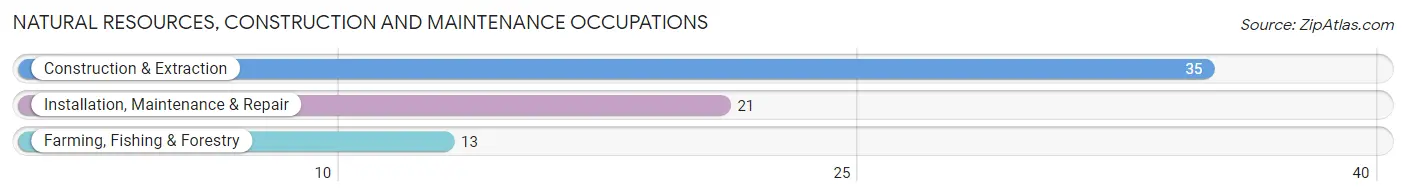
Natural Resources, Construction and Maintenance Occupations
The most common Natural Resources, Construction and Maintenance occupations in Williamsburg are Construction & Extraction (35 | 9.9%), Installation, Maintenance & Repair (21 | 5.9%), and Farming, Fishing & Forestry (13 | 3.7%).
Natural Resources, Construction and Maintenance Occupations by Sex
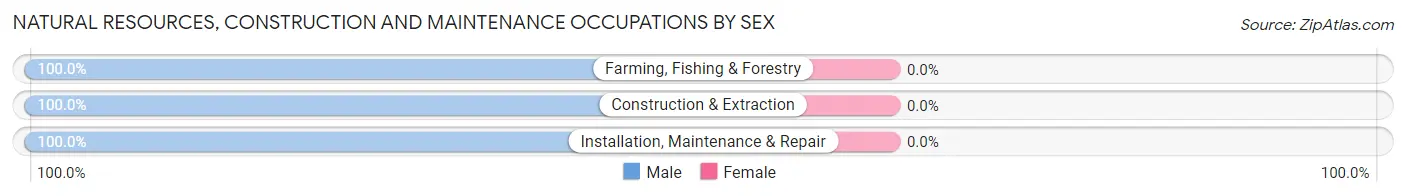
| Occupation | Male | Female |
| Farming, Fishing & Forestry | 13 (100.0%) | 0 (0.0%) |
| Construction & Extraction | 35 (100.0%) | 0 (0.0%) |
| Installation, Maintenance & Repair | 21 (100.0%) | 0 (0.0%) |
| Total (Category) | 69 (100.0%) | 0 (0.0%) |
| Total (Overall) | 199 (56.4%) | 154 (43.6%) |
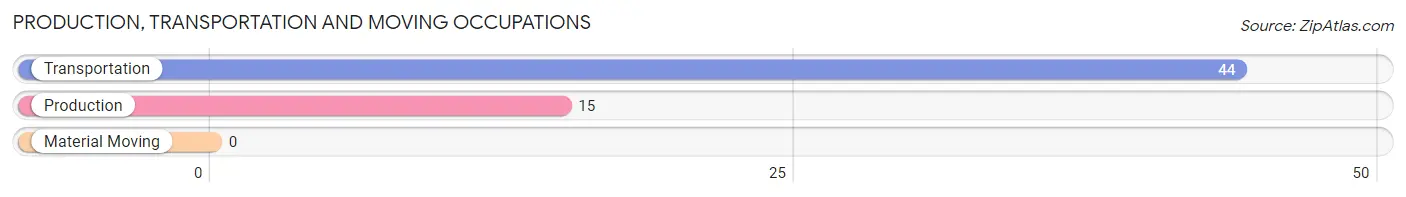
Production, Transportation and Moving Occupations
The most common Production, Transportation and Moving occupations in Williamsburg are Transportation (44 | 12.5%), and Production (15 | 4.3%).
Production, Transportation and Moving Occupations by Sex
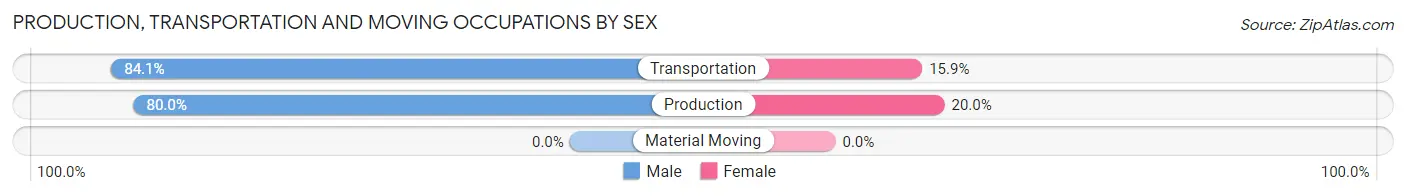
| Occupation | Male | Female |
| Production | 12 (80.0%) | 3 (20.0%) |
| Transportation | 37 (84.1%) | 7 (15.9%) |
| Material Moving | 0 (0.0%) | 0 (0.0%) |
| Total (Category) | 49 (83.1%) | 10 (17.0%) |
| Total (Overall) | 199 (56.4%) | 154 (43.6%) |
Employment Industries by Sex in Williamsburg
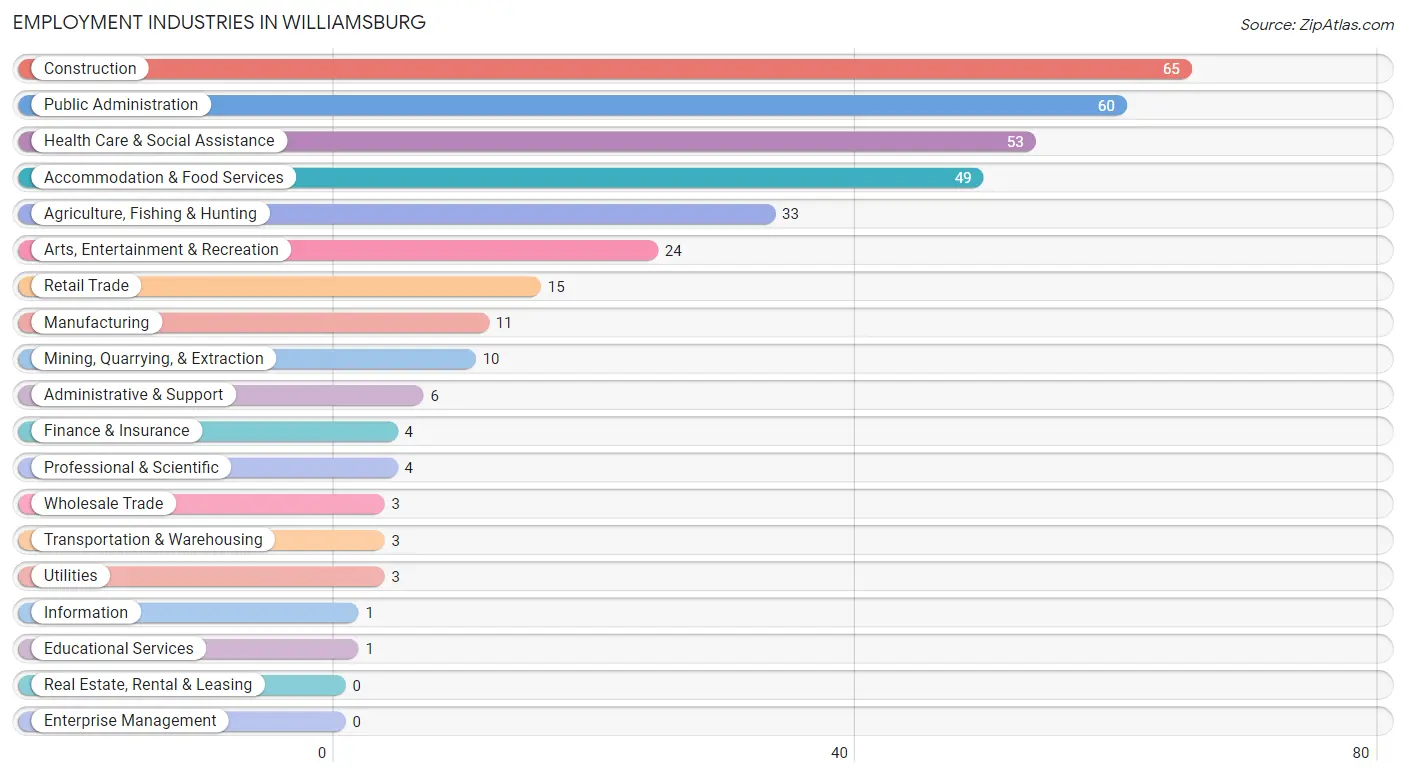
Employment Industries in Williamsburg
The major employment industries in Williamsburg include Construction (65 | 18.4%), Public Administration (60 | 17.0%), Health Care & Social Assistance (53 | 15.0%), Accommodation & Food Services (49 | 13.9%), and Agriculture, Fishing & Hunting (33 | 9.3%).
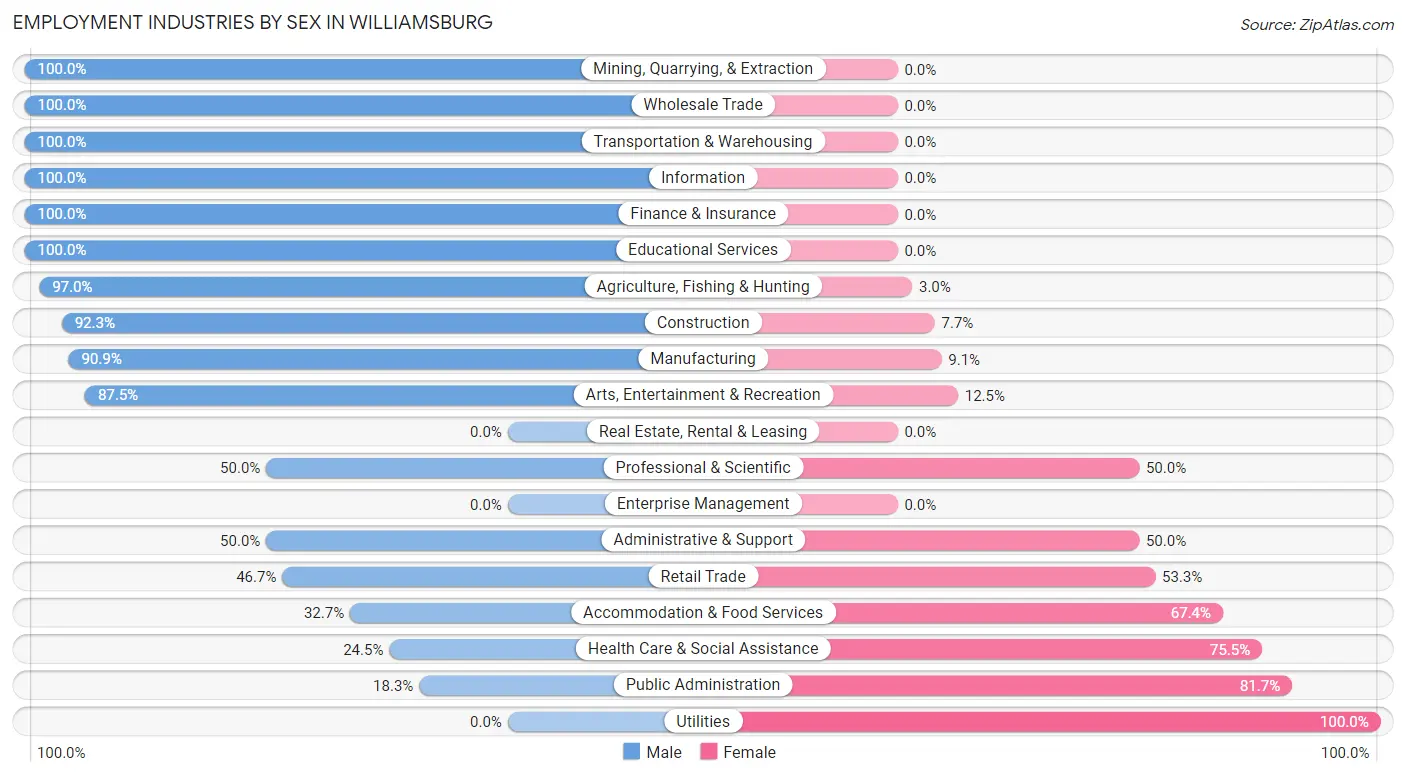
Employment Industries by Sex in Williamsburg
The Williamsburg industries that see more men than women are Mining, Quarrying, & Extraction (100.0%), Wholesale Trade (100.0%), and Transportation & Warehousing (100.0%), whereas the industries that tend to have a higher number of women are Utilities (100.0%), Public Administration (81.7%), and Health Care & Social Assistance (75.5%).
| Industry | Male | Female |
| Agriculture, Fishing & Hunting | 32 (97.0%) | 1 (3.0%) |
| Mining, Quarrying, & Extraction | 10 (100.0%) | 0 (0.0%) |
| Construction | 60 (92.3%) | 5 (7.7%) |
| Manufacturing | 10 (90.9%) | 1 (9.1%) |
| Wholesale Trade | 3 (100.0%) | 0 (0.0%) |
| Retail Trade | 7 (46.7%) | 8 (53.3%) |
| Transportation & Warehousing | 3 (100.0%) | 0 (0.0%) |
| Utilities | 0 (0.0%) | 3 (100.0%) |
| Information | 1 (100.0%) | 0 (0.0%) |
| Finance & Insurance | 4 (100.0%) | 0 (0.0%) |
| Real Estate, Rental & Leasing | 0 (0.0%) | 0 (0.0%) |
| Professional & Scientific | 2 (50.0%) | 2 (50.0%) |
| Enterprise Management | 0 (0.0%) | 0 (0.0%) |
| Administrative & Support | 3 (50.0%) | 3 (50.0%) |
| Educational Services | 1 (100.0%) | 0 (0.0%) |
| Health Care & Social Assistance | 13 (24.5%) | 40 (75.5%) |
| Arts, Entertainment & Recreation | 21 (87.5%) | 3 (12.5%) |
| Accommodation & Food Services | 16 (32.7%) | 33 (67.3%) |
| Public Administration | 11 (18.3%) | 49 (81.7%) |
| Total | 199 (56.4%) | 154 (43.6%) |
Education in Williamsburg
School Enrollment in Williamsburg
The most common levels of schooling among the 135 students in Williamsburg are high school (49 | 36.3%), elementary school (32 | 23.7%), and middle school (22 | 16.3%).
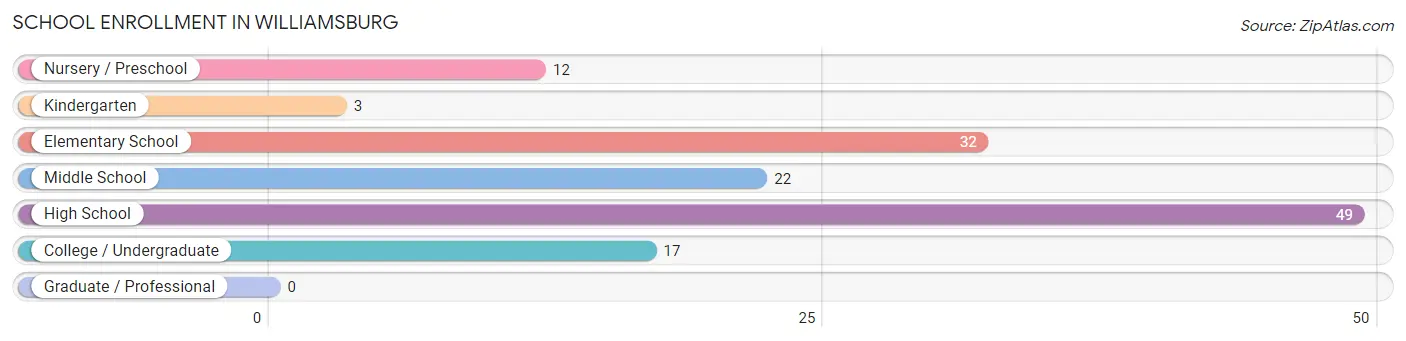
| School Level | # Students | % Students |
| Nursery / Preschool | 12 | 8.9% |
| Kindergarten | 3 | 2.2% |
| Elementary School | 32 | 23.7% |
| Middle School | 22 | 16.3% |
| High School | 49 | 36.3% |
| College / Undergraduate | 17 | 12.6% |
| Graduate / Professional | 0 | 0.0% |
| Total | 135 | 100.0% |
School Enrollment by Age by Funding Source in Williamsburg
Out of a total of 135 students who are enrolled in schools in Williamsburg, 7 (5.2%) attend a private institution, while the remaining 128 (94.8%) are enrolled in public schools. The age group of 10 to 14 year olds has the highest likelihood of being enrolled in private schools, with 7 (26.9% in the age bracket) enrolled. Conversely, the age group of 3 to 4 year olds has the lowest likelihood of being enrolled in a private school, with 15 (100.0% in the age bracket) attending a public institution.
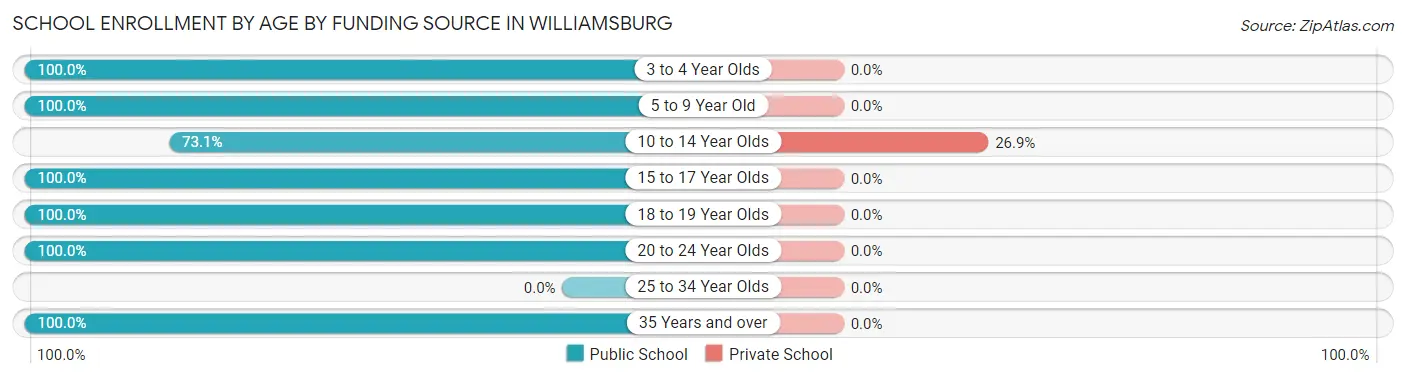
| Age Bracket | Public School | Private School |
| 3 to 4 Year Olds | 15 (100.0%) | 0 (0.0%) |
| 5 to 9 Year Old | 32 (100.0%) | 0 (0.0%) |
| 10 to 14 Year Olds | 19 (73.1%) | 7 (26.9%) |
| 15 to 17 Year Olds | 41 (100.0%) | 0 (0.0%) |
| 18 to 19 Year Olds | 14 (100.0%) | 0 (0.0%) |
| 20 to 24 Year Olds | 5 (100.0%) | 0 (0.0%) |
| 25 to 34 Year Olds | 0 (0.0%) | 0 (0.0%) |
| 35 Years and over | 2 (100.0%) | 0 (0.0%) |
| Total | 128 (94.8%) | 7 (5.2%) |
Educational Attainment by Field of Study in Williamsburg
Arts & humanities (20 | 30.8%), education (9 | 13.9%), science & technology (8 | 12.3%), social sciences (6 | 9.2%), and engineering (5 | 7.7%) are the most common fields of study among 65 individuals in Williamsburg who have obtained a bachelor's degree or higher.
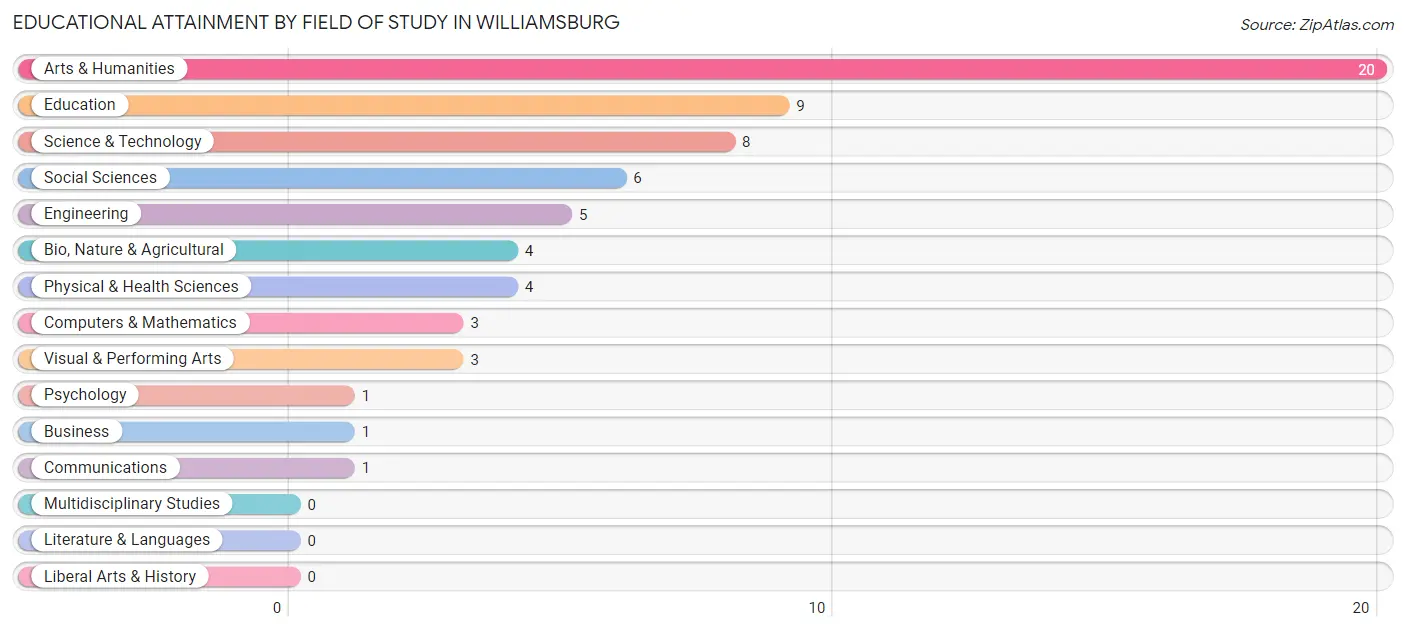
| Field of Study | # Graduates | % Graduates |
| Computers & Mathematics | 3 | 4.6% |
| Bio, Nature & Agricultural | 4 | 6.1% |
| Physical & Health Sciences | 4 | 6.1% |
| Psychology | 1 | 1.5% |
| Social Sciences | 6 | 9.2% |
| Engineering | 5 | 7.7% |
| Multidisciplinary Studies | 0 | 0.0% |
| Science & Technology | 8 | 12.3% |
| Business | 1 | 1.5% |
| Education | 9 | 13.9% |
| Literature & Languages | 0 | 0.0% |
| Liberal Arts & History | 0 | 0.0% |
| Visual & Performing Arts | 3 | 4.6% |
| Communications | 1 | 1.5% |
| Arts & Humanities | 20 | 30.8% |
| Total | 65 | 100.0% |
Transportation & Commute in Williamsburg
Vehicle Availability by Sex in Williamsburg
The most prevalent vehicle ownership categories in Williamsburg are males with 2 vehicles (72, accounting for 35.3%) and females with 2 vehicles (44, making up 46.8%).
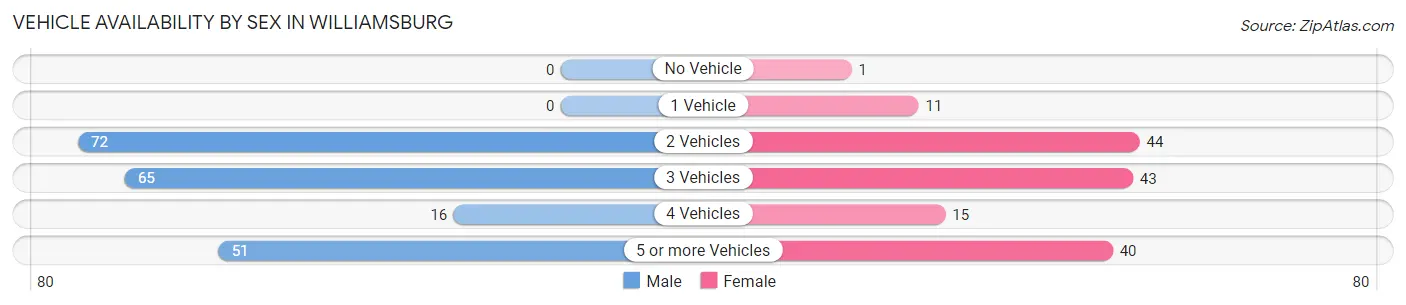
| Vehicles Available | Male | Female |
| No Vehicle | 0 (0.0%) | 1 (0.6%) |
| 1 Vehicle | 0 (0.0%) | 11 (7.1%) |
| 2 Vehicles | 72 (35.3%) | 44 (28.6%) |
| 3 Vehicles | 65 (31.9%) | 43 (27.9%) |
| 4 Vehicles | 16 (7.8%) | 15 (9.7%) |
| 5 or more Vehicles | 51 (25.0%) | 40 (26.0%) |
| Total | 204 (100.0%) | 154 (100.0%) |
Commute Time in Williamsburg
The most frequently occuring commute durations in Williamsburg are 20 to 24 minutes (125 commuters, 35.7%), 30 to 34 minutes (69 commuters, 19.7%), and 60 to 89 minutes (40 commuters, 11.4%).
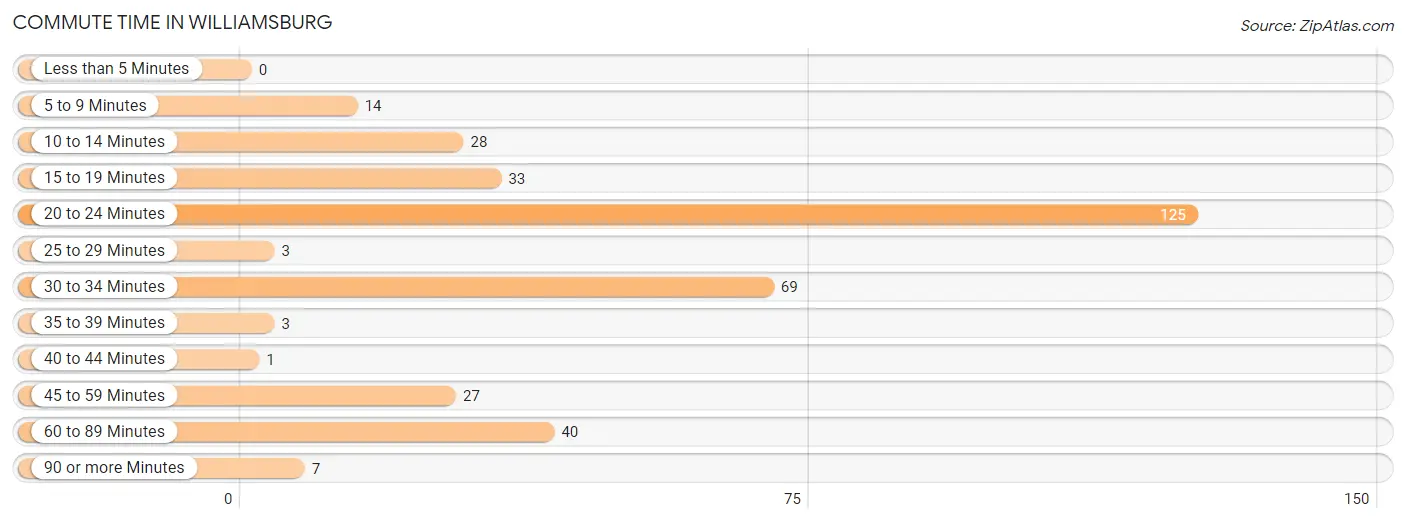
| Commute Time | # Commuters | % Commuters |
| Less than 5 Minutes | 0 | 0.0% |
| 5 to 9 Minutes | 14 | 4.0% |
| 10 to 14 Minutes | 28 | 8.0% |
| 15 to 19 Minutes | 33 | 9.4% |
| 20 to 24 Minutes | 125 | 35.7% |
| 25 to 29 Minutes | 3 | 0.9% |
| 30 to 34 Minutes | 69 | 19.7% |
| 35 to 39 Minutes | 3 | 0.9% |
| 40 to 44 Minutes | 1 | 0.3% |
| 45 to 59 Minutes | 27 | 7.7% |
| 60 to 89 Minutes | 40 | 11.4% |
| 90 or more Minutes | 7 | 2.0% |
Commute Time by Sex in Williamsburg
The most common commute times in Williamsburg are 20 to 24 minutes (56 commuters, 27.9%) for males and 20 to 24 minutes (69 commuters, 46.3%) for females.
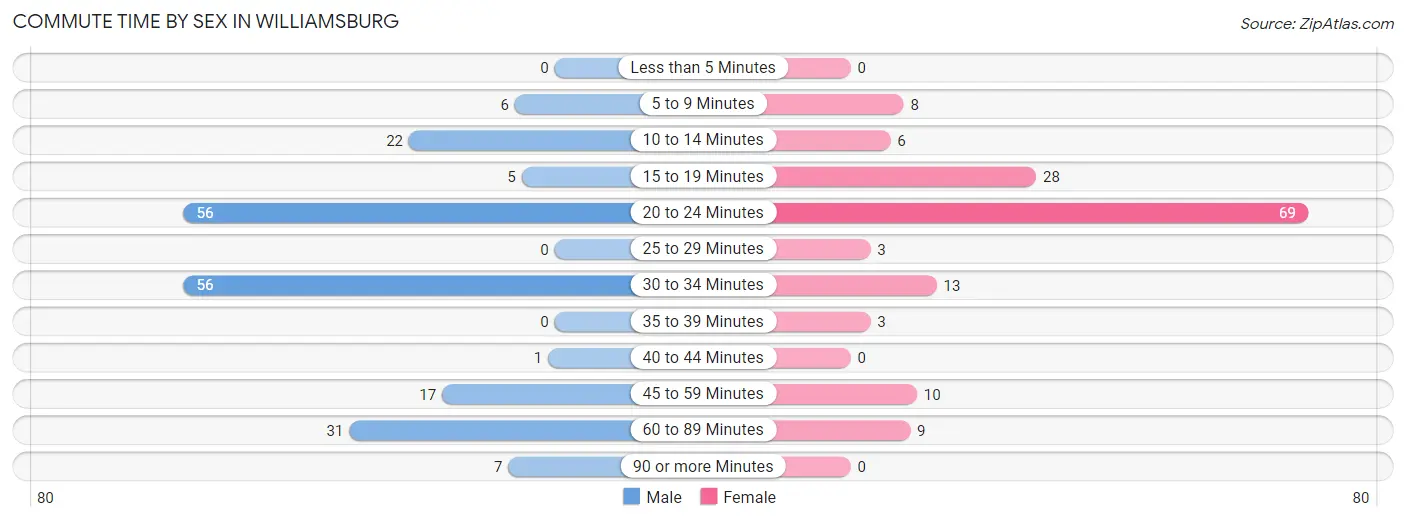
| Commute Time | Male | Female |
| Less than 5 Minutes | 0 (0.0%) | 0 (0.0%) |
| 5 to 9 Minutes | 6 (3.0%) | 8 (5.4%) |
| 10 to 14 Minutes | 22 (11.0%) | 6 (4.0%) |
| 15 to 19 Minutes | 5 (2.5%) | 28 (18.8%) |
| 20 to 24 Minutes | 56 (27.9%) | 69 (46.3%) |
| 25 to 29 Minutes | 0 (0.0%) | 3 (2.0%) |
| 30 to 34 Minutes | 56 (27.9%) | 13 (8.7%) |
| 35 to 39 Minutes | 0 (0.0%) | 3 (2.0%) |
| 40 to 44 Minutes | 1 (0.5%) | 0 (0.0%) |
| 45 to 59 Minutes | 17 (8.5%) | 10 (6.7%) |
| 60 to 89 Minutes | 31 (15.4%) | 9 (6.0%) |
| 90 or more Minutes | 7 (3.5%) | 0 (0.0%) |
Time of Departure to Work by Sex in Williamsburg
The most frequent times of departure to work in Williamsburg are 6:00 AM to 6:29 AM (54, 26.9%) for males and 7:30 AM to 7:59 AM (46, 30.9%) for females.
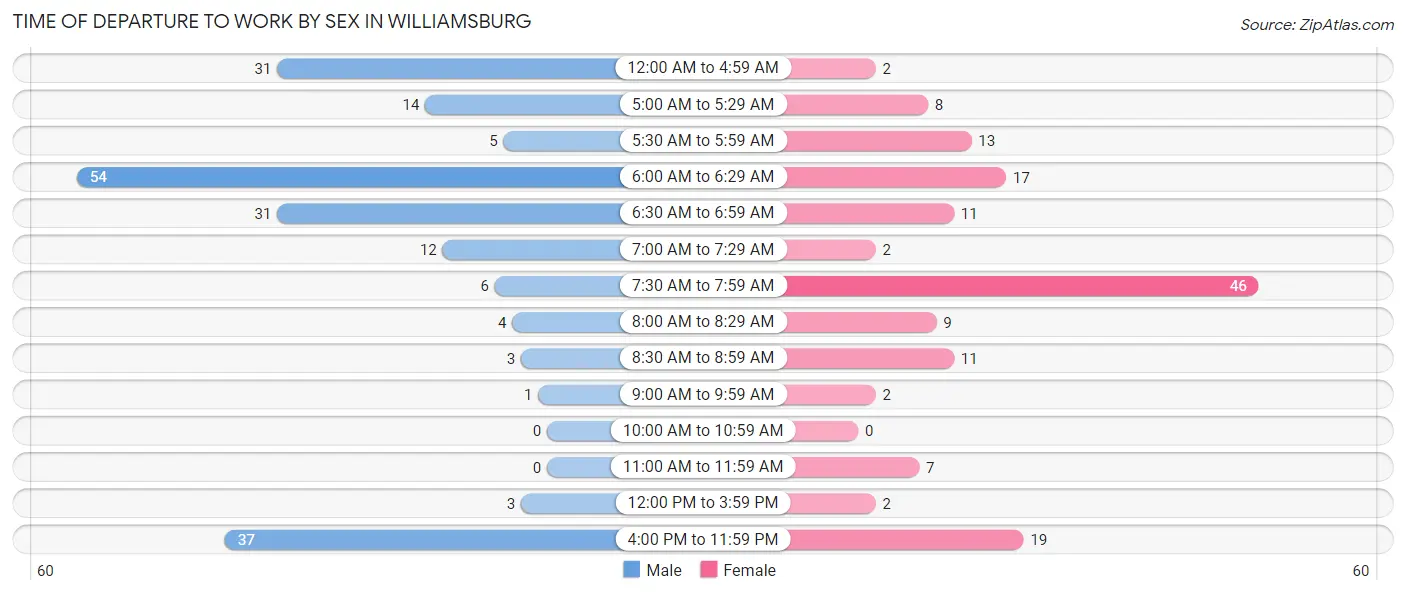
| Time of Departure | Male | Female |
| 12:00 AM to 4:59 AM | 31 (15.4%) | 2 (1.3%) |
| 5:00 AM to 5:29 AM | 14 (7.0%) | 8 (5.4%) |
| 5:30 AM to 5:59 AM | 5 (2.5%) | 13 (8.7%) |
| 6:00 AM to 6:29 AM | 54 (26.9%) | 17 (11.4%) |
| 6:30 AM to 6:59 AM | 31 (15.4%) | 11 (7.4%) |
| 7:00 AM to 7:29 AM | 12 (6.0%) | 2 (1.3%) |
| 7:30 AM to 7:59 AM | 6 (3.0%) | 46 (30.9%) |
| 8:00 AM to 8:29 AM | 4 (2.0%) | 9 (6.0%) |
| 8:30 AM to 8:59 AM | 3 (1.5%) | 11 (7.4%) |
| 9:00 AM to 9:59 AM | 1 (0.5%) | 2 (1.3%) |
| 10:00 AM to 10:59 AM | 0 (0.0%) | 0 (0.0%) |
| 11:00 AM to 11:59 AM | 0 (0.0%) | 7 (4.7%) |
| 12:00 PM to 3:59 PM | 3 (1.5%) | 2 (1.3%) |
| 4:00 PM to 11:59 PM | 37 (18.4%) | 19 (12.8%) |
| Total | 201 (100.0%) | 149 (100.0%) |
Housing Occupancy in Williamsburg
Occupancy by Ownership in Williamsburg
Of the total 283 dwellings in Williamsburg, owner-occupied units account for 238 (84.1%), while renter-occupied units make up 45 (15.9%).
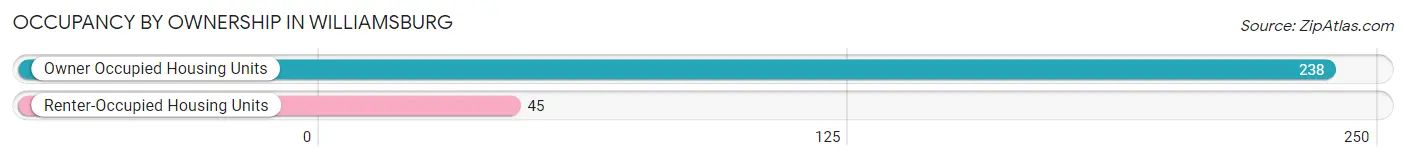
| Occupancy | # Housing Units | % Housing Units |
| Owner Occupied Housing Units | 238 | 84.1% |
| Renter-Occupied Housing Units | 45 | 15.9% |
| Total Occupied Housing Units | 283 | 100.0% |
Occupancy by Household Size in Williamsburg
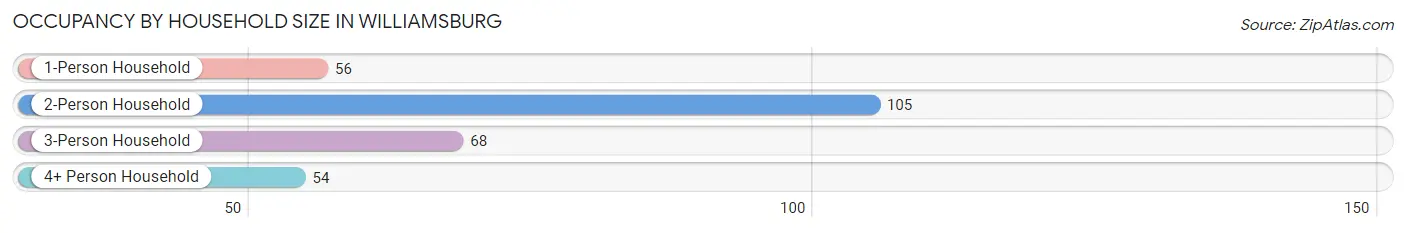
| Household Size | # Housing Units | % Housing Units |
| 1-Person Household | 56 | 19.8% |
| 2-Person Household | 105 | 37.1% |
| 3-Person Household | 68 | 24.0% |
| 4+ Person Household | 54 | 19.1% |
| Total Housing Units | 283 | 100.0% |
Occupancy by Ownership by Household Size in Williamsburg
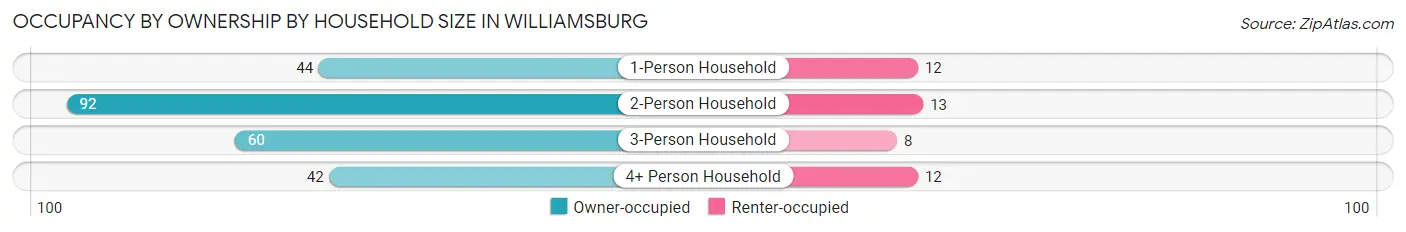
| Household Size | Owner-occupied | Renter-occupied |
| 1-Person Household | 44 (78.6%) | 12 (21.4%) |
| 2-Person Household | 92 (87.6%) | 13 (12.4%) |
| 3-Person Household | 60 (88.2%) | 8 (11.8%) |
| 4+ Person Household | 42 (77.8%) | 12 (22.2%) |
| Total Housing Units | 238 (84.1%) | 45 (15.9%) |
Occupancy by Educational Attainment in Williamsburg
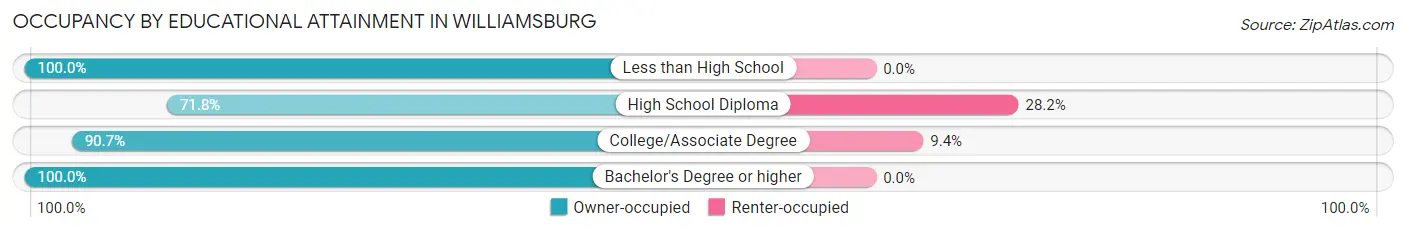
| Household Size | Owner-occupied | Renter-occupied |
| Less than High School | 15 (100.0%) | 0 (0.0%) |
| High School Diploma | 89 (71.8%) | 35 (28.2%) |
| College/Associate Degree | 97 (90.6%) | 10 (9.3%) |
| Bachelor's Degree or higher | 37 (100.0%) | 0 (0.0%) |
Occupancy by Age of Householder in Williamsburg
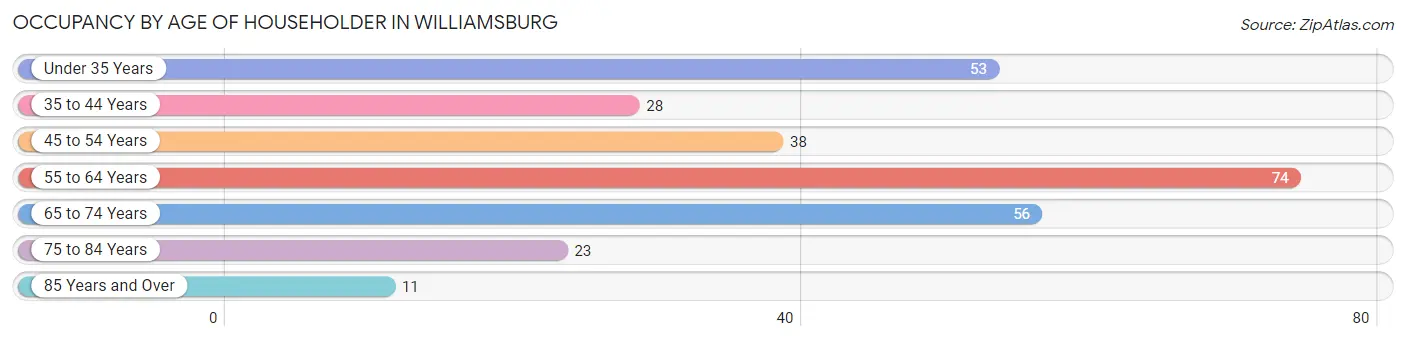
| Age Bracket | # Households | % Households |
| Under 35 Years | 53 | 18.7% |
| 35 to 44 Years | 28 | 9.9% |
| 45 to 54 Years | 38 | 13.4% |
| 55 to 64 Years | 74 | 26.2% |
| 65 to 74 Years | 56 | 19.8% |
| 75 to 84 Years | 23 | 8.1% |
| 85 Years and Over | 11 | 3.9% |
| Total | 283 | 100.0% |
Housing Finances in Williamsburg
Median Income by Occupancy in Williamsburg
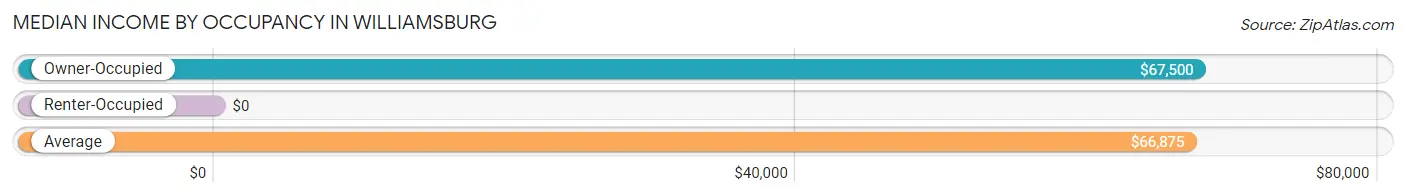
| Occupancy Type | # Households | Median Income |
| Owner-Occupied | 238 (84.1%) | $67,500 |
| Renter-Occupied | 45 (15.9%) | $0 |
| Average | 283 (100.0%) | $66,875 |
Occupancy by Householder Income Bracket in Williamsburg
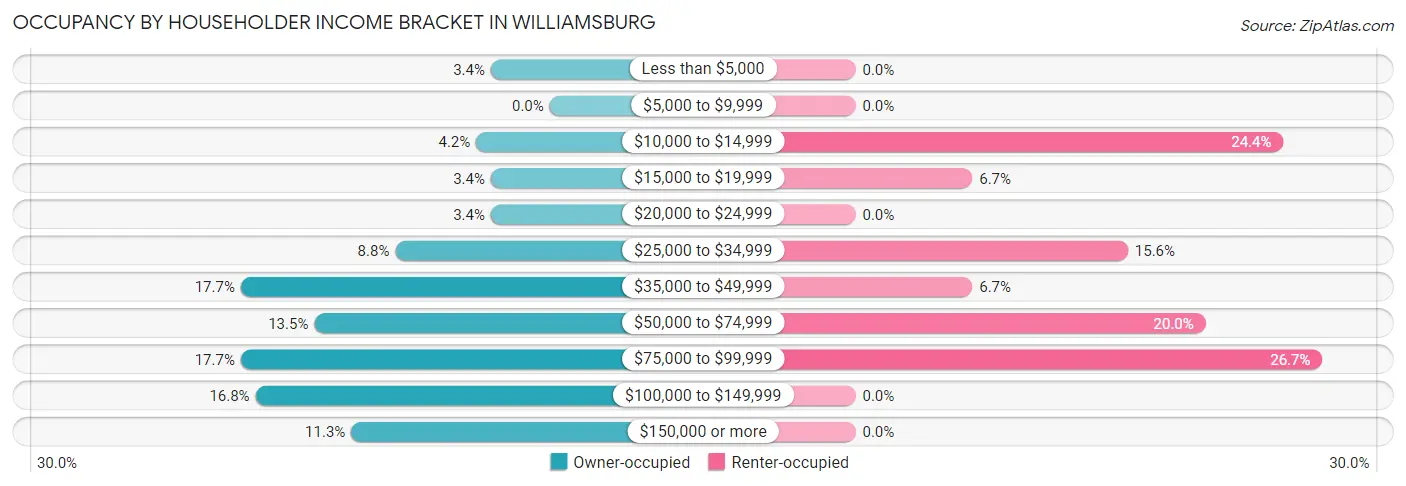
| Income Bracket | Owner-occupied | Renter-occupied |
| Less than $5,000 | 8 (3.4%) | 0 (0.0%) |
| $5,000 to $9,999 | 0 (0.0%) | 0 (0.0%) |
| $10,000 to $14,999 | 10 (4.2%) | 11 (24.4%) |
| $15,000 to $19,999 | 8 (3.4%) | 3 (6.7%) |
| $20,000 to $24,999 | 8 (3.4%) | 0 (0.0%) |
| $25,000 to $34,999 | 21 (8.8%) | 7 (15.6%) |
| $35,000 to $49,999 | 42 (17.6%) | 3 (6.7%) |
| $50,000 to $74,999 | 32 (13.5%) | 9 (20.0%) |
| $75,000 to $99,999 | 42 (17.6%) | 12 (26.7%) |
| $100,000 to $149,999 | 40 (16.8%) | 0 (0.0%) |
| $150,000 or more | 27 (11.3%) | 0 (0.0%) |
| Total | 238 (100.0%) | 45 (100.0%) |
Monthly Housing Cost Tiers in Williamsburg
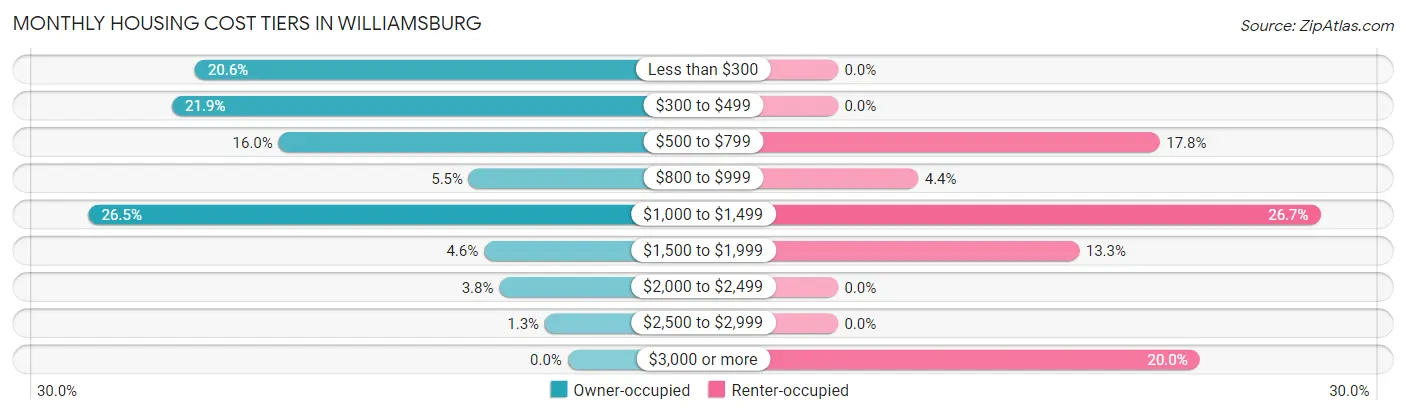
| Monthly Cost | Owner-occupied | Renter-occupied |
| Less than $300 | 49 (20.6%) | 0 (0.0%) |
| $300 to $499 | 52 (21.8%) | 0 (0.0%) |
| $500 to $799 | 38 (16.0%) | 8 (17.8%) |
| $800 to $999 | 13 (5.5%) | 2 (4.4%) |
| $1,000 to $1,499 | 63 (26.5%) | 12 (26.7%) |
| $1,500 to $1,999 | 11 (4.6%) | 6 (13.3%) |
| $2,000 to $2,499 | 9 (3.8%) | 0 (0.0%) |
| $2,500 to $2,999 | 3 (1.3%) | 0 (0.0%) |
| $3,000 or more | 0 (0.0%) | 9 (20.0%) |
| Total | 238 (100.0%) | 45 (100.0%) |
Physical Housing Characteristics in Williamsburg
Housing Structures in Williamsburg
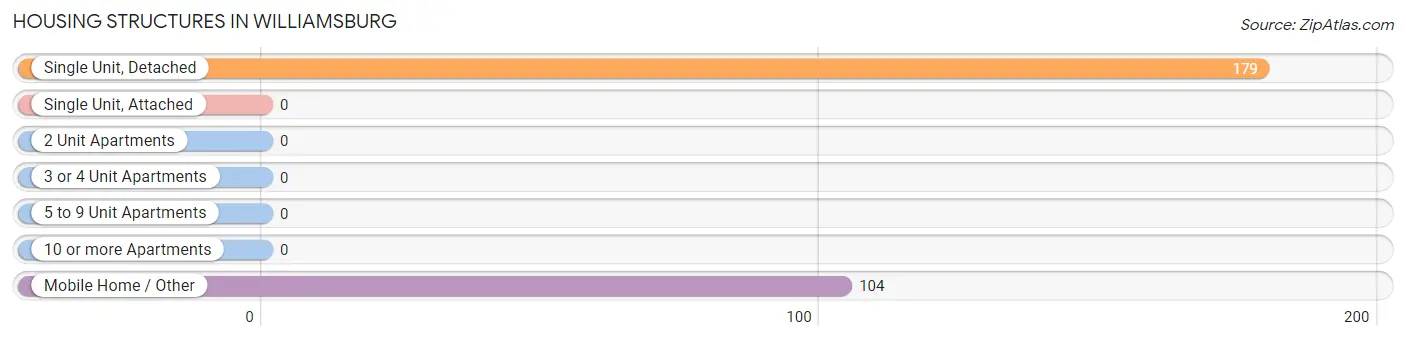
| Structure Type | # Housing Units | % Housing Units |
| Single Unit, Detached | 179 | 63.2% |
| Single Unit, Attached | 0 | 0.0% |
| 2 Unit Apartments | 0 | 0.0% |
| 3 or 4 Unit Apartments | 0 | 0.0% |
| 5 to 9 Unit Apartments | 0 | 0.0% |
| 10 or more Apartments | 0 | 0.0% |
| Mobile Home / Other | 104 | 36.7% |
| Total | 283 | 100.0% |
Housing Structures by Occupancy in Williamsburg
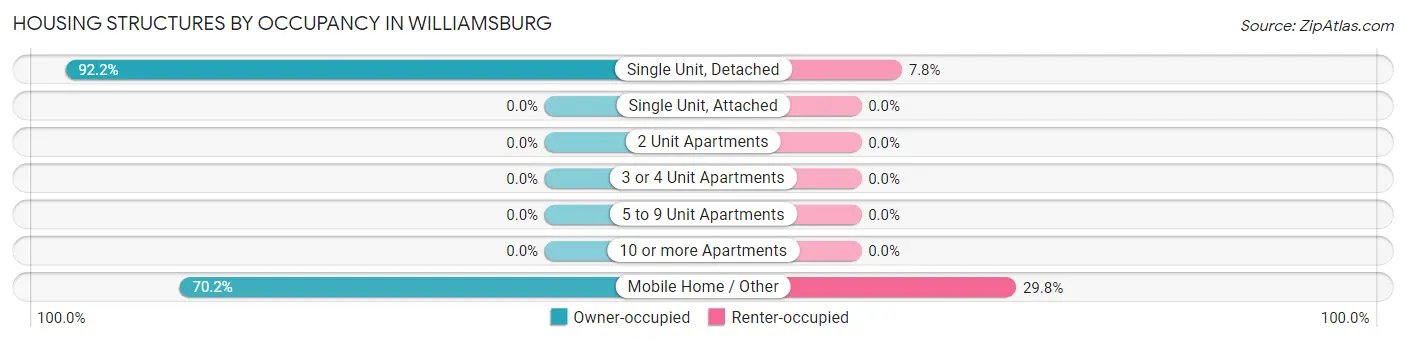
| Structure Type | Owner-occupied | Renter-occupied |
| Single Unit, Detached | 165 (92.2%) | 14 (7.8%) |
| Single Unit, Attached | 0 (0.0%) | 0 (0.0%) |
| 2 Unit Apartments | 0 (0.0%) | 0 (0.0%) |
| 3 or 4 Unit Apartments | 0 (0.0%) | 0 (0.0%) |
| 5 to 9 Unit Apartments | 0 (0.0%) | 0 (0.0%) |
| 10 or more Apartments | 0 (0.0%) | 0 (0.0%) |
| Mobile Home / Other | 73 (70.2%) | 31 (29.8%) |
| Total | 238 (84.1%) | 45 (15.9%) |
Housing Structures by Number of Rooms in Williamsburg
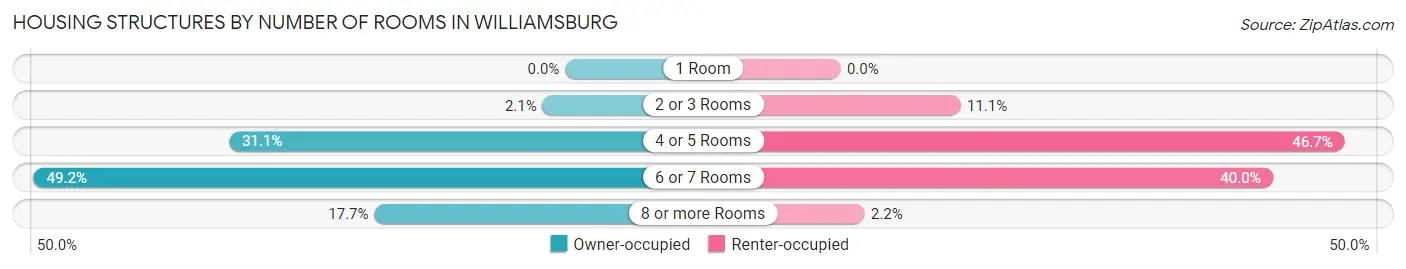
| Number of Rooms | Owner-occupied | Renter-occupied |
| 1 Room | 0 (0.0%) | 0 (0.0%) |
| 2 or 3 Rooms | 5 (2.1%) | 5 (11.1%) |
| 4 or 5 Rooms | 74 (31.1%) | 21 (46.7%) |
| 6 or 7 Rooms | 117 (49.2%) | 18 (40.0%) |
| 8 or more Rooms | 42 (17.6%) | 1 (2.2%) |
| Total | 238 (100.0%) | 45 (100.0%) |
Housing Structure by Heating Type in Williamsburg
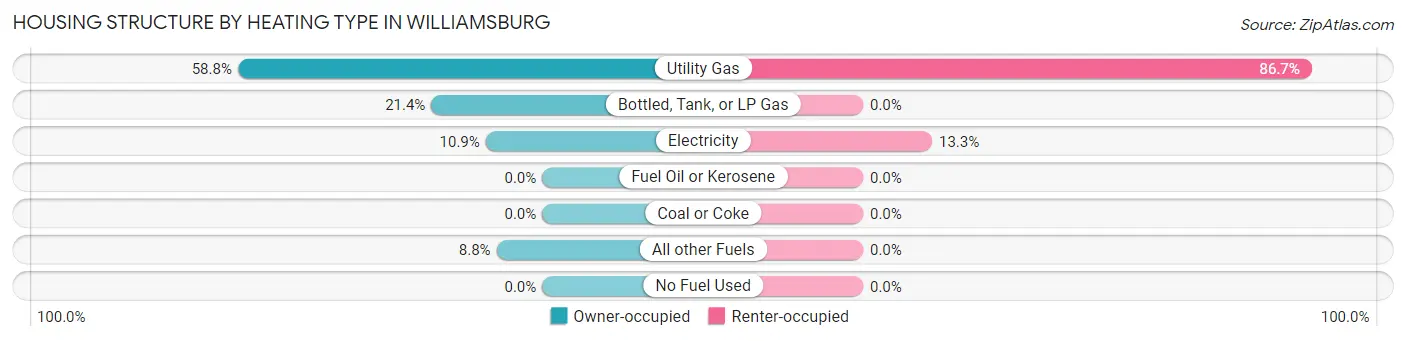
| Heating Type | Owner-occupied | Renter-occupied |
| Utility Gas | 140 (58.8%) | 39 (86.7%) |
| Bottled, Tank, or LP Gas | 51 (21.4%) | 0 (0.0%) |
| Electricity | 26 (10.9%) | 6 (13.3%) |
| Fuel Oil or Kerosene | 0 (0.0%) | 0 (0.0%) |
| Coal or Coke | 0 (0.0%) | 0 (0.0%) |
| All other Fuels | 21 (8.8%) | 0 (0.0%) |
| No Fuel Used | 0 (0.0%) | 0 (0.0%) |
| Total | 238 (100.0%) | 45 (100.0%) |
Household Vehicle Usage in Williamsburg
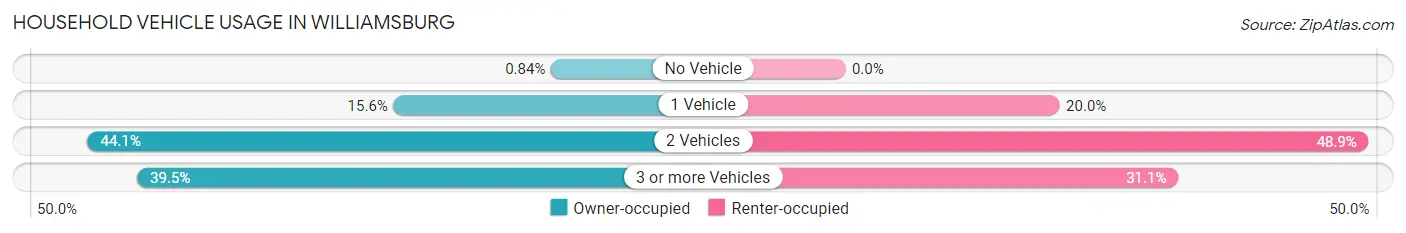
| Vehicles per Household | Owner-occupied | Renter-occupied |
| No Vehicle | 2 (0.8%) | 0 (0.0%) |
| 1 Vehicle | 37 (15.5%) | 9 (20.0%) |
| 2 Vehicles | 105 (44.1%) | 22 (48.9%) |
| 3 or more Vehicles | 94 (39.5%) | 14 (31.1%) |
| Total | 238 (100.0%) | 45 (100.0%) |
Real Estate & Mortgages in Williamsburg
Real Estate and Mortgage Overview in Williamsburg
| Characteristic | Without Mortgage | With Mortgage |
| Housing Units | 119 | 119 |
| Median Property Value | $145,400 | $220,800 |
| Median Household Income | $47,083 | $16 |
| Monthly Housing Costs | $363 | $0 |
| Real Estate Taxes | $468 | $3 |
Property Value by Mortgage Status in Williamsburg
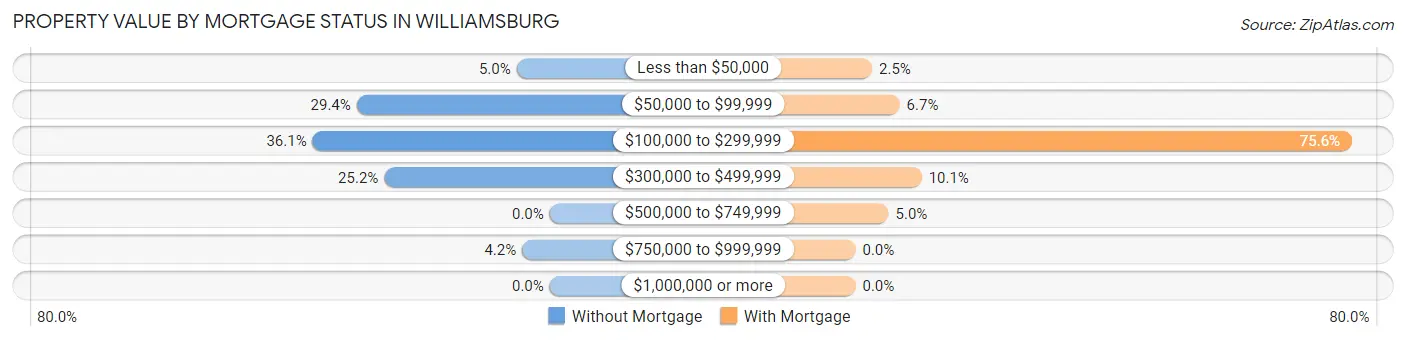
| Property Value | Without Mortgage | With Mortgage |
| Less than $50,000 | 6 (5.0%) | 3 (2.5%) |
| $50,000 to $99,999 | 35 (29.4%) | 8 (6.7%) |
| $100,000 to $299,999 | 43 (36.1%) | 90 (75.6%) |
| $300,000 to $499,999 | 30 (25.2%) | 12 (10.1%) |
| $500,000 to $749,999 | 0 (0.0%) | 6 (5.0%) |
| $750,000 to $999,999 | 5 (4.2%) | 0 (0.0%) |
| $1,000,000 or more | 0 (0.0%) | 0 (0.0%) |
| Total | 119 (100.0%) | 119 (100.0%) |
Household Income by Mortgage Status in Williamsburg
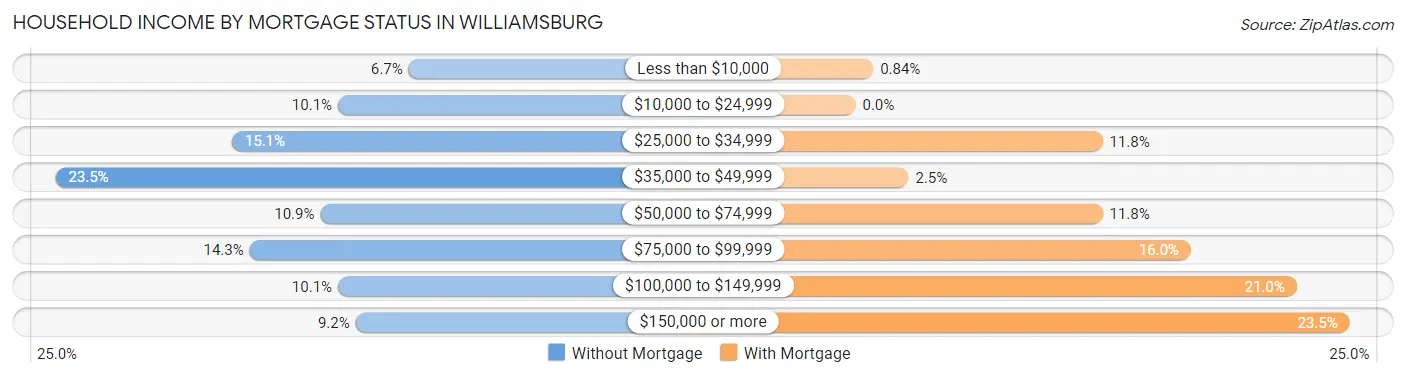
| Household Income | Without Mortgage | With Mortgage |
| Less than $10,000 | 8 (6.7%) | 1 (0.8%) |
| $10,000 to $24,999 | 12 (10.1%) | 0 (0.0%) |
| $25,000 to $34,999 | 18 (15.1%) | 14 (11.8%) |
| $35,000 to $49,999 | 28 (23.5%) | 3 (2.5%) |
| $50,000 to $74,999 | 13 (10.9%) | 14 (11.8%) |
| $75,000 to $99,999 | 17 (14.3%) | 19 (16.0%) |
| $100,000 to $149,999 | 12 (10.1%) | 25 (21.0%) |
| $150,000 or more | 11 (9.2%) | 28 (23.5%) |
| Total | 119 (100.0%) | 119 (100.0%) |
Property Value to Household Income Ratio in Williamsburg
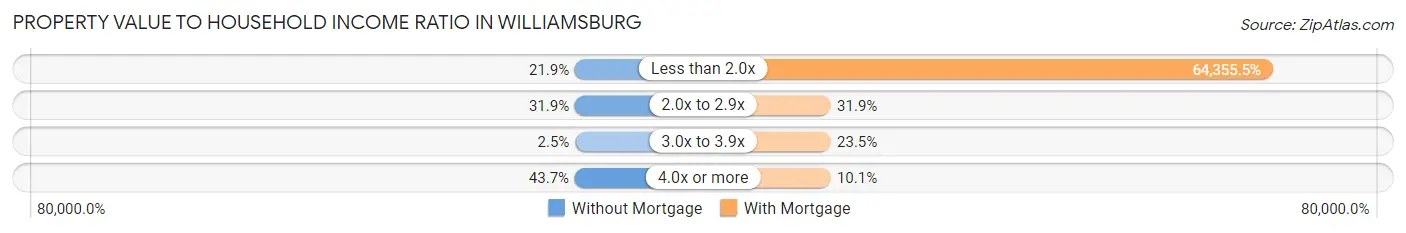
| Value-to-Income Ratio | Without Mortgage | With Mortgage |
| Less than 2.0x | 26 (21.8%) | 76,583 (64,355.5%) |
| 2.0x to 2.9x | 38 (31.9%) | 38 (31.9%) |
| 3.0x to 3.9x | 3 (2.5%) | 28 (23.5%) |
| 4.0x or more | 52 (43.7%) | 12 (10.1%) |
| Total | 119 (100.0%) | 119 (100.0%) |
Real Estate Taxes by Mortgage Status in Williamsburg
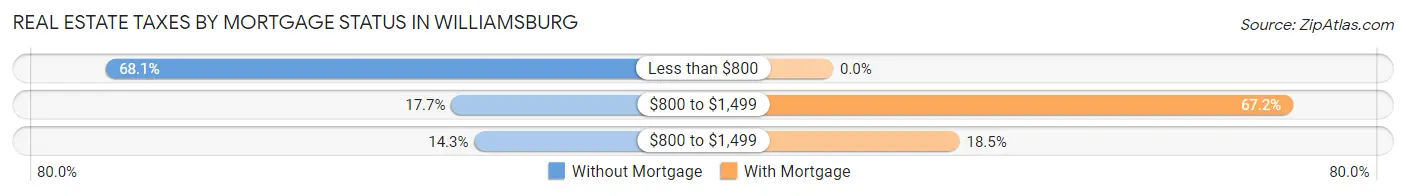
| Property Taxes | Without Mortgage | With Mortgage |
| Less than $800 | 81 (68.1%) | 0 (0.0%) |
| $800 to $1,499 | 21 (17.6%) | 80 (67.2%) |
| $800 to $1,499 | 17 (14.3%) | 22 (18.5%) |
| Total | 119 (100.0%) | 119 (100.0%) |
Health & Disability in Williamsburg
Health Insurance Coverage by Age in Williamsburg
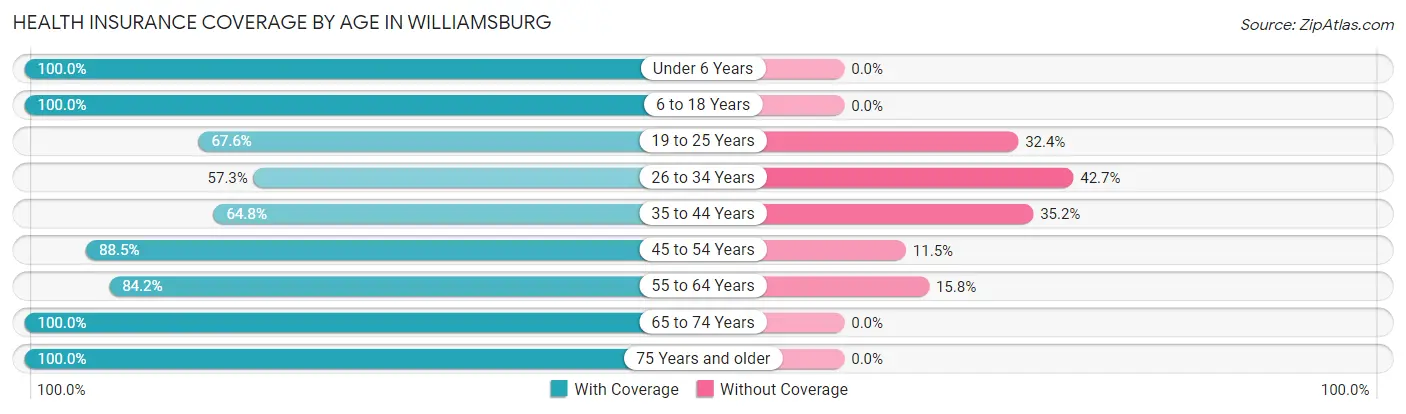
| Age Bracket | With Coverage | Without Coverage |
| Under 6 Years | 39 (100.0%) | 0 (0.0%) |
| 6 to 18 Years | 103 (100.0%) | 0 (0.0%) |
| 19 to 25 Years | 75 (67.6%) | 36 (32.4%) |
| 26 to 34 Years | 55 (57.3%) | 41 (42.7%) |
| 35 to 44 Years | 57 (64.8%) | 31 (35.2%) |
| 45 to 54 Years | 77 (88.5%) | 10 (11.5%) |
| 55 to 64 Years | 96 (84.2%) | 18 (15.8%) |
| 65 to 74 Years | 112 (100.0%) | 0 (0.0%) |
| 75 Years and older | 55 (100.0%) | 0 (0.0%) |
| Total | 669 (83.1%) | 136 (16.9%) |
Health Insurance Coverage by Citizenship Status in Williamsburg
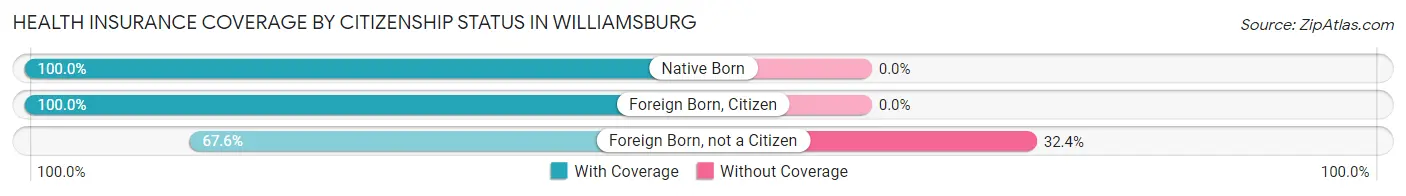
| Citizenship Status | With Coverage | Without Coverage |
| Native Born | 39 (100.0%) | 0 (0.0%) |
| Foreign Born, Citizen | 103 (100.0%) | 0 (0.0%) |
| Foreign Born, not a Citizen | 75 (67.6%) | 36 (32.4%) |
Health Insurance Coverage by Household Income in Williamsburg
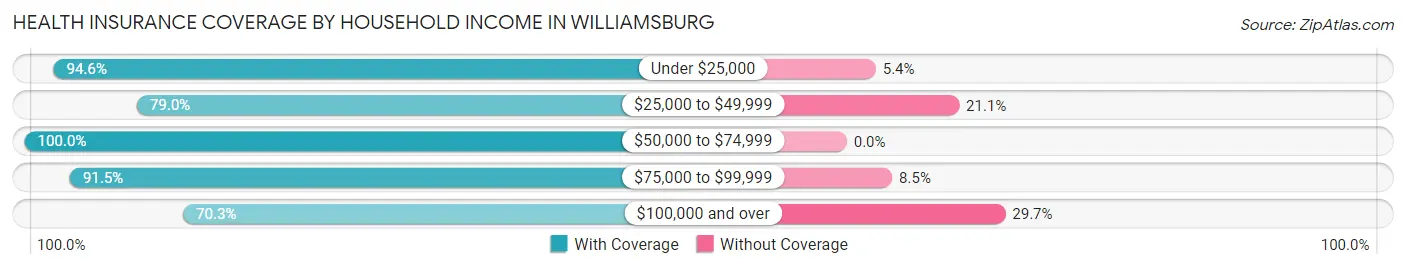
| Household Income | With Coverage | Without Coverage |
| Under $25,000 | 87 (94.6%) | 5 (5.4%) |
| $25,000 to $49,999 | 120 (78.9%) | 32 (21.0%) |
| $50,000 to $74,999 | 83 (100.0%) | 0 (0.0%) |
| $75,000 to $99,999 | 183 (91.5%) | 17 (8.5%) |
| $100,000 and over | 194 (70.3%) | 82 (29.7%) |
Public vs Private Health Insurance Coverage by Age in Williamsburg
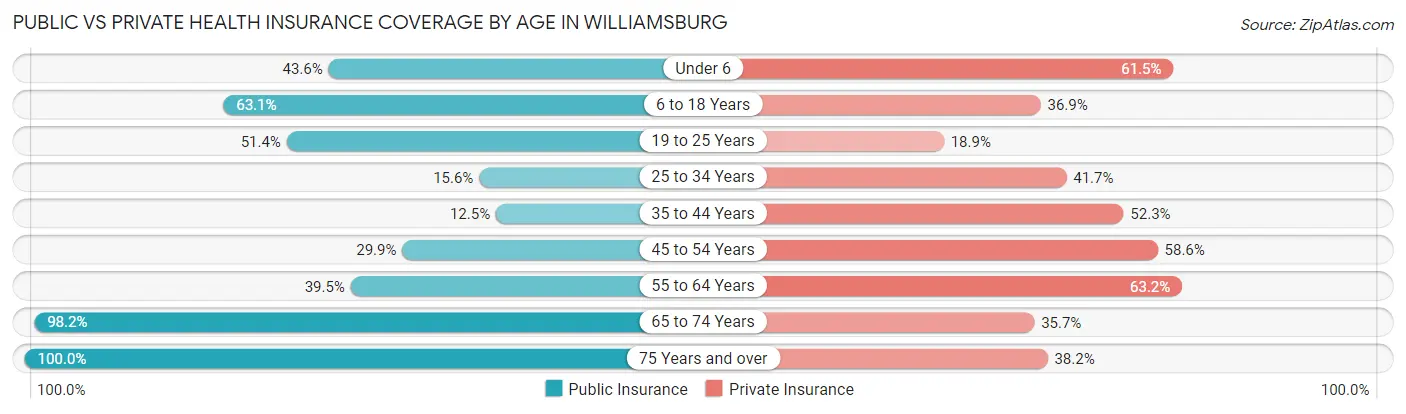
| Age Bracket | Public Insurance | Private Insurance |
| Under 6 | 17 (43.6%) | 24 (61.5%) |
| 6 to 18 Years | 65 (63.1%) | 38 (36.9%) |
| 19 to 25 Years | 57 (51.3%) | 21 (18.9%) |
| 25 to 34 Years | 15 (15.6%) | 40 (41.7%) |
| 35 to 44 Years | 11 (12.5%) | 46 (52.3%) |
| 45 to 54 Years | 26 (29.9%) | 51 (58.6%) |
| 55 to 64 Years | 45 (39.5%) | 72 (63.2%) |
| 65 to 74 Years | 110 (98.2%) | 40 (35.7%) |
| 75 Years and over | 55 (100.0%) | 21 (38.2%) |
| Total | 401 (49.8%) | 353 (43.9%) |
Disability Status by Sex by Age in Williamsburg
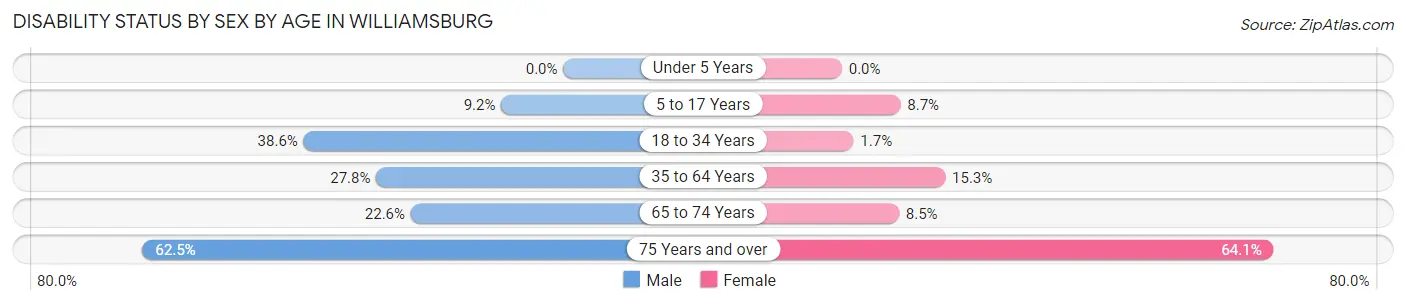
| Age Bracket | Male | Female |
| Under 5 Years | 0 (0.0%) | 0 (0.0%) |
| 5 to 17 Years | 7 (9.2%) | 2 (8.7%) |
| 18 to 34 Years | 59 (38.6%) | 1 (1.7%) |
| 35 to 64 Years | 35 (27.8%) | 25 (15.3%) |
| 65 to 74 Years | 12 (22.6%) | 5 (8.5%) |
| 75 Years and over | 10 (62.5%) | 25 (64.1%) |
Disability Class by Sex by Age in Williamsburg
Disability Class: Hearing Difficulty
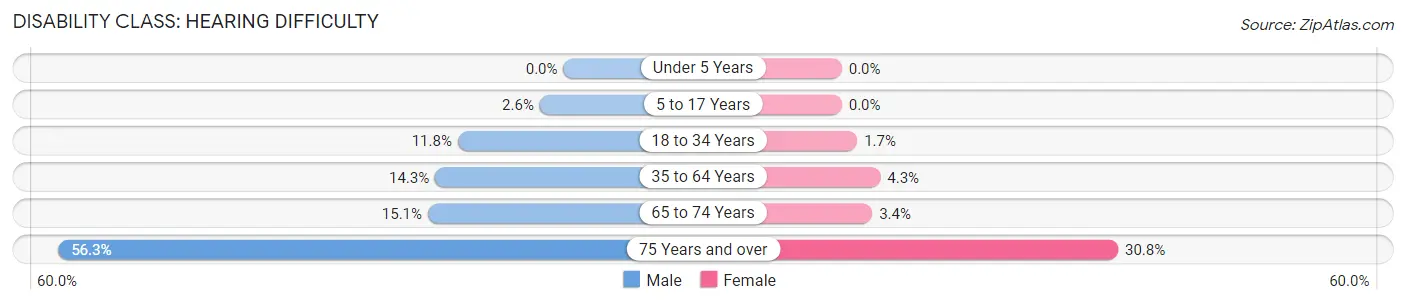
| Age Bracket | Male | Female |
| Under 5 Years | 0 (0.0%) | 0 (0.0%) |
| 5 to 17 Years | 2 (2.6%) | 0 (0.0%) |
| 18 to 34 Years | 18 (11.8%) | 1 (1.7%) |
| 35 to 64 Years | 18 (14.3%) | 7 (4.3%) |
| 65 to 74 Years | 8 (15.1%) | 2 (3.4%) |
| 75 Years and over | 9 (56.2%) | 12 (30.8%) |
Disability Class: Vision Difficulty
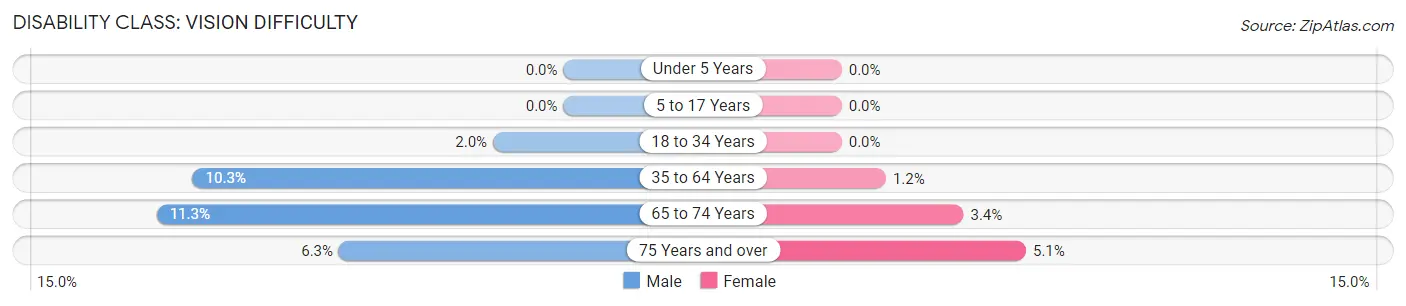
| Age Bracket | Male | Female |
| Under 5 Years | 0 (0.0%) | 0 (0.0%) |
| 5 to 17 Years | 0 (0.0%) | 0 (0.0%) |
| 18 to 34 Years | 3 (2.0%) | 0 (0.0%) |
| 35 to 64 Years | 13 (10.3%) | 2 (1.2%) |
| 65 to 74 Years | 6 (11.3%) | 2 (3.4%) |
| 75 Years and over | 1 (6.2%) | 2 (5.1%) |
Disability Class: Cognitive Difficulty
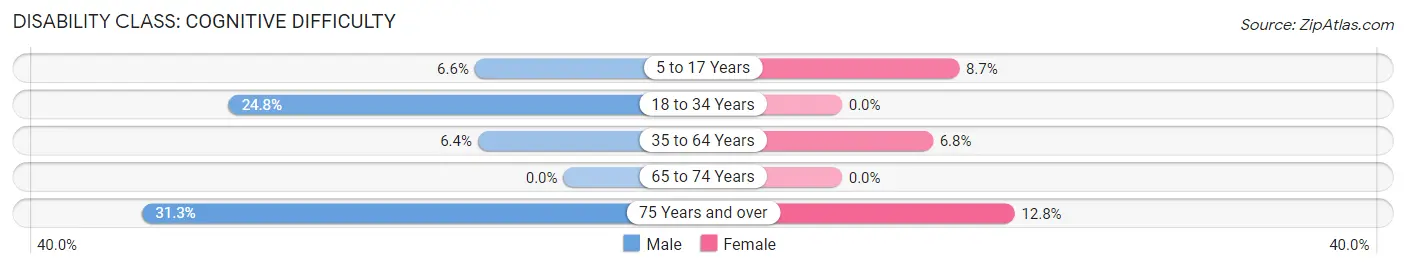
| Age Bracket | Male | Female |
| 5 to 17 Years | 5 (6.6%) | 2 (8.7%) |
| 18 to 34 Years | 38 (24.8%) | 0 (0.0%) |
| 35 to 64 Years | 8 (6.4%) | 11 (6.8%) |
| 65 to 74 Years | 0 (0.0%) | 0 (0.0%) |
| 75 Years and over | 5 (31.2%) | 5 (12.8%) |
Disability Class: Ambulatory Difficulty
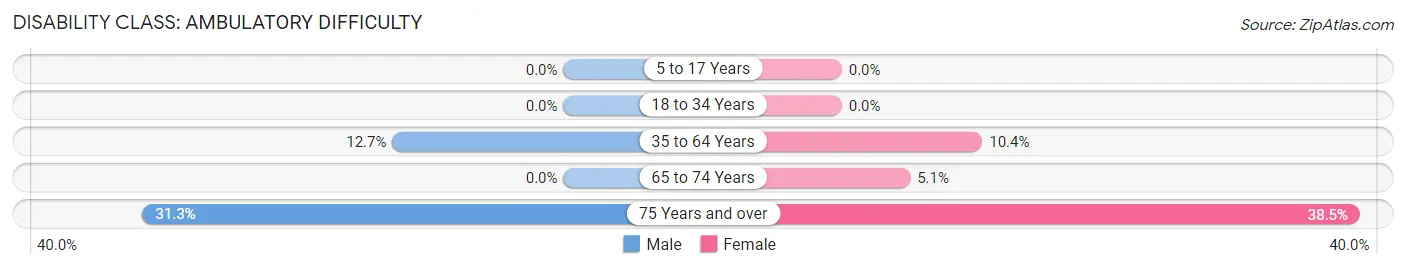
| Age Bracket | Male | Female |
| 5 to 17 Years | 0 (0.0%) | 0 (0.0%) |
| 18 to 34 Years | 0 (0.0%) | 0 (0.0%) |
| 35 to 64 Years | 16 (12.7%) | 17 (10.4%) |
| 65 to 74 Years | 0 (0.0%) | 3 (5.1%) |
| 75 Years and over | 5 (31.2%) | 15 (38.5%) |
Disability Class: Self-Care Difficulty
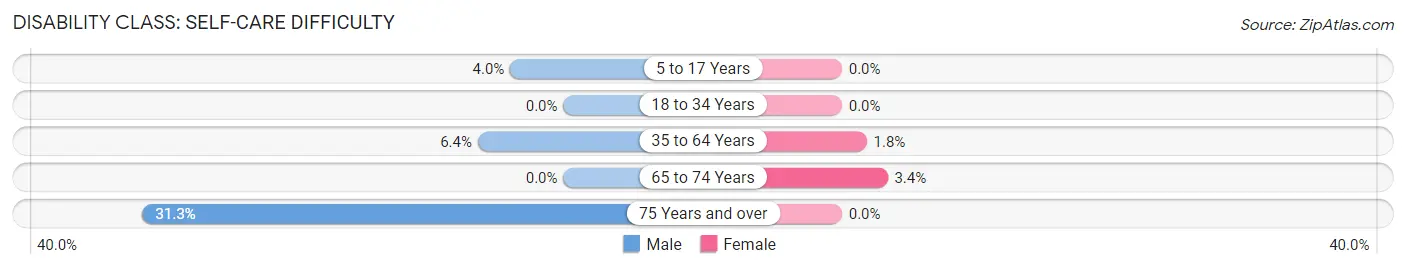
| Age Bracket | Male | Female |
| 5 to 17 Years | 3 (4.0%) | 0 (0.0%) |
| 18 to 34 Years | 0 (0.0%) | 0 (0.0%) |
| 35 to 64 Years | 8 (6.4%) | 3 (1.8%) |
| 65 to 74 Years | 0 (0.0%) | 2 (3.4%) |
| 75 Years and over | 5 (31.2%) | 0 (0.0%) |
Technology Access in Williamsburg
Computing Device Access in Williamsburg
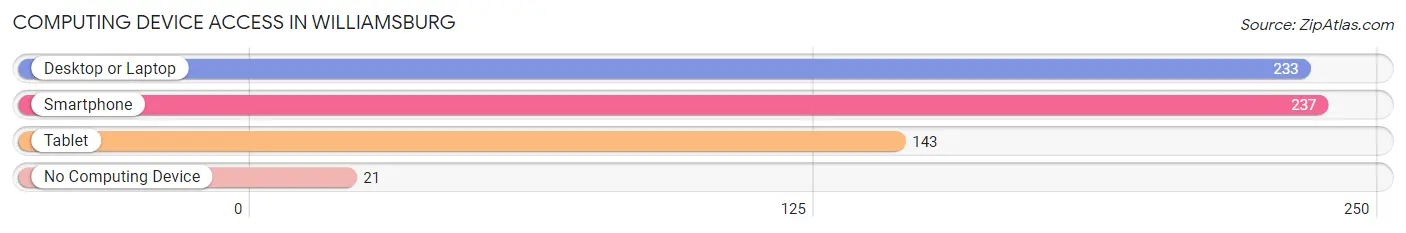
| Device Type | # Households | % Households |
| Desktop or Laptop | 233 | 82.3% |
| Smartphone | 237 | 83.8% |
| Tablet | 143 | 50.5% |
| No Computing Device | 21 | 7.4% |
| Total | 283 | 100.0% |
Internet Access in Williamsburg
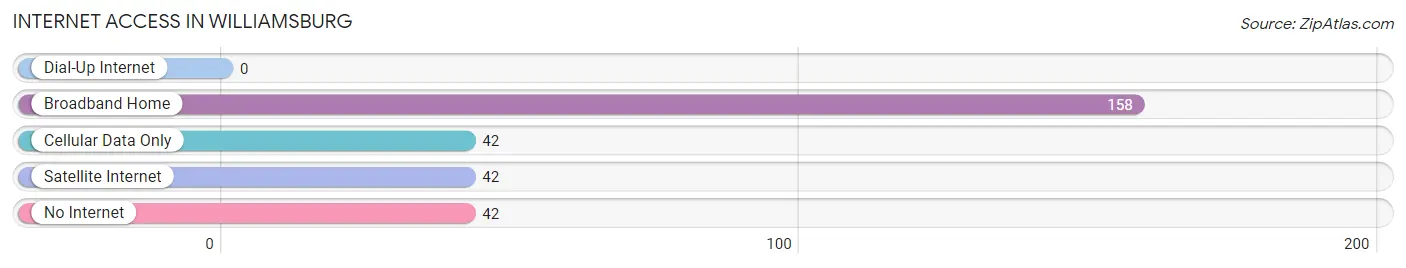
| Internet Type | # Households | % Households |
| Dial-Up Internet | 0 | 0.0% |
| Broadband Home | 158 | 55.8% |
| Cellular Data Only | 42 | 14.8% |
| Satellite Internet | 42 | 14.8% |
| No Internet | 42 | 14.8% |
| Total | 283 | 100.0% |
Williamsburg Summary
Williamsburg, Colorado is a small town located in the foothills of the Rocky Mountains in Weld County. It is situated at the intersection of Highway 85 and Highway 52, approximately 25 miles north of Denver. The town was founded in 1871 and was named after William A.H. Loveland, a prominent railroad executive. The population of Williamsburg was estimated to be 1,072 in 2020.
Geography
Williamsburg is located in the foothills of the Rocky Mountains in Weld County, Colorado. It is situated at the intersection of Highway 85 and Highway 52, approximately 25 miles north of Denver. The town is located at an elevation of 5,845 feet above sea level. The town is surrounded by rolling hills and is situated in a valley between two mountain ranges. The area is known for its scenic beauty and is home to a variety of wildlife, including deer, elk, and antelope.
Economy
Williamsburg is a small town with a limited economy. The town is primarily supported by agriculture and tourism. The town is home to several small businesses, including a grocery store, a hardware store, and a few restaurants. The town also has a few small manufacturing businesses. The town is also home to a few small farms, which produce hay, corn, and other crops.
Demographics
The population of Williamsburg was estimated to be 1,072 in 2020. The town is predominantly white, with a small Hispanic population. The median household income in Williamsburg is $50,000, and the median home value is $220,000. The town has a low unemployment rate of 3.2%.
History
Williamsburg was founded in 1871 and was named after William A.H. Loveland, a prominent railroad executive. The town was originally a farming community, but it soon became a popular tourist destination due to its scenic beauty. The town was also home to several coal mines, which provided employment for many of the town’s residents. The town was also home to a large number of saloons and gambling halls, which attracted many visitors from Denver and other nearby towns.
In the early 1900s, the town began to decline due to the decline of the coal industry. The town was also affected by the Great Depression, which caused many of the town’s businesses to close. The town was revitalized in the 1950s, when the town was chosen as the site of a new ski resort. The ski resort brought new life to the town and helped to revive the local economy.
Today, Williamsburg is a small town with a limited economy. The town is primarily supported by agriculture and tourism. The town is home to several small businesses, including a grocery store, a hardware store, and a few restaurants. The town also has a few small manufacturing businesses. The town is also home to a few small farms, which produce hay, corn, and other crops. The town is also home to a ski resort, which attracts visitors from all over the state.
Common Questions
What is Per Capita Income in Williamsburg?
Per Capita income in Williamsburg is $26,211.
What is the Median Family Income in Williamsburg?
Median Family Income in Williamsburg is $72,500.
What is the Median Household income in Williamsburg?
Median Household Income in Williamsburg is $66,875.
What is Income or Wage Gap in Williamsburg?
Income or Wage Gap in Williamsburg is 1.7%.
Women in Williamsburg earn 98.3 cents for every dollar earned by a man.
What is Inequality or Gini Index in Williamsburg?
Inequality or Gini Index in Williamsburg is 0.39.
What is the Total Population of Williamsburg?
Total Population of Williamsburg is 810.
What is the Total Male Population of Williamsburg?
Total Male Population of Williamsburg is 465.
What is the Total Female Population of Williamsburg?
Total Female Population of Williamsburg is 345.
What is the Ratio of Males per 100 Females in Williamsburg?
There are 134.78 Males per 100 Females in Williamsburg.
What is the Ratio of Females per 100 Males in Williamsburg?
There are 74.19 Females per 100 Males in Williamsburg.
What is the Median Population Age in Williamsburg?
Median Population Age in Williamsburg is 40.6 Years.
What is the Average Family Size in Williamsburg
Average Family Size in Williamsburg is 3.3 People.
What is the Average Household Size in Williamsburg
Average Household Size in Williamsburg is 2.9 People.
How Large is the Labor Force in Williamsburg?
There are 374 People in the Labor Forcein in Williamsburg.
What is the Percentage of People in the Labor Force in Williamsburg?
53.2% of People are in the Labor Force in Williamsburg.
What is the Unemployment Rate in Williamsburg?
Unemployment Rate in Williamsburg is 4.3%.