Battlement Mesa, CO Map & Demographics
Battlement Mesa Map
Battlement Mesa Overview
$26,948
PER CAPITA INCOME
$73,750
AVG FAMILY INCOME
$66,737
AVG HOUSEHOLD INCOME
1.3%
WAGE / INCOME GAP [ % ]
98.7¢/ $1
WAGE / INCOME GAP [ $ ]
0.29
INEQUALITY / GINI INDEX
5,148
TOTAL POPULATION
2,798
MALE POPULATION
2,350
FEMALE POPULATION
119.06
MALES / 100 FEMALES
83.99
FEMALES / 100 MALES
29.9
MEDIAN AGE
3.5
AVG FAMILY SIZE
2.6
AVG HOUSEHOLD SIZE
2,312
LABOR FORCE [ PEOPLE ]
60.4%
PERCENT IN LABOR FORCE
1.6%
UNEMPLOYMENT RATE
Battlement Mesa Area Codes
Income in Battlement Mesa
Income Overview in Battlement Mesa
Per Capita Income in Battlement Mesa is $26,948, while median incomes of families and households are $73,750 and $66,737 respectively.
| Characteristic | Number | Measure |
| Per Capita Income | 5,148 | $26,948 |
| Median Family Income | 1,199 | $73,750 |
| Mean Family Income | 1,199 | $82,244 |
| Median Household Income | 1,950 | $66,737 |
| Mean Household Income | 1,950 | $70,941 |
| Income Deficit | 1,199 | $0 |
| Wage / Income Gap (%) | 5,148 | 1.31% |
| Wage / Income Gap ($) | 5,148 | 98.69¢ per $1 |
| Gini / Inequality Index | 5,148 | 0.29 |
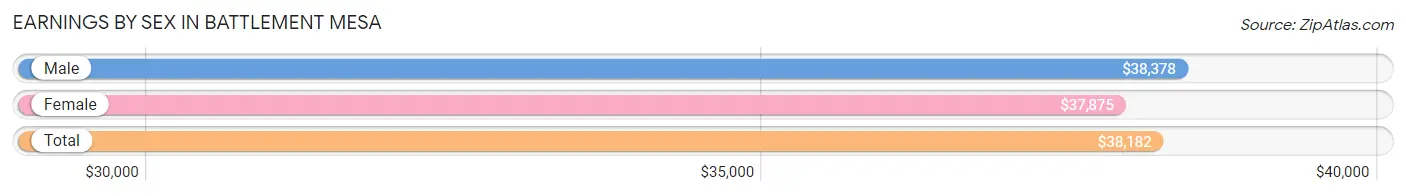
Earnings by Sex in Battlement Mesa
Average Earnings in Battlement Mesa are $38,182, $38,378 for men and $37,875 for women, a difference of 1.3%.
| Sex | Number | Average Earnings |
| Male | 1,328 (54.6%) | $38,378 |
| Female | 1,102 (45.4%) | $37,875 |
| Total | 2,430 (100.0%) | $38,182 |
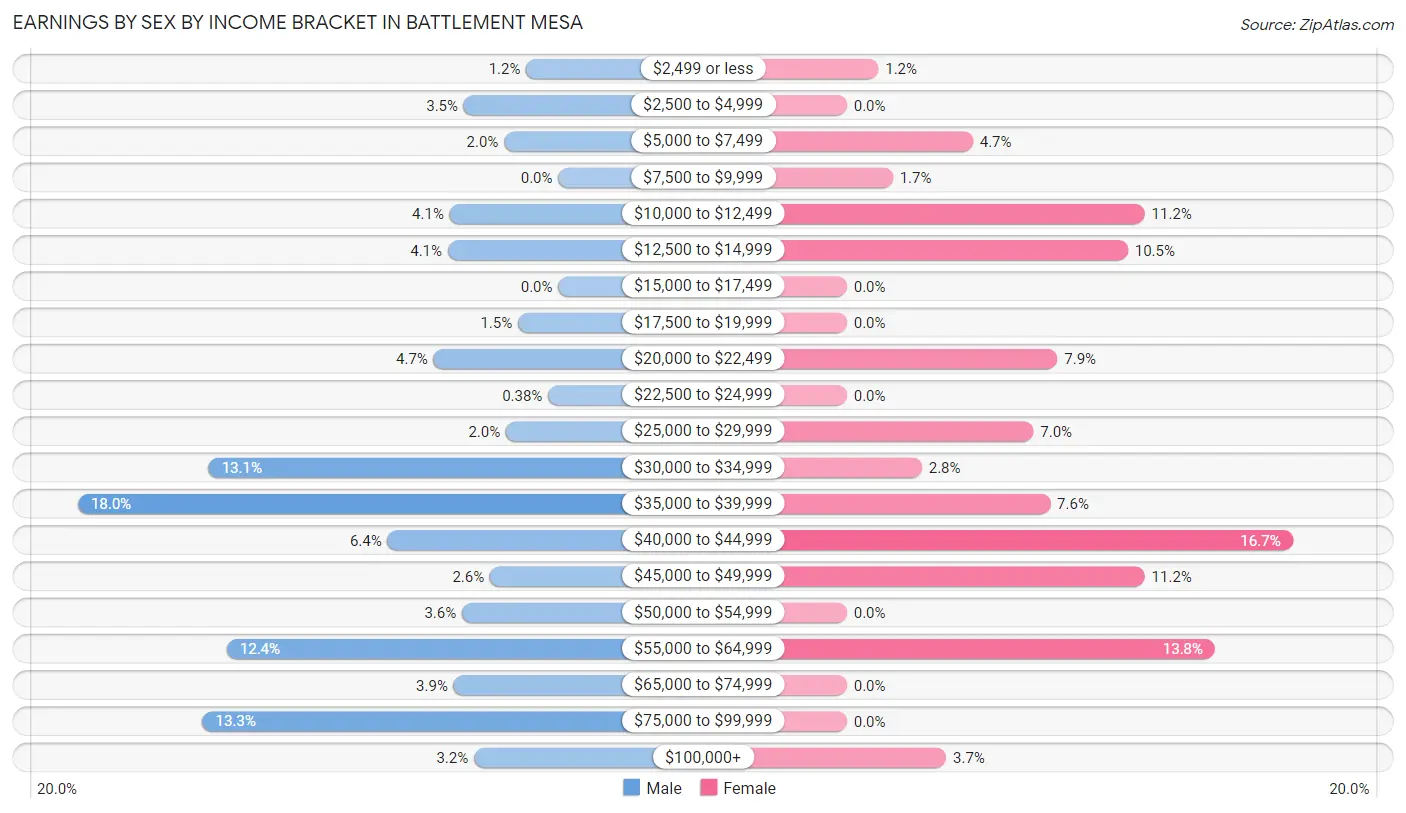
Earnings by Sex by Income Bracket in Battlement Mesa
The most common earnings brackets in Battlement Mesa are $35,000 to $39,999 for men (239 | 18.0%) and $40,000 to $44,999 for women (184 | 16.7%).
| Income | Male | Female |
| $2,499 or less | 16 (1.2%) | 13 (1.2%) |
| $2,500 to $4,999 | 47 (3.5%) | 0 (0.0%) |
| $5,000 to $7,499 | 27 (2.0%) | 52 (4.7%) |
| $7,500 to $9,999 | 0 (0.0%) | 19 (1.7%) |
| $10,000 to $12,499 | 54 (4.1%) | 123 (11.2%) |
| $12,500 to $14,999 | 55 (4.1%) | 116 (10.5%) |
| $15,000 to $17,499 | 0 (0.0%) | 0 (0.0%) |
| $17,500 to $19,999 | 20 (1.5%) | 0 (0.0%) |
| $20,000 to $22,499 | 62 (4.7%) | 87 (7.9%) |
| $22,500 to $24,999 | 5 (0.4%) | 0 (0.0%) |
| $25,000 to $29,999 | 26 (2.0%) | 77 (7.0%) |
| $30,000 to $34,999 | 174 (13.1%) | 31 (2.8%) |
| $35,000 to $39,999 | 239 (18.0%) | 84 (7.6%) |
| $40,000 to $44,999 | 85 (6.4%) | 184 (16.7%) |
| $45,000 to $49,999 | 34 (2.6%) | 123 (11.2%) |
| $50,000 to $54,999 | 48 (3.6%) | 0 (0.0%) |
| $55,000 to $64,999 | 165 (12.4%) | 152 (13.8%) |
| $65,000 to $74,999 | 52 (3.9%) | 0 (0.0%) |
| $75,000 to $99,999 | 177 (13.3%) | 0 (0.0%) |
| $100,000+ | 42 (3.2%) | 41 (3.7%) |
| Total | 1,328 (100.0%) | 1,102 (100.0%) |
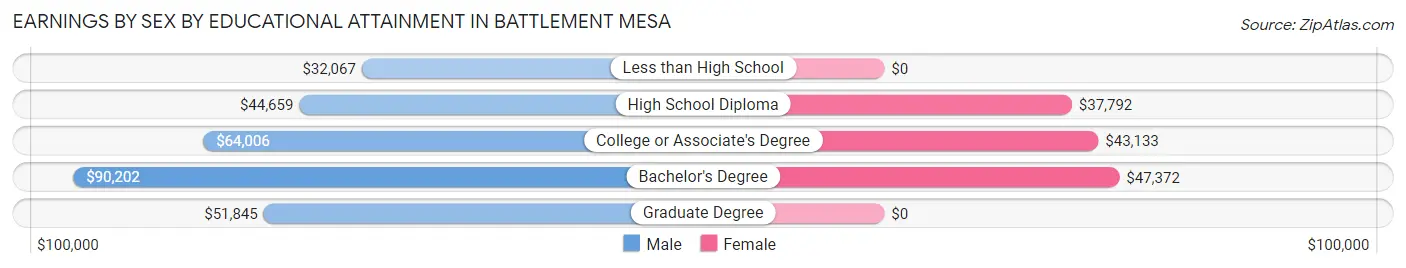
Earnings by Sex by Educational Attainment in Battlement Mesa
Average earnings in Battlement Mesa are $50,833 for men and $39,688 for women, a difference of 21.9%. Men with an educational attainment of bachelor's degree enjoy the highest average annual earnings of $90,202, while those with less than high school education earn the least with $32,067. Women with an educational attainment of bachelor's degree earn the most with the average annual earnings of $47,372, while those with high school diploma education have the smallest earnings of $37,792.
| Educational Attainment | Male Income | Female Income |
| Less than High School | $32,067 | $0 |
| High School Diploma | $44,659 | $37,792 |
| College or Associate's Degree | $64,006 | $43,133 |
| Bachelor's Degree | $90,202 | $47,372 |
| Graduate Degree | $51,845 | $0 |
| Total | $50,833 | $39,688 |
Family Income in Battlement Mesa
Family Income Brackets in Battlement Mesa
According to the Battlement Mesa family income data, there are 359 families falling into the $50,000 to $74,999 income range, which is the most common income bracket and makes up 29.9% of all families.
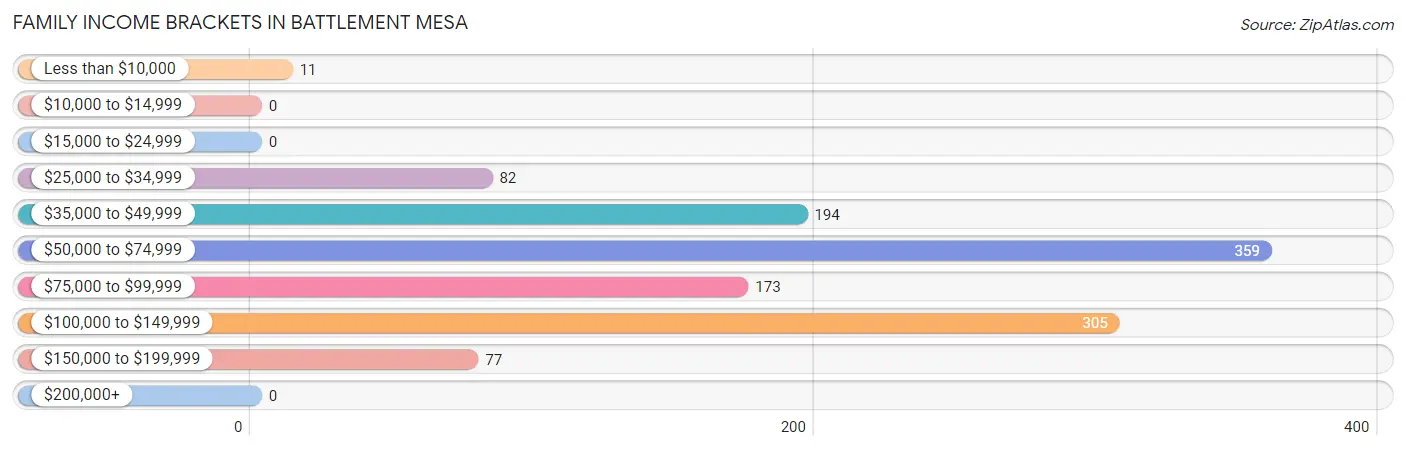
| Income Bracket | # Families | % Families |
| Less than $10,000 | 11 | 0.9% |
| $10,000 to $14,999 | 0 | 0.0% |
| $15,000 to $24,999 | 0 | 0.0% |
| $25,000 to $34,999 | 82 | 6.8% |
| $35,000 to $49,999 | 194 | 16.2% |
| $50,000 to $74,999 | 359 | 29.9% |
| $75,000 to $99,999 | 173 | 14.4% |
| $100,000 to $149,999 | 305 | 25.4% |
| $150,000 to $199,999 | 77 | 6.4% |
| $200,000+ | 0 | 0.0% |
Family Income by Famaliy Size in Battlement Mesa
5-person families (96 | 8.0%) account for the highest median family income in Battlement Mesa with $103,106 per family, while 2-person families (457 | 38.1%) have the highest median income of $32,400 per family member.
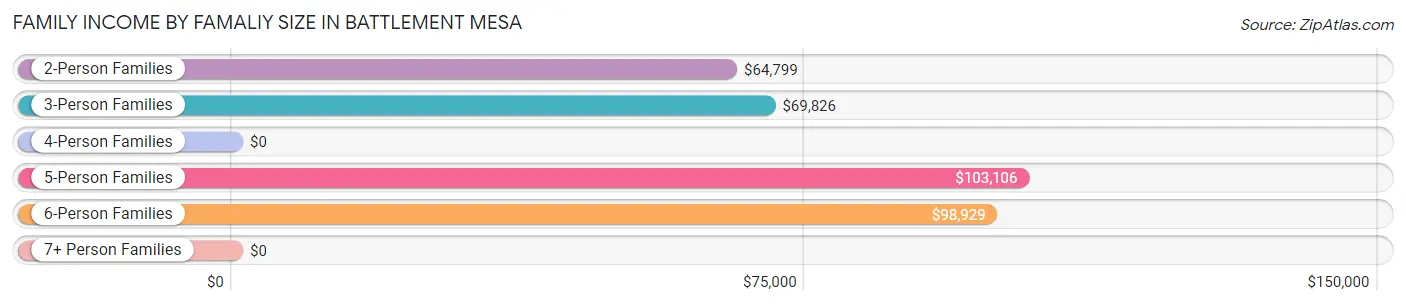
| Income Bracket | # Families | Median Income |
| 2-Person Families | 457 (38.1%) | $64,799 |
| 3-Person Families | 250 (20.8%) | $69,826 |
| 4-Person Families | 156 (13.0%) | $0 |
| 5-Person Families | 96 (8.0%) | $103,106 |
| 6-Person Families | 240 (20.0%) | $98,929 |
| 7+ Person Families | 0 (0.0%) | $0 |
| Total | 1,199 (100.0%) | $73,750 |
Family Income by Number of Earners in Battlement Mesa
The median family income in Battlement Mesa is $73,750, with families comprising 2 earners (547) having the highest median family income of $92,404, while families with no earners (152) have the lowest median family income of $39,688, accounting for 45.6% and 12.7% of families, respectively.
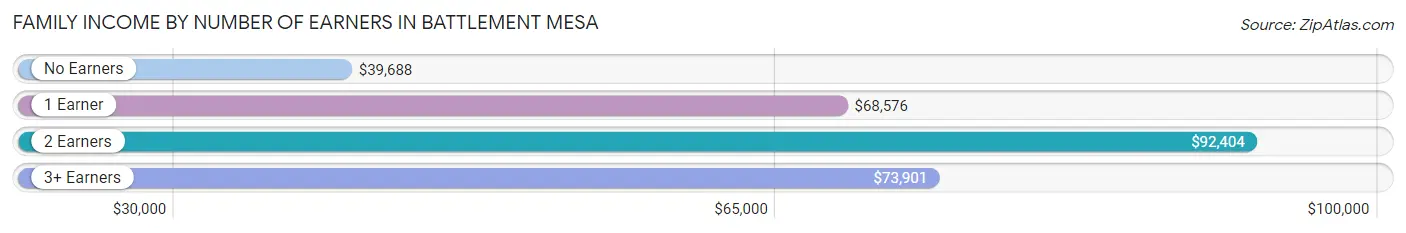
| Number of Earners | # Families | Median Income |
| No Earners | 152 (12.7%) | $39,688 |
| 1 Earner | 346 (28.9%) | $68,576 |
| 2 Earners | 547 (45.6%) | $92,404 |
| 3+ Earners | 154 (12.8%) | $73,901 |
| Total | 1,199 (100.0%) | $73,750 |
Household Income in Battlement Mesa
Household Income Brackets in Battlement Mesa
With 579 households falling in the category, the $50,000 to $74,999 income range is the most frequent in Battlement Mesa, accounting for 29.7% of all households.
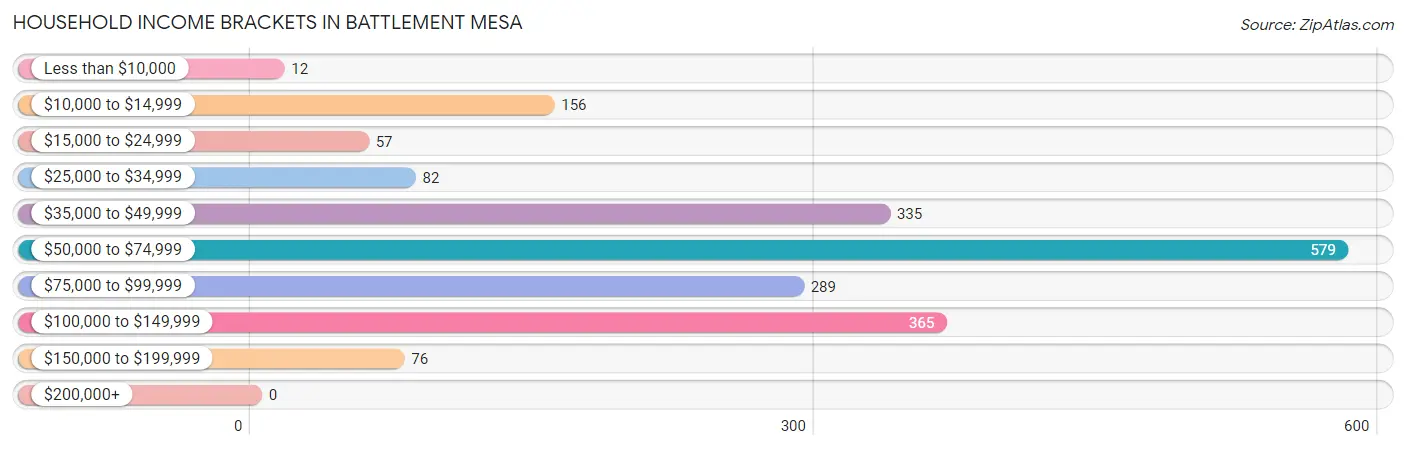
| Income Bracket | # Households | % Households |
| Less than $10,000 | 12 | 0.6% |
| $10,000 to $14,999 | 156 | 8.0% |
| $15,000 to $24,999 | 57 | 2.9% |
| $25,000 to $34,999 | 82 | 4.2% |
| $35,000 to $49,999 | 335 | 17.2% |
| $50,000 to $74,999 | 579 | 29.7% |
| $75,000 to $99,999 | 289 | 14.8% |
| $100,000 to $149,999 | 365 | 18.7% |
| $150,000 to $199,999 | 76 | 3.9% |
| $200,000+ | 0 | 0.0% |
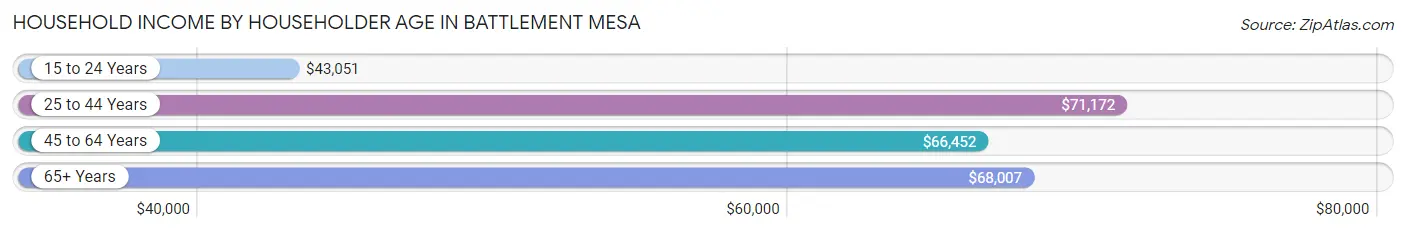
Household Income by Householder Age in Battlement Mesa
The median household income in Battlement Mesa is $66,737, with the highest median household income of $71,172 found in the 25 to 44 years age bracket for the primary householder. A total of 745 households (38.2%) fall into this category. Meanwhile, the 15 to 24 years age bracket for the primary householder has the lowest median household income of $43,051, with 77 households (4.0%) in this group.
| Income Bracket | # Households | Median Income |
| 15 to 24 Years | 77 (4.0%) | $43,051 |
| 25 to 44 Years | 745 (38.2%) | $71,172 |
| 45 to 64 Years | 583 (29.9%) | $66,452 |
| 65+ Years | 545 (28.0%) | $68,007 |
| Total | 1,950 (100.0%) | $66,737 |
Poverty in Battlement Mesa
Income Below Poverty by Sex and Age in Battlement Mesa
With 3.8% poverty level for males and 9.2% for females among the residents of Battlement Mesa, 15 year old males and 55 to 64 year old females are the most vulnerable to poverty, with 14 males (21.5%) and 61 females (18.4%) in their respective age groups living below the poverty level.
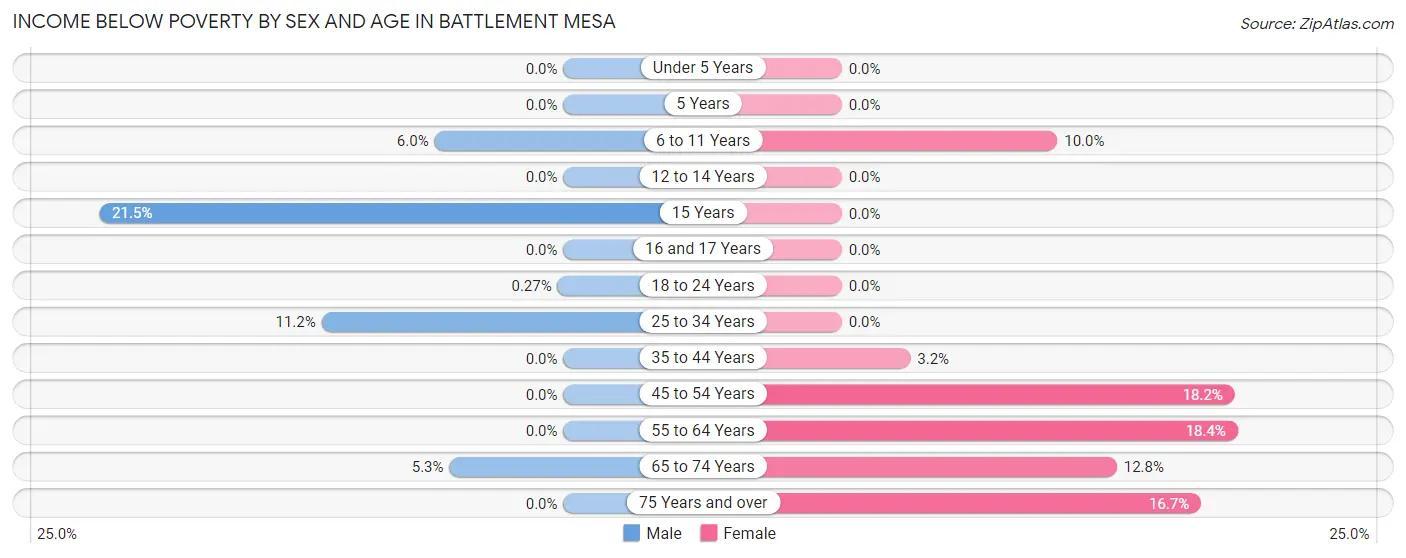
| Age Bracket | Male | Female |
| Under 5 Years | 0 (0.0%) | 0 (0.0%) |
| 5 Years | 0 (0.0%) | 0 (0.0%) |
| 6 to 11 Years | 25 (6.0%) | 17 (10.0%) |
| 12 to 14 Years | 0 (0.0%) | 0 (0.0%) |
| 15 Years | 14 (21.5%) | 0 (0.0%) |
| 16 and 17 Years | 0 (0.0%) | 0 (0.0%) |
| 18 to 24 Years | 1 (0.3%) | 0 (0.0%) |
| 25 to 34 Years | 55 (11.2%) | 0 (0.0%) |
| 35 to 44 Years | 0 (0.0%) | 10 (3.2%) |
| 45 to 54 Years | 0 (0.0%) | 64 (18.2%) |
| 55 to 64 Years | 0 (0.0%) | 61 (18.4%) |
| 65 to 74 Years | 11 (5.3%) | 25 (12.8%) |
| 75 Years and over | 0 (0.0%) | 40 (16.7%) |
| Total | 106 (3.8%) | 217 (9.2%) |
Income Above Poverty by Sex and Age in Battlement Mesa
According to the poverty statistics in Battlement Mesa, males aged under 5 years and females aged under 5 years are the age groups that are most secure financially, with 100.0% of males and 100.0% of females in these age groups living above the poverty line.
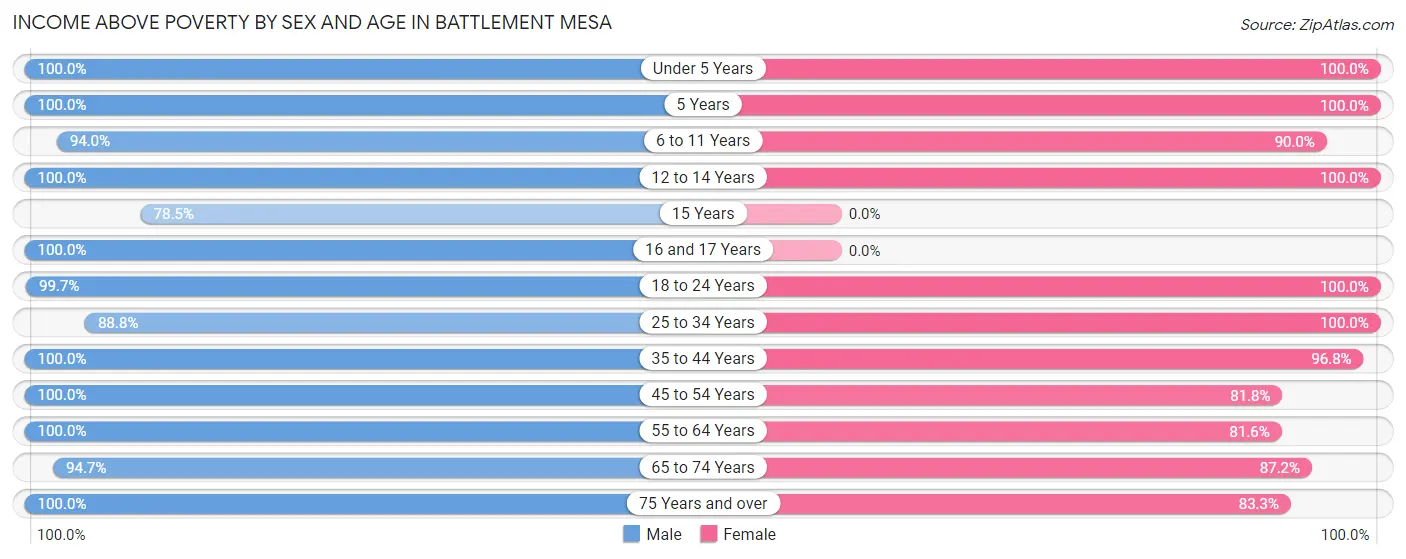
| Age Bracket | Male | Female |
| Under 5 Years | 334 (100.0%) | 63 (100.0%) |
| 5 Years | 76 (100.0%) | 42 (100.0%) |
| 6 to 11 Years | 393 (94.0%) | 153 (90.0%) |
| 12 to 14 Years | 31 (100.0%) | 122 (100.0%) |
| 15 Years | 51 (78.5%) | 0 (0.0%) |
| 16 and 17 Years | 102 (100.0%) | 0 (0.0%) |
| 18 to 24 Years | 372 (99.7%) | 155 (100.0%) |
| 25 to 34 Years | 435 (88.8%) | 365 (100.0%) |
| 35 to 44 Years | 145 (100.0%) | 304 (96.8%) |
| 45 to 54 Years | 54 (100.0%) | 287 (81.8%) |
| 55 to 64 Years | 326 (100.0%) | 271 (81.6%) |
| 65 to 74 Years | 197 (94.7%) | 171 (87.2%) |
| 75 Years and over | 176 (100.0%) | 200 (83.3%) |
| Total | 2,692 (96.2%) | 2,133 (90.8%) |
Income Below Poverty Among Married-Couple Families in Battlement Mesa
The poverty statistics for married-couple families in Battlement Mesa show that 1.1% or 11 of the total 956 families live below the poverty line. Families with no children have the highest poverty rate of 3.1%, comprising of 11 families. On the other hand, families with 1 or 2 children have the lowest poverty rate of 0.0%, which includes 0 families.
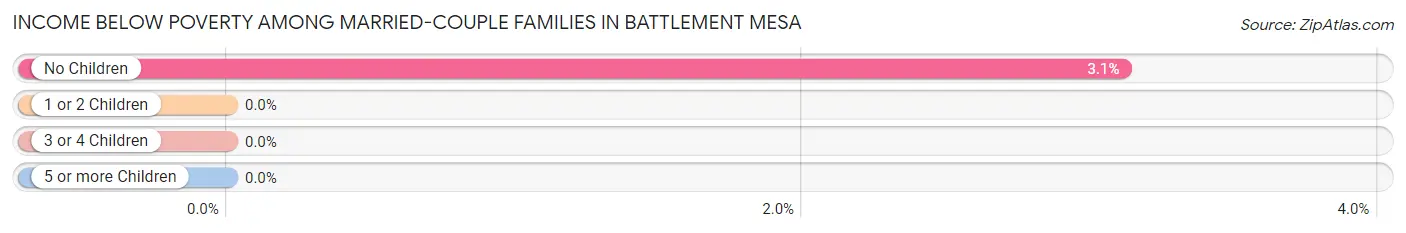
| Children | Above Poverty | Below Poverty |
| No Children | 343 (96.9%) | 11 (3.1%) |
| 1 or 2 Children | 457 (100.0%) | 0 (0.0%) |
| 3 or 4 Children | 145 (100.0%) | 0 (0.0%) |
| 5 or more Children | 0 (0.0%) | 0 (0.0%) |
| Total | 945 (98.9%) | 11 (1.1%) |
Income Below Poverty Among Single-Parent Households in Battlement Mesa
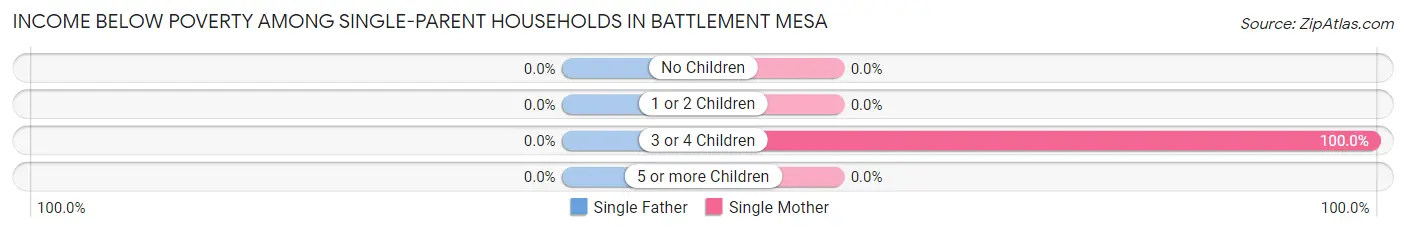
| Children | Single Father | Single Mother |
| No Children | 0 (0.0%) | 0 (0.0%) |
| 1 or 2 Children | 0 (0.0%) | 0 (0.0%) |
| 3 or 4 Children | 0 (0.0%) | 10 (100.0%) |
| 5 or more Children | 0 (0.0%) | 0 (0.0%) |
| Total | 0 (0.0%) | 10 (7.8%) |
Income Below Poverty Among Married-Couple vs Single-Parent Households in Battlement Mesa
The poverty data for Battlement Mesa shows that 11 of the married-couple family households (1.1%) and 10 of the single-parent households (4.1%) are living below the poverty level. Within the married-couple family households, those with no children have the highest poverty rate, with 11 households (3.1%) falling below the poverty line. Among the single-parent households, those with 3 or 4 children have the highest poverty rate, with 10 household (100.0%) living below poverty.
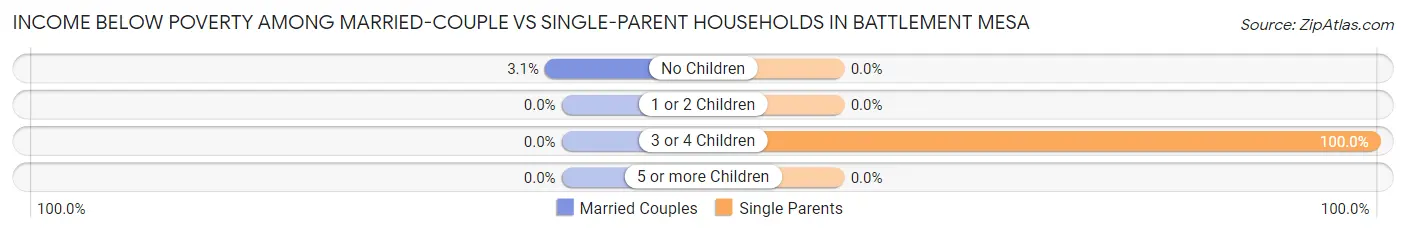
| Children | Married-Couple Families | Single-Parent Households |
| No Children | 11 (3.1%) | 0 (0.0%) |
| 1 or 2 Children | 0 (0.0%) | 0 (0.0%) |
| 3 or 4 Children | 0 (0.0%) | 10 (100.0%) |
| 5 or more Children | 0 (0.0%) | 0 (0.0%) |
| Total | 11 (1.1%) | 10 (4.1%) |
Race in Battlement Mesa
The most populous races in Battlement Mesa are White / Caucasian (3,888 | 75.5%), Hispanic or Latino (1,349 | 26.2%), and Some other Race (1,150 | 22.3%).
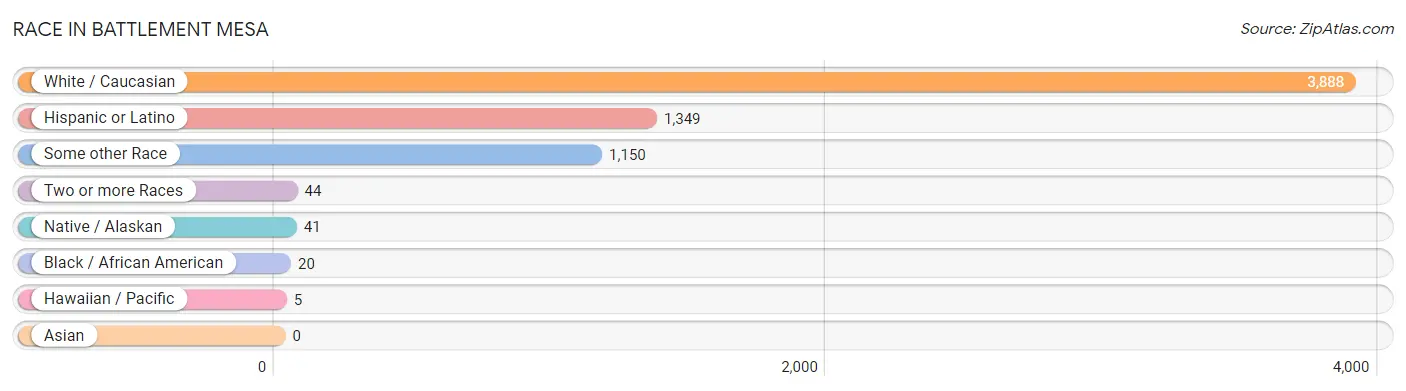
| Race | # Population | % Population |
| Asian | 0 | 0.0% |
| Black / African American | 20 | 0.4% |
| Hawaiian / Pacific | 5 | 0.1% |
| Hispanic or Latino | 1,349 | 26.2% |
| Native / Alaskan | 41 | 0.8% |
| White / Caucasian | 3,888 | 75.5% |
| Two or more Races | 44 | 0.9% |
| Some other Race | 1,150 | 22.3% |
| Total | 5,148 | 100.0% |
Ancestry in Battlement Mesa
The most populous ancestries reported in Battlement Mesa are Mexican (1,349 | 26.2%), German (901 | 17.5%), Irish (639 | 12.4%), English (574 | 11.2%), and Swiss (157 | 3.0%), together accounting for 70.3% of all Battlement Mesa residents.
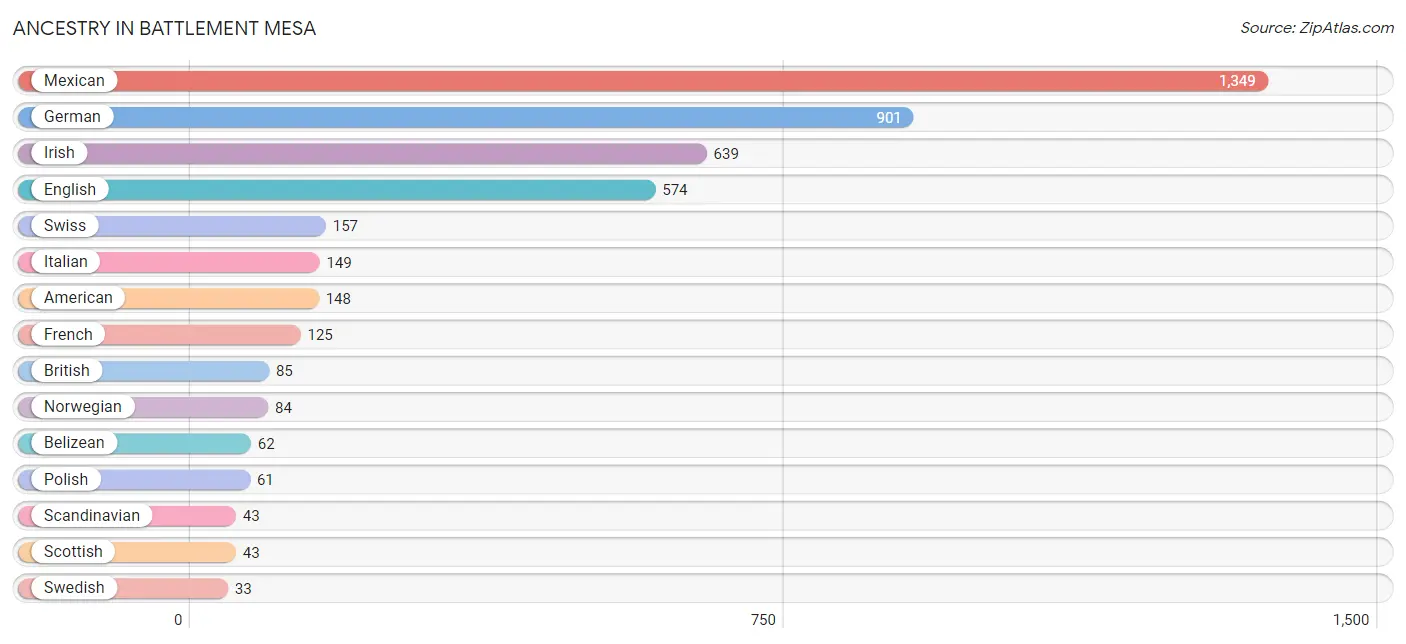
| Ancestry | # Population | % Population |
| American | 148 | 2.9% |
| Belizean | 62 | 1.2% |
| British | 85 | 1.7% |
| English | 574 | 11.2% |
| European | 31 | 0.6% |
| French | 125 | 2.4% |
| German | 901 | 17.5% |
| Irish | 639 | 12.4% |
| Italian | 149 | 2.9% |
| Mexican | 1,349 | 26.2% |
| Native Hawaiian | 5 | 0.1% |
| Northern European | 25 | 0.5% |
| Norwegian | 84 | 1.6% |
| Polish | 61 | 1.2% |
| Scandinavian | 43 | 0.8% |
| Scotch-Irish | 14 | 0.3% |
| Scottish | 43 | 0.8% |
| Swedish | 33 | 0.6% |
| Swiss | 157 | 3.0% | View All 19 Rows |
Immigrants in Battlement Mesa
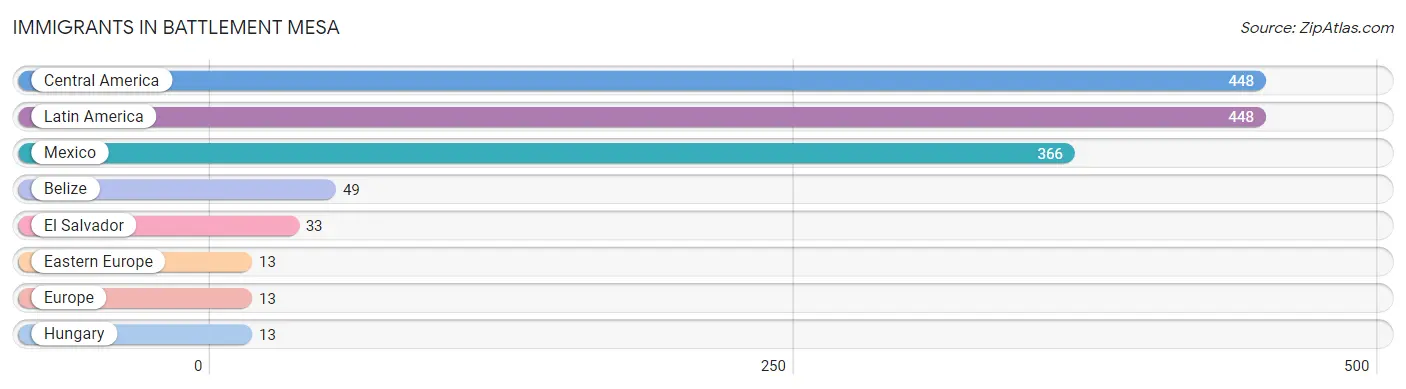
The most numerous immigrant groups reported in Battlement Mesa came from Central America (448 | 8.7%), Latin America (448 | 8.7%), Mexico (366 | 7.1%), Belize (49 | 0.9%), and El Salvador (33 | 0.6%), together accounting for 26.1% of all Battlement Mesa residents.
| Immigration Origin | # Population | % Population |
| Belize | 49 | 0.9% |
| Central America | 448 | 8.7% |
| Eastern Europe | 13 | 0.3% |
| El Salvador | 33 | 0.6% |
| Europe | 13 | 0.3% |
| Hungary | 13 | 0.3% |
| Latin America | 448 | 8.7% |
| Mexico | 366 | 7.1% | View All 8 Rows |
Sex and Age in Battlement Mesa
Sex and Age in Battlement Mesa
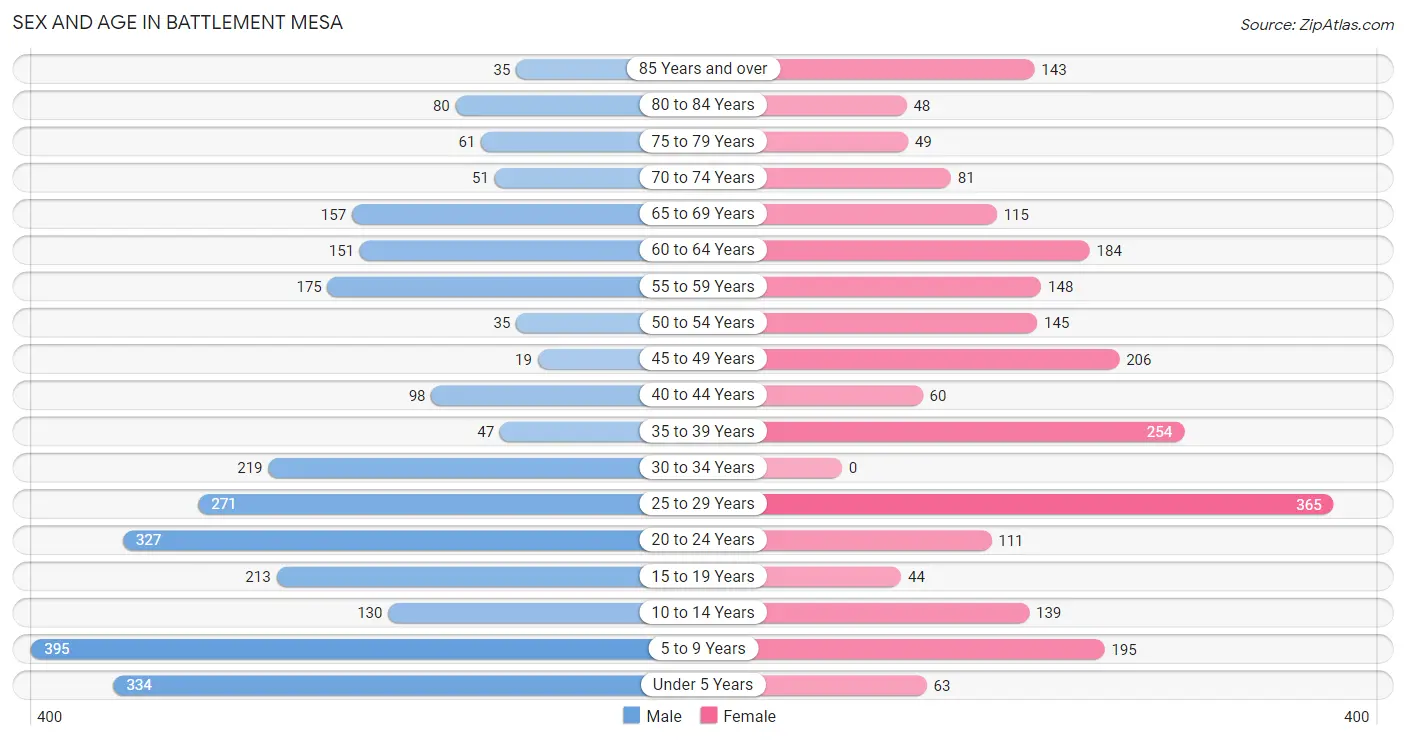
The most populous age groups in Battlement Mesa are 5 to 9 Years (395 | 14.1%) for men and 25 to 29 Years (365 | 15.5%) for women.
| Age Bracket | Male | Female |
| Under 5 Years | 334 (11.9%) | 63 (2.7%) |
| 5 to 9 Years | 395 (14.1%) | 195 (8.3%) |
| 10 to 14 Years | 130 (4.6%) | 139 (5.9%) |
| 15 to 19 Years | 213 (7.6%) | 44 (1.9%) |
| 20 to 24 Years | 327 (11.7%) | 111 (4.7%) |
| 25 to 29 Years | 271 (9.7%) | 365 (15.5%) |
| 30 to 34 Years | 219 (7.8%) | 0 (0.0%) |
| 35 to 39 Years | 47 (1.7%) | 254 (10.8%) |
| 40 to 44 Years | 98 (3.5%) | 60 (2.5%) |
| 45 to 49 Years | 19 (0.7%) | 206 (8.8%) |
| 50 to 54 Years | 35 (1.3%) | 145 (6.2%) |
| 55 to 59 Years | 175 (6.2%) | 148 (6.3%) |
| 60 to 64 Years | 151 (5.4%) | 184 (7.8%) |
| 65 to 69 Years | 157 (5.6%) | 115 (4.9%) |
| 70 to 74 Years | 51 (1.8%) | 81 (3.5%) |
| 75 to 79 Years | 61 (2.2%) | 49 (2.1%) |
| 80 to 84 Years | 80 (2.9%) | 48 (2.0%) |
| 85 Years and over | 35 (1.3%) | 143 (6.1%) |
| Total | 2,798 (100.0%) | 2,350 (100.0%) |
Families and Households in Battlement Mesa
Median Family Size in Battlement Mesa
The median family size in Battlement Mesa is 3.51 persons per family, with married-couple families (956 | 79.7%) accounting for the largest median family size of 3.63 persons per family. On the other hand, single female/mother families (128 | 10.7%) represent the smallest median family size with 2.98 persons per family.
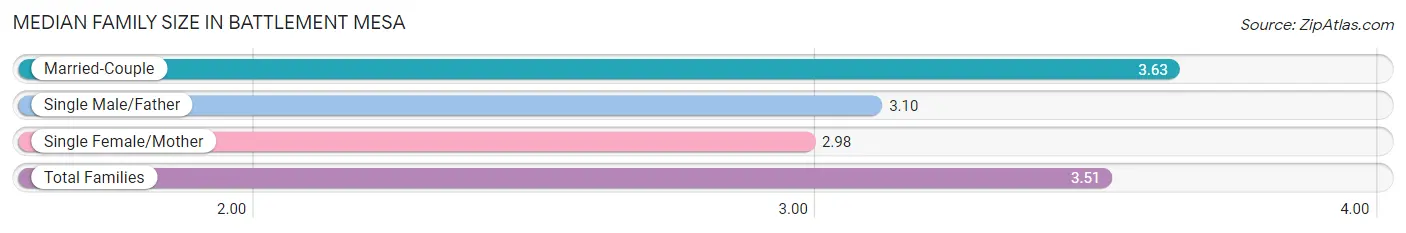
| Family Type | # Families | Family Size |
| Married-Couple | 956 (79.7%) | 3.63 |
| Single Male/Father | 115 (9.6%) | 3.10 |
| Single Female/Mother | 128 (10.7%) | 2.98 |
| Total Families | 1,199 (100.0%) | 3.51 |
Median Household Size in Battlement Mesa
The median household size in Battlement Mesa is 2.63 persons per household, with married-couple households (956 | 49.0%) accounting for the largest median household size of 3.63 persons per household. non-family households (751 | 38.5%) represent the smallest median household size with 1.16 persons per household.
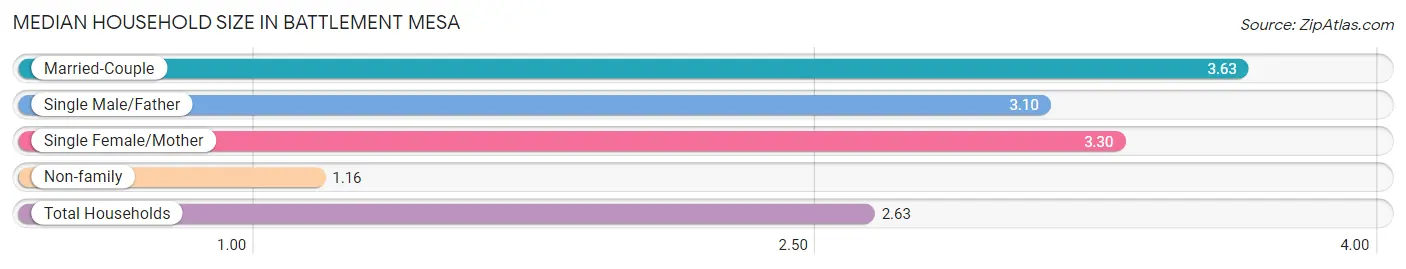
| Household Type | # Households | Household Size |
| Married-Couple | 956 (49.0%) | 3.63 |
| Single Male/Father | 115 (5.9%) | 3.10 |
| Single Female/Mother | 128 (6.6%) | 3.30 |
| Non-family | 751 (38.5%) | 1.16 |
| Total Households | 1,950 (100.0%) | 2.63 |
Household Size by Marriage Status in Battlement Mesa
Out of a total of 1,950 households in Battlement Mesa, 1,199 (61.5%) are family households, while 751 (38.5%) are nonfamily households. The most numerous type of family households are 2-person households, comprising 418, and the most common type of nonfamily households are 1-person households, comprising 655.
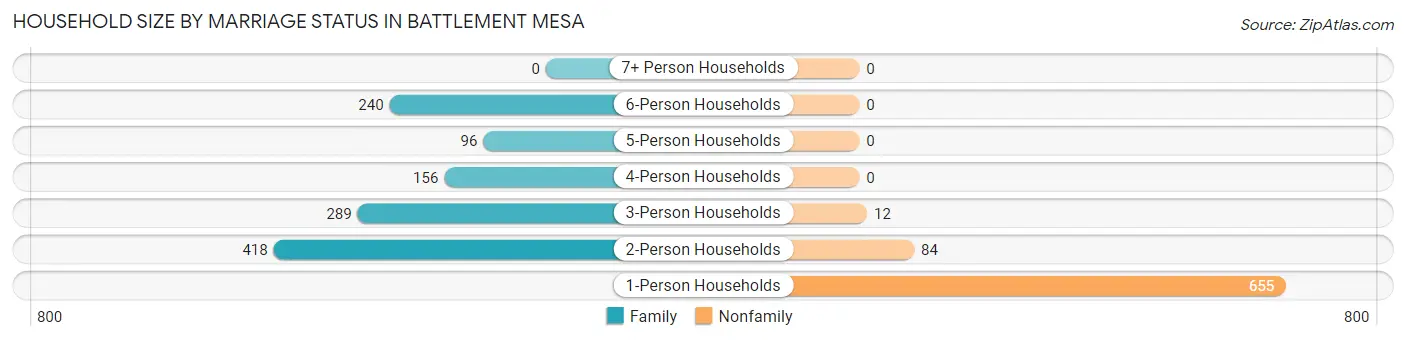
| Household Size | Family Households | Nonfamily Households |
| 1-Person Households | - | 655 (33.6%) |
| 2-Person Households | 418 (21.4%) | 84 (4.3%) |
| 3-Person Households | 289 (14.8%) | 12 (0.6%) |
| 4-Person Households | 156 (8.0%) | 0 (0.0%) |
| 5-Person Households | 96 (4.9%) | 0 (0.0%) |
| 6-Person Households | 240 (12.3%) | 0 (0.0%) |
| 7+ Person Households | 0 (0.0%) | 0 (0.0%) |
| Total | 1,199 (61.5%) | 751 (38.5%) |
Female Fertility in Battlement Mesa
Fertility by Age in Battlement Mesa
Average fertility rate in Battlement Mesa is 53.0 births per 1,000 women. Women in the age bracket of 20 to 34 years have the highest fertility rate with 116.0 births per 1,000 women. Women in the age bracket of 20 to 34 years acount for 100.0% of all women with births.
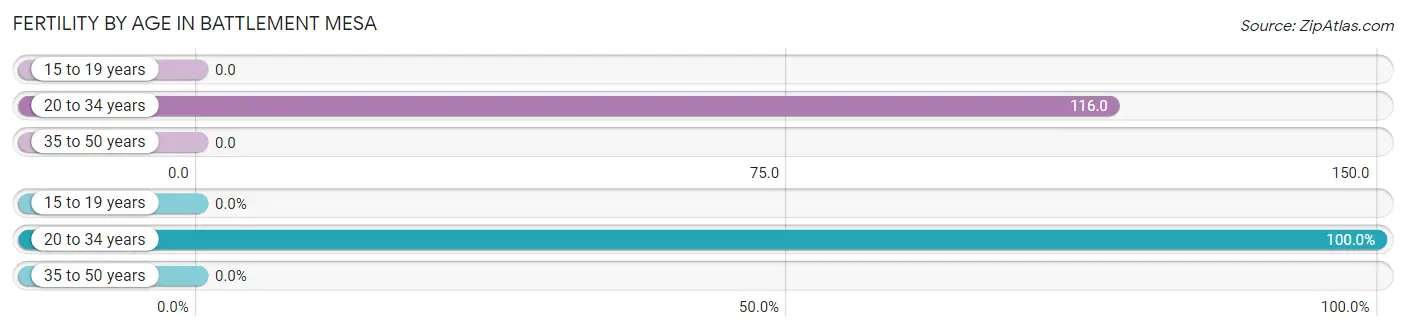
| Age Bracket | Women with Births | Births / 1,000 Women |
| 15 to 19 years | 0 (0.0%) | 0.0 |
| 20 to 34 years | 55 (100.0%) | 116.0 |
| 35 to 50 years | 0 (0.0%) | 0.0 |
| Total | 55 (100.0%) | 53.0 |
Fertility by Age by Marriage Status in Battlement Mesa
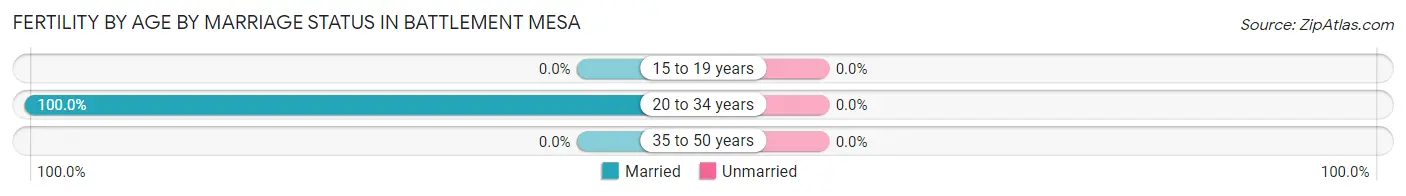
| Age Bracket | Married | Unmarried |
| 15 to 19 years | 0 (0.0%) | 0 (0.0%) |
| 20 to 34 years | 55 (100.0%) | 0 (0.0%) |
| 35 to 50 years | 0 (0.0%) | 0 (0.0%) |
| Total | 55 (100.0%) | 0 (0.0%) |
Fertility by Education in Battlement Mesa
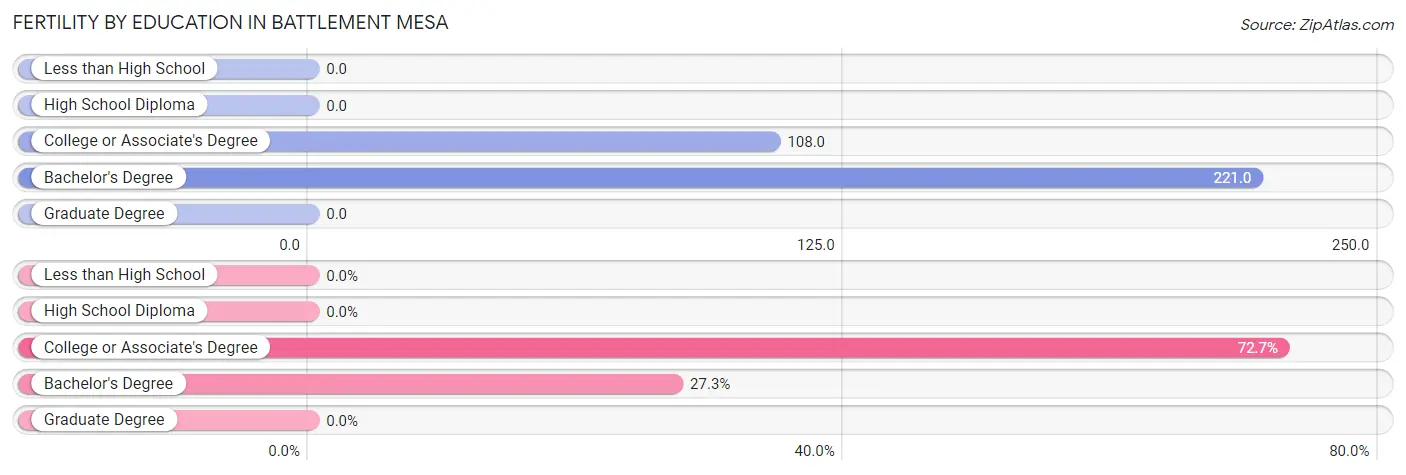
| Educational Attainment | Women with Births | Births / 1,000 Women |
| Less than High School | 0 (0.0%) | 0.0 |
| High School Diploma | 0 (0.0%) | 0.0 |
| College or Associate's Degree | 40 (72.7%) | 108.0 |
| Bachelor's Degree | 15 (27.3%) | 221.0 |
| Graduate Degree | 0 (0.0%) | 0.0 |
| Total | 55 (100.0%) | 53.0 |
Fertility by Education by Marriage Status in Battlement Mesa
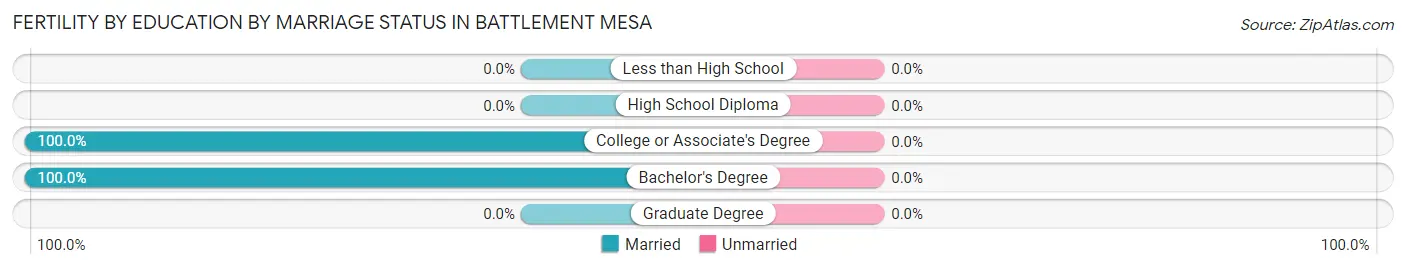
| Educational Attainment | Married | Unmarried |
| Less than High School | 0 (0.0%) | 0 (0.0%) |
| High School Diploma | 0 (0.0%) | 0 (0.0%) |
| College or Associate's Degree | 40 (100.0%) | 0 (0.0%) |
| Bachelor's Degree | 15 (100.0%) | 0 (0.0%) |
| Graduate Degree | 0 (0.0%) | 0 (0.0%) |
| Total | 55 (100.0%) | 0 (0.0%) |
Employment Characteristics in Battlement Mesa
Employment by Class of Employer in Battlement Mesa
Among the 2,205 employed individuals in Battlement Mesa, private company employees (1,588 | 72.0%), local government employees (266 | 12.1%), and self-employed (not incorporated) (101 | 4.6%) make up the most common classes of employment.
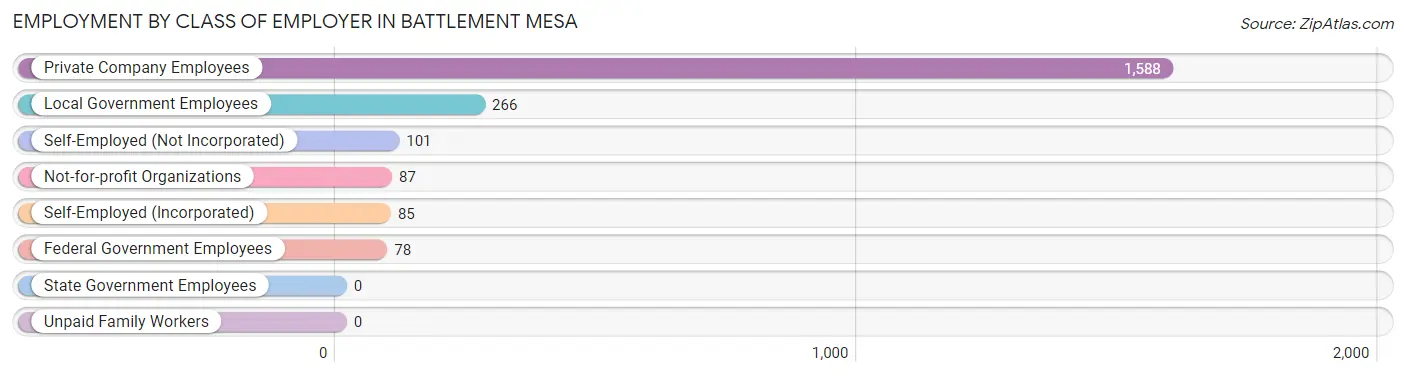
| Employer Class | # Employees | % Employees |
| Private Company Employees | 1,588 | 72.0% |
| Self-Employed (Incorporated) | 85 | 3.8% |
| Self-Employed (Not Incorporated) | 101 | 4.6% |
| Not-for-profit Organizations | 87 | 4.0% |
| Local Government Employees | 266 | 12.1% |
| State Government Employees | 0 | 0.0% |
| Federal Government Employees | 78 | 3.5% |
| Unpaid Family Workers | 0 | 0.0% |
| Total | 2,205 | 100.0% |
Employment Status by Age in Battlement Mesa
According to the labor force statistics for Battlement Mesa, out of the total population over 16 years of age (3,827), 60.4% or 2,312 individuals are in the labor force, with 1.6% or 37 of them unemployed. The age group with the highest labor force participation rate is 30 to 34 years, with 92.7% or 203 individuals in the labor force. Within the labor force, the 35 to 44 years age range has the highest percentage of unemployed individuals, with 8.0% or 31 of them being unemployed.
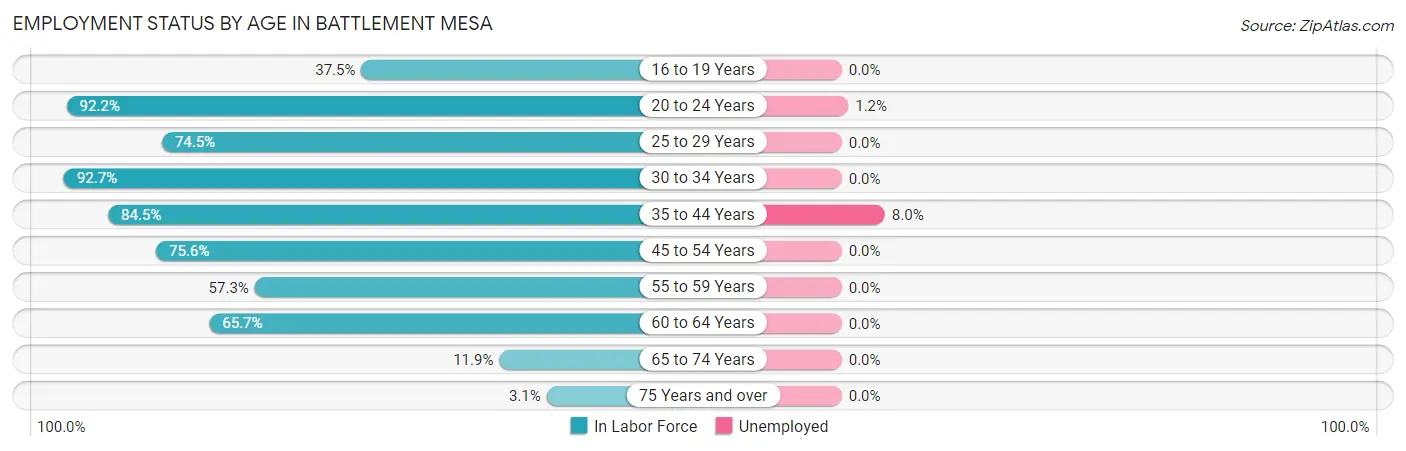
| Age Bracket | In Labor Force | Unemployed |
| 16 to 19 Years | 72 (37.5%) | 0 (0.0%) |
| 20 to 24 Years | 404 (92.2%) | 5 (1.2%) |
| 25 to 29 Years | 474 (74.5%) | 0 (0.0%) |
| 30 to 34 Years | 203 (92.7%) | 0 (0.0%) |
| 35 to 44 Years | 388 (84.5%) | 31 (8.0%) |
| 45 to 54 Years | 306 (75.6%) | 0 (0.0%) |
| 55 to 59 Years | 185 (57.3%) | 0 (0.0%) |
| 60 to 64 Years | 220 (65.7%) | 0 (0.0%) |
| 65 to 74 Years | 48 (11.9%) | 0 (0.0%) |
| 75 Years and over | 13 (3.1%) | 0 (0.0%) |
| Total | 2,312 (60.4%) | 37 (1.6%) |
Employment Status by Educational Attainment in Battlement Mesa
According to labor force statistics for Battlement Mesa, 74.7% of individuals (1,776) out of the total population between 25 and 64 years of age (2,377) are in the labor force, with 1.7% or 30 of them being unemployed. The group with the highest labor force participation rate are those with the educational attainment of bachelor's degree or higher, with 95.9% or 370 individuals in the labor force. Within the labor force, individuals with bachelor's degree or higher education have the highest percentage of unemployment, with 8.4% or 31 of them being unemployed.
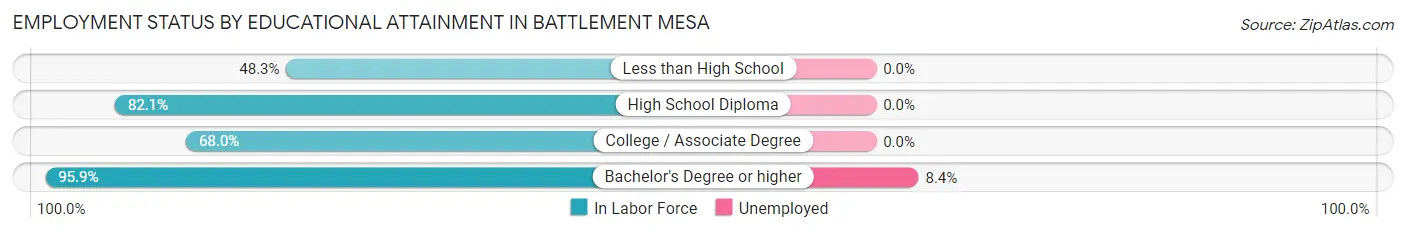
| Educational Attainment | In Labor Force | Unemployed |
| Less than High School | 161 (48.3%) | 0 (0.0%) |
| High School Diploma | 683 (82.1%) | 0 (0.0%) |
| College / Associate Degree | 562 (68.0%) | 0 (0.0%) |
| Bachelor's Degree or higher | 370 (95.9%) | 32 (8.4%) |
| Total | 1,776 (74.7%) | 40 (1.7%) |
Employment Occupations by Sex in Battlement Mesa
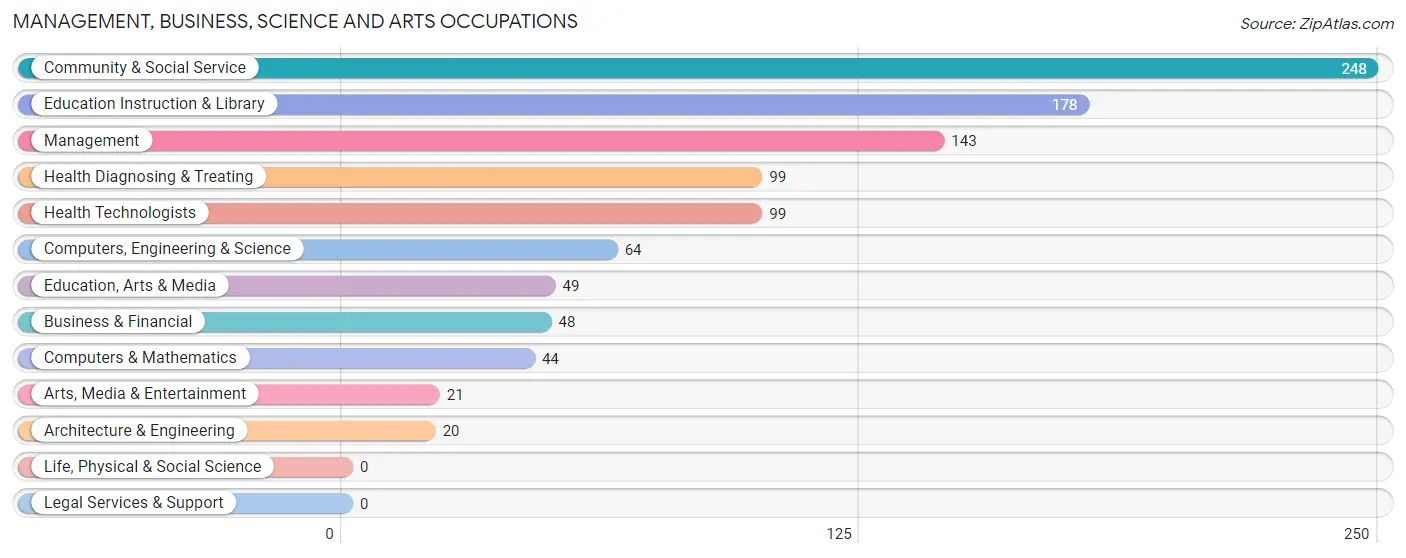
Management, Business, Science and Arts Occupations
The most common Management, Business, Science and Arts occupations in Battlement Mesa are Community & Social Service (248 | 10.9%), Education Instruction & Library (178 | 7.8%), Management (143 | 6.3%), Health Diagnosing & Treating (99 | 4.3%), and Health Technologists (99 | 4.3%).
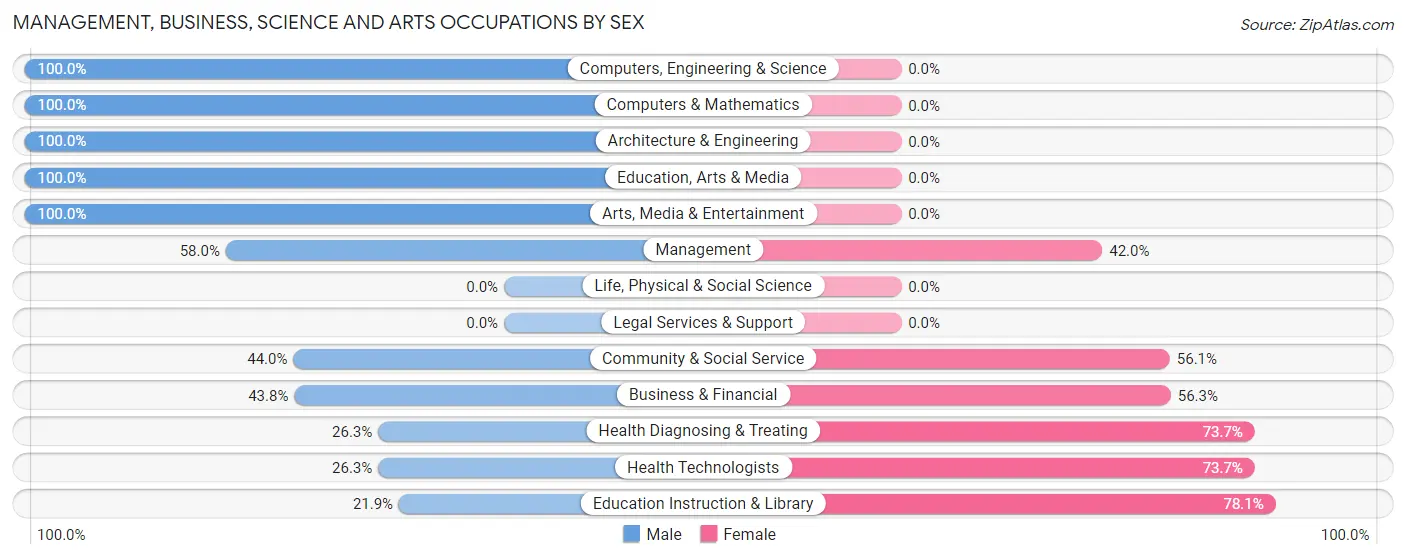
Management, Business, Science and Arts Occupations by Sex
Within the Management, Business, Science and Arts occupations in Battlement Mesa, the most male-oriented occupations are Computers, Engineering & Science (100.0%), Computers & Mathematics (100.0%), and Architecture & Engineering (100.0%), while the most female-oriented occupations are Education Instruction & Library (78.1%), Health Diagnosing & Treating (73.7%), and Health Technologists (73.7%).
| Occupation | Male | Female |
| Management | 83 (58.0%) | 60 (42.0%) |
| Business & Financial | 21 (43.8%) | 27 (56.2%) |
| Computers, Engineering & Science | 64 (100.0%) | 0 (0.0%) |
| Computers & Mathematics | 44 (100.0%) | 0 (0.0%) |
| Architecture & Engineering | 20 (100.0%) | 0 (0.0%) |
| Life, Physical & Social Science | 0 (0.0%) | 0 (0.0%) |
| Community & Social Service | 109 (44.0%) | 139 (56.0%) |
| Education, Arts & Media | 49 (100.0%) | 0 (0.0%) |
| Legal Services & Support | 0 (0.0%) | 0 (0.0%) |
| Education Instruction & Library | 39 (21.9%) | 139 (78.1%) |
| Arts, Media & Entertainment | 21 (100.0%) | 0 (0.0%) |
| Health Diagnosing & Treating | 26 (26.3%) | 73 (73.7%) |
| Health Technologists | 26 (26.3%) | 73 (73.7%) |
| Total (Category) | 303 (50.3%) | 299 (49.7%) |
| Total (Overall) | 1,199 (52.7%) | 1,078 (47.3%) |
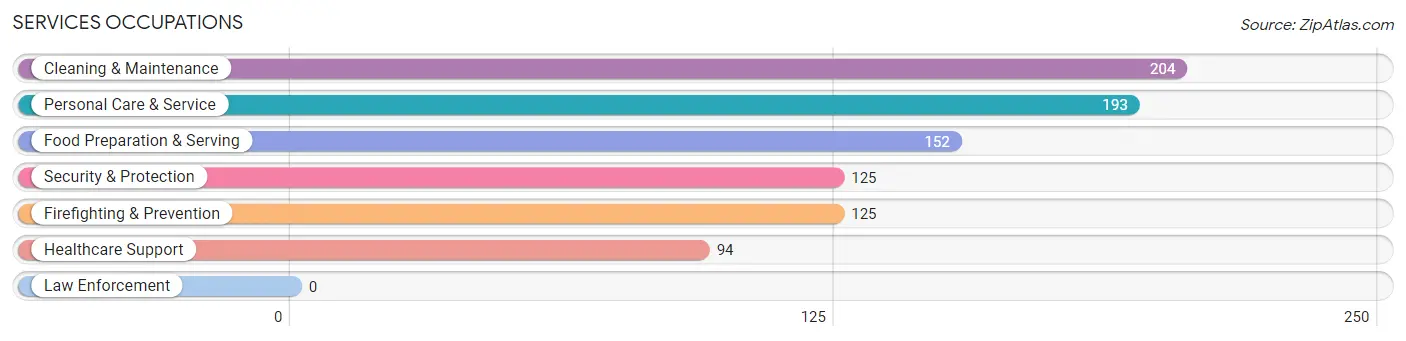
Services Occupations
The most common Services occupations in Battlement Mesa are Cleaning & Maintenance (204 | 9.0%), Personal Care & Service (193 | 8.5%), Food Preparation & Serving (152 | 6.7%), Security & Protection (125 | 5.5%), and Firefighting & Prevention (125 | 5.5%).
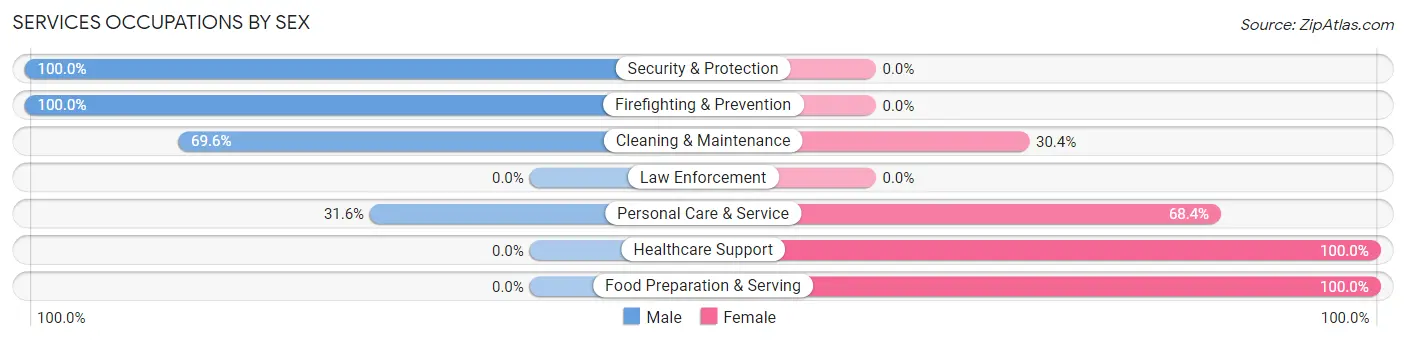
Services Occupations by Sex
Within the Services occupations in Battlement Mesa, the most male-oriented occupations are Security & Protection (100.0%), Firefighting & Prevention (100.0%), and Cleaning & Maintenance (69.6%), while the most female-oriented occupations are Healthcare Support (100.0%), Food Preparation & Serving (100.0%), and Personal Care & Service (68.4%).
| Occupation | Male | Female |
| Healthcare Support | 0 (0.0%) | 94 (100.0%) |
| Security & Protection | 125 (100.0%) | 0 (0.0%) |
| Firefighting & Prevention | 125 (100.0%) | 0 (0.0%) |
| Law Enforcement | 0 (0.0%) | 0 (0.0%) |
| Food Preparation & Serving | 0 (0.0%) | 152 (100.0%) |
| Cleaning & Maintenance | 142 (69.6%) | 62 (30.4%) |
| Personal Care & Service | 61 (31.6%) | 132 (68.4%) |
| Total (Category) | 328 (42.7%) | 440 (57.3%) |
| Total (Overall) | 1,199 (52.7%) | 1,078 (47.3%) |
Sales and Office Occupations
The most common Sales and Office occupations in Battlement Mesa are Office & Administration (184 | 8.1%), and Sales & Related (149 | 6.5%).
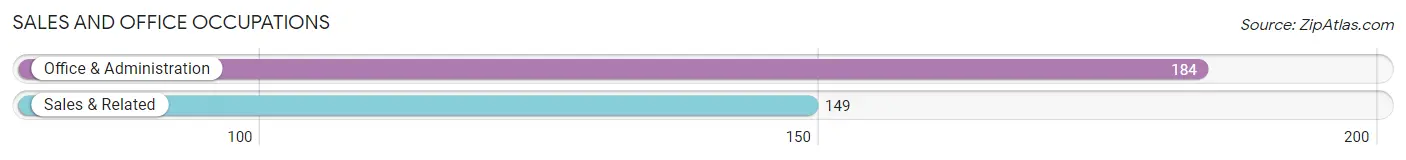
Sales and Office Occupations by Sex
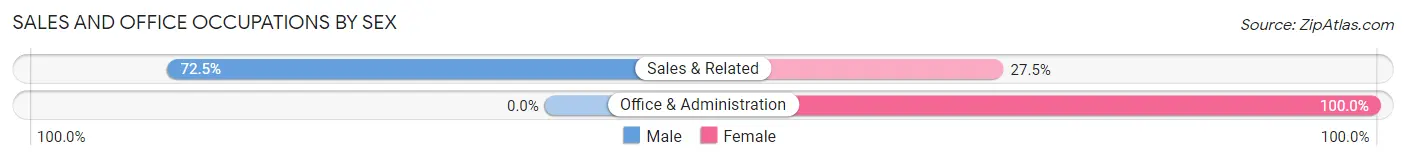
| Occupation | Male | Female |
| Sales & Related | 108 (72.5%) | 41 (27.5%) |
| Office & Administration | 0 (0.0%) | 184 (100.0%) |
| Total (Category) | 108 (32.4%) | 225 (67.6%) |
| Total (Overall) | 1,199 (52.7%) | 1,078 (47.3%) |
Natural Resources, Construction and Maintenance Occupations
The most common Natural Resources, Construction and Maintenance occupations in Battlement Mesa are , and Construction & Extraction (304 | 13.4%).
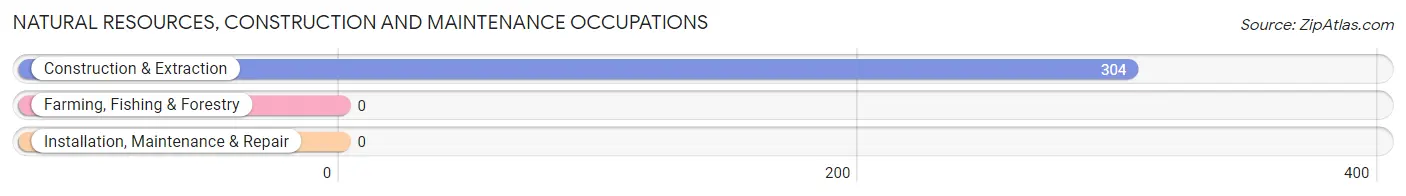
Natural Resources, Construction and Maintenance Occupations by Sex
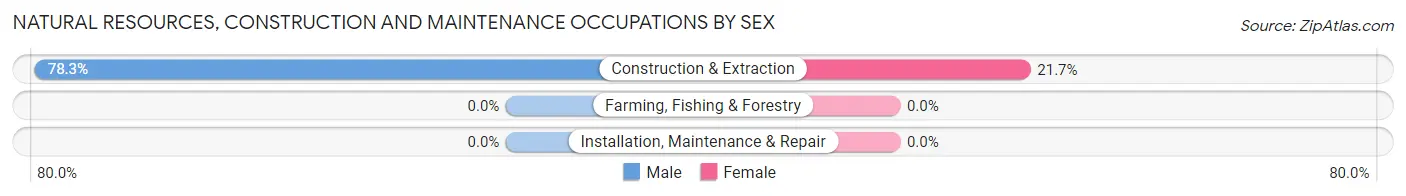
| Occupation | Male | Female |
| Farming, Fishing & Forestry | 0 (0.0%) | 0 (0.0%) |
| Construction & Extraction | 238 (78.3%) | 66 (21.7%) |
| Installation, Maintenance & Repair | 0 (0.0%) | 0 (0.0%) |
| Total (Category) | 238 (78.3%) | 66 (21.7%) |
| Total (Overall) | 1,199 (52.7%) | 1,078 (47.3%) |
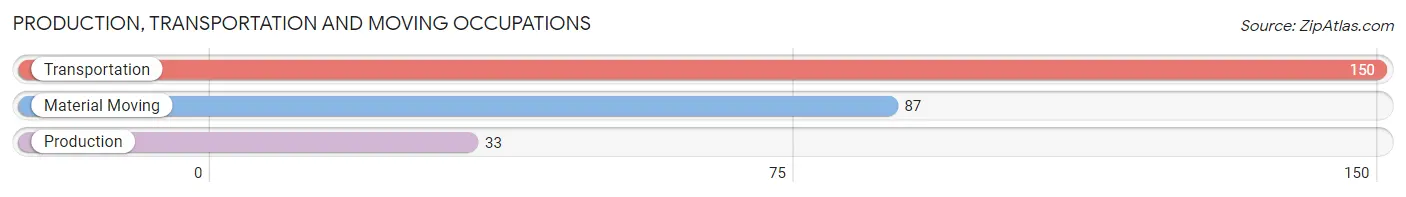
Production, Transportation and Moving Occupations
The most common Production, Transportation and Moving occupations in Battlement Mesa are Transportation (150 | 6.6%), Material Moving (87 | 3.8%), and Production (33 | 1.5%).
Production, Transportation and Moving Occupations by Sex
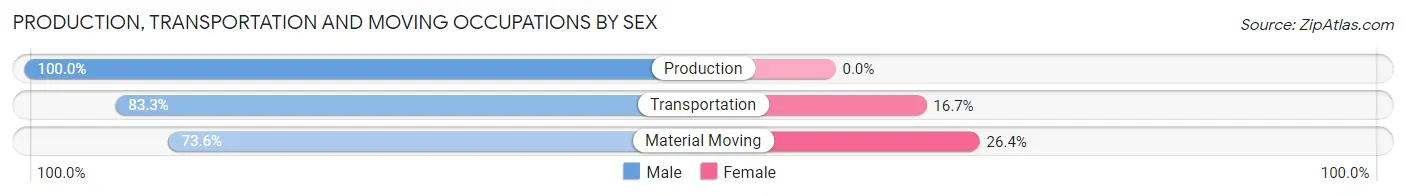
| Occupation | Male | Female |
| Production | 33 (100.0%) | 0 (0.0%) |
| Transportation | 125 (83.3%) | 25 (16.7%) |
| Material Moving | 64 (73.6%) | 23 (26.4%) |
| Total (Category) | 222 (82.2%) | 48 (17.8%) |
| Total (Overall) | 1,199 (52.7%) | 1,078 (47.3%) |
Employment Industries by Sex in Battlement Mesa
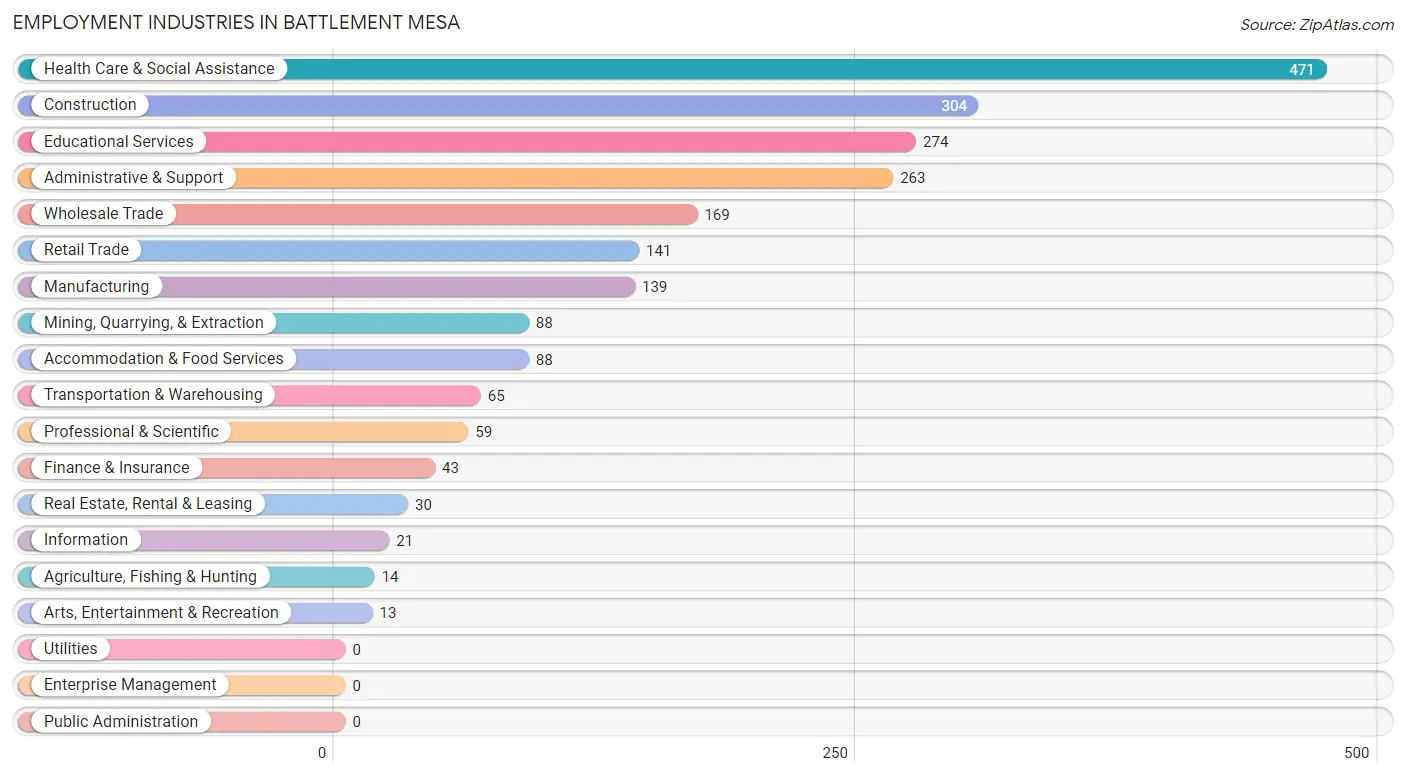
Employment Industries in Battlement Mesa
The major employment industries in Battlement Mesa include Health Care & Social Assistance (471 | 20.7%), Construction (304 | 13.4%), Educational Services (274 | 12.0%), Administrative & Support (263 | 11.6%), and Wholesale Trade (169 | 7.4%).
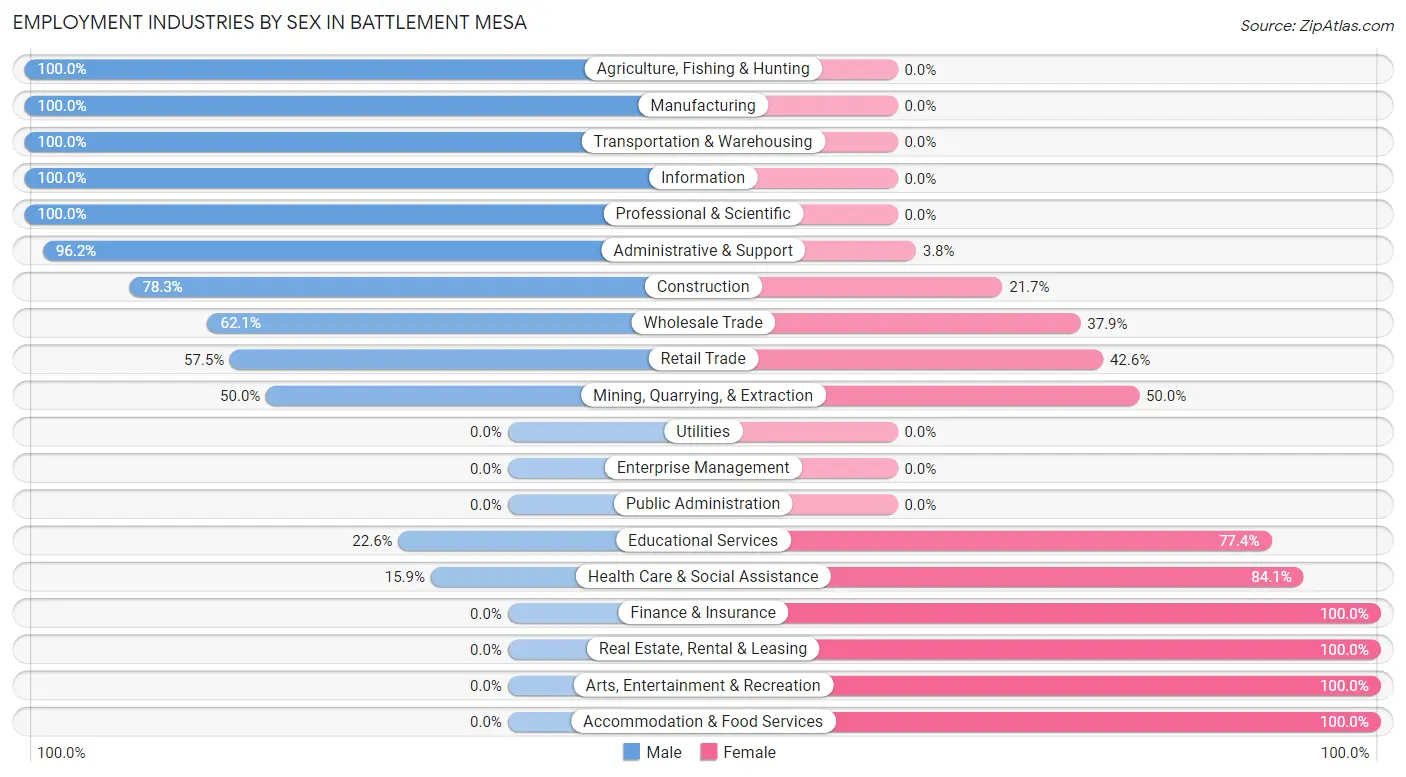
Employment Industries by Sex in Battlement Mesa
The Battlement Mesa industries that see more men than women are Agriculture, Fishing & Hunting (100.0%), Manufacturing (100.0%), and Transportation & Warehousing (100.0%), whereas the industries that tend to have a higher number of women are Finance & Insurance (100.0%), Real Estate, Rental & Leasing (100.0%), and Arts, Entertainment & Recreation (100.0%).
| Industry | Male | Female |
| Agriculture, Fishing & Hunting | 14 (100.0%) | 0 (0.0%) |
| Mining, Quarrying, & Extraction | 44 (50.0%) | 44 (50.0%) |
| Construction | 238 (78.3%) | 66 (21.7%) |
| Manufacturing | 139 (100.0%) | 0 (0.0%) |
| Wholesale Trade | 105 (62.1%) | 64 (37.9%) |
| Retail Trade | 81 (57.5%) | 60 (42.5%) |
| Transportation & Warehousing | 65 (100.0%) | 0 (0.0%) |
| Utilities | 0 (0.0%) | 0 (0.0%) |
| Information | 21 (100.0%) | 0 (0.0%) |
| Finance & Insurance | 0 (0.0%) | 43 (100.0%) |
| Real Estate, Rental & Leasing | 0 (0.0%) | 30 (100.0%) |
| Professional & Scientific | 59 (100.0%) | 0 (0.0%) |
| Enterprise Management | 0 (0.0%) | 0 (0.0%) |
| Administrative & Support | 253 (96.2%) | 10 (3.8%) |
| Educational Services | 62 (22.6%) | 212 (77.4%) |
| Health Care & Social Assistance | 75 (15.9%) | 396 (84.1%) |
| Arts, Entertainment & Recreation | 0 (0.0%) | 13 (100.0%) |
| Accommodation & Food Services | 0 (0.0%) | 88 (100.0%) |
| Public Administration | 0 (0.0%) | 0 (0.0%) |
| Total | 1,199 (52.7%) | 1,078 (47.3%) |
Education in Battlement Mesa
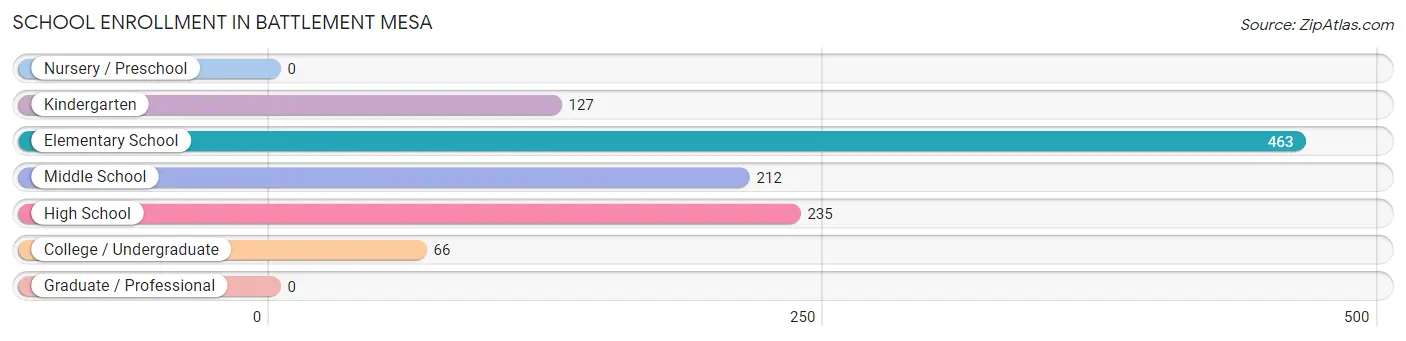
School Enrollment in Battlement Mesa
The most common levels of schooling among the 1,103 students in Battlement Mesa are elementary school (463 | 42.0%), high school (235 | 21.3%), and middle school (212 | 19.2%).
| School Level | # Students | % Students |
| Nursery / Preschool | 0 | 0.0% |
| Kindergarten | 127 | 11.5% |
| Elementary School | 463 | 42.0% |
| Middle School | 212 | 19.2% |
| High School | 235 | 21.3% |
| College / Undergraduate | 66 | 6.0% |
| Graduate / Professional | 0 | 0.0% |
| Total | 1,103 | 100.0% |
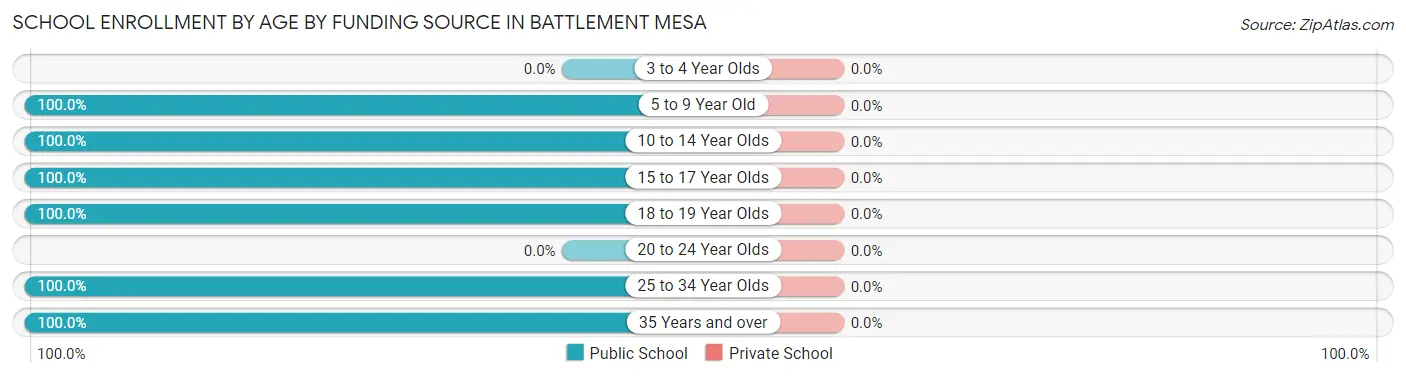
School Enrollment by Age by Funding Source in Battlement Mesa
| Age Bracket | Public School | Private School |
| 3 to 4 Year Olds | 0 (0.0%) | 0 (0.0%) |
| 5 to 9 Year Old | 590 (100.0%) | 0 (0.0%) |
| 10 to 14 Year Olds | 237 (100.0%) | 0 (0.0%) |
| 15 to 17 Year Olds | 167 (100.0%) | 0 (0.0%) |
| 18 to 19 Year Olds | 43 (100.0%) | 0 (0.0%) |
| 20 to 24 Year Olds | 0 (0.0%) | 0 (0.0%) |
| 25 to 34 Year Olds | 41 (100.0%) | 0 (0.0%) |
| 35 Years and over | 25 (100.0%) | 0 (0.0%) |
| Total | 1,103 (100.0%) | 0 (0.0%) |
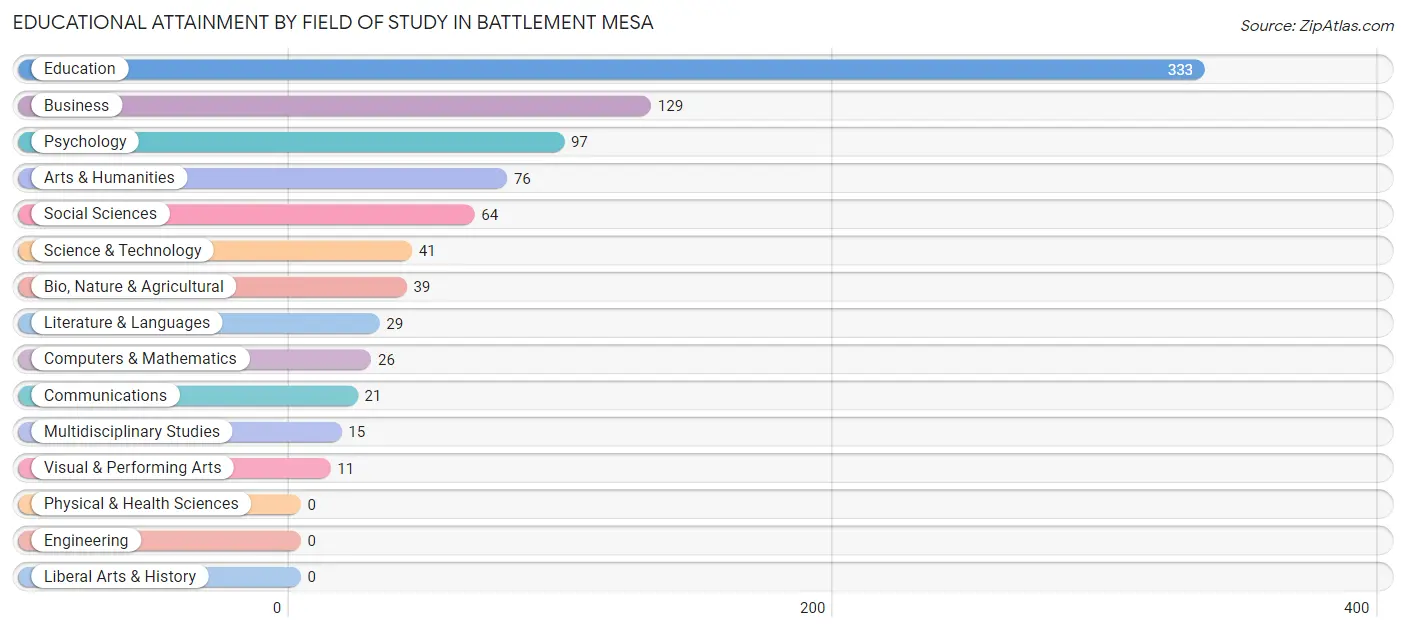
Educational Attainment by Field of Study in Battlement Mesa
Education (333 | 37.8%), business (129 | 14.6%), psychology (97 | 11.0%), arts & humanities (76 | 8.6%), and social sciences (64 | 7.3%) are the most common fields of study among 881 individuals in Battlement Mesa who have obtained a bachelor's degree or higher.
| Field of Study | # Graduates | % Graduates |
| Computers & Mathematics | 26 | 2.9% |
| Bio, Nature & Agricultural | 39 | 4.4% |
| Physical & Health Sciences | 0 | 0.0% |
| Psychology | 97 | 11.0% |
| Social Sciences | 64 | 7.3% |
| Engineering | 0 | 0.0% |
| Multidisciplinary Studies | 15 | 1.7% |
| Science & Technology | 41 | 4.6% |
| Business | 129 | 14.6% |
| Education | 333 | 37.8% |
| Literature & Languages | 29 | 3.3% |
| Liberal Arts & History | 0 | 0.0% |
| Visual & Performing Arts | 11 | 1.3% |
| Communications | 21 | 2.4% |
| Arts & Humanities | 76 | 8.6% |
| Total | 881 | 100.0% |
Transportation & Commute in Battlement Mesa
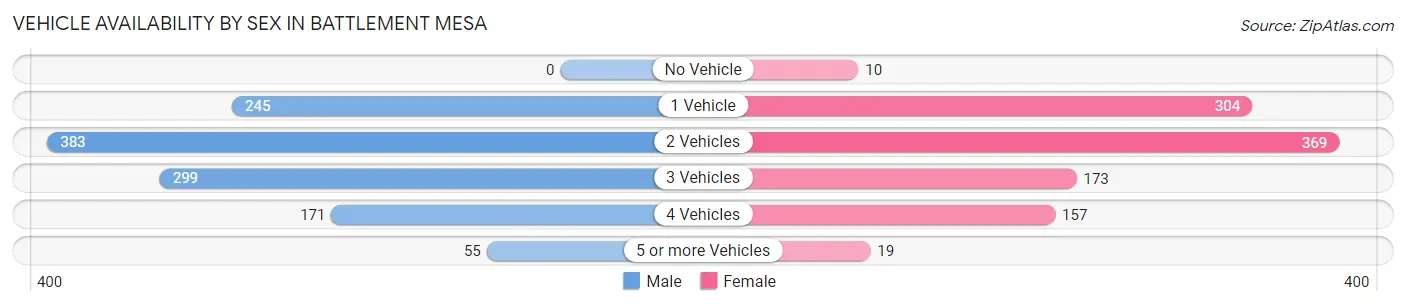
Vehicle Availability by Sex in Battlement Mesa
The most prevalent vehicle ownership categories in Battlement Mesa are males with 2 vehicles (383, accounting for 33.2%) and females with 2 vehicles (369, making up 37.1%).
| Vehicles Available | Male | Female |
| No Vehicle | 0 (0.0%) | 10 (1.0%) |
| 1 Vehicle | 245 (21.2%) | 304 (29.5%) |
| 2 Vehicles | 383 (33.2%) | 369 (35.8%) |
| 3 Vehicles | 299 (25.9%) | 173 (16.8%) |
| 4 Vehicles | 171 (14.8%) | 157 (15.2%) |
| 5 or more Vehicles | 55 (4.8%) | 19 (1.8%) |
| Total | 1,153 (100.0%) | 1,032 (100.0%) |
Commute Time in Battlement Mesa
The most frequently occuring commute durations in Battlement Mesa are 90 or more minutes (504 commuters, 23.9%), 45 to 59 minutes (393 commuters, 18.6%), and 10 to 14 minutes (362 commuters, 17.1%).
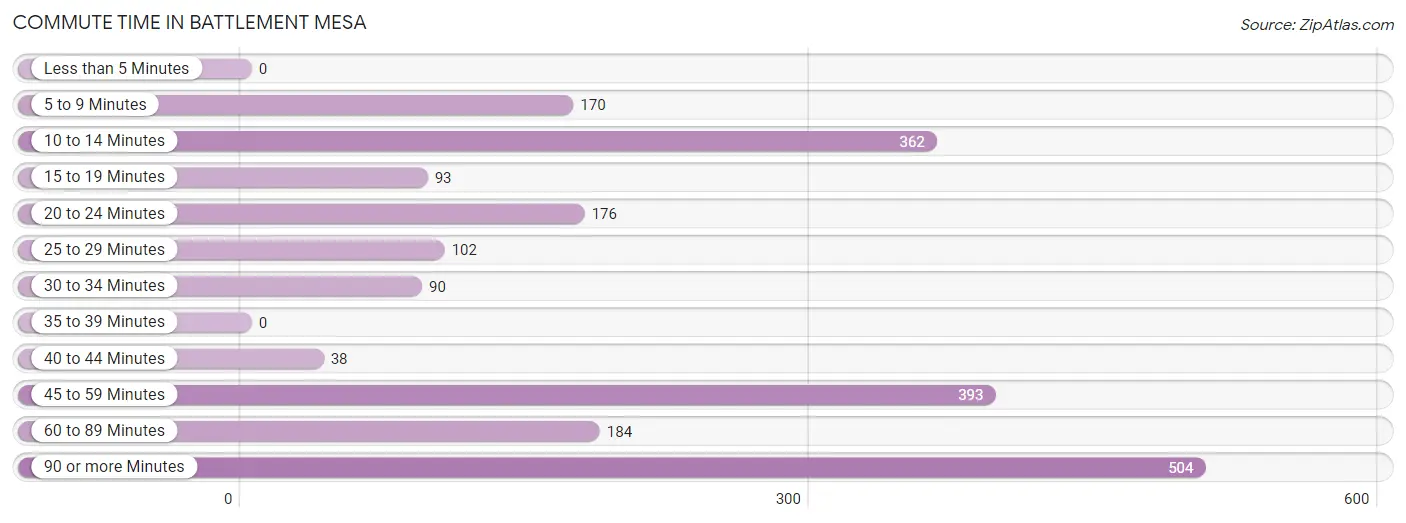
| Commute Time | # Commuters | % Commuters |
| Less than 5 Minutes | 0 | 0.0% |
| 5 to 9 Minutes | 170 | 8.1% |
| 10 to 14 Minutes | 362 | 17.1% |
| 15 to 19 Minutes | 93 | 4.4% |
| 20 to 24 Minutes | 176 | 8.3% |
| 25 to 29 Minutes | 102 | 4.8% |
| 30 to 34 Minutes | 90 | 4.3% |
| 35 to 39 Minutes | 0 | 0.0% |
| 40 to 44 Minutes | 38 | 1.8% |
| 45 to 59 Minutes | 393 | 18.6% |
| 60 to 89 Minutes | 184 | 8.7% |
| 90 or more Minutes | 504 | 23.9% |
Commute Time by Sex in Battlement Mesa
The most common commute times in Battlement Mesa are 90 or more minutes (438 commuters, 39.1%) for males and 10 to 14 minutes (275 commuters, 27.7%) for females.
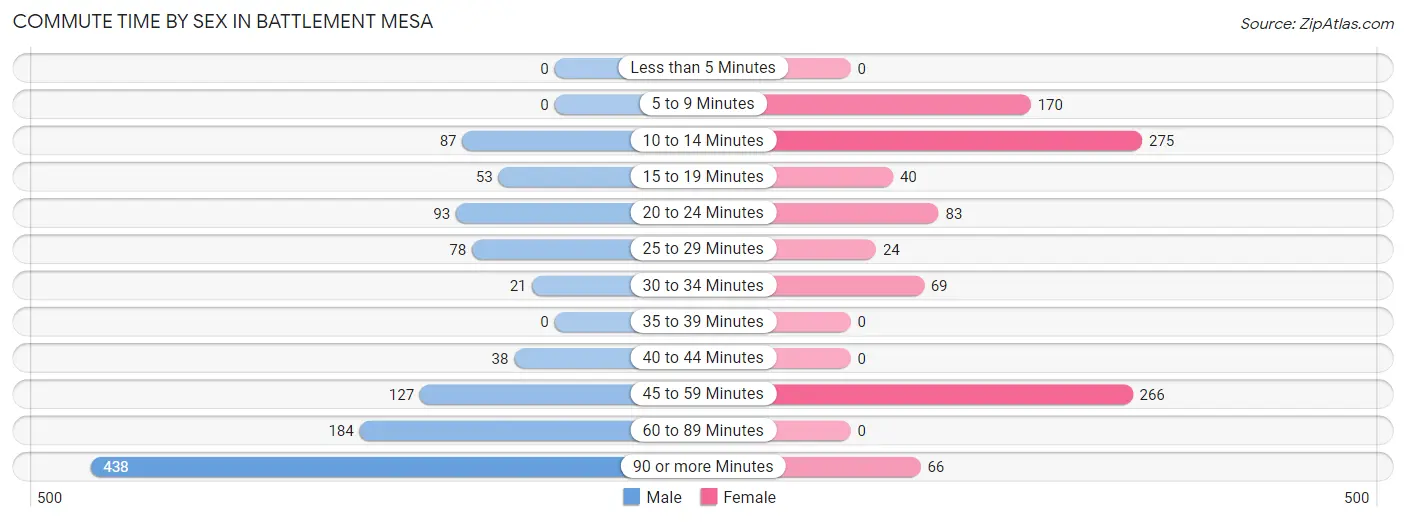
| Commute Time | Male | Female |
| Less than 5 Minutes | 0 (0.0%) | 0 (0.0%) |
| 5 to 9 Minutes | 0 (0.0%) | 170 (17.1%) |
| 10 to 14 Minutes | 87 (7.8%) | 275 (27.7%) |
| 15 to 19 Minutes | 53 (4.7%) | 40 (4.0%) |
| 20 to 24 Minutes | 93 (8.3%) | 83 (8.4%) |
| 25 to 29 Minutes | 78 (7.0%) | 24 (2.4%) |
| 30 to 34 Minutes | 21 (1.9%) | 69 (7.0%) |
| 35 to 39 Minutes | 0 (0.0%) | 0 (0.0%) |
| 40 to 44 Minutes | 38 (3.4%) | 0 (0.0%) |
| 45 to 59 Minutes | 127 (11.4%) | 266 (26.8%) |
| 60 to 89 Minutes | 184 (16.4%) | 0 (0.0%) |
| 90 or more Minutes | 438 (39.1%) | 66 (6.7%) |
Time of Departure to Work by Sex in Battlement Mesa
The most frequent times of departure to work in Battlement Mesa are 6:30 AM to 6:59 AM (227, 20.3%) for males and 7:00 AM to 7:29 AM (279, 28.1%) for females.
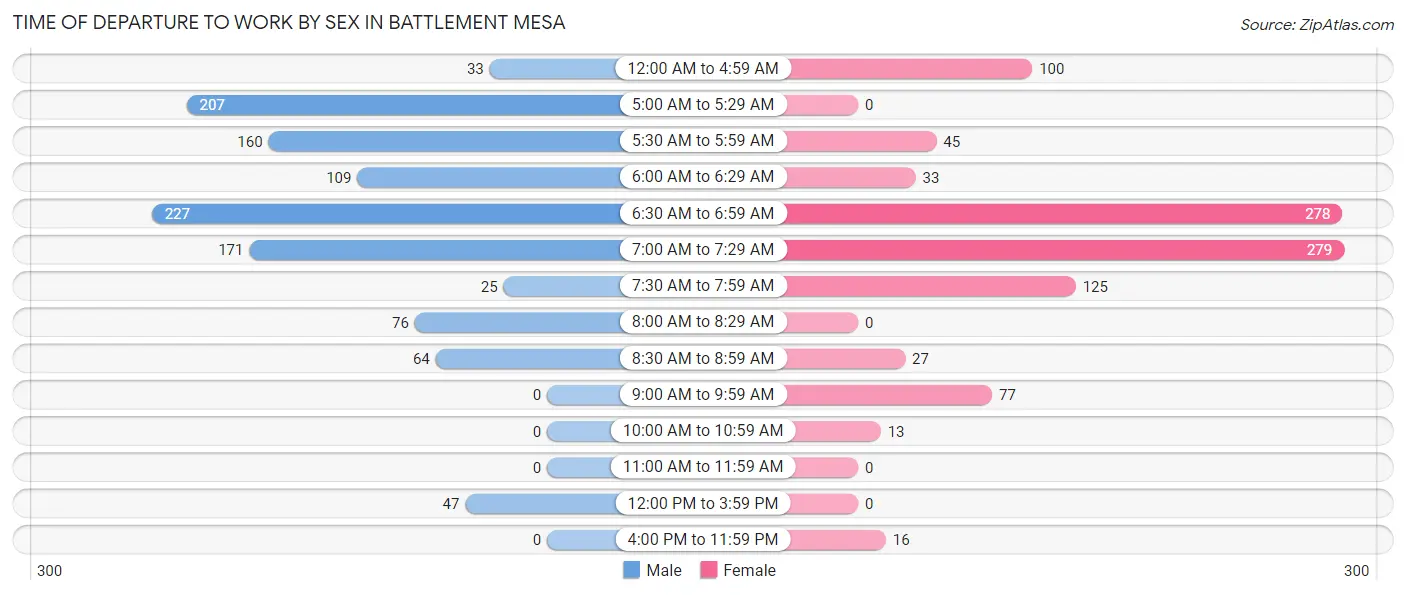
| Time of Departure | Male | Female |
| 12:00 AM to 4:59 AM | 33 (2.9%) | 100 (10.1%) |
| 5:00 AM to 5:29 AM | 207 (18.5%) | 0 (0.0%) |
| 5:30 AM to 5:59 AM | 160 (14.3%) | 45 (4.5%) |
| 6:00 AM to 6:29 AM | 109 (9.7%) | 33 (3.3%) |
| 6:30 AM to 6:59 AM | 227 (20.3%) | 278 (28.0%) |
| 7:00 AM to 7:29 AM | 171 (15.3%) | 279 (28.1%) |
| 7:30 AM to 7:59 AM | 25 (2.2%) | 125 (12.6%) |
| 8:00 AM to 8:29 AM | 76 (6.8%) | 0 (0.0%) |
| 8:30 AM to 8:59 AM | 64 (5.7%) | 27 (2.7%) |
| 9:00 AM to 9:59 AM | 0 (0.0%) | 77 (7.7%) |
| 10:00 AM to 10:59 AM | 0 (0.0%) | 13 (1.3%) |
| 11:00 AM to 11:59 AM | 0 (0.0%) | 0 (0.0%) |
| 12:00 PM to 3:59 PM | 47 (4.2%) | 0 (0.0%) |
| 4:00 PM to 11:59 PM | 0 (0.0%) | 16 (1.6%) |
| Total | 1,119 (100.0%) | 993 (100.0%) |
Housing Occupancy in Battlement Mesa
Occupancy by Ownership in Battlement Mesa
Of the total 1,950 dwellings in Battlement Mesa, owner-occupied units account for 1,482 (76.0%), while renter-occupied units make up 468 (24.0%).
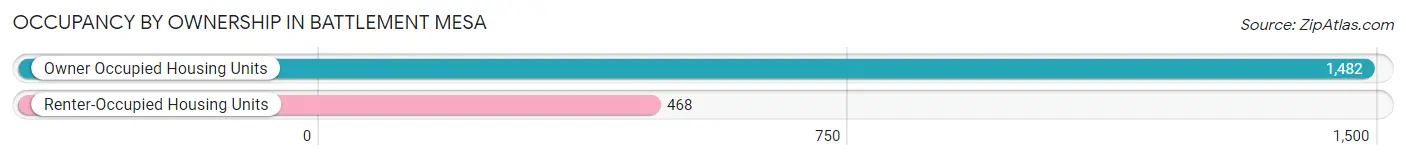
| Occupancy | # Housing Units | % Housing Units |
| Owner Occupied Housing Units | 1,482 | 76.0% |
| Renter-Occupied Housing Units | 468 | 24.0% |
| Total Occupied Housing Units | 1,950 | 100.0% |
Occupancy by Household Size in Battlement Mesa
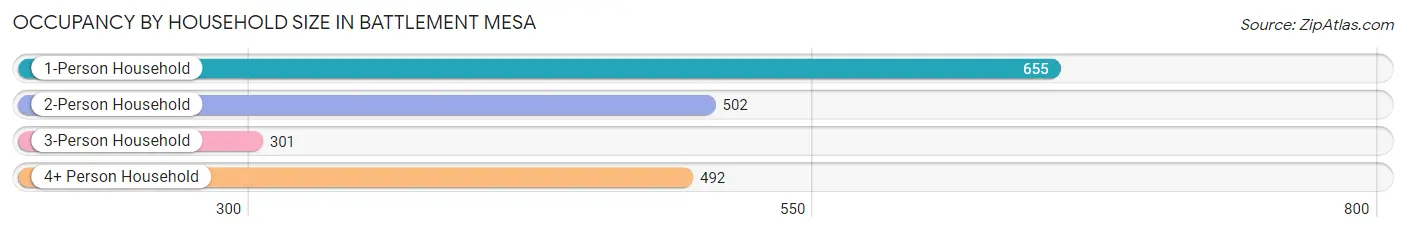
| Household Size | # Housing Units | % Housing Units |
| 1-Person Household | 655 | 33.6% |
| 2-Person Household | 502 | 25.7% |
| 3-Person Household | 301 | 15.4% |
| 4+ Person Household | 492 | 25.2% |
| Total Housing Units | 1,950 | 100.0% |
Occupancy by Ownership by Household Size in Battlement Mesa
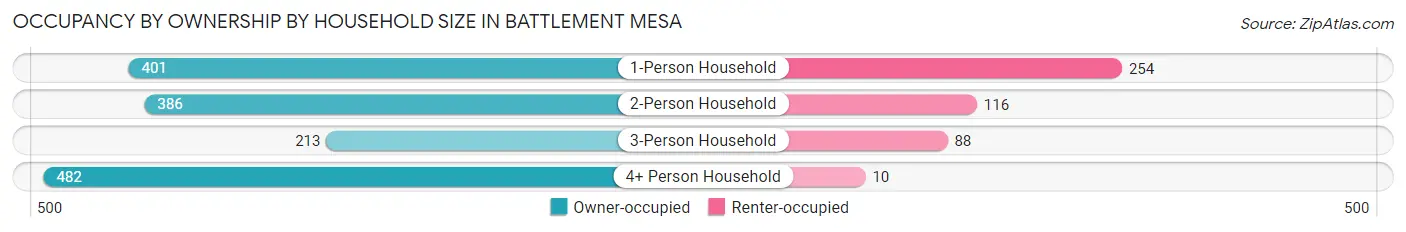
| Household Size | Owner-occupied | Renter-occupied |
| 1-Person Household | 401 (61.2%) | 254 (38.8%) |
| 2-Person Household | 386 (76.9%) | 116 (23.1%) |
| 3-Person Household | 213 (70.8%) | 88 (29.2%) |
| 4+ Person Household | 482 (98.0%) | 10 (2.0%) |
| Total Housing Units | 1,482 (76.0%) | 468 (24.0%) |
Occupancy by Educational Attainment in Battlement Mesa
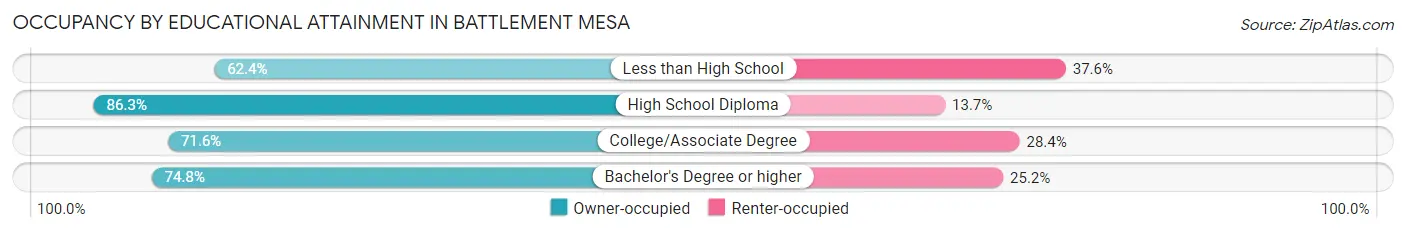
| Household Size | Owner-occupied | Renter-occupied |
| Less than High School | 78 (62.4%) | 47 (37.6%) |
| High School Diploma | 461 (86.3%) | 73 (13.7%) |
| College/Associate Degree | 506 (71.6%) | 201 (28.4%) |
| Bachelor's Degree or higher | 437 (74.8%) | 147 (25.2%) |
Occupancy by Age of Householder in Battlement Mesa
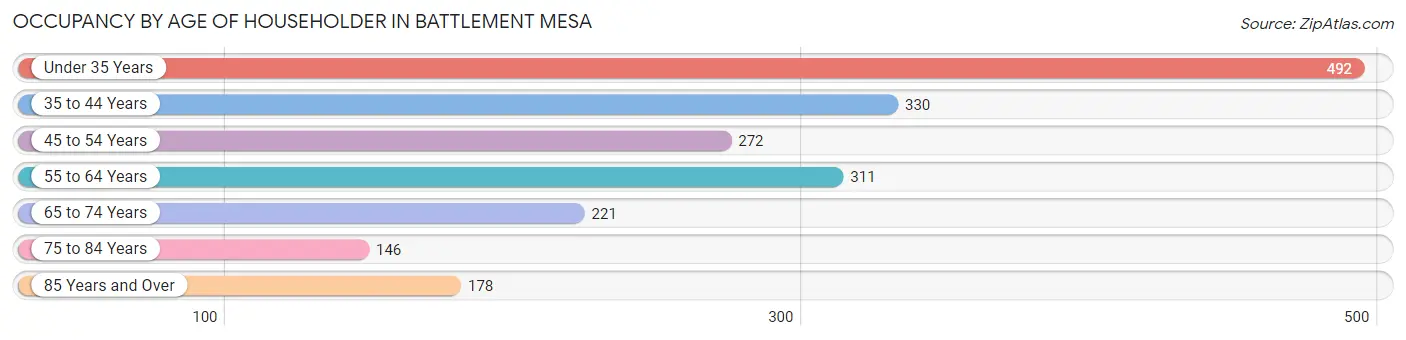
| Age Bracket | # Households | % Households |
| Under 35 Years | 492 | 25.2% |
| 35 to 44 Years | 330 | 16.9% |
| 45 to 54 Years | 272 | 14.0% |
| 55 to 64 Years | 311 | 16.0% |
| 65 to 74 Years | 221 | 11.3% |
| 75 to 84 Years | 146 | 7.5% |
| 85 Years and Over | 178 | 9.1% |
| Total | 1,950 | 100.0% |
Housing Finances in Battlement Mesa
Median Income by Occupancy in Battlement Mesa
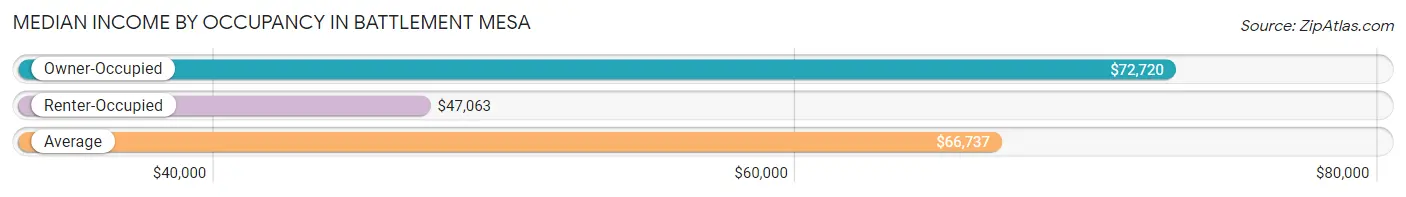
| Occupancy Type | # Households | Median Income |
| Owner-Occupied | 1,482 (76.0%) | $72,720 |
| Renter-Occupied | 468 (24.0%) | $47,063 |
| Average | 1,950 (100.0%) | $66,737 |
Occupancy by Householder Income Bracket in Battlement Mesa
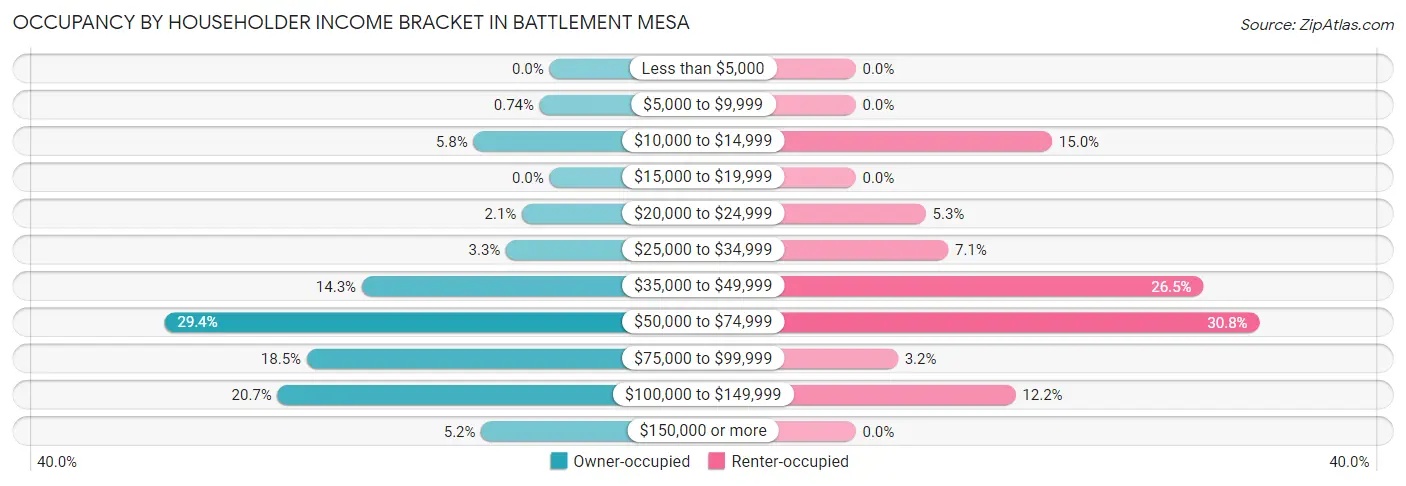
| Income Bracket | Owner-occupied | Renter-occupied |
| Less than $5,000 | 0 (0.0%) | 0 (0.0%) |
| $5,000 to $9,999 | 11 (0.7%) | 0 (0.0%) |
| $10,000 to $14,999 | 86 (5.8%) | 70 (15.0%) |
| $15,000 to $19,999 | 0 (0.0%) | 0 (0.0%) |
| $20,000 to $24,999 | 31 (2.1%) | 25 (5.3%) |
| $25,000 to $34,999 | 49 (3.3%) | 33 (7.0%) |
| $35,000 to $49,999 | 212 (14.3%) | 124 (26.5%) |
| $50,000 to $74,999 | 435 (29.3%) | 144 (30.8%) |
| $75,000 to $99,999 | 274 (18.5%) | 15 (3.2%) |
| $100,000 to $149,999 | 307 (20.7%) | 57 (12.2%) |
| $150,000 or more | 77 (5.2%) | 0 (0.0%) |
| Total | 1,482 (100.0%) | 468 (100.0%) |
Monthly Housing Cost Tiers in Battlement Mesa
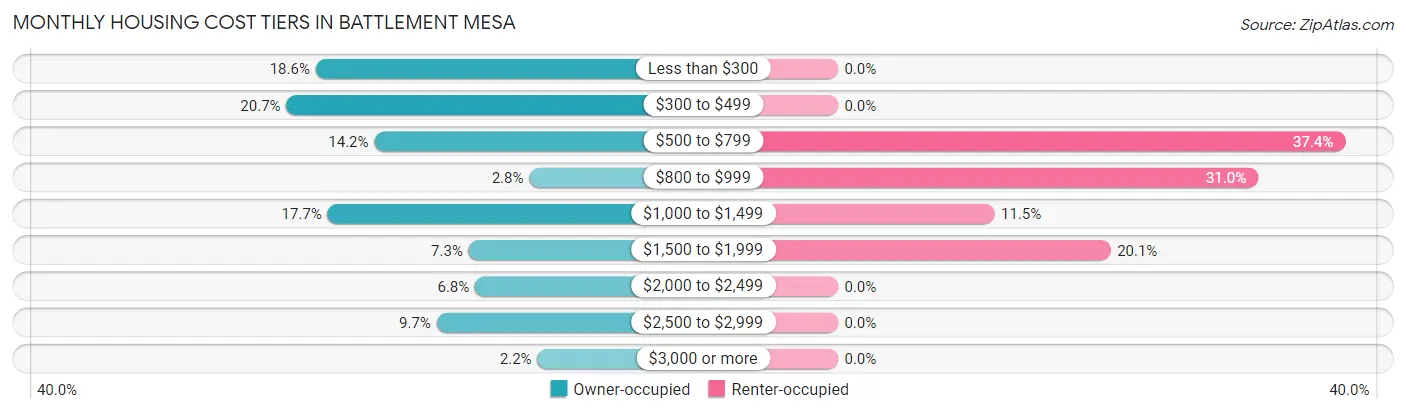
| Monthly Cost | Owner-occupied | Renter-occupied |
| Less than $300 | 275 (18.6%) | 0 (0.0%) |
| $300 to $499 | 307 (20.7%) | 0 (0.0%) |
| $500 to $799 | 211 (14.2%) | 175 (37.4%) |
| $800 to $999 | 42 (2.8%) | 145 (31.0%) |
| $1,000 to $1,499 | 262 (17.7%) | 54 (11.5%) |
| $1,500 to $1,999 | 108 (7.3%) | 94 (20.1%) |
| $2,000 to $2,499 | 101 (6.8%) | 0 (0.0%) |
| $2,500 to $2,999 | 143 (9.7%) | 0 (0.0%) |
| $3,000 or more | 33 (2.2%) | 0 (0.0%) |
| Total | 1,482 (100.0%) | 468 (100.0%) |
Physical Housing Characteristics in Battlement Mesa
Housing Structures in Battlement Mesa
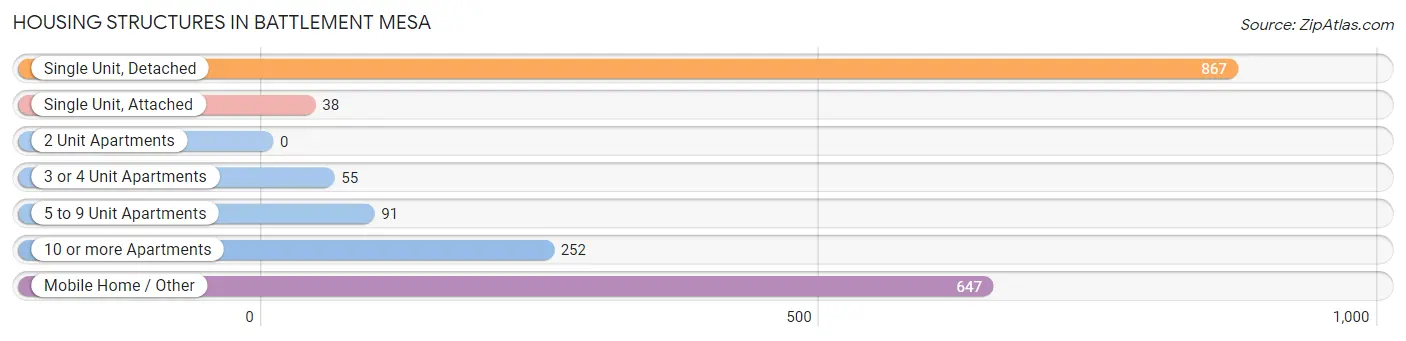
| Structure Type | # Housing Units | % Housing Units |
| Single Unit, Detached | 867 | 44.5% |
| Single Unit, Attached | 38 | 1.9% |
| 2 Unit Apartments | 0 | 0.0% |
| 3 or 4 Unit Apartments | 55 | 2.8% |
| 5 to 9 Unit Apartments | 91 | 4.7% |
| 10 or more Apartments | 252 | 12.9% |
| Mobile Home / Other | 647 | 33.2% |
| Total | 1,950 | 100.0% |
Housing Structures by Occupancy in Battlement Mesa
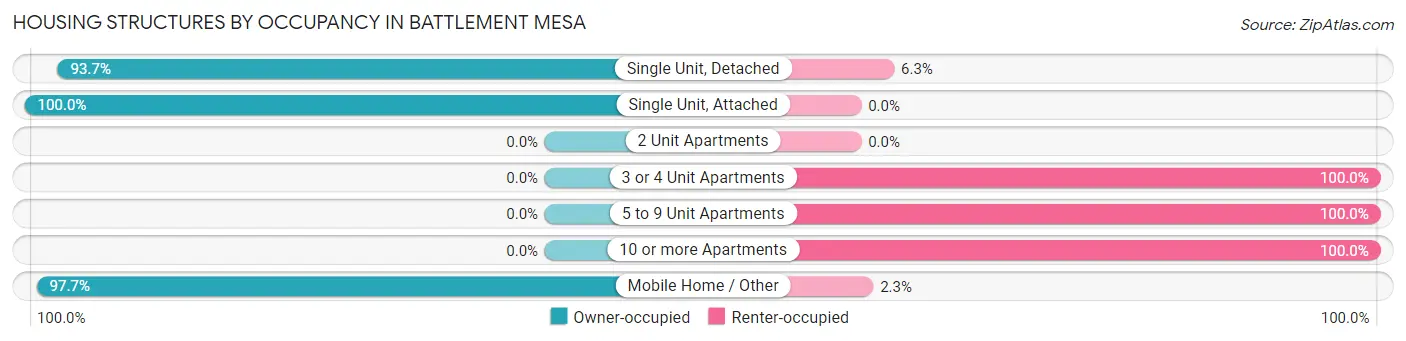
| Structure Type | Owner-occupied | Renter-occupied |
| Single Unit, Detached | 812 (93.7%) | 55 (6.3%) |
| Single Unit, Attached | 38 (100.0%) | 0 (0.0%) |
| 2 Unit Apartments | 0 (0.0%) | 0 (0.0%) |
| 3 or 4 Unit Apartments | 0 (0.0%) | 55 (100.0%) |
| 5 to 9 Unit Apartments | 0 (0.0%) | 91 (100.0%) |
| 10 or more Apartments | 0 (0.0%) | 252 (100.0%) |
| Mobile Home / Other | 632 (97.7%) | 15 (2.3%) |
| Total | 1,482 (76.0%) | 468 (24.0%) |
Housing Structures by Number of Rooms in Battlement Mesa
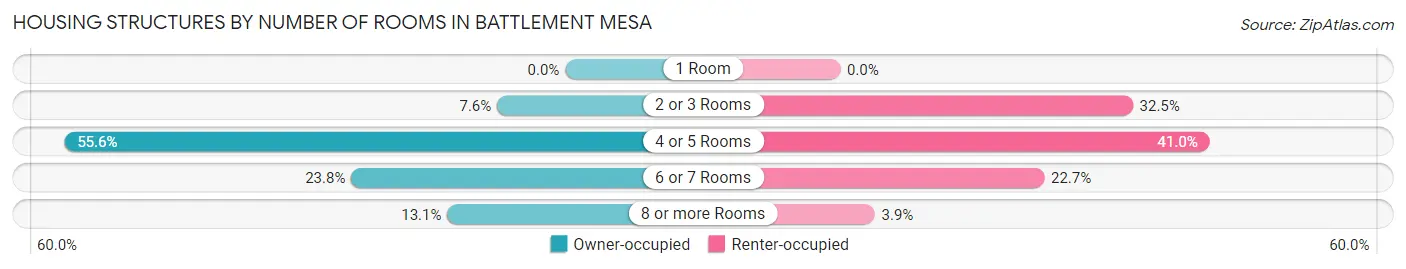
| Number of Rooms | Owner-occupied | Renter-occupied |
| 1 Room | 0 (0.0%) | 0 (0.0%) |
| 2 or 3 Rooms | 112 (7.6%) | 152 (32.5%) |
| 4 or 5 Rooms | 824 (55.6%) | 192 (41.0%) |
| 6 or 7 Rooms | 352 (23.7%) | 106 (22.7%) |
| 8 or more Rooms | 194 (13.1%) | 18 (3.8%) |
| Total | 1,482 (100.0%) | 468 (100.0%) |
Housing Structure by Heating Type in Battlement Mesa
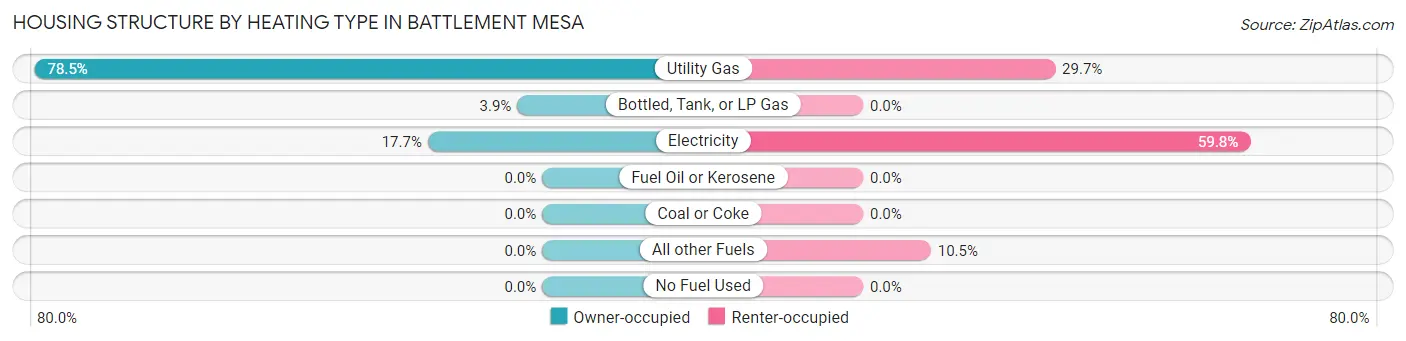
| Heating Type | Owner-occupied | Renter-occupied |
| Utility Gas | 1,163 (78.5%) | 139 (29.7%) |
| Bottled, Tank, or LP Gas | 57 (3.8%) | 0 (0.0%) |
| Electricity | 262 (17.7%) | 280 (59.8%) |
| Fuel Oil or Kerosene | 0 (0.0%) | 0 (0.0%) |
| Coal or Coke | 0 (0.0%) | 0 (0.0%) |
| All other Fuels | 0 (0.0%) | 49 (10.5%) |
| No Fuel Used | 0 (0.0%) | 0 (0.0%) |
| Total | 1,482 (100.0%) | 468 (100.0%) |
Household Vehicle Usage in Battlement Mesa
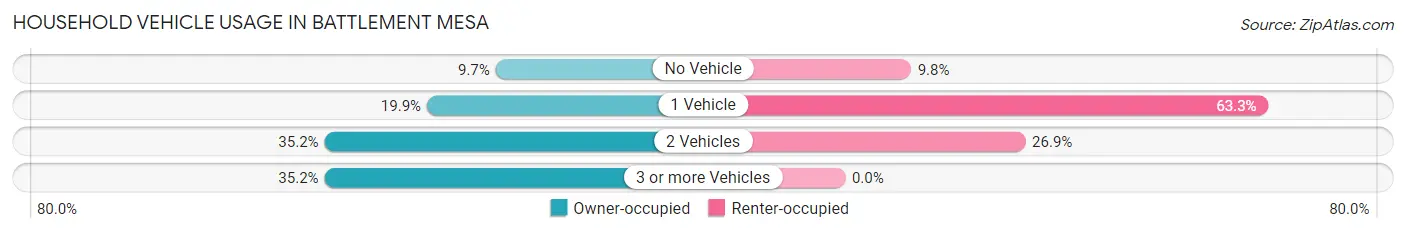
| Vehicles per Household | Owner-occupied | Renter-occupied |
| No Vehicle | 143 (9.7%) | 46 (9.8%) |
| 1 Vehicle | 295 (19.9%) | 296 (63.2%) |
| 2 Vehicles | 522 (35.2%) | 126 (26.9%) |
| 3 or more Vehicles | 522 (35.2%) | 0 (0.0%) |
| Total | 1,482 (100.0%) | 468 (100.0%) |
Real Estate & Mortgages in Battlement Mesa
Real Estate and Mortgage Overview in Battlement Mesa
| Characteristic | Without Mortgage | With Mortgage |
| Housing Units | 707 | 775 |
| Median Property Value | $59,600 | $241,100 |
| Median Household Income | $65,688 | $54 |
| Monthly Housing Costs | $353 | $33 |
| Real Estate Taxes | - | - |
Property Value by Mortgage Status in Battlement Mesa
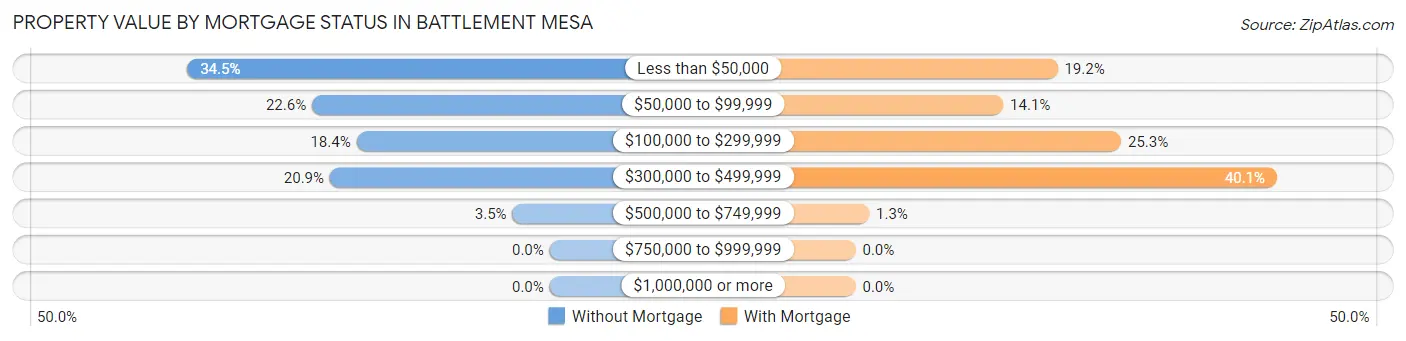
| Property Value | Without Mortgage | With Mortgage |
| Less than $50,000 | 244 (34.5%) | 149 (19.2%) |
| $50,000 to $99,999 | 160 (22.6%) | 109 (14.1%) |
| $100,000 to $299,999 | 130 (18.4%) | 196 (25.3%) |
| $300,000 to $499,999 | 148 (20.9%) | 311 (40.1%) |
| $500,000 to $749,999 | 25 (3.5%) | 10 (1.3%) |
| $750,000 to $999,999 | 0 (0.0%) | 0 (0.0%) |
| $1,000,000 or more | 0 (0.0%) | 0 (0.0%) |
| Total | 707 (100.0%) | 775 (100.0%) |
Household Income by Mortgage Status in Battlement Mesa
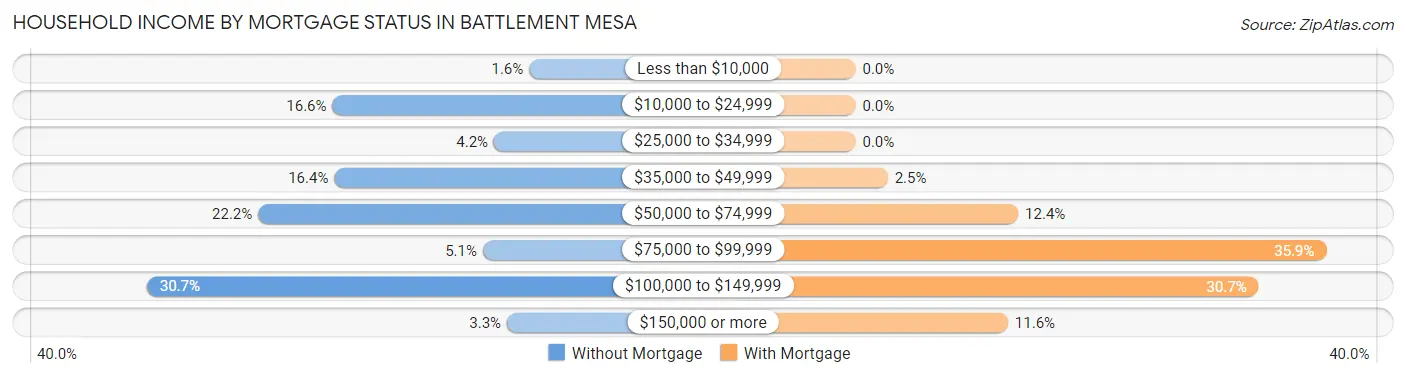
| Household Income | Without Mortgage | With Mortgage |
| Less than $10,000 | 11 (1.6%) | 0 (0.0%) |
| $10,000 to $24,999 | 117 (16.6%) | 0 (0.0%) |
| $25,000 to $34,999 | 30 (4.2%) | 0 (0.0%) |
| $35,000 to $49,999 | 116 (16.4%) | 19 (2.5%) |
| $50,000 to $74,999 | 157 (22.2%) | 96 (12.4%) |
| $75,000 to $99,999 | 36 (5.1%) | 278 (35.9%) |
| $100,000 to $149,999 | 217 (30.7%) | 238 (30.7%) |
| $150,000 or more | 23 (3.3%) | 90 (11.6%) |
| Total | 707 (100.0%) | 775 (100.0%) |
Property Value to Household Income Ratio in Battlement Mesa
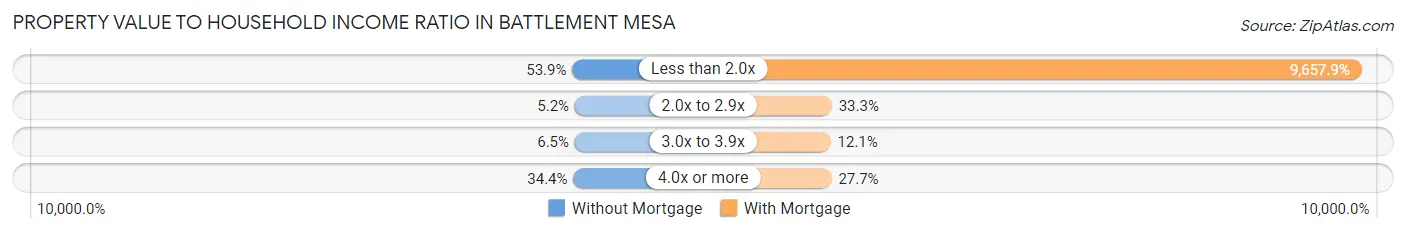
| Value-to-Income Ratio | Without Mortgage | With Mortgage |
| Less than 2.0x | 381 (53.9%) | 74,849 (9,657.9%) |
| 2.0x to 2.9x | 37 (5.2%) | 258 (33.3%) |
| 3.0x to 3.9x | 46 (6.5%) | 94 (12.1%) |
| 4.0x or more | 243 (34.4%) | 215 (27.7%) |
| Total | 707 (100.0%) | 775 (100.0%) |
Real Estate Taxes by Mortgage Status in Battlement Mesa
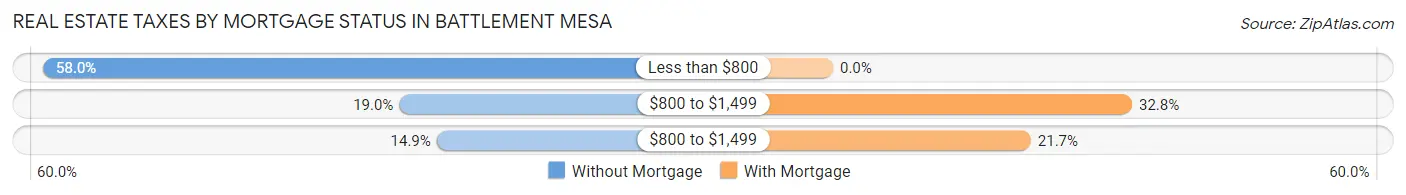
| Property Taxes | Without Mortgage | With Mortgage |
| Less than $800 | 410 (58.0%) | 0 (0.0%) |
| $800 to $1,499 | 134 (19.0%) | 254 (32.8%) |
| $800 to $1,499 | 105 (14.8%) | 168 (21.7%) |
| Total | 707 (100.0%) | 775 (100.0%) |
Health & Disability in Battlement Mesa
Health Insurance Coverage by Age in Battlement Mesa
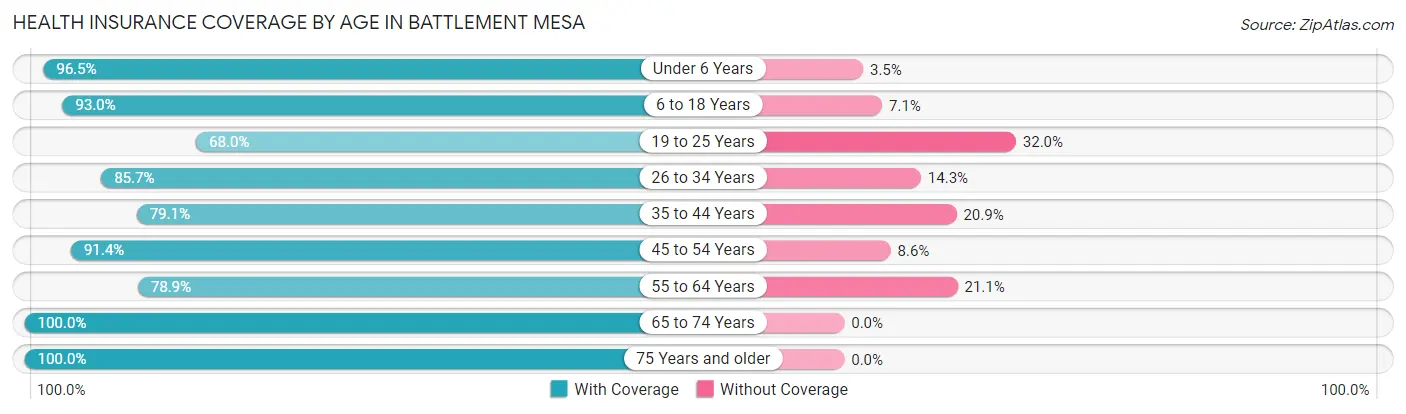
| Age Bracket | With Coverage | Without Coverage |
| Under 6 Years | 497 (96.5%) | 18 (3.5%) |
| 6 to 18 Years | 884 (92.9%) | 67 (7.0%) |
| 19 to 25 Years | 440 (68.0%) | 207 (32.0%) |
| 26 to 34 Years | 594 (85.7%) | 99 (14.3%) |
| 35 to 44 Years | 363 (79.1%) | 96 (20.9%) |
| 45 to 54 Years | 370 (91.4%) | 35 (8.6%) |
| 55 to 64 Years | 519 (78.9%) | 139 (21.1%) |
| 65 to 74 Years | 404 (100.0%) | 0 (0.0%) |
| 75 Years and older | 416 (100.0%) | 0 (0.0%) |
| Total | 4,487 (87.2%) | 661 (12.8%) |
Health Insurance Coverage by Citizenship Status in Battlement Mesa
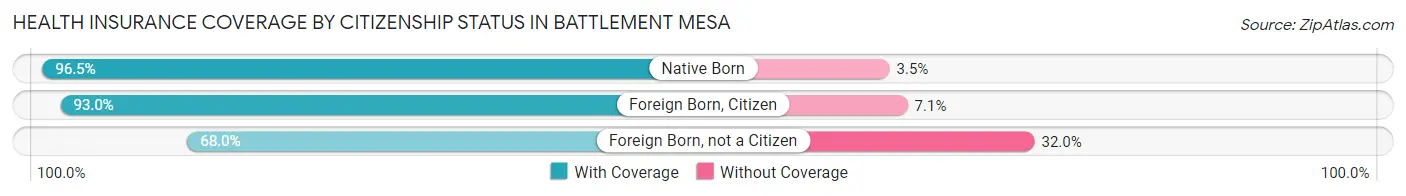
| Citizenship Status | With Coverage | Without Coverage |
| Native Born | 497 (96.5%) | 18 (3.5%) |
| Foreign Born, Citizen | 884 (92.9%) | 67 (7.0%) |
| Foreign Born, not a Citizen | 440 (68.0%) | 207 (32.0%) |
Health Insurance Coverage by Household Income in Battlement Mesa
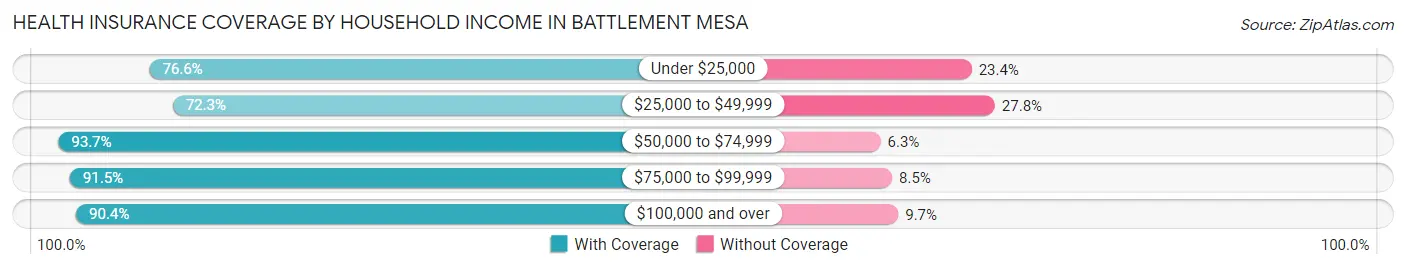
| Household Income | With Coverage | Without Coverage |
| Under $25,000 | 180 (76.6%) | 55 (23.4%) |
| $25,000 to $49,999 | 750 (72.3%) | 288 (27.8%) |
| $50,000 to $74,999 | 1,258 (93.7%) | 85 (6.3%) |
| $75,000 to $99,999 | 733 (91.5%) | 68 (8.5%) |
| $100,000 and over | 1,545 (90.3%) | 165 (9.7%) |
Public vs Private Health Insurance Coverage by Age in Battlement Mesa
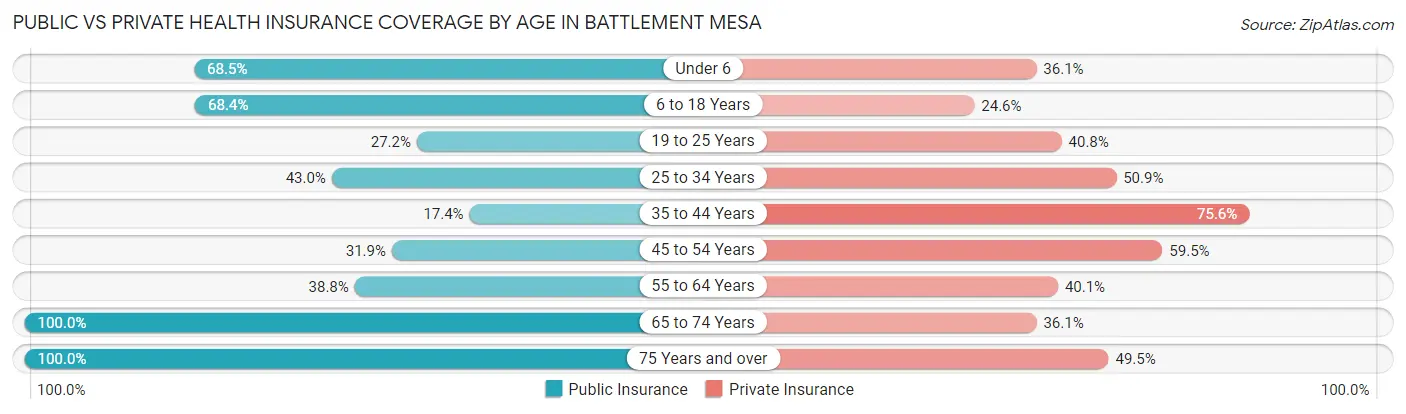
| Age Bracket | Public Insurance | Private Insurance |
| Under 6 | 353 (68.5%) | 186 (36.1%) |
| 6 to 18 Years | 650 (68.3%) | 234 (24.6%) |
| 19 to 25 Years | 176 (27.2%) | 264 (40.8%) |
| 25 to 34 Years | 298 (43.0%) | 353 (50.9%) |
| 35 to 44 Years | 80 (17.4%) | 347 (75.6%) |
| 45 to 54 Years | 129 (31.9%) | 241 (59.5%) |
| 55 to 64 Years | 255 (38.8%) | 264 (40.1%) |
| 65 to 74 Years | 404 (100.0%) | 146 (36.1%) |
| 75 Years and over | 416 (100.0%) | 206 (49.5%) |
| Total | 2,761 (53.6%) | 2,241 (43.5%) |
Disability Status by Sex by Age in Battlement Mesa
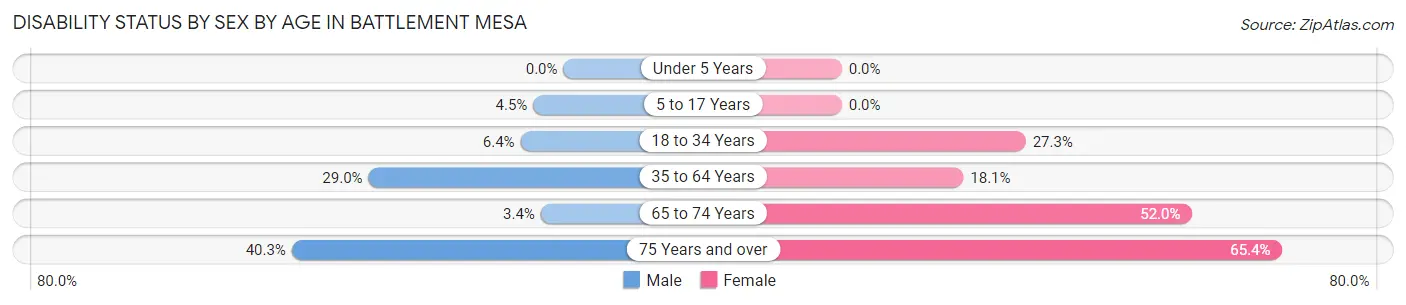
| Age Bracket | Male | Female |
| Under 5 Years | 0 (0.0%) | 0 (0.0%) |
| 5 to 17 Years | 31 (4.5%) | 0 (0.0%) |
| 18 to 34 Years | 55 (6.4%) | 142 (27.3%) |
| 35 to 64 Years | 152 (28.9%) | 180 (18.0%) |
| 65 to 74 Years | 7 (3.4%) | 102 (52.0%) |
| 75 Years and over | 71 (40.3%) | 157 (65.4%) |
Disability Class by Sex by Age in Battlement Mesa
Disability Class: Hearing Difficulty
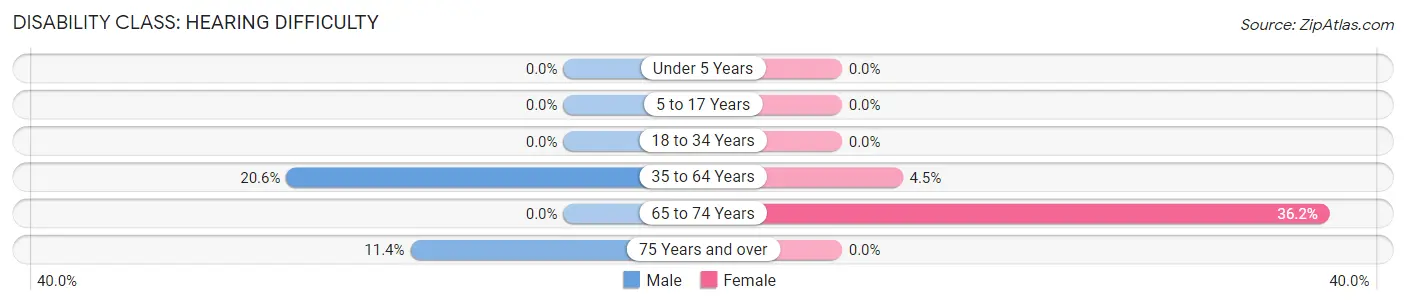
| Age Bracket | Male | Female |
| Under 5 Years | 0 (0.0%) | 0 (0.0%) |
| 5 to 17 Years | 0 (0.0%) | 0 (0.0%) |
| 18 to 34 Years | 0 (0.0%) | 0 (0.0%) |
| 35 to 64 Years | 108 (20.6%) | 45 (4.5%) |
| 65 to 74 Years | 0 (0.0%) | 71 (36.2%) |
| 75 Years and over | 20 (11.4%) | 0 (0.0%) |
Disability Class: Vision Difficulty
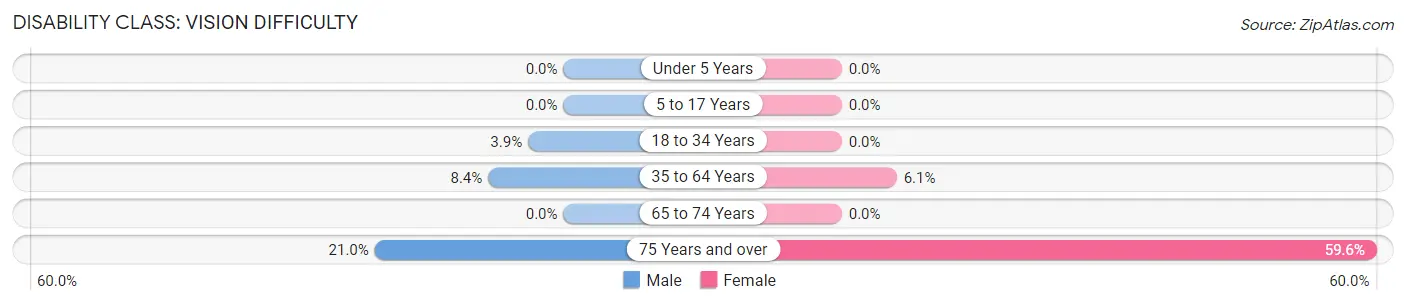
| Age Bracket | Male | Female |
| Under 5 Years | 0 (0.0%) | 0 (0.0%) |
| 5 to 17 Years | 0 (0.0%) | 0 (0.0%) |
| 18 to 34 Years | 34 (3.9%) | 0 (0.0%) |
| 35 to 64 Years | 44 (8.4%) | 61 (6.1%) |
| 65 to 74 Years | 0 (0.0%) | 0 (0.0%) |
| 75 Years and over | 37 (21.0%) | 143 (59.6%) |
Disability Class: Cognitive Difficulty
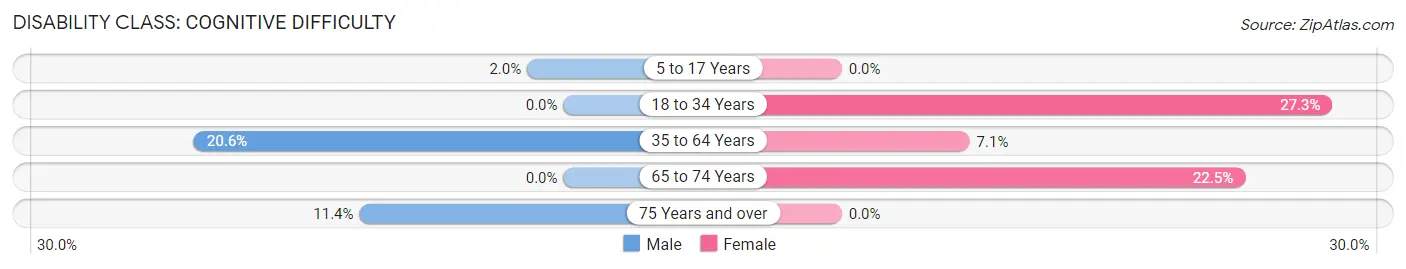
| Age Bracket | Male | Female |
| 5 to 17 Years | 14 (2.0%) | 0 (0.0%) |
| 18 to 34 Years | 0 (0.0%) | 142 (27.3%) |
| 35 to 64 Years | 108 (20.6%) | 71 (7.1%) |
| 65 to 74 Years | 0 (0.0%) | 44 (22.5%) |
| 75 Years and over | 20 (11.4%) | 0 (0.0%) |
Disability Class: Ambulatory Difficulty
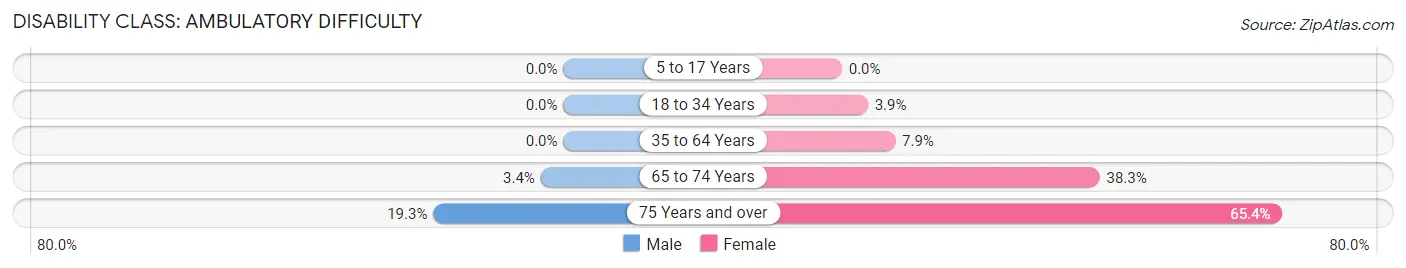
| Age Bracket | Male | Female |
| 5 to 17 Years | 0 (0.0%) | 0 (0.0%) |
| 18 to 34 Years | 0 (0.0%) | 20 (3.8%) |
| 35 to 64 Years | 0 (0.0%) | 79 (7.9%) |
| 65 to 74 Years | 7 (3.4%) | 75 (38.3%) |
| 75 Years and over | 34 (19.3%) | 157 (65.4%) |
Disability Class: Self-Care Difficulty
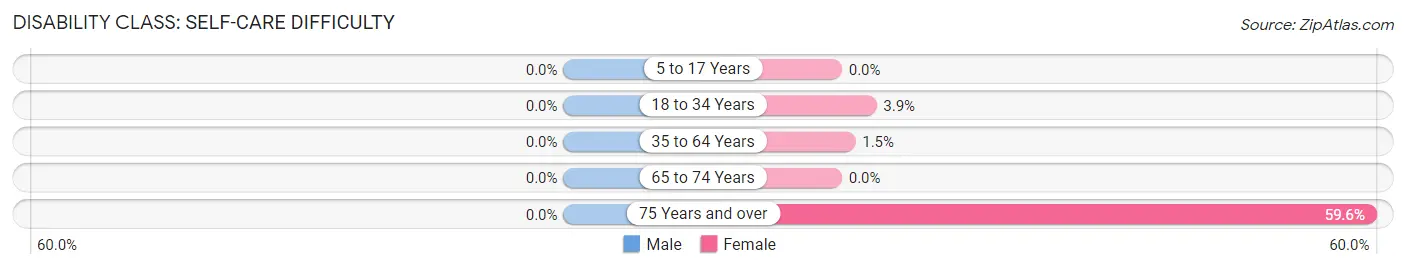
| Age Bracket | Male | Female |
| 5 to 17 Years | 0 (0.0%) | 0 (0.0%) |
| 18 to 34 Years | 0 (0.0%) | 20 (3.8%) |
| 35 to 64 Years | 0 (0.0%) | 15 (1.5%) |
| 65 to 74 Years | 0 (0.0%) | 0 (0.0%) |
| 75 Years and over | 0 (0.0%) | 143 (59.6%) |
Technology Access in Battlement Mesa
Computing Device Access in Battlement Mesa
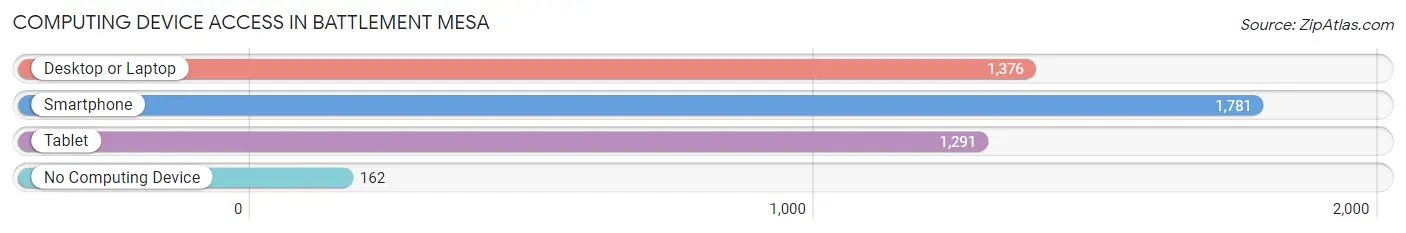
| Device Type | # Households | % Households |
| Desktop or Laptop | 1,376 | 70.6% |
| Smartphone | 1,781 | 91.3% |
| Tablet | 1,291 | 66.2% |
| No Computing Device | 162 | 8.3% |
| Total | 1,950 | 100.0% |
Internet Access in Battlement Mesa
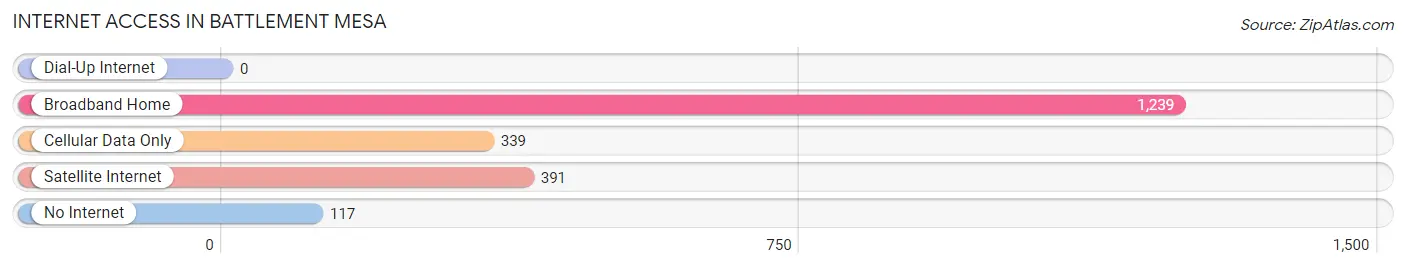
| Internet Type | # Households | % Households |
| Dial-Up Internet | 0 | 0.0% |
| Broadband Home | 1,239 | 63.5% |
| Cellular Data Only | 339 | 17.4% |
| Satellite Internet | 391 | 20.1% |
| No Internet | 117 | 6.0% |
| Total | 1,950 | 100.0% |
Battlement Mesa Summary
Battlement Mesa is a census-designated place (CDP) located in Garfield County, Colorado, United States. The population was 5,717 at the 2010 census. It is located in the Grand Valley, approximately 10 miles (16 km) west of the city of Grand Junction.
History
The area now known as Battlement Mesa was first inhabited by the Ute Indians, who used the area for hunting and gathering. The first white settlers arrived in the late 1800s, and the area was officially established as a town in the early 1900s. The town was named after the nearby Battlement Mesa, a large mesa that rises above the valley floor.
The town was originally a farming and ranching community, but in the 1950s, the area began to experience a population boom due to the discovery of oil and gas in the area. This led to the development of the Battlement Mesa oil and gas fields, which are still in operation today.
In the late 1970s, the town was chosen as the site of a nuclear power plant, the Colorado River Nuclear Generating Station. The plant was completed in 1984, and it is still in operation today.
Geography
Battlement Mesa is located in western Colorado, in the Grand Valley. It is situated at an elevation of 5,845 feet (1,782 m). The town is located approximately 10 miles (16 km) west of the city of Grand Junction.
The town is surrounded by the Battlement Mesa Plateau, a large mesa that rises above the valley floor. The mesa is composed of sandstone and shale, and it is home to a variety of wildlife, including mule deer, elk, and bighorn sheep.
Economy
The economy of Battlement Mesa is largely based on oil and gas production, as well as tourism. The town is home to the Colorado River Nuclear Generating Station, which provides electricity to the region.
The town is also home to several businesses, including restaurants, retail stores, and a variety of service-oriented businesses.
Demographics
As of the 2010 census, there were 5,717 people, 2,072 households, and 1,541 families residing in the CDP. The population density was 1,072.3 people per square mile (414.7/km2). There were 2,072 housing units at an average density of 393.3 per square mile (151.7/km2).
The racial makeup of the CDP was 91.2% White, 0.7% African American, 0.7% Native American, 0.7% Asian, 0.1% Pacific Islander, 4.3% from other races, and 2.2% from two or more races. Hispanic or Latino of any race were 11.2% of the population.
There were 2,072 households, out of which 33.2% had children under the age of 18 living with them, 57.2% were married couples living together, 9.7% had a female householder with no husband present, and 28.2% were non-families. 22.2% of all households were made up of individuals, and 8.2% had someone living alone who was 65 years of age or older. The average household size was 2.77 and the average family size was 3.22.
In the CDP, the population was spread out, with 27.2% under the age of 18, 8.2% from 18 to 24, 28.2% from 25 to 44, 24.2% from 45 to 64, and 12.2% who were 65 years of age or older. The median age was 36 years. For every 100 females, there were 97.2 males. For every 100 females age 18 and over, there were 94.2 males.
The median income for a household in the CDP was $45,938, and the median income for a family was $50,938. Males had a median income of $41,250 versus $27,500 for females. The per capita income for the CDP was $20,938. About 6.2% of families and 8.2% of the population were below the poverty line, including 10.2% of those under age 18 and 4.2% of those age 65 or over.
Common Questions
What is Per Capita Income in Battlement Mesa?
Per Capita income in Battlement Mesa is $26,948.
What is the Median Family Income in Battlement Mesa?
Median Family Income in Battlement Mesa is $73,750.
What is the Median Household income in Battlement Mesa?
Median Household Income in Battlement Mesa is $66,737.
What is Income or Wage Gap in Battlement Mesa?
Income or Wage Gap in Battlement Mesa is 1.3%.
Women in Battlement Mesa earn 98.7 cents for every dollar earned by a man.
What is Inequality or Gini Index in Battlement Mesa?
Inequality or Gini Index in Battlement Mesa is 0.29.
What is the Total Population of Battlement Mesa?
Total Population of Battlement Mesa is 5,148.
What is the Total Male Population of Battlement Mesa?
Total Male Population of Battlement Mesa is 2,798.
What is the Total Female Population of Battlement Mesa?
Total Female Population of Battlement Mesa is 2,350.
What is the Ratio of Males per 100 Females in Battlement Mesa?
There are 119.06 Males per 100 Females in Battlement Mesa.
What is the Ratio of Females per 100 Males in Battlement Mesa?
There are 83.99 Females per 100 Males in Battlement Mesa.
What is the Median Population Age in Battlement Mesa?
Median Population Age in Battlement Mesa is 29.9 Years.
What is the Average Family Size in Battlement Mesa
Average Family Size in Battlement Mesa is 3.5 People.
What is the Average Household Size in Battlement Mesa
Average Household Size in Battlement Mesa is 2.6 People.
How Large is the Labor Force in Battlement Mesa?
There are 2,312 People in the Labor Forcein in Battlement Mesa.
What is the Percentage of People in the Labor Force in Battlement Mesa?
60.4% of People are in the Labor Force in Battlement Mesa.
What is the Unemployment Rate in Battlement Mesa?
Unemployment Rate in Battlement Mesa is 1.6%.