Zip Codes with the Highest Percentage of Population Employed in Security & Protection in Colorado
RELATED REPORTS & OPTIONS
Security & Protection
Colorado
Compare Zip Codes
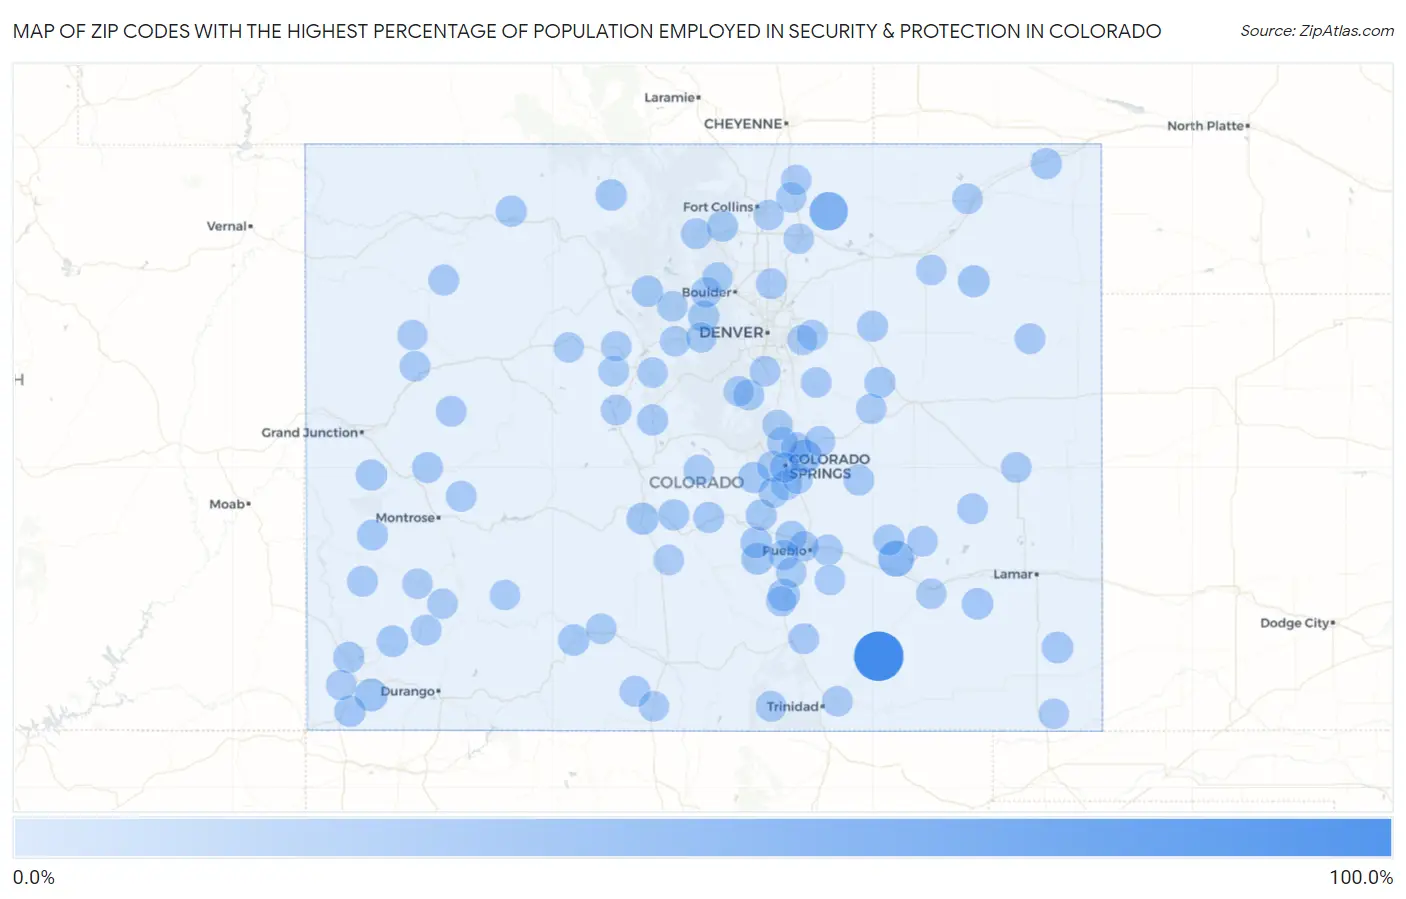
Map of Zip Codes with the Highest Percentage of Population Employed in Security & Protection in Colorado
0.0%
100.0%
Zip Codes with the Highest Percentage of Population Employed in Security & Protection in Colorado
| Zip Code | % Employed | vs State | vs National | |
| 1. | 81059 | 100.0% | 2.0%(+98.0)#1 | 2.1%(+97.9)#11 |
| 2. | 80622 | 42.4% | 2.0%(+40.4)#2 | 2.1%(+40.3)#49 |
| 3. | 81033 | 31.0% | 2.0%(+28.9)#3 | 2.1%(+28.8)#92 |
| 4. | 80938 | 18.5% | 2.0%(+16.4)#4 | 2.1%(+16.3)#235 |
| 5. | 81330 | 15.3% | 2.0%(+13.3)#5 | 2.1%(+13.1)#351 |
| 6. | 81019 | 13.1% | 2.0%(+11.1)#6 | 2.1%(+11.0)#469 |
| 7. | 81242 | 11.5% | 2.0%(+9.46)#7 | 2.1%(+9.32)#607 |
| 8. | 81253 | 10.9% | 2.0%(+8.90)#8 | 2.1%(+8.76)#656 |
| 9. | 80720 | 10.6% | 2.0%(+8.61)#9 | 2.1%(+8.46)#691 |
| 10. | 81323 | 9.6% | 2.0%(+7.55)#10 | 2.1%(+7.41)#830 |
| 11. | 80480 | 9.1% | 2.0%(+7.14)#11 | 2.1%(+6.99)#887 |
| 12. | 81084 | 9.1% | 2.0%(+7.09)#12 | 2.1%(+6.94)#898 |
| 13. | 81226 | 9.0% | 2.0%(+7.02)#13 | 2.1%(+6.88)#910 |
| 14. | 81054 | 8.8% | 2.0%(+6.83)#14 | 2.1%(+6.69)#944 |
| 15. | 81154 | 8.7% | 2.0%(+6.74)#15 | 2.1%(+6.59)#962 |
| 16. | 80451 | 8.6% | 2.0%(+6.64)#16 | 2.1%(+6.49)#977 |
| 17. | 81334 | 8.5% | 2.0%(+6.49)#17 | 2.1%(+6.34)#1,009 |
| 18. | 80749 | 7.9% | 2.0%(+5.91)#18 | 2.1%(+5.77)#1,198 |
| 19. | 80813 | 7.6% | 2.0%(+5.58)#19 | 2.1%(+5.44)#1,299 |
| 20. | 80422 | 7.5% | 2.0%(+5.50)#20 | 2.1%(+5.36)#1,331 |
| 21. | 80101 | 7.5% | 2.0%(+5.50)#21 | 2.1%(+5.35)#1,336 |
| 22. | 81327 | 7.4% | 2.0%(+5.40)#22 | 2.1%(+5.26)#1,363 |
| 23. | 81527 | 7.1% | 2.0%(+5.09)#23 | 2.1%(+4.94)#1,493 |
| 24. | 81233 | 7.1% | 2.0%(+5.07)#24 | 2.1%(+4.93)#1,503 |
| 25. | 81639 | 7.0% | 2.0%(+4.98)#25 | 2.1%(+4.84)#1,538 |
| 26. | 81240 | 7.0% | 2.0%(+4.96)#26 | 2.1%(+4.81)#1,551 |
| 27. | 81062 | 6.8% | 2.0%(+4.78)#27 | 2.1%(+4.64)#1,637 |
| 28. | 80515 | 6.7% | 2.0%(+4.73)#28 | 2.1%(+4.58)#1,665 |
| 29. | 80440 | 6.7% | 2.0%(+4.73)#29 | 2.1%(+4.58)#1,667 |
| 30. | 81410 | 6.7% | 2.0%(+4.66)#30 | 2.1%(+4.52)#1,700 |
| 31. | 81212 | 6.6% | 2.0%(+4.56)#31 | 2.1%(+4.42)#1,761 |
| 32. | 80103 | 6.4% | 2.0%(+4.38)#32 | 2.1%(+4.23)#1,837 |
| 33. | 80864 | 6.4% | 2.0%(+4.37)#33 | 2.1%(+4.23)#1,847 |
| 34. | 81424 | 6.4% | 2.0%(+4.36)#34 | 2.1%(+4.22)#1,849 |
| 35. | 81007 | 6.4% | 2.0%(+4.36)#35 | 2.1%(+4.22)#1,852 |
| 36. | 81641 | 6.1% | 2.0%(+4.08)#36 | 2.1%(+3.94)#2,024 |
| 37. | 81423 | 6.0% | 2.0%(+4.03)#37 | 2.1%(+3.89)#2,057 |
| 38. | 81089 | 6.0% | 2.0%(+4.02)#38 | 2.1%(+3.87)#2,062 |
| 39. | 81140 | 5.8% | 2.0%(+3.79)#39 | 2.1%(+3.64)#2,211 |
| 40. | 81624 | 5.6% | 2.0%(+3.57)#40 | 2.1%(+3.42)#2,393 |
| 41. | 81415 | 5.6% | 2.0%(+3.56)#41 | 2.1%(+3.42)#2,397 |
| 42. | 80829 | 5.6% | 2.0%(+3.55)#42 | 2.1%(+3.41)#2,404 |
| 43. | 80135 | 5.5% | 2.0%(+3.46)#43 | 2.1%(+3.32)#2,482 |
| 44. | 80517 | 5.4% | 2.0%(+3.36)#44 | 2.1%(+3.22)#2,569 |
| 45. | 81006 | 5.3% | 2.0%(+3.30)#45 | 2.1%(+3.16)#2,638 |
| 46. | 81045 | 5.3% | 2.0%(+3.26)#46 | 2.1%(+3.11)#2,667 |
| 47. | 81076 | 5.2% | 2.0%(+3.18)#47 | 2.1%(+3.04)#2,720 |
| 48. | 80840 | 5.1% | 2.0%(+3.12)#48 | 2.1%(+2.97)#2,789 |
| 49. | 80822 | 5.1% | 2.0%(+3.10)#49 | 2.1%(+2.96)#2,799 |
| 50. | 80514 | 5.1% | 2.0%(+3.07)#50 | 2.1%(+2.92)#2,841 |
| 51. | 81091 | 5.1% | 2.0%(+3.05)#51 | 2.1%(+2.90)#2,864 |
| 52. | 80825 | 5.0% | 2.0%(+2.95)#52 | 2.1%(+2.80)#2,981 |
| 53. | 80751 | 4.9% | 2.0%(+2.91)#53 | 2.1%(+2.77)#3,022 |
| 54. | 80461 | 4.8% | 2.0%(+2.84)#54 | 2.1%(+2.70)#3,113 |
| 55. | 81332 | 4.8% | 2.0%(+2.79)#55 | 2.1%(+2.65)#3,180 |
| 56. | 80137 | 4.6% | 2.0%(+2.64)#56 | 2.1%(+2.49)#3,381 |
| 57. | 80107 | 4.6% | 2.0%(+2.60)#57 | 2.1%(+2.45)#3,444 |
| 58. | 80902 | 4.6% | 2.0%(+2.56)#58 | 2.1%(+2.41)#3,499 |
| 59. | 81132 | 4.5% | 2.0%(+2.53)#59 | 2.1%(+2.38)#3,560 |
| 60. | 81635 | 4.5% | 2.0%(+2.47)#60 | 2.1%(+2.33)#3,638 |
| 61. | 81003 | 4.5% | 2.0%(+2.47)#61 | 2.1%(+2.33)#3,639 |
| 62. | 81649 | 4.4% | 2.0%(+2.39)#62 | 2.1%(+2.25)#3,784 |
| 63. | 81657 | 4.4% | 2.0%(+2.38)#63 | 2.1%(+2.23)#3,805 |
| 64. | 80924 | 4.4% | 2.0%(+2.37)#64 | 2.1%(+2.22)#3,820 |
| 65. | 80831 | 4.4% | 2.0%(+2.36)#65 | 2.1%(+2.22)#3,830 |
| 66. | 80466 | 4.4% | 2.0%(+2.36)#66 | 2.1%(+2.22)#3,833 |
| 67. | 80131 | 4.3% | 2.0%(+2.34)#67 | 2.1%(+2.20)#3,864 |
| 68. | 81148 | 4.2% | 2.0%(+2.21)#68 | 2.1%(+2.07)#4,095 |
| 69. | 80424 | 4.1% | 2.0%(+2.14)#69 | 2.1%(+1.99)#4,226 |
| 70. | 81143 | 4.1% | 2.0%(+2.12)#70 | 2.1%(+1.98)#4,250 |
| 71. | 80820 | 4.1% | 2.0%(+2.11)#71 | 2.1%(+1.97)#4,266 |
| 72. | 81082 | 4.1% | 2.0%(+2.11)#72 | 2.1%(+1.97)#4,273 |
| 73. | 80620 | 4.1% | 2.0%(+2.10)#73 | 2.1%(+1.95)#4,296 |
| 74. | 80926 | 4.0% | 2.0%(+2.01)#74 | 2.1%(+1.87)#4,461 |
| 75. | 80425 | 4.0% | 2.0%(+2.00)#75 | 2.1%(+1.85)#4,491 |
| 76. | 81005 | 4.0% | 2.0%(+1.99)#76 | 2.1%(+1.85)#4,494 |
| 77. | 81004 | 4.0% | 2.0%(+1.97)#77 | 2.1%(+1.83)#4,546 |
| 78. | 81426 | 4.0% | 2.0%(+1.96)#78 | 2.1%(+1.82)#4,558 |
| 79. | 80482 | 4.0% | 2.0%(+1.96)#79 | 2.1%(+1.82)#4,560 |
| 80. | 81022 | 4.0% | 2.0%(+1.96)#80 | 2.1%(+1.81)#4,573 |
| 81. | 80650 | 4.0% | 2.0%(+1.95)#81 | 2.1%(+1.81)#4,581 |
| 82. | 81321 | 3.9% | 2.0%(+1.93)#82 | 2.1%(+1.79)#4,615 |
| 83. | 81235 | 3.9% | 2.0%(+1.91)#83 | 2.1%(+1.77)#4,660 |
| 84. | 80476 | 3.9% | 2.0%(+1.88)#84 | 2.1%(+1.74)#4,723 |
| 85. | 80835 | 3.9% | 2.0%(+1.85)#85 | 2.1%(+1.71)#4,788 |
| 86. | 81430 | 3.8% | 2.0%(+1.79)#86 | 2.1%(+1.65)#4,920 |
| 87. | 80455 | 3.8% | 2.0%(+1.78)#87 | 2.1%(+1.63)#4,947 |
| 88. | 80648 | 3.8% | 2.0%(+1.77)#88 | 2.1%(+1.62)#4,969 |
| 89. | 80133 | 3.7% | 2.0%(+1.71)#89 | 2.1%(+1.57)#5,109 |
| 90. | 81050 | 3.7% | 2.0%(+1.71)#90 | 2.1%(+1.56)#5,114 |
| 91. | 81650 | 3.7% | 2.0%(+1.67)#91 | 2.1%(+1.53)#5,202 |
| 92. | 80723 | 3.6% | 2.0%(+1.64)#92 | 2.1%(+1.50)#5,290 |
| 93. | 80452 | 3.6% | 2.0%(+1.58)#93 | 2.1%(+1.44)#5,426 |
| 94. | 81631 | 3.6% | 2.0%(+1.58)#94 | 2.1%(+1.44)#5,436 |
| 95. | 81069 | 3.6% | 2.0%(+1.57)#95 | 2.1%(+1.43)#5,458 |
| 96. | 80547 | 3.5% | 2.0%(+1.54)#96 | 2.1%(+1.39)#5,568 |
| 97. | 80911 | 3.5% | 2.0%(+1.51)#97 | 2.1%(+1.36)#5,638 |
| 98. | 81029 | 3.5% | 2.0%(+1.50)#98 | 2.1%(+1.36)#5,648 |
| 99. | 80905 | 3.4% | 2.0%(+1.36)#99 | 2.1%(+1.21)#6,044 |
| 100. | 80018 | 3.3% | 2.0%(+1.34)#100 | 2.1%(+1.19)#6,118 |
Common Questions
What are the Top 10 Zip Codes with the Highest Percentage of Population Employed in Security & Protection in Colorado?
Top 10 Zip Codes with the Highest Percentage of Population Employed in Security & Protection in Colorado are:
What zip code has the Highest Percentage of Population Employed in Security & Protection in Colorado?
81059 has the Highest Percentage of Population Employed in Security & Protection in Colorado with 100.0%.
What is the Percentage of Population Employed in Security & Protection in the State of Colorado?
Percentage of Population Employed in Security & Protection in Colorado is 2.0%.
What is the Percentage of Population Employed in Security & Protection in the United States?
Percentage of Population Employed in Security & Protection in the United States is 2.1%.