Westcreek, CO Map & Demographics
Westcreek Map
Westcreek Overview
$51,460
PER CAPITA INCOME
$103,974
AVG FAMILY INCOME
$136,699
AVG HOUSEHOLD INCOME
29.9%
WAGE / INCOME GAP [ % ]
70.1¢/ $1
WAGE / INCOME GAP [ $ ]
0.18
INEQUALITY / GINI INDEX
281
TOTAL POPULATION
189
MALE POPULATION
92
FEMALE POPULATION
205.43
MALES / 100 FEMALES
48.68
FEMALES / 100 MALES
34.0
MEDIAN AGE
2.6
AVG FAMILY SIZE
2.9
AVG HOUSEHOLD SIZE
233
LABOR FORCE [ PEOPLE ]
91.4%
PERCENT IN LABOR FORCE
Income in Westcreek
Income Overview in Westcreek
Per Capita Income in Westcreek is $51,460, while median incomes of families and households are $103,974 and $136,699 respectively.
| Characteristic | Number | Measure |
| Per Capita Income | 281 | $51,460 |
| Median Family Income | 90 | $103,974 |
| Mean Family Income | 90 | $127,836 |
| Median Household Income | 97 | $136,699 |
| Mean Household Income | 97 | $148,603 |
| Income Deficit | 90 | $0 |
| Wage / Income Gap (%) | 281 | 29.91% |
| Wage / Income Gap ($) | 281 | 70.09¢ per $1 |
| Gini / Inequality Index | 281 | 0.18 |
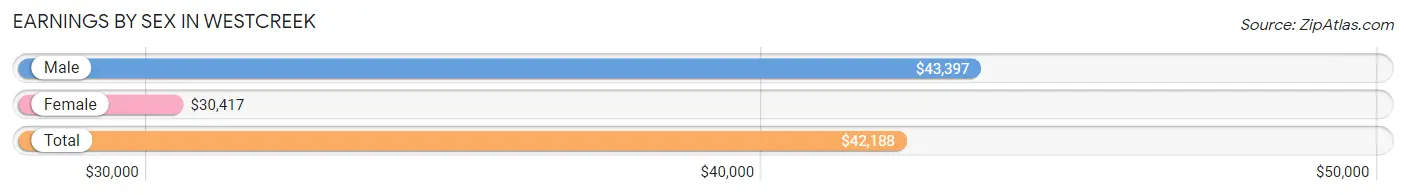
Earnings by Sex in Westcreek
Average Earnings in Westcreek are $42,188, $43,397 for men and $30,417 for women, a difference of 29.9%.
| Sex | Number | Average Earnings |
| Male | 170 (67.5%) | $43,397 |
| Female | 82 (32.5%) | $30,417 |
| Total | 252 (100.0%) | $42,188 |
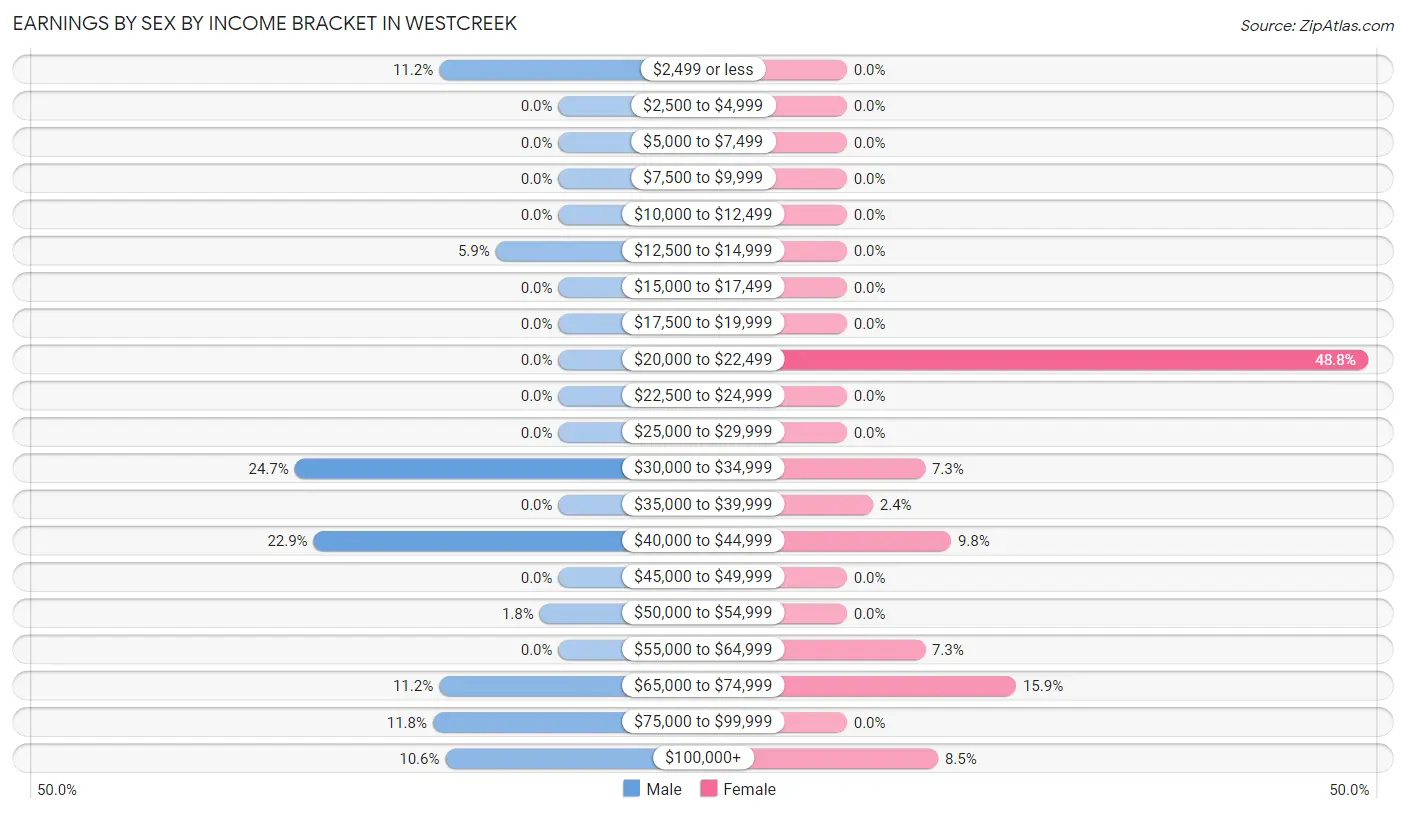
Earnings by Sex by Income Bracket in Westcreek
The most common earnings brackets in Westcreek are $30,000 to $34,999 for men (42 | 24.7%) and $20,000 to $22,499 for women (40 | 48.8%).
| Income | Male | Female |
| $2,499 or less | 19 (11.2%) | 0 (0.0%) |
| $2,500 to $4,999 | 0 (0.0%) | 0 (0.0%) |
| $5,000 to $7,499 | 0 (0.0%) | 0 (0.0%) |
| $7,500 to $9,999 | 0 (0.0%) | 0 (0.0%) |
| $10,000 to $12,499 | 0 (0.0%) | 0 (0.0%) |
| $12,500 to $14,999 | 10 (5.9%) | 0 (0.0%) |
| $15,000 to $17,499 | 0 (0.0%) | 0 (0.0%) |
| $17,500 to $19,999 | 0 (0.0%) | 0 (0.0%) |
| $20,000 to $22,499 | 0 (0.0%) | 40 (48.8%) |
| $22,500 to $24,999 | 0 (0.0%) | 0 (0.0%) |
| $25,000 to $29,999 | 0 (0.0%) | 0 (0.0%) |
| $30,000 to $34,999 | 42 (24.7%) | 6 (7.3%) |
| $35,000 to $39,999 | 0 (0.0%) | 2 (2.4%) |
| $40,000 to $44,999 | 39 (22.9%) | 8 (9.8%) |
| $45,000 to $49,999 | 0 (0.0%) | 0 (0.0%) |
| $50,000 to $54,999 | 3 (1.8%) | 0 (0.0%) |
| $55,000 to $64,999 | 0 (0.0%) | 6 (7.3%) |
| $65,000 to $74,999 | 19 (11.2%) | 13 (15.9%) |
| $75,000 to $99,999 | 20 (11.8%) | 0 (0.0%) |
| $100,000+ | 18 (10.6%) | 7 (8.5%) |
| Total | 170 (100.0%) | 82 (100.0%) |
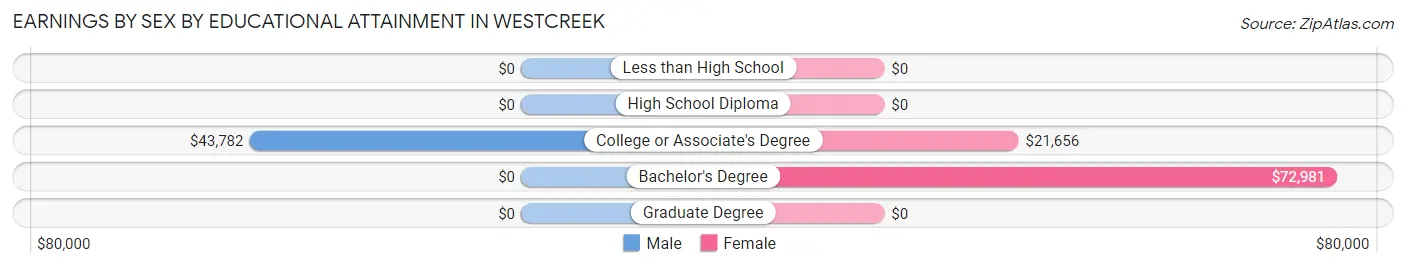
Earnings by Sex by Educational Attainment in Westcreek
Average earnings in Westcreek are $44,327 for men and $22,313 for women, a difference of 49.7%. Men with an educational attainment of college or associate's degree enjoy the highest average annual earnings of $43,782, while those with college or associate's degree education earn the least with $43,782. Women with an educational attainment of bachelor's degree earn the most with the average annual earnings of $72,981, while those with college or associate's degree education have the smallest earnings of $21,656.
| Educational Attainment | Male Income | Female Income |
| Less than High School | - | - |
| High School Diploma | - | - |
| College or Associate's Degree | $43,782 | $21,656 |
| Bachelor's Degree | - | - |
| Graduate Degree | - | - |
| Total | $44,327 | $22,313 |
Family Income in Westcreek
Family Income Brackets in Westcreek
According to the Westcreek family income data, there are 45 families falling into the $100,000 to $149,999 income range, which is the most common income bracket and makes up 50.0% of all families.
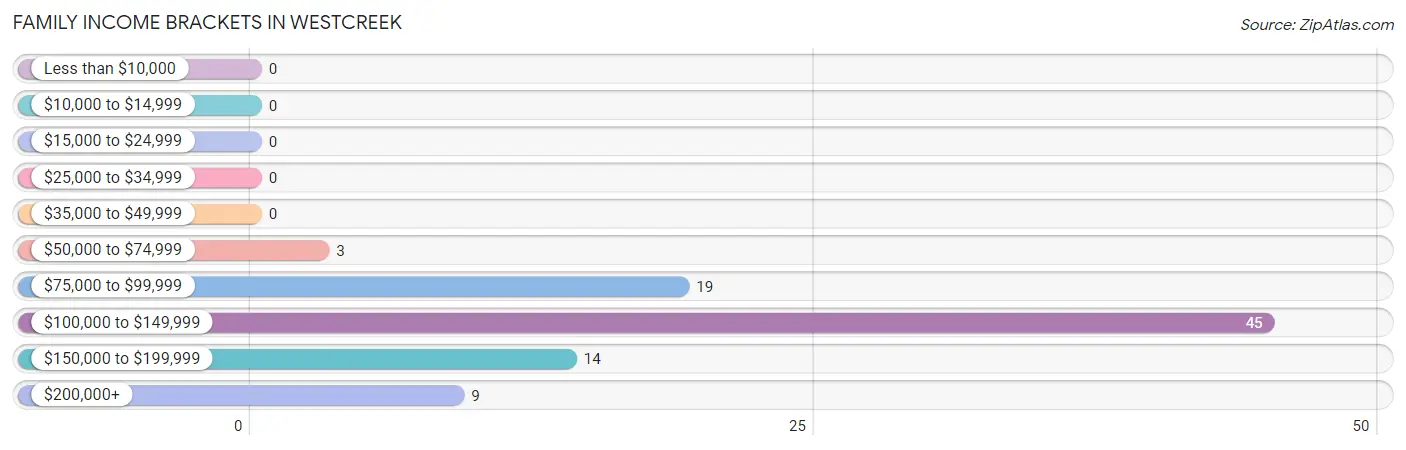
| Income Bracket | # Families | % Families |
| Less than $10,000 | 0 | 0.0% |
| $10,000 to $14,999 | 0 | 0.0% |
| $15,000 to $24,999 | 0 | 0.0% |
| $25,000 to $34,999 | 0 | 0.0% |
| $35,000 to $49,999 | 0 | 0.0% |
| $50,000 to $74,999 | 3 | 3.3% |
| $75,000 to $99,999 | 19 | 21.1% |
| $100,000 to $149,999 | 45 | 50.0% |
| $150,000 to $199,999 | 14 | 15.6% |
| $200,000+ | 9 | 10.0% |
Family Income by Famaliy Size in Westcreek
2-person families (63 | 70.0%) account for the highest median family income in Westcreek with $103,109 per family, while 2-person families (63 | 70.0%) have the highest median income of $51,554 per family member.
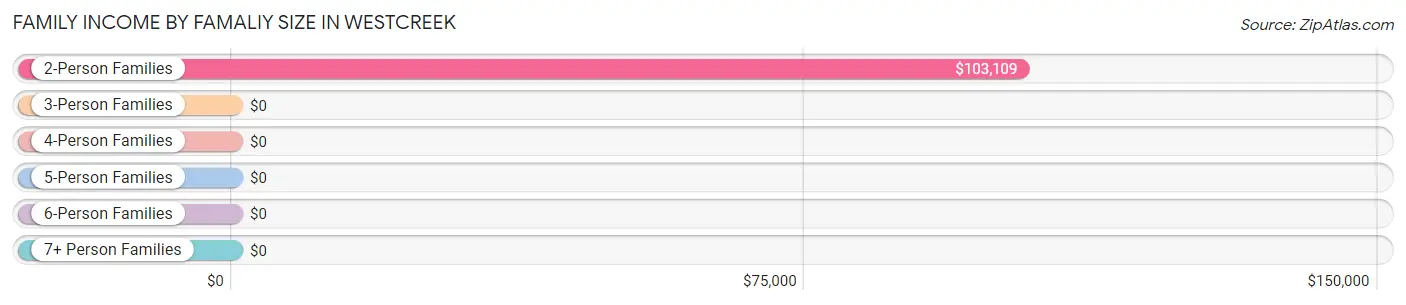
| Income Bracket | # Families | Median Income |
| 2-Person Families | 63 (70.0%) | $103,109 |
| 3-Person Families | 6 (6.7%) | $0 |
| 4-Person Families | 14 (15.6%) | $0 |
| 5-Person Families | 7 (7.8%) | $0 |
| 6-Person Families | 0 (0.0%) | $0 |
| 7+ Person Families | 0 (0.0%) | $0 |
| Total | 90 (100.0%) | $103,974 |
Family Income by Number of Earners in Westcreek
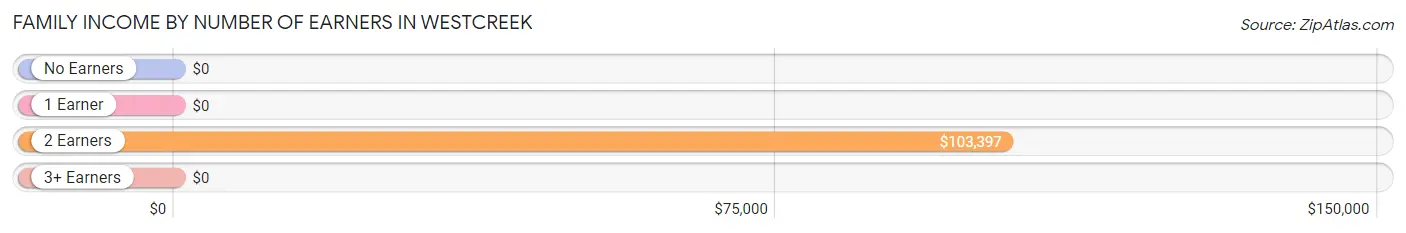
| Number of Earners | # Families | Median Income |
| No Earners | 0 (0.0%) | $0 |
| 1 Earner | 3 (3.3%) | $0 |
| 2 Earners | 66 (73.3%) | $103,397 |
| 3+ Earners | 21 (23.3%) | $0 |
| Total | 90 (100.0%) | $103,974 |
Household Income in Westcreek
Household Income Brackets in Westcreek
With 45 households falling in the category, the $100,000 to $149,999 income range is the most frequent in Westcreek, accounting for 46.4% of all households.
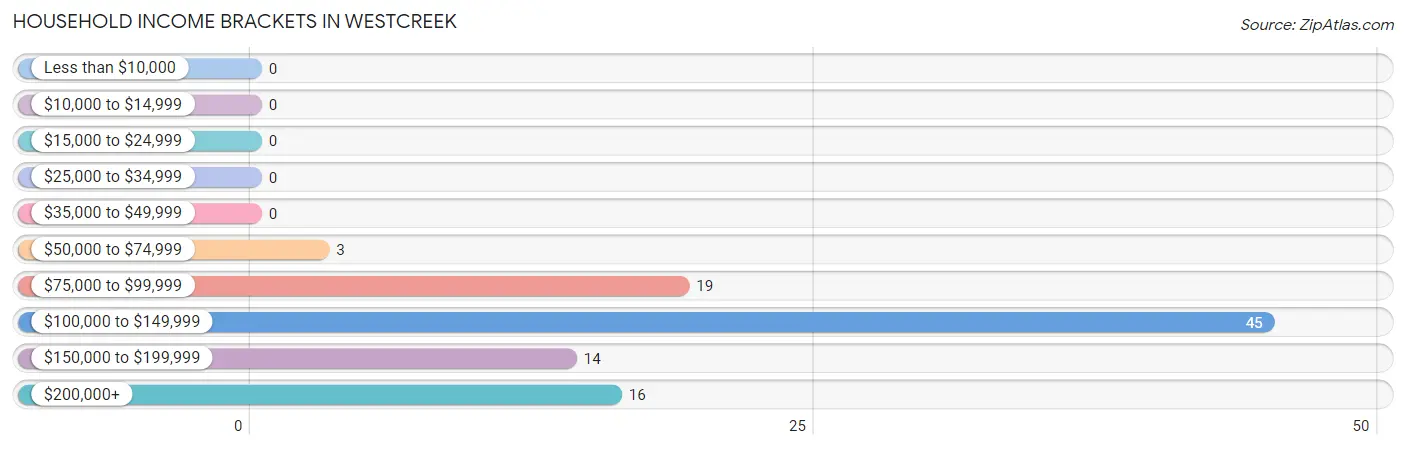
| Income Bracket | # Households | % Households |
| Less than $10,000 | 0 | 0.0% |
| $10,000 to $14,999 | 0 | 0.0% |
| $15,000 to $24,999 | 0 | 0.0% |
| $25,000 to $34,999 | 0 | 0.0% |
| $35,000 to $49,999 | 0 | 0.0% |
| $50,000 to $74,999 | 3 | 3.1% |
| $75,000 to $99,999 | 19 | 19.6% |
| $100,000 to $149,999 | 45 | 46.4% |
| $150,000 to $199,999 | 14 | 14.4% |
| $200,000+ | 16 | 16.5% |
Household Income by Householder Age in Westcreek
The median household income in Westcreek is $136,699, with the highest median household income of $160,179 found in the 45 to 64 years age bracket for the primary householder. A total of 58 households (59.8%) fall into this category.
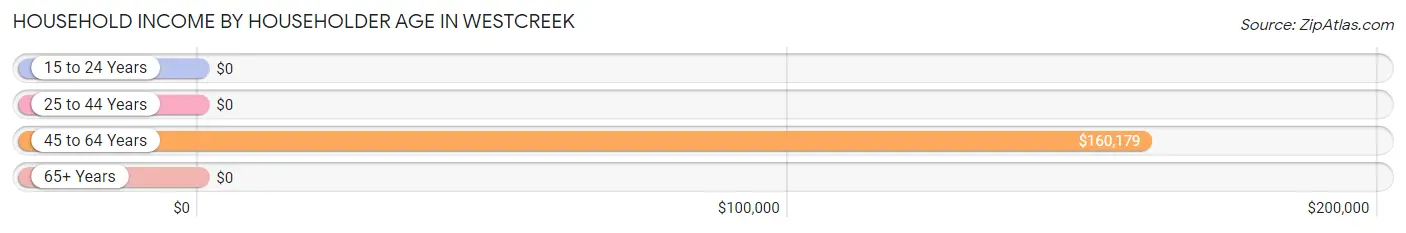
| Income Bracket | # Households | Median Income |
| 15 to 24 Years | 0 (0.0%) | $0 |
| 25 to 44 Years | 39 (40.2%) | $0 |
| 45 to 64 Years | 58 (59.8%) | $160,179 |
| 65+ Years | 0 (0.0%) | $0 |
| Total | 97 (100.0%) | $136,699 |
Poverty in Westcreek
Income Below Poverty by Sex and Age in Westcreek
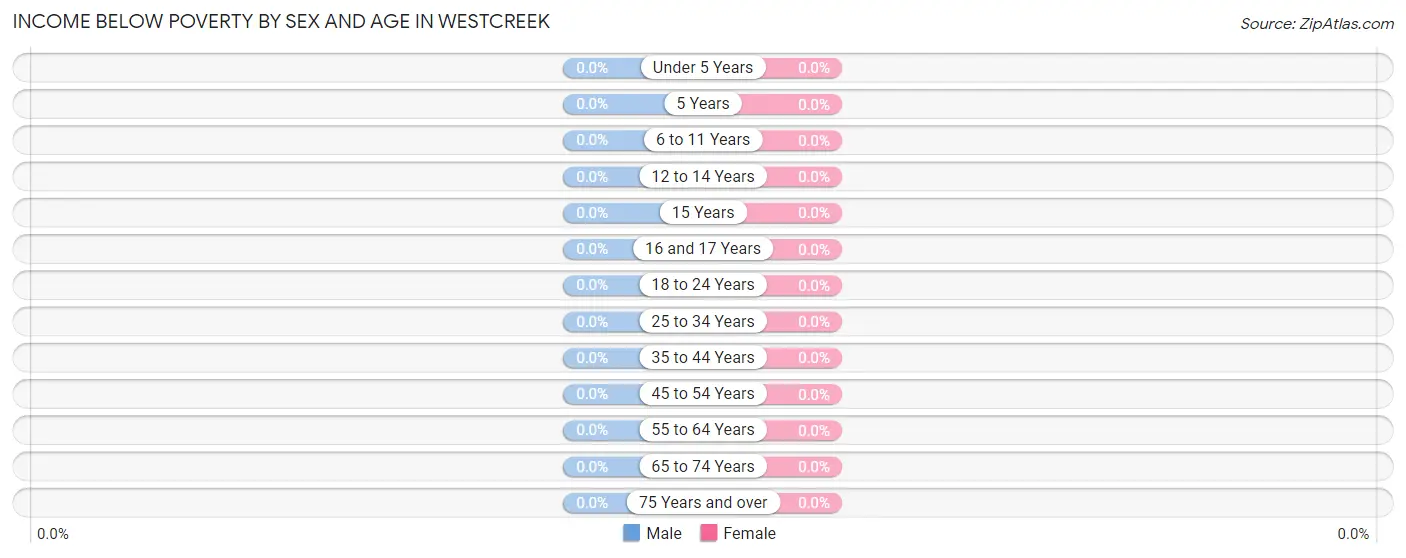
| Age Bracket | Male | Female |
| Under 5 Years | 0 (0.0%) | 0 (0.0%) |
| 5 Years | 0 (0.0%) | 0 (0.0%) |
| 6 to 11 Years | 0 (0.0%) | 0 (0.0%) |
| 12 to 14 Years | 0 (0.0%) | 0 (0.0%) |
| 15 Years | 0 (0.0%) | 0 (0.0%) |
| 16 and 17 Years | 0 (0.0%) | 0 (0.0%) |
| 18 to 24 Years | 0 (0.0%) | 0 (0.0%) |
| 25 to 34 Years | 0 (0.0%) | 0 (0.0%) |
| 35 to 44 Years | 0 (0.0%) | 0 (0.0%) |
| 45 to 54 Years | 0 (0.0%) | 0 (0.0%) |
| 55 to 64 Years | 0 (0.0%) | 0 (0.0%) |
| 65 to 74 Years | 0 (0.0%) | 0 (0.0%) |
| 75 Years and over | 0 (0.0%) | 0 (0.0%) |
| Total | 0 (0.0%) | 0 (0.0%) |
Income Above Poverty by Sex and Age in Westcreek
According to the poverty statistics in Westcreek, males aged 6 to 11 years and females aged 6 to 11 years are the age groups that are most secure financially, with 100.0% of males and 100.0% of females in these age groups living above the poverty line.
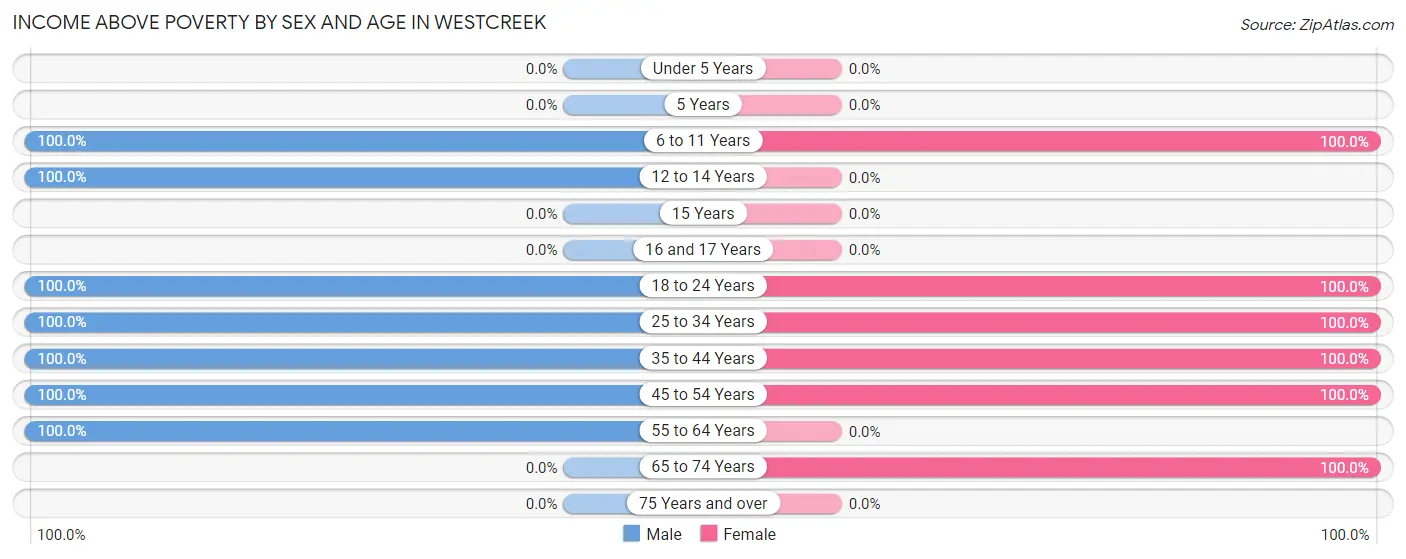
| Age Bracket | Male | Female |
| Under 5 Years | 0 (0.0%) | 0 (0.0%) |
| 5 Years | 0 (0.0%) | 0 (0.0%) |
| 6 to 11 Years | 6 (100.0%) | 7 (100.0%) |
| 12 to 14 Years | 13 (100.0%) | 0 (0.0%) |
| 15 Years | 0 (0.0%) | 0 (0.0%) |
| 16 and 17 Years | 0 (0.0%) | 0 (0.0%) |
| 18 to 24 Years | 29 (100.0%) | 8 (100.0%) |
| 25 to 34 Years | 39 (100.0%) | 40 (100.0%) |
| 35 to 44 Years | 42 (100.0%) | 6 (100.0%) |
| 45 to 54 Years | 38 (100.0%) | 28 (100.0%) |
| 55 to 64 Years | 22 (100.0%) | 0 (0.0%) |
| 65 to 74 Years | 0 (0.0%) | 3 (100.0%) |
| 75 Years and over | 0 (0.0%) | 0 (0.0%) |
| Total | 189 (100.0%) | 92 (100.0%) |
Income Below Poverty Among Married-Couple Families in Westcreek
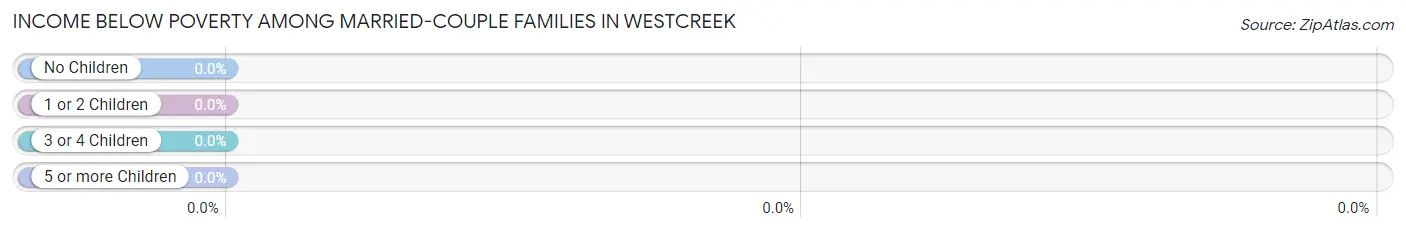
| Children | Above Poverty | Below Poverty |
| No Children | 63 (100.0%) | 0 (0.0%) |
| 1 or 2 Children | 27 (100.0%) | 0 (0.0%) |
| 3 or 4 Children | 0 (0.0%) | 0 (0.0%) |
| 5 or more Children | 0 (0.0%) | 0 (0.0%) |
| Total | 90 (100.0%) | 0 (0.0%) |
Income Below Poverty Among Single-Parent Households in Westcreek
| Children | Single Father | Single Mother |
| No Children | 0 (0.0%) | 0 (0.0%) |
| 1 or 2 Children | 0 (0.0%) | 0 (0.0%) |
| 3 or 4 Children | 0 (0.0%) | 0 (0.0%) |
| 5 or more Children | 0 (0.0%) | 0 (0.0%) |
| Total | 0 (0.0%) | 0 (0.0%) |
Income Below Poverty Among Married-Couple vs Single-Parent Households in Westcreek
| Children | Married-Couple Families | Single-Parent Households |
| No Children | 0 (0.0%) | 0 (0.0%) |
| 1 or 2 Children | 0 (0.0%) | 0 (0.0%) |
| 3 or 4 Children | 0 (0.0%) | 0 (0.0%) |
| 5 or more Children | 0 (0.0%) | 0 (0.0%) |
| Total | 0 (0.0%) | 0 (0.0%) |
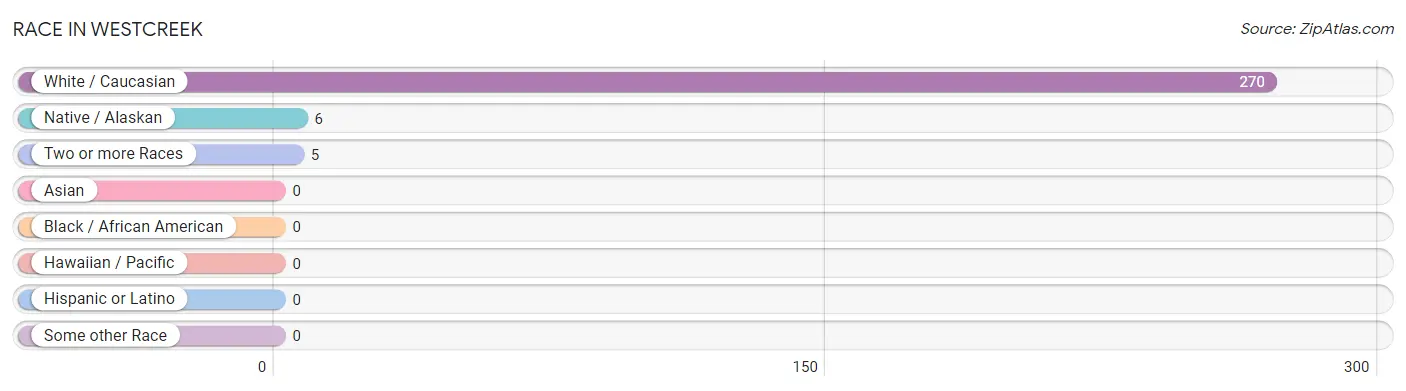
Race in Westcreek
The most populous races in Westcreek are White / Caucasian (270 | 96.1%), Native / Alaskan (6 | 2.1%), and Two or more Races (5 | 1.8%).
| Race | # Population | % Population |
| Asian | 0 | 0.0% |
| Black / African American | 0 | 0.0% |
| Hawaiian / Pacific | 0 | 0.0% |
| Hispanic or Latino | 0 | 0.0% |
| Native / Alaskan | 6 | 2.1% |
| White / Caucasian | 270 | 96.1% |
| Two or more Races | 5 | 1.8% |
| Some other Race | 0 | 0.0% |
| Total | 281 | 100.0% |
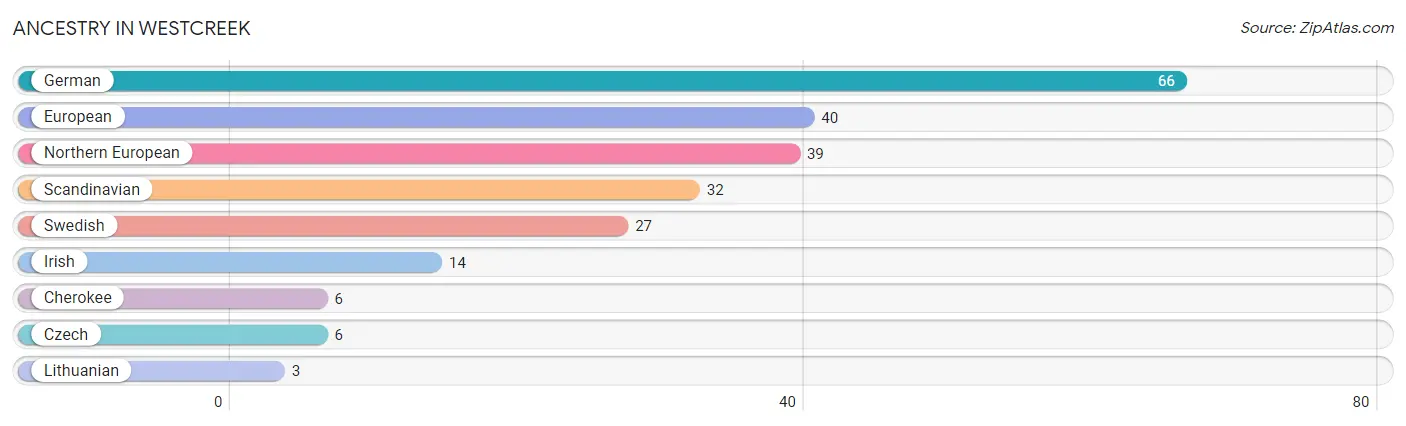
Ancestry in Westcreek
The most populous ancestries reported in Westcreek are German (66 | 23.5%), European (40 | 14.2%), Northern European (39 | 13.9%), Scandinavian (32 | 11.4%), and Swedish (27 | 9.6%), together accounting for 72.6% of all Westcreek residents.
| Ancestry | # Population | % Population |
| Cherokee | 6 | 2.1% |
| Czech | 6 | 2.1% |
| European | 40 | 14.2% |
| German | 66 | 23.5% |
| Irish | 14 | 5.0% |
| Lithuanian | 3 | 1.1% |
| Northern European | 39 | 13.9% |
| Scandinavian | 32 | 11.4% |
| Swedish | 27 | 9.6% | View All 9 Rows |
Immigrants in Westcreek

| Immigration Origin | # Population | % Population | View All 0 Rows |
Sex and Age in Westcreek
Sex and Age in Westcreek
The most populous age groups in Westcreek are 35 to 39 Years (42 | 22.2%) for men and 25 to 29 Years (40 | 43.5%) for women.
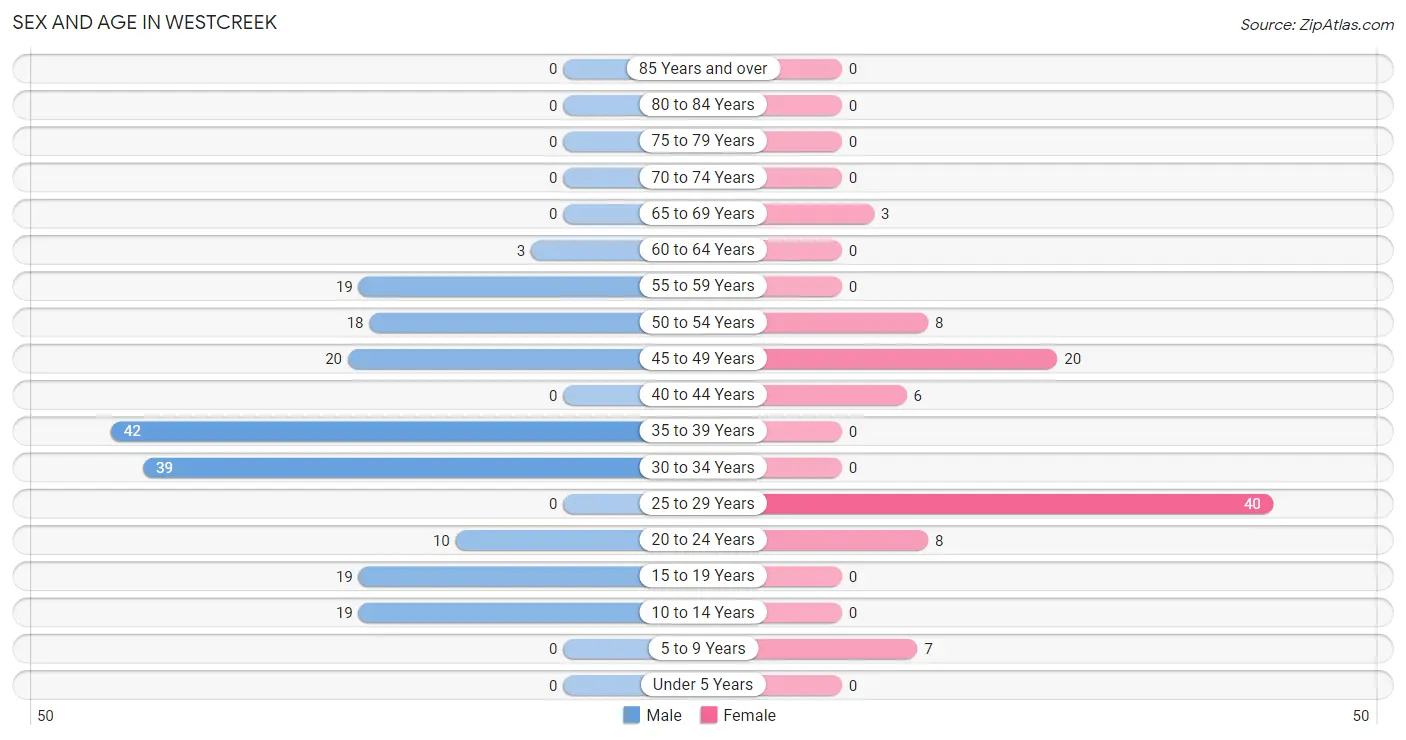
| Age Bracket | Male | Female |
| Under 5 Years | 0 (0.0%) | 0 (0.0%) |
| 5 to 9 Years | 0 (0.0%) | 7 (7.6%) |
| 10 to 14 Years | 19 (10.1%) | 0 (0.0%) |
| 15 to 19 Years | 19 (10.1%) | 0 (0.0%) |
| 20 to 24 Years | 10 (5.3%) | 8 (8.7%) |
| 25 to 29 Years | 0 (0.0%) | 40 (43.5%) |
| 30 to 34 Years | 39 (20.6%) | 0 (0.0%) |
| 35 to 39 Years | 42 (22.2%) | 0 (0.0%) |
| 40 to 44 Years | 0 (0.0%) | 6 (6.5%) |
| 45 to 49 Years | 20 (10.6%) | 20 (21.7%) |
| 50 to 54 Years | 18 (9.5%) | 8 (8.7%) |
| 55 to 59 Years | 19 (10.1%) | 0 (0.0%) |
| 60 to 64 Years | 3 (1.6%) | 0 (0.0%) |
| 65 to 69 Years | 0 (0.0%) | 3 (3.3%) |
| 70 to 74 Years | 0 (0.0%) | 0 (0.0%) |
| 75 to 79 Years | 0 (0.0%) | 0 (0.0%) |
| 80 to 84 Years | 0 (0.0%) | 0 (0.0%) |
| 85 Years and over | 0 (0.0%) | 0 (0.0%) |
| Total | 189 (100.0%) | 92 (100.0%) |
Families and Households in Westcreek
Median Family Size in Westcreek
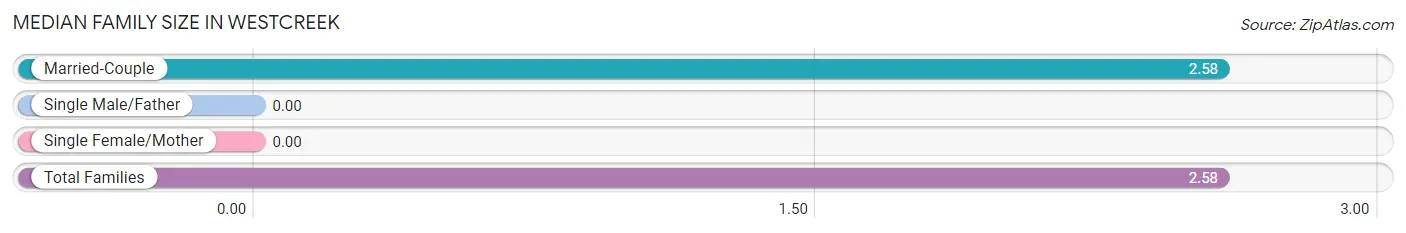
| Family Type | # Families | Family Size |
| Married-Couple | 90 (100.0%) | 2.58 |
| Single Male/Father | 0 (0.0%) | - |
| Single Female/Mother | 0 (0.0%) | - |
| Total Families | 90 (100.0%) | 2.58 |
Median Household Size in Westcreek
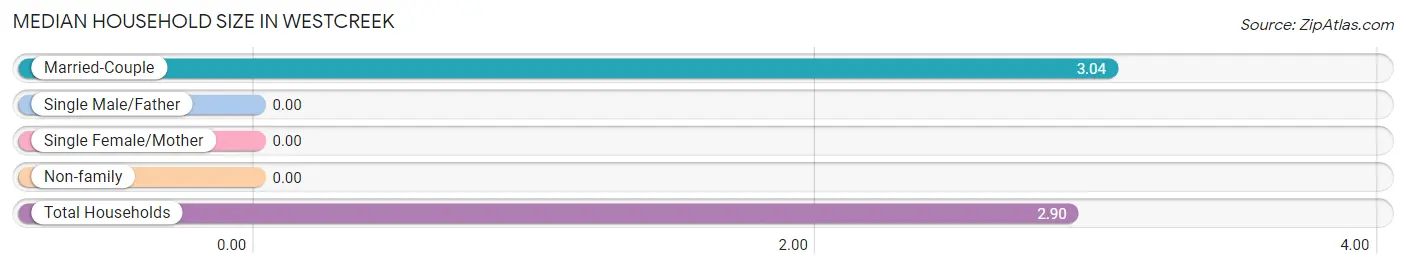
| Household Type | # Households | Household Size |
| Married-Couple | 90 (92.8%) | 3.04 |
| Single Male/Father | 0 (0.0%) | - |
| Single Female/Mother | 0 (0.0%) | - |
| Non-family | 7 (7.2%) | - |
| Total Households | 97 (100.0%) | 2.90 |
Household Size by Marriage Status in Westcreek
Out of a total of 97 households in Westcreek, 90 (92.8%) are family households, while 7 (7.2%) are nonfamily households. The most numerous type of family households are 3-person households, comprising 45, and the most common type of nonfamily households are 1-person households, comprising 7.
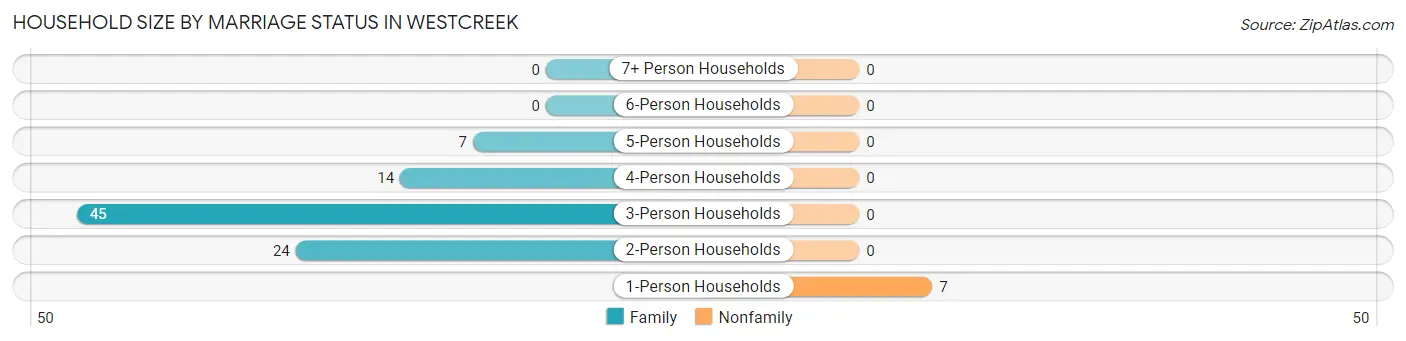
| Household Size | Family Households | Nonfamily Households |
| 1-Person Households | - | 7 (7.2%) |
| 2-Person Households | 24 (24.7%) | 0 (0.0%) |
| 3-Person Households | 45 (46.4%) | 0 (0.0%) |
| 4-Person Households | 14 (14.4%) | 0 (0.0%) |
| 5-Person Households | 7 (7.2%) | 0 (0.0%) |
| 6-Person Households | 0 (0.0%) | 0 (0.0%) |
| 7+ Person Households | 0 (0.0%) | 0 (0.0%) |
| Total | 90 (92.8%) | 7 (7.2%) |
Female Fertility in Westcreek
Fertility by Age in Westcreek
| Age Bracket | Women with Births | Births / 1,000 Women |
| 15 to 19 years | 0 (0.0%) | 0.0 |
| 20 to 34 years | 0 (0.0%) | 0.0 |
| 35 to 50 years | 0 (0.0%) | 0.0 |
| Total | 0 (0.0%) | 0.0 |
Fertility by Age by Marriage Status in Westcreek
| Age Bracket | Married | Unmarried |
| 15 to 19 years | 0 (0.0%) | 0 (0.0%) |
| 20 to 34 years | 0 (0.0%) | 0 (0.0%) |
| 35 to 50 years | 0 (0.0%) | 0 (0.0%) |
| Total | 0 (0.0%) | 0 (0.0%) |
Fertility by Education in Westcreek
| Educational Attainment | Women with Births | Births / 1,000 Women |
| Less than High School | 0 (0.0%) | 0.0 |
| High School Diploma | 0 (0.0%) | 0.0 |
| College or Associate's Degree | 0 (0.0%) | 0.0 |
| Bachelor's Degree | 0 (0.0%) | 0.0 |
| Graduate Degree | 0 (0.0%) | 0.0 |
| Total | 0 (0.0%) | 0.0 |
Fertility by Education by Marriage Status in Westcreek
| Educational Attainment | Married | Unmarried |
| Less than High School | 0 (0.0%) | 0 (0.0%) |
| High School Diploma | 0 (0.0%) | 0 (0.0%) |
| College or Associate's Degree | 0 (0.0%) | 0 (0.0%) |
| Bachelor's Degree | 0 (0.0%) | 0 (0.0%) |
| Graduate Degree | 0 (0.0%) | 0 (0.0%) |
| Total | 0 (0.0%) | 0 (0.0%) |
Employment Characteristics in Westcreek
Employment by Class of Employer in Westcreek
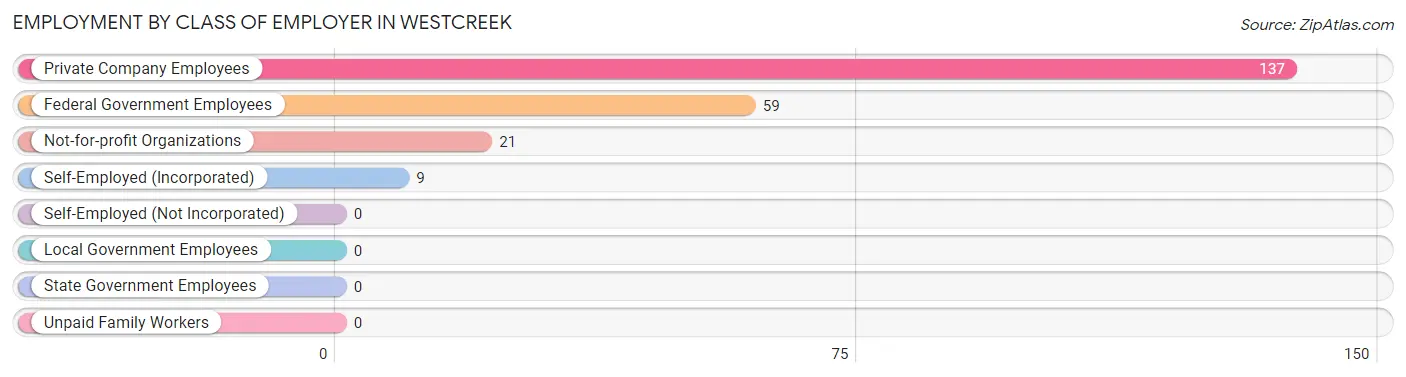
Among the 226 employed individuals in Westcreek, private company employees (137 | 60.6%), federal government employees (59 | 26.1%), and not-for-profit organizations (21 | 9.3%) make up the most common classes of employment.
| Employer Class | # Employees | % Employees |
| Private Company Employees | 137 | 60.6% |
| Self-Employed (Incorporated) | 9 | 4.0% |
| Self-Employed (Not Incorporated) | 0 | 0.0% |
| Not-for-profit Organizations | 21 | 9.3% |
| Local Government Employees | 0 | 0.0% |
| State Government Employees | 0 | 0.0% |
| Federal Government Employees | 59 | 26.1% |
| Unpaid Family Workers | 0 | 0.0% |
| Total | 226 | 100.0% |
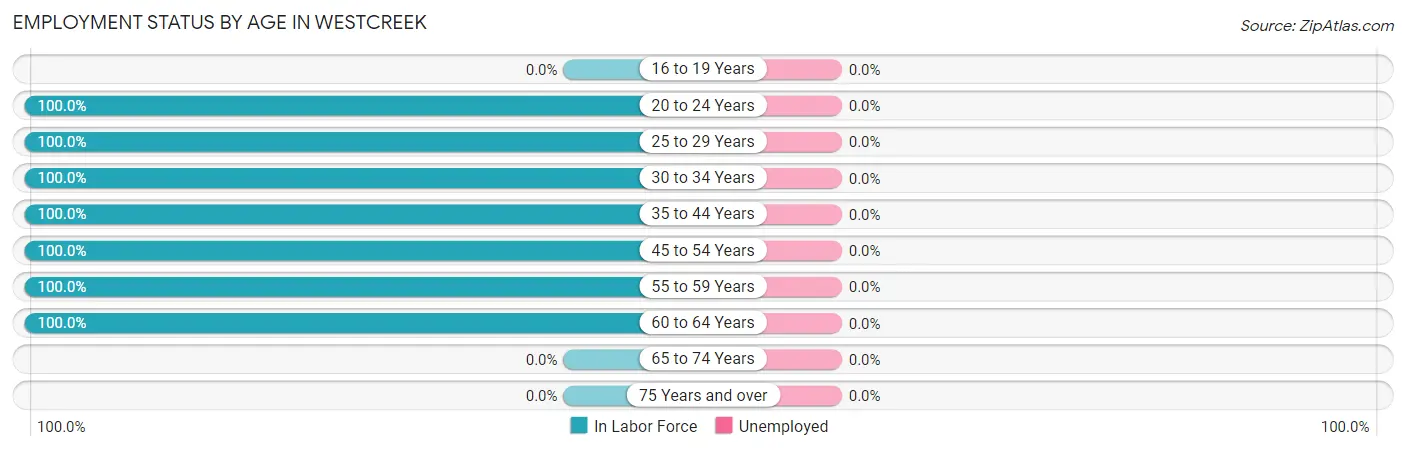
Employment Status by Age in Westcreek
| Age Bracket | In Labor Force | Unemployed |
| 16 to 19 Years | 0 (0.0%) | 0 (0.0%) |
| 20 to 24 Years | 18 (100.0%) | 0 (0.0%) |
| 25 to 29 Years | 40 (100.0%) | 0 (0.0%) |
| 30 to 34 Years | 39 (100.0%) | 0 (0.0%) |
| 35 to 44 Years | 48 (100.0%) | 0 (0.0%) |
| 45 to 54 Years | 66 (100.0%) | 0 (0.0%) |
| 55 to 59 Years | 19 (100.0%) | 0 (0.0%) |
| 60 to 64 Years | 3 (100.0%) | 0 (0.0%) |
| 65 to 74 Years | 0 (0.0%) | 0 (0.0%) |
| 75 Years and over | 0 (0.0%) | 0 (0.0%) |
| Total | 233 (91.4%) | 0 (0.0%) |
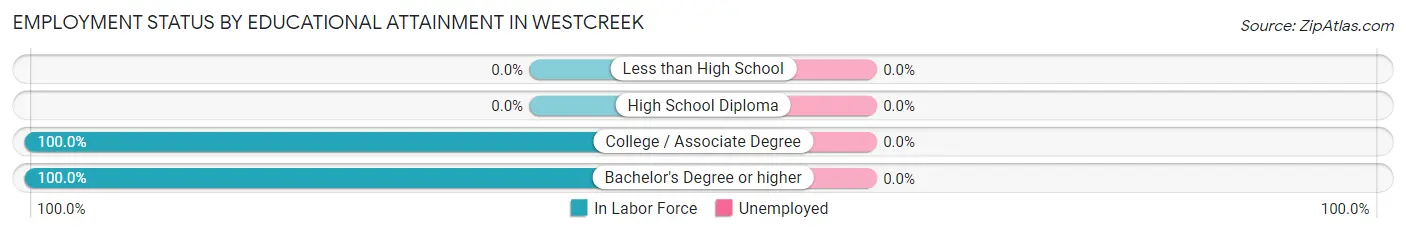
Employment Status by Educational Attainment in Westcreek
| Educational Attainment | In Labor Force | Unemployed |
| Less than High School | 0 (0.0%) | 0 (0.0%) |
| High School Diploma | 0 (0.0%) | 0 (0.0%) |
| College / Associate Degree | 177 (100.0%) | 0 (0.0%) |
| Bachelor's Degree or higher | 38 (100.0%) | 0 (0.0%) |
| Total | 215 (100.0%) | 0 (0.0%) |
Employment Occupations by Sex in Westcreek
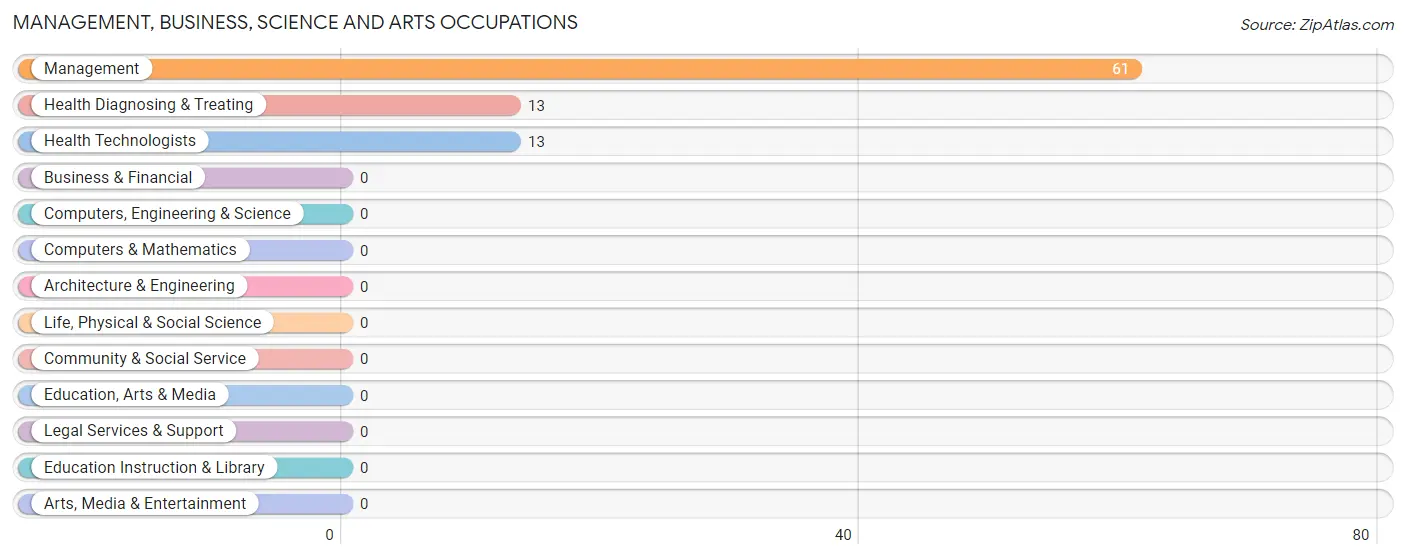
Management, Business, Science and Arts Occupations
The most common Management, Business, Science and Arts occupations in Westcreek are Management (61 | 26.2%), Health Diagnosing & Treating (13 | 5.6%), and Health Technologists (13 | 5.6%).
Management, Business, Science and Arts Occupations by Sex
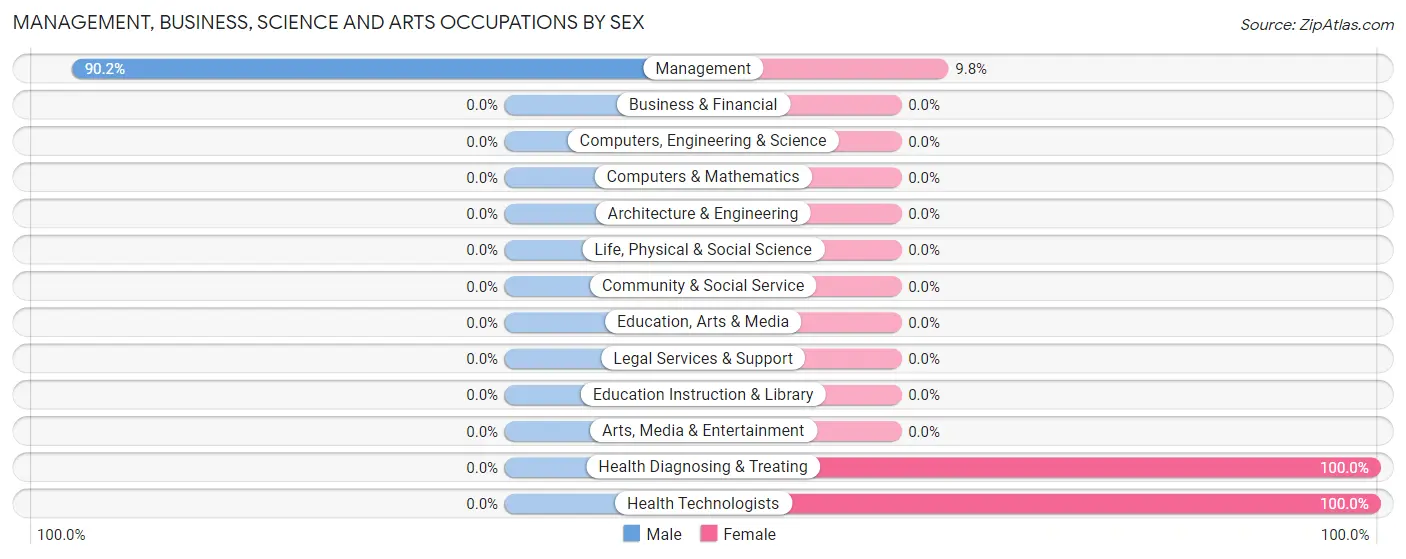
| Occupation | Male | Female |
| Management | 55 (90.2%) | 6 (9.8%) |
| Business & Financial | 0 (0.0%) | 0 (0.0%) |
| Computers, Engineering & Science | 0 (0.0%) | 0 (0.0%) |
| Computers & Mathematics | 0 (0.0%) | 0 (0.0%) |
| Architecture & Engineering | 0 (0.0%) | 0 (0.0%) |
| Life, Physical & Social Science | 0 (0.0%) | 0 (0.0%) |
| Community & Social Service | 0 (0.0%) | 0 (0.0%) |
| Education, Arts & Media | 0 (0.0%) | 0 (0.0%) |
| Legal Services & Support | 0 (0.0%) | 0 (0.0%) |
| Education Instruction & Library | 0 (0.0%) | 0 (0.0%) |
| Arts, Media & Entertainment | 0 (0.0%) | 0 (0.0%) |
| Health Diagnosing & Treating | 0 (0.0%) | 13 (100.0%) |
| Health Technologists | 0 (0.0%) | 13 (100.0%) |
| Total (Category) | 55 (74.3%) | 19 (25.7%) |
| Total (Overall) | 151 (64.8%) | 82 (35.2%) |
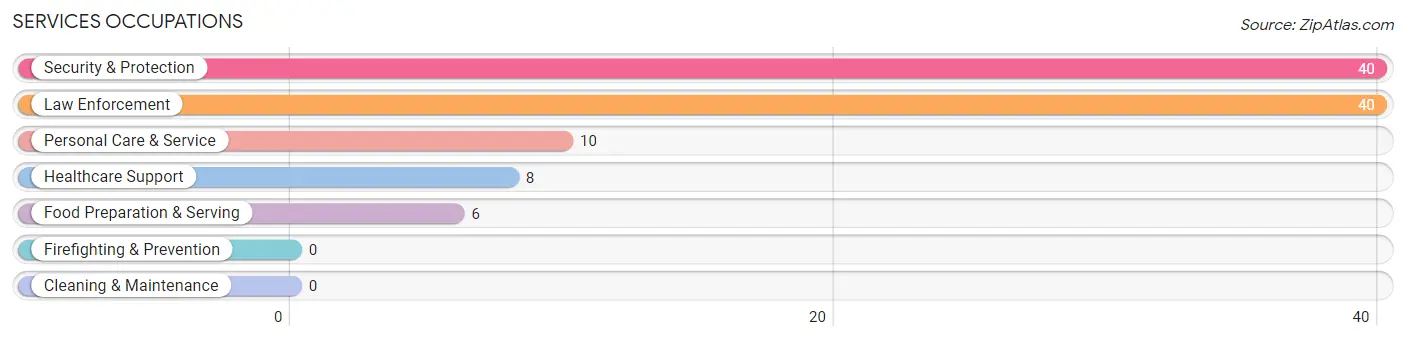
Services Occupations
The most common Services occupations in Westcreek are Security & Protection (40 | 17.2%), Law Enforcement (40 | 17.2%), Personal Care & Service (10 | 4.3%), Healthcare Support (8 | 3.4%), and Food Preparation & Serving (6 | 2.6%).
Services Occupations by Sex
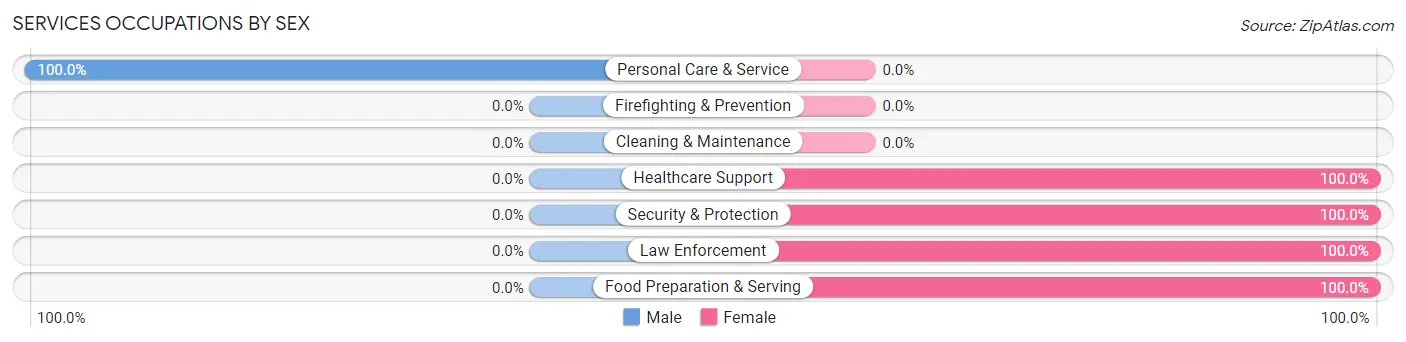
| Occupation | Male | Female |
| Healthcare Support | 0 (0.0%) | 8 (100.0%) |
| Security & Protection | 0 (0.0%) | 40 (100.0%) |
| Firefighting & Prevention | 0 (0.0%) | 0 (0.0%) |
| Law Enforcement | 0 (0.0%) | 40 (100.0%) |
| Food Preparation & Serving | 0 (0.0%) | 6 (100.0%) |
| Cleaning & Maintenance | 0 (0.0%) | 0 (0.0%) |
| Personal Care & Service | 10 (100.0%) | 0 (0.0%) |
| Total (Category) | 10 (15.6%) | 54 (84.4%) |
| Total (Overall) | 151 (64.8%) | 82 (35.2%) |
Sales and Office Occupations
The most common Sales and Office occupations in Westcreek are Office & Administration (27 | 11.6%), and Sales & Related (9 | 3.9%).
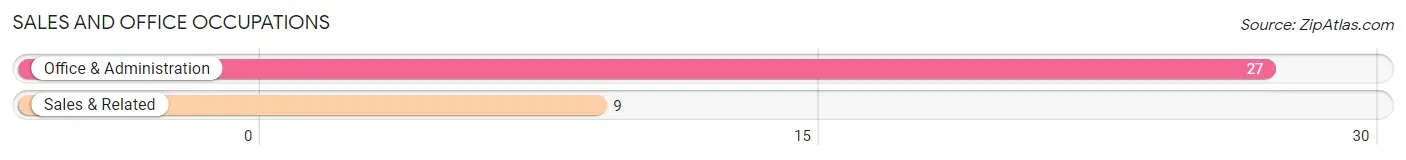
Sales and Office Occupations by Sex

| Occupation | Male | Female |
| Sales & Related | 0 (0.0%) | 9 (100.0%) |
| Office & Administration | 27 (100.0%) | 0 (0.0%) |
| Total (Category) | 27 (75.0%) | 9 (25.0%) |
| Total (Overall) | 151 (64.8%) | 82 (35.2%) |
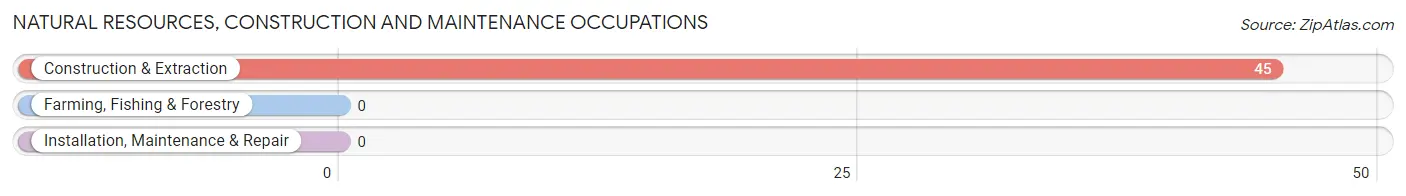
Natural Resources, Construction and Maintenance Occupations
The most common Natural Resources, Construction and Maintenance occupations in Westcreek are , and Construction & Extraction (45 | 19.3%).
Natural Resources, Construction and Maintenance Occupations by Sex
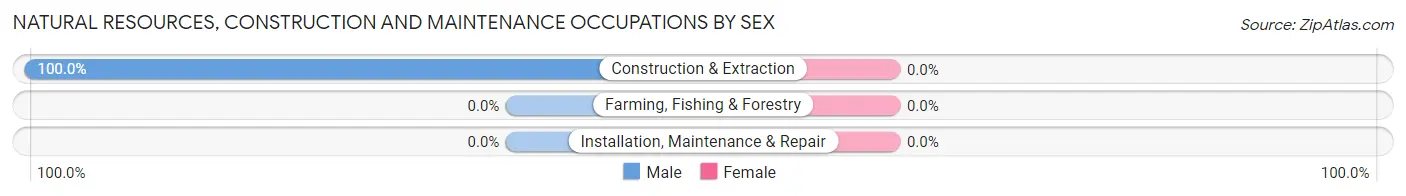
| Occupation | Male | Female |
| Farming, Fishing & Forestry | 0 (0.0%) | 0 (0.0%) |
| Construction & Extraction | 45 (100.0%) | 0 (0.0%) |
| Installation, Maintenance & Repair | 0 (0.0%) | 0 (0.0%) |
| Total (Category) | 45 (100.0%) | 0 (0.0%) |
| Total (Overall) | 151 (64.8%) | 82 (35.2%) |
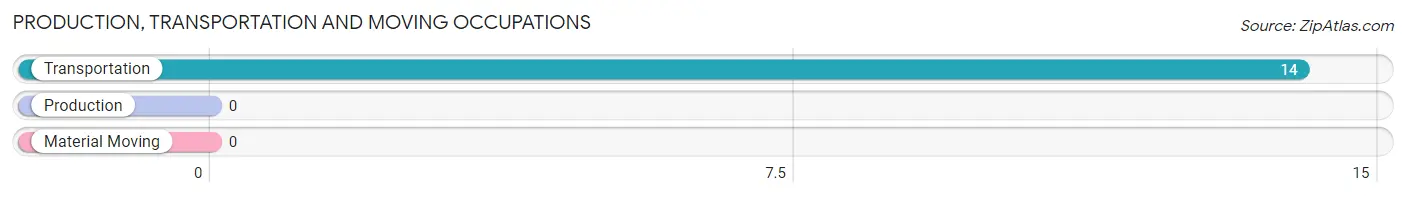
Production, Transportation and Moving Occupations
The most common Production, Transportation and Moving occupations in Westcreek are , and Transportation (14 | 6.0%).
Production, Transportation and Moving Occupations by Sex
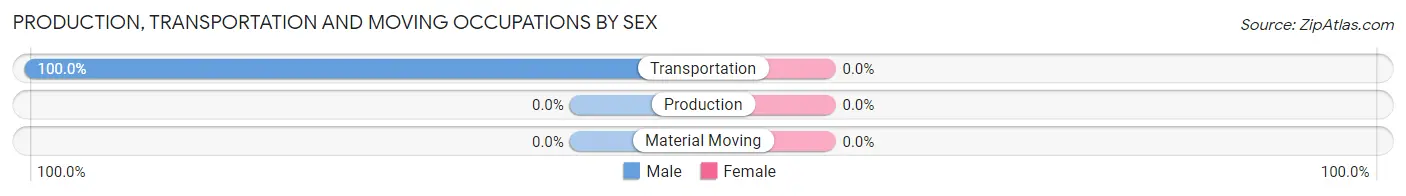
| Occupation | Male | Female |
| Production | 0 (0.0%) | 0 (0.0%) |
| Transportation | 14 (100.0%) | 0 (0.0%) |
| Material Moving | 0 (0.0%) | 0 (0.0%) |
| Total (Category) | 14 (100.0%) | 0 (0.0%) |
| Total (Overall) | 151 (64.8%) | 82 (35.2%) |
Employment Industries by Sex in Westcreek
Employment Industries in Westcreek
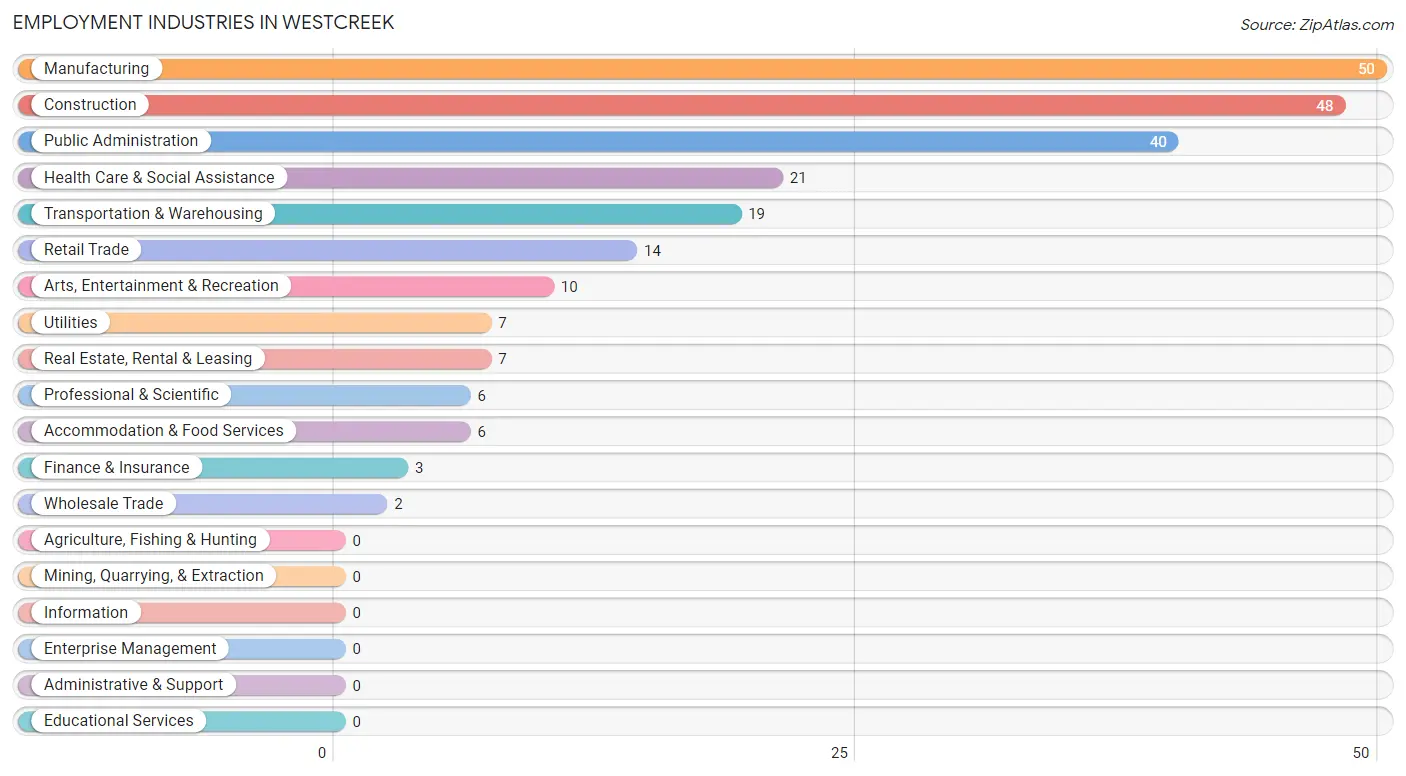
The major employment industries in Westcreek include Manufacturing (50 | 21.5%), Construction (48 | 20.6%), Public Administration (40 | 17.2%), Health Care & Social Assistance (21 | 9.0%), and Transportation & Warehousing (19 | 8.2%).
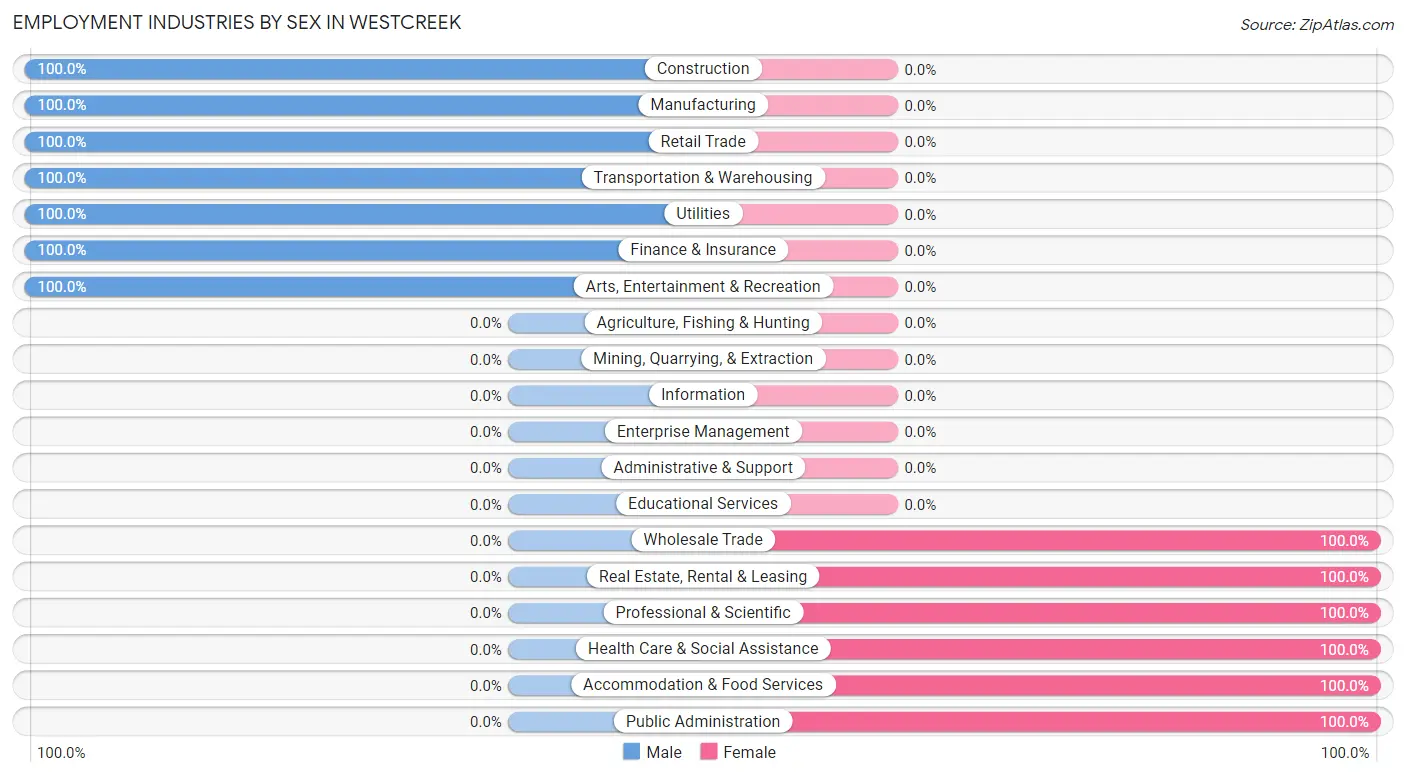
Employment Industries by Sex in Westcreek
The Westcreek industries that see more men than women are Construction (100.0%), Manufacturing (100.0%), and Retail Trade (100.0%), whereas the industries that tend to have a higher number of women are Wholesale Trade (100.0%), Real Estate, Rental & Leasing (100.0%), and Professional & Scientific (100.0%).
| Industry | Male | Female |
| Agriculture, Fishing & Hunting | 0 (0.0%) | 0 (0.0%) |
| Mining, Quarrying, & Extraction | 0 (0.0%) | 0 (0.0%) |
| Construction | 48 (100.0%) | 0 (0.0%) |
| Manufacturing | 50 (100.0%) | 0 (0.0%) |
| Wholesale Trade | 0 (0.0%) | 2 (100.0%) |
| Retail Trade | 14 (100.0%) | 0 (0.0%) |
| Transportation & Warehousing | 19 (100.0%) | 0 (0.0%) |
| Utilities | 7 (100.0%) | 0 (0.0%) |
| Information | 0 (0.0%) | 0 (0.0%) |
| Finance & Insurance | 3 (100.0%) | 0 (0.0%) |
| Real Estate, Rental & Leasing | 0 (0.0%) | 7 (100.0%) |
| Professional & Scientific | 0 (0.0%) | 6 (100.0%) |
| Enterprise Management | 0 (0.0%) | 0 (0.0%) |
| Administrative & Support | 0 (0.0%) | 0 (0.0%) |
| Educational Services | 0 (0.0%) | 0 (0.0%) |
| Health Care & Social Assistance | 0 (0.0%) | 21 (100.0%) |
| Arts, Entertainment & Recreation | 10 (100.0%) | 0 (0.0%) |
| Accommodation & Food Services | 0 (0.0%) | 6 (100.0%) |
| Public Administration | 0 (0.0%) | 40 (100.0%) |
| Total | 151 (64.8%) | 82 (35.2%) |
Education in Westcreek
School Enrollment in Westcreek
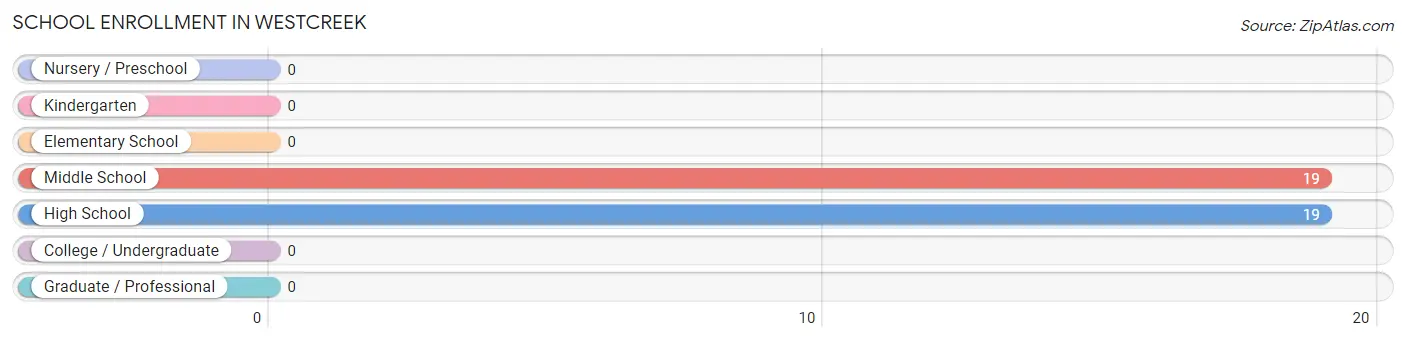
The most common levels of schooling among the 38 students in Westcreek are middle school (19 | 50.0%), and high school (19 | 50.0%).
| School Level | # Students | % Students |
| Nursery / Preschool | 0 | 0.0% |
| Kindergarten | 0 | 0.0% |
| Elementary School | 0 | 0.0% |
| Middle School | 19 | 50.0% |
| High School | 19 | 50.0% |
| College / Undergraduate | 0 | 0.0% |
| Graduate / Professional | 0 | 0.0% |
| Total | 38 | 100.0% |
School Enrollment by Age by Funding Source in Westcreek

| Age Bracket | Public School | Private School |
| 3 to 4 Year Olds | 0 (0.0%) | 0 (0.0%) |
| 5 to 9 Year Old | 0 (0.0%) | 0 (0.0%) |
| 10 to 14 Year Olds | 19 (100.0%) | 0 (0.0%) |
| 15 to 17 Year Olds | 0 (0.0%) | 0 (0.0%) |
| 18 to 19 Year Olds | 19 (100.0%) | 0 (0.0%) |
| 20 to 24 Year Olds | 0 (0.0%) | 0 (0.0%) |
| 25 to 34 Year Olds | 0 (0.0%) | 0 (0.0%) |
| 35 Years and over | 0 (0.0%) | 0 (0.0%) |
| Total | 38 (100.0%) | 0 (0.0%) |
Educational Attainment by Field of Study in Westcreek
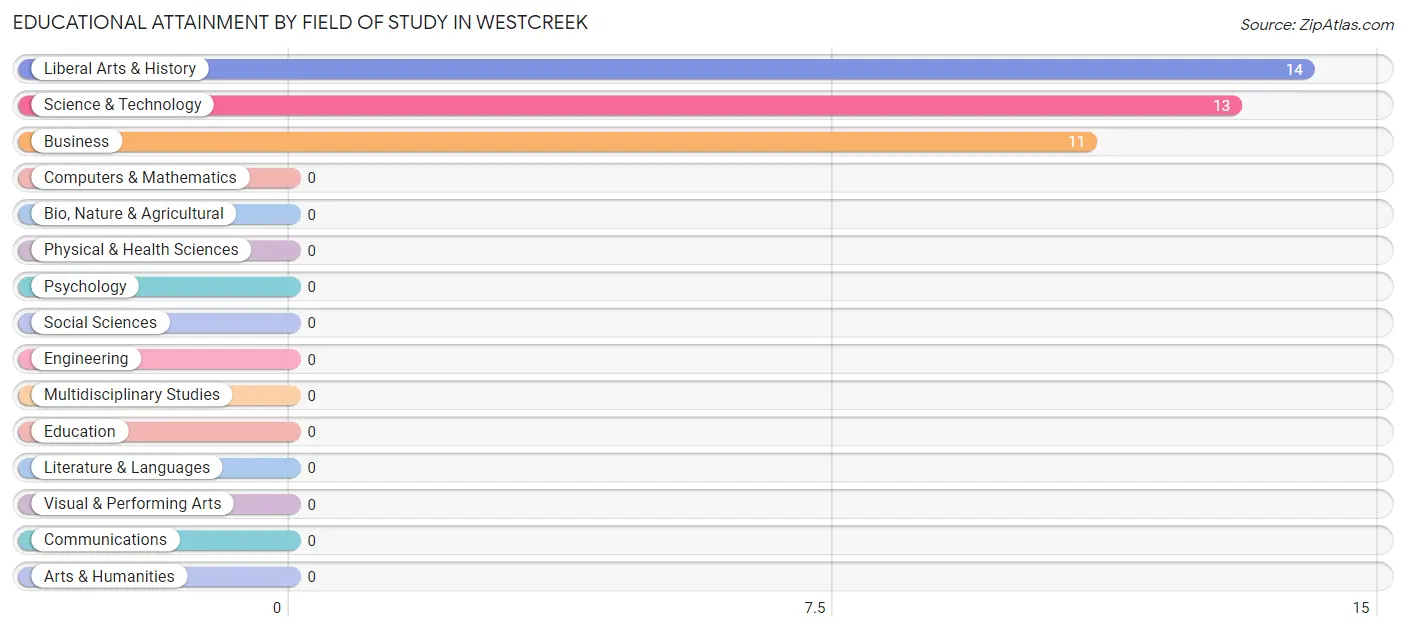
Liberal arts & history (14 | 36.8%), science & technology (13 | 34.2%), and business (11 | 28.9%) are the most common fields of study among 38 individuals in Westcreek who have obtained a bachelor's degree or higher.
| Field of Study | # Graduates | % Graduates |
| Computers & Mathematics | 0 | 0.0% |
| Bio, Nature & Agricultural | 0 | 0.0% |
| Physical & Health Sciences | 0 | 0.0% |
| Psychology | 0 | 0.0% |
| Social Sciences | 0 | 0.0% |
| Engineering | 0 | 0.0% |
| Multidisciplinary Studies | 0 | 0.0% |
| Science & Technology | 13 | 34.2% |
| Business | 11 | 28.9% |
| Education | 0 | 0.0% |
| Literature & Languages | 0 | 0.0% |
| Liberal Arts & History | 14 | 36.8% |
| Visual & Performing Arts | 0 | 0.0% |
| Communications | 0 | 0.0% |
| Arts & Humanities | 0 | 0.0% |
| Total | 38 | 100.0% |
Transportation & Commute in Westcreek
Vehicle Availability by Sex in Westcreek
The most prevalent vehicle ownership categories in Westcreek are males with 3 vehicles (104, accounting for 68.9%) and females with 3 vehicles (61, making up 138.7%).
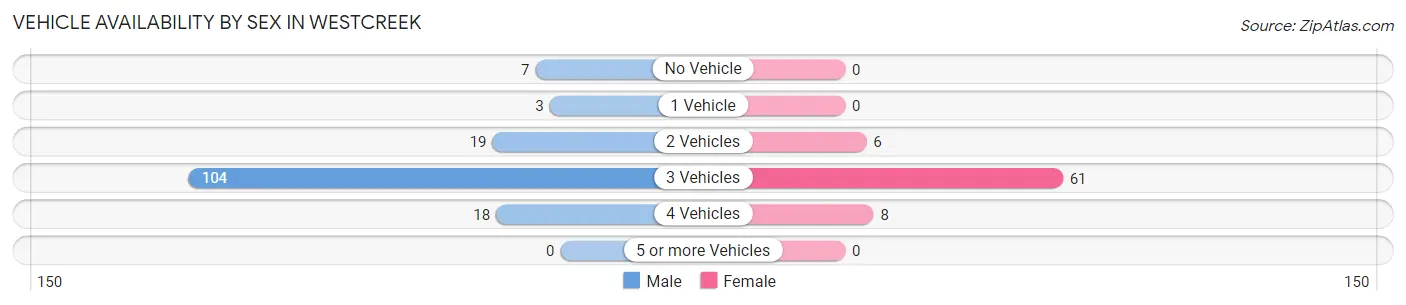
| Vehicles Available | Male | Female |
| No Vehicle | 7 (4.6%) | 0 (0.0%) |
| 1 Vehicle | 3 (2.0%) | 0 (0.0%) |
| 2 Vehicles | 19 (12.6%) | 6 (8.0%) |
| 3 Vehicles | 104 (68.9%) | 61 (81.3%) |
| 4 Vehicles | 18 (11.9%) | 8 (10.7%) |
| 5 or more Vehicles | 0 (0.0%) | 0 (0.0%) |
| Total | 151 (100.0%) | 75 (100.0%) |
Commute Time in Westcreek
The most frequently occuring commute durations in Westcreek are 60 to 89 minutes (114 commuters, 54.0%), 30 to 34 minutes (46 commuters, 21.8%), and 45 to 59 minutes (37 commuters, 17.5%).
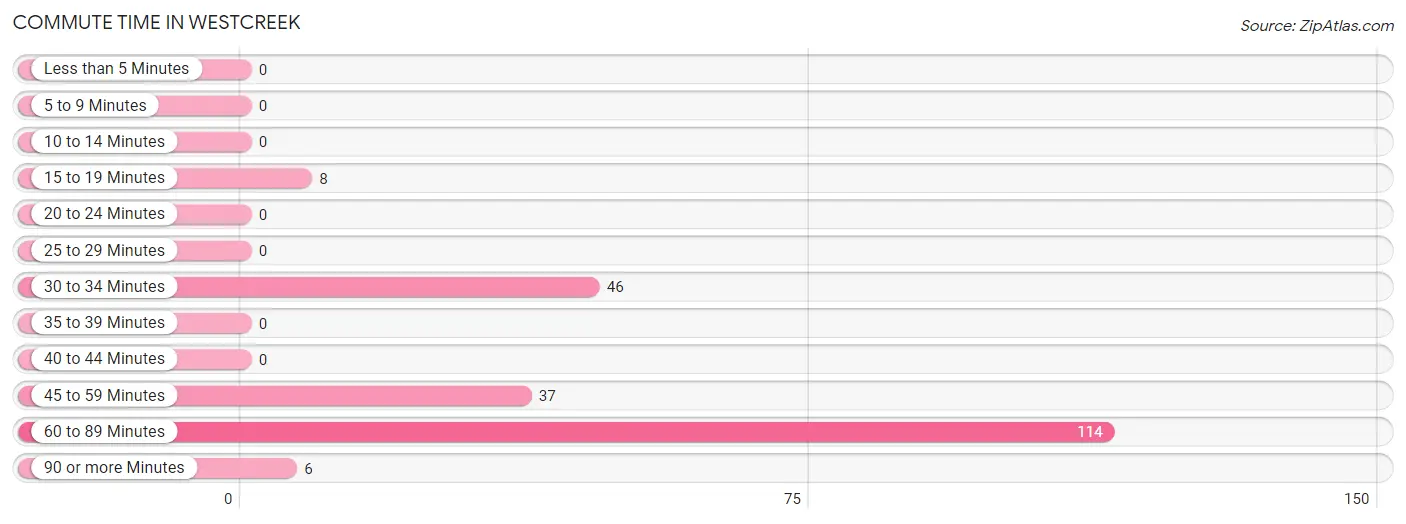
| Commute Time | # Commuters | % Commuters |
| Less than 5 Minutes | 0 | 0.0% |
| 5 to 9 Minutes | 0 | 0.0% |
| 10 to 14 Minutes | 0 | 0.0% |
| 15 to 19 Minutes | 8 | 3.8% |
| 20 to 24 Minutes | 0 | 0.0% |
| 25 to 29 Minutes | 0 | 0.0% |
| 30 to 34 Minutes | 46 | 21.8% |
| 35 to 39 Minutes | 0 | 0.0% |
| 40 to 44 Minutes | 0 | 0.0% |
| 45 to 59 Minutes | 37 | 17.5% |
| 60 to 89 Minutes | 114 | 54.0% |
| 90 or more Minutes | 6 | 2.8% |
Commute Time by Sex in Westcreek
The most common commute times in Westcreek are 60 to 89 minutes (106 commuters, 73.6%) for males and 30 to 34 minutes (46 commuters, 68.7%) for females.
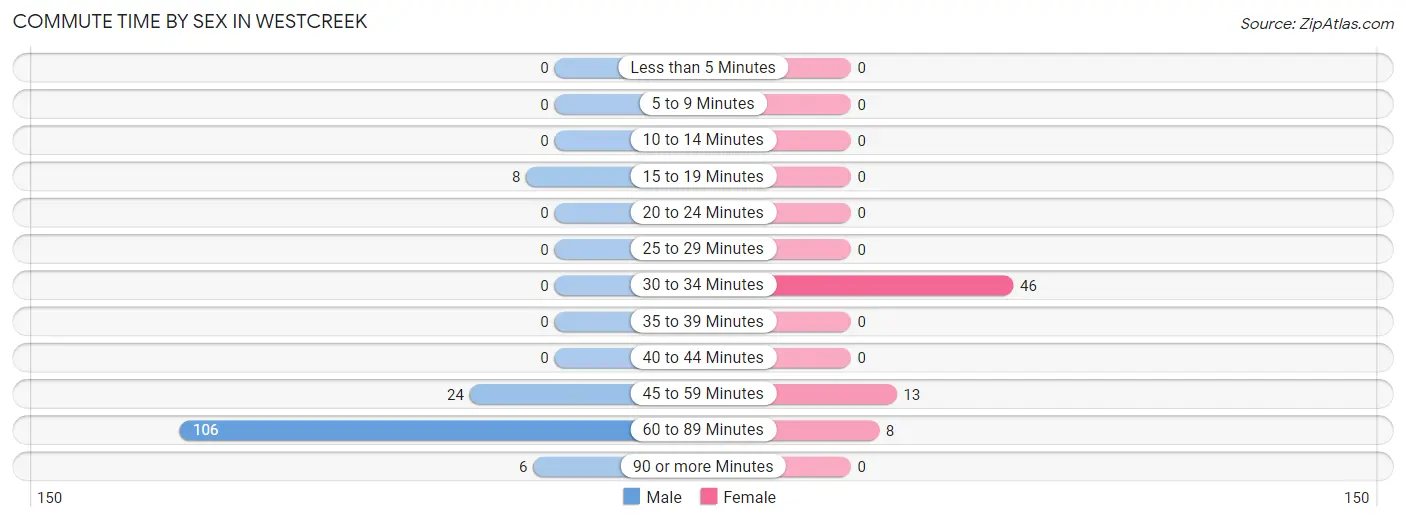
| Commute Time | Male | Female |
| Less than 5 Minutes | 0 (0.0%) | 0 (0.0%) |
| 5 to 9 Minutes | 0 (0.0%) | 0 (0.0%) |
| 10 to 14 Minutes | 0 (0.0%) | 0 (0.0%) |
| 15 to 19 Minutes | 8 (5.6%) | 0 (0.0%) |
| 20 to 24 Minutes | 0 (0.0%) | 0 (0.0%) |
| 25 to 29 Minutes | 0 (0.0%) | 0 (0.0%) |
| 30 to 34 Minutes | 0 (0.0%) | 46 (68.7%) |
| 35 to 39 Minutes | 0 (0.0%) | 0 (0.0%) |
| 40 to 44 Minutes | 0 (0.0%) | 0 (0.0%) |
| 45 to 59 Minutes | 24 (16.7%) | 13 (19.4%) |
| 60 to 89 Minutes | 106 (73.6%) | 8 (11.9%) |
| 90 or more Minutes | 6 (4.2%) | 0 (0.0%) |
Time of Departure to Work by Sex in Westcreek
The most frequent times of departure to work in Westcreek are 7:00 AM to 7:29 AM (64, 44.4%) for males and 7:30 AM to 7:59 AM (46, 68.7%) for females.
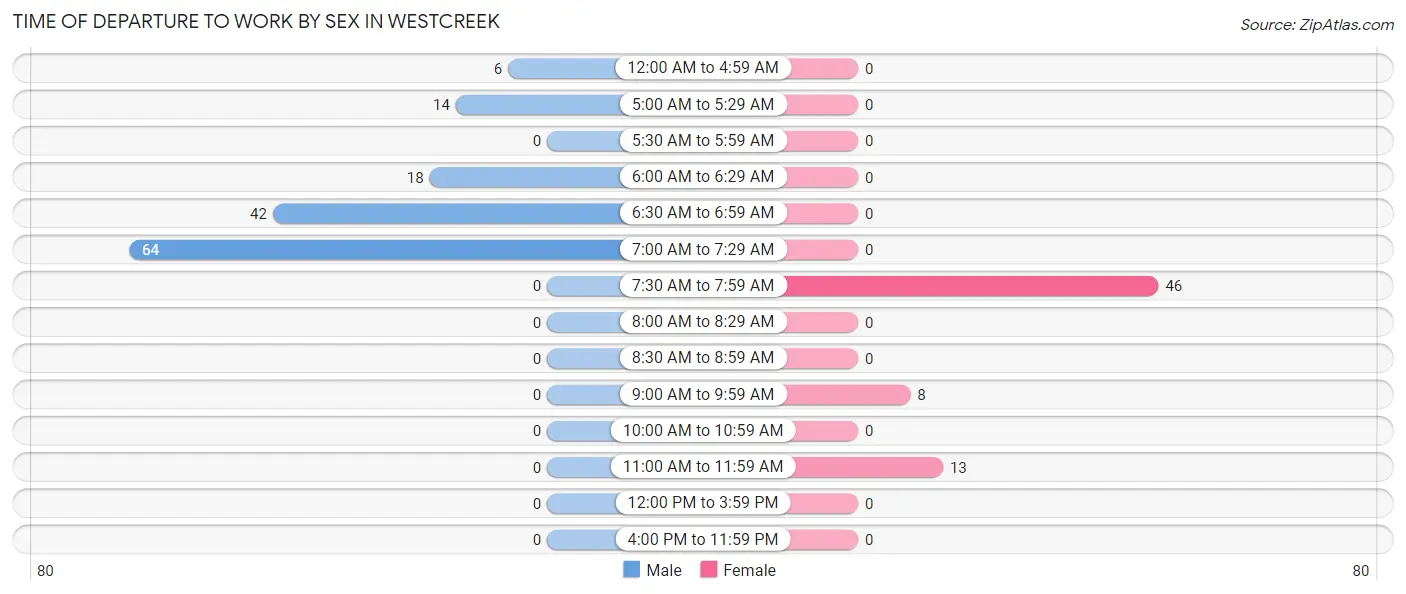
| Time of Departure | Male | Female |
| 12:00 AM to 4:59 AM | 6 (4.2%) | 0 (0.0%) |
| 5:00 AM to 5:29 AM | 14 (9.7%) | 0 (0.0%) |
| 5:30 AM to 5:59 AM | 0 (0.0%) | 0 (0.0%) |
| 6:00 AM to 6:29 AM | 18 (12.5%) | 0 (0.0%) |
| 6:30 AM to 6:59 AM | 42 (29.2%) | 0 (0.0%) |
| 7:00 AM to 7:29 AM | 64 (44.4%) | 0 (0.0%) |
| 7:30 AM to 7:59 AM | 0 (0.0%) | 46 (68.7%) |
| 8:00 AM to 8:29 AM | 0 (0.0%) | 0 (0.0%) |
| 8:30 AM to 8:59 AM | 0 (0.0%) | 0 (0.0%) |
| 9:00 AM to 9:59 AM | 0 (0.0%) | 8 (11.9%) |
| 10:00 AM to 10:59 AM | 0 (0.0%) | 0 (0.0%) |
| 11:00 AM to 11:59 AM | 0 (0.0%) | 13 (19.4%) |
| 12:00 PM to 3:59 PM | 0 (0.0%) | 0 (0.0%) |
| 4:00 PM to 11:59 PM | 0 (0.0%) | 0 (0.0%) |
| Total | 144 (100.0%) | 67 (100.0%) |
Housing Occupancy in Westcreek
Occupancy by Ownership in Westcreek
Of the total 97 dwellings in Westcreek, owner-occupied units account for 58 (59.8%), while renter-occupied units make up 39 (40.2%).
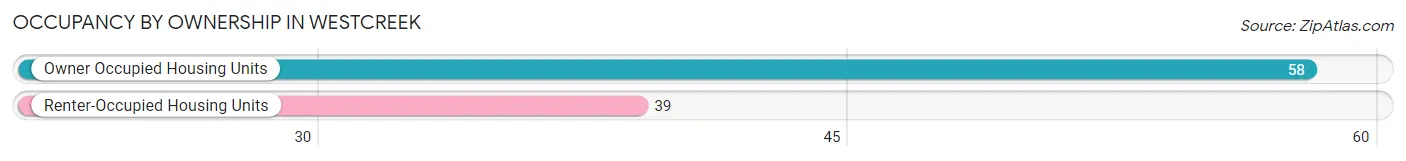
| Occupancy | # Housing Units | % Housing Units |
| Owner Occupied Housing Units | 58 | 59.8% |
| Renter-Occupied Housing Units | 39 | 40.2% |
| Total Occupied Housing Units | 97 | 100.0% |
Occupancy by Household Size in Westcreek
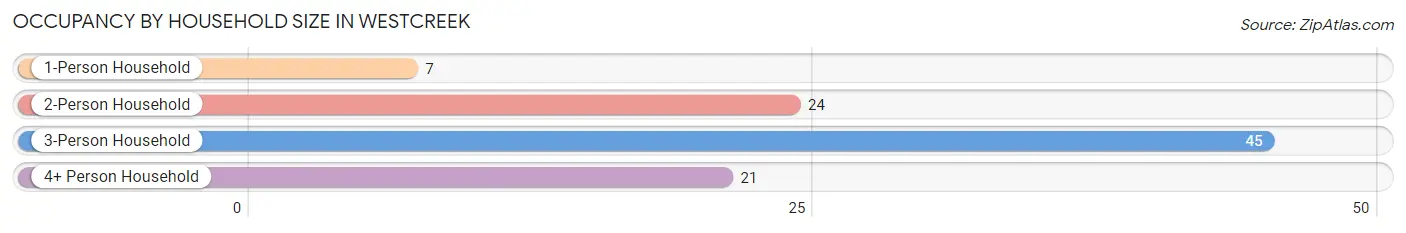
| Household Size | # Housing Units | % Housing Units |
| 1-Person Household | 7 | 7.2% |
| 2-Person Household | 24 | 24.7% |
| 3-Person Household | 45 | 46.4% |
| 4+ Person Household | 21 | 21.6% |
| Total Housing Units | 97 | 100.0% |
Occupancy by Ownership by Household Size in Westcreek
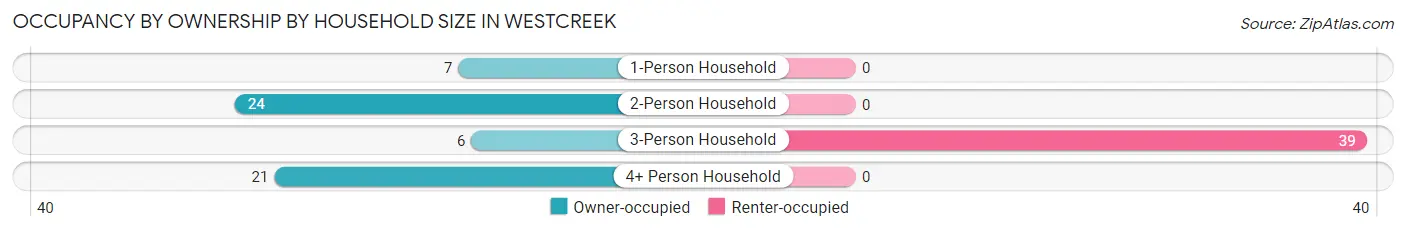
| Household Size | Owner-occupied | Renter-occupied |
| 1-Person Household | 7 (100.0%) | 0 (0.0%) |
| 2-Person Household | 24 (100.0%) | 0 (0.0%) |
| 3-Person Household | 6 (13.3%) | 39 (86.7%) |
| 4+ Person Household | 21 (100.0%) | 0 (0.0%) |
| Total Housing Units | 58 (59.8%) | 39 (40.2%) |
Occupancy by Educational Attainment in Westcreek
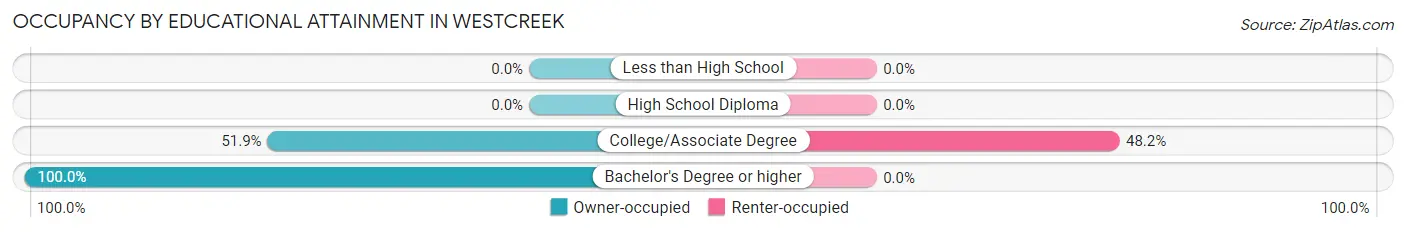
| Household Size | Owner-occupied | Renter-occupied |
| Less than High School | 0 (0.0%) | 0 (0.0%) |
| High School Diploma | 0 (0.0%) | 0 (0.0%) |
| College/Associate Degree | 42 (51.8%) | 39 (48.1%) |
| Bachelor's Degree or higher | 16 (100.0%) | 0 (0.0%) |
Occupancy by Age of Householder in Westcreek
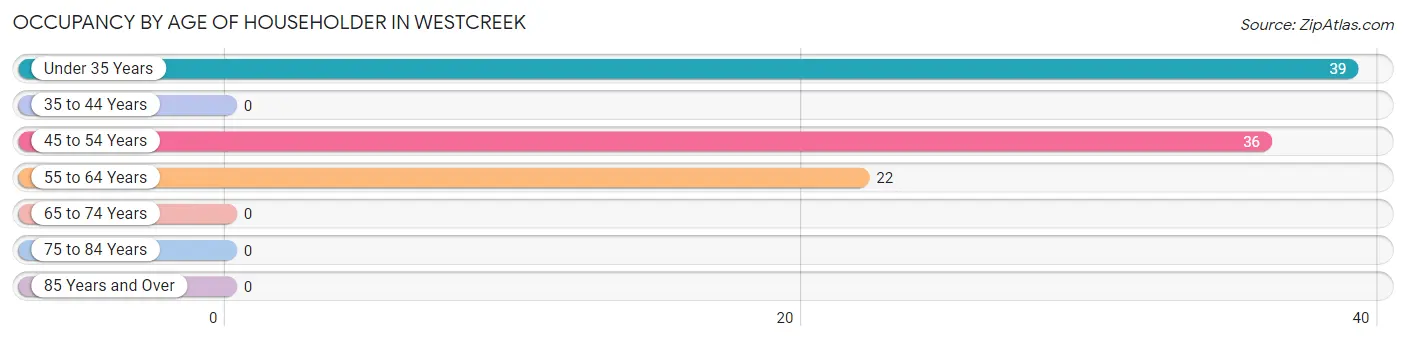
| Age Bracket | # Households | % Households |
| Under 35 Years | 39 | 40.2% |
| 35 to 44 Years | 0 | 0.0% |
| 45 to 54 Years | 36 | 37.1% |
| 55 to 64 Years | 22 | 22.7% |
| 65 to 74 Years | 0 | 0.0% |
| 75 to 84 Years | 0 | 0.0% |
| 85 Years and Over | 0 | 0.0% |
| Total | 97 | 100.0% |
Housing Finances in Westcreek
Median Income by Occupancy in Westcreek
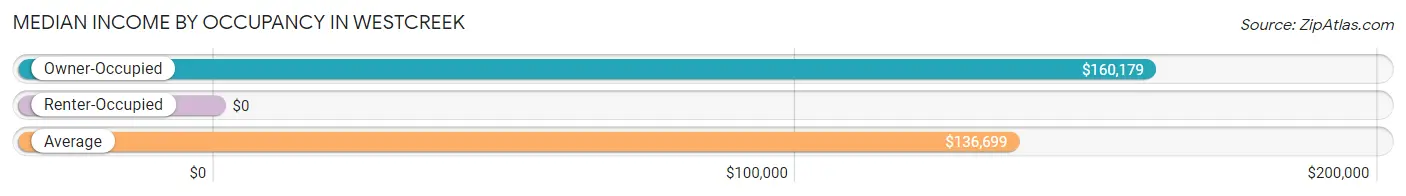
| Occupancy Type | # Households | Median Income |
| Owner-Occupied | 58 (59.8%) | $160,179 |
| Renter-Occupied | 39 (40.2%) | $0 |
| Average | 97 (100.0%) | $136,699 |
Occupancy by Householder Income Bracket in Westcreek
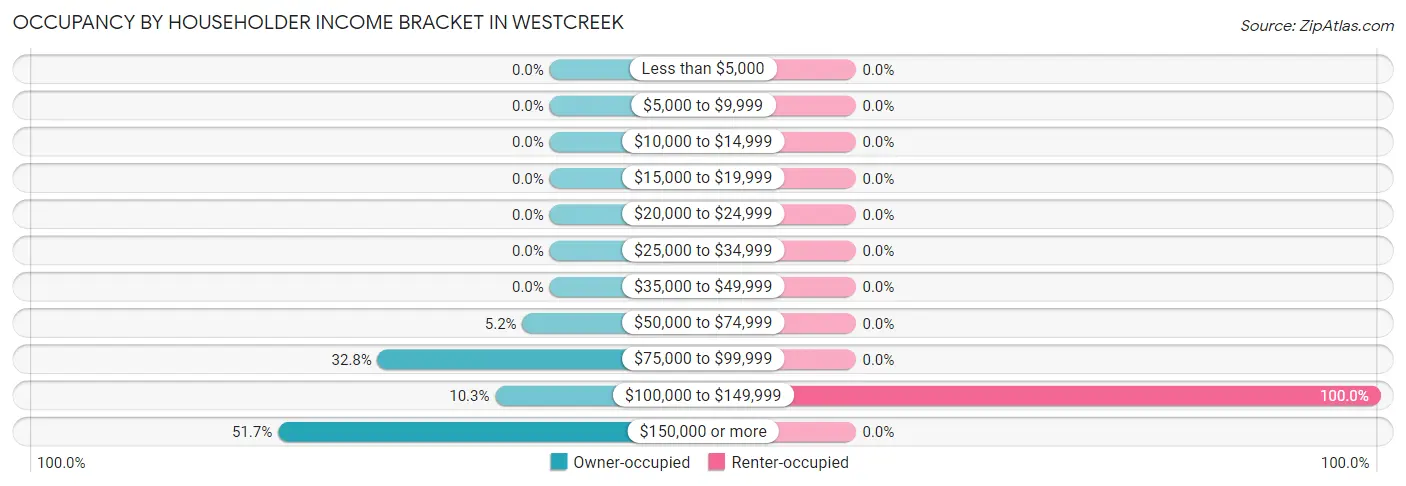
| Income Bracket | Owner-occupied | Renter-occupied |
| Less than $5,000 | 0 (0.0%) | 0 (0.0%) |
| $5,000 to $9,999 | 0 (0.0%) | 0 (0.0%) |
| $10,000 to $14,999 | 0 (0.0%) | 0 (0.0%) |
| $15,000 to $19,999 | 0 (0.0%) | 0 (0.0%) |
| $20,000 to $24,999 | 0 (0.0%) | 0 (0.0%) |
| $25,000 to $34,999 | 0 (0.0%) | 0 (0.0%) |
| $35,000 to $49,999 | 0 (0.0%) | 0 (0.0%) |
| $50,000 to $74,999 | 3 (5.2%) | 0 (0.0%) |
| $75,000 to $99,999 | 19 (32.8%) | 0 (0.0%) |
| $100,000 to $149,999 | 6 (10.3%) | 39 (100.0%) |
| $150,000 or more | 30 (51.7%) | 0 (0.0%) |
| Total | 58 (100.0%) | 39 (100.0%) |
Monthly Housing Cost Tiers in Westcreek
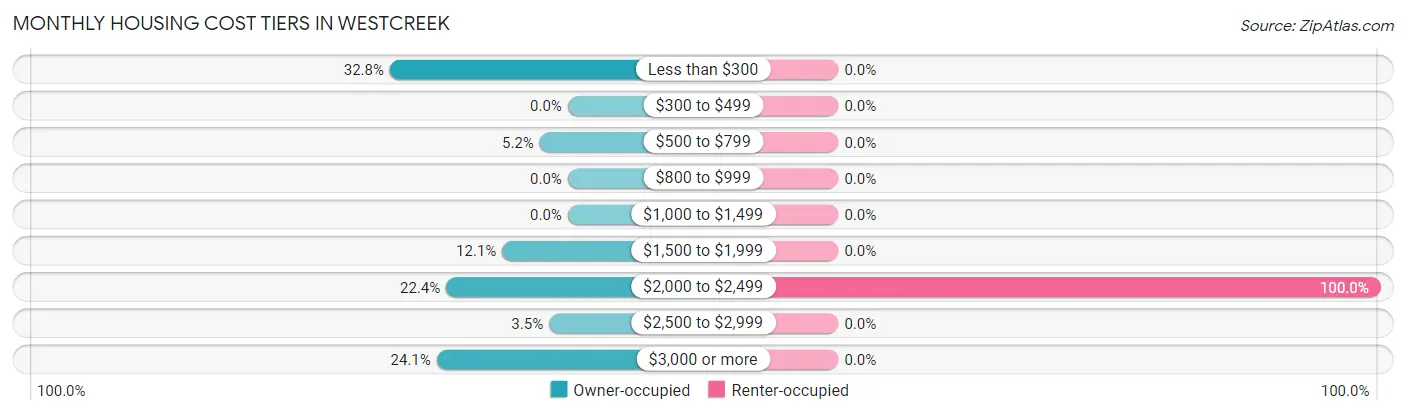
| Monthly Cost | Owner-occupied | Renter-occupied |
| Less than $300 | 19 (32.8%) | 0 (0.0%) |
| $300 to $499 | 0 (0.0%) | 0 (0.0%) |
| $500 to $799 | 3 (5.2%) | 0 (0.0%) |
| $800 to $999 | 0 (0.0%) | 0 (0.0%) |
| $1,000 to $1,499 | 0 (0.0%) | 0 (0.0%) |
| $1,500 to $1,999 | 7 (12.1%) | 0 (0.0%) |
| $2,000 to $2,499 | 13 (22.4%) | 39 (100.0%) |
| $2,500 to $2,999 | 2 (3.5%) | 0 (0.0%) |
| $3,000 or more | 14 (24.1%) | 0 (0.0%) |
| Total | 58 (100.0%) | 39 (100.0%) |
Physical Housing Characteristics in Westcreek
Housing Structures in Westcreek
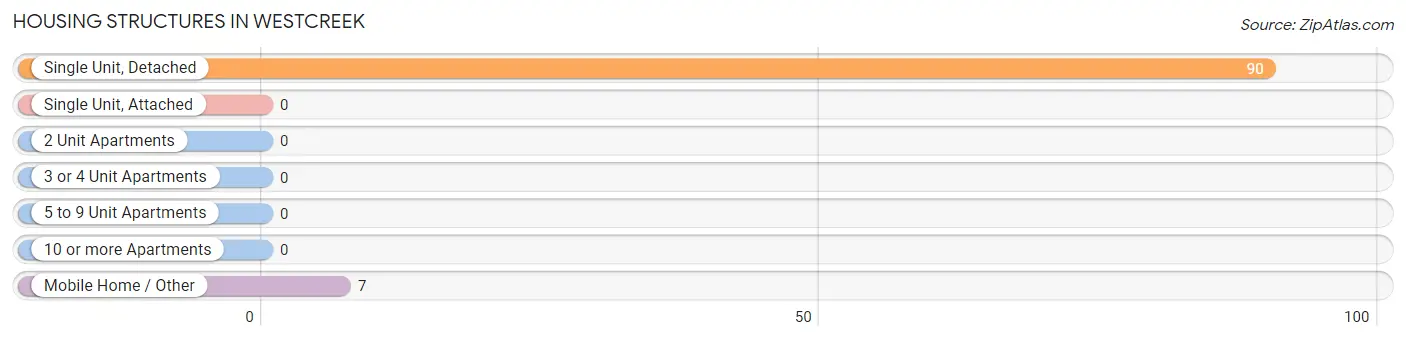
| Structure Type | # Housing Units | % Housing Units |
| Single Unit, Detached | 90 | 92.8% |
| Single Unit, Attached | 0 | 0.0% |
| 2 Unit Apartments | 0 | 0.0% |
| 3 or 4 Unit Apartments | 0 | 0.0% |
| 5 to 9 Unit Apartments | 0 | 0.0% |
| 10 or more Apartments | 0 | 0.0% |
| Mobile Home / Other | 7 | 7.2% |
| Total | 97 | 100.0% |
Housing Structures by Occupancy in Westcreek
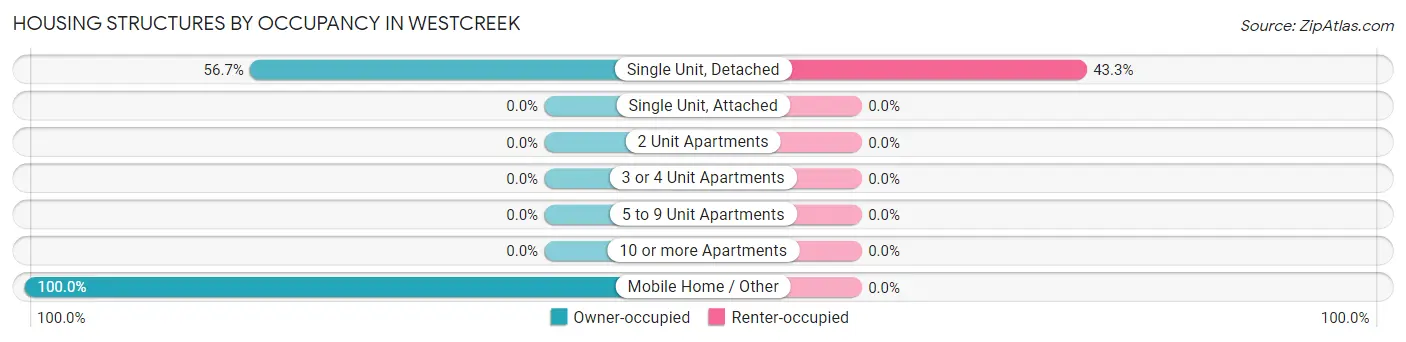
| Structure Type | Owner-occupied | Renter-occupied |
| Single Unit, Detached | 51 (56.7%) | 39 (43.3%) |
| Single Unit, Attached | 0 (0.0%) | 0 (0.0%) |
| 2 Unit Apartments | 0 (0.0%) | 0 (0.0%) |
| 3 or 4 Unit Apartments | 0 (0.0%) | 0 (0.0%) |
| 5 to 9 Unit Apartments | 0 (0.0%) | 0 (0.0%) |
| 10 or more Apartments | 0 (0.0%) | 0 (0.0%) |
| Mobile Home / Other | 7 (100.0%) | 0 (0.0%) |
| Total | 58 (59.8%) | 39 (40.2%) |
Housing Structures by Number of Rooms in Westcreek
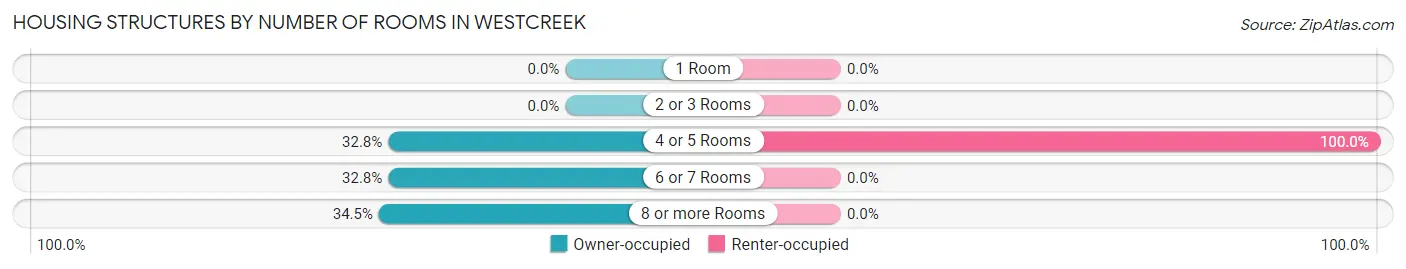
| Number of Rooms | Owner-occupied | Renter-occupied |
| 1 Room | 0 (0.0%) | 0 (0.0%) |
| 2 or 3 Rooms | 0 (0.0%) | 0 (0.0%) |
| 4 or 5 Rooms | 19 (32.8%) | 39 (100.0%) |
| 6 or 7 Rooms | 19 (32.8%) | 0 (0.0%) |
| 8 or more Rooms | 20 (34.5%) | 0 (0.0%) |
| Total | 58 (100.0%) | 39 (100.0%) |
Housing Structure by Heating Type in Westcreek
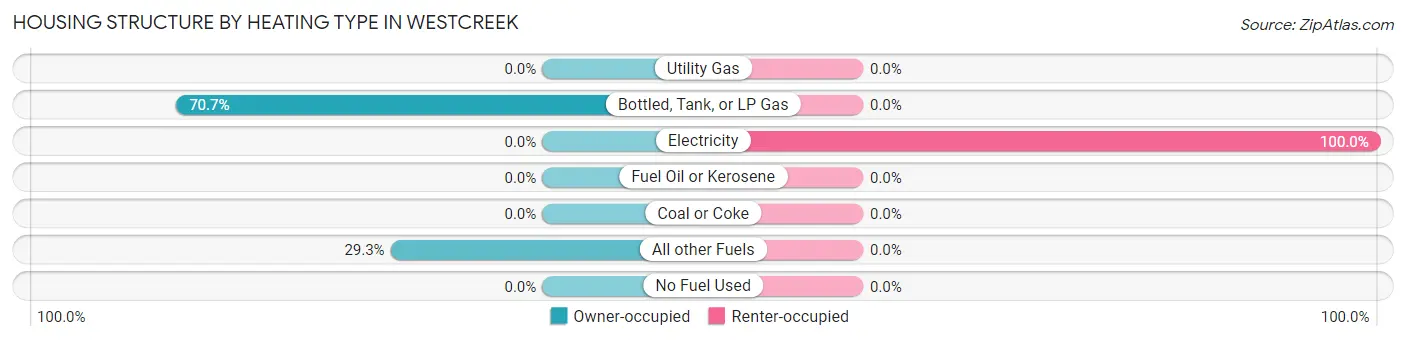
| Heating Type | Owner-occupied | Renter-occupied |
| Utility Gas | 0 (0.0%) | 0 (0.0%) |
| Bottled, Tank, or LP Gas | 41 (70.7%) | 0 (0.0%) |
| Electricity | 0 (0.0%) | 39 (100.0%) |
| Fuel Oil or Kerosene | 0 (0.0%) | 0 (0.0%) |
| Coal or Coke | 0 (0.0%) | 0 (0.0%) |
| All other Fuels | 17 (29.3%) | 0 (0.0%) |
| No Fuel Used | 0 (0.0%) | 0 (0.0%) |
| Total | 58 (100.0%) | 39 (100.0%) |
Household Vehicle Usage in Westcreek
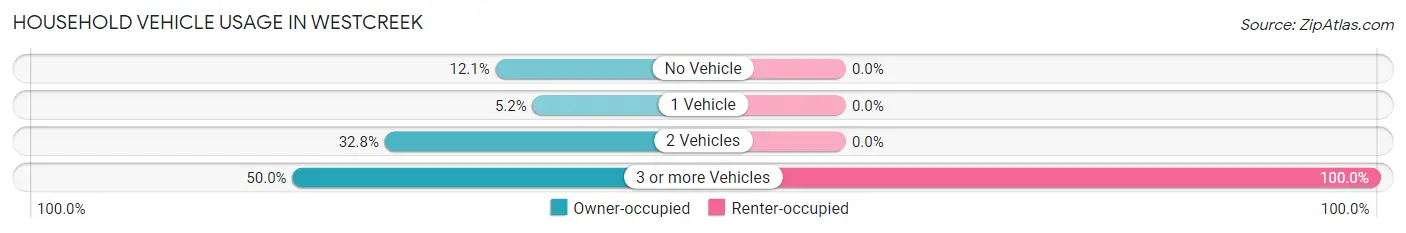
| Vehicles per Household | Owner-occupied | Renter-occupied |
| No Vehicle | 7 (12.1%) | 0 (0.0%) |
| 1 Vehicle | 3 (5.2%) | 0 (0.0%) |
| 2 Vehicles | 19 (32.8%) | 0 (0.0%) |
| 3 or more Vehicles | 29 (50.0%) | 39 (100.0%) |
| Total | 58 (100.0%) | 39 (100.0%) |
Real Estate & Mortgages in Westcreek
Real Estate and Mortgage Overview in Westcreek
| Characteristic | Without Mortgage | With Mortgage |
| Housing Units | 3 | 55 |
| Median Property Value | - | - |
| Median Household Income | - | - |
| Monthly Housing Costs | - | - |
| Real Estate Taxes | - | - |
Property Value by Mortgage Status in Westcreek
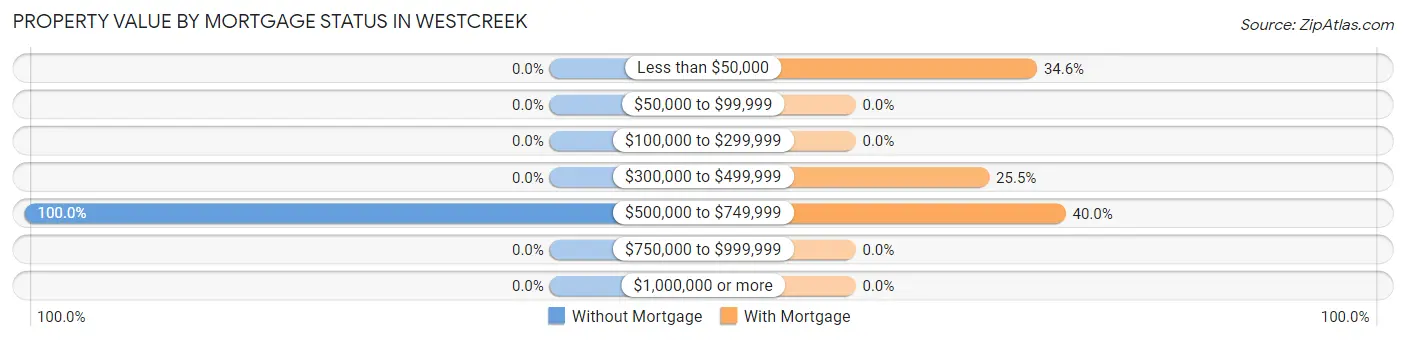
| Property Value | Without Mortgage | With Mortgage |
| Less than $50,000 | 0 (0.0%) | 19 (34.5%) |
| $50,000 to $99,999 | 0 (0.0%) | 0 (0.0%) |
| $100,000 to $299,999 | 0 (0.0%) | 0 (0.0%) |
| $300,000 to $499,999 | 0 (0.0%) | 14 (25.5%) |
| $500,000 to $749,999 | 3 (100.0%) | 22 (40.0%) |
| $750,000 to $999,999 | 0 (0.0%) | 0 (0.0%) |
| $1,000,000 or more | 0 (0.0%) | 0 (0.0%) |
| Total | 3 (100.0%) | 55 (100.0%) |
Household Income by Mortgage Status in Westcreek
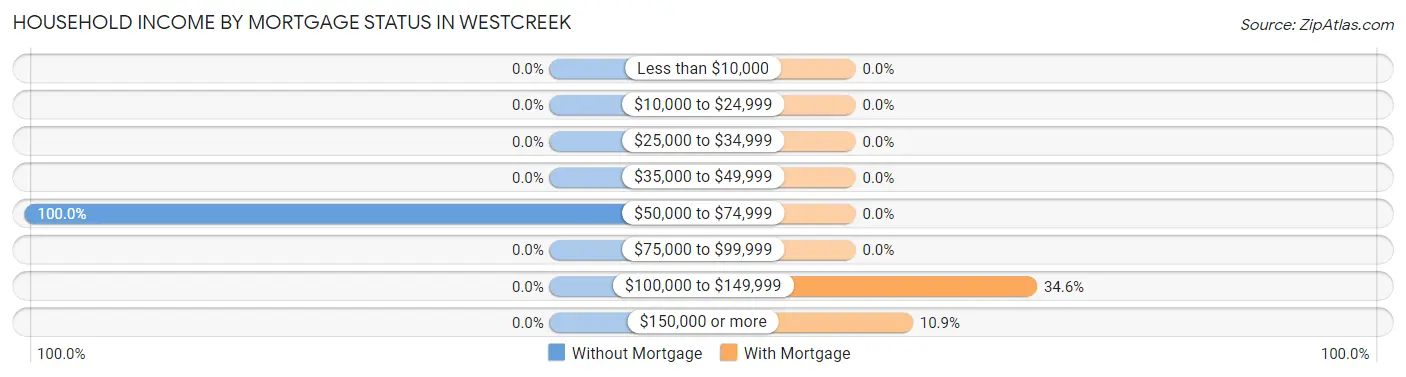
| Household Income | Without Mortgage | With Mortgage |
| Less than $10,000 | 0 (0.0%) | 0 (0.0%) |
| $10,000 to $24,999 | 0 (0.0%) | 0 (0.0%) |
| $25,000 to $34,999 | 0 (0.0%) | 0 (0.0%) |
| $35,000 to $49,999 | 0 (0.0%) | 0 (0.0%) |
| $50,000 to $74,999 | 3 (100.0%) | 0 (0.0%) |
| $75,000 to $99,999 | 0 (0.0%) | 0 (0.0%) |
| $100,000 to $149,999 | 0 (0.0%) | 19 (34.5%) |
| $150,000 or more | 0 (0.0%) | 6 (10.9%) |
| Total | 3 (100.0%) | 55 (100.0%) |
Property Value to Household Income Ratio in Westcreek
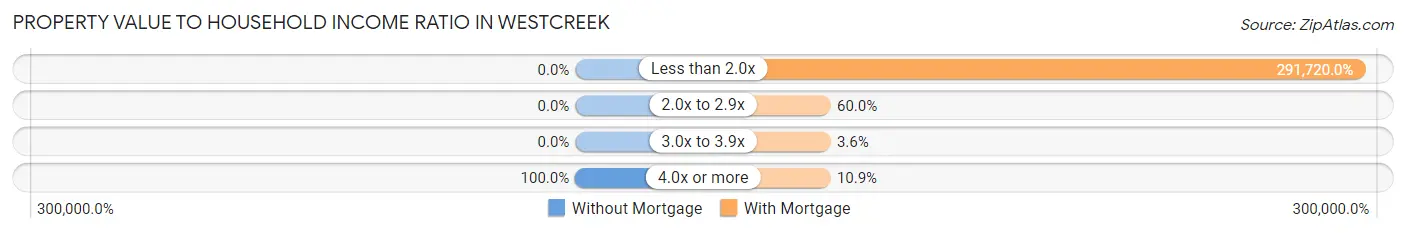
| Value-to-Income Ratio | Without Mortgage | With Mortgage |
| Less than 2.0x | 0 (0.0%) | 160,446 (291,720.0%) |
| 2.0x to 2.9x | 0 (0.0%) | 33 (60.0%) |
| 3.0x to 3.9x | 0 (0.0%) | 2 (3.6%) |
| 4.0x or more | 3 (100.0%) | 6 (10.9%) |
| Total | 3 (100.0%) | 55 (100.0%) |
Real Estate Taxes by Mortgage Status in Westcreek
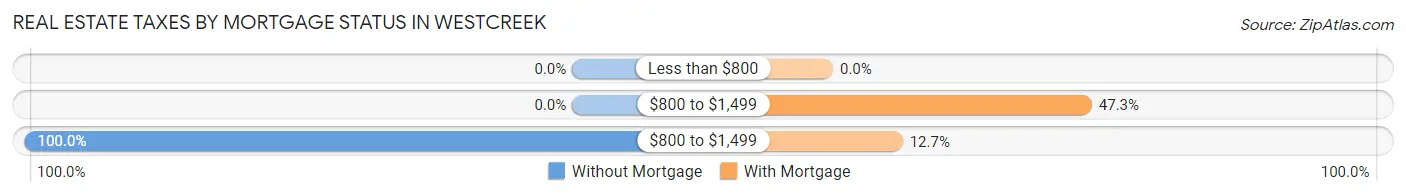
| Property Taxes | Without Mortgage | With Mortgage |
| Less than $800 | 0 (0.0%) | 0 (0.0%) |
| $800 to $1,499 | 0 (0.0%) | 26 (47.3%) |
| $800 to $1,499 | 3 (100.0%) | 7 (12.7%) |
| Total | 3 (100.0%) | 55 (100.0%) |
Health & Disability in Westcreek
Health Insurance Coverage by Age in Westcreek
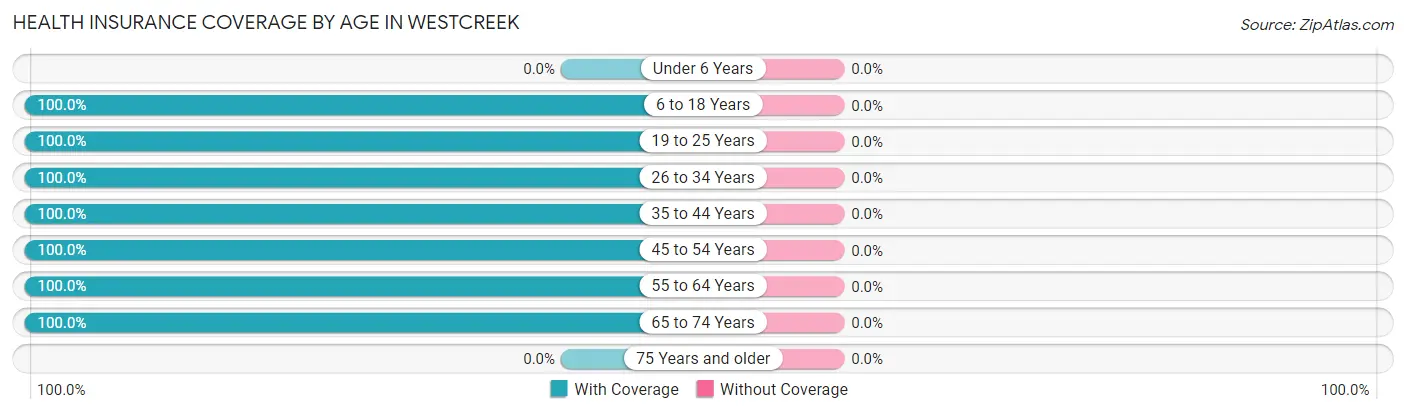
| Age Bracket | With Coverage | Without Coverage |
| Under 6 Years | 0 (0.0%) | 0 (0.0%) |
| 6 to 18 Years | 45 (100.0%) | 0 (0.0%) |
| 19 to 25 Years | 18 (100.0%) | 0 (0.0%) |
| 26 to 34 Years | 79 (100.0%) | 0 (0.0%) |
| 35 to 44 Years | 48 (100.0%) | 0 (0.0%) |
| 45 to 54 Years | 66 (100.0%) | 0 (0.0%) |
| 55 to 64 Years | 22 (100.0%) | 0 (0.0%) |
| 65 to 74 Years | 3 (100.0%) | 0 (0.0%) |
| 75 Years and older | 0 (0.0%) | 0 (0.0%) |
| Total | 281 (100.0%) | 0 (0.0%) |
Health Insurance Coverage by Citizenship Status in Westcreek
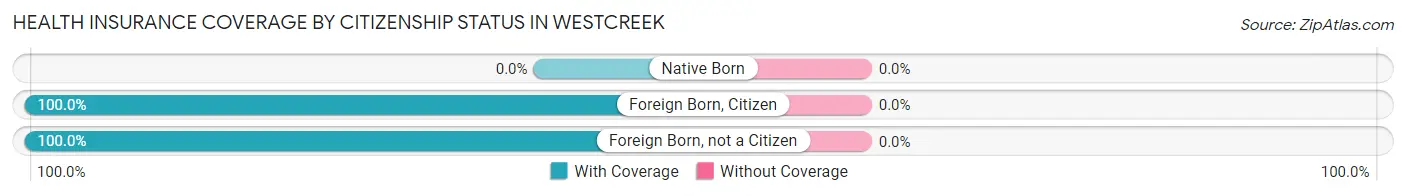
| Citizenship Status | With Coverage | Without Coverage |
| Native Born | 0 (0.0%) | 0 (0.0%) |
| Foreign Born, Citizen | 45 (100.0%) | 0 (0.0%) |
| Foreign Born, not a Citizen | 18 (100.0%) | 0 (0.0%) |
Health Insurance Coverage by Household Income in Westcreek
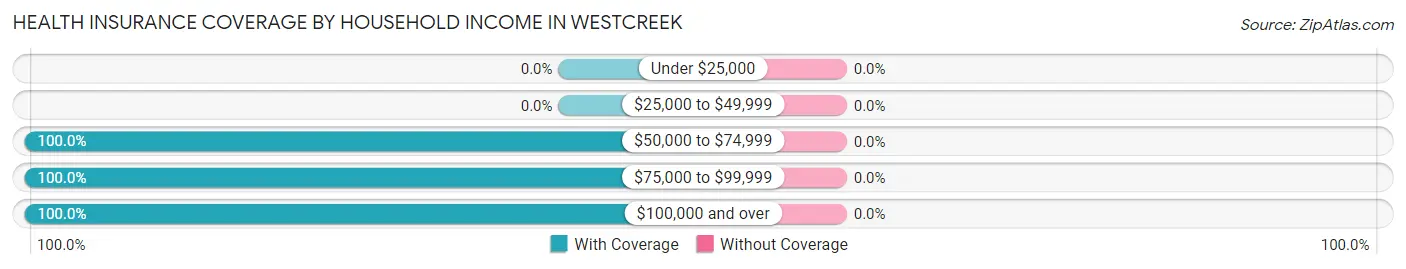
| Household Income | With Coverage | Without Coverage |
| Under $25,000 | 0 (0.0%) | 0 (0.0%) |
| $25,000 to $49,999 | 0 (0.0%) | 0 (0.0%) |
| $50,000 to $74,999 | 6 (100.0%) | 0 (0.0%) |
| $75,000 to $99,999 | 25 (100.0%) | 0 (0.0%) |
| $100,000 and over | 250 (100.0%) | 0 (0.0%) |
Public vs Private Health Insurance Coverage by Age in Westcreek
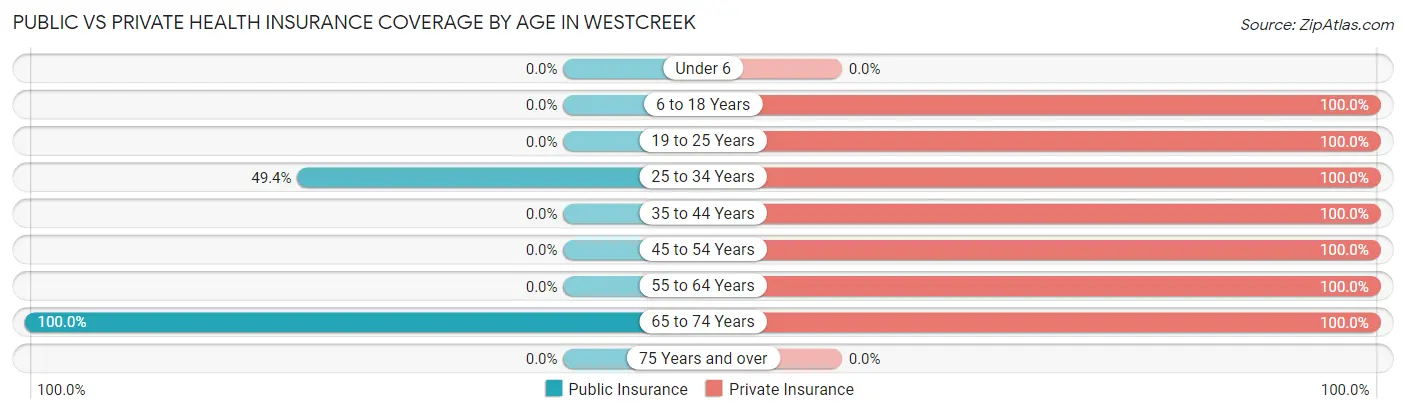
| Age Bracket | Public Insurance | Private Insurance |
| Under 6 | 0 (0.0%) | 0 (0.0%) |
| 6 to 18 Years | 0 (0.0%) | 45 (100.0%) |
| 19 to 25 Years | 0 (0.0%) | 18 (100.0%) |
| 25 to 34 Years | 39 (49.4%) | 79 (100.0%) |
| 35 to 44 Years | 0 (0.0%) | 48 (100.0%) |
| 45 to 54 Years | 0 (0.0%) | 66 (100.0%) |
| 55 to 64 Years | 0 (0.0%) | 22 (100.0%) |
| 65 to 74 Years | 3 (100.0%) | 3 (100.0%) |
| 75 Years and over | 0 (0.0%) | 0 (0.0%) |
| Total | 42 (14.9%) | 281 (100.0%) |
Disability Status by Sex by Age in Westcreek
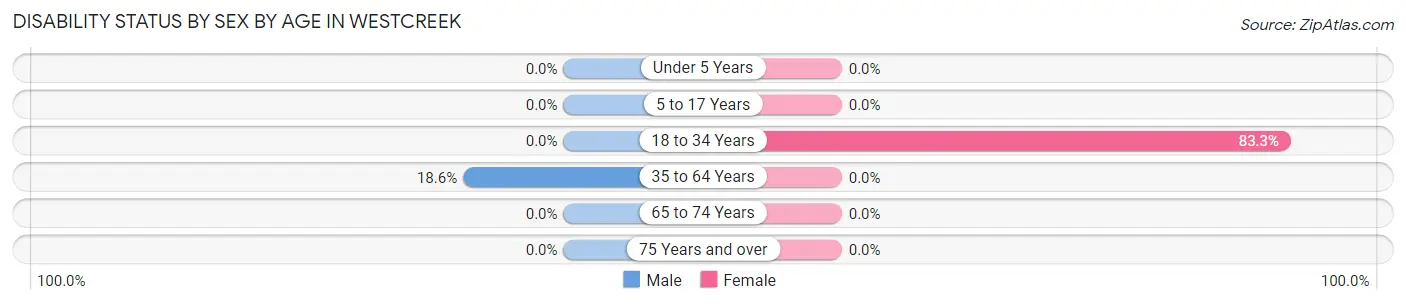
| Age Bracket | Male | Female |
| Under 5 Years | 0 (0.0%) | 0 (0.0%) |
| 5 to 17 Years | 0 (0.0%) | 0 (0.0%) |
| 18 to 34 Years | 0 (0.0%) | 40 (83.3%) |
| 35 to 64 Years | 19 (18.6%) | 0 (0.0%) |
| 65 to 74 Years | 0 (0.0%) | 0 (0.0%) |
| 75 Years and over | 0 (0.0%) | 0 (0.0%) |
Disability Class by Sex by Age in Westcreek
Disability Class: Hearing Difficulty
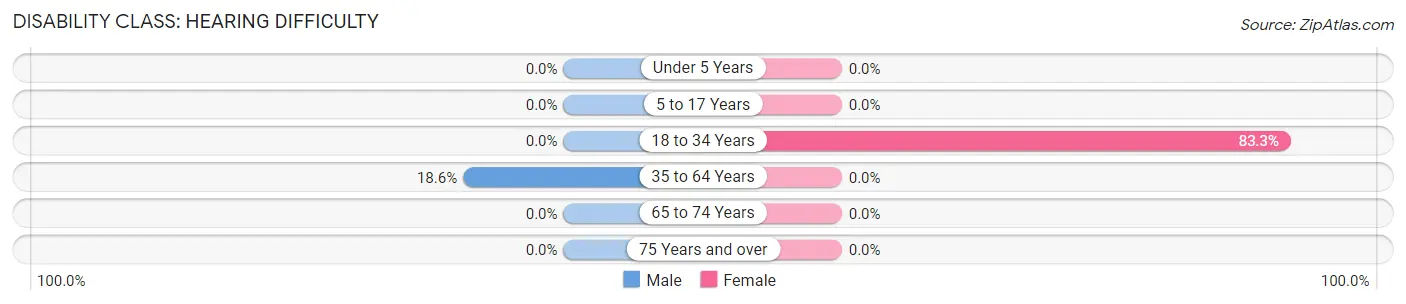
| Age Bracket | Male | Female |
| Under 5 Years | 0 (0.0%) | 0 (0.0%) |
| 5 to 17 Years | 0 (0.0%) | 0 (0.0%) |
| 18 to 34 Years | 0 (0.0%) | 40 (83.3%) |
| 35 to 64 Years | 19 (18.6%) | 0 (0.0%) |
| 65 to 74 Years | 0 (0.0%) | 0 (0.0%) |
| 75 Years and over | 0 (0.0%) | 0 (0.0%) |
Disability Class: Vision Difficulty
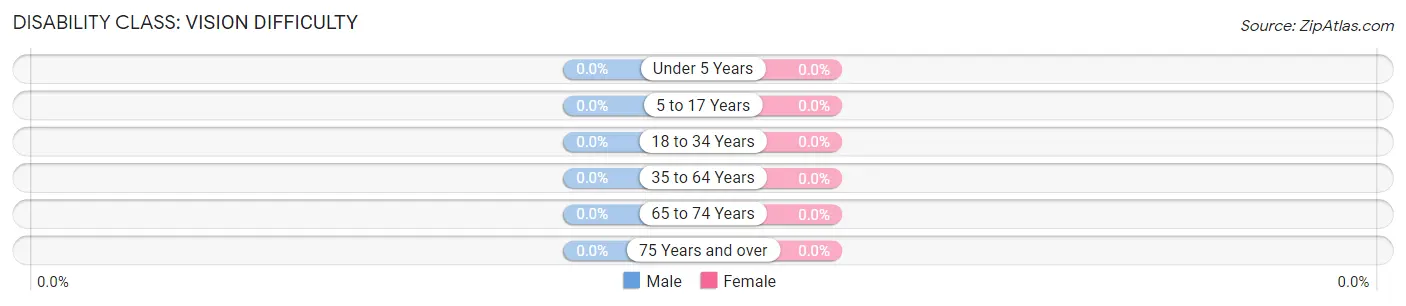
| Age Bracket | Male | Female |
| Under 5 Years | 0 (0.0%) | 0 (0.0%) |
| 5 to 17 Years | 0 (0.0%) | 0 (0.0%) |
| 18 to 34 Years | 0 (0.0%) | 0 (0.0%) |
| 35 to 64 Years | 0 (0.0%) | 0 (0.0%) |
| 65 to 74 Years | 0 (0.0%) | 0 (0.0%) |
| 75 Years and over | 0 (0.0%) | 0 (0.0%) |
Disability Class: Cognitive Difficulty
| Age Bracket | Male | Female |
| 5 to 17 Years | 0 (0.0%) | 0 (0.0%) |
| 18 to 34 Years | 0 (0.0%) | 0 (0.0%) |
| 35 to 64 Years | 0 (0.0%) | 0 (0.0%) |
| 65 to 74 Years | 0 (0.0%) | 0 (0.0%) |
| 75 Years and over | 0 (0.0%) | 0 (0.0%) |
Disability Class: Ambulatory Difficulty
| Age Bracket | Male | Female |
| 5 to 17 Years | 0 (0.0%) | 0 (0.0%) |
| 18 to 34 Years | 0 (0.0%) | 0 (0.0%) |
| 35 to 64 Years | 0 (0.0%) | 0 (0.0%) |
| 65 to 74 Years | 0 (0.0%) | 0 (0.0%) |
| 75 Years and over | 0 (0.0%) | 0 (0.0%) |
Disability Class: Self-Care Difficulty
| Age Bracket | Male | Female |
| 5 to 17 Years | 0 (0.0%) | 0 (0.0%) |
| 18 to 34 Years | 0 (0.0%) | 0 (0.0%) |
| 35 to 64 Years | 0 (0.0%) | 0 (0.0%) |
| 65 to 74 Years | 0 (0.0%) | 0 (0.0%) |
| 75 Years and over | 0 (0.0%) | 0 (0.0%) |
Technology Access in Westcreek
Computing Device Access in Westcreek
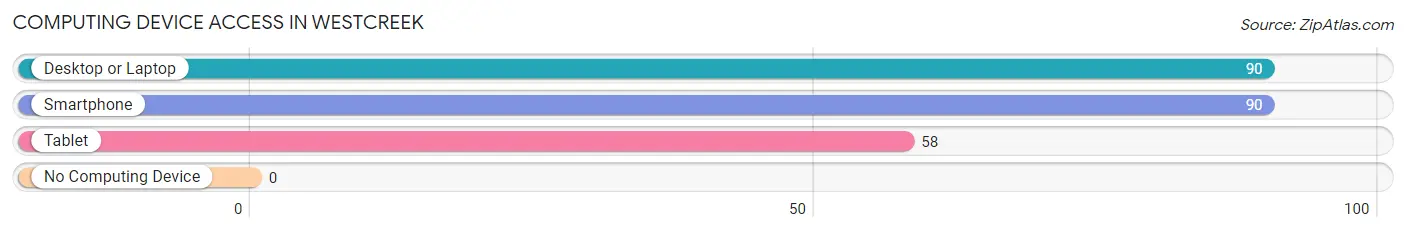
| Device Type | # Households | % Households |
| Desktop or Laptop | 90 | 92.8% |
| Smartphone | 90 | 92.8% |
| Tablet | 58 | 59.8% |
| No Computing Device | 0 | 0.0% |
| Total | 97 | 100.0% |
Internet Access in Westcreek
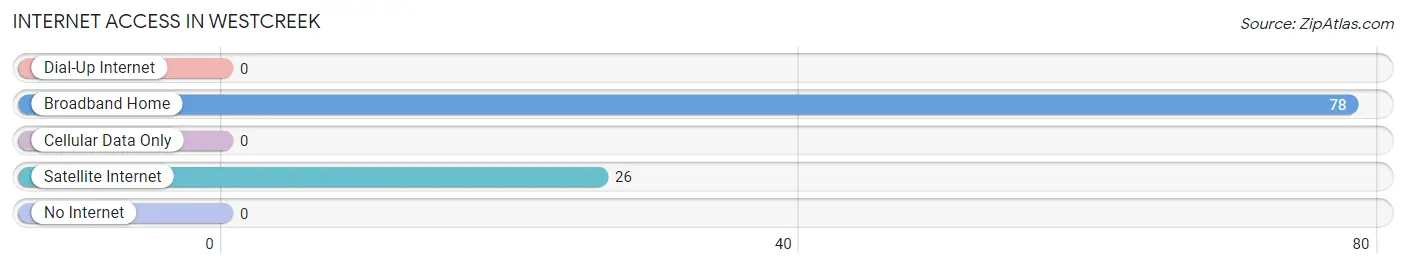
| Internet Type | # Households | % Households |
| Dial-Up Internet | 0 | 0.0% |
| Broadband Home | 78 | 80.4% |
| Cellular Data Only | 0 | 0.0% |
| Satellite Internet | 26 | 26.8% |
| No Internet | 0 | 0.0% |
| Total | 97 | 100.0% |
Westcreek Summary
Westcreek, Colorado is a small unincorporated community located in the foothills of the Rocky Mountains in Park County. It is situated at an elevation of 8,400 feet and is surrounded by the Pike National Forest. The town was founded in 1876 by a group of settlers who were looking for a place to settle and raise their families.
History
Westcreek was founded in 1876 by a group of settlers who were looking for a place to settle and raise their families. The town was named after the creek that runs through it, which was named after the West family who were among the first settlers. The town was originally a mining town, with the first mine being established in 1877. The mine was a gold mine, and it was very successful for a few years. However, the gold eventually ran out and the mine closed in 1883.
The town then shifted its focus to ranching and farming, and the population began to grow. In the early 1900s, the town was home to a number of businesses, including a general store, a blacksmith, a saloon, and a post office. The town also had a school, which was built in 1910.
Geography
Westcreek is located in the foothills of the Rocky Mountains in Park County, Colorado. It is situated at an elevation of 8,400 feet and is surrounded by the Pike National Forest. The town is located on the banks of the West Creek, which is a tributary of the South Platte River. The town is located about 25 miles west of Colorado Springs and about 50 miles south of Denver.
The town is located in a mountainous region, and the terrain is mostly hilly and forested. The climate is generally mild, with cold winters and warm summers. The average annual temperature is around 50 degrees Fahrenheit.
Economy
Westcreek’s economy is largely based on tourism and ranching. The town is a popular destination for outdoor enthusiasts, as it is surrounded by the Pike National Forest and is close to several ski resorts. The town also has a number of guest ranches, which offer visitors the opportunity to experience the western lifestyle.
Ranching is also an important part of the local economy. The town is home to several cattle ranches, which raise beef cattle for sale. The town also has a number of horse ranches, which offer horseback riding and other equestrian activities.
Demographics
As of the 2010 census, the population of Westcreek was 545. The racial makeup of the town was 97.3% White, 0.2% African American, 0.2% Native American, 0.4% Asian, 0.2% from other races, and 1.9% from two or more races. Hispanic or Latino of any race were 1.3% of the population.
The median household income in Westcreek was $45,833, and the median family income was $50,000. The per capita income for the town was $20,845. About 8.3% of families and 10.3% of the population were below the poverty line, including 11.3% of those under age 18 and 8.3% of those age 65 or over.
Common Questions
What is Per Capita Income in Westcreek?
Per Capita income in Westcreek is $51,460.
What is the Median Family Income in Westcreek?
Median Family Income in Westcreek is $103,974.
What is the Median Household income in Westcreek?
Median Household Income in Westcreek is $136,699.
What is Income or Wage Gap in Westcreek?
Income or Wage Gap in Westcreek is 29.9%.
Women in Westcreek earn 70.1 cents for every dollar earned by a man.
What is Inequality or Gini Index in Westcreek?
Inequality or Gini Index in Westcreek is 0.18.
What is the Total Population of Westcreek?
Total Population of Westcreek is 281.
What is the Total Male Population of Westcreek?
Total Male Population of Westcreek is 189.
What is the Total Female Population of Westcreek?
Total Female Population of Westcreek is 92.
What is the Ratio of Males per 100 Females in Westcreek?
There are 205.43 Males per 100 Females in Westcreek.
What is the Ratio of Females per 100 Males in Westcreek?
There are 48.68 Females per 100 Males in Westcreek.
What is the Median Population Age in Westcreek?
Median Population Age in Westcreek is 34.0 Years.
What is the Average Family Size in Westcreek
Average Family Size in Westcreek is 2.6 People.
What is the Average Household Size in Westcreek
Average Household Size in Westcreek is 2.9 People.
How Large is the Labor Force in Westcreek?
There are 233 People in the Labor Forcein in Westcreek.
What is the Percentage of People in the Labor Force in Westcreek?
91.4% of People are in the Labor Force in Westcreek.