Del Norte, CO Map & Demographics
Del Norte Map
Del Norte Overview
$28,956
PER CAPITA INCOME
$54,559
AVG FAMILY INCOME
$40,756
AVG HOUSEHOLD INCOME
5.4%
WAGE / INCOME GAP [ % ]
94.6¢/ $1
WAGE / INCOME GAP [ $ ]
0.42
INEQUALITY / GINI INDEX
1,808
TOTAL POPULATION
1,039
MALE POPULATION
769
FEMALE POPULATION
135.11
MALES / 100 FEMALES
74.01
FEMALES / 100 MALES
43.8
MEDIAN AGE
3.2
AVG FAMILY SIZE
1.9
AVG HOUSEHOLD SIZE
858
LABOR FORCE [ PEOPLE ]
59.9%
PERCENT IN LABOR FORCE
7.7%
UNEMPLOYMENT RATE
Del Norte Zip Codes
Del Norte Area Codes
Income in Del Norte
Income Overview in Del Norte
Per Capita Income in Del Norte is $28,956, while median incomes of families and households are $54,559 and $40,756 respectively.
| Characteristic | Number | Measure |
| Per Capita Income | 1,808 | $28,956 |
| Median Family Income | 348 | $54,559 |
| Mean Family Income | 348 | $83,786 |
| Median Household Income | 900 | $40,756 |
| Mean Household Income | 900 | $55,962 |
| Income Deficit | 348 | $0 |
| Wage / Income Gap (%) | 1,808 | 5.42% |
| Wage / Income Gap ($) | 1,808 | 94.58¢ per $1 |
| Gini / Inequality Index | 1,808 | 0.42 |
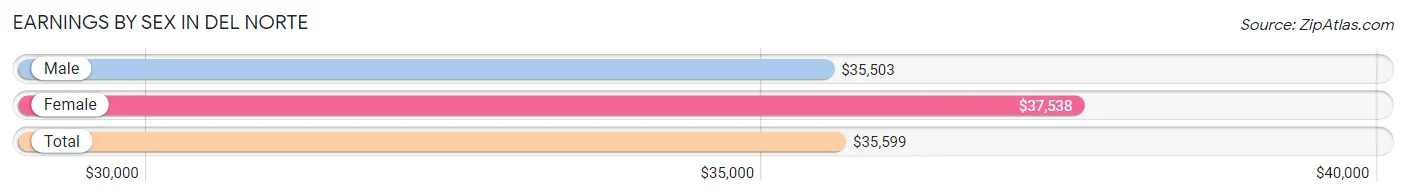
Earnings by Sex in Del Norte
Average Earnings in Del Norte are $35,599, $35,503 for men and $37,538 for women, a difference of 5.4%.
| Sex | Number | Average Earnings |
| Male | 611 (65.1%) | $35,503 |
| Female | 327 (34.9%) | $37,538 |
| Total | 938 (100.0%) | $35,599 |
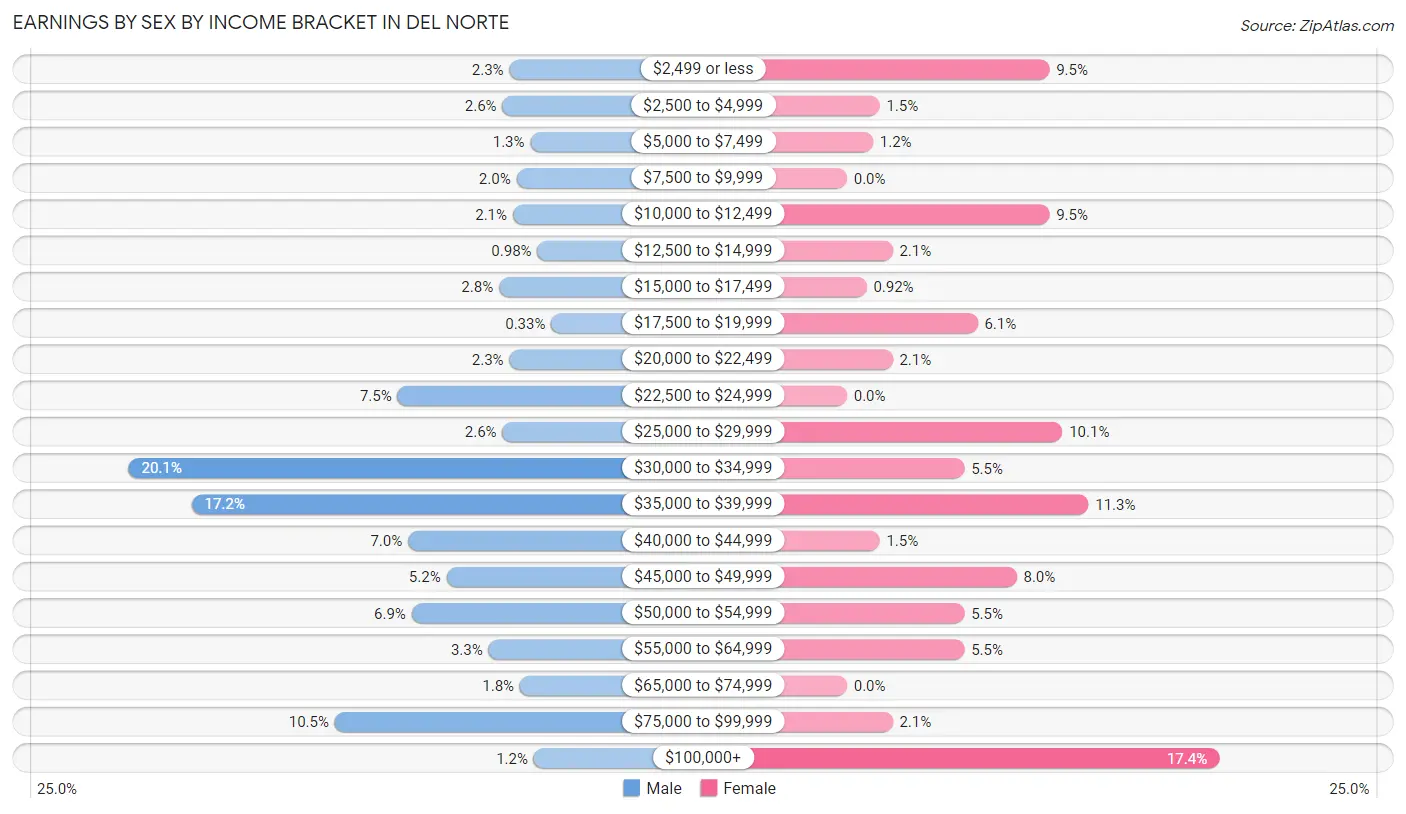
Earnings by Sex by Income Bracket in Del Norte
The most common earnings brackets in Del Norte are $30,000 to $34,999 for men (123 | 20.1%) and $100,000+ for women (57 | 17.4%).
| Income | Male | Female |
| $2,499 or less | 14 (2.3%) | 31 (9.5%) |
| $2,500 to $4,999 | 16 (2.6%) | 5 (1.5%) |
| $5,000 to $7,499 | 8 (1.3%) | 4 (1.2%) |
| $7,500 to $9,999 | 12 (2.0%) | 0 (0.0%) |
| $10,000 to $12,499 | 13 (2.1%) | 31 (9.5%) |
| $12,500 to $14,999 | 6 (1.0%) | 7 (2.1%) |
| $15,000 to $17,499 | 17 (2.8%) | 3 (0.9%) |
| $17,500 to $19,999 | 2 (0.3%) | 20 (6.1%) |
| $20,000 to $22,499 | 14 (2.3%) | 7 (2.1%) |
| $22,500 to $24,999 | 46 (7.5%) | 0 (0.0%) |
| $25,000 to $29,999 | 16 (2.6%) | 33 (10.1%) |
| $30,000 to $34,999 | 123 (20.1%) | 18 (5.5%) |
| $35,000 to $39,999 | 105 (17.2%) | 37 (11.3%) |
| $40,000 to $44,999 | 43 (7.0%) | 5 (1.5%) |
| $45,000 to $49,999 | 32 (5.2%) | 26 (8.0%) |
| $50,000 to $54,999 | 42 (6.9%) | 18 (5.5%) |
| $55,000 to $64,999 | 20 (3.3%) | 18 (5.5%) |
| $65,000 to $74,999 | 11 (1.8%) | 0 (0.0%) |
| $75,000 to $99,999 | 64 (10.5%) | 7 (2.1%) |
| $100,000+ | 7 (1.1%) | 57 (17.4%) |
| Total | 611 (100.0%) | 327 (100.0%) |
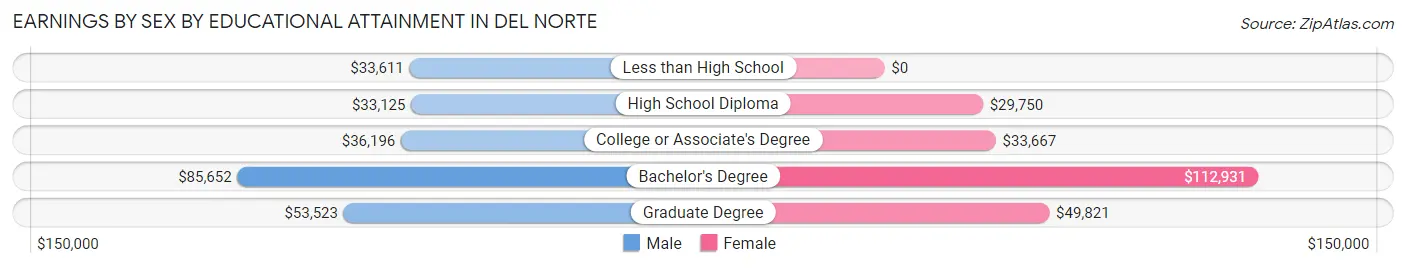
Earnings by Sex by Educational Attainment in Del Norte
Average earnings in Del Norte are $36,182 for men and $39,583 for women, a difference of 8.6%. Men with an educational attainment of bachelor's degree enjoy the highest average annual earnings of $85,652, while those with high school diploma education earn the least with $33,125. Women with an educational attainment of bachelor's degree earn the most with the average annual earnings of $112,931, while those with high school diploma education have the smallest earnings of $29,750.
| Educational Attainment | Male Income | Female Income |
| Less than High School | $33,611 | $0 |
| High School Diploma | $33,125 | $29,750 |
| College or Associate's Degree | $36,196 | $33,667 |
| Bachelor's Degree | $85,652 | $112,931 |
| Graduate Degree | $53,523 | $49,821 |
| Total | $36,182 | $39,583 |
Family Income in Del Norte
Family Income Brackets in Del Norte
According to the Del Norte family income data, there are 90 families falling into the $35,000 to $49,999 income range, which is the most common income bracket and makes up 25.9% of all families. Conversely, the less than $10,000 income bracket is the least frequent group with only 6 families (1.7%) belonging to this category.
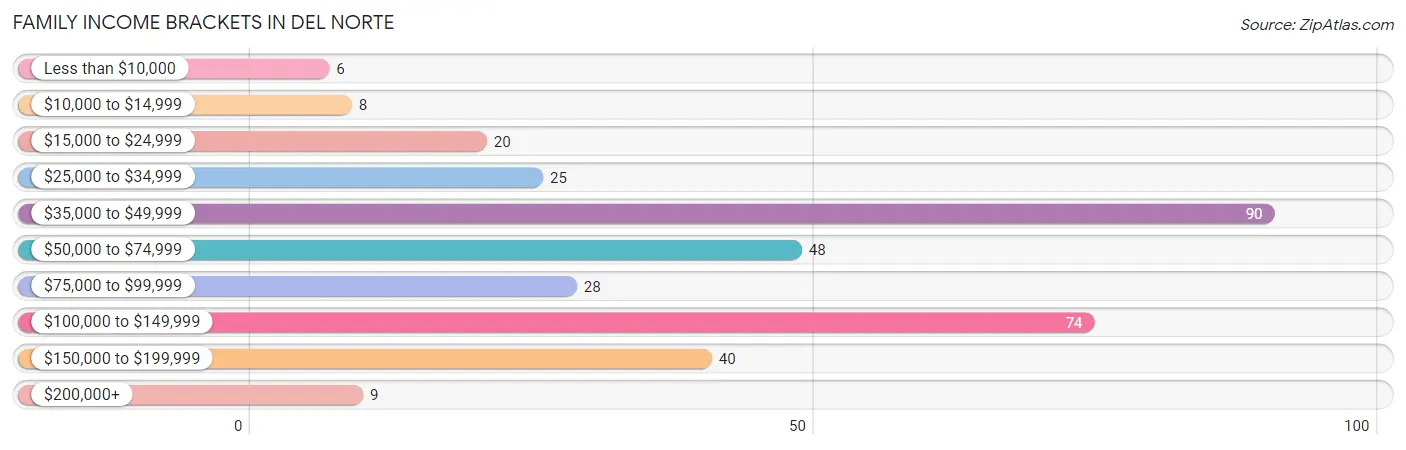
| Income Bracket | # Families | % Families |
| Less than $10,000 | 6 | 1.7% |
| $10,000 to $14,999 | 8 | 2.3% |
| $15,000 to $24,999 | 20 | 5.7% |
| $25,000 to $34,999 | 25 | 7.2% |
| $35,000 to $49,999 | 90 | 25.9% |
| $50,000 to $74,999 | 48 | 13.8% |
| $75,000 to $99,999 | 28 | 8.0% |
| $100,000 to $149,999 | 74 | 21.3% |
| $150,000 to $199,999 | 40 | 11.5% |
| $200,000+ | 9 | 2.6% |
Family Income by Famaliy Size in Del Norte
5-person families (33 | 9.5%) account for the highest median family income in Del Norte with $120,515 per family, while 3-person families (52 | 14.9%) have the highest median income of $35,833 per family member.
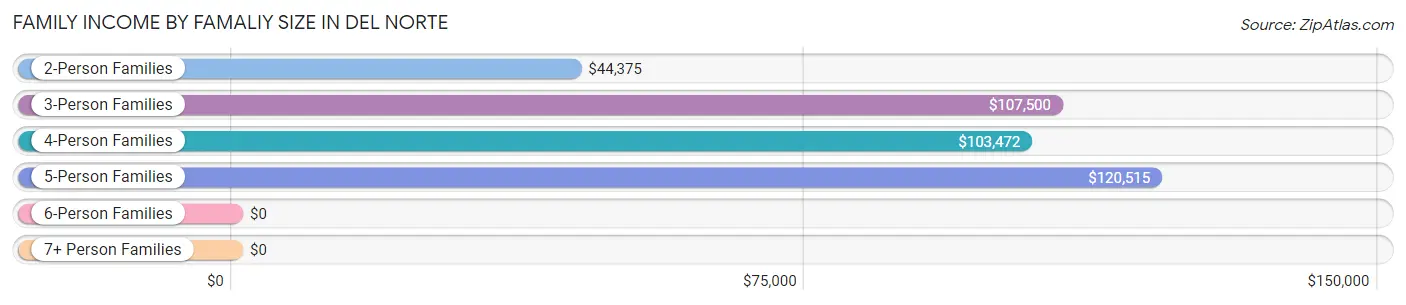
| Income Bracket | # Families | Median Income |
| 2-Person Families | 160 (46.0%) | $44,375 |
| 3-Person Families | 52 (14.9%) | $107,500 |
| 4-Person Families | 103 (29.6%) | $103,472 |
| 5-Person Families | 33 (9.5%) | $120,515 |
| 6-Person Families | 0 (0.0%) | $0 |
| 7+ Person Families | 0 (0.0%) | $0 |
| Total | 348 (100.0%) | $54,559 |
Family Income by Number of Earners in Del Norte
The median family income in Del Norte is $54,559, with families comprising 3+ earners (17) having the highest median family income of $139,583, while families with no earners (49) have the lowest median family income of $38,021, accounting for 4.9% and 14.1% of families, respectively.
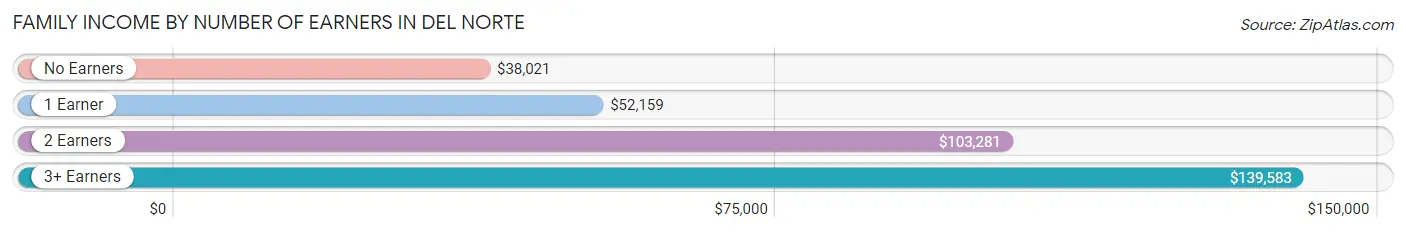
| Number of Earners | # Families | Median Income |
| No Earners | 49 (14.1%) | $38,021 |
| 1 Earner | 141 (40.5%) | $52,159 |
| 2 Earners | 141 (40.5%) | $103,281 |
| 3+ Earners | 17 (4.9%) | $139,583 |
| Total | 348 (100.0%) | $54,559 |
Household Income in Del Norte
Household Income Brackets in Del Norte
With 256 households falling in the category, the $35,000 to $49,999 income range is the most frequent in Del Norte, accounting for 28.4% of all households. In contrast, only 9 households (1.0%) fall into the $200,000+ income bracket, making it the least populous group.
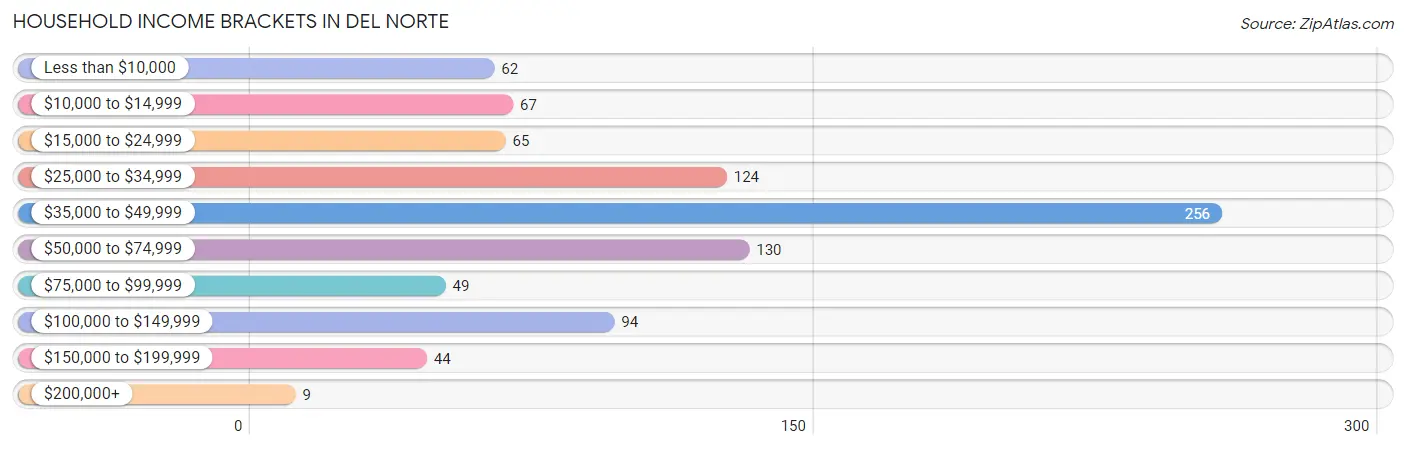
| Income Bracket | # Households | % Households |
| Less than $10,000 | 62 | 6.9% |
| $10,000 to $14,999 | 67 | 7.4% |
| $15,000 to $24,999 | 65 | 7.2% |
| $25,000 to $34,999 | 124 | 13.8% |
| $35,000 to $49,999 | 256 | 28.4% |
| $50,000 to $74,999 | 130 | 14.4% |
| $75,000 to $99,999 | 49 | 5.4% |
| $100,000 to $149,999 | 94 | 10.4% |
| $150,000 to $199,999 | 44 | 4.9% |
| $200,000+ | 9 | 1.0% |
Household Income by Householder Age in Del Norte
The median household income in Del Norte is $40,756, with the highest median household income of $36,882 found in the 65+ years age bracket for the primary householder. A total of 355 households (39.4%) fall into this category. Meanwhile, the 15 to 24 years age bracket for the primary householder has the lowest median household income of $0, with 23 households (2.6%) in this group.
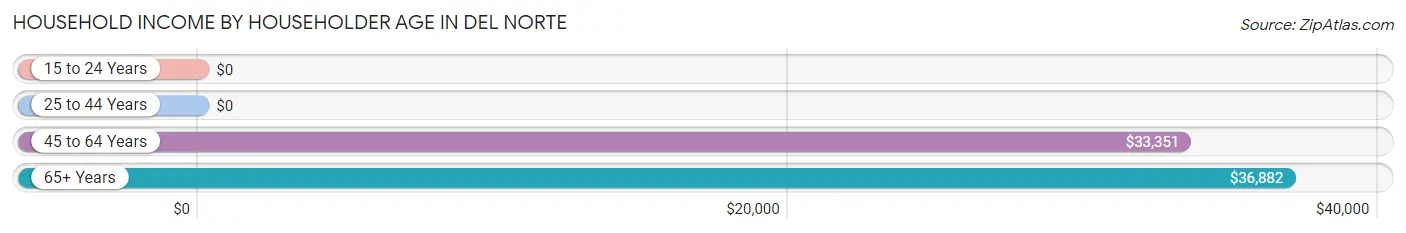
| Income Bracket | # Households | Median Income |
| 15 to 24 Years | 23 (2.6%) | $0 |
| 25 to 44 Years | 219 (24.3%) | $0 |
| 45 to 64 Years | 303 (33.7%) | $33,351 |
| 65+ Years | 355 (39.4%) | $36,882 |
| Total | 900 (100.0%) | $40,756 |
Poverty in Del Norte
Income Below Poverty by Sex and Age in Del Norte
With 7.7% poverty level for males and 12.0% for females among the residents of Del Norte, 55 to 64 year old males and 55 to 64 year old females are the most vulnerable to poverty, with 54 males (42.5%) and 33 females (34.7%) in their respective age groups living below the poverty level.
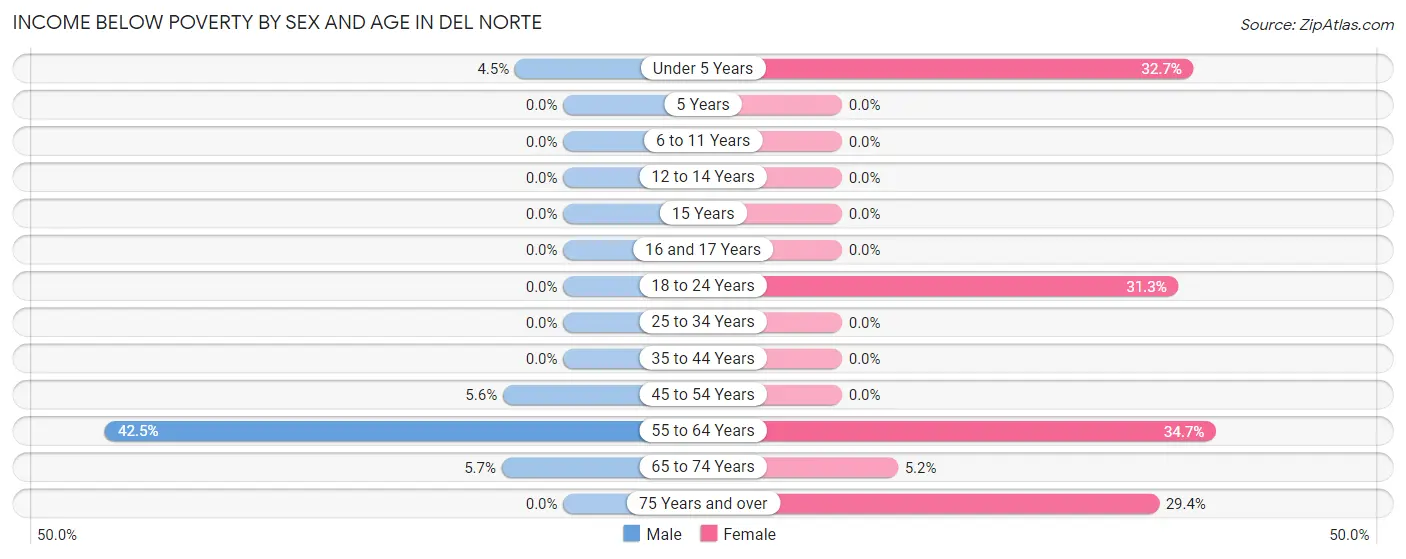
| Age Bracket | Male | Female |
| Under 5 Years | 3 (4.5%) | 16 (32.7%) |
| 5 Years | 0 (0.0%) | 0 (0.0%) |
| 6 to 11 Years | 0 (0.0%) | 0 (0.0%) |
| 12 to 14 Years | 0 (0.0%) | 0 (0.0%) |
| 15 Years | 0 (0.0%) | 0 (0.0%) |
| 16 and 17 Years | 0 (0.0%) | 0 (0.0%) |
| 18 to 24 Years | 0 (0.0%) | 15 (31.2%) |
| 25 to 34 Years | 0 (0.0%) | 0 (0.0%) |
| 35 to 44 Years | 0 (0.0%) | 0 (0.0%) |
| 45 to 54 Years | 7 (5.6%) | 0 (0.0%) |
| 55 to 64 Years | 54 (42.5%) | 33 (34.7%) |
| 65 to 74 Years | 12 (5.7%) | 7 (5.2%) |
| 75 Years and over | 0 (0.0%) | 20 (29.4%) |
| Total | 76 (7.7%) | 91 (12.0%) |
Income Above Poverty by Sex and Age in Del Norte
According to the poverty statistics in Del Norte, males aged 6 to 11 years and females aged 6 to 11 years are the age groups that are most secure financially, with 100.0% of males and 100.0% of females in these age groups living above the poverty line.
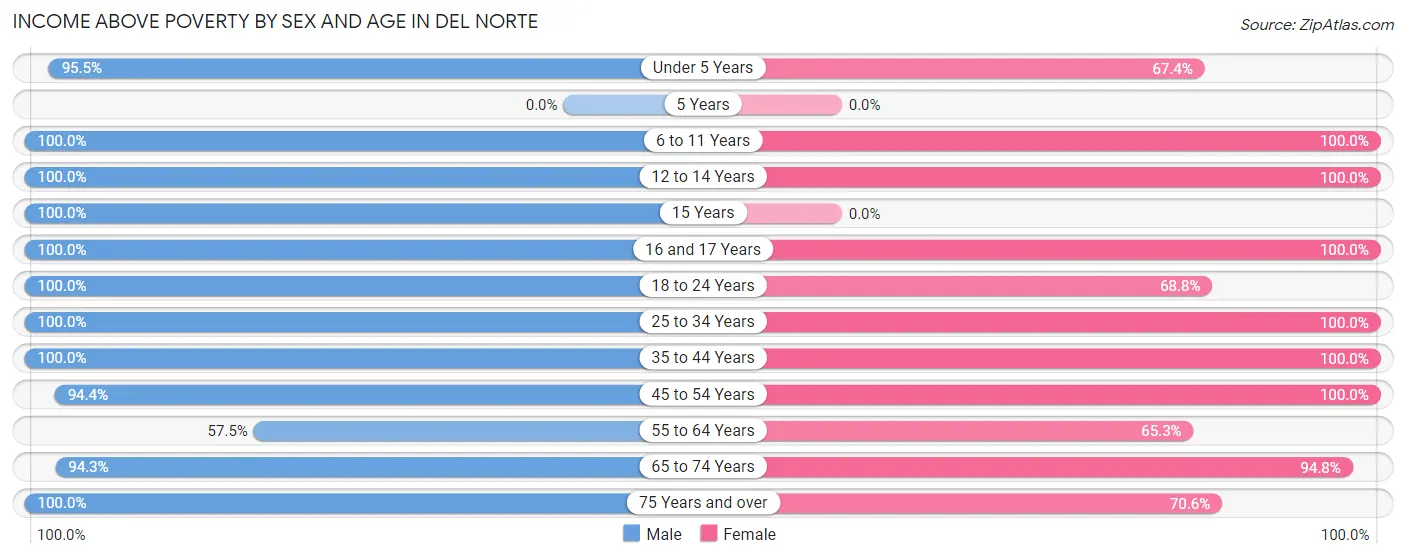
| Age Bracket | Male | Female |
| Under 5 Years | 64 (95.5%) | 33 (67.3%) |
| 5 Years | 0 (0.0%) | 0 (0.0%) |
| 6 to 11 Years | 72 (100.0%) | 46 (100.0%) |
| 12 to 14 Years | 82 (100.0%) | 51 (100.0%) |
| 15 Years | 3 (100.0%) | 0 (0.0%) |
| 16 and 17 Years | 5 (100.0%) | 30 (100.0%) |
| 18 to 24 Years | 38 (100.0%) | 33 (68.8%) |
| 25 to 34 Years | 49 (100.0%) | 62 (100.0%) |
| 35 to 44 Years | 184 (100.0%) | 121 (100.0%) |
| 45 to 54 Years | 118 (94.4%) | 54 (100.0%) |
| 55 to 64 Years | 73 (57.5%) | 62 (65.3%) |
| 65 to 74 Years | 198 (94.3%) | 128 (94.8%) |
| 75 Years and over | 24 (100.0%) | 48 (70.6%) |
| Total | 910 (92.3%) | 668 (88.0%) |
Income Below Poverty Among Married-Couple Families in Del Norte
The poverty statistics for married-couple families in Del Norte show that 2.2% or 5 of the total 229 families live below the poverty line. Families with no children have the highest poverty rate of 4.9%, comprising of 5 families. On the other hand, families with 1 or 2 children have the lowest poverty rate of 0.0%, which includes 0 families.
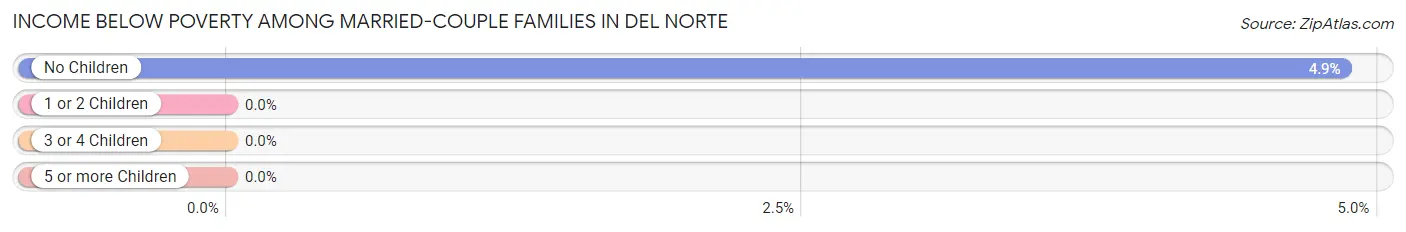
| Children | Above Poverty | Below Poverty |
| No Children | 98 (95.2%) | 5 (4.9%) |
| 1 or 2 Children | 93 (100.0%) | 0 (0.0%) |
| 3 or 4 Children | 33 (100.0%) | 0 (0.0%) |
| 5 or more Children | 0 (0.0%) | 0 (0.0%) |
| Total | 224 (97.8%) | 5 (2.2%) |
Income Below Poverty Among Single-Parent Households in Del Norte
According to the poverty data in Del Norte, 18.2% or 6 single-father households and 15.1% or 13 single-mother households are living below the poverty line. Among single-father households, those with 1 or 2 children have the highest poverty rate, with 6 households (21.4%) experiencing poverty. Likewise, among single-mother households, those with 1 or 2 children have the highest poverty rate, with 9 households (16.4%) falling below the poverty line.
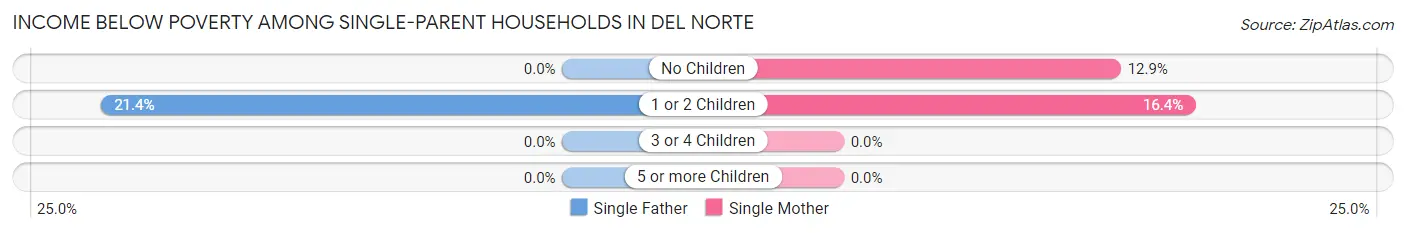
| Children | Single Father | Single Mother |
| No Children | 0 (0.0%) | 4 (12.9%) |
| 1 or 2 Children | 6 (21.4%) | 9 (16.4%) |
| 3 or 4 Children | 0 (0.0%) | 0 (0.0%) |
| 5 or more Children | 0 (0.0%) | 0 (0.0%) |
| Total | 6 (18.2%) | 13 (15.1%) |
Income Below Poverty Among Married-Couple vs Single-Parent Households in Del Norte
The poverty data for Del Norte shows that 5 of the married-couple family households (2.2%) and 19 of the single-parent households (16.0%) are living below the poverty level. Within the married-couple family households, those with no children have the highest poverty rate, with 5 households (4.9%) falling below the poverty line. Among the single-parent households, those with 1 or 2 children have the highest poverty rate, with 15 household (18.1%) living below poverty.
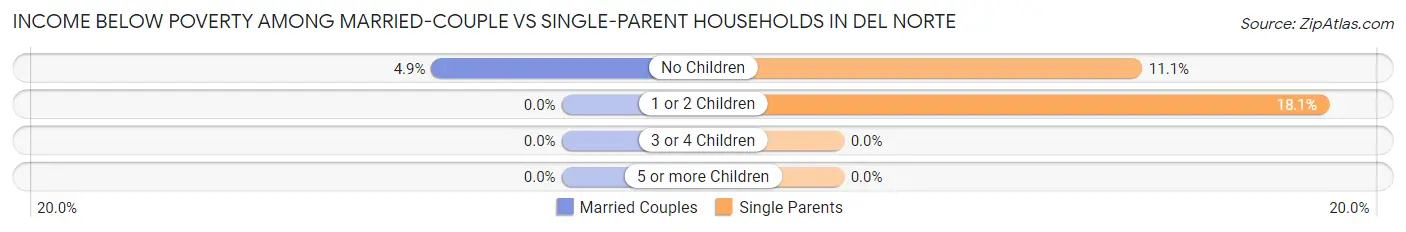
| Children | Married-Couple Families | Single-Parent Households |
| No Children | 5 (4.9%) | 4 (11.1%) |
| 1 or 2 Children | 0 (0.0%) | 15 (18.1%) |
| 3 or 4 Children | 0 (0.0%) | 0 (0.0%) |
| 5 or more Children | 0 (0.0%) | 0 (0.0%) |
| Total | 5 (2.2%) | 19 (16.0%) |
Race in Del Norte
The most populous races in Del Norte are White / Caucasian (1,444 | 79.9%), Hispanic or Latino (800 | 44.3%), and Two or more Races (216 | 11.9%).
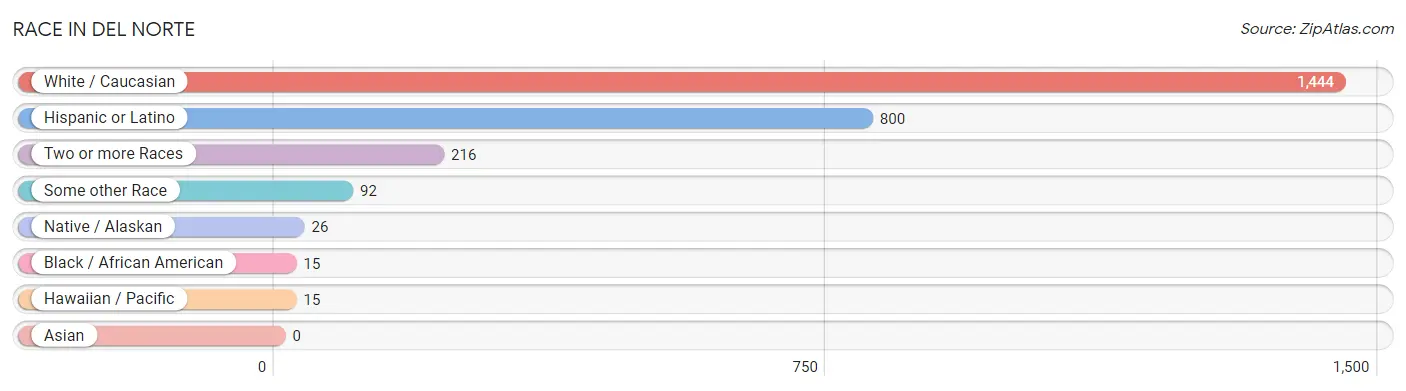
| Race | # Population | % Population |
| Asian | 0 | 0.0% |
| Black / African American | 15 | 0.8% |
| Hawaiian / Pacific | 15 | 0.8% |
| Hispanic or Latino | 800 | 44.3% |
| Native / Alaskan | 26 | 1.4% |
| White / Caucasian | 1,444 | 79.9% |
| Two or more Races | 216 | 11.9% |
| Some other Race | 92 | 5.1% |
| Total | 1,808 | 100.0% |
Ancestry in Del Norte
The most populous ancestries reported in Del Norte are German (421 | 23.3%), Mexican (416 | 23.0%), English (214 | 11.8%), Irish (211 | 11.7%), and Spanish (121 | 6.7%), together accounting for 76.5% of all Del Norte residents.
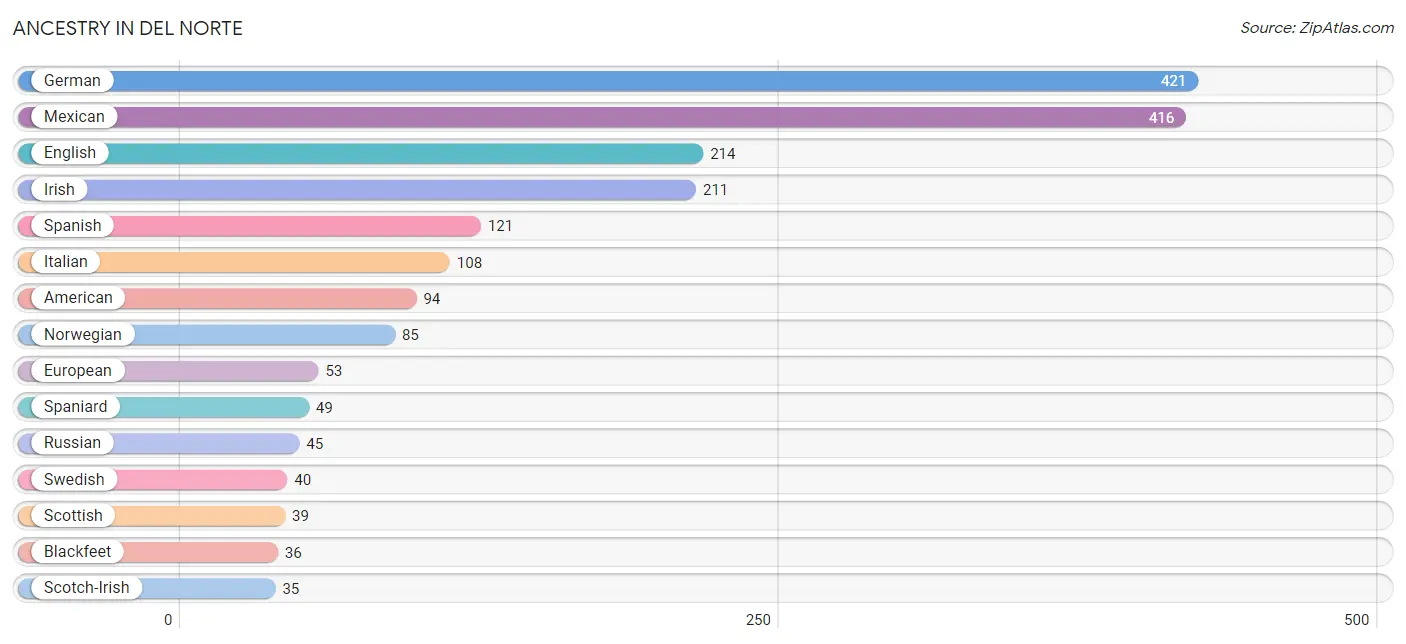
| Ancestry | # Population | % Population |
| American | 94 | 5.2% |
| Apache | 5 | 0.3% |
| Blackfeet | 36 | 2.0% |
| Cherokee | 6 | 0.3% |
| Danish | 11 | 0.6% |
| Dutch | 10 | 0.5% |
| Eastern European | 9 | 0.5% |
| English | 214 | 11.8% |
| European | 53 | 2.9% |
| French | 21 | 1.2% |
| German | 421 | 23.3% |
| Hungarian | 6 | 0.3% |
| Irish | 211 | 11.7% |
| Italian | 108 | 6.0% |
| Mexican | 416 | 23.0% |
| Native Hawaiian | 15 | 0.8% |
| Navajo | 3 | 0.2% |
| Norwegian | 85 | 4.7% |
| Pennsylvania German | 7 | 0.4% |
| Polish | 15 | 0.8% |
| Puerto Rican | 5 | 0.3% |
| Russian | 45 | 2.5% |
| Scandinavian | 4 | 0.2% |
| Scotch-Irish | 35 | 1.9% |
| Scottish | 39 | 2.2% |
| Spaniard | 49 | 2.7% |
| Spanish | 121 | 6.7% |
| Spanish American | 7 | 0.4% |
| Swedish | 40 | 2.2% |
| Swiss | 5 | 0.3% |
| Ukrainian | 3 | 0.2% |
| Welsh | 7 | 0.4% | View All 32 Rows |
Immigrants in Del Norte
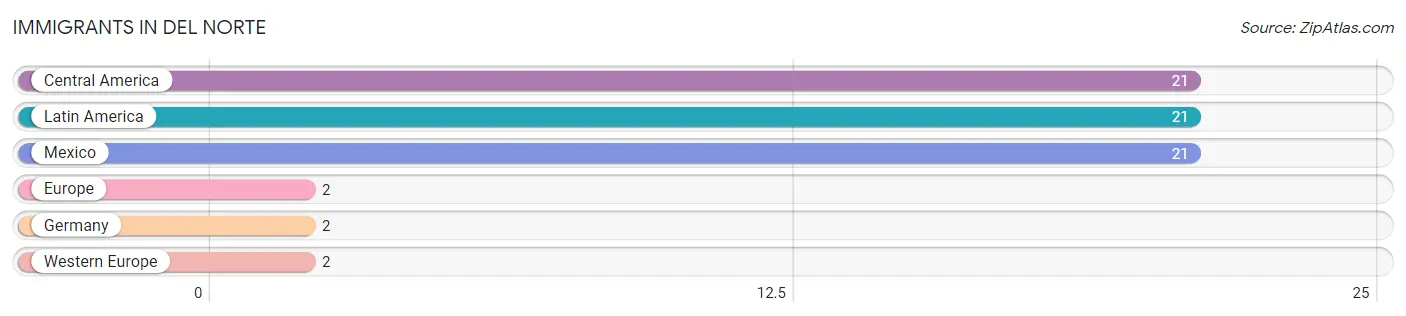
The most numerous immigrant groups reported in Del Norte came from Central America (21 | 1.2%), Latin America (21 | 1.2%), Mexico (21 | 1.2%), Europe (2 | 0.1%), and Germany (2 | 0.1%), together accounting for 3.7% of all Del Norte residents.
| Immigration Origin | # Population | % Population |
| Central America | 21 | 1.2% |
| Europe | 2 | 0.1% |
| Germany | 2 | 0.1% |
| Latin America | 21 | 1.2% |
| Mexico | 21 | 1.2% |
| Western Europe | 2 | 0.1% | View All 6 Rows |
Sex and Age in Del Norte
Sex and Age in Del Norte
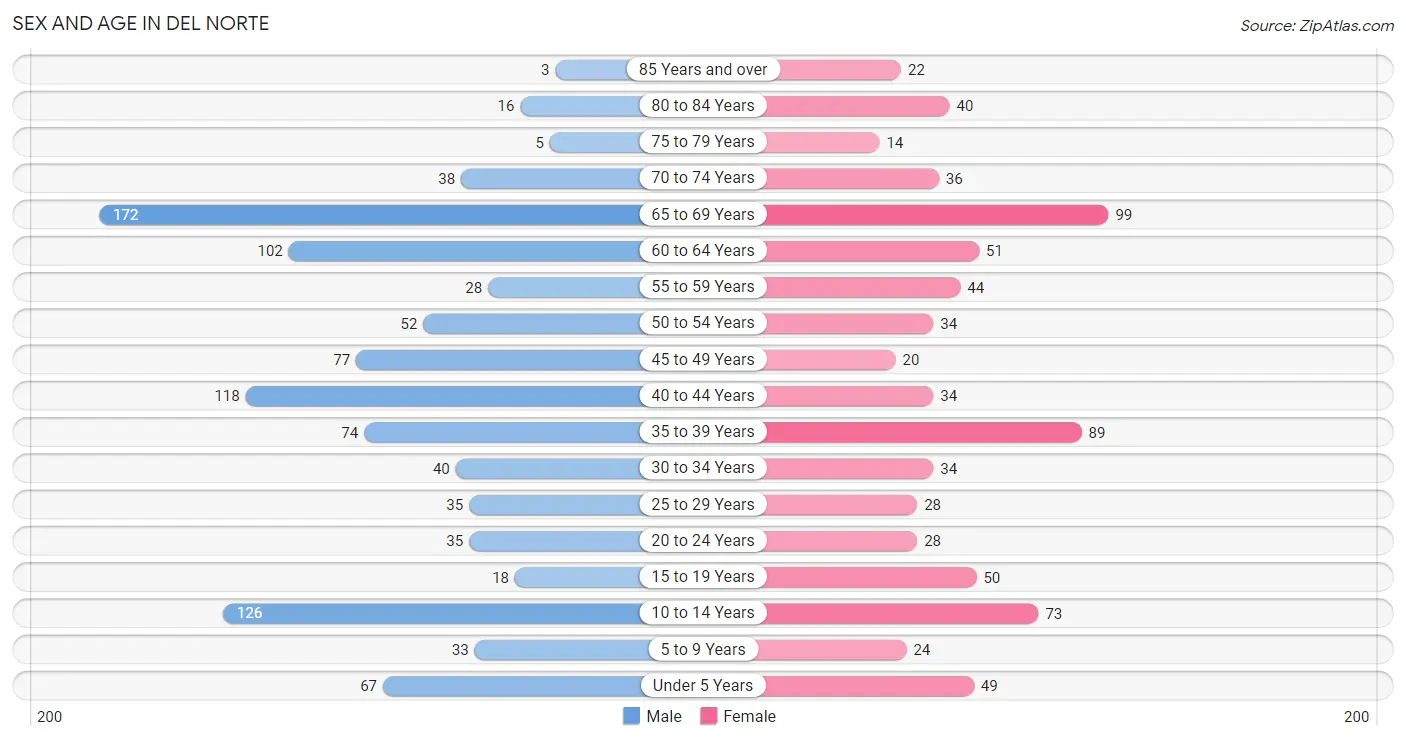
The most populous age groups in Del Norte are 65 to 69 Years (172 | 16.6%) for men and 65 to 69 Years (99 | 12.9%) for women.
| Age Bracket | Male | Female |
| Under 5 Years | 67 (6.5%) | 49 (6.4%) |
| 5 to 9 Years | 33 (3.2%) | 24 (3.1%) |
| 10 to 14 Years | 126 (12.1%) | 73 (9.5%) |
| 15 to 19 Years | 18 (1.7%) | 50 (6.5%) |
| 20 to 24 Years | 35 (3.4%) | 28 (3.6%) |
| 25 to 29 Years | 35 (3.4%) | 28 (3.6%) |
| 30 to 34 Years | 40 (3.8%) | 34 (4.4%) |
| 35 to 39 Years | 74 (7.1%) | 89 (11.6%) |
| 40 to 44 Years | 118 (11.4%) | 34 (4.4%) |
| 45 to 49 Years | 77 (7.4%) | 20 (2.6%) |
| 50 to 54 Years | 52 (5.0%) | 34 (4.4%) |
| 55 to 59 Years | 28 (2.7%) | 44 (5.7%) |
| 60 to 64 Years | 102 (9.8%) | 51 (6.6%) |
| 65 to 69 Years | 172 (16.6%) | 99 (12.9%) |
| 70 to 74 Years | 38 (3.7%) | 36 (4.7%) |
| 75 to 79 Years | 5 (0.5%) | 14 (1.8%) |
| 80 to 84 Years | 16 (1.5%) | 40 (5.2%) |
| 85 Years and over | 3 (0.3%) | 22 (2.9%) |
| Total | 1,039 (100.0%) | 769 (100.0%) |
Families and Households in Del Norte
Median Family Size in Del Norte
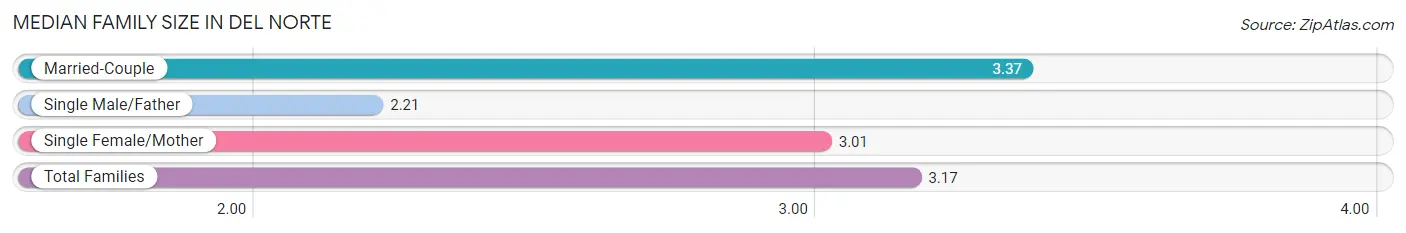
The median family size in Del Norte is 3.17 persons per family, with married-couple families (229 | 65.8%) accounting for the largest median family size of 3.37 persons per family. On the other hand, single male/father families (33 | 9.5%) represent the smallest median family size with 2.21 persons per family.
| Family Type | # Families | Family Size |
| Married-Couple | 229 (65.8%) | 3.37 |
| Single Male/Father | 33 (9.5%) | 2.21 |
| Single Female/Mother | 86 (24.7%) | 3.01 |
| Total Families | 348 (100.0%) | 3.17 |
Median Household Size in Del Norte
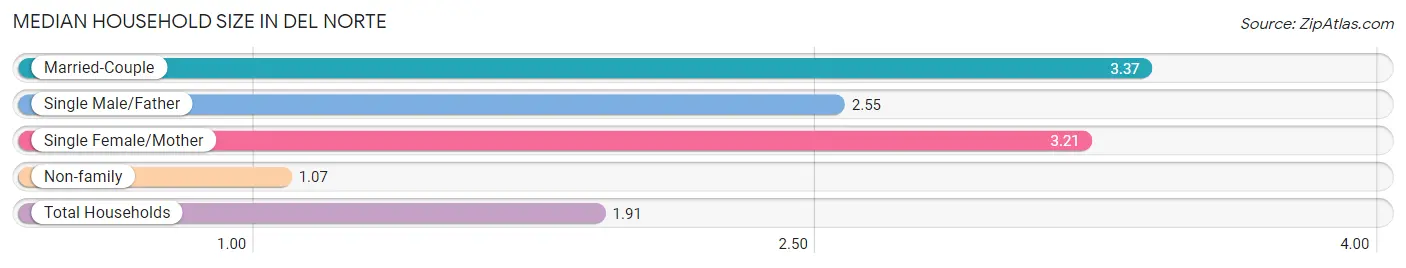
The median household size in Del Norte is 1.91 persons per household, with married-couple households (229 | 25.4%) accounting for the largest median household size of 3.37 persons per household. non-family households (552 | 61.3%) represent the smallest median household size with 1.07 persons per household.
| Household Type | # Households | Household Size |
| Married-Couple | 229 (25.4%) | 3.37 |
| Single Male/Father | 33 (3.7%) | 2.55 |
| Single Female/Mother | 86 (9.6%) | 3.21 |
| Non-family | 552 (61.3%) | 1.07 |
| Total Households | 900 (100.0%) | 1.91 |
Household Size by Marriage Status in Del Norte
Out of a total of 900 households in Del Norte, 348 (38.7%) are family households, while 552 (61.3%) are nonfamily households. The most numerous type of family households are 2-person households, comprising 141, and the most common type of nonfamily households are 1-person households, comprising 482.
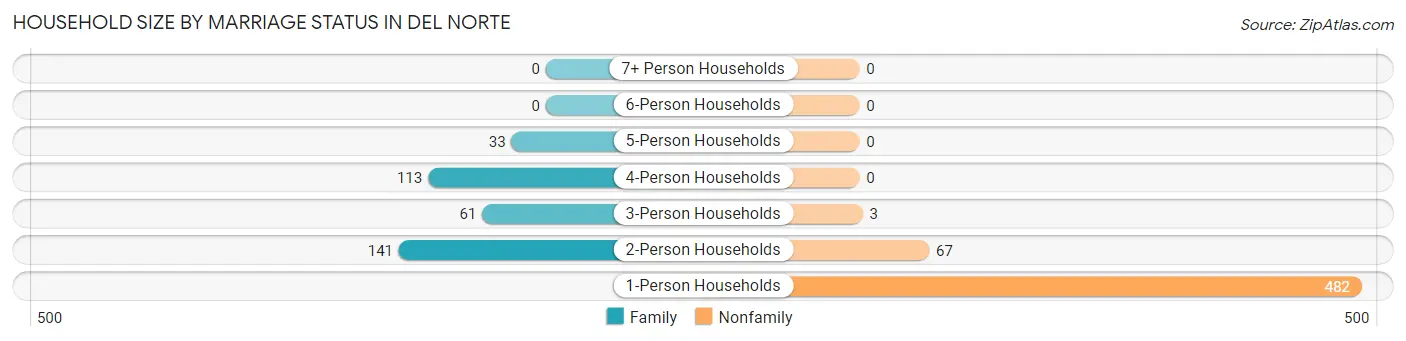
| Household Size | Family Households | Nonfamily Households |
| 1-Person Households | - | 482 (53.6%) |
| 2-Person Households | 141 (15.7%) | 67 (7.4%) |
| 3-Person Households | 61 (6.8%) | 3 (0.3%) |
| 4-Person Households | 113 (12.6%) | 0 (0.0%) |
| 5-Person Households | 33 (3.7%) | 0 (0.0%) |
| 6-Person Households | 0 (0.0%) | 0 (0.0%) |
| 7+ Person Households | 0 (0.0%) | 0 (0.0%) |
| Total | 348 (38.7%) | 552 (61.3%) |
Female Fertility in Del Norte
Fertility by Age in Del Norte
Average fertility rate in Del Norte is 54.0 births per 1,000 women. Women in the age bracket of 20 to 34 years have the highest fertility rate with 178.0 births per 1,000 women. Women in the age bracket of 20 to 34 years acount for 100.0% of all women with births.
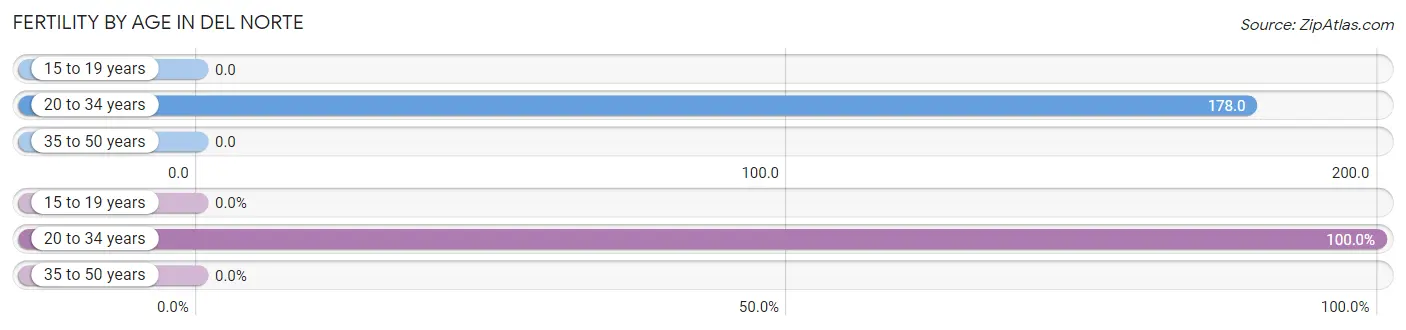
| Age Bracket | Women with Births | Births / 1,000 Women |
| 15 to 19 years | 0 (0.0%) | 0.0 |
| 20 to 34 years | 16 (100.0%) | 178.0 |
| 35 to 50 years | 0 (0.0%) | 0.0 |
| Total | 16 (100.0%) | 54.0 |
Fertility by Age by Marriage Status in Del Norte

| Age Bracket | Married | Unmarried |
| 15 to 19 years | 0 (0.0%) | 0 (0.0%) |
| 20 to 34 years | 0 (0.0%) | 16 (100.0%) |
| 35 to 50 years | 0 (0.0%) | 0 (0.0%) |
| Total | 0 (0.0%) | 16 (100.0%) |
Fertility by Education in Del Norte
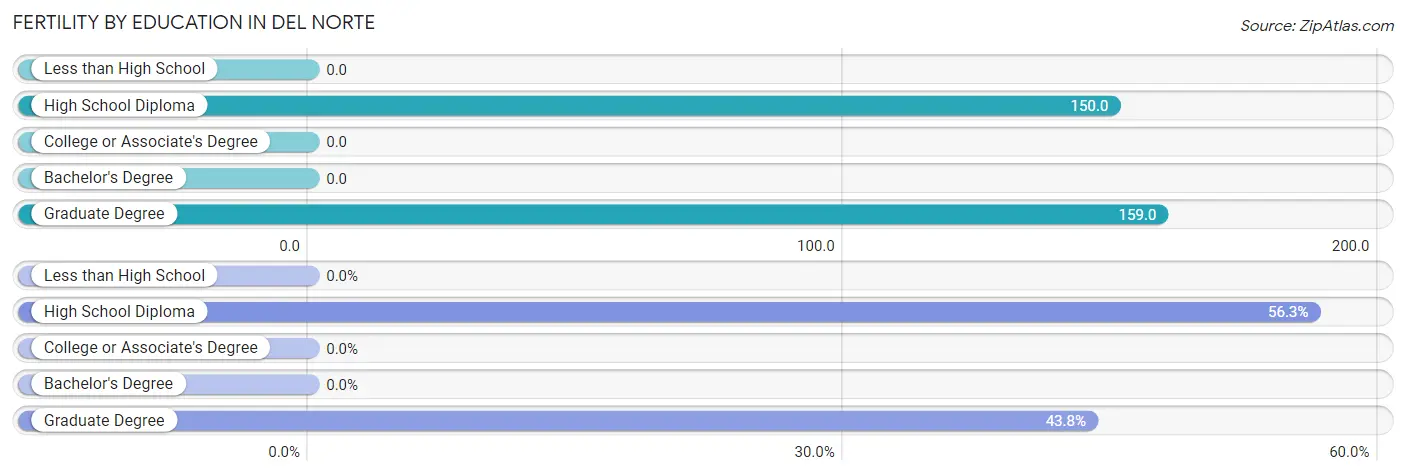
| Educational Attainment | Women with Births | Births / 1,000 Women |
| Less than High School | 0 (0.0%) | 0.0 |
| High School Diploma | 9 (56.2%) | 150.0 |
| College or Associate's Degree | 0 (0.0%) | 0.0 |
| Bachelor's Degree | 0 (0.0%) | 0.0 |
| Graduate Degree | 7 (43.8%) | 159.0 |
| Total | 16 (100.0%) | 54.0 |
Fertility by Education by Marriage Status in Del Norte
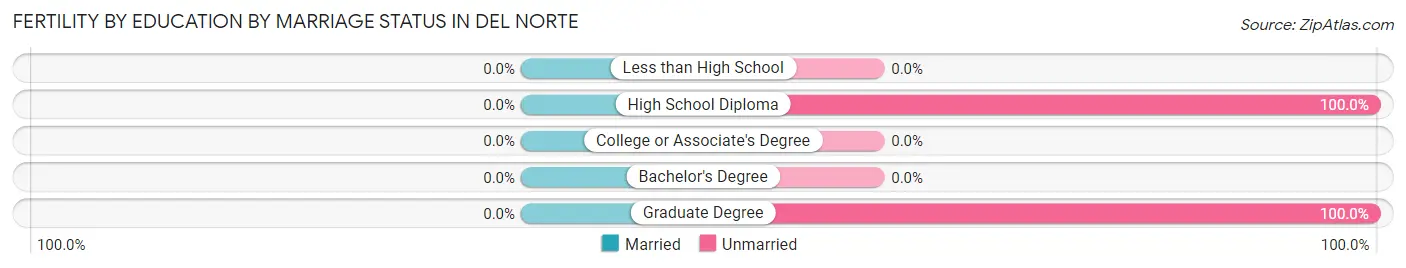
| Educational Attainment | Married | Unmarried |
| Less than High School | 0 (0.0%) | 0 (0.0%) |
| High School Diploma | 0 (0.0%) | 9 (100.0%) |
| College or Associate's Degree | 0 (0.0%) | 0 (0.0%) |
| Bachelor's Degree | 0 (0.0%) | 0 (0.0%) |
| Graduate Degree | 0 (0.0%) | 7 (100.0%) |
| Total | 0 (0.0%) | 16 (100.0%) |
Employment Characteristics in Del Norte
Employment by Class of Employer in Del Norte
Among the 768 employed individuals in Del Norte, private company employees (434 | 56.5%), not-for-profit organizations (86 | 11.2%), and local government employees (85 | 11.1%) make up the most common classes of employment.
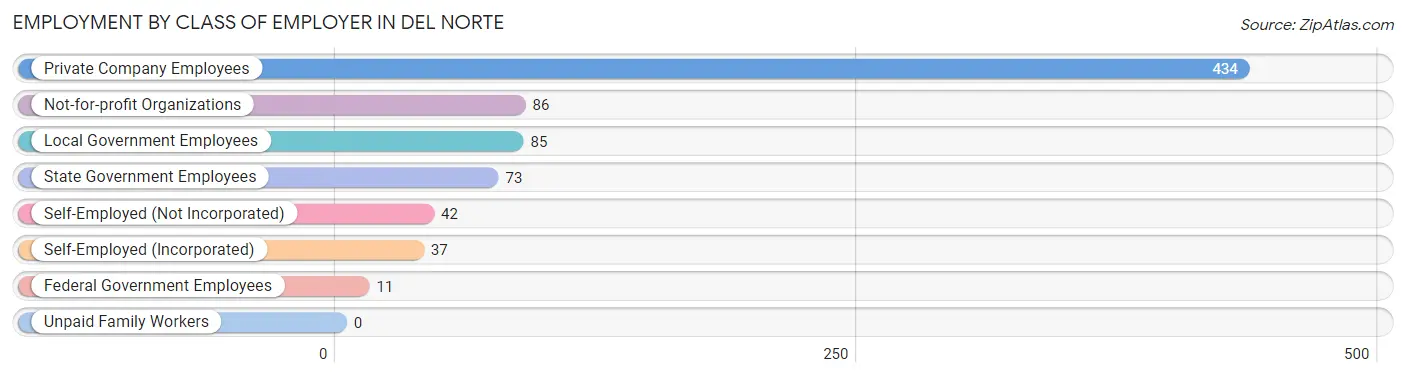
| Employer Class | # Employees | % Employees |
| Private Company Employees | 434 | 56.5% |
| Self-Employed (Incorporated) | 37 | 4.8% |
| Self-Employed (Not Incorporated) | 42 | 5.5% |
| Not-for-profit Organizations | 86 | 11.2% |
| Local Government Employees | 85 | 11.1% |
| State Government Employees | 73 | 9.5% |
| Federal Government Employees | 11 | 1.4% |
| Unpaid Family Workers | 0 | 0.0% |
| Total | 768 | 100.0% |
Employment Status by Age in Del Norte
According to the labor force statistics for Del Norte, out of the total population over 16 years of age (1,433), 59.9% or 858 individuals are in the labor force, with 7.7% or 66 of them unemployed. The age group with the highest labor force participation rate is 20 to 24 years, with 93.7% or 59 individuals in the labor force. Within the labor force, the 35 to 44 years age range has the highest percentage of unemployed individuals, with 14.0% or 41 of them being unemployed.
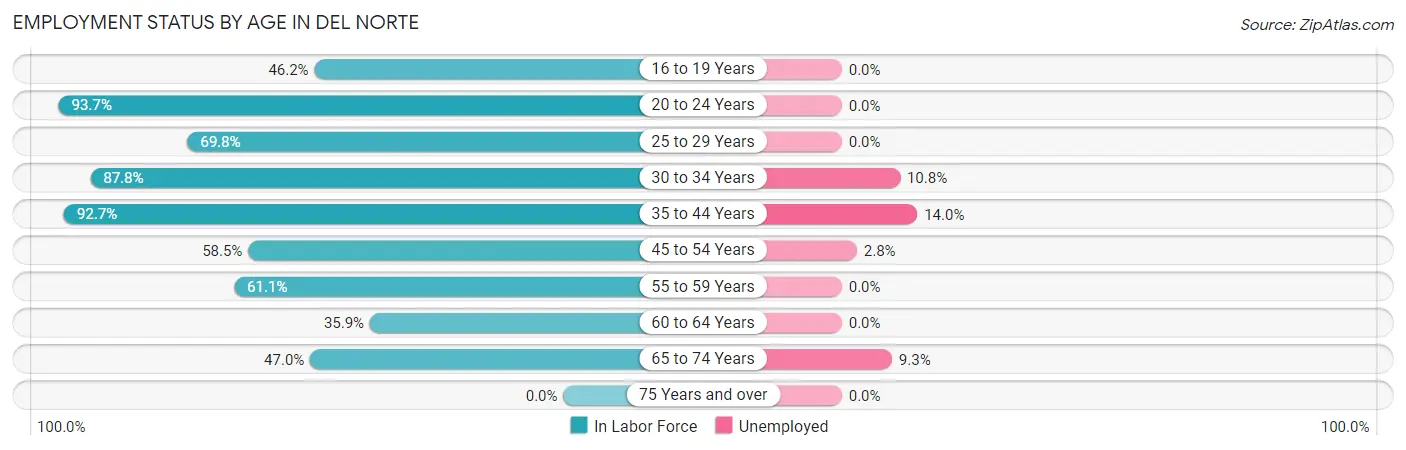
| Age Bracket | In Labor Force | Unemployed |
| 16 to 19 Years | 30 (46.2%) | 0 (0.0%) |
| 20 to 24 Years | 59 (93.7%) | 0 (0.0%) |
| 25 to 29 Years | 44 (69.8%) | 0 (0.0%) |
| 30 to 34 Years | 65 (87.8%) | 7 (10.8%) |
| 35 to 44 Years | 292 (92.7%) | 41 (14.0%) |
| 45 to 54 Years | 107 (58.5%) | 3 (2.8%) |
| 55 to 59 Years | 44 (61.1%) | 0 (0.0%) |
| 60 to 64 Years | 55 (35.9%) | 0 (0.0%) |
| 65 to 74 Years | 162 (47.0%) | 15 (9.3%) |
| 75 Years and over | 0 (0.0%) | 0 (0.0%) |
| Total | 858 (59.9%) | 66 (7.7%) |
Employment Status by Educational Attainment in Del Norte
According to labor force statistics for Del Norte, 70.6% of individuals (607) out of the total population between 25 and 64 years of age (860) are in the labor force, with 8.4% or 51 of them being unemployed. The group with the highest labor force participation rate are those with the educational attainment of bachelor's degree or higher, with 87.6% or 191 individuals in the labor force. Within the labor force, individuals with high school diploma education have the highest percentage of unemployment, with 14.6% or 24 of them being unemployed.

| Educational Attainment | In Labor Force | Unemployed |
| Less than High School | 64 (61.0%) | 5 (4.7%) |
| High School Diploma | 164 (68.9%) | 35 (14.6%) |
| College / Associate Degree | 188 (62.9%) | 11 (3.7%) |
| Bachelor's Degree or higher | 191 (87.6%) | 19 (8.9%) |
| Total | 607 (70.6%) | 72 (8.4%) |
Employment Occupations by Sex in Del Norte
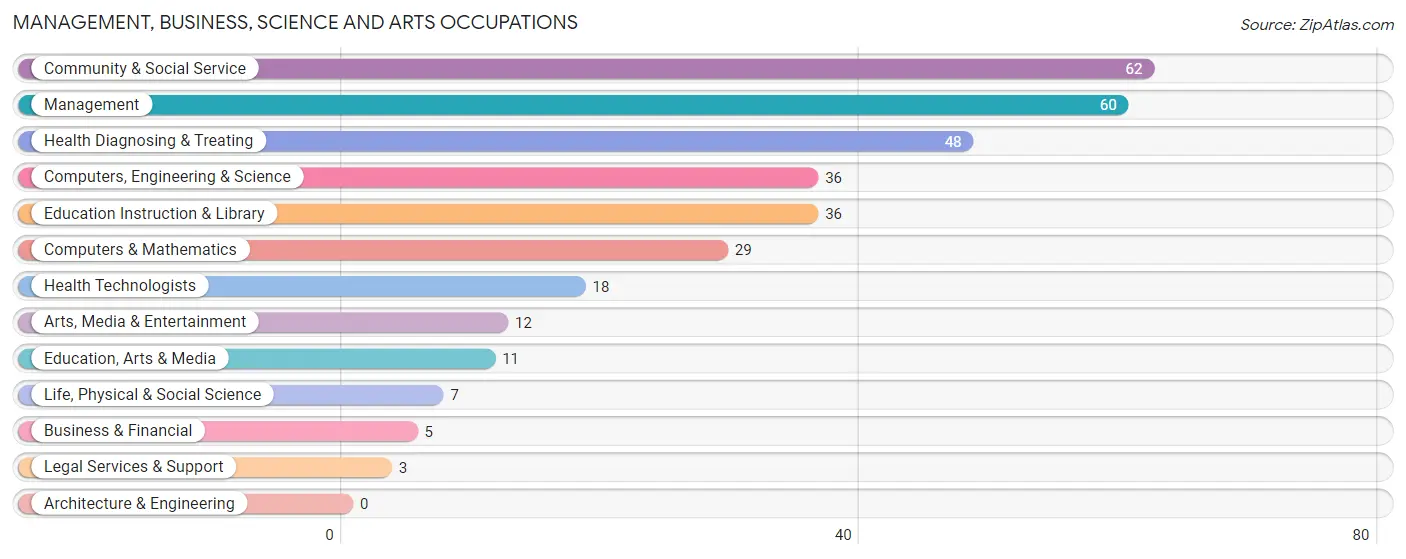
Management, Business, Science and Arts Occupations
The most common Management, Business, Science and Arts occupations in Del Norte are Community & Social Service (62 | 7.8%), Management (60 | 7.6%), Health Diagnosing & Treating (48 | 6.1%), Computers, Engineering & Science (36 | 4.5%), and Education Instruction & Library (36 | 4.5%).
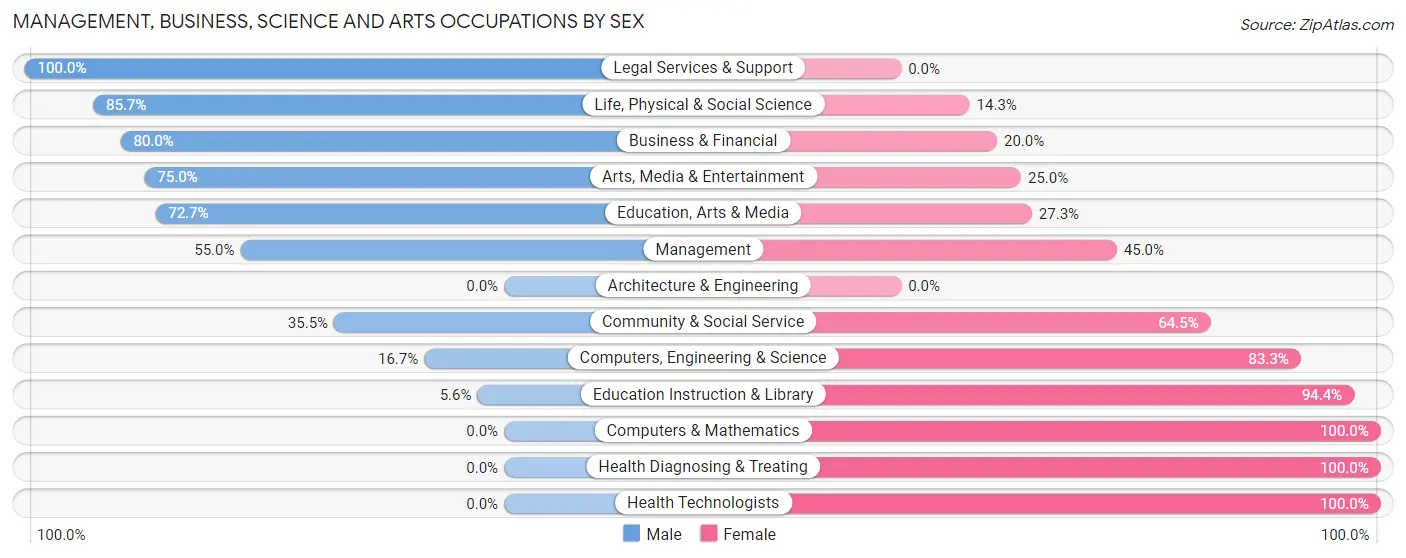
Management, Business, Science and Arts Occupations by Sex
Within the Management, Business, Science and Arts occupations in Del Norte, the most male-oriented occupations are Legal Services & Support (100.0%), Life, Physical & Social Science (85.7%), and Business & Financial (80.0%), while the most female-oriented occupations are Computers & Mathematics (100.0%), Health Diagnosing & Treating (100.0%), and Health Technologists (100.0%).
| Occupation | Male | Female |
| Management | 33 (55.0%) | 27 (45.0%) |
| Business & Financial | 4 (80.0%) | 1 (20.0%) |
| Computers, Engineering & Science | 6 (16.7%) | 30 (83.3%) |
| Computers & Mathematics | 0 (0.0%) | 29 (100.0%) |
| Architecture & Engineering | 0 (0.0%) | 0 (0.0%) |
| Life, Physical & Social Science | 6 (85.7%) | 1 (14.3%) |
| Community & Social Service | 22 (35.5%) | 40 (64.5%) |
| Education, Arts & Media | 8 (72.7%) | 3 (27.3%) |
| Legal Services & Support | 3 (100.0%) | 0 (0.0%) |
| Education Instruction & Library | 2 (5.6%) | 34 (94.4%) |
| Arts, Media & Entertainment | 9 (75.0%) | 3 (25.0%) |
| Health Diagnosing & Treating | 0 (0.0%) | 48 (100.0%) |
| Health Technologists | 0 (0.0%) | 18 (100.0%) |
| Total (Category) | 65 (30.8%) | 146 (69.2%) |
| Total (Overall) | 480 (60.6%) | 312 (39.4%) |
Services Occupations
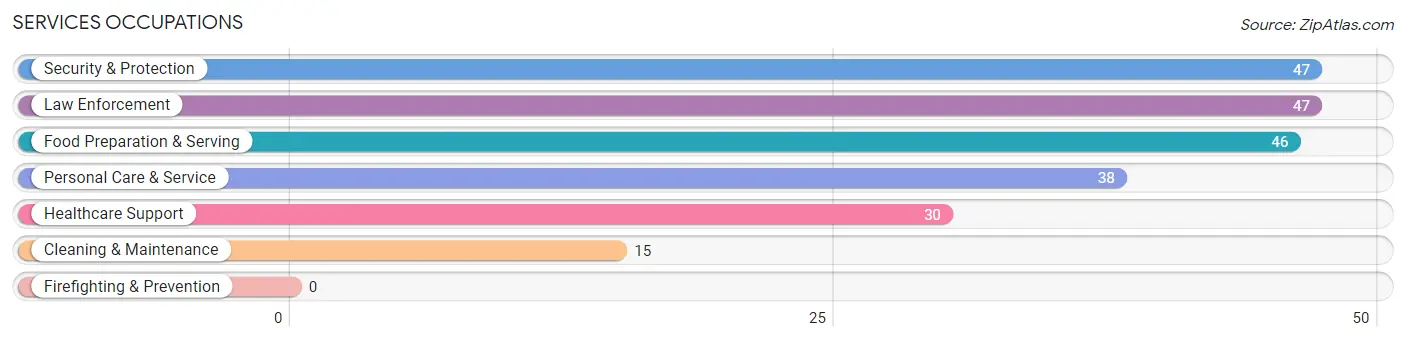
The most common Services occupations in Del Norte are Security & Protection (47 | 5.9%), Law Enforcement (47 | 5.9%), Food Preparation & Serving (46 | 5.8%), Personal Care & Service (38 | 4.8%), and Healthcare Support (30 | 3.8%).
Services Occupations by Sex
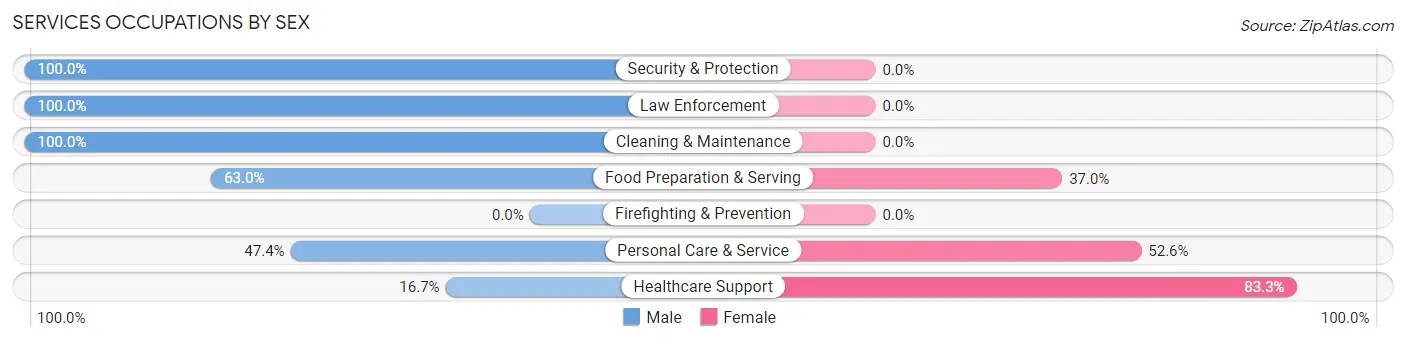
Within the Services occupations in Del Norte, the most male-oriented occupations are Security & Protection (100.0%), Law Enforcement (100.0%), and Cleaning & Maintenance (100.0%), while the most female-oriented occupations are Healthcare Support (83.3%), Personal Care & Service (52.6%), and Food Preparation & Serving (37.0%).
| Occupation | Male | Female |
| Healthcare Support | 5 (16.7%) | 25 (83.3%) |
| Security & Protection | 47 (100.0%) | 0 (0.0%) |
| Firefighting & Prevention | 0 (0.0%) | 0 (0.0%) |
| Law Enforcement | 47 (100.0%) | 0 (0.0%) |
| Food Preparation & Serving | 29 (63.0%) | 17 (37.0%) |
| Cleaning & Maintenance | 15 (100.0%) | 0 (0.0%) |
| Personal Care & Service | 18 (47.4%) | 20 (52.6%) |
| Total (Category) | 114 (64.8%) | 62 (35.2%) |
| Total (Overall) | 480 (60.6%) | 312 (39.4%) |
Sales and Office Occupations
The most common Sales and Office occupations in Del Norte are Office & Administration (162 | 20.4%), and Sales & Related (19 | 2.4%).

Sales and Office Occupations by Sex

| Occupation | Male | Female |
| Sales & Related | 10 (52.6%) | 9 (47.4%) |
| Office & Administration | 101 (62.4%) | 61 (37.7%) |
| Total (Category) | 111 (61.3%) | 70 (38.7%) |
| Total (Overall) | 480 (60.6%) | 312 (39.4%) |
Natural Resources, Construction and Maintenance Occupations
The most common Natural Resources, Construction and Maintenance occupations in Del Norte are Installation, Maintenance & Repair (93 | 11.7%), Construction & Extraction (87 | 11.0%), and Farming, Fishing & Forestry (8 | 1.0%).

Natural Resources, Construction and Maintenance Occupations by Sex

| Occupation | Male | Female |
| Farming, Fishing & Forestry | 8 (100.0%) | 0 (0.0%) |
| Construction & Extraction | 78 (89.7%) | 9 (10.3%) |
| Installation, Maintenance & Repair | 93 (100.0%) | 0 (0.0%) |
| Total (Category) | 179 (95.2%) | 9 (4.8%) |
| Total (Overall) | 480 (60.6%) | 312 (39.4%) |
Production, Transportation and Moving Occupations
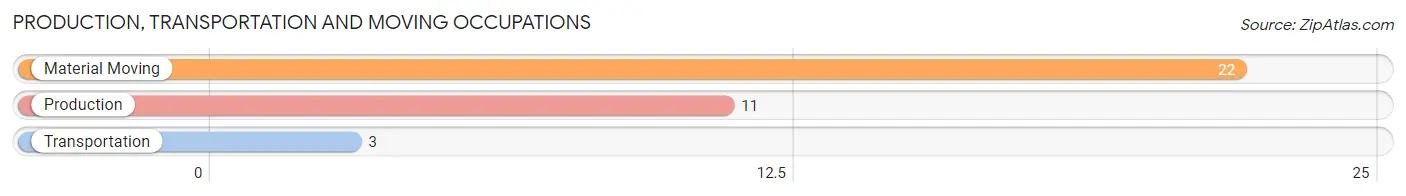
The most common Production, Transportation and Moving occupations in Del Norte are Material Moving (22 | 2.8%), Production (11 | 1.4%), and Transportation (3 | 0.4%).
Production, Transportation and Moving Occupations by Sex

| Occupation | Male | Female |
| Production | 8 (72.7%) | 3 (27.3%) |
| Transportation | 3 (100.0%) | 0 (0.0%) |
| Material Moving | 0 (0.0%) | 22 (100.0%) |
| Total (Category) | 11 (30.6%) | 25 (69.4%) |
| Total (Overall) | 480 (60.6%) | 312 (39.4%) |
Employment Industries by Sex in Del Norte
Employment Industries in Del Norte
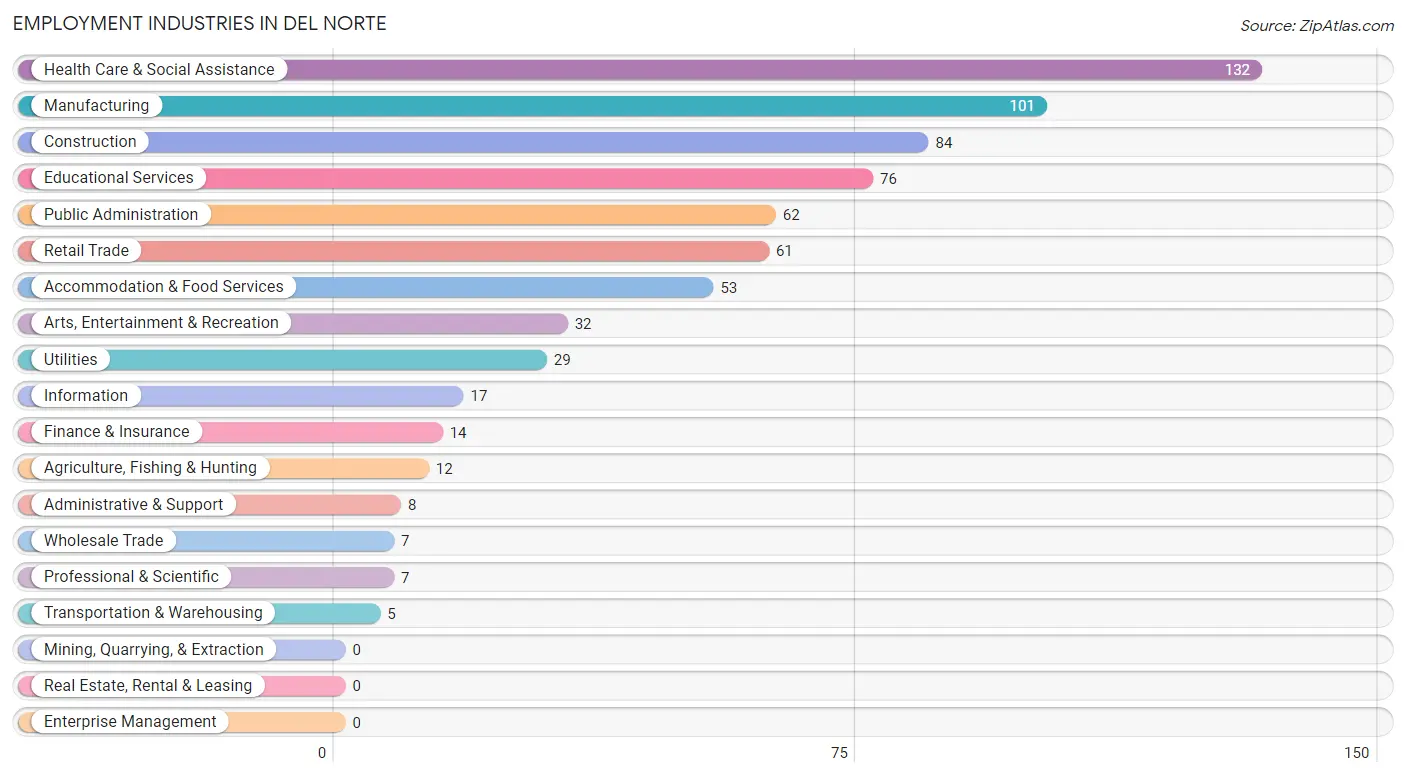
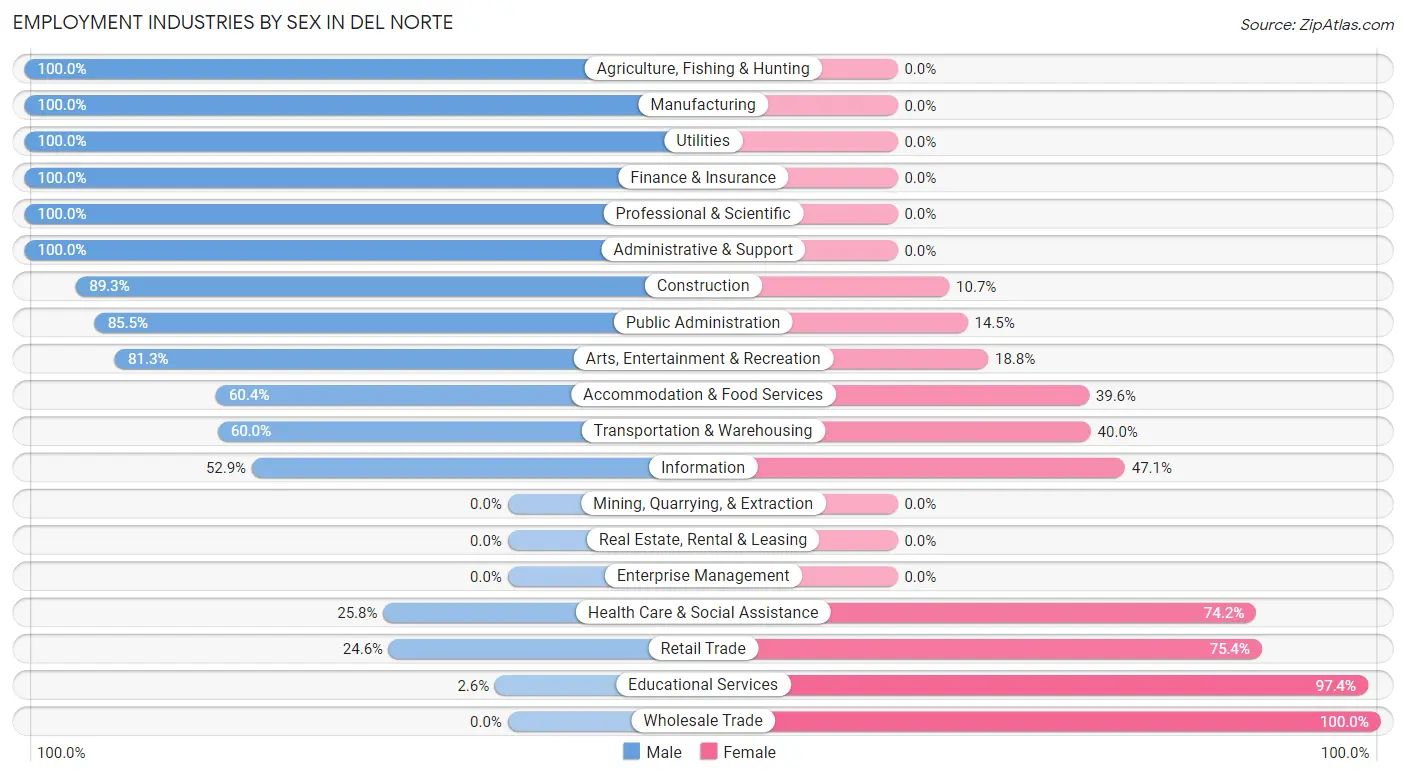
The major employment industries in Del Norte include Health Care & Social Assistance (132 | 16.7%), Manufacturing (101 | 12.8%), Construction (84 | 10.6%), Educational Services (76 | 9.6%), and Public Administration (62 | 7.8%).
Employment Industries by Sex in Del Norte
The Del Norte industries that see more men than women are Agriculture, Fishing & Hunting (100.0%), Manufacturing (100.0%), and Utilities (100.0%), whereas the industries that tend to have a higher number of women are Wholesale Trade (100.0%), Educational Services (97.4%), and Retail Trade (75.4%).
| Industry | Male | Female |
| Agriculture, Fishing & Hunting | 12 (100.0%) | 0 (0.0%) |
| Mining, Quarrying, & Extraction | 0 (0.0%) | 0 (0.0%) |
| Construction | 75 (89.3%) | 9 (10.7%) |
| Manufacturing | 101 (100.0%) | 0 (0.0%) |
| Wholesale Trade | 0 (0.0%) | 7 (100.0%) |
| Retail Trade | 15 (24.6%) | 46 (75.4%) |
| Transportation & Warehousing | 3 (60.0%) | 2 (40.0%) |
| Utilities | 29 (100.0%) | 0 (0.0%) |
| Information | 9 (52.9%) | 8 (47.1%) |
| Finance & Insurance | 14 (100.0%) | 0 (0.0%) |
| Real Estate, Rental & Leasing | 0 (0.0%) | 0 (0.0%) |
| Professional & Scientific | 7 (100.0%) | 0 (0.0%) |
| Enterprise Management | 0 (0.0%) | 0 (0.0%) |
| Administrative & Support | 8 (100.0%) | 0 (0.0%) |
| Educational Services | 2 (2.6%) | 74 (97.4%) |
| Health Care & Social Assistance | 34 (25.8%) | 98 (74.2%) |
| Arts, Entertainment & Recreation | 26 (81.2%) | 6 (18.8%) |
| Accommodation & Food Services | 32 (60.4%) | 21 (39.6%) |
| Public Administration | 53 (85.5%) | 9 (14.5%) |
| Total | 480 (60.6%) | 312 (39.4%) |
Education in Del Norte
School Enrollment in Del Norte
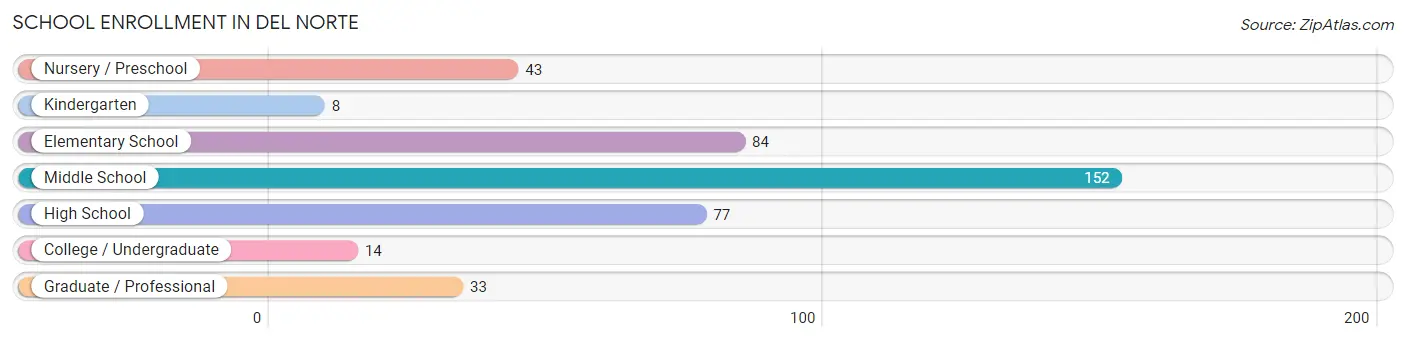
The most common levels of schooling among the 411 students in Del Norte are middle school (152 | 37.0%), elementary school (84 | 20.4%), and high school (77 | 18.7%).
| School Level | # Students | % Students |
| Nursery / Preschool | 43 | 10.5% |
| Kindergarten | 8 | 1.9% |
| Elementary School | 84 | 20.4% |
| Middle School | 152 | 37.0% |
| High School | 77 | 18.7% |
| College / Undergraduate | 14 | 3.4% |
| Graduate / Professional | 33 | 8.0% |
| Total | 411 | 100.0% |
School Enrollment by Age by Funding Source in Del Norte
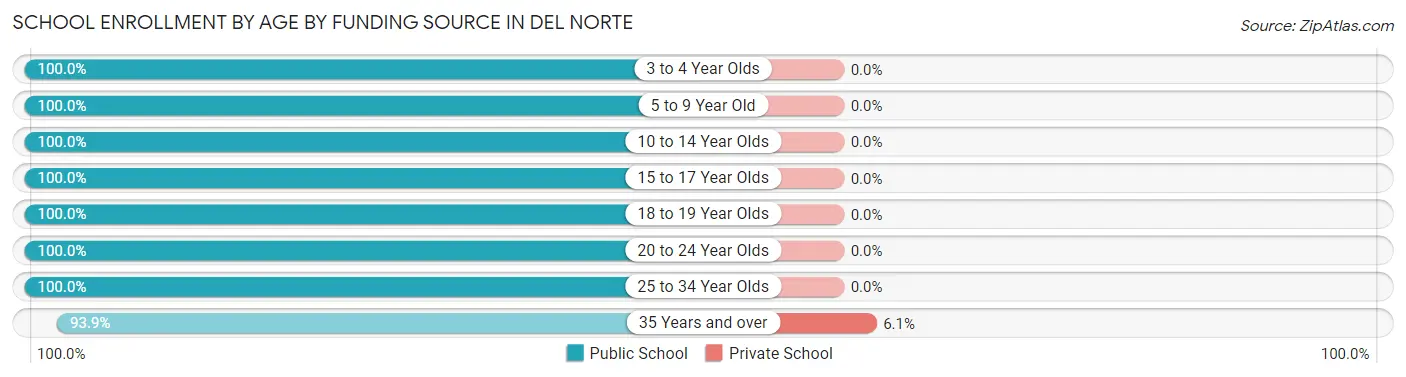
Out of a total of 411 students who are enrolled in schools in Del Norte, 2 (0.5%) attend a private institution, while the remaining 409 (99.5%) are enrolled in public schools. The age group of 35 years and over has the highest likelihood of being enrolled in private schools, with 2 (6.1% in the age bracket) enrolled. Conversely, the age group of 3 to 4 year olds has the lowest likelihood of being enrolled in a private school, with 43 (100.0% in the age bracket) attending a public institution.
| Age Bracket | Public School | Private School |
| 3 to 4 Year Olds | 43 (100.0%) | 0 (0.0%) |
| 5 to 9 Year Old | 57 (100.0%) | 0 (0.0%) |
| 10 to 14 Year Olds | 199 (100.0%) | 0 (0.0%) |
| 15 to 17 Year Olds | 38 (100.0%) | 0 (0.0%) |
| 18 to 19 Year Olds | 27 (100.0%) | 0 (0.0%) |
| 20 to 24 Year Olds | 6 (100.0%) | 0 (0.0%) |
| 25 to 34 Year Olds | 8 (100.0%) | 0 (0.0%) |
| 35 Years and over | 31 (93.9%) | 2 (6.1%) |
| Total | 409 (99.5%) | 2 (0.5%) |
Educational Attainment by Field of Study in Del Norte
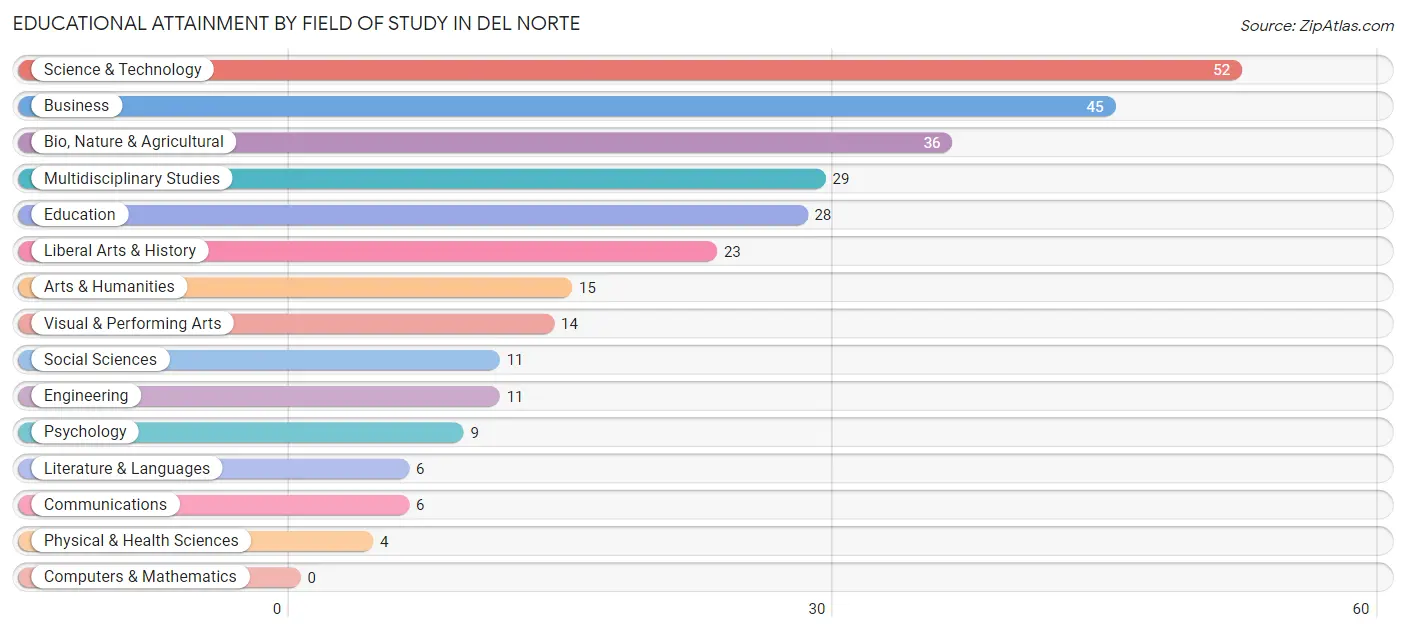
Science & technology (52 | 18.0%), business (45 | 15.6%), bio, nature & agricultural (36 | 12.5%), multidisciplinary studies (29 | 10.0%), and education (28 | 9.7%) are the most common fields of study among 289 individuals in Del Norte who have obtained a bachelor's degree or higher.
| Field of Study | # Graduates | % Graduates |
| Computers & Mathematics | 0 | 0.0% |
| Bio, Nature & Agricultural | 36 | 12.5% |
| Physical & Health Sciences | 4 | 1.4% |
| Psychology | 9 | 3.1% |
| Social Sciences | 11 | 3.8% |
| Engineering | 11 | 3.8% |
| Multidisciplinary Studies | 29 | 10.0% |
| Science & Technology | 52 | 18.0% |
| Business | 45 | 15.6% |
| Education | 28 | 9.7% |
| Literature & Languages | 6 | 2.1% |
| Liberal Arts & History | 23 | 8.0% |
| Visual & Performing Arts | 14 | 4.8% |
| Communications | 6 | 2.1% |
| Arts & Humanities | 15 | 5.2% |
| Total | 289 | 100.0% |
Transportation & Commute in Del Norte
Vehicle Availability by Sex in Del Norte
The most prevalent vehicle ownership categories in Del Norte are males with 2 vehicles (168, accounting for 36.9%) and females with 2 vehicles (75, making up 58.3%).
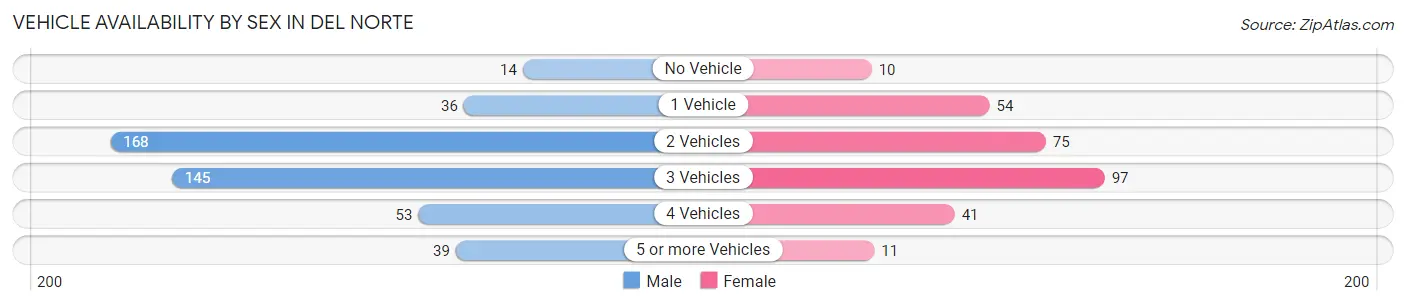
| Vehicles Available | Male | Female |
| No Vehicle | 14 (3.1%) | 10 (3.5%) |
| 1 Vehicle | 36 (7.9%) | 54 (18.8%) |
| 2 Vehicles | 168 (36.9%) | 75 (26.0%) |
| 3 Vehicles | 145 (31.9%) | 97 (33.7%) |
| 4 Vehicles | 53 (11.7%) | 41 (14.2%) |
| 5 or more Vehicles | 39 (8.6%) | 11 (3.8%) |
| Total | 455 (100.0%) | 288 (100.0%) |
Commute Time in Del Norte
The most frequently occuring commute durations in Del Norte are 5 to 9 minutes (216 commuters, 30.7%), 45 to 59 minutes (140 commuters, 19.9%), and 20 to 24 minutes (116 commuters, 16.5%).
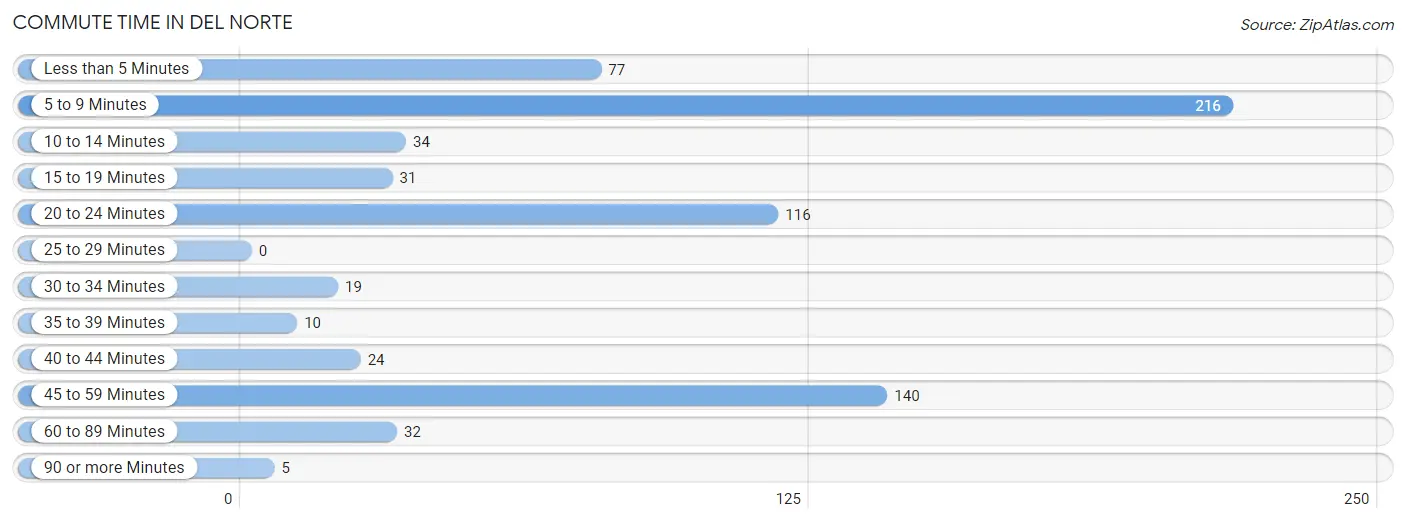
| Commute Time | # Commuters | % Commuters |
| Less than 5 Minutes | 77 | 10.9% |
| 5 to 9 Minutes | 216 | 30.7% |
| 10 to 14 Minutes | 34 | 4.8% |
| 15 to 19 Minutes | 31 | 4.4% |
| 20 to 24 Minutes | 116 | 16.5% |
| 25 to 29 Minutes | 0 | 0.0% |
| 30 to 34 Minutes | 19 | 2.7% |
| 35 to 39 Minutes | 10 | 1.4% |
| 40 to 44 Minutes | 24 | 3.4% |
| 45 to 59 Minutes | 140 | 19.9% |
| 60 to 89 Minutes | 32 | 4.5% |
| 90 or more Minutes | 5 | 0.7% |
Commute Time by Sex in Del Norte
The most common commute times in Del Norte are 45 to 59 minutes (137 commuters, 29.1%) for males and 5 to 9 minutes (98 commuters, 41.9%) for females.
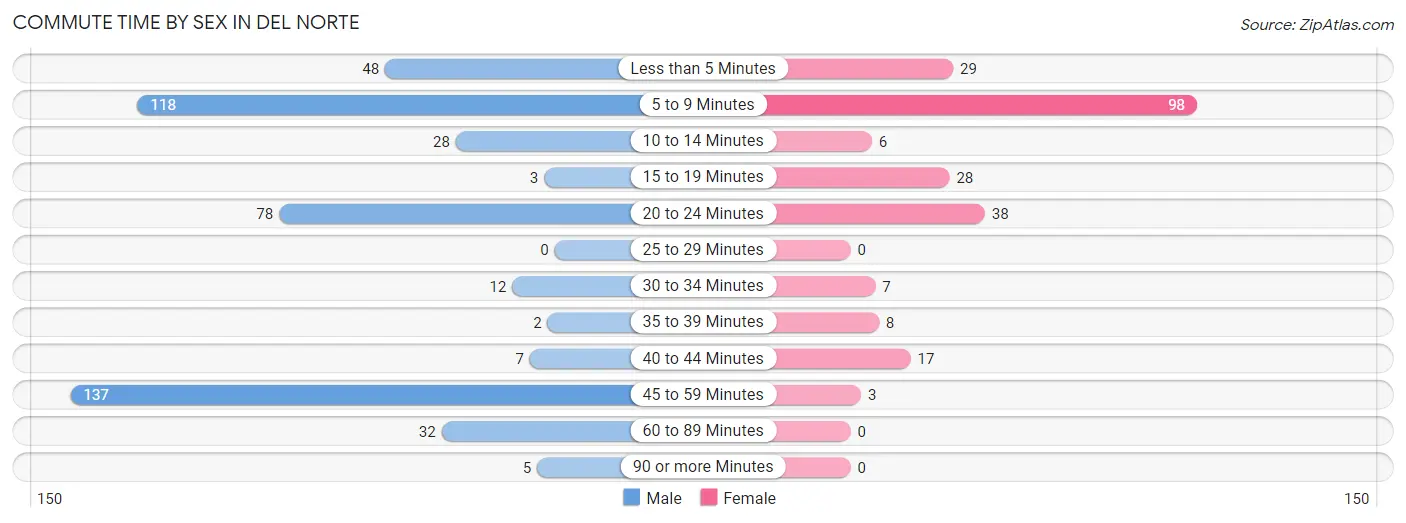
| Commute Time | Male | Female |
| Less than 5 Minutes | 48 (10.2%) | 29 (12.4%) |
| 5 to 9 Minutes | 118 (25.1%) | 98 (41.9%) |
| 10 to 14 Minutes | 28 (6.0%) | 6 (2.6%) |
| 15 to 19 Minutes | 3 (0.6%) | 28 (12.0%) |
| 20 to 24 Minutes | 78 (16.6%) | 38 (16.2%) |
| 25 to 29 Minutes | 0 (0.0%) | 0 (0.0%) |
| 30 to 34 Minutes | 12 (2.5%) | 7 (3.0%) |
| 35 to 39 Minutes | 2 (0.4%) | 8 (3.4%) |
| 40 to 44 Minutes | 7 (1.5%) | 17 (7.3%) |
| 45 to 59 Minutes | 137 (29.1%) | 3 (1.3%) |
| 60 to 89 Minutes | 32 (6.8%) | 0 (0.0%) |
| 90 or more Minutes | 5 (1.1%) | 0 (0.0%) |
Time of Departure to Work by Sex in Del Norte
The most frequent times of departure to work in Del Norte are 7:00 AM to 7:29 AM (145, 30.8%) for males and 7:30 AM to 7:59 AM (67, 28.6%) for females.
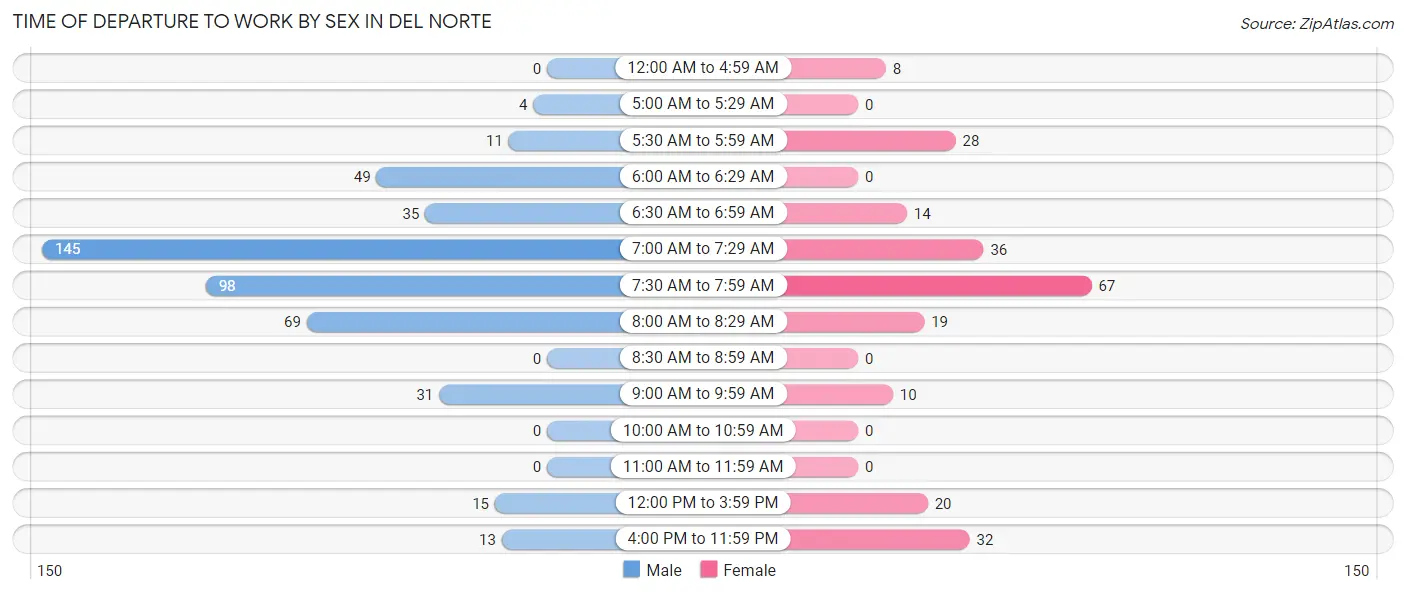
| Time of Departure | Male | Female |
| 12:00 AM to 4:59 AM | 0 (0.0%) | 8 (3.4%) |
| 5:00 AM to 5:29 AM | 4 (0.9%) | 0 (0.0%) |
| 5:30 AM to 5:59 AM | 11 (2.3%) | 28 (12.0%) |
| 6:00 AM to 6:29 AM | 49 (10.4%) | 0 (0.0%) |
| 6:30 AM to 6:59 AM | 35 (7.4%) | 14 (6.0%) |
| 7:00 AM to 7:29 AM | 145 (30.8%) | 36 (15.4%) |
| 7:30 AM to 7:59 AM | 98 (20.8%) | 67 (28.6%) |
| 8:00 AM to 8:29 AM | 69 (14.7%) | 19 (8.1%) |
| 8:30 AM to 8:59 AM | 0 (0.0%) | 0 (0.0%) |
| 9:00 AM to 9:59 AM | 31 (6.6%) | 10 (4.3%) |
| 10:00 AM to 10:59 AM | 0 (0.0%) | 0 (0.0%) |
| 11:00 AM to 11:59 AM | 0 (0.0%) | 0 (0.0%) |
| 12:00 PM to 3:59 PM | 15 (3.2%) | 20 (8.6%) |
| 4:00 PM to 11:59 PM | 13 (2.8%) | 32 (13.7%) |
| Total | 470 (100.0%) | 234 (100.0%) |
Housing Occupancy in Del Norte
Occupancy by Ownership in Del Norte
Of the total 900 dwellings in Del Norte, owner-occupied units account for 689 (76.6%), while renter-occupied units make up 211 (23.4%).
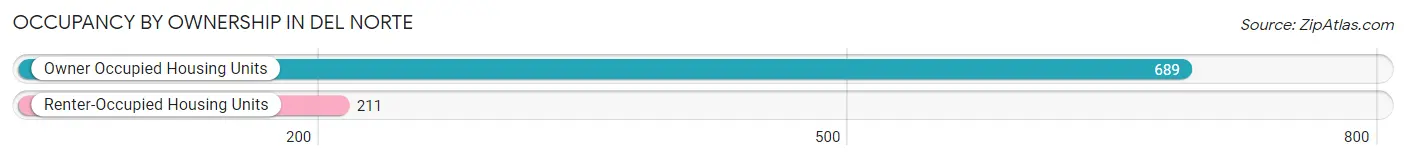
| Occupancy | # Housing Units | % Housing Units |
| Owner Occupied Housing Units | 689 | 76.6% |
| Renter-Occupied Housing Units | 211 | 23.4% |
| Total Occupied Housing Units | 900 | 100.0% |
Occupancy by Household Size in Del Norte
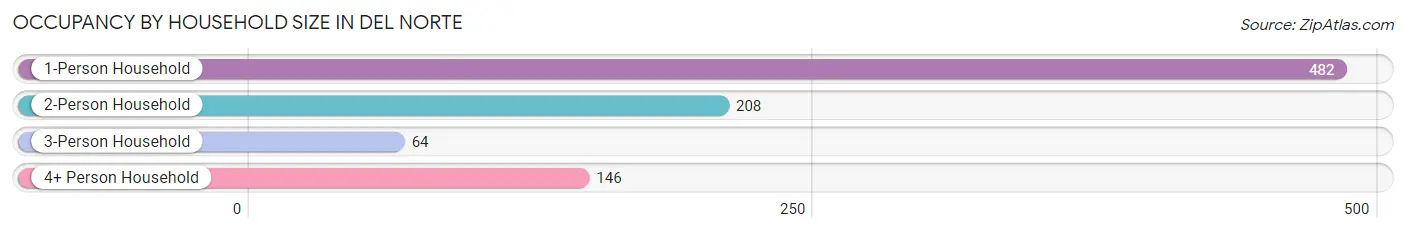
| Household Size | # Housing Units | % Housing Units |
| 1-Person Household | 482 | 53.6% |
| 2-Person Household | 208 | 23.1% |
| 3-Person Household | 64 | 7.1% |
| 4+ Person Household | 146 | 16.2% |
| Total Housing Units | 900 | 100.0% |
Occupancy by Ownership by Household Size in Del Norte
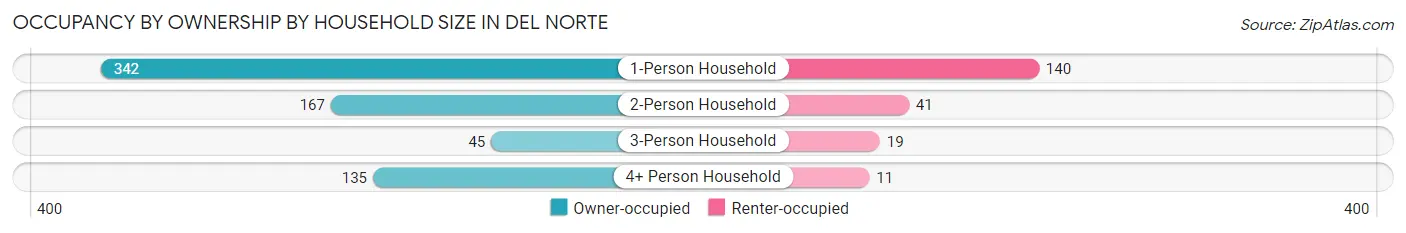
| Household Size | Owner-occupied | Renter-occupied |
| 1-Person Household | 342 (71.0%) | 140 (29.0%) |
| 2-Person Household | 167 (80.3%) | 41 (19.7%) |
| 3-Person Household | 45 (70.3%) | 19 (29.7%) |
| 4+ Person Household | 135 (92.5%) | 11 (7.5%) |
| Total Housing Units | 689 (76.6%) | 211 (23.4%) |
Occupancy by Educational Attainment in Del Norte
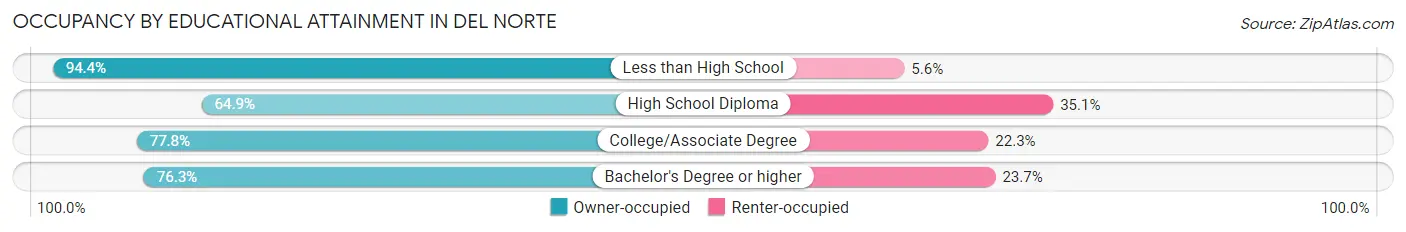
| Household Size | Owner-occupied | Renter-occupied |
| Less than High School | 118 (94.4%) | 7 (5.6%) |
| High School Diploma | 146 (64.9%) | 79 (35.1%) |
| College/Associate Degree | 283 (77.7%) | 81 (22.3%) |
| Bachelor's Degree or higher | 142 (76.3%) | 44 (23.7%) |
Occupancy by Age of Householder in Del Norte
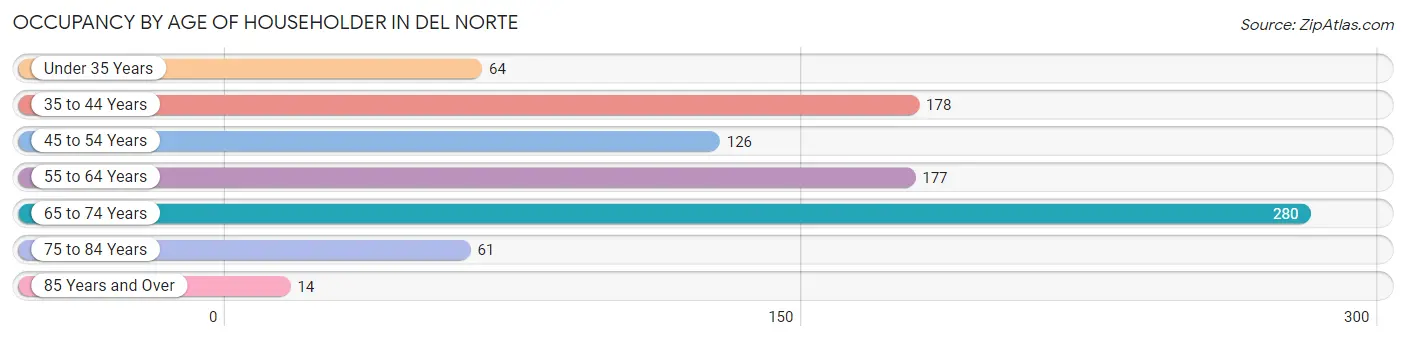
| Age Bracket | # Households | % Households |
| Under 35 Years | 64 | 7.1% |
| 35 to 44 Years | 178 | 19.8% |
| 45 to 54 Years | 126 | 14.0% |
| 55 to 64 Years | 177 | 19.7% |
| 65 to 74 Years | 280 | 31.1% |
| 75 to 84 Years | 61 | 6.8% |
| 85 Years and Over | 14 | 1.6% |
| Total | 900 | 100.0% |
Housing Finances in Del Norte
Median Income by Occupancy in Del Norte
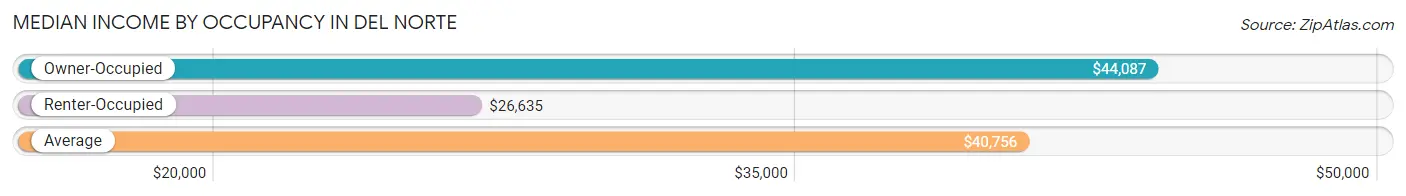
| Occupancy Type | # Households | Median Income |
| Owner-Occupied | 689 (76.6%) | $44,087 |
| Renter-Occupied | 211 (23.4%) | $26,635 |
| Average | 900 (100.0%) | $40,756 |
Occupancy by Householder Income Bracket in Del Norte
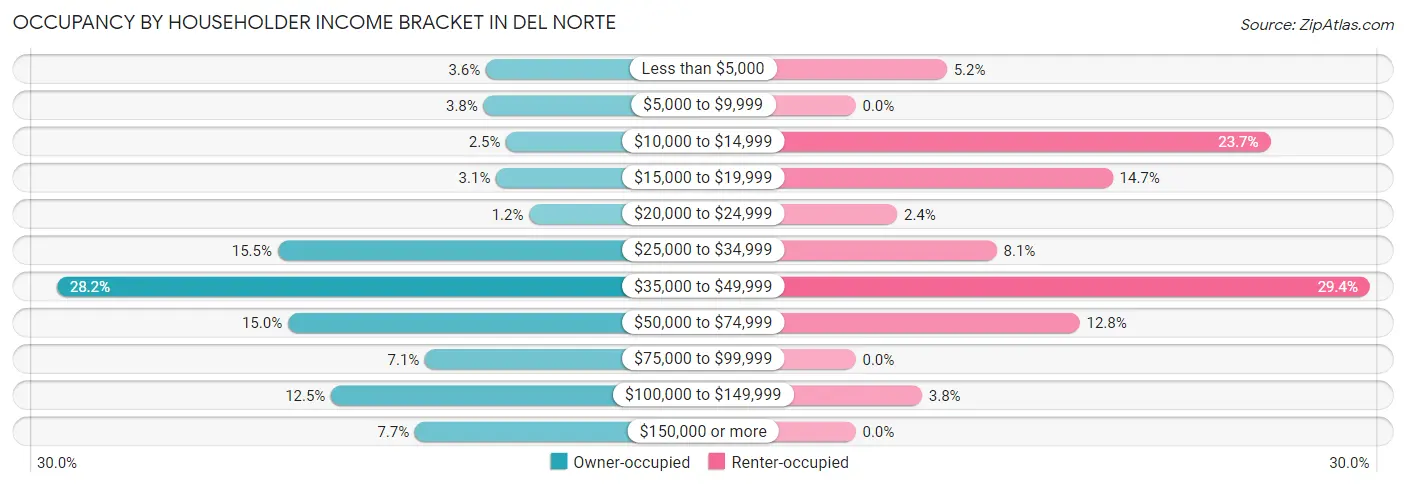
| Income Bracket | Owner-occupied | Renter-occupied |
| Less than $5,000 | 25 (3.6%) | 11 (5.2%) |
| $5,000 to $9,999 | 26 (3.8%) | 0 (0.0%) |
| $10,000 to $14,999 | 17 (2.5%) | 50 (23.7%) |
| $15,000 to $19,999 | 21 (3.0%) | 31 (14.7%) |
| $20,000 to $24,999 | 8 (1.2%) | 5 (2.4%) |
| $25,000 to $34,999 | 107 (15.5%) | 17 (8.1%) |
| $35,000 to $49,999 | 194 (28.2%) | 62 (29.4%) |
| $50,000 to $74,999 | 103 (14.9%) | 27 (12.8%) |
| $75,000 to $99,999 | 49 (7.1%) | 0 (0.0%) |
| $100,000 to $149,999 | 86 (12.5%) | 8 (3.8%) |
| $150,000 or more | 53 (7.7%) | 0 (0.0%) |
| Total | 689 (100.0%) | 211 (100.0%) |
Monthly Housing Cost Tiers in Del Norte
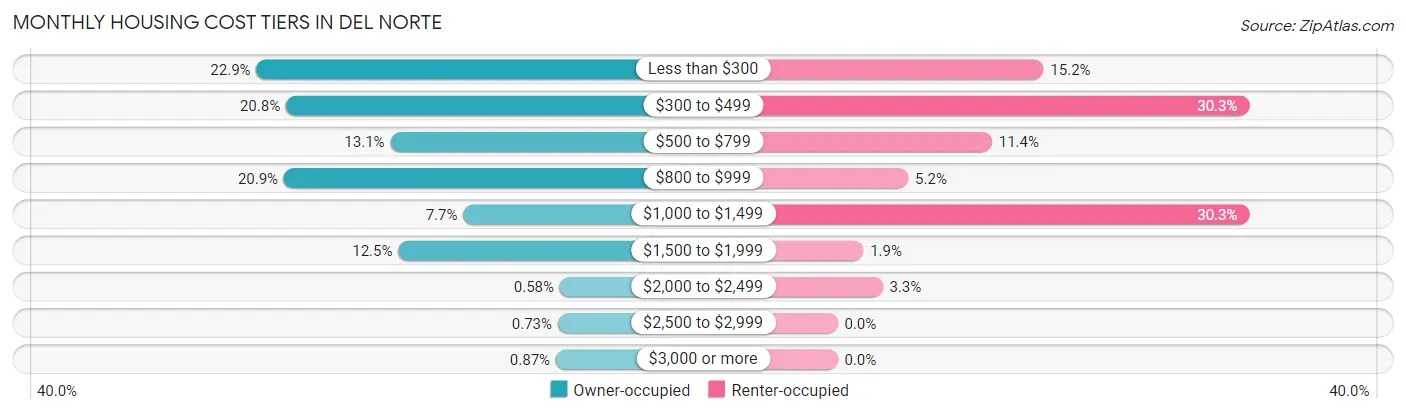
| Monthly Cost | Owner-occupied | Renter-occupied |
| Less than $300 | 158 (22.9%) | 32 (15.2%) |
| $300 to $499 | 143 (20.7%) | 64 (30.3%) |
| $500 to $799 | 90 (13.1%) | 24 (11.4%) |
| $800 to $999 | 144 (20.9%) | 11 (5.2%) |
| $1,000 to $1,499 | 53 (7.7%) | 64 (30.3%) |
| $1,500 to $1,999 | 86 (12.5%) | 4 (1.9%) |
| $2,000 to $2,499 | 4 (0.6%) | 7 (3.3%) |
| $2,500 to $2,999 | 5 (0.7%) | 0 (0.0%) |
| $3,000 or more | 6 (0.9%) | 0 (0.0%) |
| Total | 689 (100.0%) | 211 (100.0%) |
Physical Housing Characteristics in Del Norte
Housing Structures in Del Norte
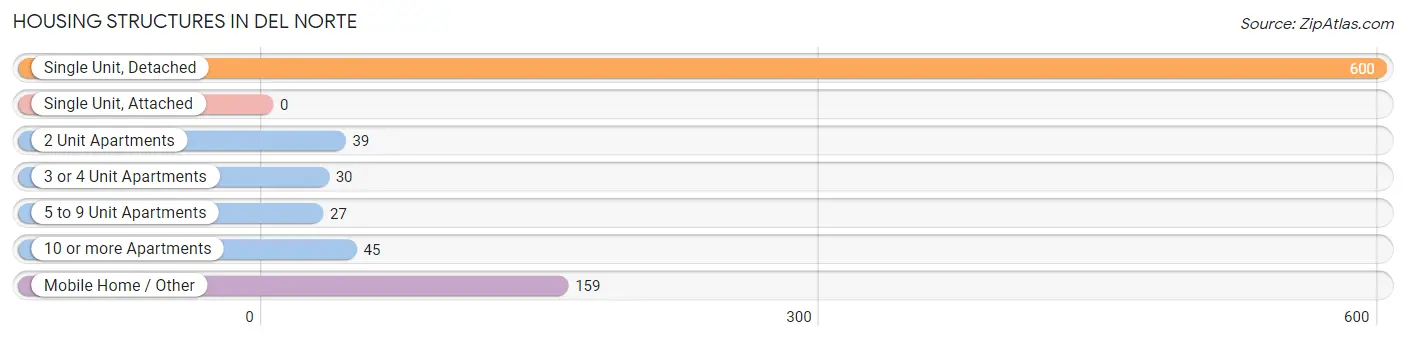
| Structure Type | # Housing Units | % Housing Units |
| Single Unit, Detached | 600 | 66.7% |
| Single Unit, Attached | 0 | 0.0% |
| 2 Unit Apartments | 39 | 4.3% |
| 3 or 4 Unit Apartments | 30 | 3.3% |
| 5 to 9 Unit Apartments | 27 | 3.0% |
| 10 or more Apartments | 45 | 5.0% |
| Mobile Home / Other | 159 | 17.7% |
| Total | 900 | 100.0% |
Housing Structures by Occupancy in Del Norte
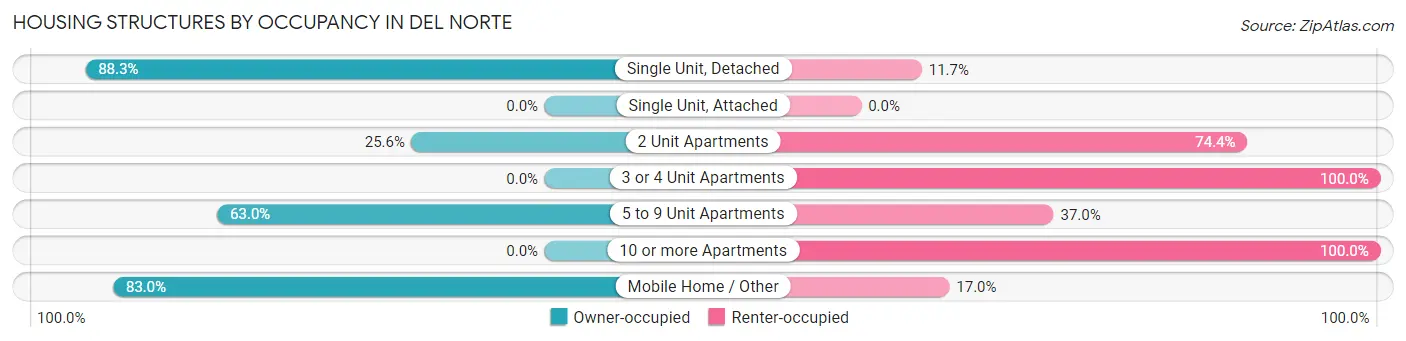
| Structure Type | Owner-occupied | Renter-occupied |
| Single Unit, Detached | 530 (88.3%) | 70 (11.7%) |
| Single Unit, Attached | 0 (0.0%) | 0 (0.0%) |
| 2 Unit Apartments | 10 (25.6%) | 29 (74.4%) |
| 3 or 4 Unit Apartments | 0 (0.0%) | 30 (100.0%) |
| 5 to 9 Unit Apartments | 17 (63.0%) | 10 (37.0%) |
| 10 or more Apartments | 0 (0.0%) | 45 (100.0%) |
| Mobile Home / Other | 132 (83.0%) | 27 (17.0%) |
| Total | 689 (76.6%) | 211 (23.4%) |
Housing Structures by Number of Rooms in Del Norte
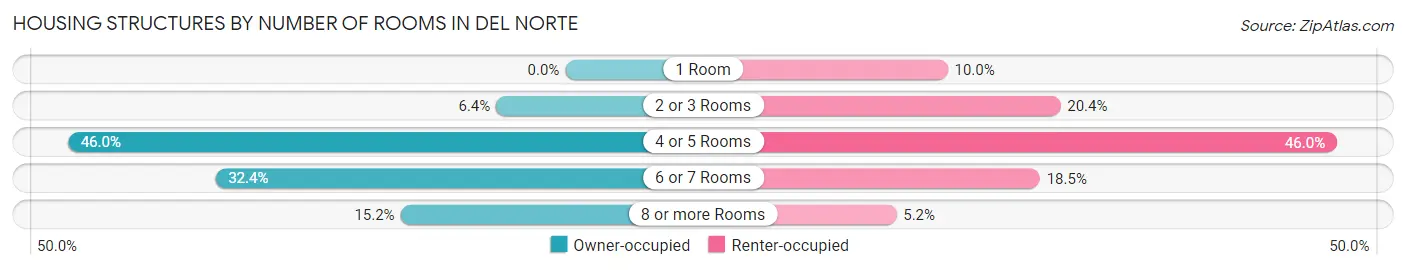
| Number of Rooms | Owner-occupied | Renter-occupied |
| 1 Room | 0 (0.0%) | 21 (10.0%) |
| 2 or 3 Rooms | 44 (6.4%) | 43 (20.4%) |
| 4 or 5 Rooms | 317 (46.0%) | 97 (46.0%) |
| 6 or 7 Rooms | 223 (32.4%) | 39 (18.5%) |
| 8 or more Rooms | 105 (15.2%) | 11 (5.2%) |
| Total | 689 (100.0%) | 211 (100.0%) |
Housing Structure by Heating Type in Del Norte
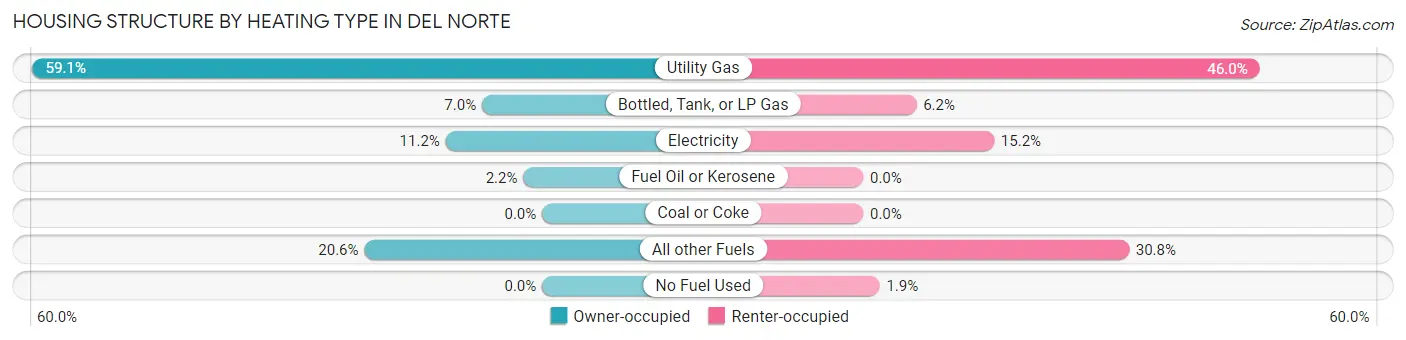
| Heating Type | Owner-occupied | Renter-occupied |
| Utility Gas | 407 (59.1%) | 97 (46.0%) |
| Bottled, Tank, or LP Gas | 48 (7.0%) | 13 (6.2%) |
| Electricity | 77 (11.2%) | 32 (15.2%) |
| Fuel Oil or Kerosene | 15 (2.2%) | 0 (0.0%) |
| Coal or Coke | 0 (0.0%) | 0 (0.0%) |
| All other Fuels | 142 (20.6%) | 65 (30.8%) |
| No Fuel Used | 0 (0.0%) | 4 (1.9%) |
| Total | 689 (100.0%) | 211 (100.0%) |
Household Vehicle Usage in Del Norte
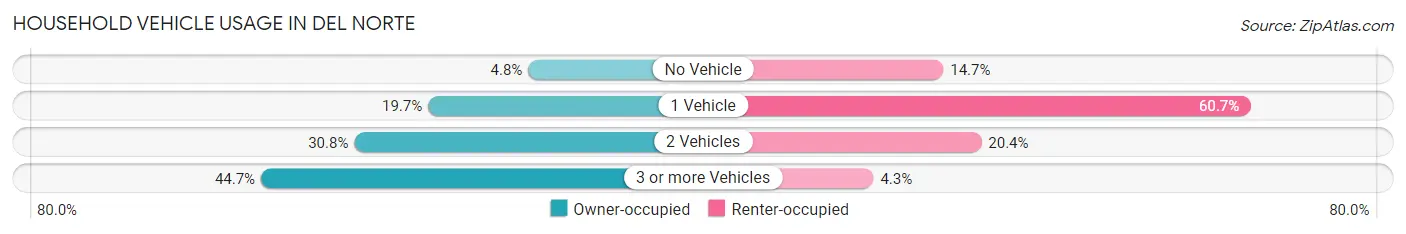
| Vehicles per Household | Owner-occupied | Renter-occupied |
| No Vehicle | 33 (4.8%) | 31 (14.7%) |
| 1 Vehicle | 136 (19.7%) | 128 (60.7%) |
| 2 Vehicles | 212 (30.8%) | 43 (20.4%) |
| 3 or more Vehicles | 308 (44.7%) | 9 (4.3%) |
| Total | 689 (100.0%) | 211 (100.0%) |
Real Estate & Mortgages in Del Norte
Real Estate and Mortgage Overview in Del Norte
| Characteristic | Without Mortgage | With Mortgage |
| Housing Units | 350 | 339 |
| Median Property Value | $87,300 | $164,100 |
| Median Household Income | $34,679 | $53 |
| Monthly Housing Costs | $312 | $6 |
| Real Estate Taxes | $452 | $18 |
Property Value by Mortgage Status in Del Norte
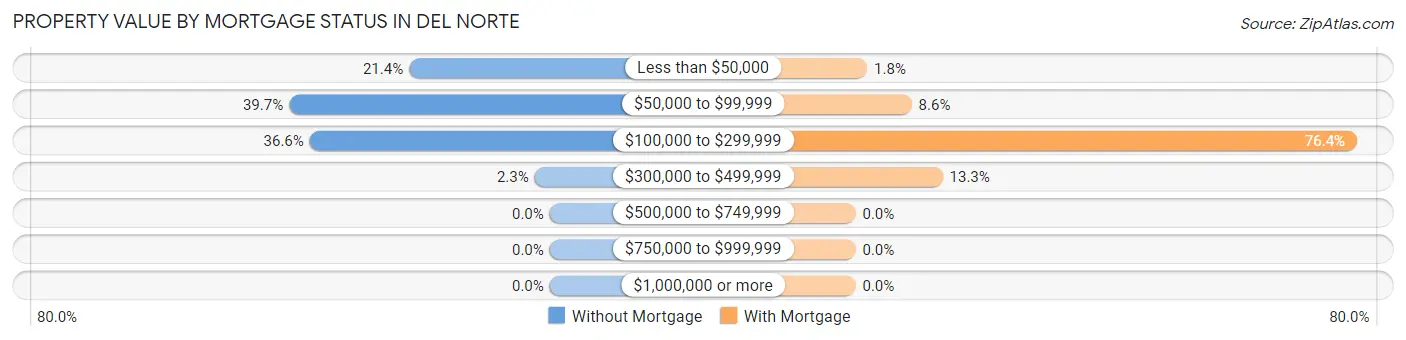
| Property Value | Without Mortgage | With Mortgage |
| Less than $50,000 | 75 (21.4%) | 6 (1.8%) |
| $50,000 to $99,999 | 139 (39.7%) | 29 (8.6%) |
| $100,000 to $299,999 | 128 (36.6%) | 259 (76.4%) |
| $300,000 to $499,999 | 8 (2.3%) | 45 (13.3%) |
| $500,000 to $749,999 | 0 (0.0%) | 0 (0.0%) |
| $750,000 to $999,999 | 0 (0.0%) | 0 (0.0%) |
| $1,000,000 or more | 0 (0.0%) | 0 (0.0%) |
| Total | 350 (100.0%) | 339 (100.0%) |
Household Income by Mortgage Status in Del Norte
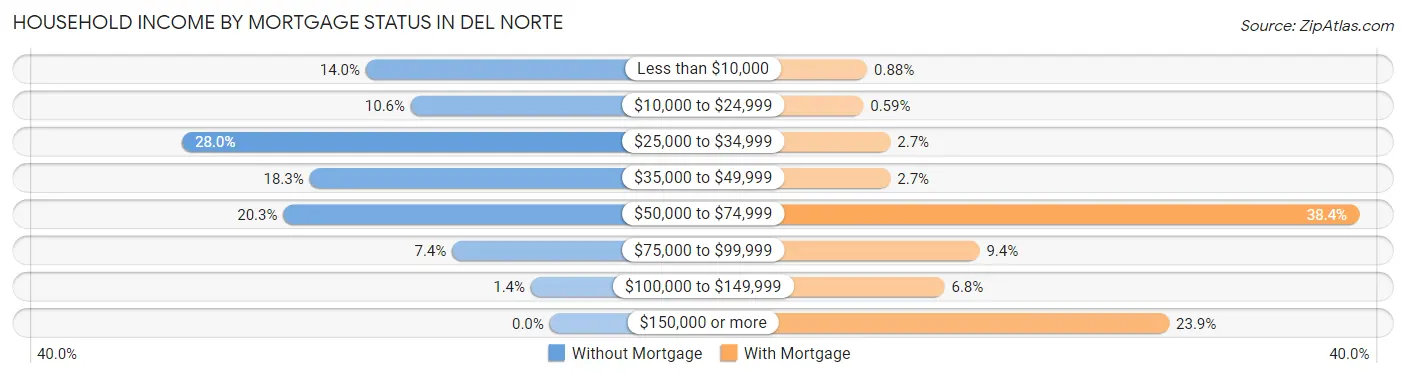
| Household Income | Without Mortgage | With Mortgage |
| Less than $10,000 | 49 (14.0%) | 3 (0.9%) |
| $10,000 to $24,999 | 37 (10.6%) | 2 (0.6%) |
| $25,000 to $34,999 | 98 (28.0%) | 9 (2.6%) |
| $35,000 to $49,999 | 64 (18.3%) | 9 (2.6%) |
| $50,000 to $74,999 | 71 (20.3%) | 130 (38.4%) |
| $75,000 to $99,999 | 26 (7.4%) | 32 (9.4%) |
| $100,000 to $149,999 | 5 (1.4%) | 23 (6.8%) |
| $150,000 or more | 0 (0.0%) | 81 (23.9%) |
| Total | 350 (100.0%) | 339 (100.0%) |
Property Value to Household Income Ratio in Del Norte
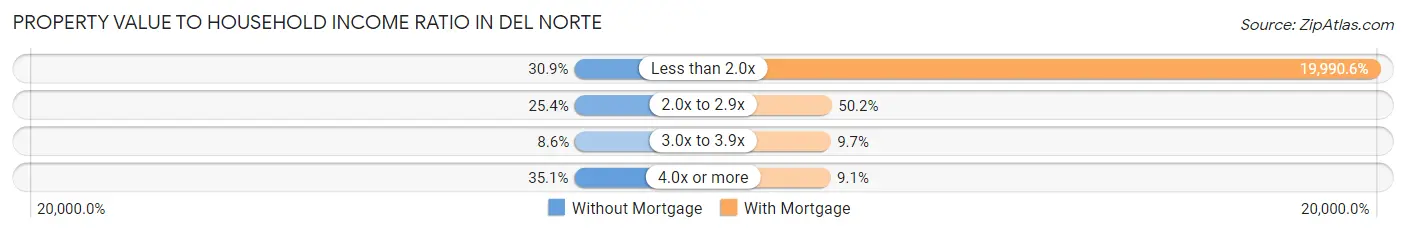
| Value-to-Income Ratio | Without Mortgage | With Mortgage |
| Less than 2.0x | 108 (30.9%) | 67,768 (19,990.6%) |
| 2.0x to 2.9x | 89 (25.4%) | 170 (50.1%) |
| 3.0x to 3.9x | 30 (8.6%) | 33 (9.7%) |
| 4.0x or more | 123 (35.1%) | 31 (9.1%) |
| Total | 350 (100.0%) | 339 (100.0%) |
Real Estate Taxes by Mortgage Status in Del Norte

| Property Taxes | Without Mortgage | With Mortgage |
| Less than $800 | 317 (90.6%) | 0 (0.0%) |
| $800 to $1,499 | 22 (6.3%) | 196 (57.8%) |
| $800 to $1,499 | 1 (0.3%) | 108 (31.9%) |
| Total | 350 (100.0%) | 339 (100.0%) |
Health & Disability in Del Norte
Health Insurance Coverage by Age in Del Norte
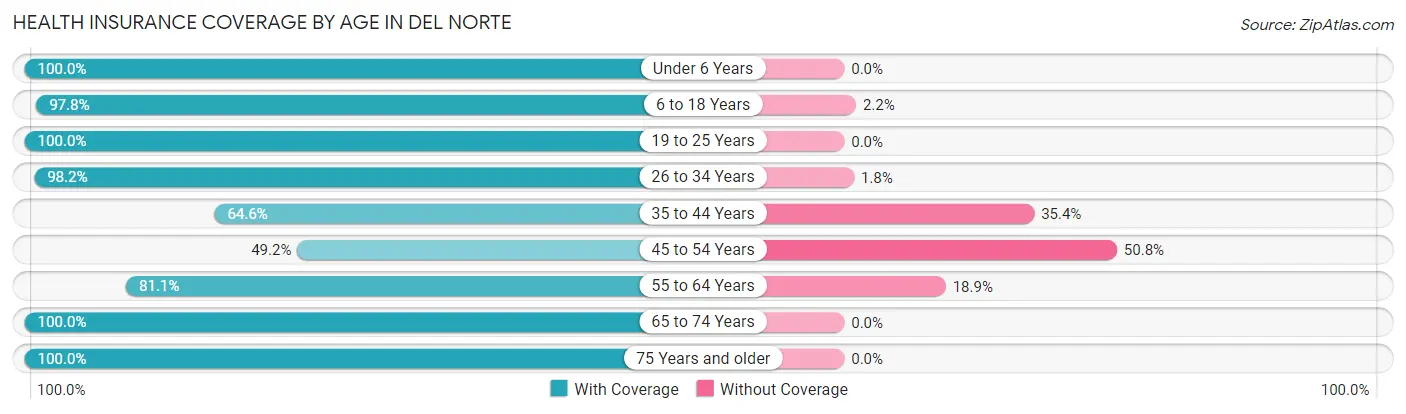
| Age Bracket | With Coverage | Without Coverage |
| Under 6 Years | 116 (100.0%) | 0 (0.0%) |
| 6 to 18 Years | 314 (97.8%) | 7 (2.2%) |
| 19 to 25 Years | 59 (100.0%) | 0 (0.0%) |
| 26 to 34 Years | 109 (98.2%) | 2 (1.8%) |
| 35 to 44 Years | 197 (64.6%) | 108 (35.4%) |
| 45 to 54 Years | 88 (49.2%) | 91 (50.8%) |
| 55 to 64 Years | 180 (81.1%) | 42 (18.9%) |
| 65 to 74 Years | 345 (100.0%) | 0 (0.0%) |
| 75 Years and older | 92 (100.0%) | 0 (0.0%) |
| Total | 1,500 (85.7%) | 250 (14.3%) |
Health Insurance Coverage by Citizenship Status in Del Norte

| Citizenship Status | With Coverage | Without Coverage |
| Native Born | 116 (100.0%) | 0 (0.0%) |
| Foreign Born, Citizen | 314 (97.8%) | 7 (2.2%) |
| Foreign Born, not a Citizen | 59 (100.0%) | 0 (0.0%) |
Health Insurance Coverage by Household Income in Del Norte

| Household Income | With Coverage | Without Coverage |
| Under $25,000 | 184 (86.0%) | 30 (14.0%) |
| $25,000 to $49,999 | 495 (81.6%) | 112 (18.4%) |
| $50,000 to $74,999 | 207 (80.5%) | 50 (19.5%) |
| $75,000 to $99,999 | 97 (78.9%) | 26 (21.1%) |
| $100,000 and over | 507 (97.1%) | 15 (2.9%) |
Public vs Private Health Insurance Coverage by Age in Del Norte
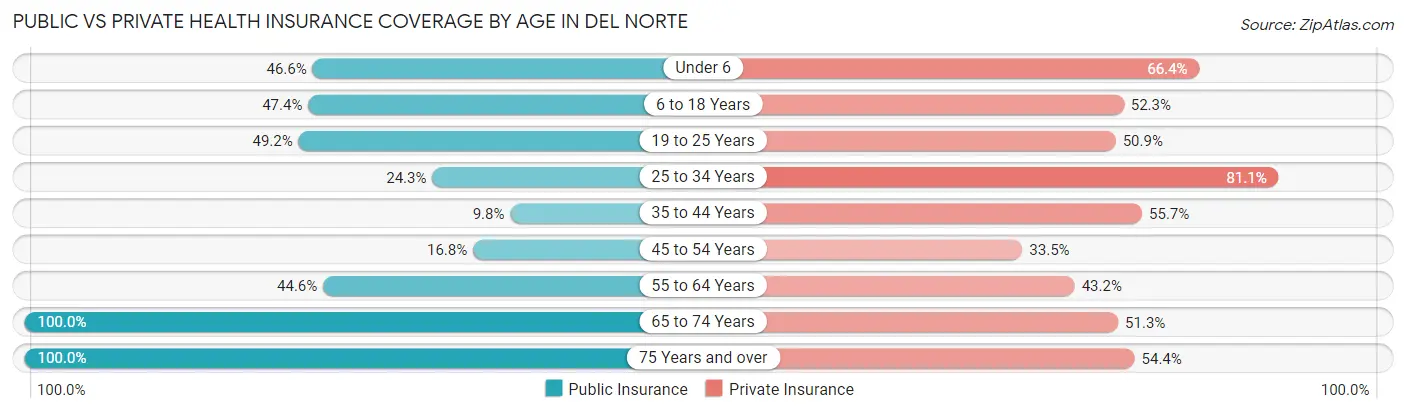
| Age Bracket | Public Insurance | Private Insurance |
| Under 6 | 54 (46.6%) | 77 (66.4%) |
| 6 to 18 Years | 152 (47.3%) | 168 (52.3%) |
| 19 to 25 Years | 29 (49.1%) | 30 (50.8%) |
| 25 to 34 Years | 27 (24.3%) | 90 (81.1%) |
| 35 to 44 Years | 30 (9.8%) | 170 (55.7%) |
| 45 to 54 Years | 30 (16.8%) | 60 (33.5%) |
| 55 to 64 Years | 99 (44.6%) | 96 (43.2%) |
| 65 to 74 Years | 345 (100.0%) | 177 (51.3%) |
| 75 Years and over | 92 (100.0%) | 50 (54.3%) |
| Total | 858 (49.0%) | 918 (52.5%) |
Disability Status by Sex by Age in Del Norte
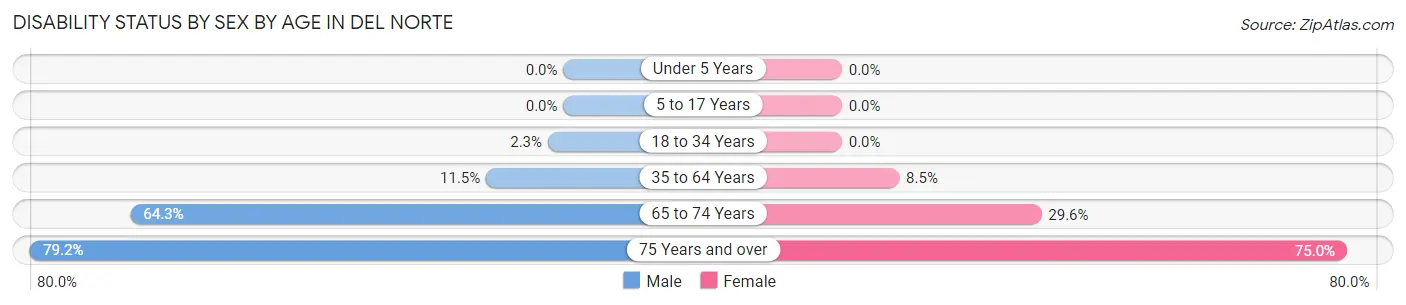
| Age Bracket | Male | Female |
| Under 5 Years | 0 (0.0%) | 0 (0.0%) |
| 5 to 17 Years | 0 (0.0%) | 0 (0.0%) |
| 18 to 34 Years | 2 (2.3%) | 0 (0.0%) |
| 35 to 64 Years | 50 (11.5%) | 23 (8.5%) |
| 65 to 74 Years | 135 (64.3%) | 40 (29.6%) |
| 75 Years and over | 19 (79.2%) | 51 (75.0%) |
Disability Class by Sex by Age in Del Norte
Disability Class: Hearing Difficulty
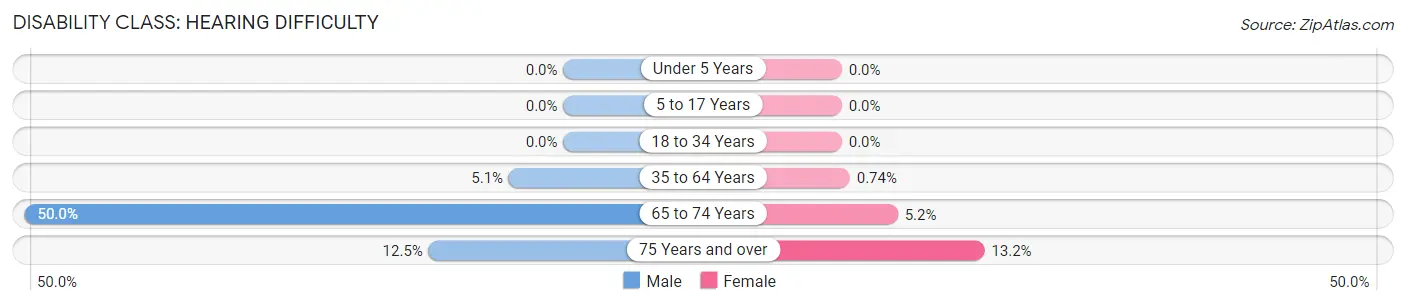
| Age Bracket | Male | Female |
| Under 5 Years | 0 (0.0%) | 0 (0.0%) |
| 5 to 17 Years | 0 (0.0%) | 0 (0.0%) |
| 18 to 34 Years | 0 (0.0%) | 0 (0.0%) |
| 35 to 64 Years | 22 (5.1%) | 2 (0.7%) |
| 65 to 74 Years | 105 (50.0%) | 7 (5.2%) |
| 75 Years and over | 3 (12.5%) | 9 (13.2%) |
Disability Class: Vision Difficulty
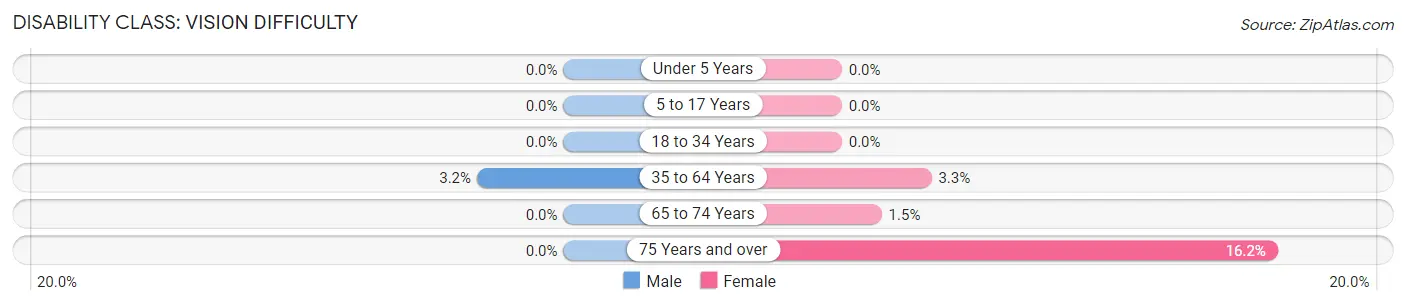
| Age Bracket | Male | Female |
| Under 5 Years | 0 (0.0%) | 0 (0.0%) |
| 5 to 17 Years | 0 (0.0%) | 0 (0.0%) |
| 18 to 34 Years | 0 (0.0%) | 0 (0.0%) |
| 35 to 64 Years | 14 (3.2%) | 9 (3.3%) |
| 65 to 74 Years | 0 (0.0%) | 2 (1.5%) |
| 75 Years and over | 0 (0.0%) | 11 (16.2%) |
Disability Class: Cognitive Difficulty
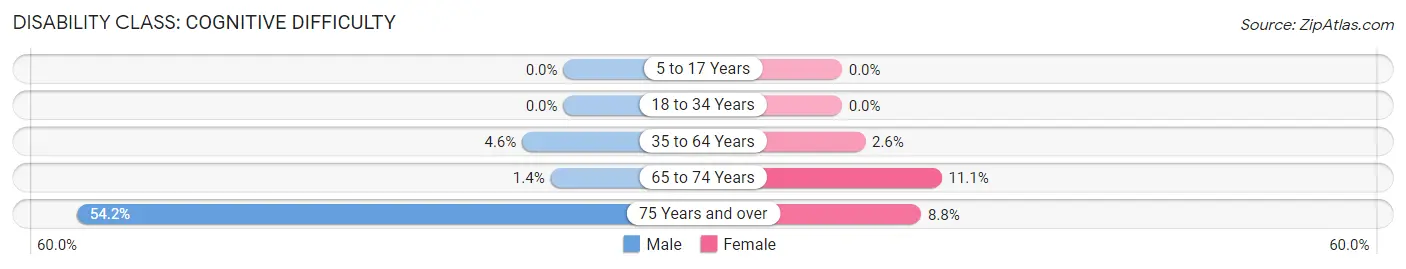
| Age Bracket | Male | Female |
| 5 to 17 Years | 0 (0.0%) | 0 (0.0%) |
| 18 to 34 Years | 0 (0.0%) | 0 (0.0%) |
| 35 to 64 Years | 20 (4.6%) | 7 (2.6%) |
| 65 to 74 Years | 3 (1.4%) | 15 (11.1%) |
| 75 Years and over | 13 (54.2%) | 6 (8.8%) |
Disability Class: Ambulatory Difficulty
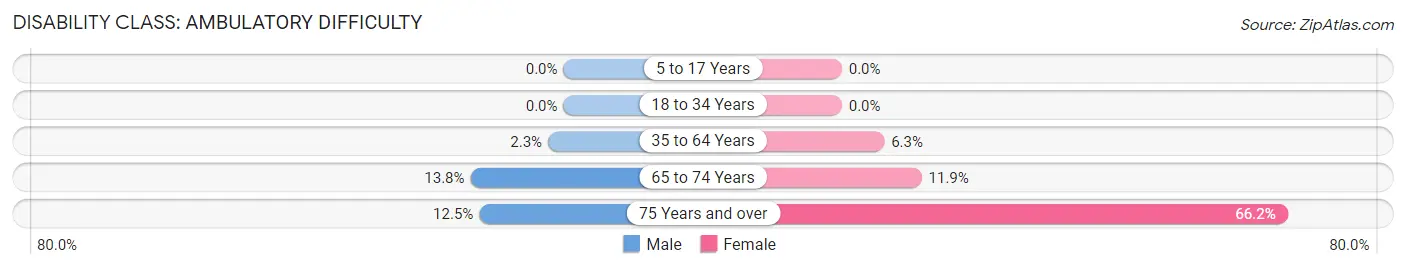
| Age Bracket | Male | Female |
| 5 to 17 Years | 0 (0.0%) | 0 (0.0%) |
| 18 to 34 Years | 0 (0.0%) | 0 (0.0%) |
| 35 to 64 Years | 10 (2.3%) | 17 (6.3%) |
| 65 to 74 Years | 29 (13.8%) | 16 (11.8%) |
| 75 Years and over | 3 (12.5%) | 45 (66.2%) |
Disability Class: Self-Care Difficulty

| Age Bracket | Male | Female |
| 5 to 17 Years | 0 (0.0%) | 0 (0.0%) |
| 18 to 34 Years | 0 (0.0%) | 0 (0.0%) |
| 35 to 64 Years | 8 (1.8%) | 11 (4.1%) |
| 65 to 74 Years | 5 (2.4%) | 15 (11.1%) |
| 75 Years and over | 3 (12.5%) | 0 (0.0%) |
Technology Access in Del Norte
Computing Device Access in Del Norte
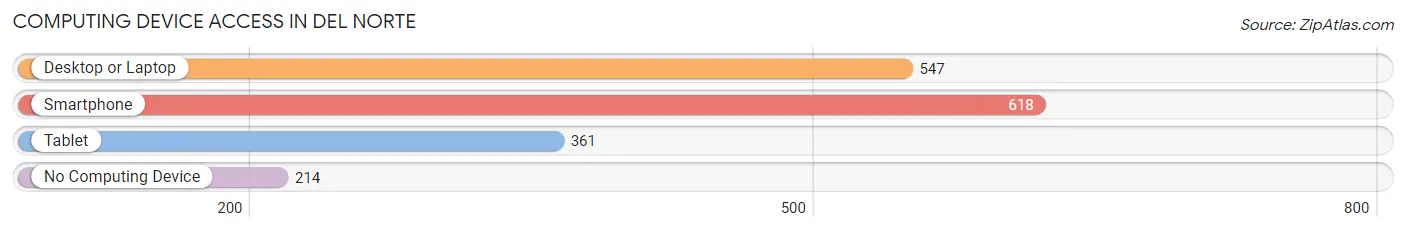
| Device Type | # Households | % Households |
| Desktop or Laptop | 547 | 60.8% |
| Smartphone | 618 | 68.7% |
| Tablet | 361 | 40.1% |
| No Computing Device | 214 | 23.8% |
| Total | 900 | 100.0% |
Internet Access in Del Norte
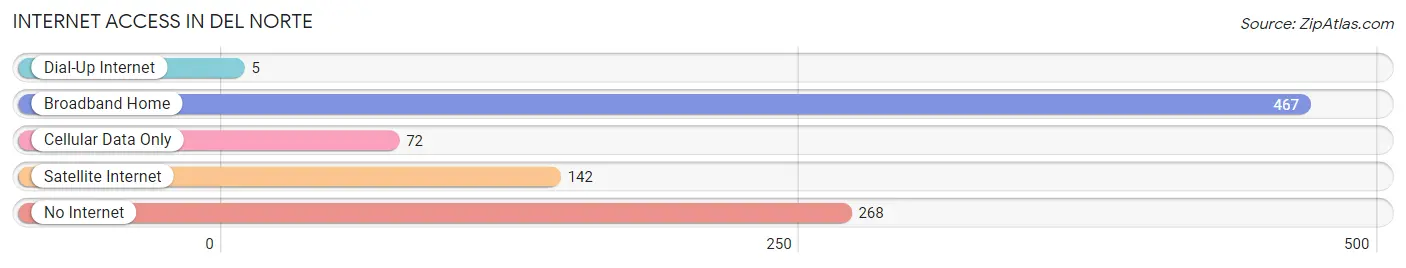
| Internet Type | # Households | % Households |
| Dial-Up Internet | 5 | 0.6% |
| Broadband Home | 467 | 51.9% |
| Cellular Data Only | 72 | 8.0% |
| Satellite Internet | 142 | 15.8% |
| No Internet | 268 | 29.8% |
| Total | 900 | 100.0% |
Del Norte Summary
History
Del Norte, Colorado is a small town located in the San Luis Valley in the south-central part of the state. It is the county seat of Rio Grande County and is located at the intersection of US Highway 160 and Colorado State Highway 112. The town was founded in 1868 by a group of settlers from the nearby town of Monte Vista. The town was named after the nearby Rio Grande River, which was known as the Rio del Norte in Spanish.
The town was originally a farming and ranching community, but in the late 19th century, it became a center for mining and timber operations. The town was also home to a number of saloons and gambling halls, which attracted many visitors from the surrounding area.
In the early 20th century, the town began to experience a decline in population as the mining and timber operations moved away. However, the town was able to remain a viable community due to its proximity to the nearby towns of Monte Vista and Alamosa.
Geography
Del Norte is located in the San Luis Valley, which is a large intermontane basin located in the south-central part of Colorado. The valley is surrounded by the Sangre de Cristo Mountains to the east and the San Juan Mountains to the west. The valley is home to a number of rivers, including the Rio Grande, which flows through the town.
The town is located at an elevation of 7,845 feet (2,390 m) above sea level. The climate is semi-arid, with hot summers and cold winters. The average annual precipitation is 12.5 inches (318 mm).
Economy
The economy of Del Norte is largely based on agriculture and tourism. The town is home to a number of farms and ranches, which produce a variety of crops, including potatoes, alfalfa, and hay. The town is also home to a number of tourist attractions, including the Rio Grande National Forest, the Great Sand Dunes National Park, and the San Luis Valley Museum.
The town is also home to a number of businesses, including restaurants, hotels, and retail stores. The town is served by the Rio Grande County Airport, which offers flights to Denver and other nearby cities.
Demographics
As of the 2010 census, the population of Del Norte was 1,890. The racial makeup of the town was 91.2% White, 0.3% African American, 0.7% Native American, 0.2% Asian, 0.1% Pacific Islander, 5.2% from other races, and 2.3% from two or more races. Hispanic or Latino of any race were 11.3% of the population.
The median income for a household in the town was $31,250, and the median income for a family was $37,500. The per capita income for the town was $17,845. About 16.2% of families and 19.2% of the population were below the poverty line, including 25.2% of those under age 18 and 10.2% of those age 65 or over.
Common Questions
What is Per Capita Income in Del Norte?
Per Capita income in Del Norte is $28,956.
What is the Median Family Income in Del Norte?
Median Family Income in Del Norte is $54,559.
What is the Median Household income in Del Norte?
Median Household Income in Del Norte is $40,756.
What is Income or Wage Gap in Del Norte?
Income or Wage Gap in Del Norte is 5.4%.
Women in Del Norte earn 94.6 cents for every dollar earned by a man.
What is Inequality or Gini Index in Del Norte?
Inequality or Gini Index in Del Norte is 0.42.
What is the Total Population of Del Norte?
Total Population of Del Norte is 1,808.
What is the Total Male Population of Del Norte?
Total Male Population of Del Norte is 1,039.
What is the Total Female Population of Del Norte?
Total Female Population of Del Norte is 769.
What is the Ratio of Males per 100 Females in Del Norte?
There are 135.11 Males per 100 Females in Del Norte.
What is the Ratio of Females per 100 Males in Del Norte?
There are 74.01 Females per 100 Males in Del Norte.
What is the Median Population Age in Del Norte?
Median Population Age in Del Norte is 43.8 Years.
What is the Average Family Size in Del Norte
Average Family Size in Del Norte is 3.2 People.
What is the Average Household Size in Del Norte
Average Household Size in Del Norte is 1.9 People.
How Large is the Labor Force in Del Norte?
There are 858 People in the Labor Forcein in Del Norte.
What is the Percentage of People in the Labor Force in Del Norte?
59.9% of People are in the Labor Force in Del Norte.
What is the Unemployment Rate in Del Norte?
Unemployment Rate in Del Norte is 7.7%.