Vail, CO Map & Demographics
Vail Map
Vail Overview
$80,145
PER CAPITA INCOME
$128,000
AVG FAMILY INCOME
$96,667
AVG HOUSEHOLD INCOME
7.9%
WAGE / INCOME GAP [ % ]
92.1¢/ $1
WAGE / INCOME GAP [ $ ]
0.54
INEQUALITY / GINI INDEX
4,833
TOTAL POPULATION
2,695
MALE POPULATION
2,138
FEMALE POPULATION
126.05
MALES / 100 FEMALES
79.33
FEMALES / 100 MALES
49.1
MEDIAN AGE
2.5
AVG FAMILY SIZE
2.0
AVG HOUSEHOLD SIZE
3,372
LABOR FORCE [ PEOPLE ]
74.2%
PERCENT IN LABOR FORCE
7.6%
UNEMPLOYMENT RATE
Vail Zip Codes
Vail Area Codes
Income in Vail
Income Overview in Vail
Per Capita Income in Vail is $80,145, while median incomes of families and households are $128,000 and $96,667 respectively.
| Characteristic | Number | Measure |
| Per Capita Income | 4,833 | $80,145 |
| Median Family Income | 1,016 | $128,000 |
| Mean Family Income | 1,016 | $223,695 |
| Median Household Income | 2,370 | $96,667 |
| Mean Household Income | 2,370 | $156,182 |
| Income Deficit | 1,016 | $0 |
| Wage / Income Gap (%) | 4,833 | 7.94% |
| Wage / Income Gap ($) | 4,833 | 92.06¢ per $1 |
| Gini / Inequality Index | 4,833 | 0.54 |
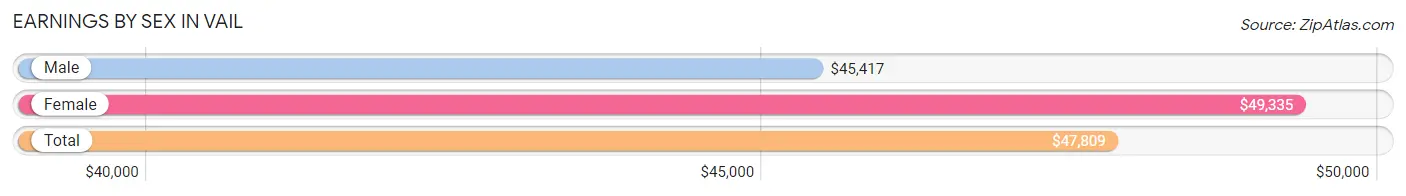
Earnings by Sex in Vail
Average Earnings in Vail are $47,809, $45,417 for men and $49,335 for women, a difference of 7.9%.
| Sex | Number | Average Earnings |
| Male | 2,027 (57.6%) | $45,417 |
| Female | 1,491 (42.4%) | $49,335 |
| Total | 3,518 (100.0%) | $47,809 |
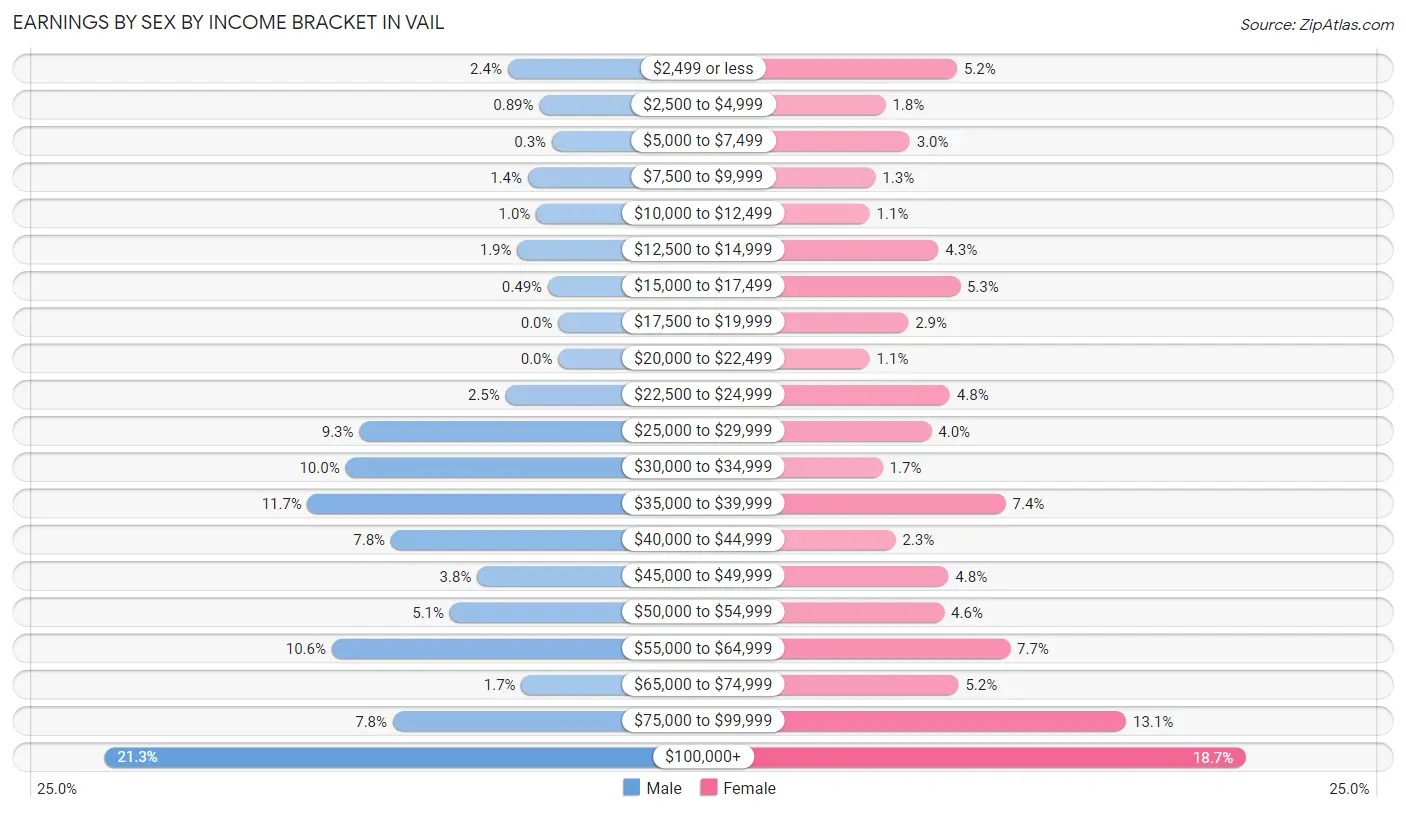
Earnings by Sex by Income Bracket in Vail
The most common earnings brackets in Vail are $100,000+ for men (431 | 21.3%) and $100,000+ for women (278 | 18.6%).
| Income | Male | Female |
| $2,499 or less | 48 (2.4%) | 77 (5.2%) |
| $2,500 to $4,999 | 18 (0.9%) | 27 (1.8%) |
| $5,000 to $7,499 | 6 (0.3%) | 44 (2.9%) |
| $7,500 to $9,999 | 29 (1.4%) | 20 (1.3%) |
| $10,000 to $12,499 | 21 (1.0%) | 16 (1.1%) |
| $12,500 to $14,999 | 39 (1.9%) | 64 (4.3%) |
| $15,000 to $17,499 | 10 (0.5%) | 79 (5.3%) |
| $17,500 to $19,999 | 0 (0.0%) | 43 (2.9%) |
| $20,000 to $22,499 | 0 (0.0%) | 16 (1.1%) |
| $22,500 to $24,999 | 50 (2.5%) | 72 (4.8%) |
| $25,000 to $29,999 | 189 (9.3%) | 59 (4.0%) |
| $30,000 to $34,999 | 202 (10.0%) | 25 (1.7%) |
| $35,000 to $39,999 | 238 (11.7%) | 111 (7.4%) |
| $40,000 to $44,999 | 159 (7.8%) | 34 (2.3%) |
| $45,000 to $49,999 | 77 (3.8%) | 71 (4.8%) |
| $50,000 to $54,999 | 103 (5.1%) | 68 (4.6%) |
| $55,000 to $64,999 | 215 (10.6%) | 114 (7.6%) |
| $65,000 to $74,999 | 35 (1.7%) | 78 (5.2%) |
| $75,000 to $99,999 | 157 (7.7%) | 195 (13.1%) |
| $100,000+ | 431 (21.3%) | 278 (18.6%) |
| Total | 2,027 (100.0%) | 1,491 (100.0%) |
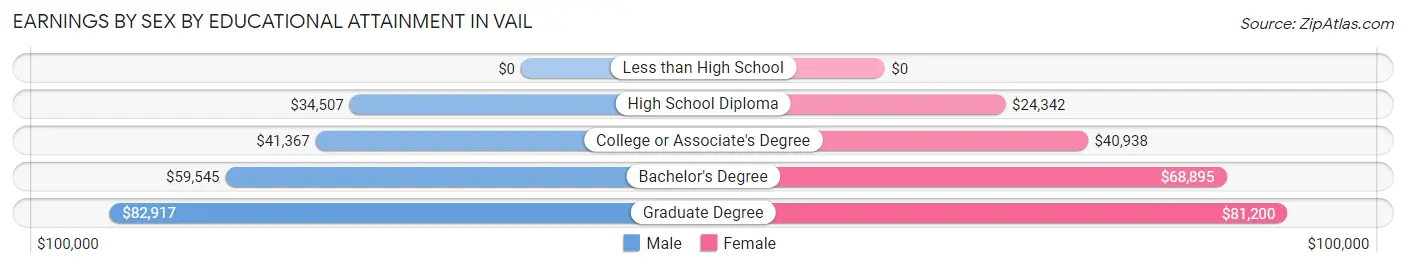
Earnings by Sex by Educational Attainment in Vail
Average earnings in Vail are $50,579 for men and $58,750 for women, a difference of 13.9%. Men with an educational attainment of graduate degree enjoy the highest average annual earnings of $82,917, while those with high school diploma education earn the least with $34,507. Women with an educational attainment of graduate degree earn the most with the average annual earnings of $81,200, while those with high school diploma education have the smallest earnings of $24,342.
| Educational Attainment | Male Income | Female Income |
| Less than High School | - | - |
| High School Diploma | $34,507 | $24,342 |
| College or Associate's Degree | $41,367 | $40,938 |
| Bachelor's Degree | $59,545 | $68,895 |
| Graduate Degree | $82,917 | $81,200 |
| Total | $50,579 | $58,750 |
Family Income in Vail
Family Income Brackets in Vail
According to the Vail family income data, there are 365 families falling into the $200,000+ income range, which is the most common income bracket and makes up 35.9% of all families.
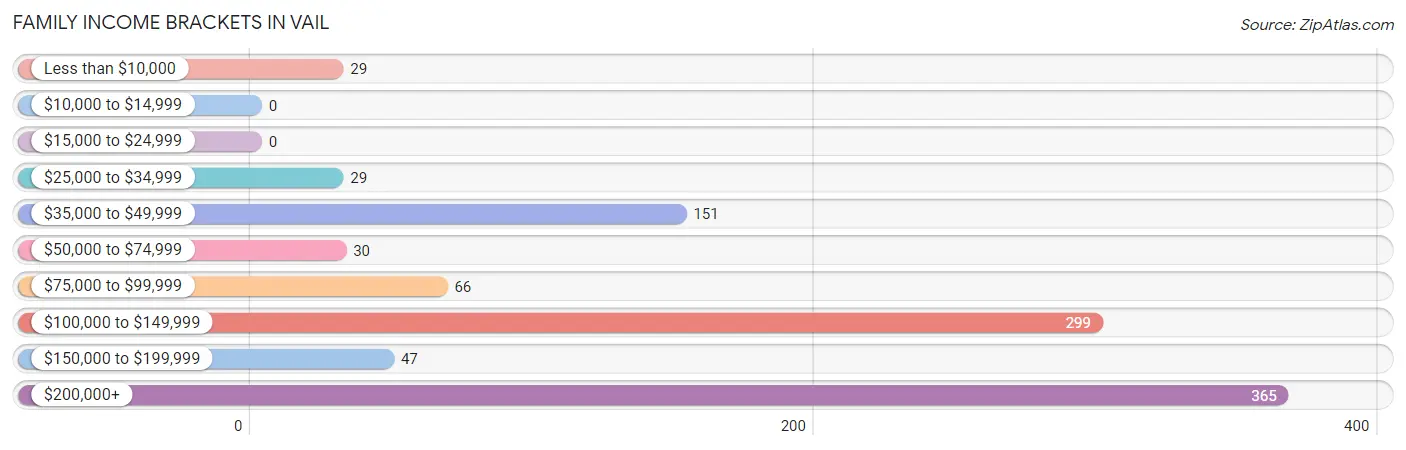
| Income Bracket | # Families | % Families |
| Less than $10,000 | 29 | 2.9% |
| $10,000 to $14,999 | 0 | 0.0% |
| $15,000 to $24,999 | 0 | 0.0% |
| $25,000 to $34,999 | 29 | 2.9% |
| $35,000 to $49,999 | 151 | 14.9% |
| $50,000 to $74,999 | 30 | 3.0% |
| $75,000 to $99,999 | 66 | 6.5% |
| $100,000 to $149,999 | 299 | 29.4% |
| $150,000 to $199,999 | 47 | 4.6% |
| $200,000+ | 365 | 35.9% |
Family Income by Famaliy Size in Vail
3-person families (100 | 9.8%) account for the highest median family income in Vail with $250,001 per family, while 3-person families (100 | 9.8%) have the highest median income of $83,334 per family member.
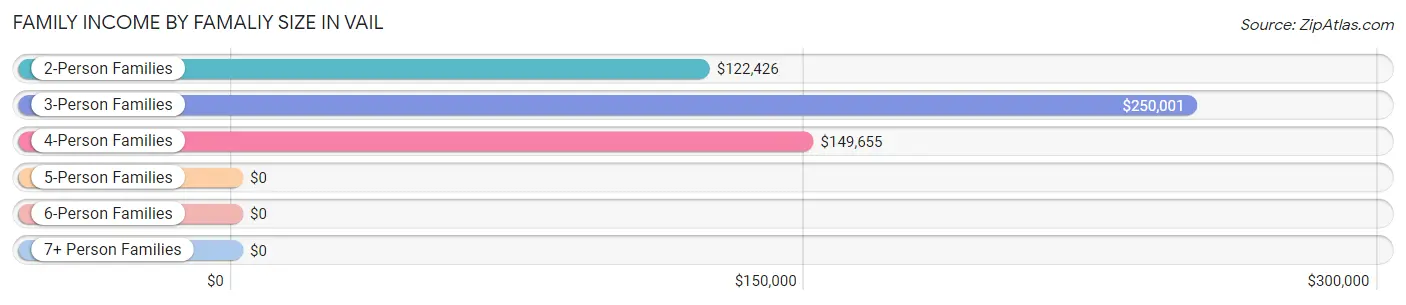
| Income Bracket | # Families | Median Income |
| 2-Person Families | 786 (77.4%) | $122,426 |
| 3-Person Families | 100 (9.8%) | $250,001 |
| 4-Person Families | 98 (9.7%) | $149,655 |
| 5-Person Families | 22 (2.2%) | $0 |
| 6-Person Families | 10 (1.0%) | $0 |
| 7+ Person Families | 0 (0.0%) | $0 |
| Total | 1,016 (100.0%) | $128,000 |
Family Income by Number of Earners in Vail
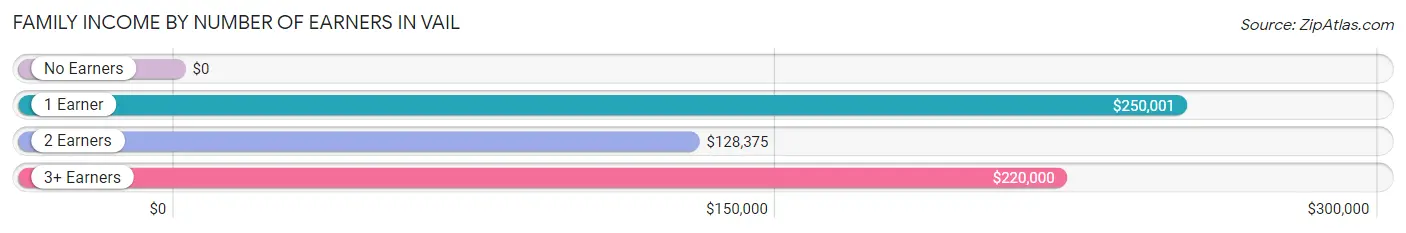
| Number of Earners | # Families | Median Income |
| No Earners | 223 (22.0%) | $0 |
| 1 Earner | 180 (17.7%) | $250,001 |
| 2 Earners | 563 (55.4%) | $128,375 |
| 3+ Earners | 50 (4.9%) | $220,000 |
| Total | 1,016 (100.0%) | $128,000 |
Household Income in Vail
Household Income Brackets in Vail
With 512 households falling in the category, the $100,000 to $149,999 income range is the most frequent in Vail, accounting for 21.6% of all households. In contrast, only 40 households (1.7%) fall into the less than $10,000 income bracket, making it the least populous group.
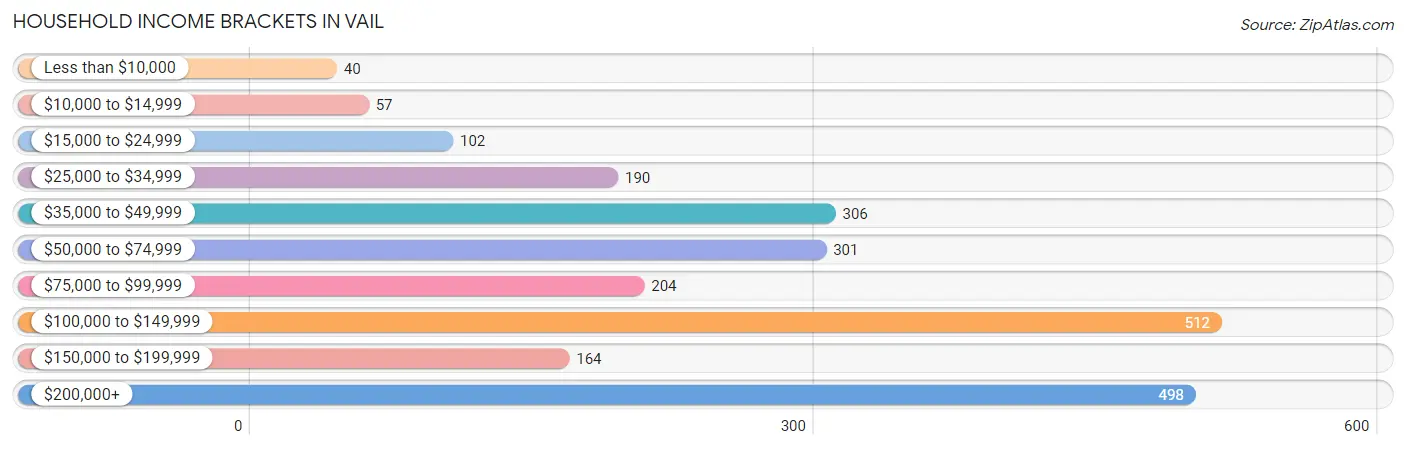
| Income Bracket | # Households | % Households |
| Less than $10,000 | 40 | 1.7% |
| $10,000 to $14,999 | 57 | 2.4% |
| $15,000 to $24,999 | 102 | 4.3% |
| $25,000 to $34,999 | 190 | 8.0% |
| $35,000 to $49,999 | 306 | 12.9% |
| $50,000 to $74,999 | 301 | 12.7% |
| $75,000 to $99,999 | 204 | 8.6% |
| $100,000 to $149,999 | 512 | 21.6% |
| $150,000 to $199,999 | 164 | 6.9% |
| $200,000+ | 498 | 21.0% |
Household Income by Householder Age in Vail
The median household income in Vail is $96,667, with the highest median household income of $116,713 found in the 45 to 64 years age bracket for the primary householder. A total of 955 households (40.3%) fall into this category. Meanwhile, the 15 to 24 years age bracket for the primary householder has the lowest median household income of $0, with 116 households (4.9%) in this group.
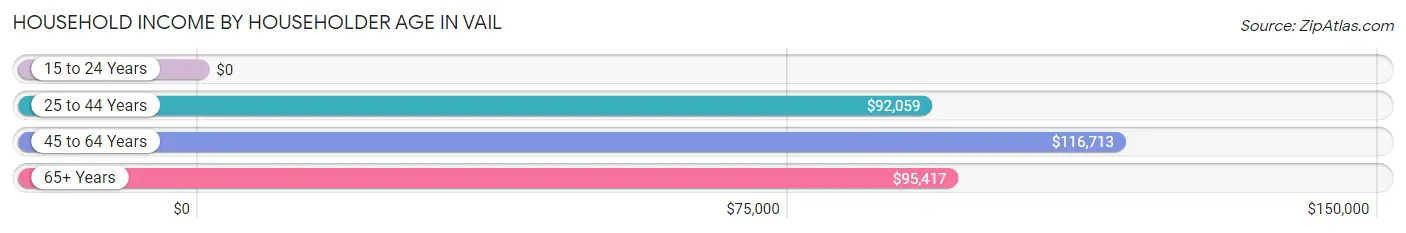
| Income Bracket | # Households | Median Income |
| 15 to 24 Years | 116 (4.9%) | $0 |
| 25 to 44 Years | 766 (32.3%) | $92,059 |
| 45 to 64 Years | 955 (40.3%) | $116,713 |
| 65+ Years | 533 (22.5%) | $95,417 |
| Total | 2,370 (100.0%) | $96,667 |
Poverty in Vail
Income Below Poverty by Sex and Age in Vail
With 4.1% poverty level for males and 7.3% for females among the residents of Vail, 18 to 24 year old males and 16 and 17 year old females are the most vulnerable to poverty, with 51 males (28.5%) and 7 females (21.2%) in their respective age groups living below the poverty level.
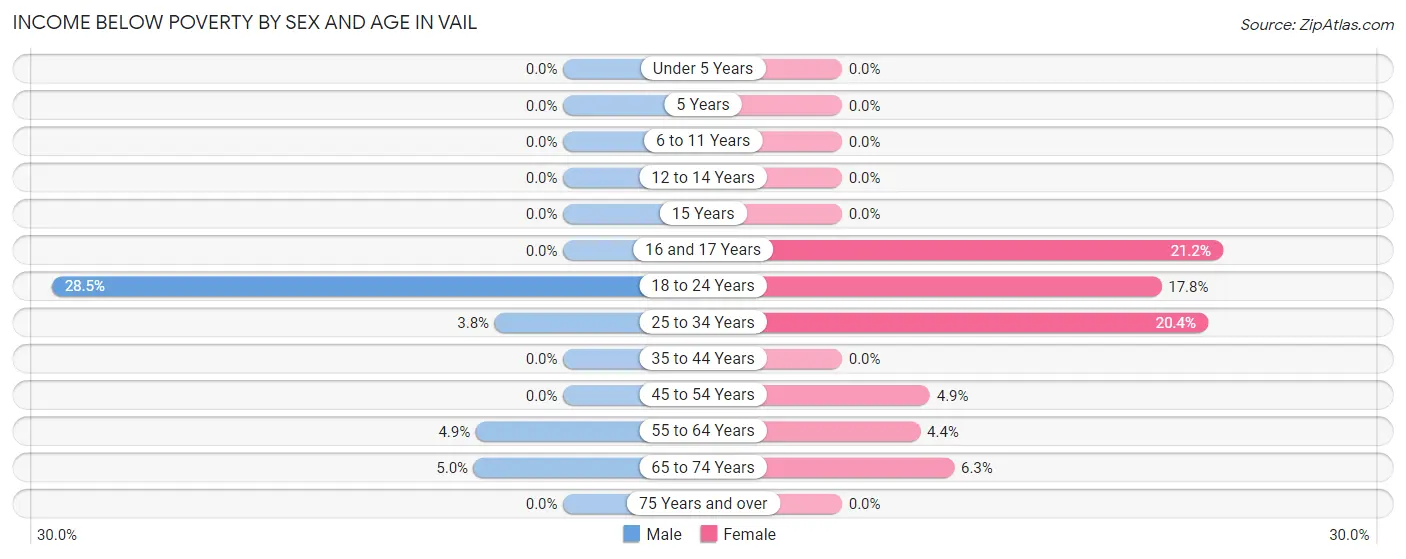
| Age Bracket | Male | Female |
| Under 5 Years | 0 (0.0%) | 0 (0.0%) |
| 5 Years | 0 (0.0%) | 0 (0.0%) |
| 6 to 11 Years | 0 (0.0%) | 0 (0.0%) |
| 12 to 14 Years | 0 (0.0%) | 0 (0.0%) |
| 15 Years | 0 (0.0%) | 0 (0.0%) |
| 16 and 17 Years | 0 (0.0%) | 7 (21.2%) |
| 18 to 24 Years | 51 (28.5%) | 45 (17.8%) |
| 25 to 34 Years | 20 (3.8%) | 54 (20.4%) |
| 35 to 44 Years | 0 (0.0%) | 0 (0.0%) |
| 45 to 54 Years | 0 (0.0%) | 14 (4.9%) |
| 55 to 64 Years | 27 (4.9%) | 21 (4.4%) |
| 65 to 74 Years | 12 (5.0%) | 15 (6.2%) |
| 75 Years and over | 0 (0.0%) | 0 (0.0%) |
| Total | 110 (4.1%) | 156 (7.3%) |
Income Above Poverty by Sex and Age in Vail
According to the poverty statistics in Vail, males aged under 5 years and females aged under 5 years are the age groups that are most secure financially, with 100.0% of males and 100.0% of females in these age groups living above the poverty line.
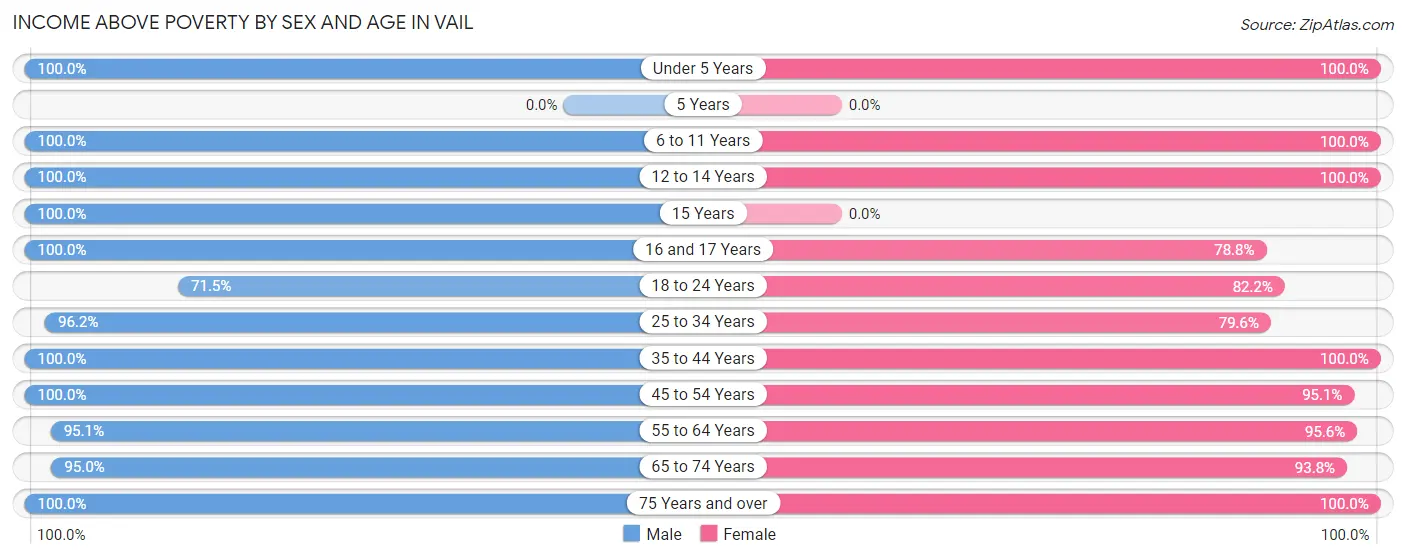
| Age Bracket | Male | Female |
| Under 5 Years | 25 (100.0%) | 39 (100.0%) |
| 5 Years | 0 (0.0%) | 0 (0.0%) |
| 6 to 11 Years | 64 (100.0%) | 31 (100.0%) |
| 12 to 14 Years | 80 (100.0%) | 25 (100.0%) |
| 15 Years | 25 (100.0%) | 0 (0.0%) |
| 16 and 17 Years | 9 (100.0%) | 26 (78.8%) |
| 18 to 24 Years | 128 (71.5%) | 208 (82.2%) |
| 25 to 34 Years | 505 (96.2%) | 211 (79.6%) |
| 35 to 44 Years | 395 (100.0%) | 296 (100.0%) |
| 45 to 54 Years | 418 (100.0%) | 272 (95.1%) |
| 55 to 64 Years | 529 (95.1%) | 461 (95.6%) |
| 65 to 74 Years | 229 (95.0%) | 225 (93.8%) |
| 75 Years and over | 178 (100.0%) | 188 (100.0%) |
| Total | 2,585 (95.9%) | 1,982 (92.7%) |
Income Below Poverty Among Married-Couple Families in Vail
The poverty statistics for married-couple families in Vail show that 2.6% or 25 of the total 964 families live below the poverty line. Families with no children have the highest poverty rate of 3.3%, comprising of 25 families. On the other hand, families with 1 or 2 children have the lowest poverty rate of 0.0%, which includes 0 families.
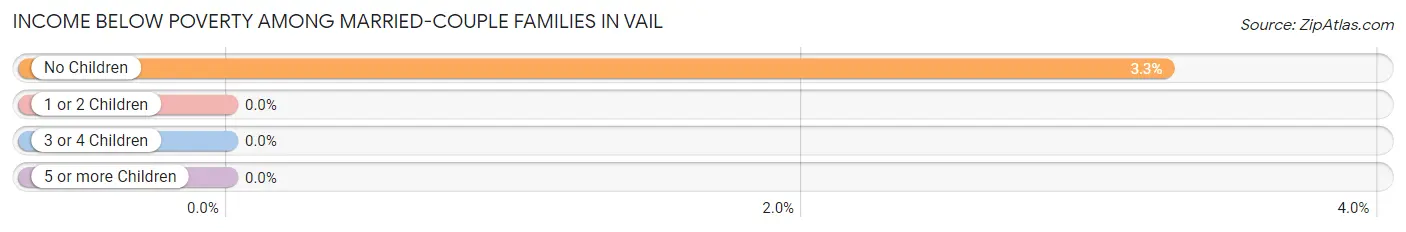
| Children | Above Poverty | Below Poverty |
| No Children | 742 (96.7%) | 25 (3.3%) |
| 1 or 2 Children | 197 (100.0%) | 0 (0.0%) |
| 3 or 4 Children | 0 (0.0%) | 0 (0.0%) |
| 5 or more Children | 0 (0.0%) | 0 (0.0%) |
| Total | 939 (97.4%) | 25 (2.6%) |
Income Below Poverty Among Single-Parent Households in Vail
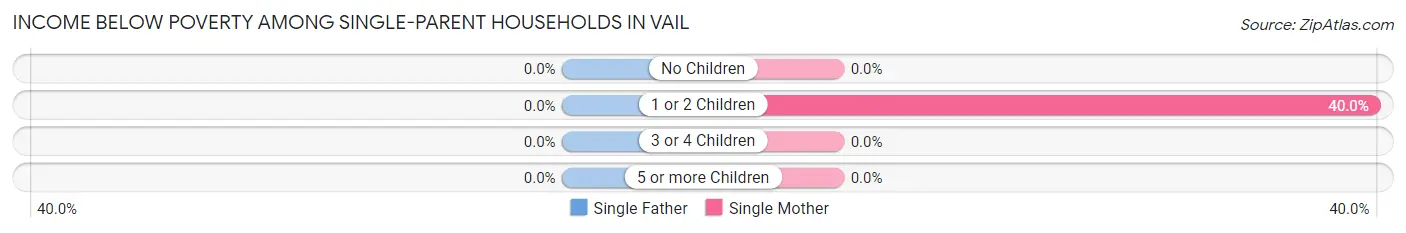
| Children | Single Father | Single Mother |
| No Children | 0 (0.0%) | 0 (0.0%) |
| 1 or 2 Children | 0 (0.0%) | 4 (40.0%) |
| 3 or 4 Children | 0 (0.0%) | 0 (0.0%) |
| 5 or more Children | 0 (0.0%) | 0 (0.0%) |
| Total | 0 (0.0%) | 4 (40.0%) |
Income Below Poverty Among Married-Couple vs Single-Parent Households in Vail
The poverty data for Vail shows that 25 of the married-couple family households (2.6%) and 4 of the single-parent households (7.7%) are living below the poverty level. Within the married-couple family households, those with no children have the highest poverty rate, with 25 households (3.3%) falling below the poverty line. Among the single-parent households, those with 1 or 2 children have the highest poverty rate, with 4 household (21.0%) living below poverty.
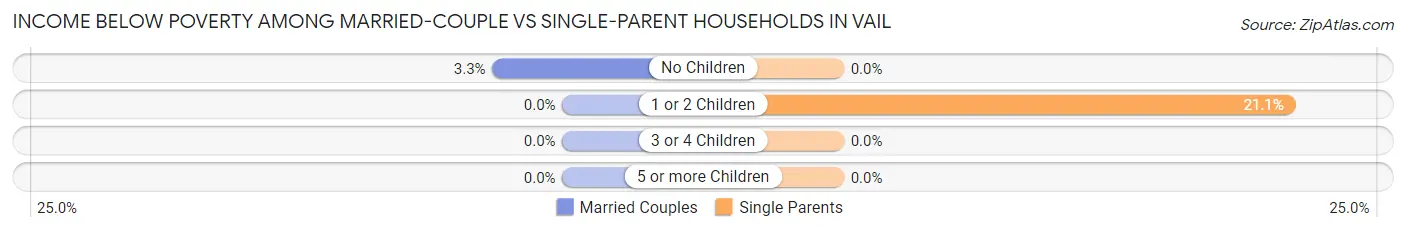
| Children | Married-Couple Families | Single-Parent Households |
| No Children | 25 (3.3%) | 0 (0.0%) |
| 1 or 2 Children | 0 (0.0%) | 4 (21.0%) |
| 3 or 4 Children | 0 (0.0%) | 0 (0.0%) |
| 5 or more Children | 0 (0.0%) | 0 (0.0%) |
| Total | 25 (2.6%) | 4 (7.7%) |
Race in Vail
The most populous races in Vail are White / Caucasian (4,562 | 94.4%), Two or more Races (217 | 4.5%), and Hispanic or Latino (167 | 3.5%).
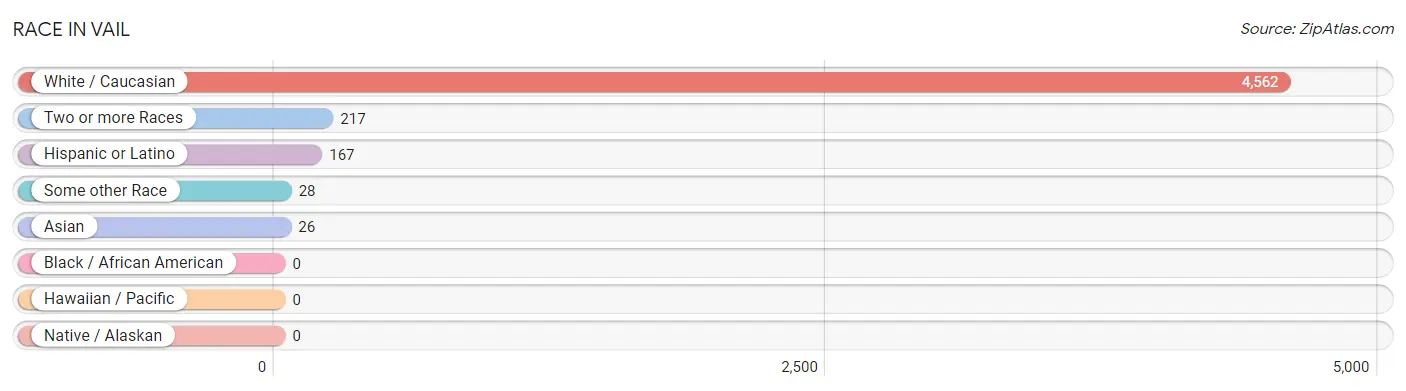
| Race | # Population | % Population |
| Asian | 26 | 0.5% |
| Black / African American | 0 | 0.0% |
| Hawaiian / Pacific | 0 | 0.0% |
| Hispanic or Latino | 167 | 3.5% |
| Native / Alaskan | 0 | 0.0% |
| White / Caucasian | 4,562 | 94.4% |
| Two or more Races | 217 | 4.5% |
| Some other Race | 28 | 0.6% |
| Total | 4,833 | 100.0% |
Ancestry in Vail
The most populous ancestries reported in Vail are German (982 | 20.3%), Irish (659 | 13.6%), English (525 | 10.9%), Italian (251 | 5.2%), and Greek (202 | 4.2%), together accounting for 54.2% of all Vail residents.
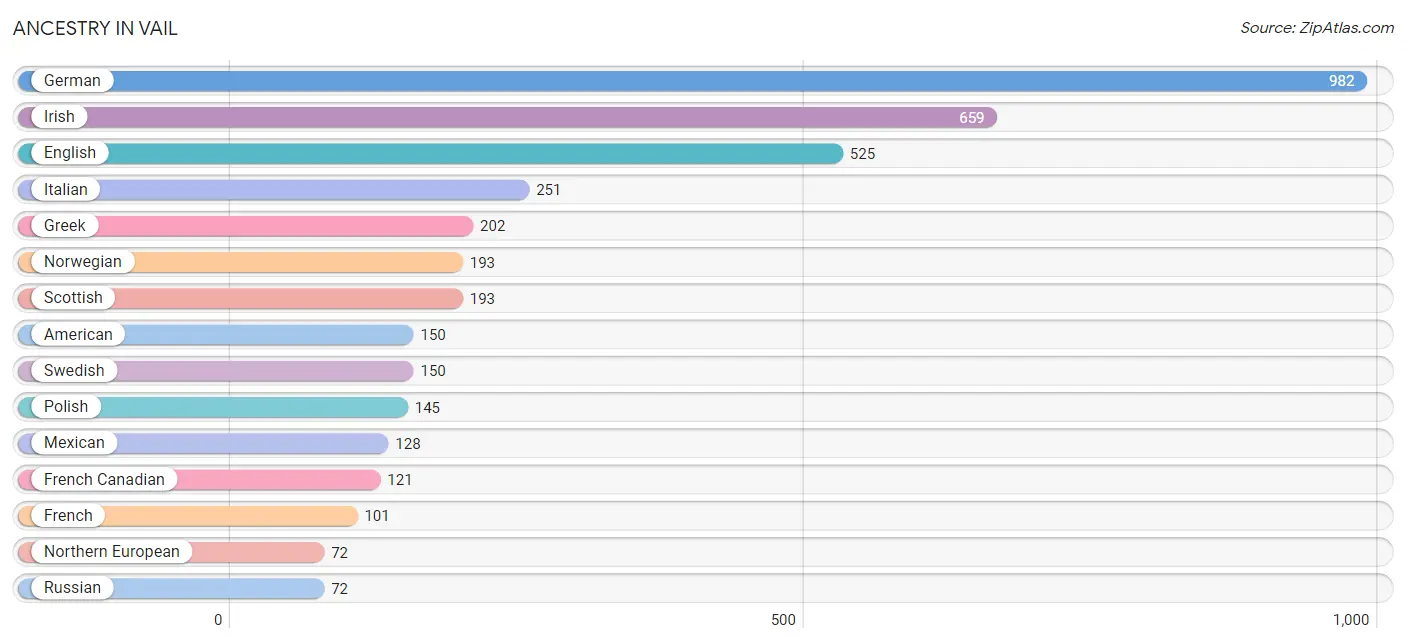
| Ancestry | # Population | % Population |
| Albanian | 6 | 0.1% |
| American | 150 | 3.1% |
| Arab | 4 | 0.1% |
| Argentinean | 5 | 0.1% |
| Australian | 27 | 0.6% |
| Austrian | 5 | 0.1% |
| Bhutanese | 20 | 0.4% |
| British | 37 | 0.8% |
| Burmese | 5 | 0.1% |
| Canadian | 11 | 0.2% |
| Central American | 21 | 0.4% |
| Croatian | 24 | 0.5% |
| Cuban | 6 | 0.1% |
| Czech | 55 | 1.1% |
| Danish | 55 | 1.1% |
| Dutch | 58 | 1.2% |
| Eastern European | 44 | 0.9% |
| English | 525 | 10.9% |
| European | 65 | 1.3% |
| French | 101 | 2.1% |
| French Canadian | 121 | 2.5% |
| German | 982 | 20.3% |
| Greek | 202 | 4.2% |
| Hungarian | 36 | 0.7% |
| Indian (Asian) | 7 | 0.1% |
| Irish | 659 | 13.6% |
| Italian | 251 | 5.2% |
| Lithuanian | 31 | 0.6% |
| Mexican | 128 | 2.6% |
| Moroccan | 4 | 0.1% |
| Nicaraguan | 10 | 0.2% |
| Northern European | 72 | 1.5% |
| Norwegian | 193 | 4.0% |
| Polish | 145 | 3.0% |
| Portuguese | 25 | 0.5% |
| Puerto Rican | 7 | 0.1% |
| Russian | 72 | 1.5% |
| Salvadoran | 11 | 0.2% |
| Scandinavian | 8 | 0.2% |
| Scotch-Irish | 65 | 1.3% |
| Scottish | 193 | 4.0% |
| Slavic | 12 | 0.3% |
| Slovak | 5 | 0.1% |
| South American | 5 | 0.1% |
| Sri Lankan | 14 | 0.3% |
| Swedish | 150 | 3.1% |
| Swiss | 29 | 0.6% |
| Ukrainian | 22 | 0.5% |
| Welsh | 6 | 0.1% | View All 49 Rows |
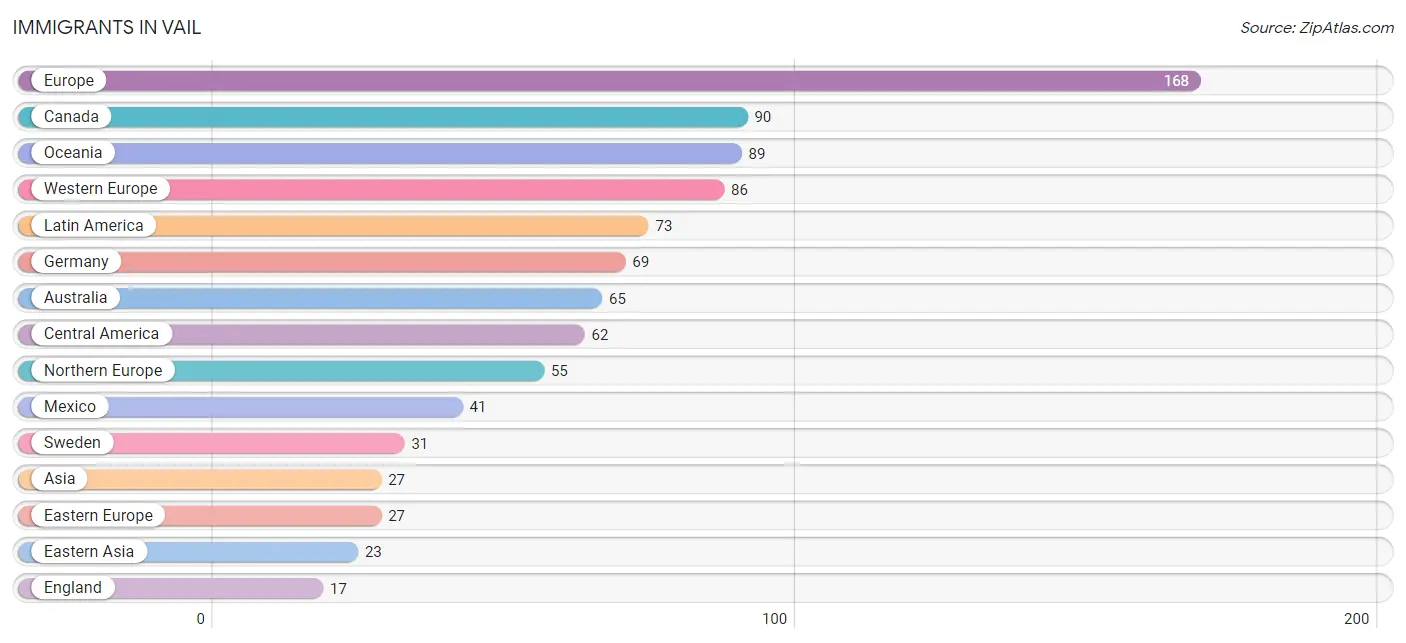
Immigrants in Vail
The most numerous immigrant groups reported in Vail came from Europe (168 | 3.5%), Canada (90 | 1.9%), Oceania (89 | 1.8%), Western Europe (86 | 1.8%), and Latin America (73 | 1.5%), together accounting for 10.5% of all Vail residents.
| Immigration Origin | # Population | % Population |
| Africa | 14 | 0.3% |
| Argentina | 5 | 0.1% |
| Asia | 27 | 0.6% |
| Australia | 65 | 1.3% |
| Canada | 90 | 1.9% |
| Caribbean | 6 | 0.1% |
| Central America | 62 | 1.3% |
| China | 7 | 0.1% |
| Croatia | 10 | 0.2% |
| Cuba | 6 | 0.1% |
| Czechoslovakia | 6 | 0.1% |
| Eastern Asia | 23 | 0.5% |
| Eastern Europe | 27 | 0.6% |
| El Salvador | 11 | 0.2% |
| England | 17 | 0.4% |
| Europe | 168 | 3.5% |
| France | 14 | 0.3% |
| Germany | 69 | 1.4% |
| Ireland | 7 | 0.1% |
| Japan | 14 | 0.3% |
| Korea | 2 | 0.0% |
| Latin America | 73 | 1.5% |
| Mexico | 41 | 0.9% |
| Netherlands | 3 | 0.1% |
| Nicaragua | 10 | 0.2% |
| Northern Europe | 55 | 1.1% |
| Oceania | 89 | 1.8% |
| Philippines | 4 | 0.1% |
| Russia | 11 | 0.2% |
| South Africa | 14 | 0.3% |
| South America | 5 | 0.1% |
| South Eastern Asia | 4 | 0.1% |
| Sweden | 31 | 0.6% |
| Taiwan | 3 | 0.1% |
| Western Europe | 86 | 1.8% | View All 35 Rows |
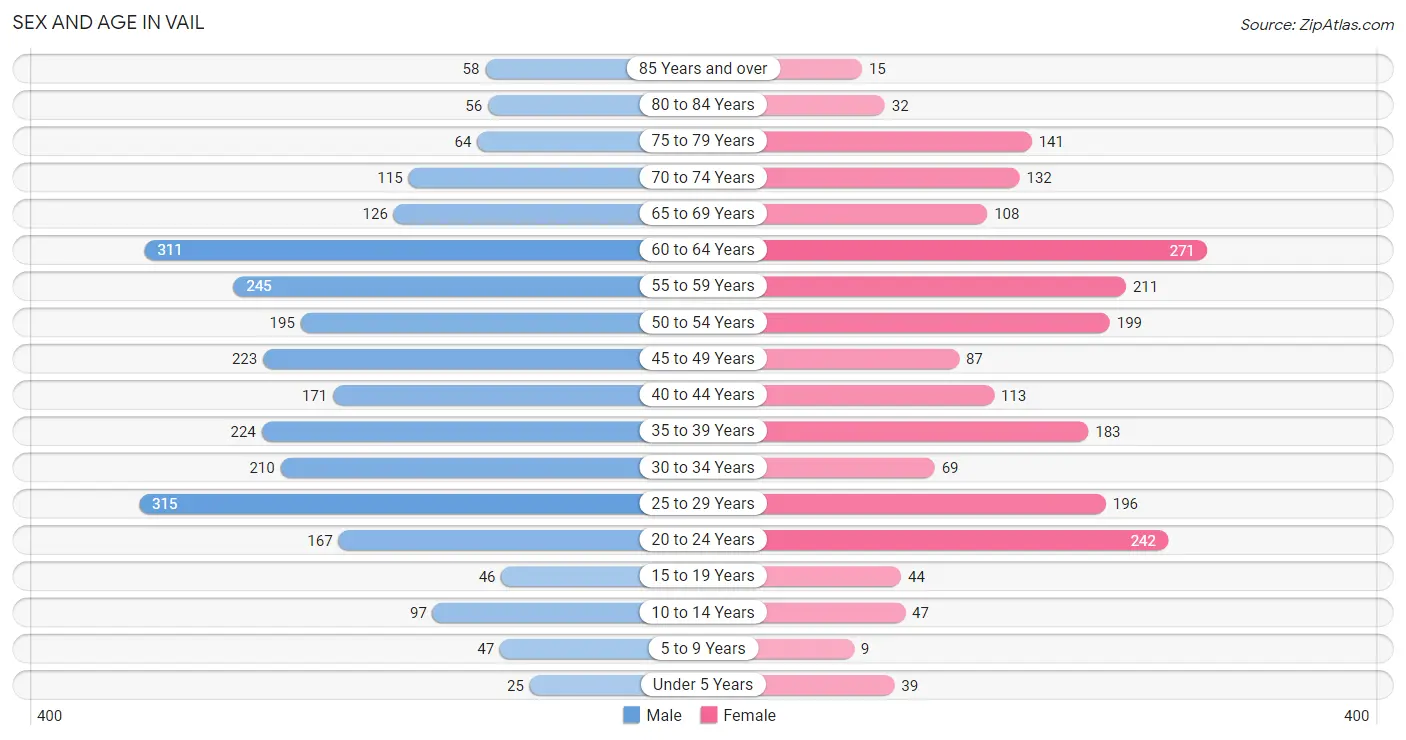
Sex and Age in Vail
Sex and Age in Vail
The most populous age groups in Vail are 25 to 29 Years (315 | 11.7%) for men and 60 to 64 Years (271 | 12.7%) for women.
| Age Bracket | Male | Female |
| Under 5 Years | 25 (0.9%) | 39 (1.8%) |
| 5 to 9 Years | 47 (1.7%) | 9 (0.4%) |
| 10 to 14 Years | 97 (3.6%) | 47 (2.2%) |
| 15 to 19 Years | 46 (1.7%) | 44 (2.1%) |
| 20 to 24 Years | 167 (6.2%) | 242 (11.3%) |
| 25 to 29 Years | 315 (11.7%) | 196 (9.2%) |
| 30 to 34 Years | 210 (7.8%) | 69 (3.2%) |
| 35 to 39 Years | 224 (8.3%) | 183 (8.6%) |
| 40 to 44 Years | 171 (6.4%) | 113 (5.3%) |
| 45 to 49 Years | 223 (8.3%) | 87 (4.1%) |
| 50 to 54 Years | 195 (7.2%) | 199 (9.3%) |
| 55 to 59 Years | 245 (9.1%) | 211 (9.9%) |
| 60 to 64 Years | 311 (11.5%) | 271 (12.7%) |
| 65 to 69 Years | 126 (4.7%) | 108 (5.1%) |
| 70 to 74 Years | 115 (4.3%) | 132 (6.2%) |
| 75 to 79 Years | 64 (2.4%) | 141 (6.6%) |
| 80 to 84 Years | 56 (2.1%) | 32 (1.5%) |
| 85 Years and over | 58 (2.1%) | 15 (0.7%) |
| Total | 2,695 (100.0%) | 2,138 (100.0%) |
Families and Households in Vail
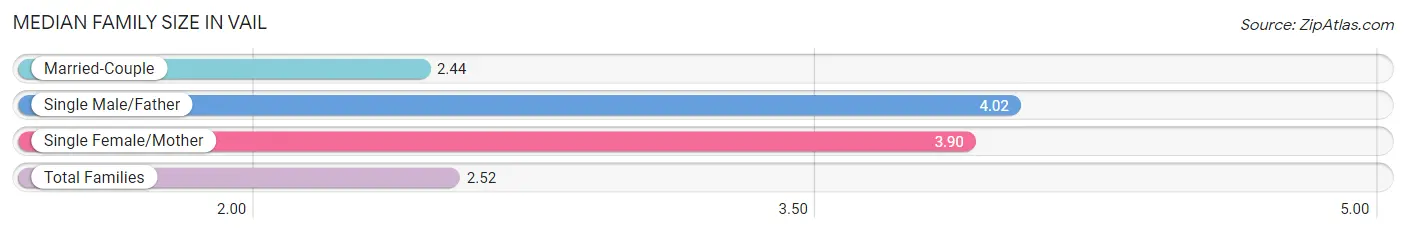
Median Family Size in Vail
The median family size in Vail is 2.52 persons per family, with single male/father families (42 | 4.1%) accounting for the largest median family size of 4.02 persons per family. On the other hand, married-couple families (964 | 94.9%) represent the smallest median family size with 2.44 persons per family.
| Family Type | # Families | Family Size |
| Married-Couple | 964 (94.9%) | 2.44 |
| Single Male/Father | 42 (4.1%) | 4.02 |
| Single Female/Mother | 10 (1.0%) | 3.90 |
| Total Families | 1,016 (100.0%) | 2.52 |
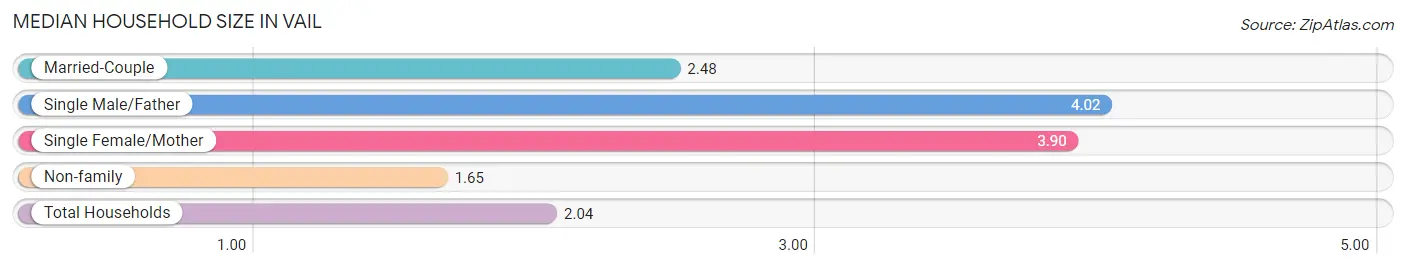
Median Household Size in Vail
The median household size in Vail is 2.04 persons per household, with single male/father households (42 | 1.8%) accounting for the largest median household size of 4.02 persons per household. non-family households (1,354 | 57.1%) represent the smallest median household size with 1.65 persons per household.
| Household Type | # Households | Household Size |
| Married-Couple | 964 (40.7%) | 2.48 |
| Single Male/Father | 42 (1.8%) | 4.02 |
| Single Female/Mother | 10 (0.4%) | 3.90 |
| Non-family | 1,354 (57.1%) | 1.65 |
| Total Households | 2,370 (100.0%) | 2.04 |
Household Size by Marriage Status in Vail
Out of a total of 2,370 households in Vail, 1,016 (42.9%) are family households, while 1,354 (57.1%) are nonfamily households. The most numerous type of family households are 2-person households, comprising 765, and the most common type of nonfamily households are 1-person households, comprising 945.
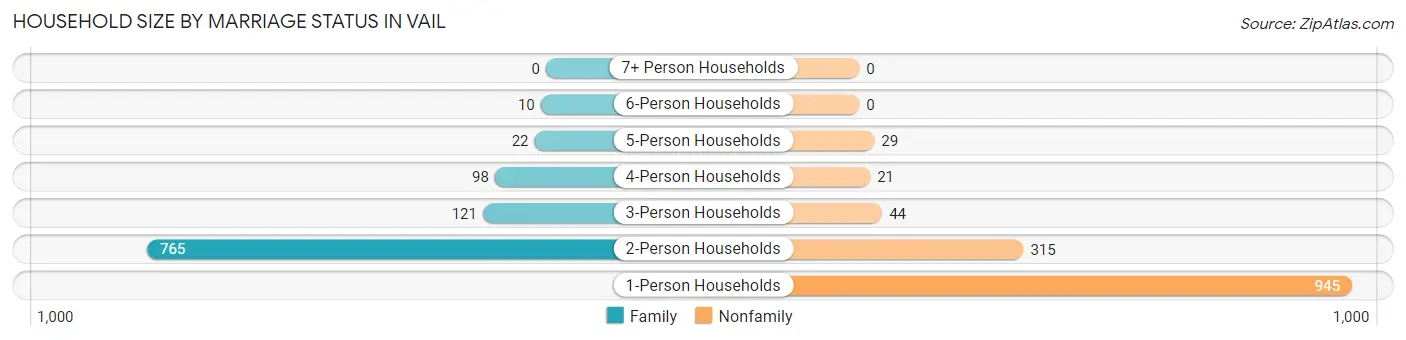
| Household Size | Family Households | Nonfamily Households |
| 1-Person Households | - | 945 (39.9%) |
| 2-Person Households | 765 (32.3%) | 315 (13.3%) |
| 3-Person Households | 121 (5.1%) | 44 (1.9%) |
| 4-Person Households | 98 (4.1%) | 21 (0.9%) |
| 5-Person Households | 22 (0.9%) | 29 (1.2%) |
| 6-Person Households | 10 (0.4%) | 0 (0.0%) |
| 7+ Person Households | 0 (0.0%) | 0 (0.0%) |
| Total | 1,016 (42.9%) | 1,354 (57.1%) |
Female Fertility in Vail
Fertility by Age in Vail
Average fertility rate in Vail is 47.0 births per 1,000 women. Women in the age bracket of 35 to 50 years have the highest fertility rate with 105.0 births per 1,000 women. Women in the age bracket of 35 to 50 years acount for 100.0% of all women with births.
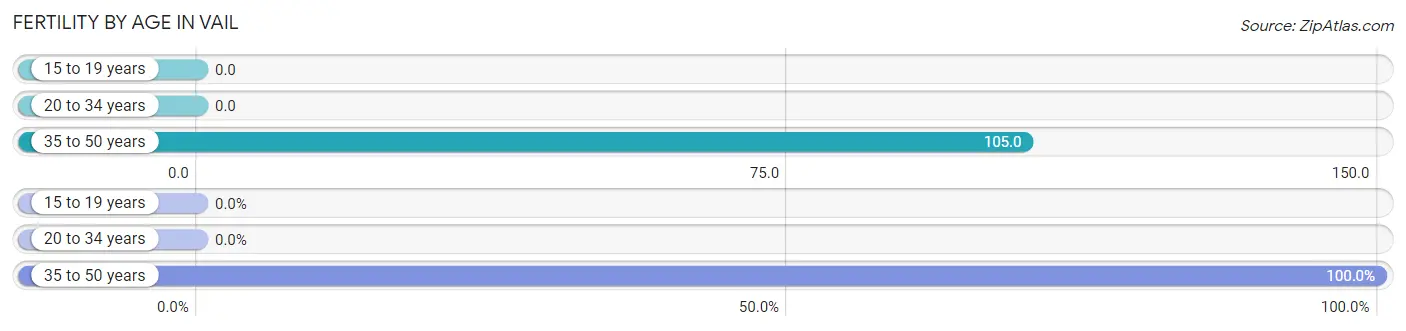
| Age Bracket | Women with Births | Births / 1,000 Women |
| 15 to 19 years | 0 (0.0%) | 0.0 |
| 20 to 34 years | 0 (0.0%) | 0.0 |
| 35 to 50 years | 46 (100.0%) | 105.0 |
| Total | 46 (100.0%) | 47.0 |
Fertility by Age by Marriage Status in Vail
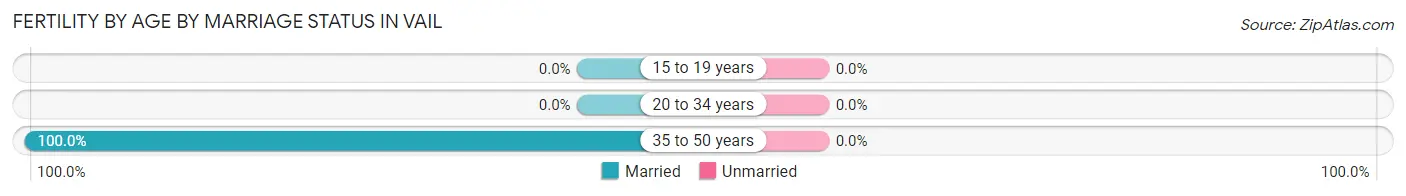
| Age Bracket | Married | Unmarried |
| 15 to 19 years | 0 (0.0%) | 0 (0.0%) |
| 20 to 34 years | 0 (0.0%) | 0 (0.0%) |
| 35 to 50 years | 46 (100.0%) | 0 (0.0%) |
| Total | 46 (100.0%) | 0 (0.0%) |
Fertility by Education in Vail
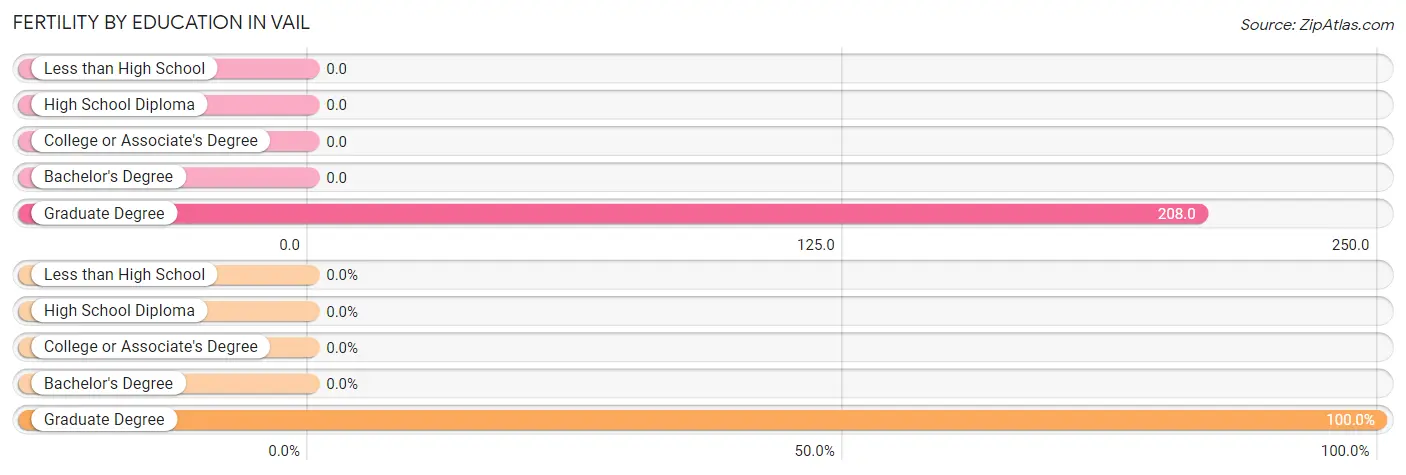
| Educational Attainment | Women with Births | Births / 1,000 Women |
| Less than High School | 0 (0.0%) | 0.0 |
| High School Diploma | 0 (0.0%) | 0.0 |
| College or Associate's Degree | 0 (0.0%) | 0.0 |
| Bachelor's Degree | 0 (0.0%) | 0.0 |
| Graduate Degree | 46 (100.0%) | 208.0 |
| Total | 46 (100.0%) | 47.0 |
Fertility by Education by Marriage Status in Vail
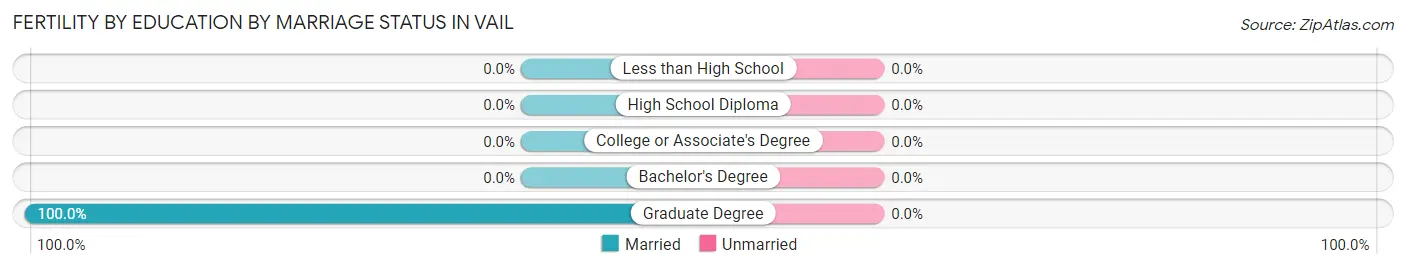
| Educational Attainment | Married | Unmarried |
| Less than High School | 0 (0.0%) | 0 (0.0%) |
| High School Diploma | 0 (0.0%) | 0 (0.0%) |
| College or Associate's Degree | 0 (0.0%) | 0 (0.0%) |
| Bachelor's Degree | 0 (0.0%) | 0 (0.0%) |
| Graduate Degree | 46 (100.0%) | 0 (0.0%) |
| Total | 46 (100.0%) | 0 (0.0%) |
Employment Characteristics in Vail
Employment by Class of Employer in Vail
Among the 3,071 employed individuals in Vail, private company employees (2,081 | 67.8%), local government employees (304 | 9.9%), and self-employed (incorporated) (248 | 8.1%) make up the most common classes of employment.
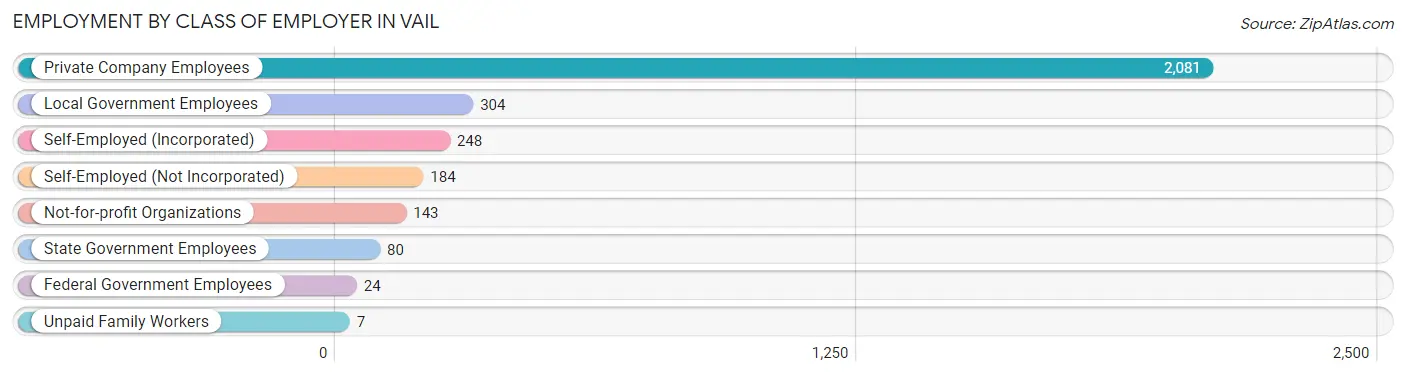
| Employer Class | # Employees | % Employees |
| Private Company Employees | 2,081 | 67.8% |
| Self-Employed (Incorporated) | 248 | 8.1% |
| Self-Employed (Not Incorporated) | 184 | 6.0% |
| Not-for-profit Organizations | 143 | 4.7% |
| Local Government Employees | 304 | 9.9% |
| State Government Employees | 80 | 2.6% |
| Federal Government Employees | 24 | 0.8% |
| Unpaid Family Workers | 7 | 0.2% |
| Total | 3,071 | 100.0% |
Employment Status by Age in Vail
According to the labor force statistics for Vail, out of the total population over 16 years of age (4,544), 74.2% or 3,372 individuals are in the labor force, with 7.6% or 256 of them unemployed. The age group with the highest labor force participation rate is 20 to 24 years, with 97.3% or 398 individuals in the labor force. Within the labor force, the 55 to 59 years age range has the highest percentage of unemployed individuals, with 24.9% or 91 of them being unemployed.
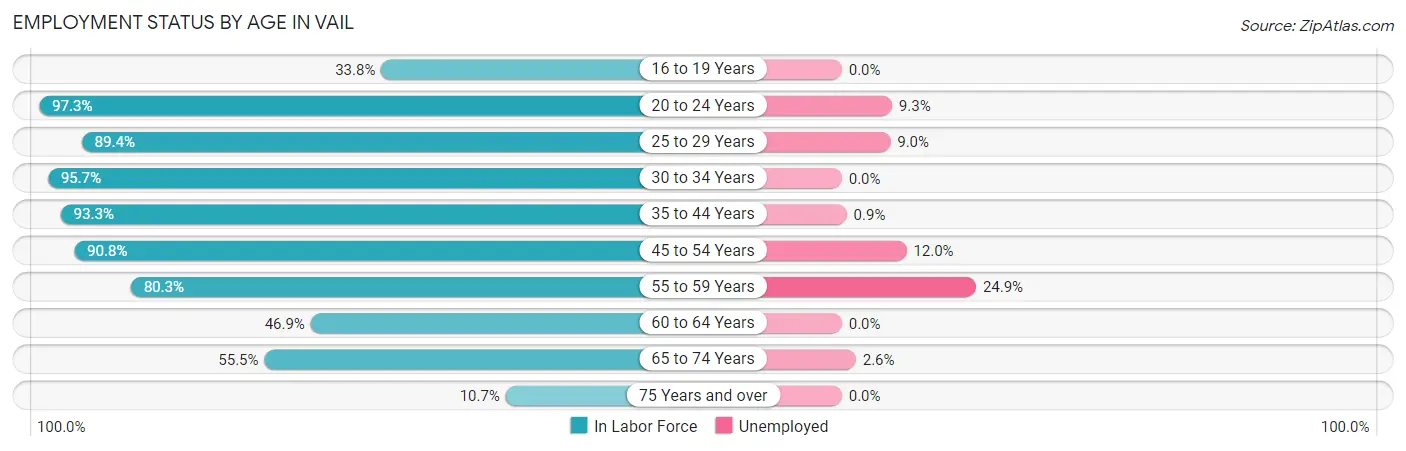
| Age Bracket | In Labor Force | Unemployed |
| 16 to 19 Years | 22 (33.8%) | 0 (0.0%) |
| 20 to 24 Years | 398 (97.3%) | 37 (9.3%) |
| 25 to 29 Years | 457 (89.4%) | 41 (9.0%) |
| 30 to 34 Years | 267 (95.7%) | 0 (0.0%) |
| 35 to 44 Years | 645 (93.3%) | 6 (0.9%) |
| 45 to 54 Years | 639 (90.8%) | 77 (12.0%) |
| 55 to 59 Years | 366 (80.3%) | 91 (24.9%) |
| 60 to 64 Years | 273 (46.9%) | 0 (0.0%) |
| 65 to 74 Years | 267 (55.5%) | 7 (2.6%) |
| 75 Years and over | 39 (10.7%) | 0 (0.0%) |
| Total | 3,372 (74.2%) | 256 (7.6%) |
Employment Status by Educational Attainment in Vail
According to labor force statistics for Vail, 82.1% of individuals (2,646) out of the total population between 25 and 64 years of age (3,223) are in the labor force, with 8.1% or 214 of them being unemployed. The group with the highest labor force participation rate are those with the educational attainment of less than high school, with 100.0% or 20 individuals in the labor force. Within the labor force, individuals with less than high school education have the highest percentage of unemployment, with 100.0% or 20 of them being unemployed.
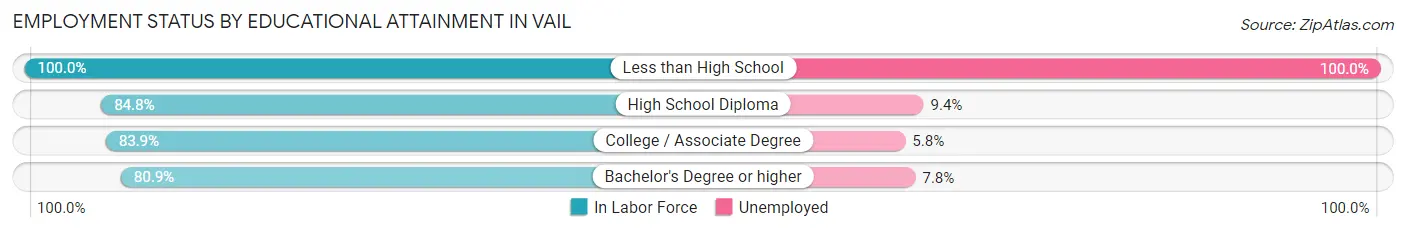
| Educational Attainment | In Labor Force | Unemployed |
| Less than High School | 20 (100.0%) | 20 (100.0%) |
| High School Diploma | 224 (84.8%) | 25 (9.4%) |
| College / Associate Degree | 691 (83.9%) | 48 (5.8%) |
| Bachelor's Degree or higher | 1,711 (80.9%) | 165 (7.8%) |
| Total | 2,646 (82.1%) | 261 (8.1%) |
Employment Occupations by Sex in Vail
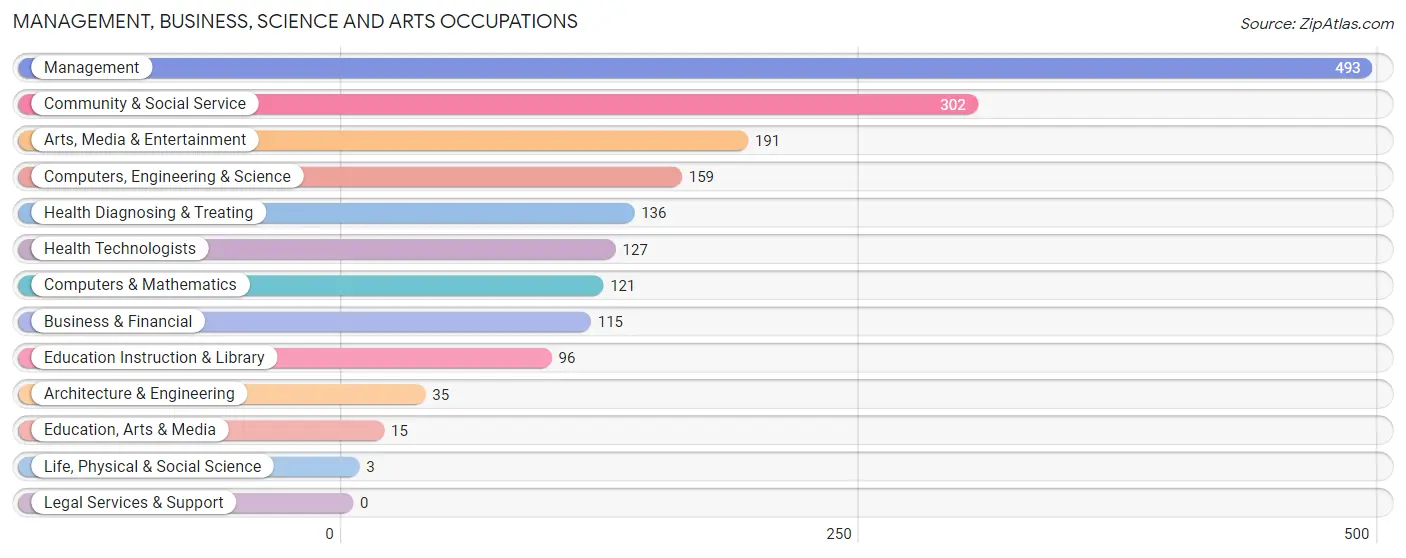
Management, Business, Science and Arts Occupations
The most common Management, Business, Science and Arts occupations in Vail are Management (493 | 15.9%), Community & Social Service (302 | 9.8%), Arts, Media & Entertainment (191 | 6.2%), Computers, Engineering & Science (159 | 5.1%), and Health Diagnosing & Treating (136 | 4.4%).
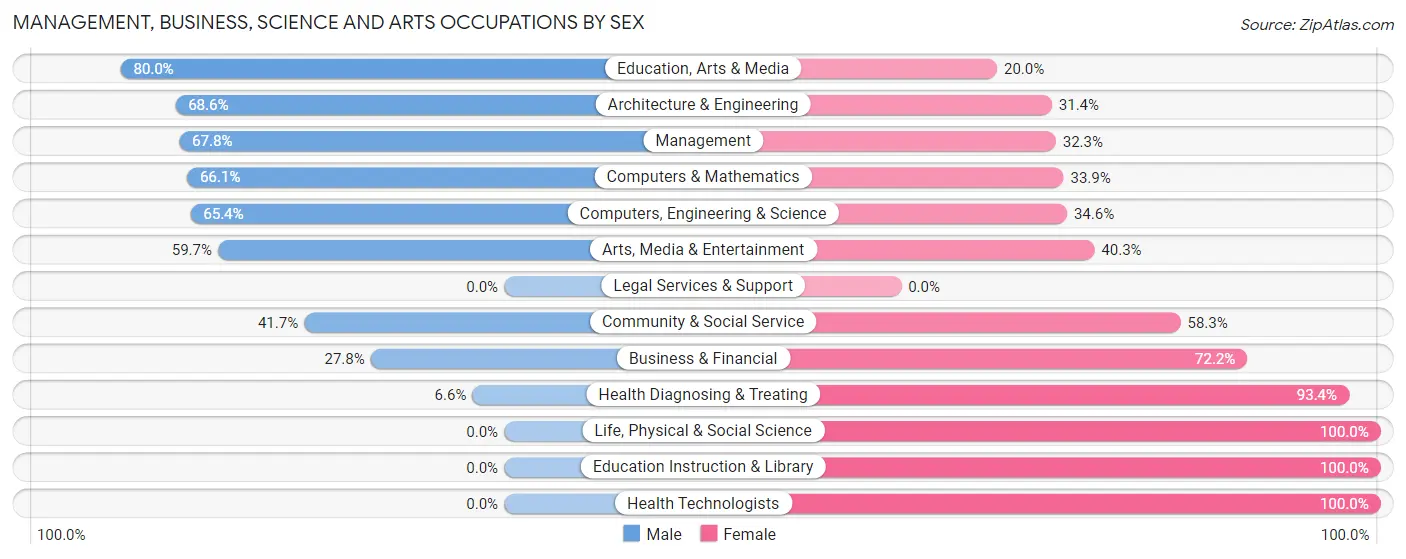
Management, Business, Science and Arts Occupations by Sex
Within the Management, Business, Science and Arts occupations in Vail, the most male-oriented occupations are Education, Arts & Media (80.0%), Architecture & Engineering (68.6%), and Management (67.7%), while the most female-oriented occupations are Life, Physical & Social Science (100.0%), Education Instruction & Library (100.0%), and Health Technologists (100.0%).
| Occupation | Male | Female |
| Management | 334 (67.7%) | 159 (32.3%) |
| Business & Financial | 32 (27.8%) | 83 (72.2%) |
| Computers, Engineering & Science | 104 (65.4%) | 55 (34.6%) |
| Computers & Mathematics | 80 (66.1%) | 41 (33.9%) |
| Architecture & Engineering | 24 (68.6%) | 11 (31.4%) |
| Life, Physical & Social Science | 0 (0.0%) | 3 (100.0%) |
| Community & Social Service | 126 (41.7%) | 176 (58.3%) |
| Education, Arts & Media | 12 (80.0%) | 3 (20.0%) |
| Legal Services & Support | 0 (0.0%) | 0 (0.0%) |
| Education Instruction & Library | 0 (0.0%) | 96 (100.0%) |
| Arts, Media & Entertainment | 114 (59.7%) | 77 (40.3%) |
| Health Diagnosing & Treating | 9 (6.6%) | 127 (93.4%) |
| Health Technologists | 0 (0.0%) | 127 (100.0%) |
| Total (Category) | 605 (50.2%) | 600 (49.8%) |
| Total (Overall) | 1,813 (58.6%) | 1,280 (41.4%) |
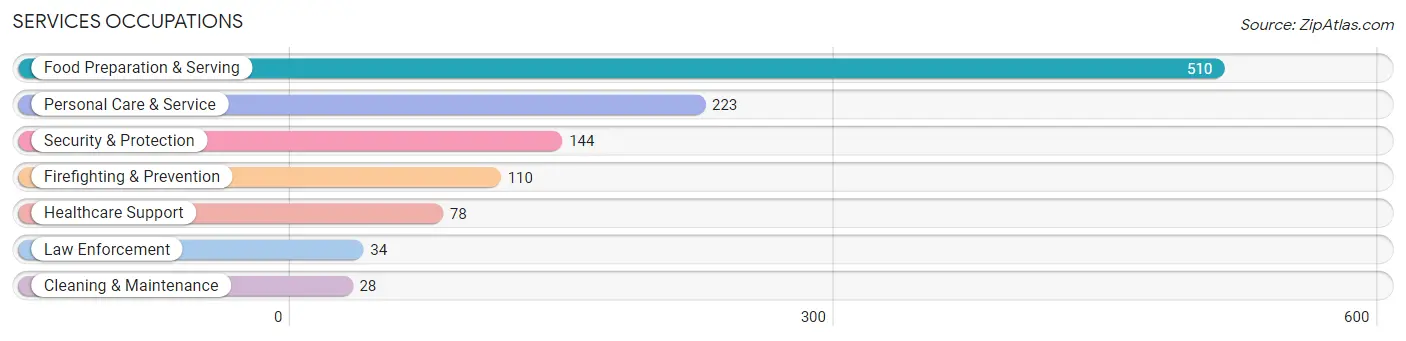
Services Occupations
The most common Services occupations in Vail are Food Preparation & Serving (510 | 16.5%), Personal Care & Service (223 | 7.2%), Security & Protection (144 | 4.7%), Firefighting & Prevention (110 | 3.6%), and Healthcare Support (78 | 2.5%).
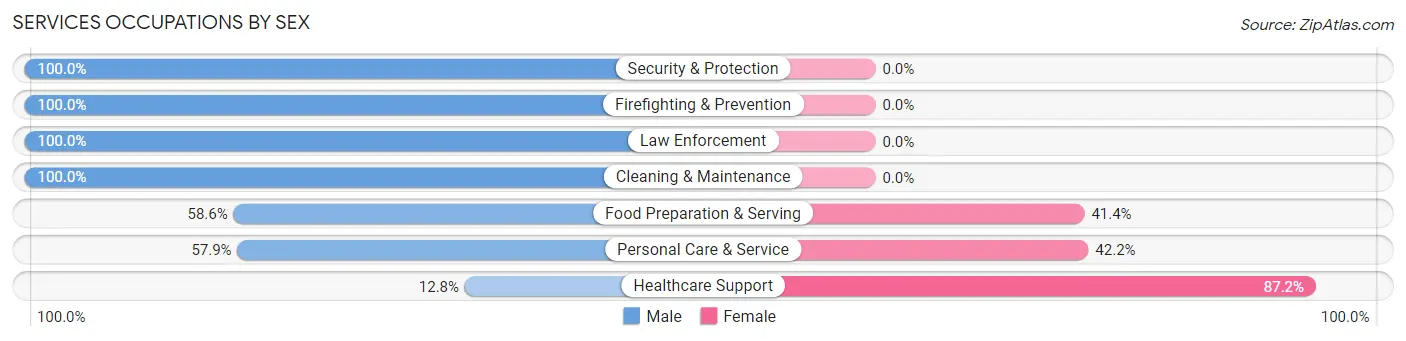
Services Occupations by Sex
Within the Services occupations in Vail, the most male-oriented occupations are Security & Protection (100.0%), Firefighting & Prevention (100.0%), and Law Enforcement (100.0%), while the most female-oriented occupations are Healthcare Support (87.2%), Personal Care & Service (42.1%), and Food Preparation & Serving (41.4%).
| Occupation | Male | Female |
| Healthcare Support | 10 (12.8%) | 68 (87.2%) |
| Security & Protection | 144 (100.0%) | 0 (0.0%) |
| Firefighting & Prevention | 110 (100.0%) | 0 (0.0%) |
| Law Enforcement | 34 (100.0%) | 0 (0.0%) |
| Food Preparation & Serving | 299 (58.6%) | 211 (41.4%) |
| Cleaning & Maintenance | 28 (100.0%) | 0 (0.0%) |
| Personal Care & Service | 129 (57.9%) | 94 (42.1%) |
| Total (Category) | 610 (62.1%) | 373 (38.0%) |
| Total (Overall) | 1,813 (58.6%) | 1,280 (41.4%) |
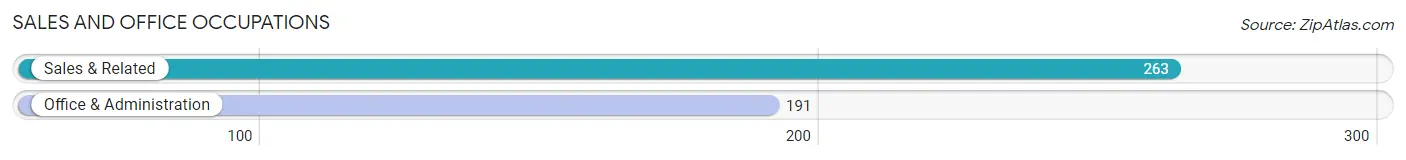
Sales and Office Occupations
The most common Sales and Office occupations in Vail are Sales & Related (263 | 8.5%), and Office & Administration (191 | 6.2%).
Sales and Office Occupations by Sex
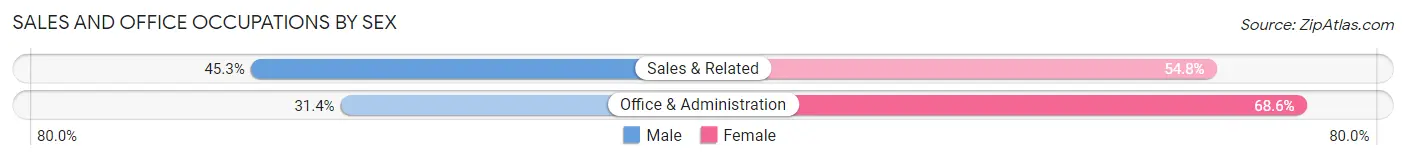
| Occupation | Male | Female |
| Sales & Related | 119 (45.3%) | 144 (54.7%) |
| Office & Administration | 60 (31.4%) | 131 (68.6%) |
| Total (Category) | 179 (39.4%) | 275 (60.6%) |
| Total (Overall) | 1,813 (58.6%) | 1,280 (41.4%) |
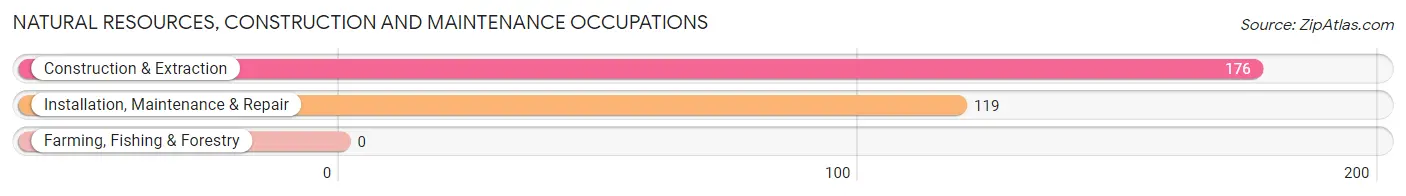
Natural Resources, Construction and Maintenance Occupations
The most common Natural Resources, Construction and Maintenance occupations in Vail are Construction & Extraction (176 | 5.7%), and Installation, Maintenance & Repair (119 | 3.8%).
Natural Resources, Construction and Maintenance Occupations by Sex
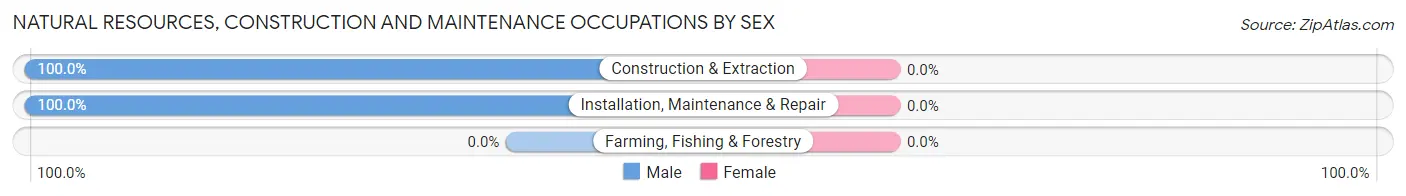
| Occupation | Male | Female |
| Farming, Fishing & Forestry | 0 (0.0%) | 0 (0.0%) |
| Construction & Extraction | 176 (100.0%) | 0 (0.0%) |
| Installation, Maintenance & Repair | 119 (100.0%) | 0 (0.0%) |
| Total (Category) | 295 (100.0%) | 0 (0.0%) |
| Total (Overall) | 1,813 (58.6%) | 1,280 (41.4%) |
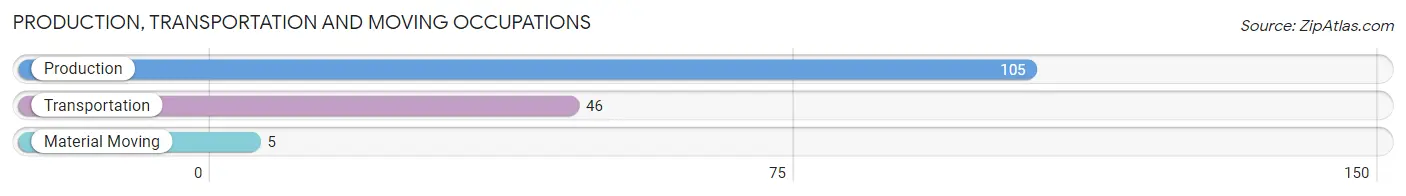
Production, Transportation and Moving Occupations
The most common Production, Transportation and Moving occupations in Vail are Production (105 | 3.4%), Transportation (46 | 1.5%), and Material Moving (5 | 0.2%).
Production, Transportation and Moving Occupations by Sex
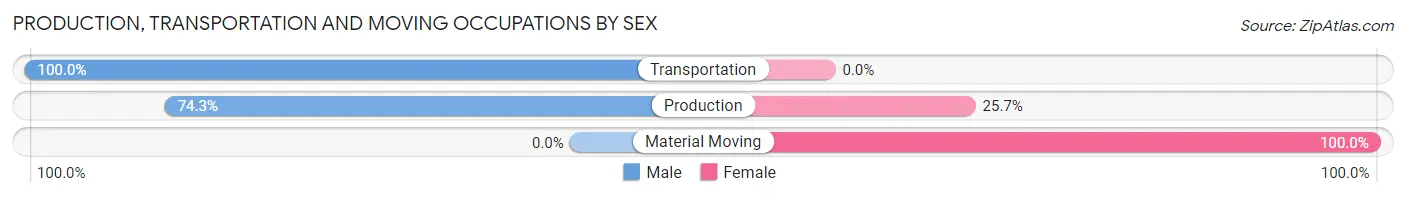
| Occupation | Male | Female |
| Production | 78 (74.3%) | 27 (25.7%) |
| Transportation | 46 (100.0%) | 0 (0.0%) |
| Material Moving | 0 (0.0%) | 5 (100.0%) |
| Total (Category) | 124 (79.5%) | 32 (20.5%) |
| Total (Overall) | 1,813 (58.6%) | 1,280 (41.4%) |
Employment Industries by Sex in Vail
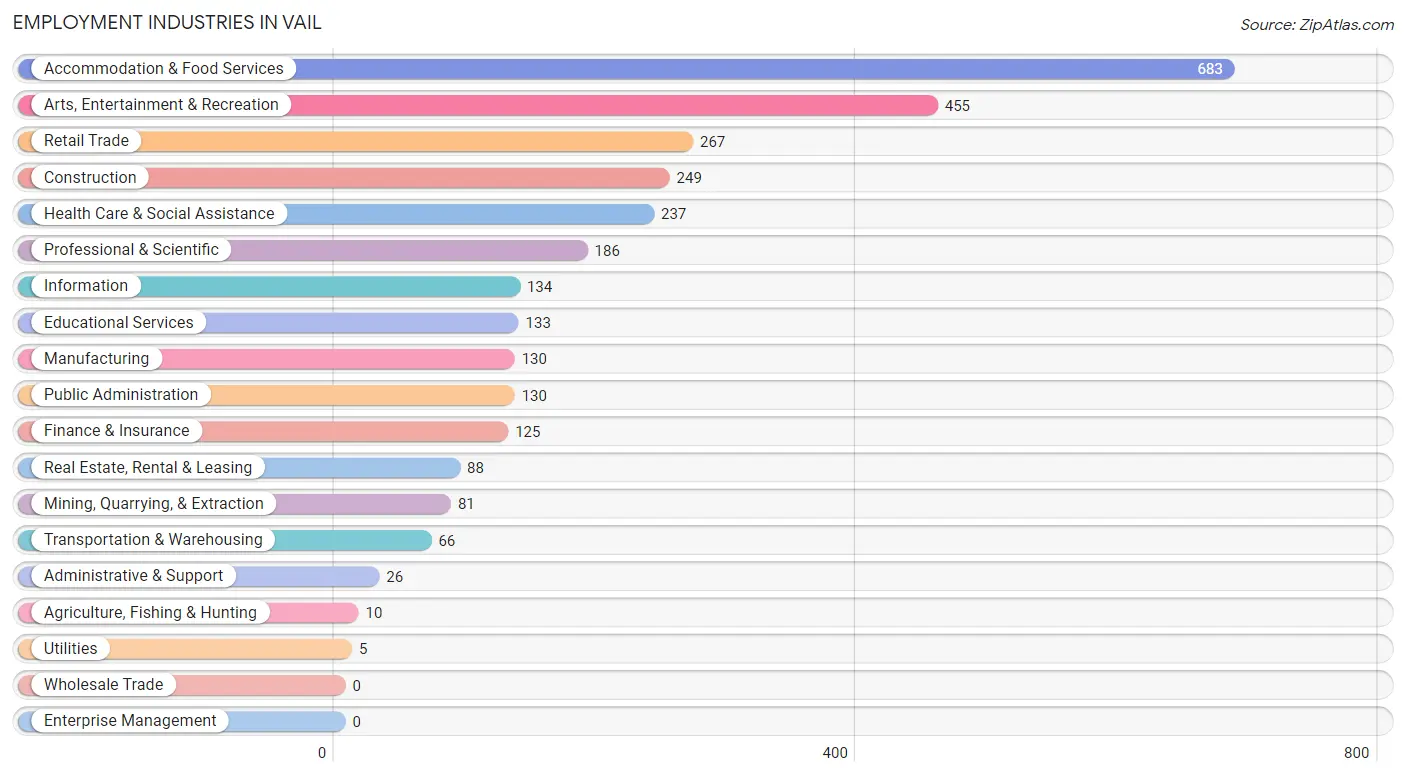
Employment Industries in Vail
The major employment industries in Vail include Accommodation & Food Services (683 | 22.1%), Arts, Entertainment & Recreation (455 | 14.7%), Retail Trade (267 | 8.6%), Construction (249 | 8.1%), and Health Care & Social Assistance (237 | 7.7%).
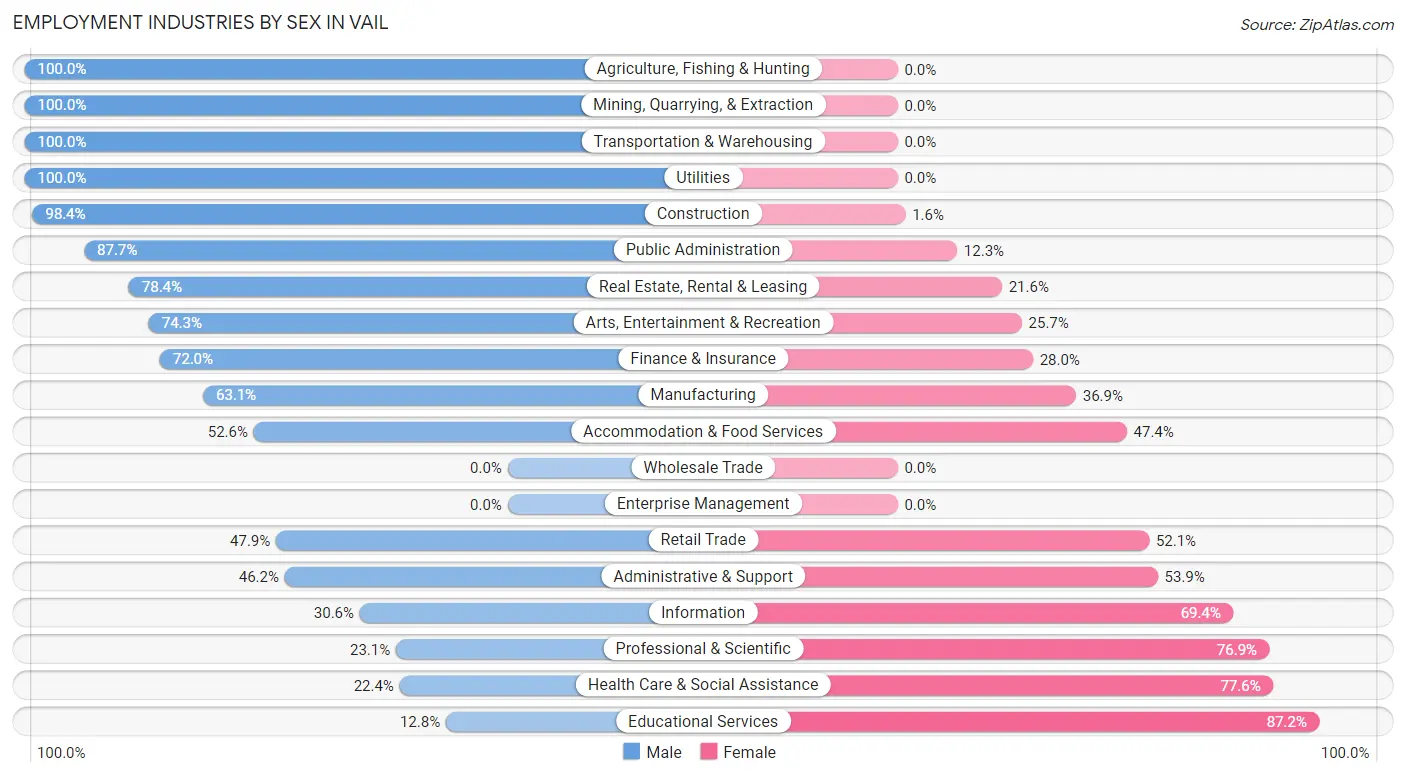
Employment Industries by Sex in Vail
The Vail industries that see more men than women are Agriculture, Fishing & Hunting (100.0%), Mining, Quarrying, & Extraction (100.0%), and Transportation & Warehousing (100.0%), whereas the industries that tend to have a higher number of women are Educational Services (87.2%), Health Care & Social Assistance (77.6%), and Professional & Scientific (76.9%).
| Industry | Male | Female |
| Agriculture, Fishing & Hunting | 10 (100.0%) | 0 (0.0%) |
| Mining, Quarrying, & Extraction | 81 (100.0%) | 0 (0.0%) |
| Construction | 245 (98.4%) | 4 (1.6%) |
| Manufacturing | 82 (63.1%) | 48 (36.9%) |
| Wholesale Trade | 0 (0.0%) | 0 (0.0%) |
| Retail Trade | 128 (47.9%) | 139 (52.1%) |
| Transportation & Warehousing | 66 (100.0%) | 0 (0.0%) |
| Utilities | 5 (100.0%) | 0 (0.0%) |
| Information | 41 (30.6%) | 93 (69.4%) |
| Finance & Insurance | 90 (72.0%) | 35 (28.0%) |
| Real Estate, Rental & Leasing | 69 (78.4%) | 19 (21.6%) |
| Professional & Scientific | 43 (23.1%) | 143 (76.9%) |
| Enterprise Management | 0 (0.0%) | 0 (0.0%) |
| Administrative & Support | 12 (46.2%) | 14 (53.8%) |
| Educational Services | 17 (12.8%) | 116 (87.2%) |
| Health Care & Social Assistance | 53 (22.4%) | 184 (77.6%) |
| Arts, Entertainment & Recreation | 338 (74.3%) | 117 (25.7%) |
| Accommodation & Food Services | 359 (52.6%) | 324 (47.4%) |
| Public Administration | 114 (87.7%) | 16 (12.3%) |
| Total | 1,813 (58.6%) | 1,280 (41.4%) |
Education in Vail
School Enrollment in Vail
The most common levels of schooling among the 396 students in Vail are middle school (119 | 30.0%), high school (76 | 19.2%), and college / undergraduate (55 | 13.9%).
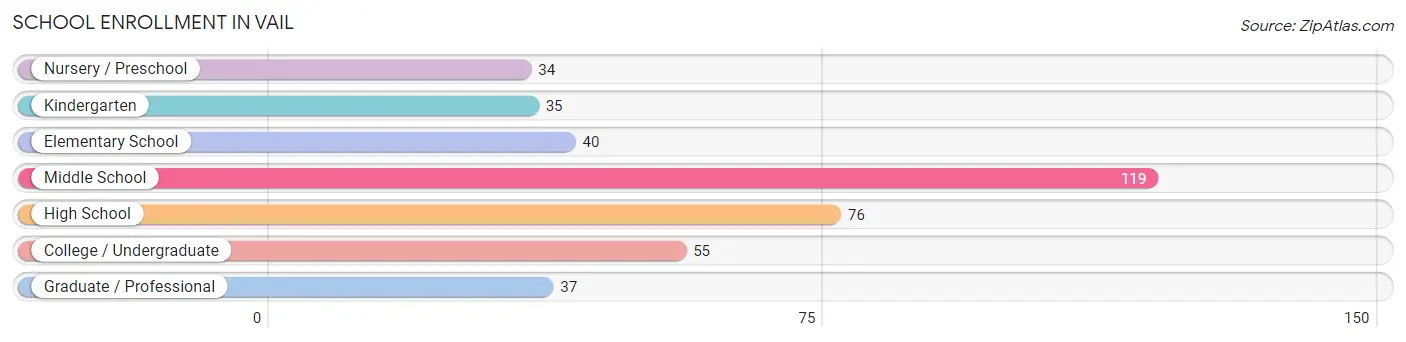
| School Level | # Students | % Students |
| Nursery / Preschool | 34 | 8.6% |
| Kindergarten | 35 | 8.8% |
| Elementary School | 40 | 10.1% |
| Middle School | 119 | 30.0% |
| High School | 76 | 19.2% |
| College / Undergraduate | 55 | 13.9% |
| Graduate / Professional | 37 | 9.3% |
| Total | 396 | 100.0% |
School Enrollment by Age by Funding Source in Vail
Out of a total of 396 students who are enrolled in schools in Vail, 197 (49.7%) attend a private institution, while the remaining 199 (50.3%) are enrolled in public schools. The age group of 3 to 4 year olds has the highest likelihood of being enrolled in private schools, with 34 (100.0% in the age bracket) enrolled. Conversely, the age group of 25 to 34 year olds has the lowest likelihood of being enrolled in a private school, with 5 (100.0% in the age bracket) attending a public institution.
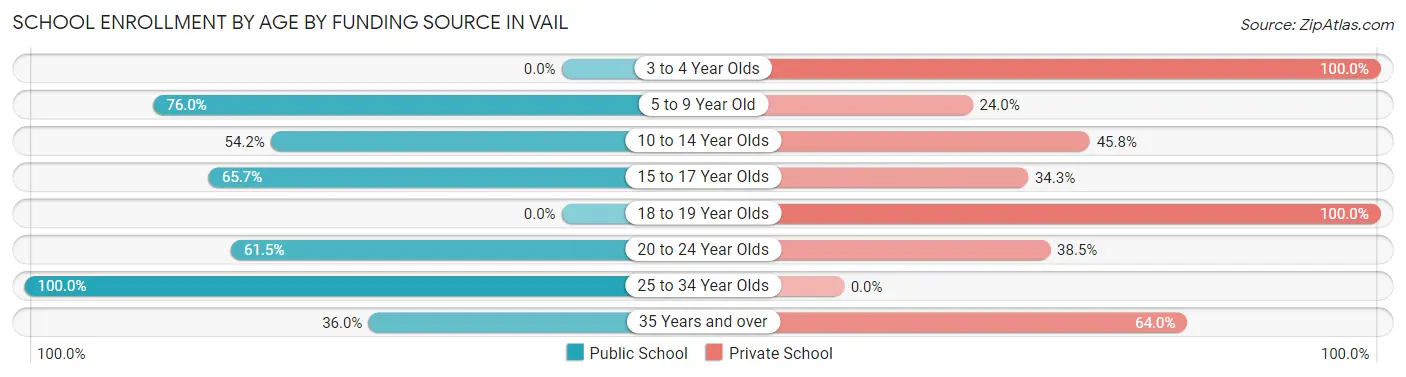
| Age Bracket | Public School | Private School |
| 3 to 4 Year Olds | 0 (0.0%) | 34 (100.0%) |
| 5 to 9 Year Old | 38 (76.0%) | 12 (24.0%) |
| 10 to 14 Year Olds | 78 (54.2%) | 66 (45.8%) |
| 15 to 17 Year Olds | 44 (65.7%) | 23 (34.3%) |
| 18 to 19 Year Olds | 0 (0.0%) | 20 (100.0%) |
| 20 to 24 Year Olds | 16 (61.5%) | 10 (38.5%) |
| 25 to 34 Year Olds | 5 (100.0%) | 0 (0.0%) |
| 35 Years and over | 18 (36.0%) | 32 (64.0%) |
| Total | 199 (50.3%) | 197 (49.7%) |
Educational Attainment by Field of Study in Vail
Business (700 | 24.3%), social sciences (331 | 11.5%), bio, nature & agricultural (242 | 8.4%), psychology (222 | 7.7%), and science & technology (221 | 7.7%) are the most common fields of study among 2,877 individuals in Vail who have obtained a bachelor's degree or higher.
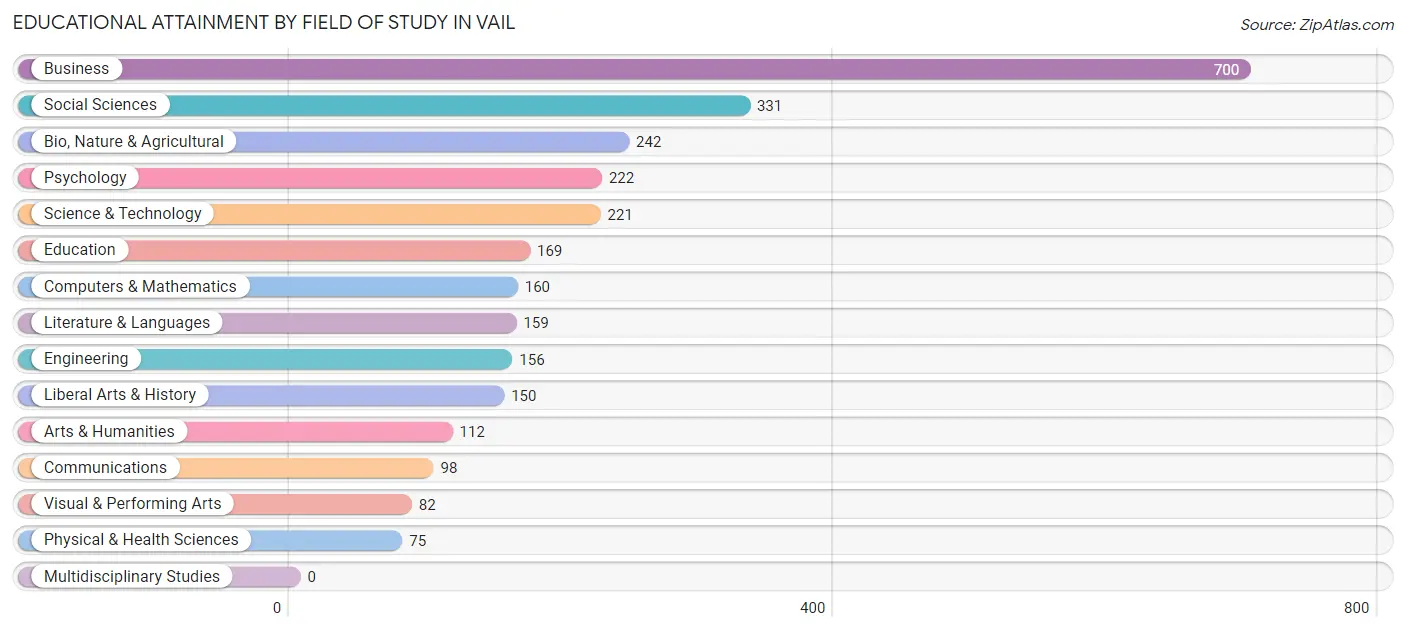
| Field of Study | # Graduates | % Graduates |
| Computers & Mathematics | 160 | 5.6% |
| Bio, Nature & Agricultural | 242 | 8.4% |
| Physical & Health Sciences | 75 | 2.6% |
| Psychology | 222 | 7.7% |
| Social Sciences | 331 | 11.5% |
| Engineering | 156 | 5.4% |
| Multidisciplinary Studies | 0 | 0.0% |
| Science & Technology | 221 | 7.7% |
| Business | 700 | 24.3% |
| Education | 169 | 5.9% |
| Literature & Languages | 159 | 5.5% |
| Liberal Arts & History | 150 | 5.2% |
| Visual & Performing Arts | 82 | 2.9% |
| Communications | 98 | 3.4% |
| Arts & Humanities | 112 | 3.9% |
| Total | 2,877 | 100.0% |
Transportation & Commute in Vail
Vehicle Availability by Sex in Vail
The most prevalent vehicle ownership categories in Vail are males with 2 vehicles (658, accounting for 36.8%) and females with 2 vehicles (557, making up 51.4%).
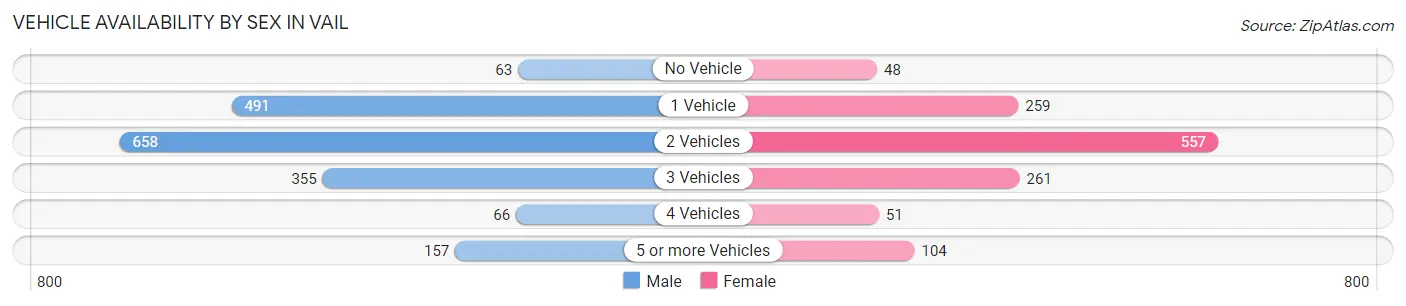
| Vehicles Available | Male | Female |
| No Vehicle | 63 (3.5%) | 48 (3.7%) |
| 1 Vehicle | 491 (27.4%) | 259 (20.2%) |
| 2 Vehicles | 658 (36.8%) | 557 (43.5%) |
| 3 Vehicles | 355 (19.8%) | 261 (20.4%) |
| 4 Vehicles | 66 (3.7%) | 51 (4.0%) |
| 5 or more Vehicles | 157 (8.8%) | 104 (8.1%) |
| Total | 1,790 (100.0%) | 1,280 (100.0%) |
Commute Time in Vail
The most frequently occuring commute durations in Vail are 10 to 14 minutes (670 commuters, 24.7%), 5 to 9 minutes (537 commuters, 19.8%), and 15 to 19 minutes (514 commuters, 19.0%).
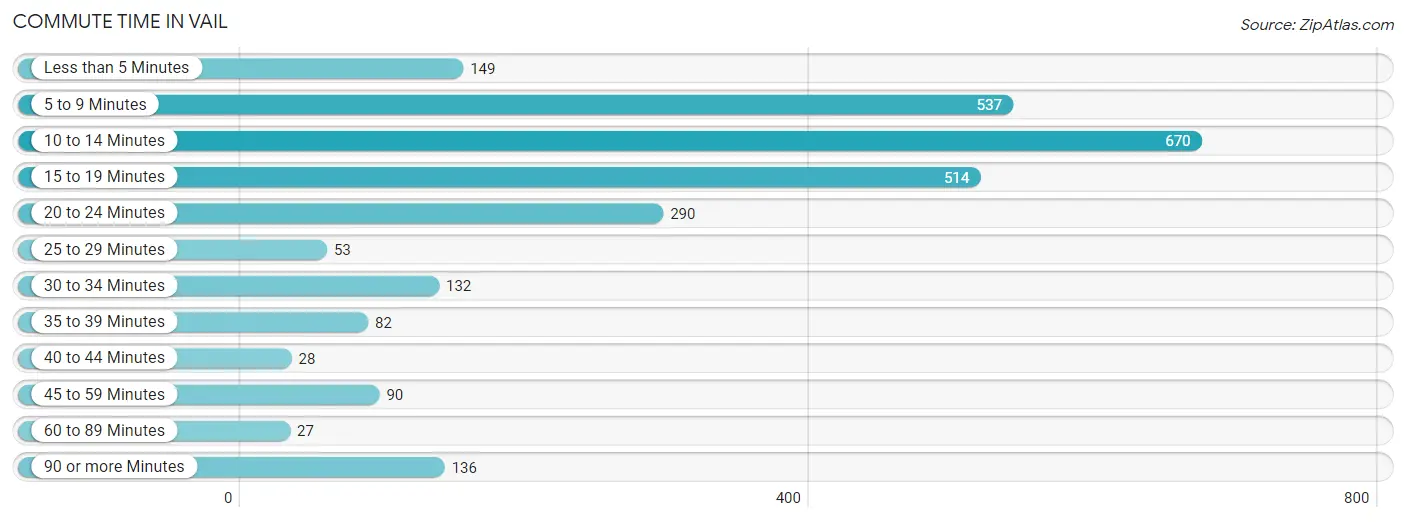
| Commute Time | # Commuters | % Commuters |
| Less than 5 Minutes | 149 | 5.5% |
| 5 to 9 Minutes | 537 | 19.8% |
| 10 to 14 Minutes | 670 | 24.7% |
| 15 to 19 Minutes | 514 | 19.0% |
| 20 to 24 Minutes | 290 | 10.7% |
| 25 to 29 Minutes | 53 | 2.0% |
| 30 to 34 Minutes | 132 | 4.9% |
| 35 to 39 Minutes | 82 | 3.0% |
| 40 to 44 Minutes | 28 | 1.0% |
| 45 to 59 Minutes | 90 | 3.3% |
| 60 to 89 Minutes | 27 | 1.0% |
| 90 or more Minutes | 136 | 5.0% |
Commute Time by Sex in Vail
The most common commute times in Vail are 10 to 14 minutes (398 commuters, 25.1%) for males and 10 to 14 minutes (272 commuters, 24.3%) for females.
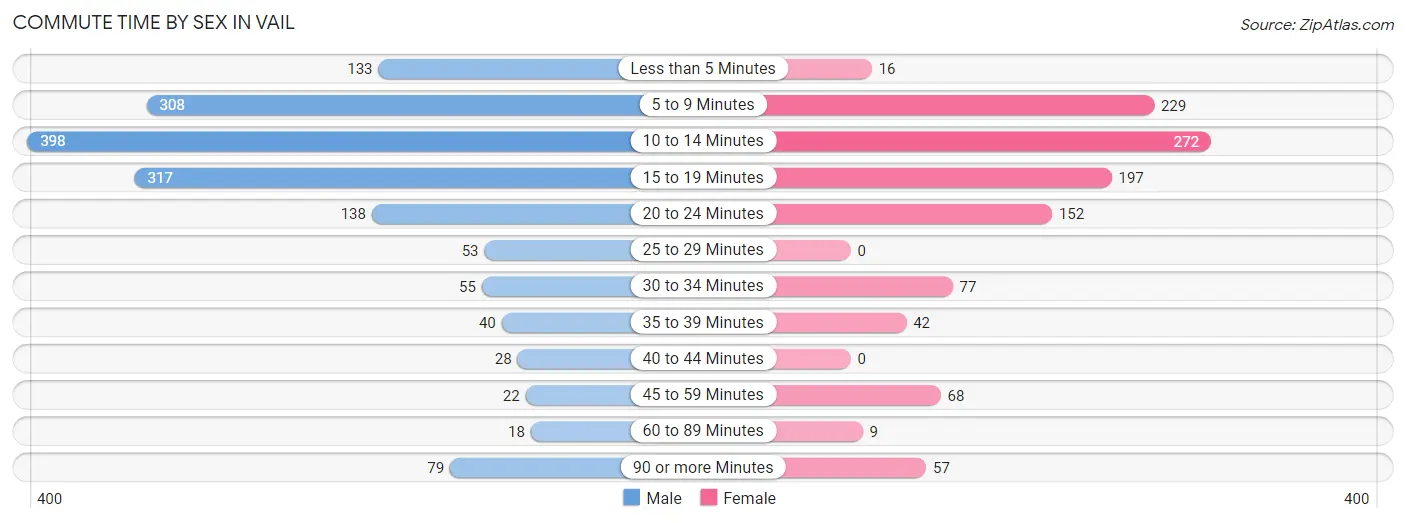
| Commute Time | Male | Female |
| Less than 5 Minutes | 133 (8.4%) | 16 (1.4%) |
| 5 to 9 Minutes | 308 (19.4%) | 229 (20.5%) |
| 10 to 14 Minutes | 398 (25.1%) | 272 (24.3%) |
| 15 to 19 Minutes | 317 (20.0%) | 197 (17.6%) |
| 20 to 24 Minutes | 138 (8.7%) | 152 (13.6%) |
| 25 to 29 Minutes | 53 (3.3%) | 0 (0.0%) |
| 30 to 34 Minutes | 55 (3.5%) | 77 (6.9%) |
| 35 to 39 Minutes | 40 (2.5%) | 42 (3.7%) |
| 40 to 44 Minutes | 28 (1.8%) | 0 (0.0%) |
| 45 to 59 Minutes | 22 (1.4%) | 68 (6.1%) |
| 60 to 89 Minutes | 18 (1.1%) | 9 (0.8%) |
| 90 or more Minutes | 79 (5.0%) | 57 (5.1%) |
Time of Departure to Work by Sex in Vail
The most frequent times of departure to work in Vail are 7:30 AM to 7:59 AM (175, 11.0%) for males and 9:00 AM to 9:59 AM (221, 19.8%) for females.
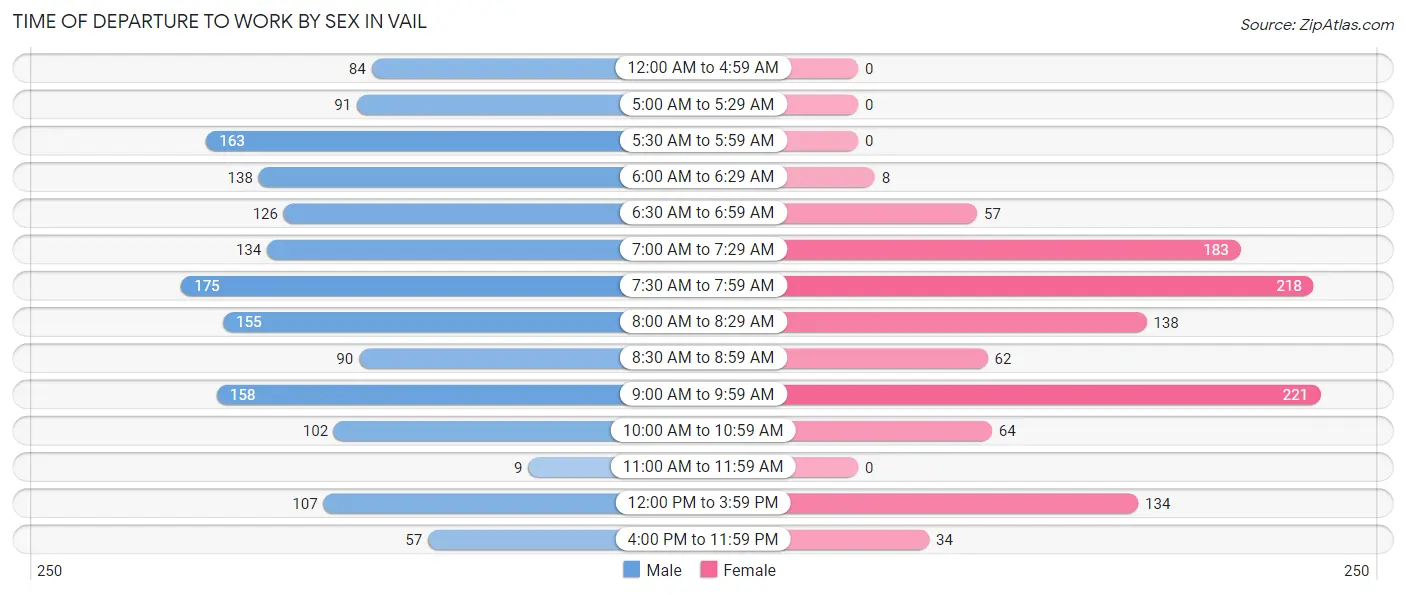
| Time of Departure | Male | Female |
| 12:00 AM to 4:59 AM | 84 (5.3%) | 0 (0.0%) |
| 5:00 AM to 5:29 AM | 91 (5.7%) | 0 (0.0%) |
| 5:30 AM to 5:59 AM | 163 (10.3%) | 0 (0.0%) |
| 6:00 AM to 6:29 AM | 138 (8.7%) | 8 (0.7%) |
| 6:30 AM to 6:59 AM | 126 (7.9%) | 57 (5.1%) |
| 7:00 AM to 7:29 AM | 134 (8.4%) | 183 (16.4%) |
| 7:30 AM to 7:59 AM | 175 (11.0%) | 218 (19.5%) |
| 8:00 AM to 8:29 AM | 155 (9.8%) | 138 (12.3%) |
| 8:30 AM to 8:59 AM | 90 (5.7%) | 62 (5.5%) |
| 9:00 AM to 9:59 AM | 158 (9.9%) | 221 (19.8%) |
| 10:00 AM to 10:59 AM | 102 (6.4%) | 64 (5.7%) |
| 11:00 AM to 11:59 AM | 9 (0.6%) | 0 (0.0%) |
| 12:00 PM to 3:59 PM | 107 (6.7%) | 134 (12.0%) |
| 4:00 PM to 11:59 PM | 57 (3.6%) | 34 (3.0%) |
| Total | 1,589 (100.0%) | 1,119 (100.0%) |
Housing Occupancy in Vail
Occupancy by Ownership in Vail
Of the total 2,370 dwellings in Vail, owner-occupied units account for 1,634 (69.0%), while renter-occupied units make up 736 (31.0%).
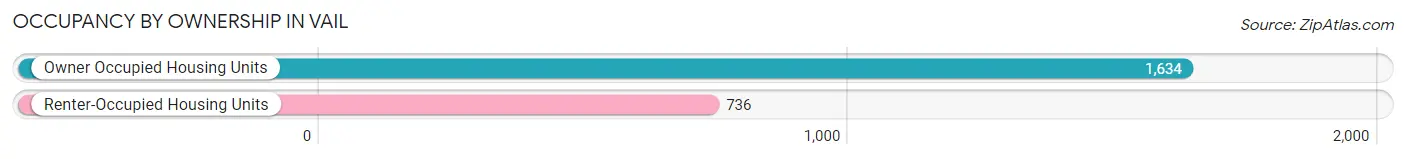
| Occupancy | # Housing Units | % Housing Units |
| Owner Occupied Housing Units | 1,634 | 69.0% |
| Renter-Occupied Housing Units | 736 | 31.0% |
| Total Occupied Housing Units | 2,370 | 100.0% |
Occupancy by Household Size in Vail
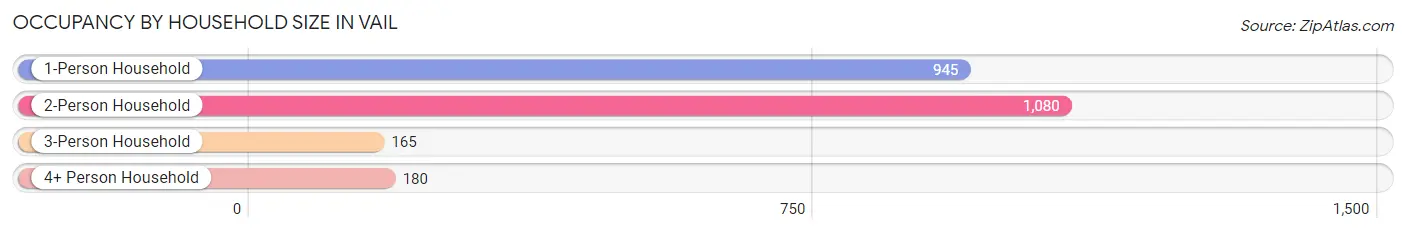
| Household Size | # Housing Units | % Housing Units |
| 1-Person Household | 945 | 39.9% |
| 2-Person Household | 1,080 | 45.6% |
| 3-Person Household | 165 | 7.0% |
| 4+ Person Household | 180 | 7.6% |
| Total Housing Units | 2,370 | 100.0% |
Occupancy by Ownership by Household Size in Vail
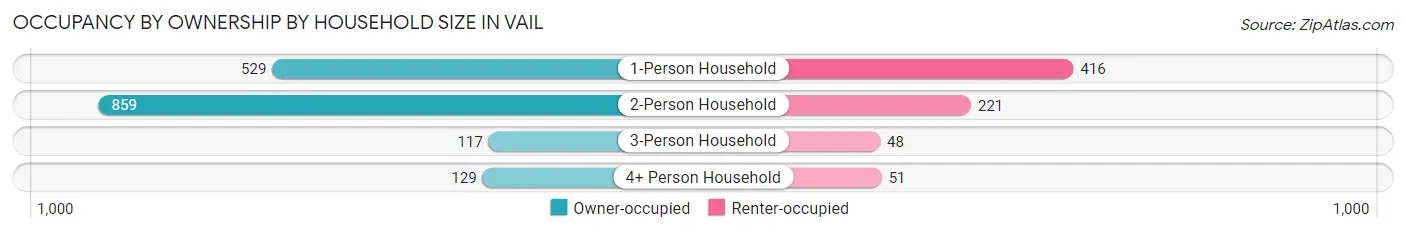
| Household Size | Owner-occupied | Renter-occupied |
| 1-Person Household | 529 (56.0%) | 416 (44.0%) |
| 2-Person Household | 859 (79.5%) | 221 (20.5%) |
| 3-Person Household | 117 (70.9%) | 48 (29.1%) |
| 4+ Person Household | 129 (71.7%) | 51 (28.3%) |
| Total Housing Units | 1,634 (69.0%) | 736 (31.0%) |
Occupancy by Educational Attainment in Vail
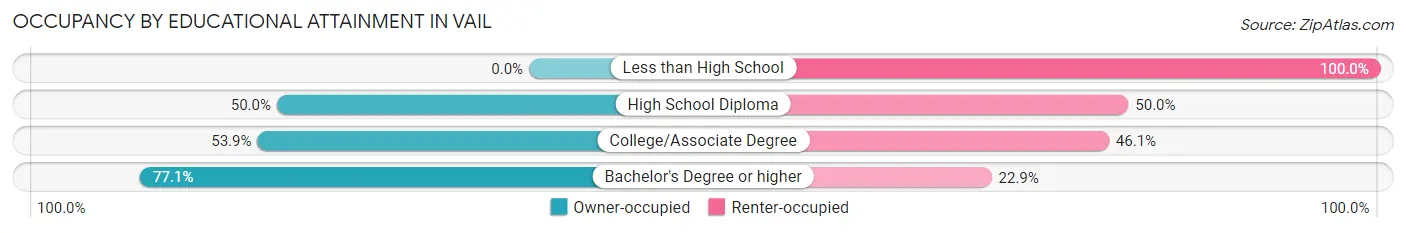
| Household Size | Owner-occupied | Renter-occupied |
| Less than High School | 0 (0.0%) | 20 (100.0%) |
| High School Diploma | 84 (50.0%) | 84 (50.0%) |
| College/Associate Degree | 307 (53.9%) | 263 (46.1%) |
| Bachelor's Degree or higher | 1,243 (77.1%) | 369 (22.9%) |
Occupancy by Age of Householder in Vail
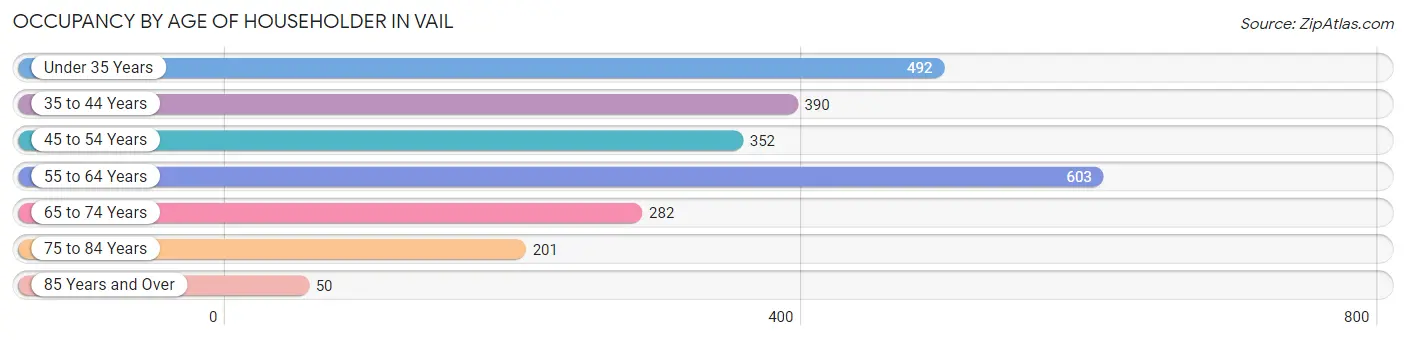
| Age Bracket | # Households | % Households |
| Under 35 Years | 492 | 20.8% |
| 35 to 44 Years | 390 | 16.5% |
| 45 to 54 Years | 352 | 14.8% |
| 55 to 64 Years | 603 | 25.4% |
| 65 to 74 Years | 282 | 11.9% |
| 75 to 84 Years | 201 | 8.5% |
| 85 Years and Over | 50 | 2.1% |
| Total | 2,370 | 100.0% |
Housing Finances in Vail
Median Income by Occupancy in Vail
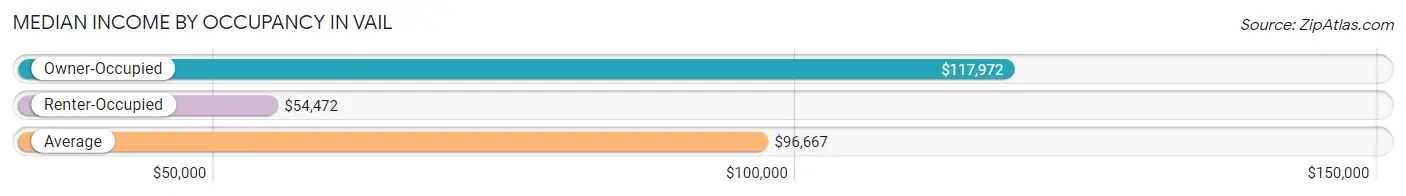
| Occupancy Type | # Households | Median Income |
| Owner-Occupied | 1,634 (69.0%) | $117,972 |
| Renter-Occupied | 736 (31.0%) | $54,472 |
| Average | 2,370 (100.0%) | $96,667 |
Occupancy by Householder Income Bracket in Vail
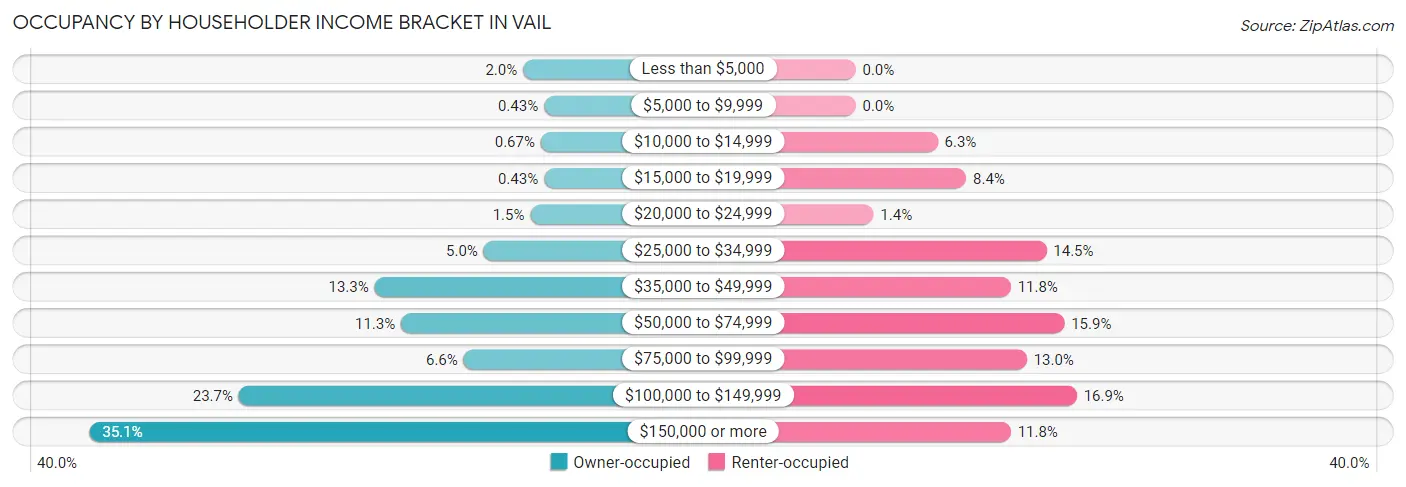
| Income Bracket | Owner-occupied | Renter-occupied |
| Less than $5,000 | 33 (2.0%) | 0 (0.0%) |
| $5,000 to $9,999 | 7 (0.4%) | 0 (0.0%) |
| $10,000 to $14,999 | 11 (0.7%) | 46 (6.2%) |
| $15,000 to $19,999 | 7 (0.4%) | 62 (8.4%) |
| $20,000 to $24,999 | 24 (1.5%) | 10 (1.4%) |
| $25,000 to $34,999 | 82 (5.0%) | 107 (14.5%) |
| $35,000 to $49,999 | 218 (13.3%) | 87 (11.8%) |
| $50,000 to $74,999 | 185 (11.3%) | 117 (15.9%) |
| $75,000 to $99,999 | 107 (6.6%) | 96 (13.0%) |
| $100,000 to $149,999 | 387 (23.7%) | 124 (16.9%) |
| $150,000 or more | 573 (35.1%) | 87 (11.8%) |
| Total | 1,634 (100.0%) | 736 (100.0%) |
Monthly Housing Cost Tiers in Vail
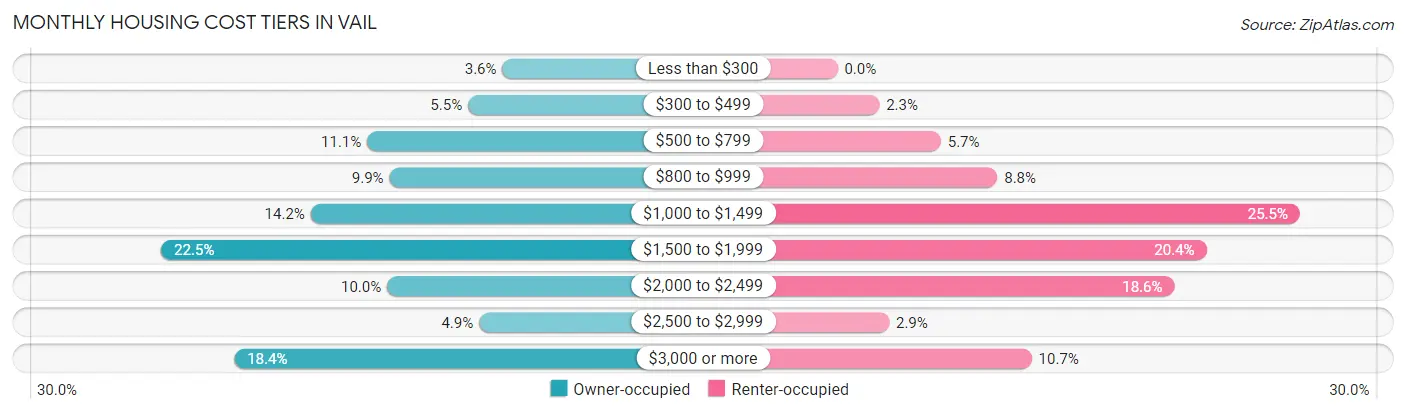
| Monthly Cost | Owner-occupied | Renter-occupied |
| Less than $300 | 59 (3.6%) | 0 (0.0%) |
| $300 to $499 | 90 (5.5%) | 17 (2.3%) |
| $500 to $799 | 181 (11.1%) | 42 (5.7%) |
| $800 to $999 | 161 (9.9%) | 65 (8.8%) |
| $1,000 to $1,499 | 232 (14.2%) | 188 (25.5%) |
| $1,500 to $1,999 | 367 (22.5%) | 150 (20.4%) |
| $2,000 to $2,499 | 163 (10.0%) | 137 (18.6%) |
| $2,500 to $2,999 | 80 (4.9%) | 21 (2.9%) |
| $3,000 or more | 301 (18.4%) | 79 (10.7%) |
| Total | 1,634 (100.0%) | 736 (100.0%) |
Physical Housing Characteristics in Vail
Housing Structures in Vail
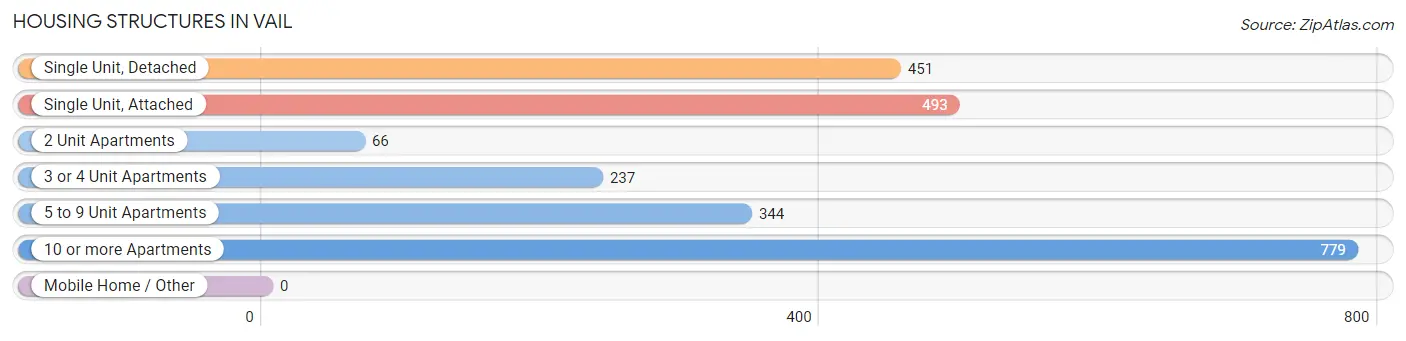
| Structure Type | # Housing Units | % Housing Units |
| Single Unit, Detached | 451 | 19.0% |
| Single Unit, Attached | 493 | 20.8% |
| 2 Unit Apartments | 66 | 2.8% |
| 3 or 4 Unit Apartments | 237 | 10.0% |
| 5 to 9 Unit Apartments | 344 | 14.5% |
| 10 or more Apartments | 779 | 32.9% |
| Mobile Home / Other | 0 | 0.0% |
| Total | 2,370 | 100.0% |
Housing Structures by Occupancy in Vail
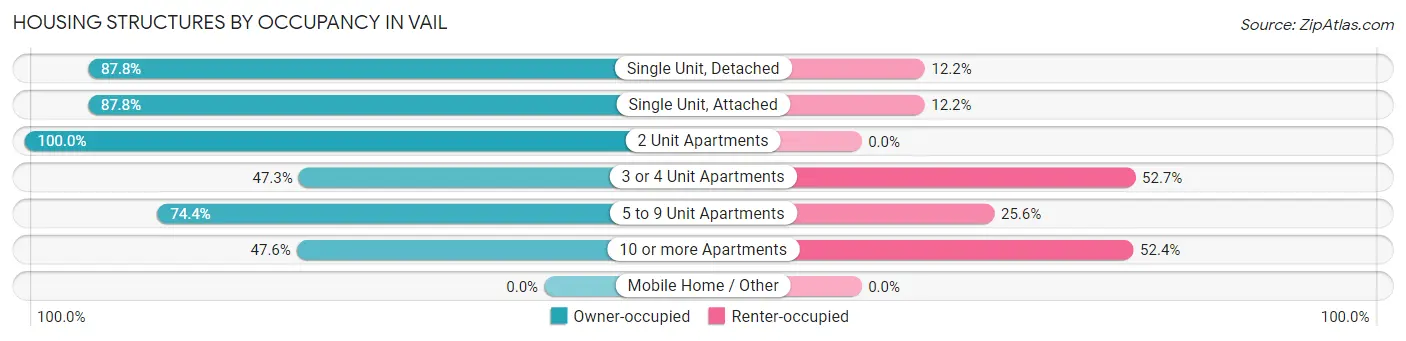
| Structure Type | Owner-occupied | Renter-occupied |
| Single Unit, Detached | 396 (87.8%) | 55 (12.2%) |
| Single Unit, Attached | 433 (87.8%) | 60 (12.2%) |
| 2 Unit Apartments | 66 (100.0%) | 0 (0.0%) |
| 3 or 4 Unit Apartments | 112 (47.3%) | 125 (52.7%) |
| 5 to 9 Unit Apartments | 256 (74.4%) | 88 (25.6%) |
| 10 or more Apartments | 371 (47.6%) | 408 (52.4%) |
| Mobile Home / Other | 0 (0.0%) | 0 (0.0%) |
| Total | 1,634 (69.0%) | 736 (31.0%) |
Housing Structures by Number of Rooms in Vail
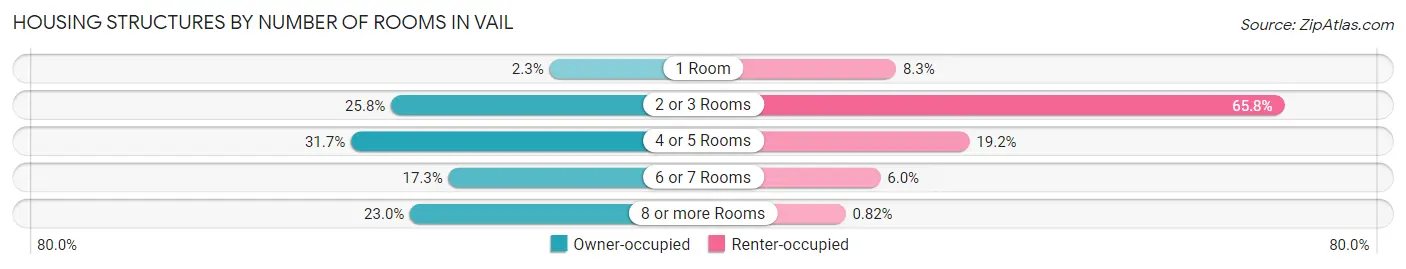
| Number of Rooms | Owner-occupied | Renter-occupied |
| 1 Room | 38 (2.3%) | 61 (8.3%) |
| 2 or 3 Rooms | 421 (25.8%) | 484 (65.8%) |
| 4 or 5 Rooms | 518 (31.7%) | 141 (19.2%) |
| 6 or 7 Rooms | 282 (17.3%) | 44 (6.0%) |
| 8 or more Rooms | 375 (23.0%) | 6 (0.8%) |
| Total | 1,634 (100.0%) | 736 (100.0%) |
Housing Structure by Heating Type in Vail
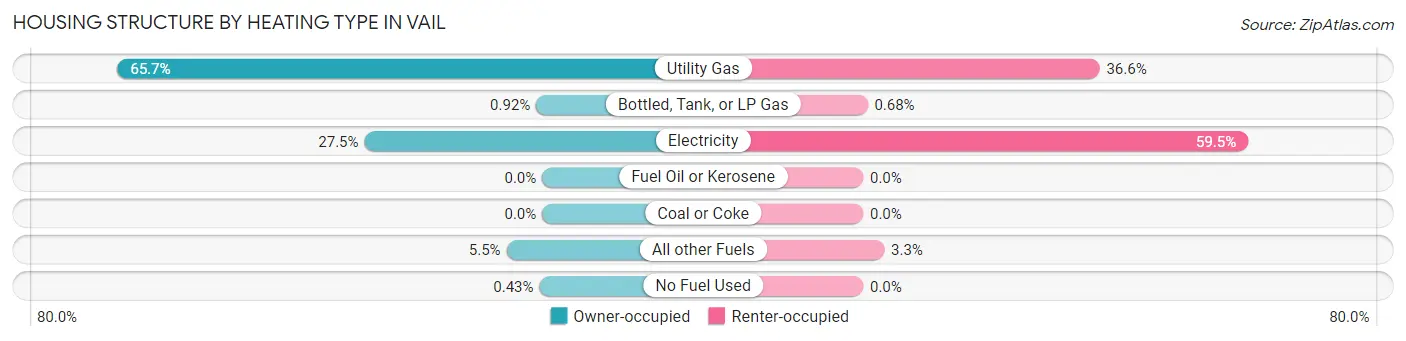
| Heating Type | Owner-occupied | Renter-occupied |
| Utility Gas | 1,073 (65.7%) | 269 (36.5%) |
| Bottled, Tank, or LP Gas | 15 (0.9%) | 5 (0.7%) |
| Electricity | 449 (27.5%) | 438 (59.5%) |
| Fuel Oil or Kerosene | 0 (0.0%) | 0 (0.0%) |
| Coal or Coke | 0 (0.0%) | 0 (0.0%) |
| All other Fuels | 90 (5.5%) | 24 (3.3%) |
| No Fuel Used | 7 (0.4%) | 0 (0.0%) |
| Total | 1,634 (100.0%) | 736 (100.0%) |
Household Vehicle Usage in Vail
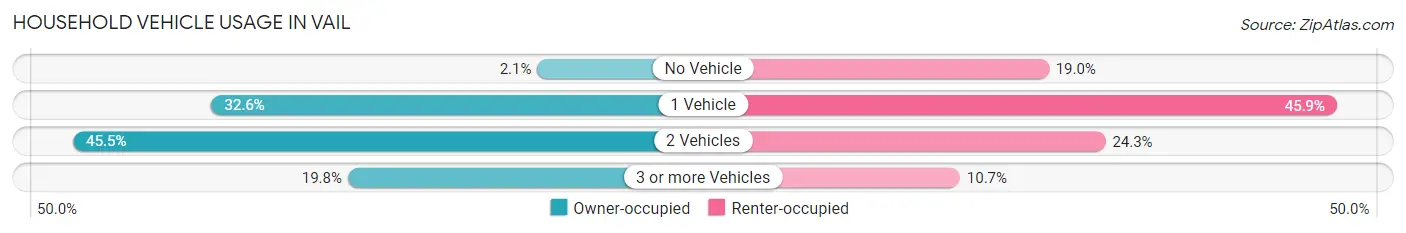
| Vehicles per Household | Owner-occupied | Renter-occupied |
| No Vehicle | 35 (2.1%) | 140 (19.0%) |
| 1 Vehicle | 532 (32.6%) | 338 (45.9%) |
| 2 Vehicles | 743 (45.5%) | 179 (24.3%) |
| 3 or more Vehicles | 324 (19.8%) | 79 (10.7%) |
| Total | 1,634 (100.0%) | 736 (100.0%) |
Real Estate & Mortgages in Vail
Real Estate and Mortgage Overview in Vail
| Characteristic | Without Mortgage | With Mortgage |
| Housing Units | 779 | 855 |
| Median Property Value | $991,300 | $715,100 |
| Median Household Income | $79,803 | $307 |
| Monthly Housing Costs | $935 | $286 |
| Real Estate Taxes | $3,536 | $0 |
Property Value by Mortgage Status in Vail
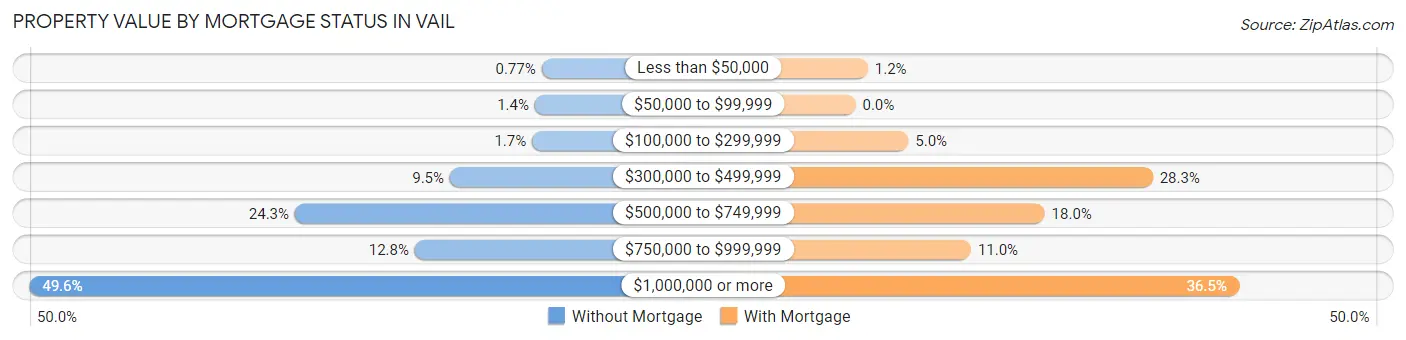
| Property Value | Without Mortgage | With Mortgage |
| Less than $50,000 | 6 (0.8%) | 10 (1.2%) |
| $50,000 to $99,999 | 11 (1.4%) | 0 (0.0%) |
| $100,000 to $299,999 | 13 (1.7%) | 43 (5.0%) |
| $300,000 to $499,999 | 74 (9.5%) | 242 (28.3%) |
| $500,000 to $749,999 | 189 (24.3%) | 154 (18.0%) |
| $750,000 to $999,999 | 100 (12.8%) | 94 (11.0%) |
| $1,000,000 or more | 386 (49.5%) | 312 (36.5%) |
| Total | 779 (100.0%) | 855 (100.0%) |
Household Income by Mortgage Status in Vail
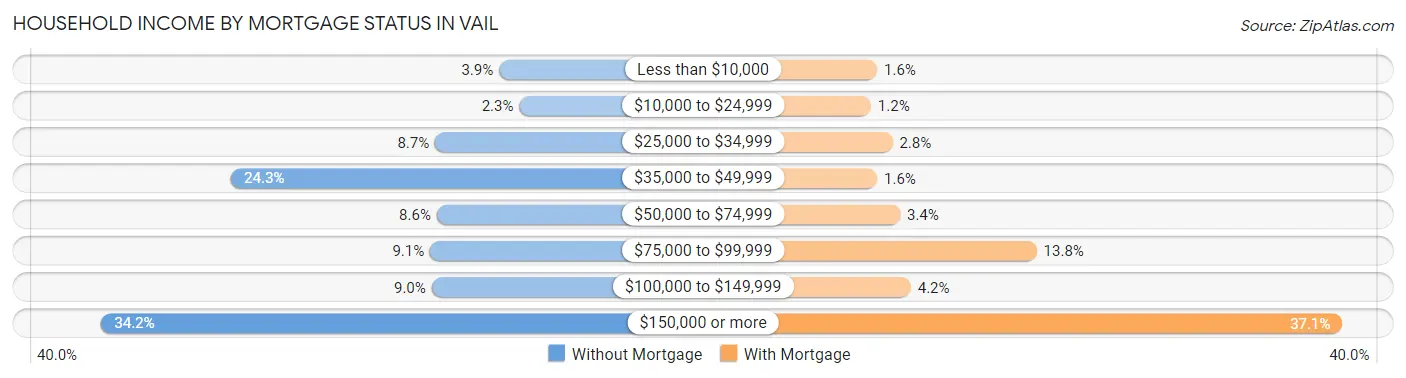
| Household Income | Without Mortgage | With Mortgage |
| Less than $10,000 | 30 (3.8%) | 14 (1.6%) |
| $10,000 to $24,999 | 18 (2.3%) | 10 (1.2%) |
| $25,000 to $34,999 | 68 (8.7%) | 24 (2.8%) |
| $35,000 to $49,999 | 189 (24.3%) | 14 (1.6%) |
| $50,000 to $74,999 | 67 (8.6%) | 29 (3.4%) |
| $75,000 to $99,999 | 71 (9.1%) | 118 (13.8%) |
| $100,000 to $149,999 | 70 (9.0%) | 36 (4.2%) |
| $150,000 or more | 266 (34.2%) | 317 (37.1%) |
| Total | 779 (100.0%) | 855 (100.0%) |
Property Value to Household Income Ratio in Vail
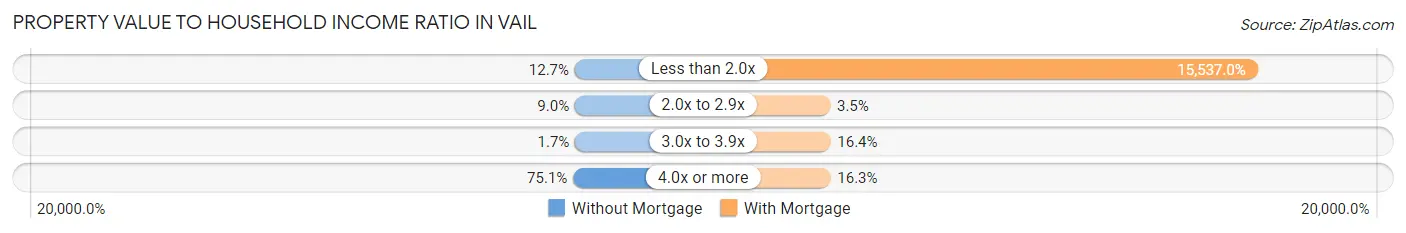
| Value-to-Income Ratio | Without Mortgage | With Mortgage |
| Less than 2.0x | 99 (12.7%) | 132,841 (15,537.0%) |
| 2.0x to 2.9x | 70 (9.0%) | 30 (3.5%) |
| 3.0x to 3.9x | 13 (1.7%) | 140 (16.4%) |
| 4.0x or more | 585 (75.1%) | 139 (16.3%) |
| Total | 779 (100.0%) | 855 (100.0%) |
Real Estate Taxes by Mortgage Status in Vail
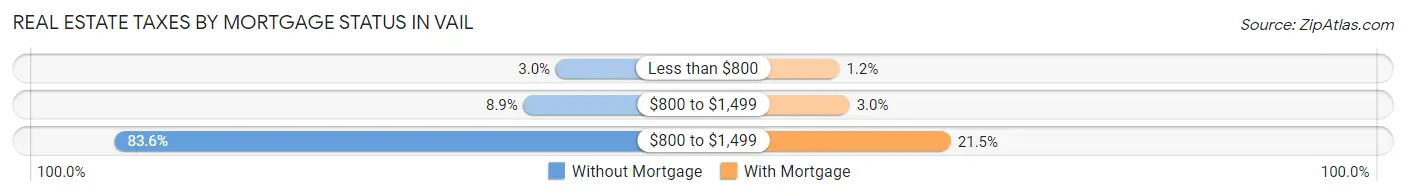
| Property Taxes | Without Mortgage | With Mortgage |
| Less than $800 | 23 (2.9%) | 10 (1.2%) |
| $800 to $1,499 | 69 (8.9%) | 26 (3.0%) |
| $800 to $1,499 | 651 (83.6%) | 184 (21.5%) |
| Total | 779 (100.0%) | 855 (100.0%) |
Health & Disability in Vail
Health Insurance Coverage by Age in Vail
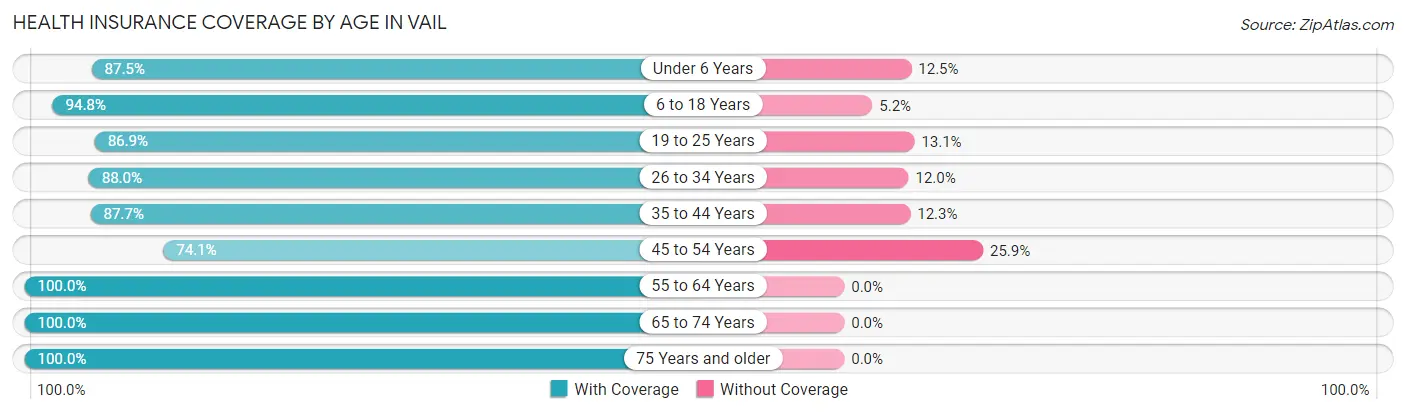
| Age Bracket | With Coverage | Without Coverage |
| Under 6 Years | 56 (87.5%) | 8 (12.5%) |
| 6 to 18 Years | 272 (94.8%) | 15 (5.2%) |
| 19 to 25 Years | 392 (86.9%) | 59 (13.1%) |
| 26 to 34 Years | 661 (88.0%) | 90 (12.0%) |
| 35 to 44 Years | 606 (87.7%) | 85 (12.3%) |
| 45 to 54 Years | 504 (74.1%) | 176 (25.9%) |
| 55 to 64 Years | 1,038 (100.0%) | 0 (0.0%) |
| 65 to 74 Years | 481 (100.0%) | 0 (0.0%) |
| 75 Years and older | 366 (100.0%) | 0 (0.0%) |
| Total | 4,376 (91.0%) | 433 (9.0%) |
Health Insurance Coverage by Citizenship Status in Vail
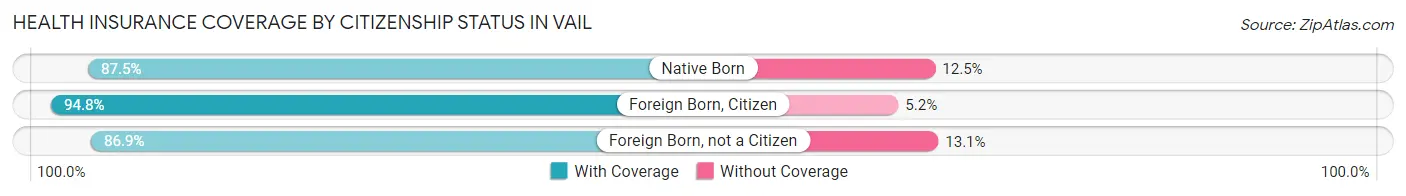
| Citizenship Status | With Coverage | Without Coverage |
| Native Born | 56 (87.5%) | 8 (12.5%) |
| Foreign Born, Citizen | 272 (94.8%) | 15 (5.2%) |
| Foreign Born, not a Citizen | 392 (86.9%) | 59 (13.1%) |
Health Insurance Coverage by Household Income in Vail
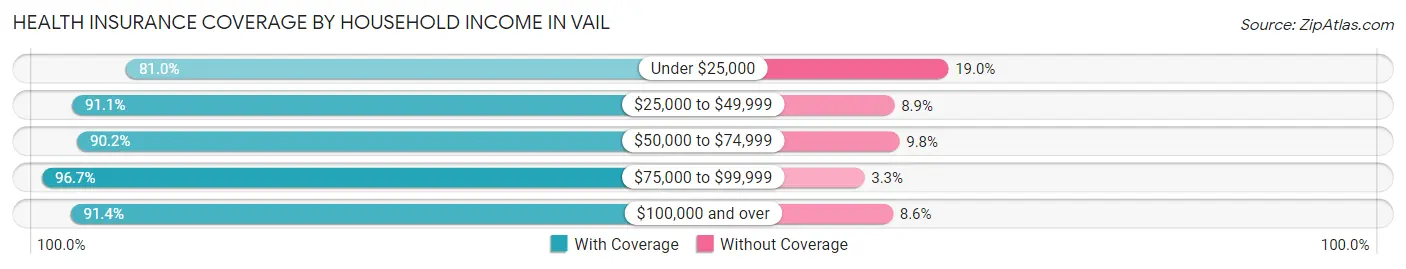
| Household Income | With Coverage | Without Coverage |
| Under $25,000 | 243 (81.0%) | 57 (19.0%) |
| $25,000 to $49,999 | 656 (91.1%) | 64 (8.9%) |
| $50,000 to $74,999 | 422 (90.2%) | 46 (9.8%) |
| $75,000 to $99,999 | 383 (96.7%) | 13 (3.3%) |
| $100,000 and over | 2,670 (91.4%) | 252 (8.6%) |
Public vs Private Health Insurance Coverage by Age in Vail
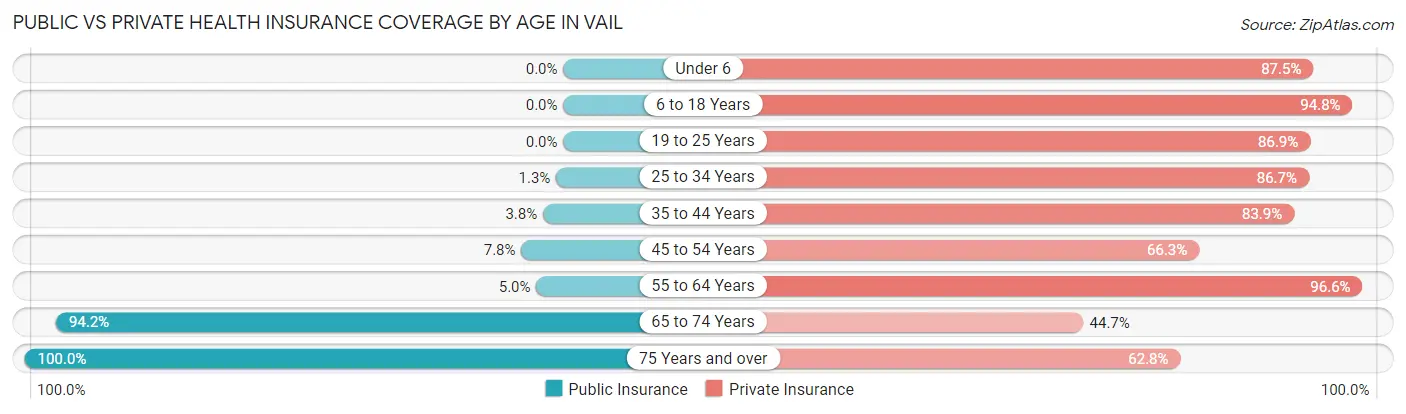
| Age Bracket | Public Insurance | Private Insurance |
| Under 6 | 0 (0.0%) | 56 (87.5%) |
| 6 to 18 Years | 0 (0.0%) | 272 (94.8%) |
| 19 to 25 Years | 0 (0.0%) | 392 (86.9%) |
| 25 to 34 Years | 10 (1.3%) | 651 (86.7%) |
| 35 to 44 Years | 26 (3.8%) | 580 (83.9%) |
| 45 to 54 Years | 53 (7.8%) | 451 (66.3%) |
| 55 to 64 Years | 52 (5.0%) | 1,003 (96.6%) |
| 65 to 74 Years | 453 (94.2%) | 215 (44.7%) |
| 75 Years and over | 366 (100.0%) | 230 (62.8%) |
| Total | 960 (20.0%) | 3,850 (80.1%) |
Disability Status by Sex by Age in Vail
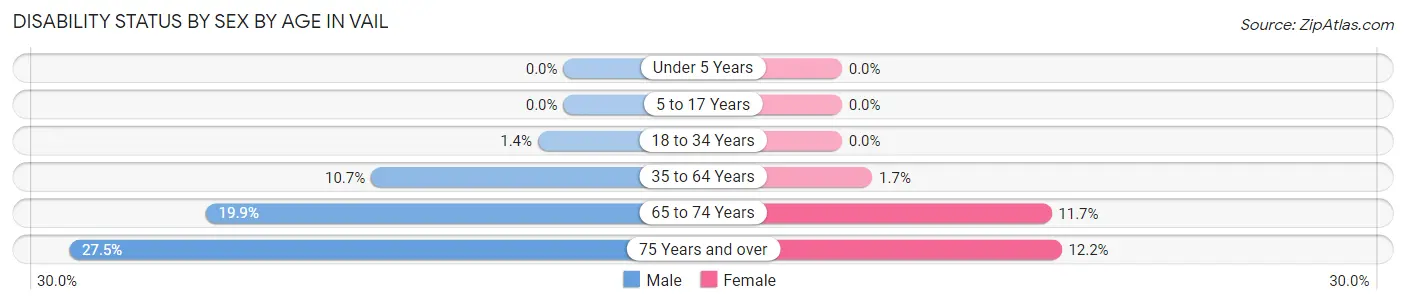
| Age Bracket | Male | Female |
| Under 5 Years | 0 (0.0%) | 0 (0.0%) |
| 5 to 17 Years | 0 (0.0%) | 0 (0.0%) |
| 18 to 34 Years | 10 (1.4%) | 0 (0.0%) |
| 35 to 64 Years | 144 (10.7%) | 18 (1.7%) |
| 65 to 74 Years | 48 (19.9%) | 28 (11.7%) |
| 75 Years and over | 49 (27.5%) | 23 (12.2%) |
Disability Class by Sex by Age in Vail
Disability Class: Hearing Difficulty
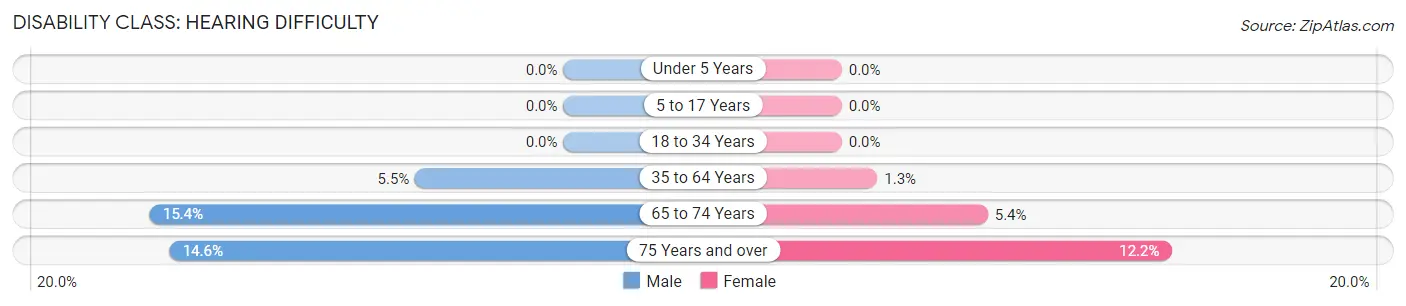
| Age Bracket | Male | Female |
| Under 5 Years | 0 (0.0%) | 0 (0.0%) |
| 5 to 17 Years | 0 (0.0%) | 0 (0.0%) |
| 18 to 34 Years | 0 (0.0%) | 0 (0.0%) |
| 35 to 64 Years | 74 (5.5%) | 14 (1.3%) |
| 65 to 74 Years | 37 (15.3%) | 13 (5.4%) |
| 75 Years and over | 26 (14.6%) | 23 (12.2%) |
Disability Class: Vision Difficulty
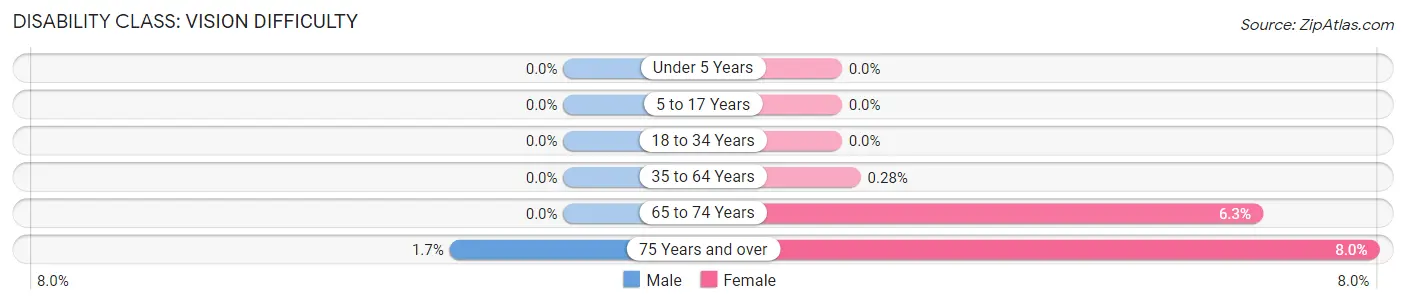
| Age Bracket | Male | Female |
| Under 5 Years | 0 (0.0%) | 0 (0.0%) |
| 5 to 17 Years | 0 (0.0%) | 0 (0.0%) |
| 18 to 34 Years | 0 (0.0%) | 0 (0.0%) |
| 35 to 64 Years | 0 (0.0%) | 3 (0.3%) |
| 65 to 74 Years | 0 (0.0%) | 15 (6.2%) |
| 75 Years and over | 3 (1.7%) | 15 (8.0%) |
Disability Class: Cognitive Difficulty
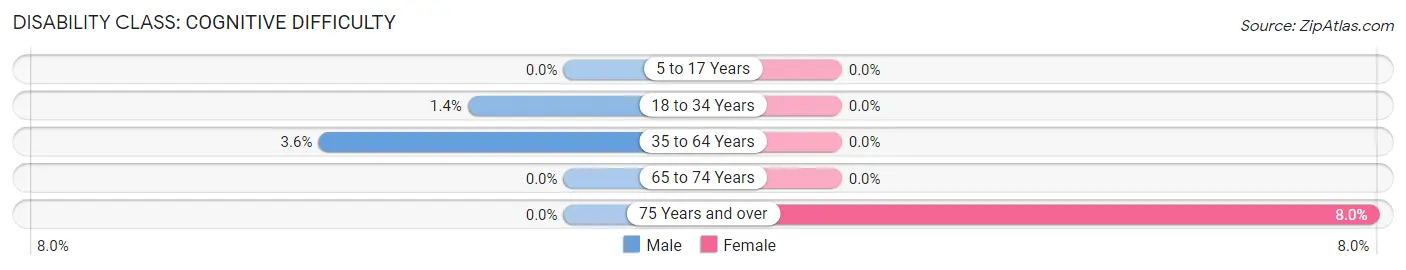
| Age Bracket | Male | Female |
| 5 to 17 Years | 0 (0.0%) | 0 (0.0%) |
| 18 to 34 Years | 10 (1.4%) | 0 (0.0%) |
| 35 to 64 Years | 49 (3.6%) | 0 (0.0%) |
| 65 to 74 Years | 0 (0.0%) | 0 (0.0%) |
| 75 Years and over | 0 (0.0%) | 15 (8.0%) |
Disability Class: Ambulatory Difficulty
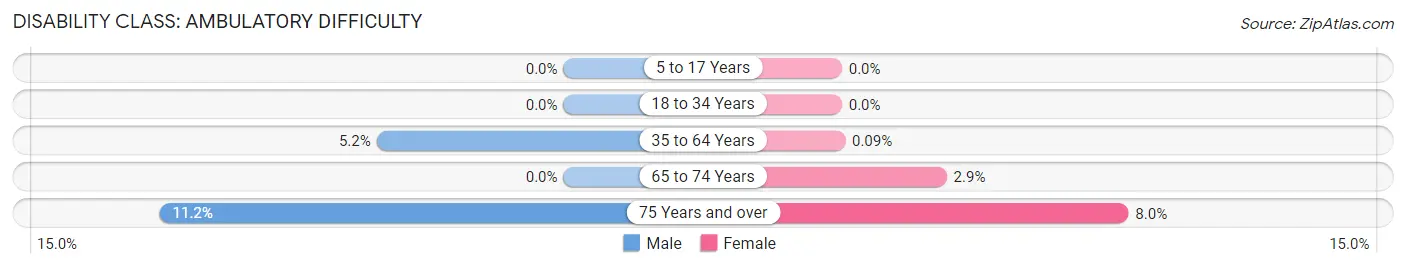
| Age Bracket | Male | Female |
| 5 to 17 Years | 0 (0.0%) | 0 (0.0%) |
| 18 to 34 Years | 0 (0.0%) | 0 (0.0%) |
| 35 to 64 Years | 70 (5.2%) | 1 (0.1%) |
| 65 to 74 Years | 0 (0.0%) | 7 (2.9%) |
| 75 Years and over | 20 (11.2%) | 15 (8.0%) |
Disability Class: Self-Care Difficulty
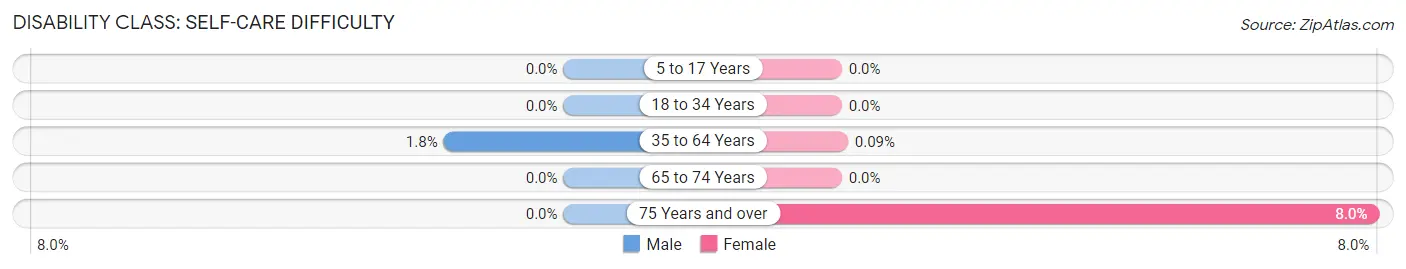
| Age Bracket | Male | Female |
| 5 to 17 Years | 0 (0.0%) | 0 (0.0%) |
| 18 to 34 Years | 0 (0.0%) | 0 (0.0%) |
| 35 to 64 Years | 24 (1.8%) | 1 (0.1%) |
| 65 to 74 Years | 0 (0.0%) | 0 (0.0%) |
| 75 Years and over | 0 (0.0%) | 15 (8.0%) |
Technology Access in Vail
Computing Device Access in Vail
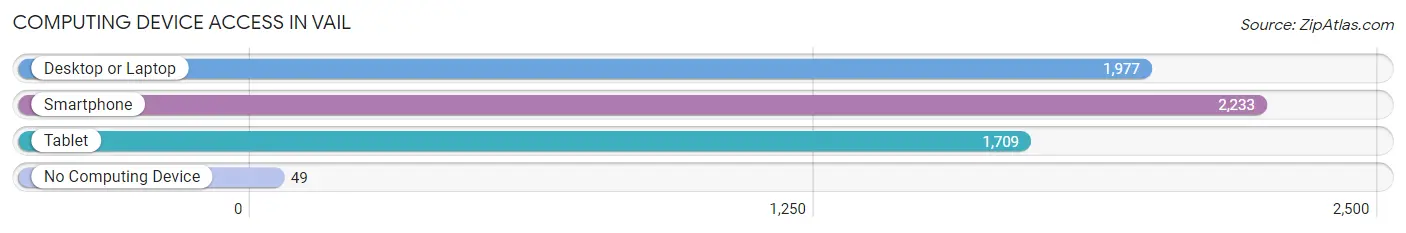
| Device Type | # Households | % Households |
| Desktop or Laptop | 1,977 | 83.4% |
| Smartphone | 2,233 | 94.2% |
| Tablet | 1,709 | 72.1% |
| No Computing Device | 49 | 2.1% |
| Total | 2,370 | 100.0% |
Internet Access in Vail
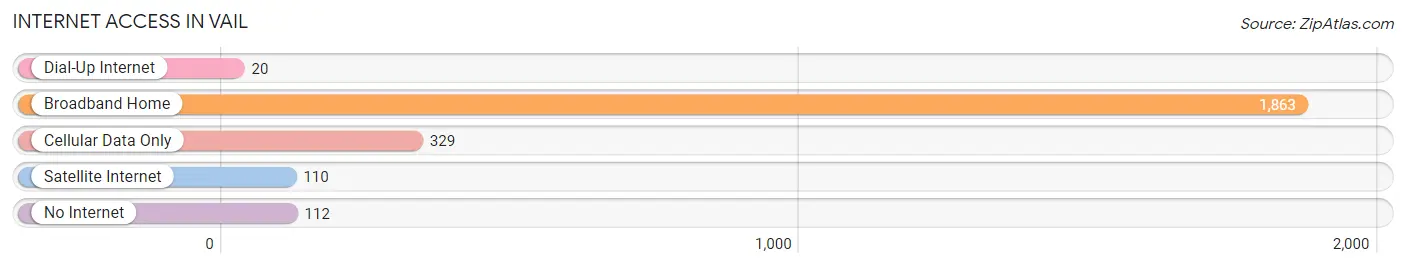
| Internet Type | # Households | % Households |
| Dial-Up Internet | 20 | 0.8% |
| Broadband Home | 1,863 | 78.6% |
| Cellular Data Only | 329 | 13.9% |
| Satellite Internet | 110 | 4.6% |
| No Internet | 112 | 4.7% |
| Total | 2,370 | 100.0% |
Vail Summary
Vail, Colorado is a small mountain town located in Eagle County, Colorado. It is situated in the Rocky Mountains, approximately 100 miles west of Denver. Vail is known for its world-class skiing and snowboarding, and is one of the most popular ski resorts in the United States. The town was founded in 1962, and has since become a popular destination for tourists and locals alike.
Geography
Vail is located in the Rocky Mountains, at an elevation of 8,150 feet. The town is surrounded by the White River National Forest, and is situated in a valley between the Gore Range and the Sawatch Range. The town is located in Eagle County, and is approximately 100 miles west of Denver.
The climate in Vail is generally mild, with cold winters and warm summers. The average temperature in the winter is around 20 degrees Fahrenheit, and the average temperature in the summer is around 70 degrees Fahrenheit. The town receives an average of 300 inches of snow each year, making it an ideal destination for skiing and snowboarding.
Economy
Vail's economy is largely based on tourism. The town is home to several ski resorts, including Vail Mountain, Beaver Creek, and Breckenridge. These resorts attract thousands of visitors each year, and generate millions of dollars in revenue for the town. In addition to skiing and snowboarding, Vail is also home to a variety of other attractions, including shopping, dining, and entertainment.
The town is also home to several businesses, including restaurants, hotels, and retail stores. These businesses provide jobs for local residents, and contribute to the town's economy.
Demographics
As of the 2010 census, Vail had a population of 5,305. The town is predominantly white, with approximately 90% of the population identifying as Caucasian. The median household income in Vail is $90,000, and the median home value is $1.2 million.
Conclusion
Vail, Colorado is a small mountain town located in Eagle County, Colorado. It is known for its world-class skiing and snowboarding, and is one of the most popular ski resorts in the United States. The town's economy is largely based on tourism, and it is home to several businesses, including restaurants, hotels, and retail stores. The population of Vail is predominantly white, with a median household income of $90,000 and a median home value of $1.2 million.
Common Questions
What is Per Capita Income in Vail?
Per Capita income in Vail is $80,145.
What is the Median Family Income in Vail?
Median Family Income in Vail is $128,000.
What is the Median Household income in Vail?
Median Household Income in Vail is $96,667.
What is Income or Wage Gap in Vail?
Income or Wage Gap in Vail is 7.9%.
Women in Vail earn 92.1 cents for every dollar earned by a man.
What is Inequality or Gini Index in Vail?
Inequality or Gini Index in Vail is 0.54.
What is the Total Population of Vail?
Total Population of Vail is 4,833.
What is the Total Male Population of Vail?
Total Male Population of Vail is 2,695.
What is the Total Female Population of Vail?
Total Female Population of Vail is 2,138.
What is the Ratio of Males per 100 Females in Vail?
There are 126.05 Males per 100 Females in Vail.
What is the Ratio of Females per 100 Males in Vail?
There are 79.33 Females per 100 Males in Vail.
What is the Median Population Age in Vail?
Median Population Age in Vail is 49.1 Years.
What is the Average Family Size in Vail
Average Family Size in Vail is 2.5 People.
What is the Average Household Size in Vail
Average Household Size in Vail is 2.0 People.
How Large is the Labor Force in Vail?
There are 3,372 People in the Labor Forcein in Vail.
What is the Percentage of People in the Labor Force in Vail?
74.2% of People are in the Labor Force in Vail.
What is the Unemployment Rate in Vail?
Unemployment Rate in Vail is 7.6%.