Colorado City, CO Map & Demographics
Colorado City Map
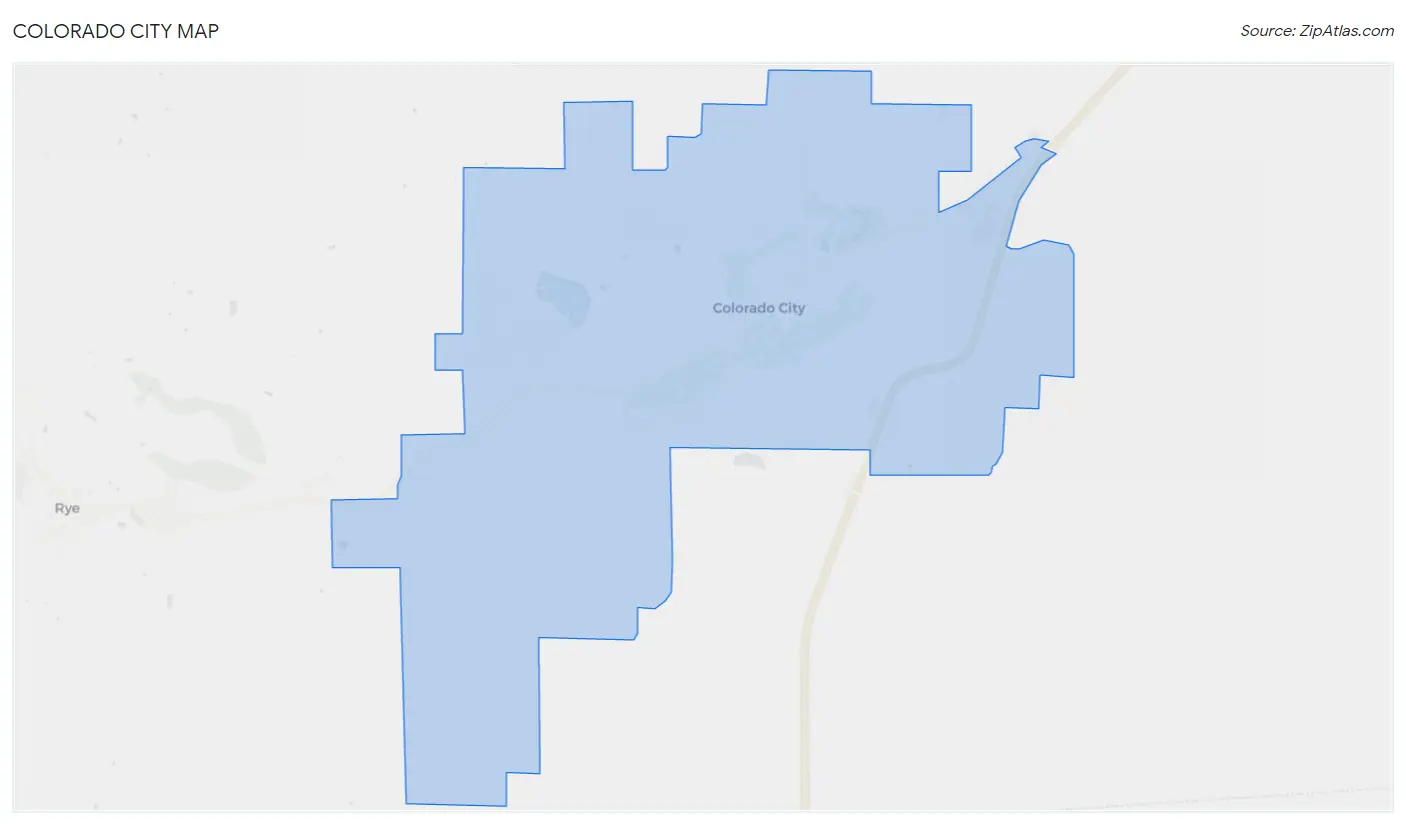
Colorado City Overview
$32,717
PER CAPITA INCOME
$88,420
AVG FAMILY INCOME
$55,759
AVG HOUSEHOLD INCOME
0.48
INEQUALITY / GINI INDEX
1,932
TOTAL POPULATION
850
MALE POPULATION
1,082
FEMALE POPULATION
78.56
MALES / 100 FEMALES
127.29
FEMALES / 100 MALES
48.0
MEDIAN AGE
3.1
AVG FAMILY SIZE
2.4
AVG HOUSEHOLD SIZE
785
LABOR FORCE [ PEOPLE ]
46.4%
PERCENT IN LABOR FORCE
Colorado City Zip Codes
Colorado City Area Codes
Income in Colorado City
Income Overview in Colorado City
Per Capita Income in Colorado City is $32,717, while median incomes of families and households are $88,420 and $55,759 respectively.
| Characteristic | Number | Measure |
| Per Capita Income | 1,932 | $32,717 |
| Median Family Income | 507 | $88,420 |
| Mean Family Income | 507 | $106,295 |
| Median Household Income | 809 | $55,759 |
| Mean Household Income | 809 | $77,113 |
| Income Deficit | 507 | $0 |
| Wage / Income Gap (%) | 1,932 | 0.00% |
| Wage / Income Gap ($) | 1,932 | 100.00¢ per $1 |
| Gini / Inequality Index | 1,932 | 0.48 |
Earnings by Sex in Colorado City
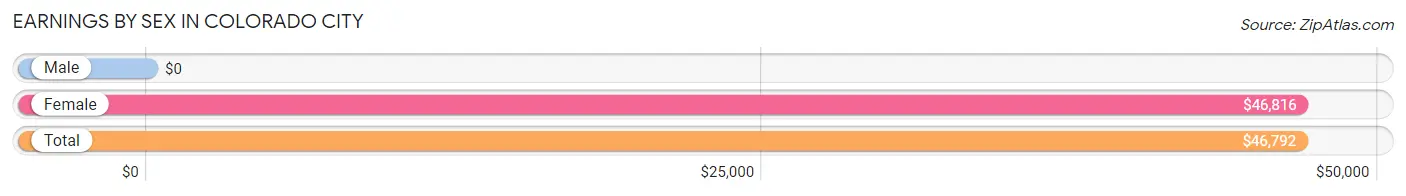
| Sex | Number | Average Earnings |
| Male | 381 (48.6%) | $0 |
| Female | 403 (51.4%) | $46,816 |
| Total | 784 (100.0%) | $46,792 |
Earnings by Sex by Income Bracket in Colorado City
The most common earnings brackets in Colorado City are $65,000 to $74,999 for men (132 | 34.6%) and $75,000 to $99,999 for women (82 | 20.3%).
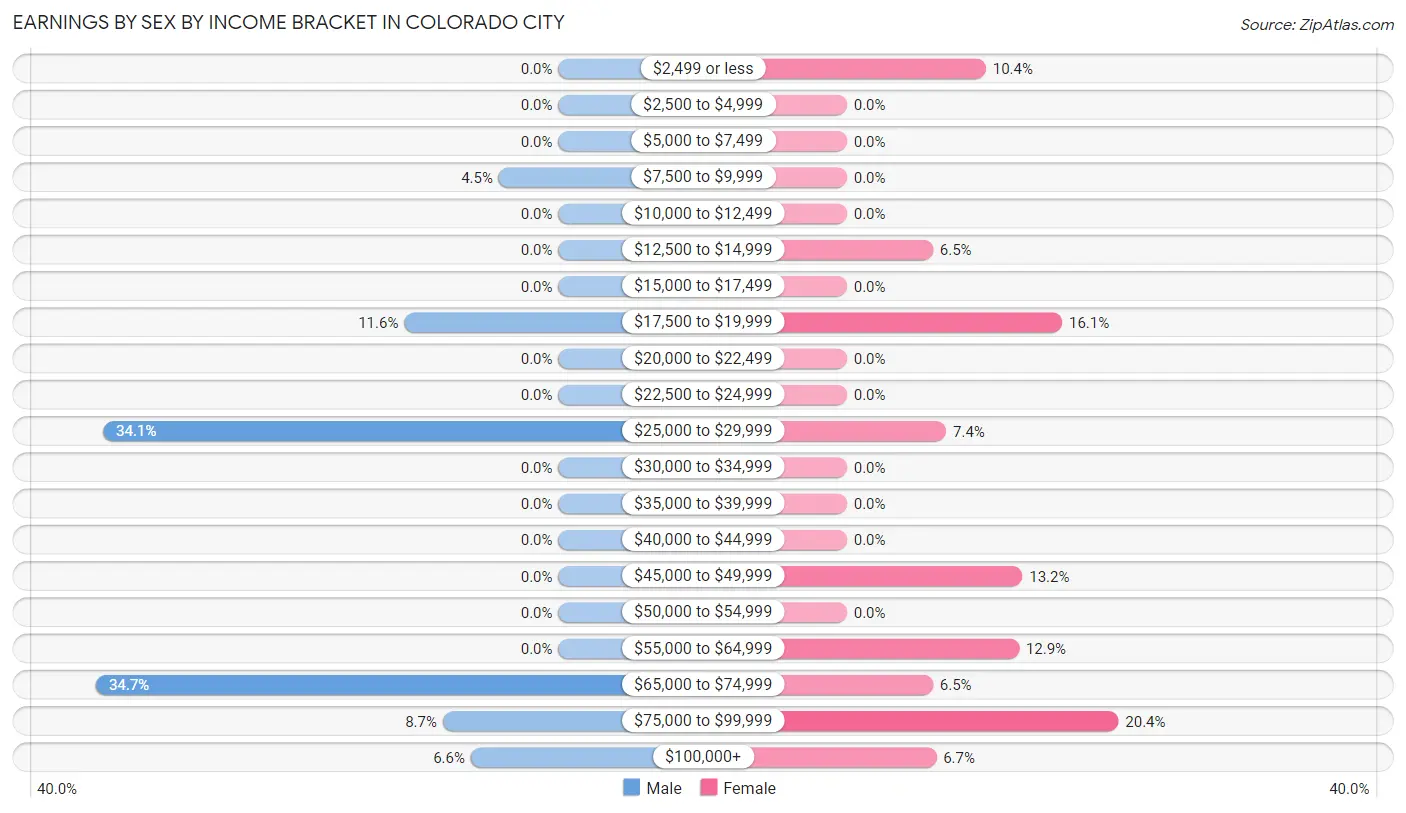
| Income | Male | Female |
| $2,499 or less | 0 (0.0%) | 42 (10.4%) |
| $2,500 to $4,999 | 0 (0.0%) | 0 (0.0%) |
| $5,000 to $7,499 | 0 (0.0%) | 0 (0.0%) |
| $7,500 to $9,999 | 17 (4.5%) | 0 (0.0%) |
| $10,000 to $12,499 | 0 (0.0%) | 0 (0.0%) |
| $12,500 to $14,999 | 0 (0.0%) | 26 (6.5%) |
| $15,000 to $17,499 | 0 (0.0%) | 0 (0.0%) |
| $17,500 to $19,999 | 44 (11.6%) | 65 (16.1%) |
| $20,000 to $22,499 | 0 (0.0%) | 0 (0.0%) |
| $22,500 to $24,999 | 0 (0.0%) | 0 (0.0%) |
| $25,000 to $29,999 | 130 (34.1%) | 30 (7.4%) |
| $30,000 to $34,999 | 0 (0.0%) | 0 (0.0%) |
| $35,000 to $39,999 | 0 (0.0%) | 0 (0.0%) |
| $40,000 to $44,999 | 0 (0.0%) | 0 (0.0%) |
| $45,000 to $49,999 | 0 (0.0%) | 53 (13.2%) |
| $50,000 to $54,999 | 0 (0.0%) | 0 (0.0%) |
| $55,000 to $64,999 | 0 (0.0%) | 52 (12.9%) |
| $65,000 to $74,999 | 132 (34.6%) | 26 (6.5%) |
| $75,000 to $99,999 | 33 (8.7%) | 82 (20.3%) |
| $100,000+ | 25 (6.6%) | 27 (6.7%) |
| Total | 381 (100.0%) | 403 (100.0%) |
Earnings by Sex by Educational Attainment in Colorado City
Average earnings in Colorado City are $67,067 for men and $61,827 for women, a difference of 7.8%. Men with an educational attainment of college or associate's degree enjoy the highest average annual earnings of $68,641, while those with college or associate's degree education earn the least with $68,641. Women with an educational attainment of bachelor's degree earn the most with the average annual earnings of $68,894, while those with college or associate's degree education have the smallest earnings of $61,827.
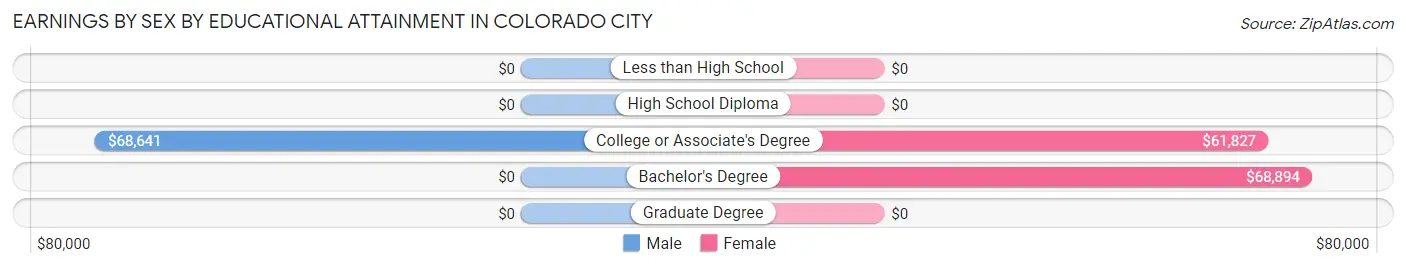
| Educational Attainment | Male Income | Female Income |
| Less than High School | - | - |
| High School Diploma | - | - |
| College or Associate's Degree | $68,641 | $61,827 |
| Bachelor's Degree | - | - |
| Graduate Degree | - | - |
| Total | $67,067 | $61,827 |
Family Income in Colorado City
Family Income Brackets in Colorado City
According to the Colorado City family income data, there are 117 families falling into the $150,000 to $199,999 income range, which is the most common income bracket and makes up 23.1% of all families.
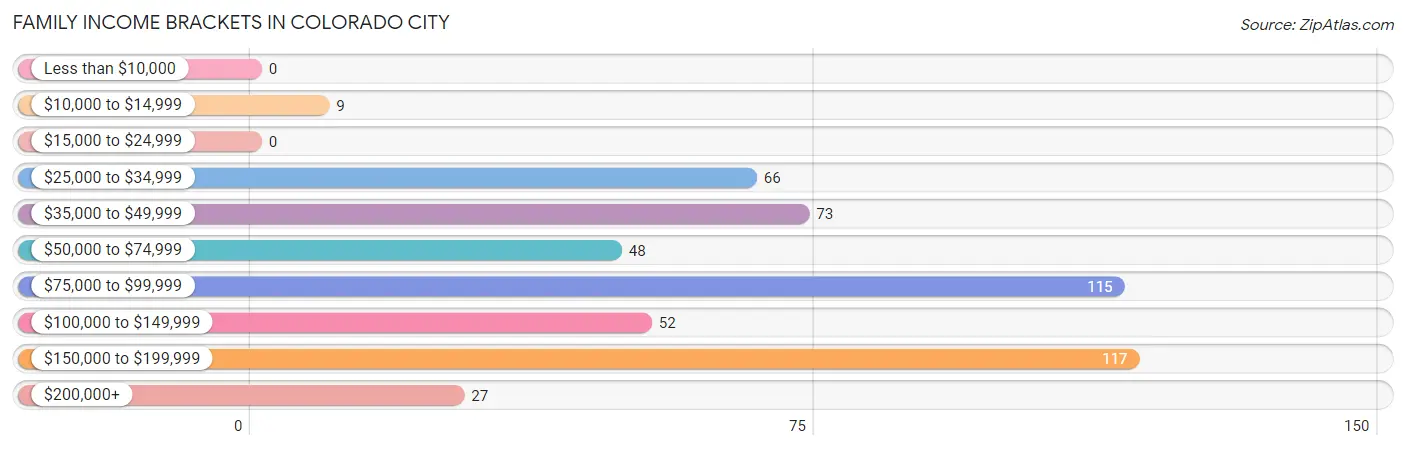
| Income Bracket | # Families | % Families |
| Less than $10,000 | 0 | 0.0% |
| $10,000 to $14,999 | 9 | 1.8% |
| $15,000 to $24,999 | 0 | 0.0% |
| $25,000 to $34,999 | 66 | 13.0% |
| $35,000 to $49,999 | 73 | 14.4% |
| $50,000 to $74,999 | 48 | 9.5% |
| $75,000 to $99,999 | 115 | 22.7% |
| $100,000 to $149,999 | 52 | 10.3% |
| $150,000 to $199,999 | 117 | 23.1% |
| $200,000+ | 27 | 5.3% |
Family Income by Famaliy Size in Colorado City
4-person families (122 | 24.1%) account for the highest median family income in Colorado City with $88,785 per family, while 4-person families (122 | 24.1%) have the highest median income of $22,196 per family member.
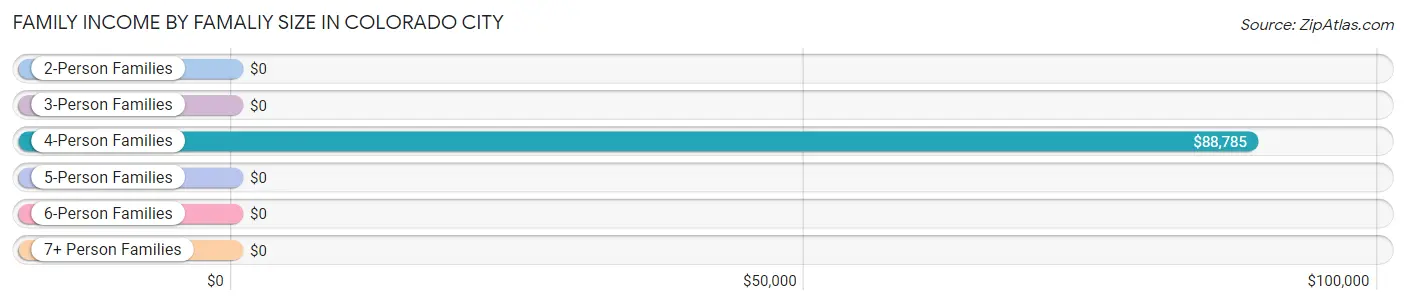
| Income Bracket | # Families | Median Income |
| 2-Person Families | 244 (48.1%) | $0 |
| 3-Person Families | 68 (13.4%) | $0 |
| 4-Person Families | 122 (24.1%) | $88,785 |
| 5-Person Families | 73 (14.4%) | $0 |
| 6-Person Families | 0 (0.0%) | $0 |
| 7+ Person Families | 0 (0.0%) | $0 |
| Total | 507 (100.0%) | $88,420 |
Family Income by Number of Earners in Colorado City
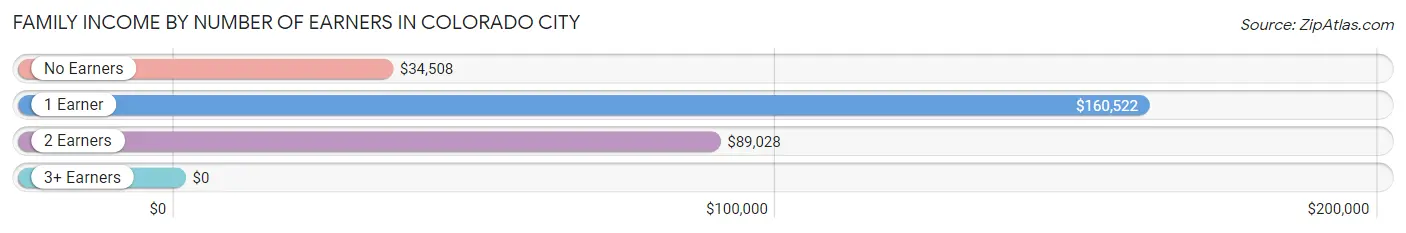
| Number of Earners | # Families | Median Income |
| No Earners | 124 (24.5%) | $34,508 |
| 1 Earner | 144 (28.4%) | $160,522 |
| 2 Earners | 212 (41.8%) | $89,028 |
| 3+ Earners | 27 (5.3%) | $0 |
| Total | 507 (100.0%) | $88,420 |
Household Income in Colorado City
Household Income Brackets in Colorado City
With 145 households falling in the category, the $75,000 to $99,999 income range is the most frequent in Colorado City, accounting for 17.9% of all households. In contrast, only 27 households (3.3%) fall into the $200,000+ income bracket, making it the least populous group.
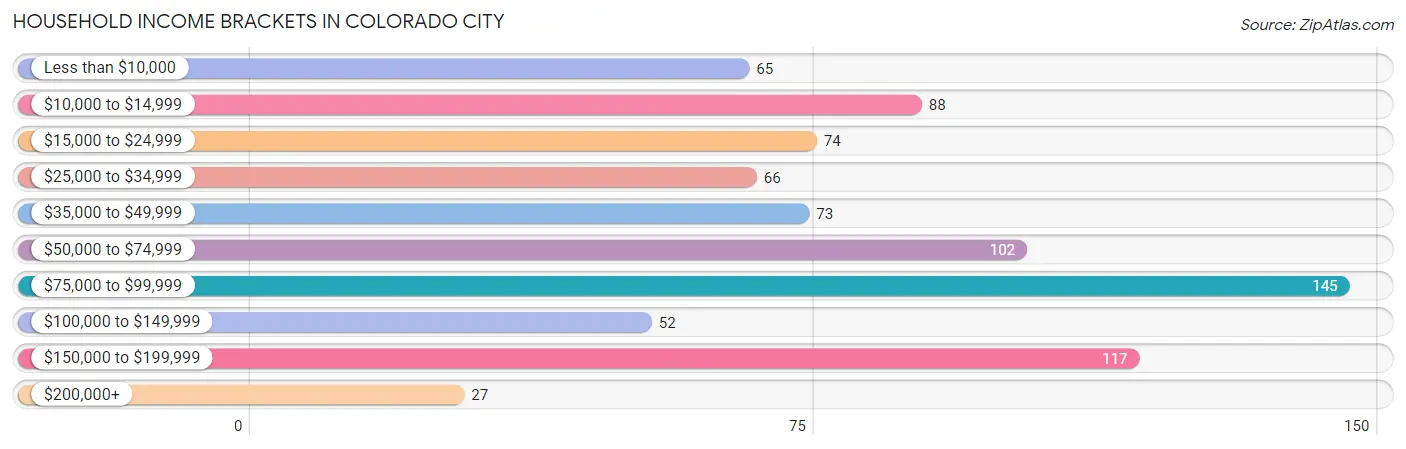
| Income Bracket | # Households | % Households |
| Less than $10,000 | 65 | 8.0% |
| $10,000 to $14,999 | 88 | 10.9% |
| $15,000 to $24,999 | 74 | 9.1% |
| $25,000 to $34,999 | 66 | 8.2% |
| $35,000 to $49,999 | 73 | 9.0% |
| $50,000 to $74,999 | 102 | 12.6% |
| $75,000 to $99,999 | 145 | 17.9% |
| $100,000 to $149,999 | 52 | 6.4% |
| $150,000 to $199,999 | 117 | 14.5% |
| $200,000+ | 27 | 3.3% |
Household Income by Householder Age in Colorado City
The median household income in Colorado City is $55,759, with the highest median household income of $76,823 found in the 25 to 44 years age bracket for the primary householder. A total of 157 households (19.4%) fall into this category. Meanwhile, the 15 to 24 years age bracket for the primary householder has the lowest median household income of $0, with 68 households (8.4%) in this group.
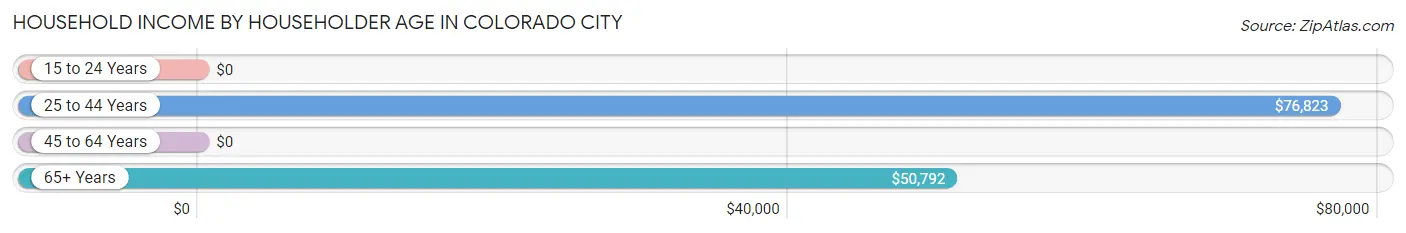
| Income Bracket | # Households | Median Income |
| 15 to 24 Years | 68 (8.4%) | $0 |
| 25 to 44 Years | 157 (19.4%) | $76,823 |
| 45 to 64 Years | 267 (33.0%) | $0 |
| 65+ Years | 317 (39.2%) | $50,792 |
| Total | 809 (100.0%) | $55,759 |
Poverty in Colorado City
Income Below Poverty by Sex and Age in Colorado City
With 8.9% poverty level for males and 7.8% for females among the residents of Colorado City, 55 to 64 year old males and 55 to 64 year old females are the most vulnerable to poverty, with 52 males (40.3%) and 26 females (19.0%) in their respective age groups living below the poverty level.
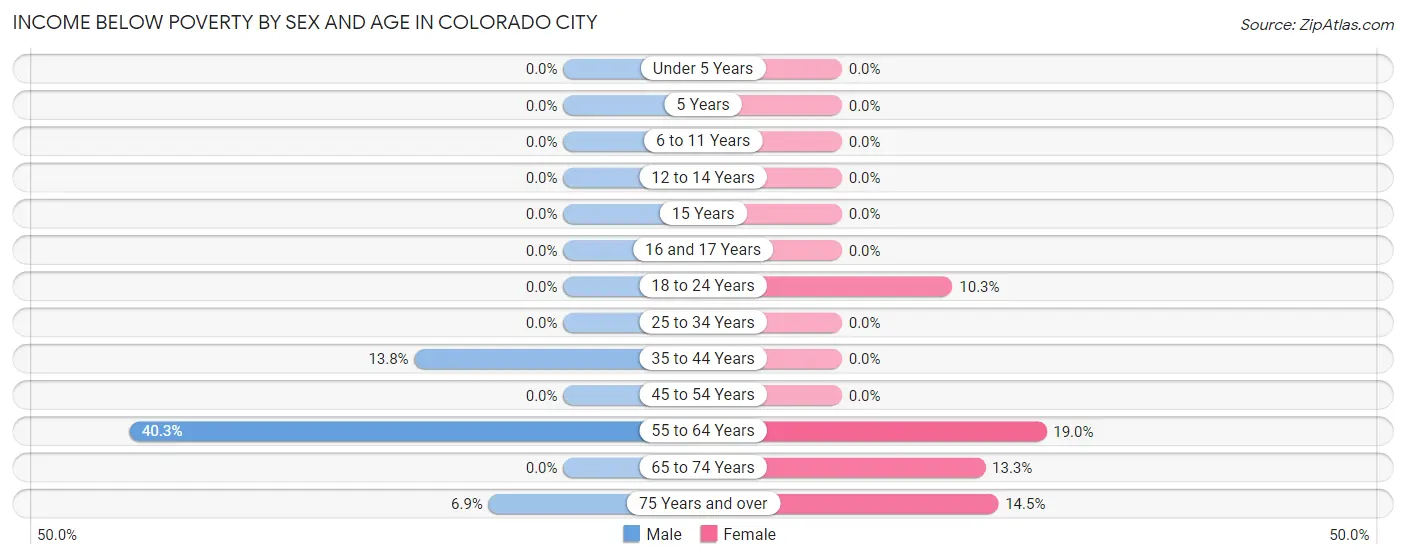
| Age Bracket | Male | Female |
| Under 5 Years | 0 (0.0%) | 0 (0.0%) |
| 5 Years | 0 (0.0%) | 0 (0.0%) |
| 6 to 11 Years | 0 (0.0%) | 0 (0.0%) |
| 12 to 14 Years | 0 (0.0%) | 0 (0.0%) |
| 15 Years | 0 (0.0%) | 0 (0.0%) |
| 16 and 17 Years | 0 (0.0%) | 0 (0.0%) |
| 18 to 24 Years | 0 (0.0%) | 24 (10.3%) |
| 25 to 34 Years | 0 (0.0%) | 0 (0.0%) |
| 35 to 44 Years | 17 (13.8%) | 0 (0.0%) |
| 45 to 54 Years | 0 (0.0%) | 0 (0.0%) |
| 55 to 64 Years | 52 (40.3%) | 26 (19.0%) |
| 65 to 74 Years | 0 (0.0%) | 25 (13.3%) |
| 75 Years and over | 7 (6.9%) | 9 (14.5%) |
| Total | 76 (8.9%) | 84 (7.8%) |
Income Above Poverty by Sex and Age in Colorado City
According to the poverty statistics in Colorado City, males aged 5 years and females aged under 5 years are the age groups that are most secure financially, with 100.0% of males and 100.0% of females in these age groups living above the poverty line.
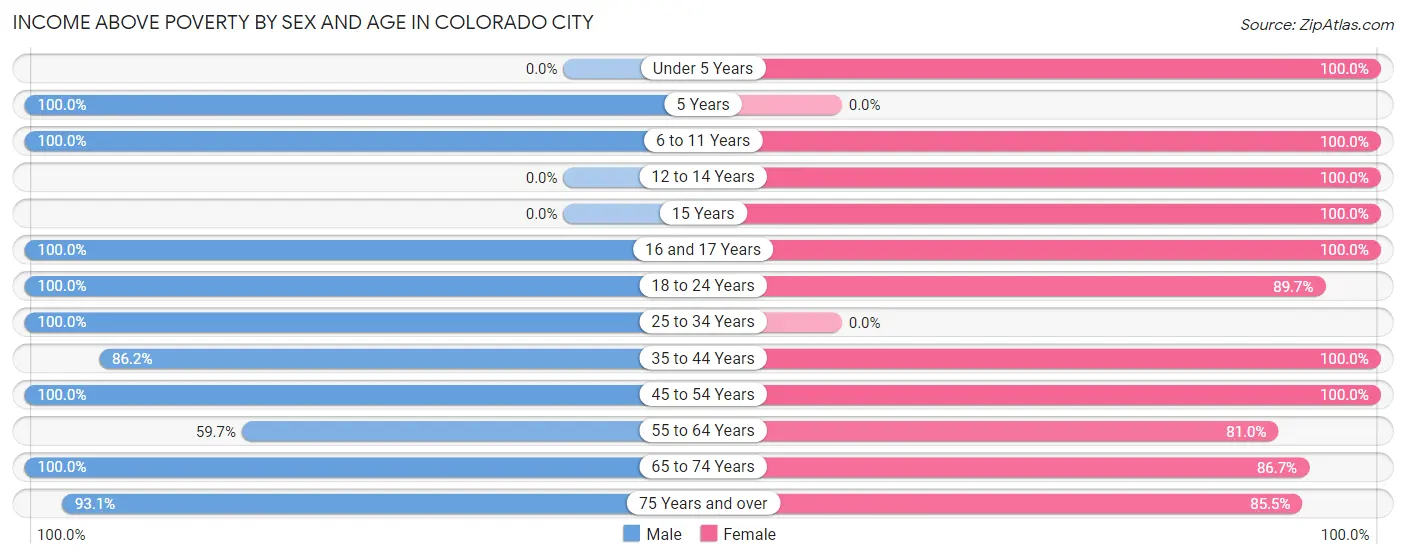
| Age Bracket | Male | Female |
| Under 5 Years | 0 (0.0%) | 37 (100.0%) |
| 5 Years | 28 (100.0%) | 0 (0.0%) |
| 6 to 11 Years | 27 (100.0%) | 49 (100.0%) |
| 12 to 14 Years | 0 (0.0%) | 74 (100.0%) |
| 15 Years | 0 (0.0%) | 26 (100.0%) |
| 16 and 17 Years | 76 (100.0%) | 31 (100.0%) |
| 18 to 24 Years | 44 (100.0%) | 210 (89.7%) |
| 25 to 34 Years | 50 (100.0%) | 0 (0.0%) |
| 35 to 44 Years | 106 (86.2%) | 166 (100.0%) |
| 45 to 54 Years | 125 (100.0%) | 78 (100.0%) |
| 55 to 64 Years | 77 (59.7%) | 111 (81.0%) |
| 65 to 74 Years | 147 (100.0%) | 163 (86.7%) |
| 75 Years and over | 94 (93.1%) | 53 (85.5%) |
| Total | 774 (91.1%) | 998 (92.2%) |
Income Below Poverty Among Married-Couple Families in Colorado City
The poverty statistics for married-couple families in Colorado City show that 1.8% or 9 of the total 507 families live below the poverty line. Families with no children have the highest poverty rate of 3.3%, comprising of 9 families. On the other hand, families with 1 or 2 children have the lowest poverty rate of 0.0%, which includes 0 families.
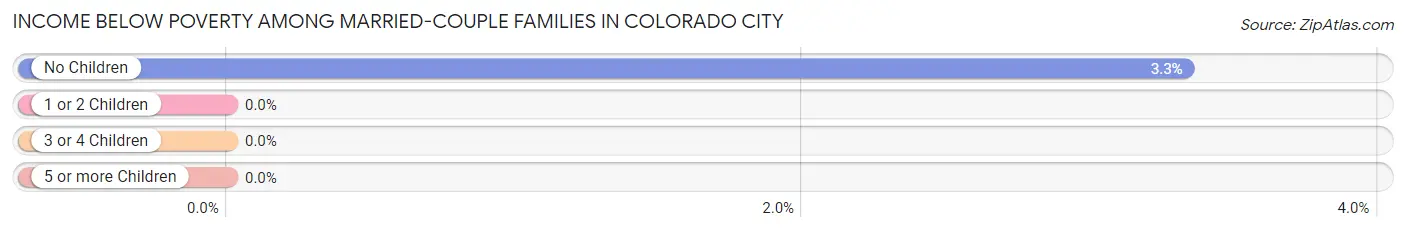
| Children | Above Poverty | Below Poverty |
| No Children | 261 (96.7%) | 9 (3.3%) |
| 1 or 2 Children | 219 (100.0%) | 0 (0.0%) |
| 3 or 4 Children | 18 (100.0%) | 0 (0.0%) |
| 5 or more Children | 0 (0.0%) | 0 (0.0%) |
| Total | 498 (98.2%) | 9 (1.8%) |
Income Below Poverty Among Single-Parent Households in Colorado City
| Children | Single Father | Single Mother |
| No Children | 0 (0.0%) | 0 (0.0%) |
| 1 or 2 Children | 0 (0.0%) | 0 (0.0%) |
| 3 or 4 Children | 0 (0.0%) | 0 (0.0%) |
| 5 or more Children | 0 (0.0%) | 0 (0.0%) |
| Total | 0 (0.0%) | 0 (0.0%) |
Income Below Poverty Among Married-Couple vs Single-Parent Households in Colorado City
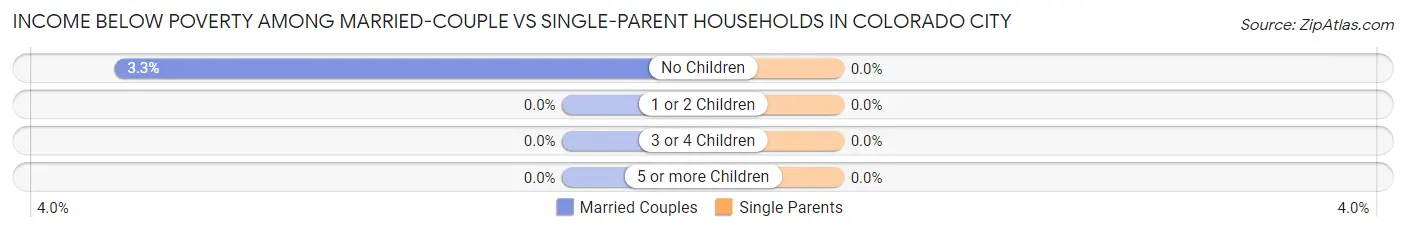
| Children | Married-Couple Families | Single-Parent Households |
| No Children | 9 (3.3%) | 0 (0.0%) |
| 1 or 2 Children | 0 (0.0%) | 0 (0.0%) |
| 3 or 4 Children | 0 (0.0%) | 0 (0.0%) |
| 5 or more Children | 0 (0.0%) | 0 (0.0%) |
| Total | 9 (1.8%) | 0 (0.0%) |
Race in Colorado City
The most populous races in Colorado City are White / Caucasian (1,798 | 93.1%), Hispanic or Latino (386 | 20.0%), and Some other Race (109 | 5.6%).
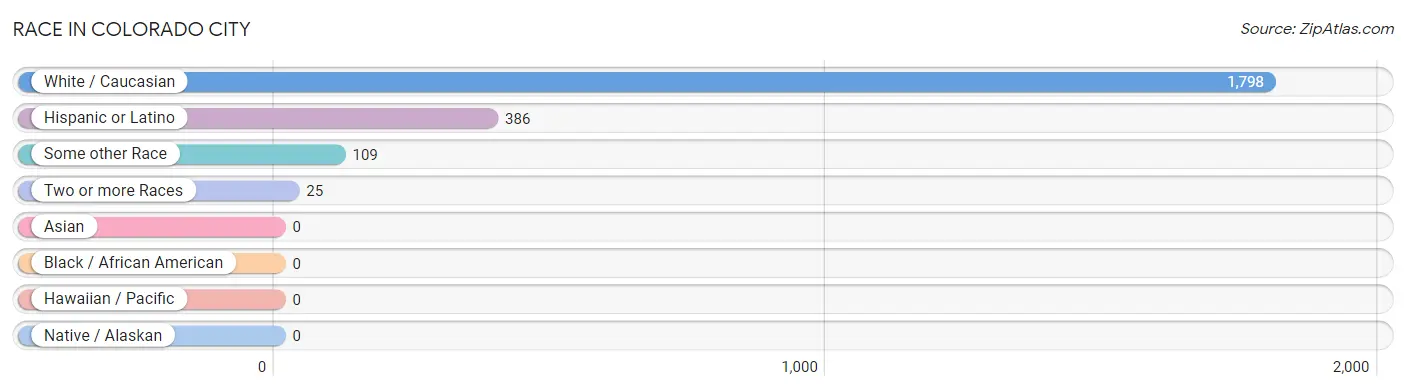
| Race | # Population | % Population |
| Asian | 0 | 0.0% |
| Black / African American | 0 | 0.0% |
| Hawaiian / Pacific | 0 | 0.0% |
| Hispanic or Latino | 386 | 20.0% |
| Native / Alaskan | 0 | 0.0% |
| White / Caucasian | 1,798 | 93.1% |
| Two or more Races | 25 | 1.3% |
| Some other Race | 109 | 5.6% |
| Total | 1,932 | 100.0% |
Ancestry in Colorado City
The most populous ancestries reported in Colorado City are Irish (319 | 16.5%), Italian (297 | 15.4%), Mexican (275 | 14.2%), German (231 | 12.0%), and Swiss (168 | 8.7%), together accounting for 66.8% of all Colorado City residents.
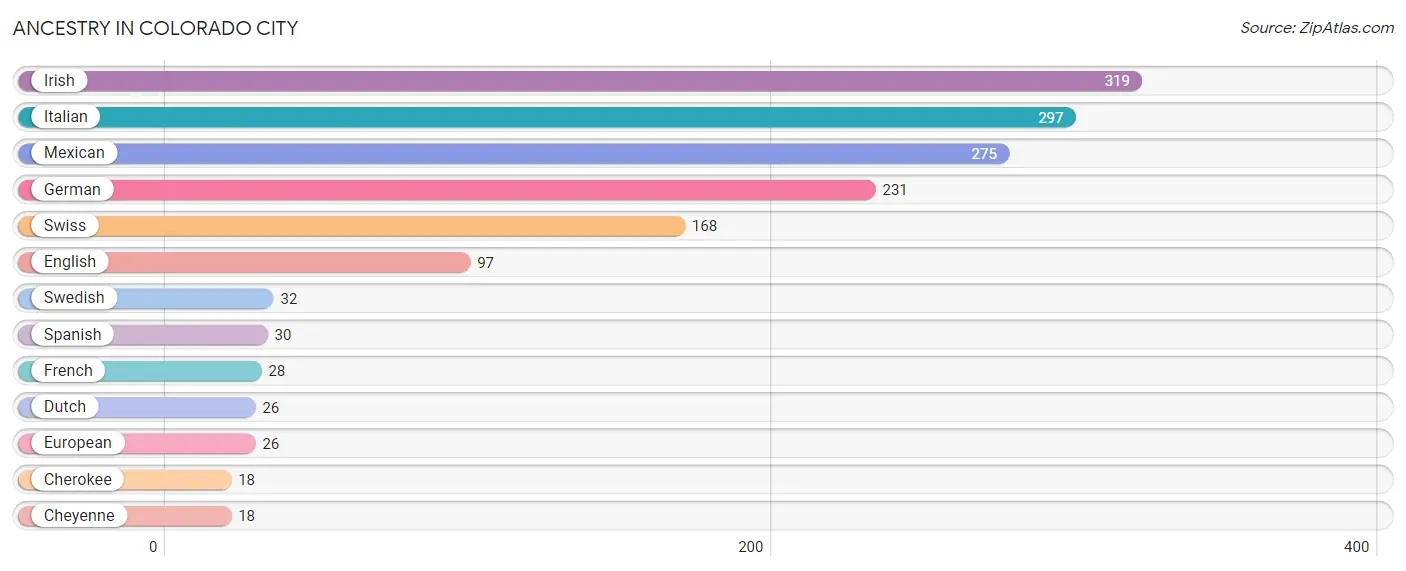
| Ancestry | # Population | % Population |
| Cherokee | 18 | 0.9% |
| Cheyenne | 18 | 0.9% |
| Dutch | 26 | 1.3% |
| English | 97 | 5.0% |
| European | 26 | 1.3% |
| French | 28 | 1.5% |
| German | 231 | 12.0% |
| Irish | 319 | 16.5% |
| Italian | 297 | 15.4% |
| Mexican | 275 | 14.2% |
| Spanish | 30 | 1.5% |
| Swedish | 32 | 1.7% |
| Swiss | 168 | 8.7% | View All 13 Rows |
Immigrants in Colorado City

| Immigration Origin | # Population | % Population | View All 0 Rows |
Sex and Age in Colorado City
Sex and Age in Colorado City
The most populous age groups in Colorado City are 75 to 79 Years (101 | 11.9%) for men and 35 to 39 Years (166 | 15.3%) for women.
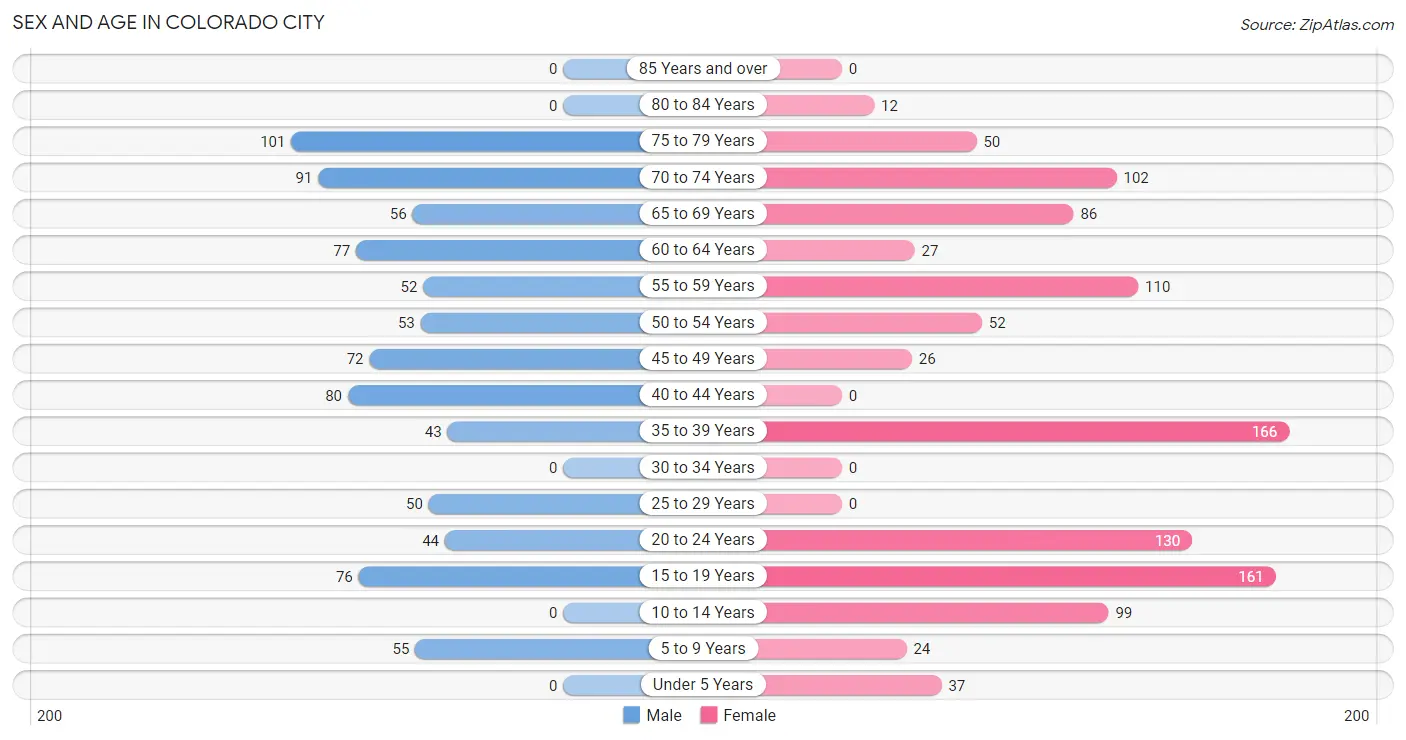
| Age Bracket | Male | Female |
| Under 5 Years | 0 (0.0%) | 37 (3.4%) |
| 5 to 9 Years | 55 (6.5%) | 24 (2.2%) |
| 10 to 14 Years | 0 (0.0%) | 99 (9.1%) |
| 15 to 19 Years | 76 (8.9%) | 161 (14.9%) |
| 20 to 24 Years | 44 (5.2%) | 130 (12.0%) |
| 25 to 29 Years | 50 (5.9%) | 0 (0.0%) |
| 30 to 34 Years | 0 (0.0%) | 0 (0.0%) |
| 35 to 39 Years | 43 (5.1%) | 166 (15.3%) |
| 40 to 44 Years | 80 (9.4%) | 0 (0.0%) |
| 45 to 49 Years | 72 (8.5%) | 26 (2.4%) |
| 50 to 54 Years | 53 (6.2%) | 52 (4.8%) |
| 55 to 59 Years | 52 (6.1%) | 110 (10.2%) |
| 60 to 64 Years | 77 (9.1%) | 27 (2.5%) |
| 65 to 69 Years | 56 (6.6%) | 86 (8.0%) |
| 70 to 74 Years | 91 (10.7%) | 102 (9.4%) |
| 75 to 79 Years | 101 (11.9%) | 50 (4.6%) |
| 80 to 84 Years | 0 (0.0%) | 12 (1.1%) |
| 85 Years and over | 0 (0.0%) | 0 (0.0%) |
| Total | 850 (100.0%) | 1,082 (100.0%) |
Families and Households in Colorado City
Median Family Size in Colorado City
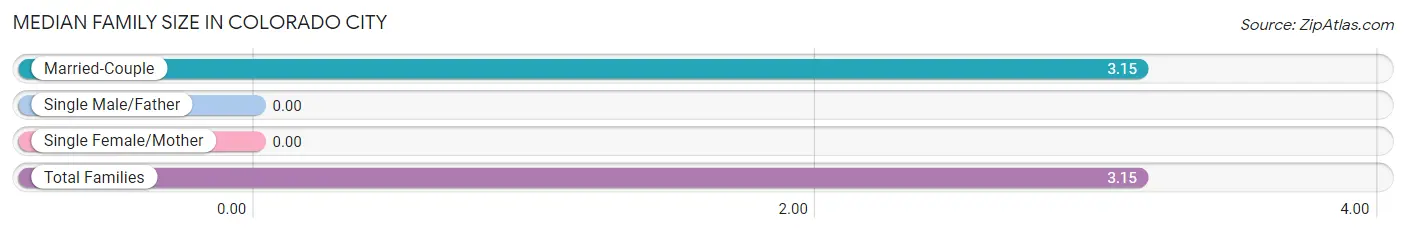
| Family Type | # Families | Family Size |
| Married-Couple | 507 (100.0%) | 3.15 |
| Single Male/Father | 0 (0.0%) | - |
| Single Female/Mother | 0 (0.0%) | - |
| Total Families | 507 (100.0%) | 3.15 |
Median Household Size in Colorado City
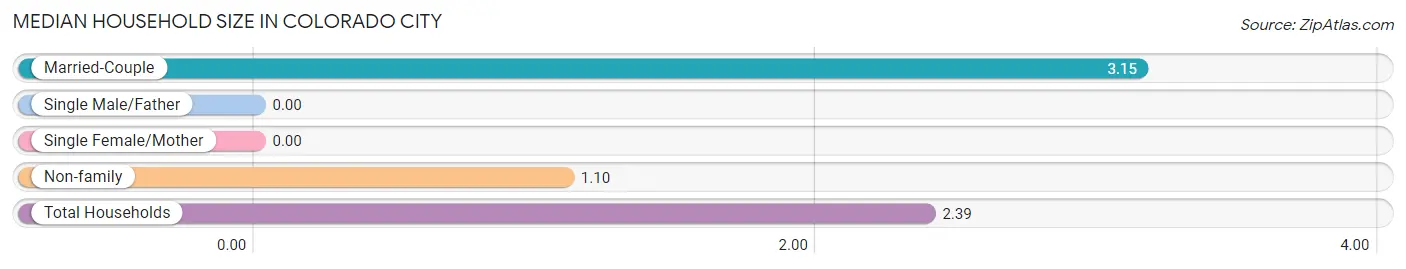
| Household Type | # Households | Household Size |
| Married-Couple | 507 (62.7%) | 3.15 |
| Single Male/Father | 0 (0.0%) | - |
| Single Female/Mother | 0 (0.0%) | - |
| Non-family | 302 (37.3%) | 1.10 |
| Total Households | 809 (100.0%) | 2.39 |
Household Size by Marriage Status in Colorado City
Out of a total of 809 households in Colorado City, 507 (62.7%) are family households, while 302 (37.3%) are nonfamily households. The most numerous type of family households are 2-person households, comprising 244, and the most common type of nonfamily households are 1-person households, comprising 274.
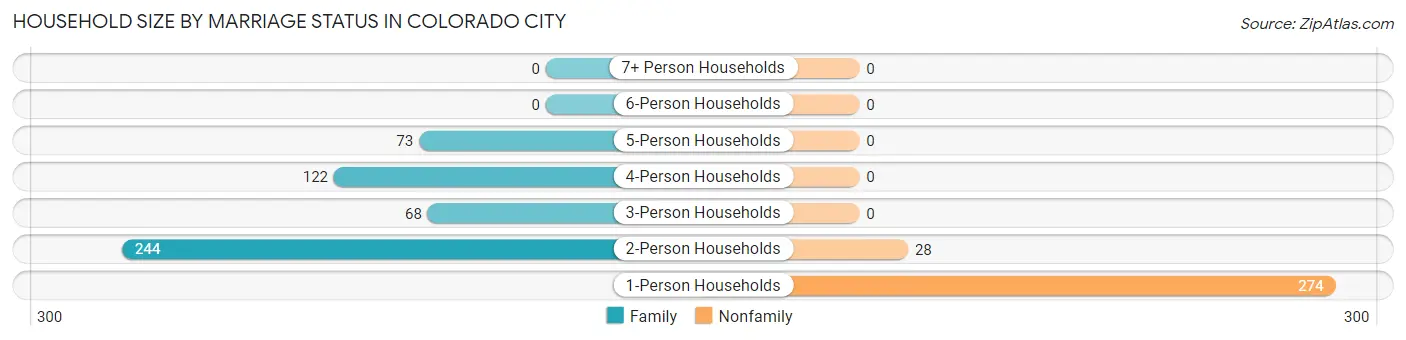
| Household Size | Family Households | Nonfamily Households |
| 1-Person Households | - | 274 (33.9%) |
| 2-Person Households | 244 (30.2%) | 28 (3.5%) |
| 3-Person Households | 68 (8.4%) | 0 (0.0%) |
| 4-Person Households | 122 (15.1%) | 0 (0.0%) |
| 5-Person Households | 73 (9.0%) | 0 (0.0%) |
| 6-Person Households | 0 (0.0%) | 0 (0.0%) |
| 7+ Person Households | 0 (0.0%) | 0 (0.0%) |
| Total | 507 (62.7%) | 302 (37.3%) |
Female Fertility in Colorado City
Fertility by Age in Colorado City
Average fertility rate in Colorado City is 59.0 births per 1,000 women. Women in the age bracket of 20 to 34 years have the highest fertility rate with 231.0 births per 1,000 women. Women in the age bracket of 20 to 34 years acount for 100.0% of all women with births.
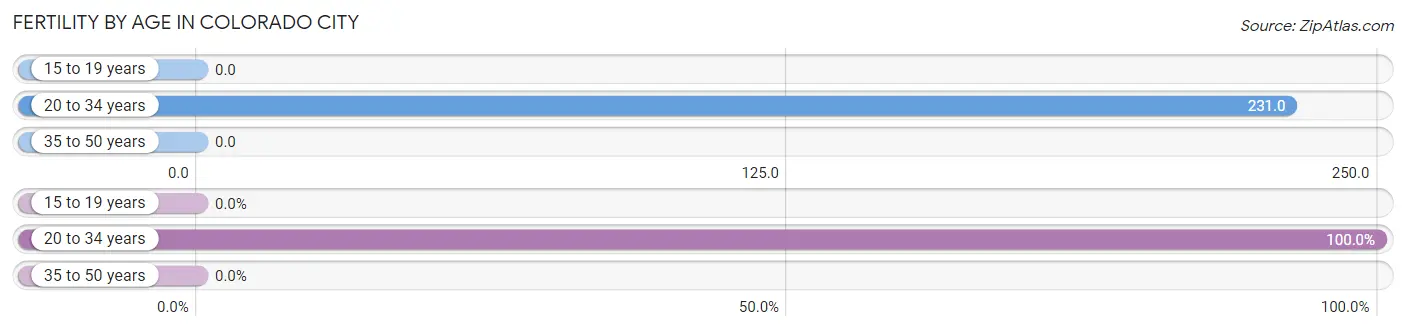
| Age Bracket | Women with Births | Births / 1,000 Women |
| 15 to 19 years | 0 (0.0%) | 0.0 |
| 20 to 34 years | 30 (100.0%) | 231.0 |
| 35 to 50 years | 0 (0.0%) | 0.0 |
| Total | 30 (100.0%) | 59.0 |
Fertility by Age by Marriage Status in Colorado City
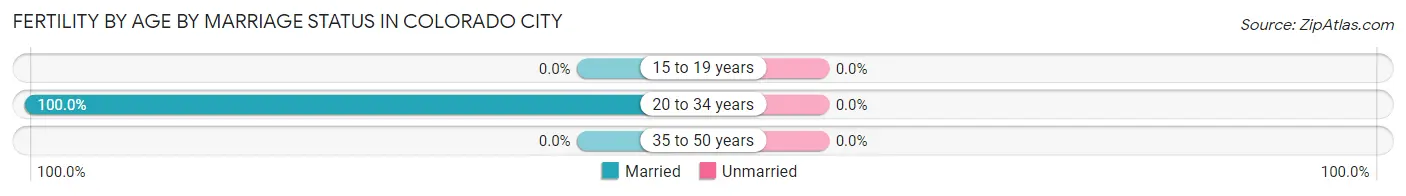
| Age Bracket | Married | Unmarried |
| 15 to 19 years | 0 (0.0%) | 0 (0.0%) |
| 20 to 34 years | 30 (100.0%) | 0 (0.0%) |
| 35 to 50 years | 0 (0.0%) | 0 (0.0%) |
| Total | 30 (100.0%) | 0 (0.0%) |
Fertility by Education in Colorado City
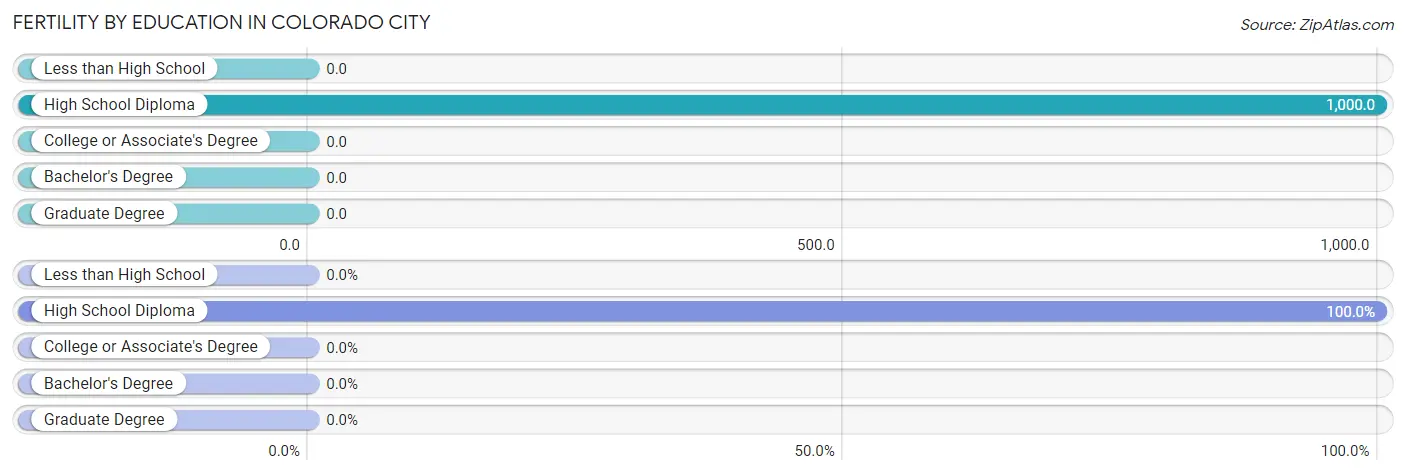
| Educational Attainment | Women with Births | Births / 1,000 Women |
| Less than High School | 0 (0.0%) | 0.0 |
| High School Diploma | 30 (100.0%) | 1,000.0 |
| College or Associate's Degree | 0 (0.0%) | 0.0 |
| Bachelor's Degree | 0 (0.0%) | 0.0 |
| Graduate Degree | 0 (0.0%) | 0.0 |
| Total | 30 (100.0%) | 59.0 |
Fertility by Education by Marriage Status in Colorado City
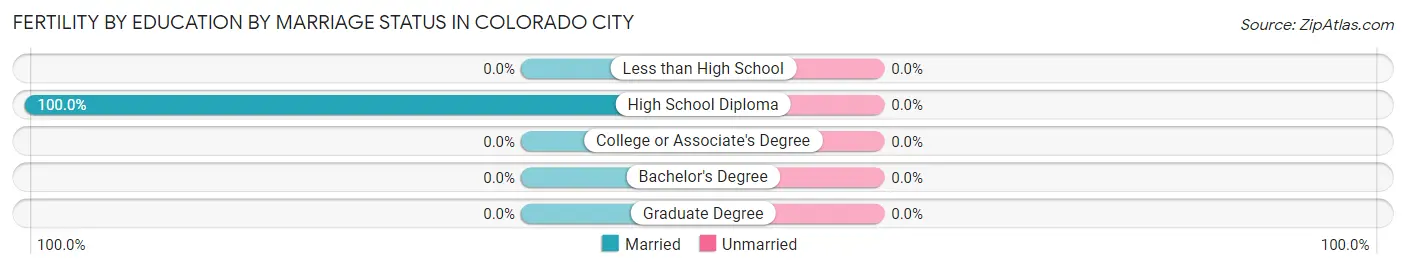
| Educational Attainment | Married | Unmarried |
| Less than High School | 0 (0.0%) | 0 (0.0%) |
| High School Diploma | 30 (100.0%) | 0 (0.0%) |
| College or Associate's Degree | 0 (0.0%) | 0 (0.0%) |
| Bachelor's Degree | 0 (0.0%) | 0 (0.0%) |
| Graduate Degree | 0 (0.0%) | 0 (0.0%) |
| Total | 30 (100.0%) | 0 (0.0%) |
Employment Characteristics in Colorado City
Employment by Class of Employer in Colorado City
Among the 767 employed individuals in Colorado City, private company employees (294 | 38.3%), federal government employees (143 | 18.6%), and self-employed (not incorporated) (133 | 17.3%) make up the most common classes of employment.
| Employer Class | # Employees | % Employees |
| Private Company Employees | 294 | 38.3% |
| Self-Employed (Incorporated) | 0 | 0.0% |
| Self-Employed (Not Incorporated) | 133 | 17.3% |
| Not-for-profit Organizations | 89 | 11.6% |
| Local Government Employees | 82 | 10.7% |
| State Government Employees | 26 | 3.4% |
| Federal Government Employees | 143 | 18.6% |
| Unpaid Family Workers | 0 | 0.0% |
| Total | 767 | 100.0% |
Employment Status by Age in Colorado City
| Age Bracket | In Labor Force | Unemployed |
| 16 to 19 Years | 65 (30.8%) | 0 (0.0%) |
| 20 to 24 Years | 98 (56.3%) | 0 (0.0%) |
| 25 to 29 Years | 0 (0.0%) | 0 (0.0%) |
| 30 to 34 Years | 0 (0.0%) | 0 (0.0%) |
| 35 to 44 Years | 217 (75.1%) | 0 (0.0%) |
| 45 to 54 Years | 176 (86.7%) | 0 (0.0%) |
| 55 to 59 Years | 85 (52.5%) | 0 (0.0%) |
| 60 to 64 Years | 52 (50.0%) | 0 (0.0%) |
| 65 to 74 Years | 91 (27.2%) | 0 (0.0%) |
| 75 Years and over | 0 (0.0%) | 0 (0.0%) |
| Total | 785 (46.4%) | 0 (0.0%) |
Employment Status by Educational Attainment in Colorado City
| Educational Attainment | In Labor Force | Unemployed |
| Less than High School | 26 (51.0%) | 0 (0.0%) |
| High School Diploma | 74 (36.1%) | 0 (0.0%) |
| College / Associate Degree | 277 (73.7%) | 0 (0.0%) |
| Bachelor's Degree or higher | 153 (86.9%) | 0 (0.0%) |
| Total | 530 (65.6%) | 0 (0.0%) |
Employment Occupations by Sex in Colorado City
Management, Business, Science and Arts Occupations
The most common Management, Business, Science and Arts occupations in Colorado City are Health Diagnosing & Treating (103 | 13.1%), Business & Financial (91 | 11.6%), Management (53 | 6.8%), Community & Social Service (52 | 6.6%), and Education Instruction & Library (52 | 6.6%).
Management, Business, Science and Arts Occupations by Sex
Within the Management, Business, Science and Arts occupations in Colorado City, the most male-oriented occupations are Business & Financial (100.0%), Computers, Engineering & Science (100.0%), and Life, Physical & Social Science (100.0%), while the most female-oriented occupations are Management (100.0%), Health Diagnosing & Treating (100.0%), and Health Technologists (100.0%).
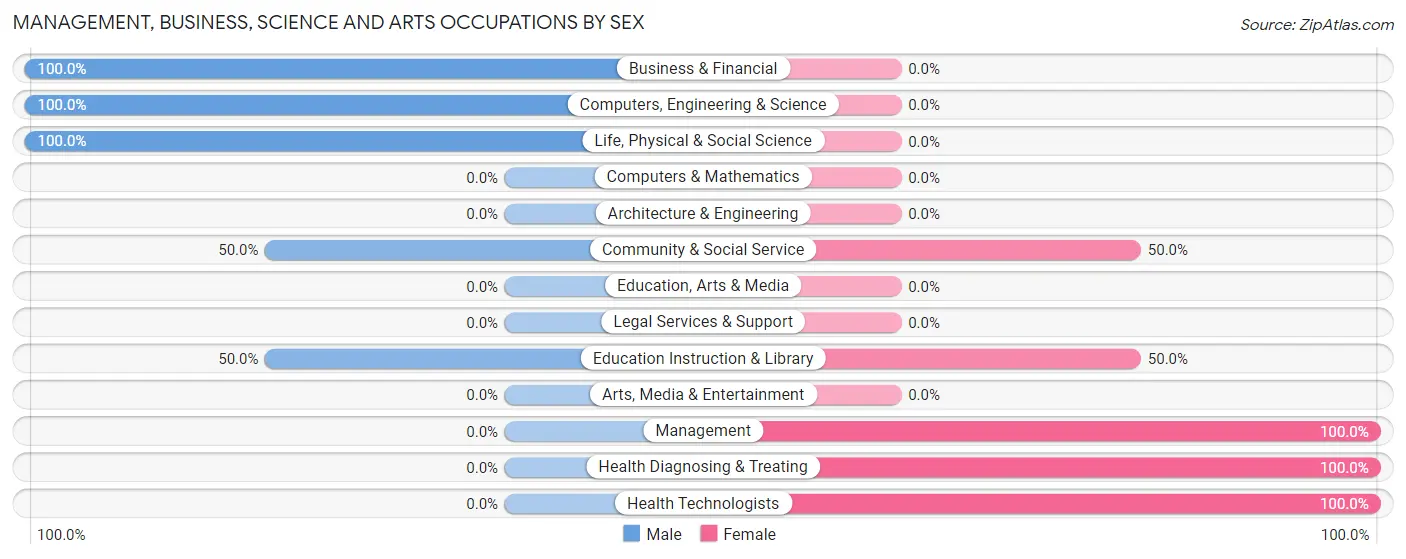
| Occupation | Male | Female |
| Management | 0 (0.0%) | 53 (100.0%) |
| Business & Financial | 91 (100.0%) | 0 (0.0%) |
| Computers, Engineering & Science | 26 (100.0%) | 0 (0.0%) |
| Computers & Mathematics | 0 (0.0%) | 0 (0.0%) |
| Architecture & Engineering | 0 (0.0%) | 0 (0.0%) |
| Life, Physical & Social Science | 26 (100.0%) | 0 (0.0%) |
| Community & Social Service | 26 (50.0%) | 26 (50.0%) |
| Education, Arts & Media | 0 (0.0%) | 0 (0.0%) |
| Legal Services & Support | 0 (0.0%) | 0 (0.0%) |
| Education Instruction & Library | 26 (50.0%) | 26 (50.0%) |
| Arts, Media & Entertainment | 0 (0.0%) | 0 (0.0%) |
| Health Diagnosing & Treating | 0 (0.0%) | 103 (100.0%) |
| Health Technologists | 0 (0.0%) | 51 (100.0%) |
| Total (Category) | 143 (44.0%) | 182 (56.0%) |
| Total (Overall) | 381 (48.6%) | 403 (51.4%) |
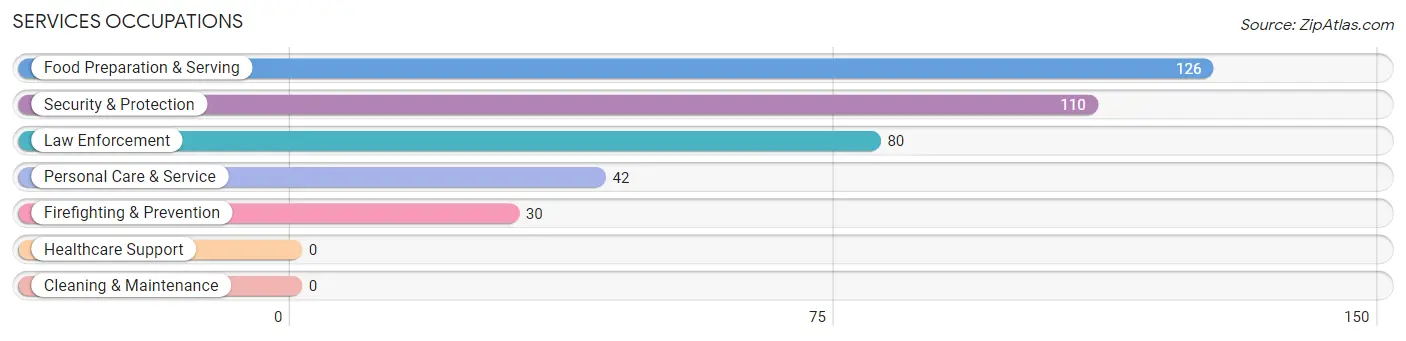
Services Occupations
The most common Services occupations in Colorado City are Food Preparation & Serving (126 | 16.1%), Security & Protection (110 | 14.0%), Law Enforcement (80 | 10.2%), Personal Care & Service (42 | 5.4%), and Firefighting & Prevention (30 | 3.8%).
Services Occupations by Sex
Within the Services occupations in Colorado City, the most male-oriented occupations are Law Enforcement (100.0%), Security & Protection (72.7%), and Food Preparation & Serving (48.4%), while the most female-oriented occupations are Firefighting & Prevention (100.0%), Personal Care & Service (100.0%), and Food Preparation & Serving (51.6%).
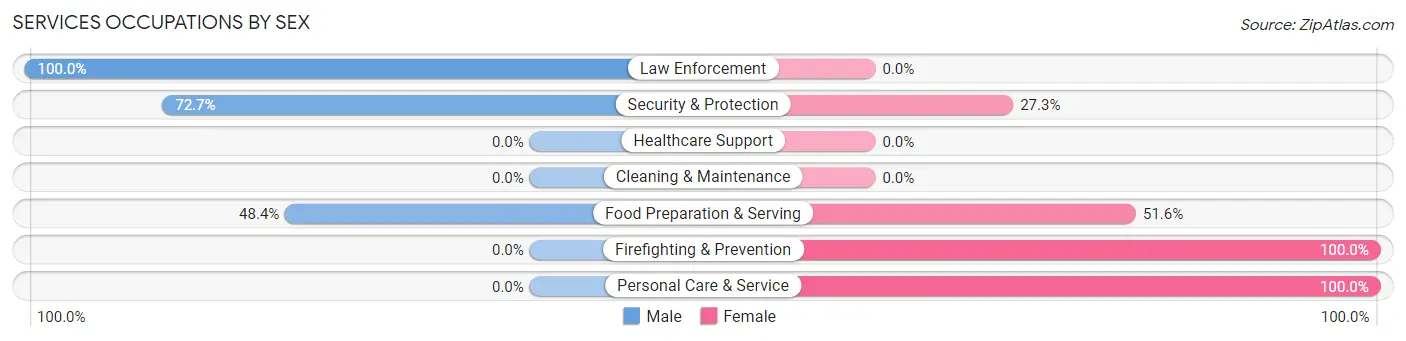
| Occupation | Male | Female |
| Healthcare Support | 0 (0.0%) | 0 (0.0%) |
| Security & Protection | 80 (72.7%) | 30 (27.3%) |
| Firefighting & Prevention | 0 (0.0%) | 30 (100.0%) |
| Law Enforcement | 80 (100.0%) | 0 (0.0%) |
| Food Preparation & Serving | 61 (48.4%) | 65 (51.6%) |
| Cleaning & Maintenance | 0 (0.0%) | 0 (0.0%) |
| Personal Care & Service | 0 (0.0%) | 42 (100.0%) |
| Total (Category) | 141 (50.7%) | 137 (49.3%) |
| Total (Overall) | 381 (48.6%) | 403 (51.4%) |
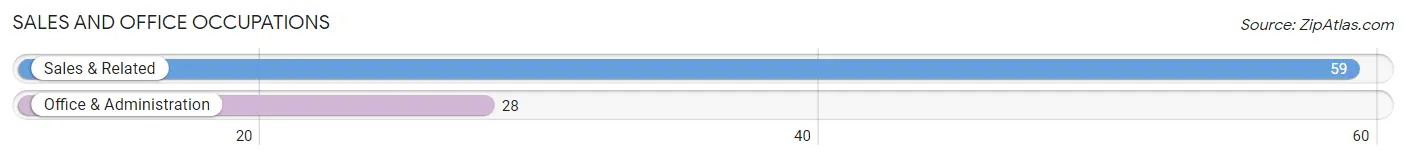
Sales and Office Occupations
The most common Sales and Office occupations in Colorado City are Sales & Related (59 | 7.5%), and Office & Administration (28 | 3.6%).
Sales and Office Occupations by Sex

| Occupation | Male | Female |
| Sales & Related | 33 (55.9%) | 26 (44.1%) |
| Office & Administration | 0 (0.0%) | 28 (100.0%) |
| Total (Category) | 33 (37.9%) | 54 (62.1%) |
| Total (Overall) | 381 (48.6%) | 403 (51.4%) |
Natural Resources, Construction and Maintenance Occupations

Natural Resources, Construction and Maintenance Occupations by Sex
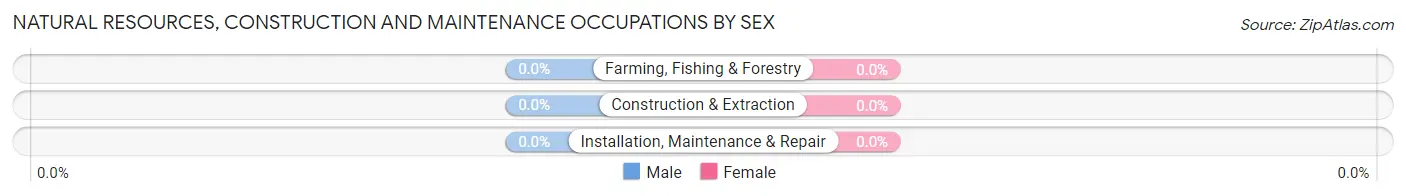
| Occupation | Male | Female |
| Farming, Fishing & Forestry | 0 (0.0%) | 0 (0.0%) |
| Construction & Extraction | 0 (0.0%) | 0 (0.0%) |
| Installation, Maintenance & Repair | 0 (0.0%) | 0 (0.0%) |
| Total (Category) | 0 (0.0%) | 0 (0.0%) |
| Total (Overall) | 381 (48.6%) | 403 (51.4%) |
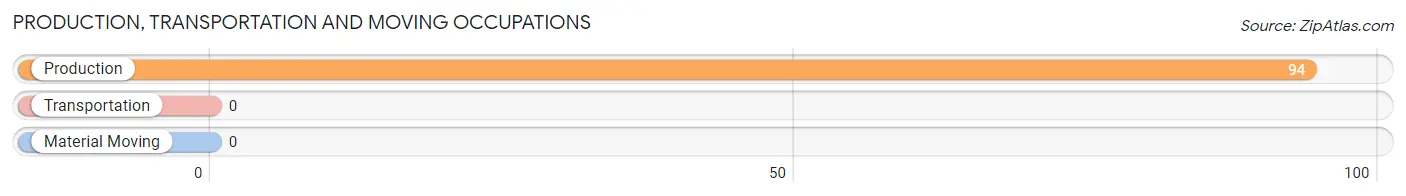
Production, Transportation and Moving Occupations
The most common Production, Transportation and Moving occupations in Colorado City are , and Production (94 | 12.0%).
Production, Transportation and Moving Occupations by Sex
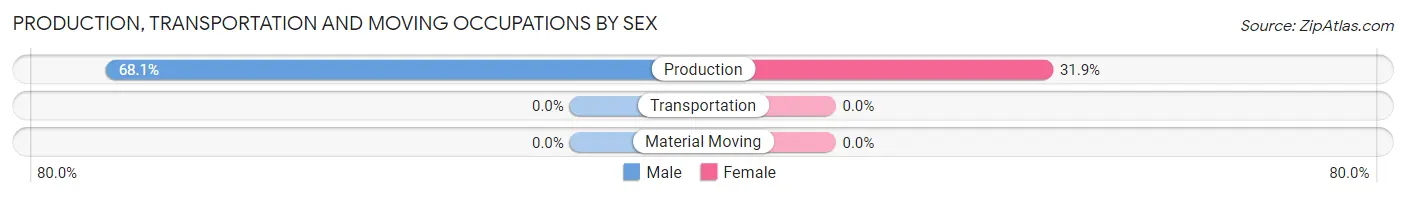
| Occupation | Male | Female |
| Production | 64 (68.1%) | 30 (31.9%) |
| Transportation | 0 (0.0%) | 0 (0.0%) |
| Material Moving | 0 (0.0%) | 0 (0.0%) |
| Total (Category) | 64 (68.1%) | 30 (31.9%) |
| Total (Overall) | 381 (48.6%) | 403 (51.4%) |
Employment Industries by Sex in Colorado City
Employment Industries in Colorado City
The major employment industries in Colorado City include Health Care & Social Assistance (168 | 21.4%), Public Administration (136 | 17.3%), Professional & Scientific (91 | 11.6%), Retail Trade (59 | 7.5%), and Educational Services (52 | 6.6%).
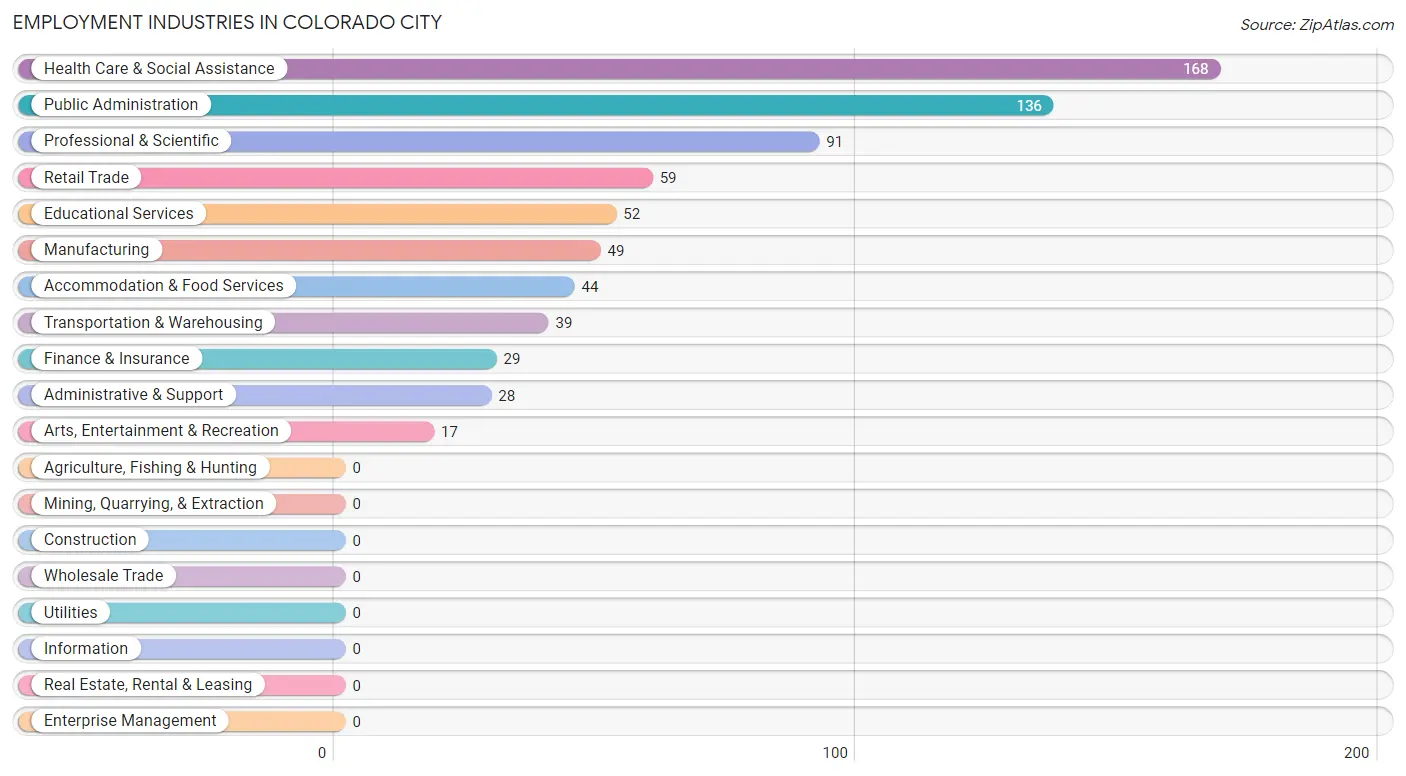
Employment Industries by Sex in Colorado City
The Colorado City industries that see more men than women are Transportation & Warehousing (100.0%), Professional & Scientific (100.0%), and Arts, Entertainment & Recreation (100.0%), whereas the industries that tend to have a higher number of women are Finance & Insurance (100.0%), Administrative & Support (100.0%), and Health Care & Social Assistance (100.0%).
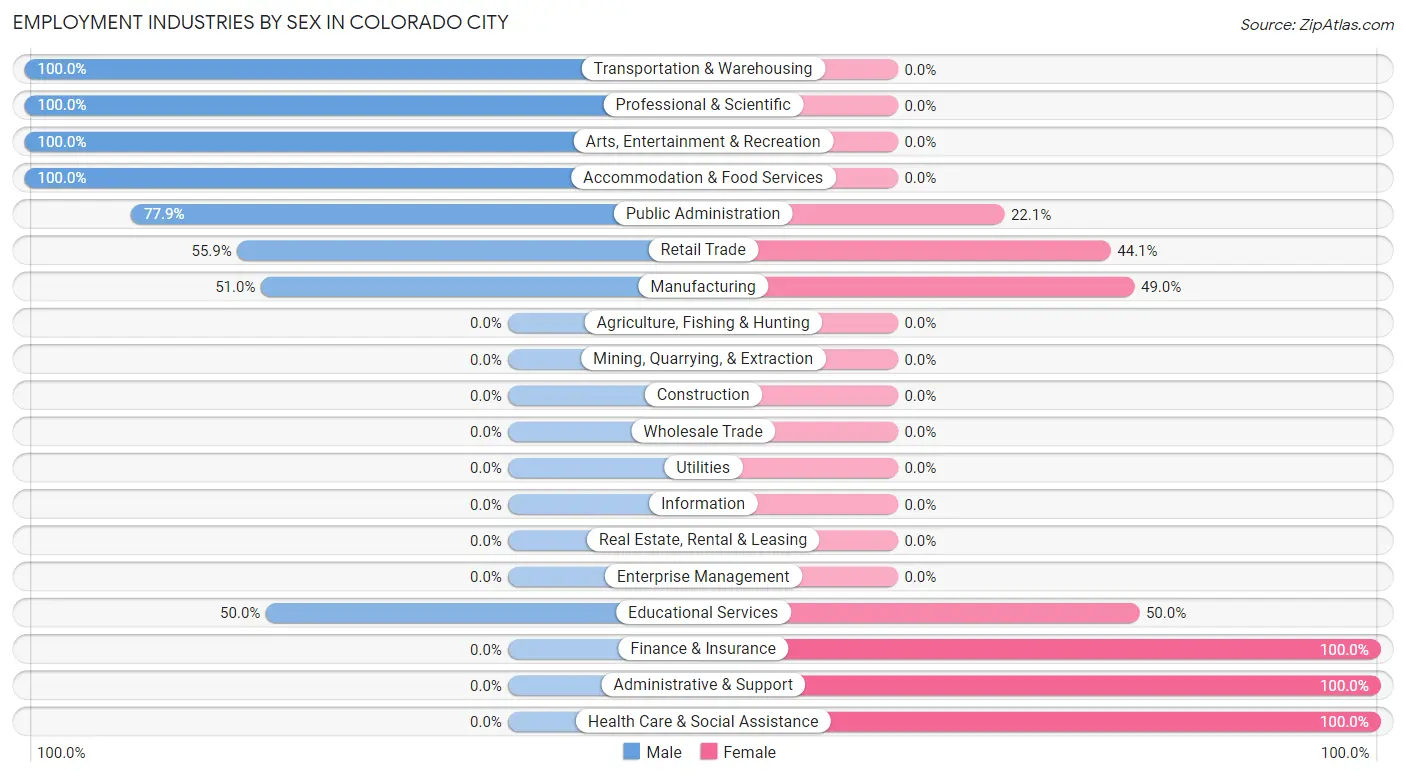
| Industry | Male | Female |
| Agriculture, Fishing & Hunting | 0 (0.0%) | 0 (0.0%) |
| Mining, Quarrying, & Extraction | 0 (0.0%) | 0 (0.0%) |
| Construction | 0 (0.0%) | 0 (0.0%) |
| Manufacturing | 25 (51.0%) | 24 (49.0%) |
| Wholesale Trade | 0 (0.0%) | 0 (0.0%) |
| Retail Trade | 33 (55.9%) | 26 (44.1%) |
| Transportation & Warehousing | 39 (100.0%) | 0 (0.0%) |
| Utilities | 0 (0.0%) | 0 (0.0%) |
| Information | 0 (0.0%) | 0 (0.0%) |
| Finance & Insurance | 0 (0.0%) | 29 (100.0%) |
| Real Estate, Rental & Leasing | 0 (0.0%) | 0 (0.0%) |
| Professional & Scientific | 91 (100.0%) | 0 (0.0%) |
| Enterprise Management | 0 (0.0%) | 0 (0.0%) |
| Administrative & Support | 0 (0.0%) | 28 (100.0%) |
| Educational Services | 26 (50.0%) | 26 (50.0%) |
| Health Care & Social Assistance | 0 (0.0%) | 168 (100.0%) |
| Arts, Entertainment & Recreation | 17 (100.0%) | 0 (0.0%) |
| Accommodation & Food Services | 44 (100.0%) | 0 (0.0%) |
| Public Administration | 106 (77.9%) | 30 (22.1%) |
| Total | 381 (48.6%) | 403 (51.4%) |
Education in Colorado City
School Enrollment in Colorado City
The most common levels of schooling among the 491 students in Colorado City are college / undergraduate (180 | 36.7%), high school (133 | 27.1%), and middle school (74 | 15.1%).
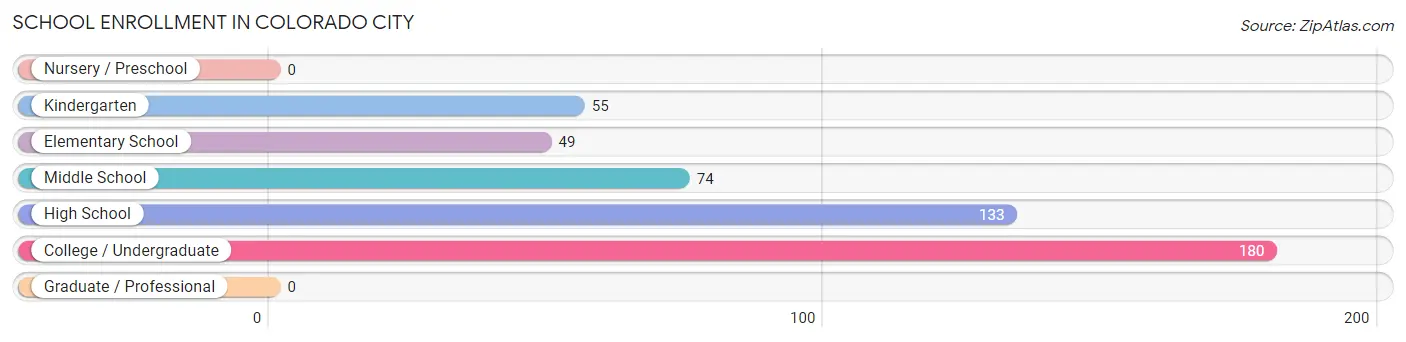
| School Level | # Students | % Students |
| Nursery / Preschool | 0 | 0.0% |
| Kindergarten | 55 | 11.2% |
| Elementary School | 49 | 10.0% |
| Middle School | 74 | 15.1% |
| High School | 133 | 27.1% |
| College / Undergraduate | 180 | 36.7% |
| Graduate / Professional | 0 | 0.0% |
| Total | 491 | 100.0% |
School Enrollment by Age by Funding Source in Colorado City
Out of a total of 491 students who are enrolled in schools in Colorado City, 76 (15.5%) attend a private institution, while the remaining 415 (84.5%) are enrolled in public schools. The age group of 20 to 24 year olds has the highest likelihood of being enrolled in private schools, with 76 (100.0% in the age bracket) enrolled. Conversely, the age group of 5 to 9 year old has the lowest likelihood of being enrolled in a private school, with 79 (100.0% in the age bracket) attending a public institution.
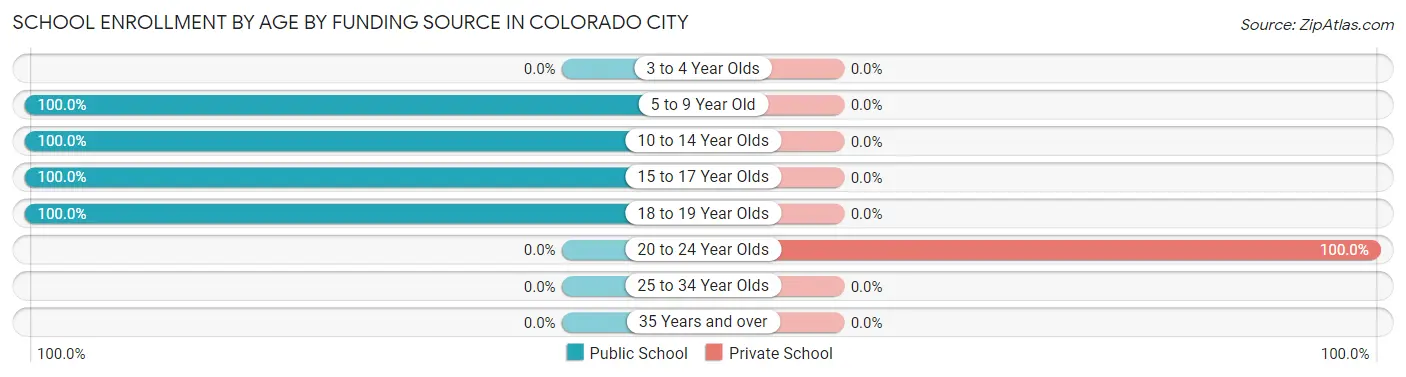
| Age Bracket | Public School | Private School |
| 3 to 4 Year Olds | 0 (0.0%) | 0 (0.0%) |
| 5 to 9 Year Old | 79 (100.0%) | 0 (0.0%) |
| 10 to 14 Year Olds | 99 (100.0%) | 0 (0.0%) |
| 15 to 17 Year Olds | 133 (100.0%) | 0 (0.0%) |
| 18 to 19 Year Olds | 104 (100.0%) | 0 (0.0%) |
| 20 to 24 Year Olds | 0 (0.0%) | 76 (100.0%) |
| 25 to 34 Year Olds | 0 (0.0%) | 0 (0.0%) |
| 35 Years and over | 0 (0.0%) | 0 (0.0%) |
| Total | 415 (84.5%) | 76 (15.5%) |
Educational Attainment by Field of Study in Colorado City
Science & technology (101 | 42.6%), education (52 | 21.9%), physical & health sciences (24 | 10.1%), bio, nature & agricultural (23 | 9.7%), and arts & humanities (19 | 8.0%) are the most common fields of study among 237 individuals in Colorado City who have obtained a bachelor's degree or higher.
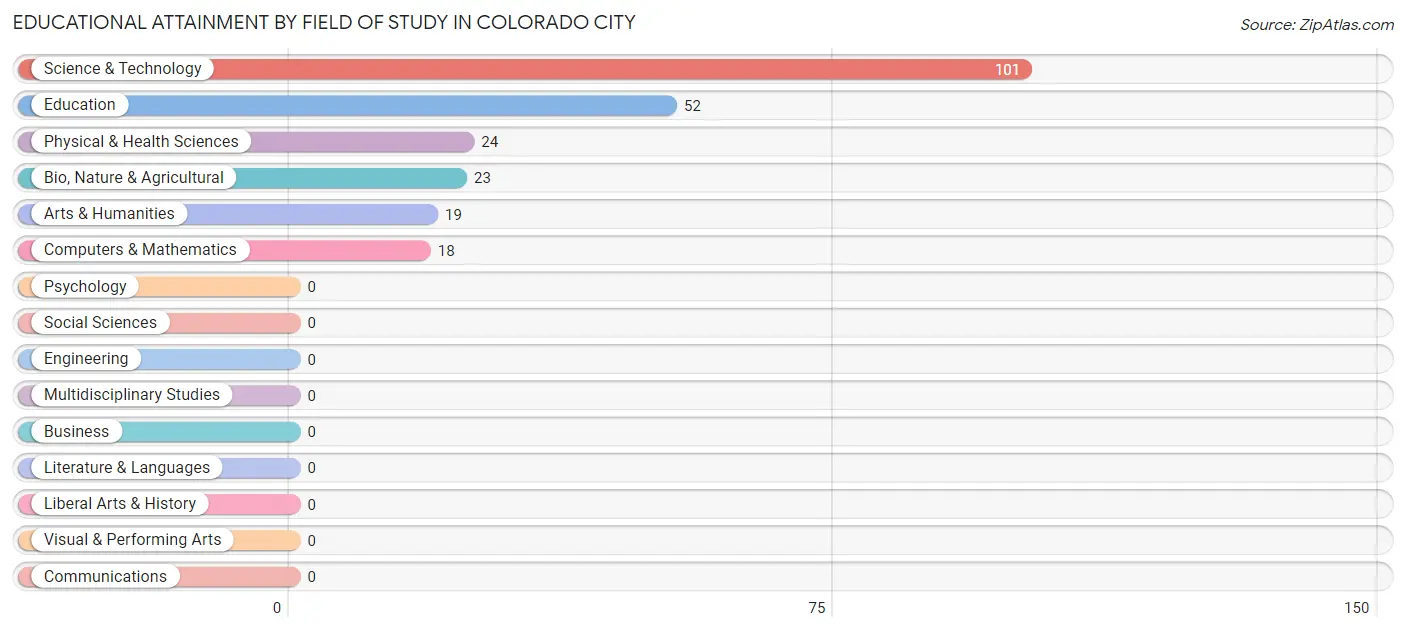
| Field of Study | # Graduates | % Graduates |
| Computers & Mathematics | 18 | 7.6% |
| Bio, Nature & Agricultural | 23 | 9.7% |
| Physical & Health Sciences | 24 | 10.1% |
| Psychology | 0 | 0.0% |
| Social Sciences | 0 | 0.0% |
| Engineering | 0 | 0.0% |
| Multidisciplinary Studies | 0 | 0.0% |
| Science & Technology | 101 | 42.6% |
| Business | 0 | 0.0% |
| Education | 52 | 21.9% |
| Literature & Languages | 0 | 0.0% |
| Liberal Arts & History | 0 | 0.0% |
| Visual & Performing Arts | 0 | 0.0% |
| Communications | 0 | 0.0% |
| Arts & Humanities | 19 | 8.0% |
| Total | 237 | 100.0% |
Transportation & Commute in Colorado City
Vehicle Availability by Sex in Colorado City
The most prevalent vehicle ownership categories in Colorado City are males with 2 vehicles (161, accounting for 44.2%) and females with 2 vehicles (107, making up 40.0%).
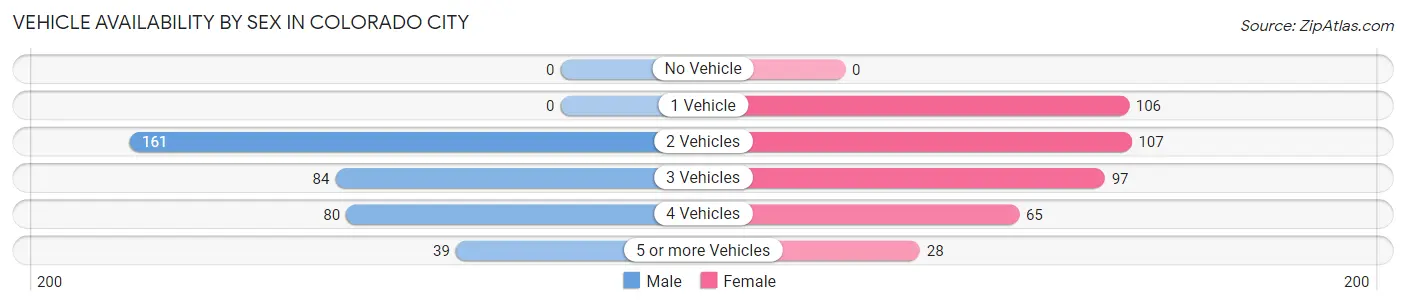
| Vehicles Available | Male | Female |
| No Vehicle | 0 (0.0%) | 0 (0.0%) |
| 1 Vehicle | 0 (0.0%) | 106 (26.3%) |
| 2 Vehicles | 161 (44.2%) | 107 (26.6%) |
| 3 Vehicles | 84 (23.1%) | 97 (24.1%) |
| 4 Vehicles | 80 (22.0%) | 65 (16.1%) |
| 5 or more Vehicles | 39 (10.7%) | 28 (7.0%) |
| Total | 364 (100.0%) | 403 (100.0%) |
Commute Time in Colorado City
The most frequently occuring commute durations in Colorado City are 30 to 34 minutes (219 commuters, 28.5%), 15 to 19 minutes (163 commuters, 21.2%), and 45 to 59 minutes (147 commuters, 19.2%).
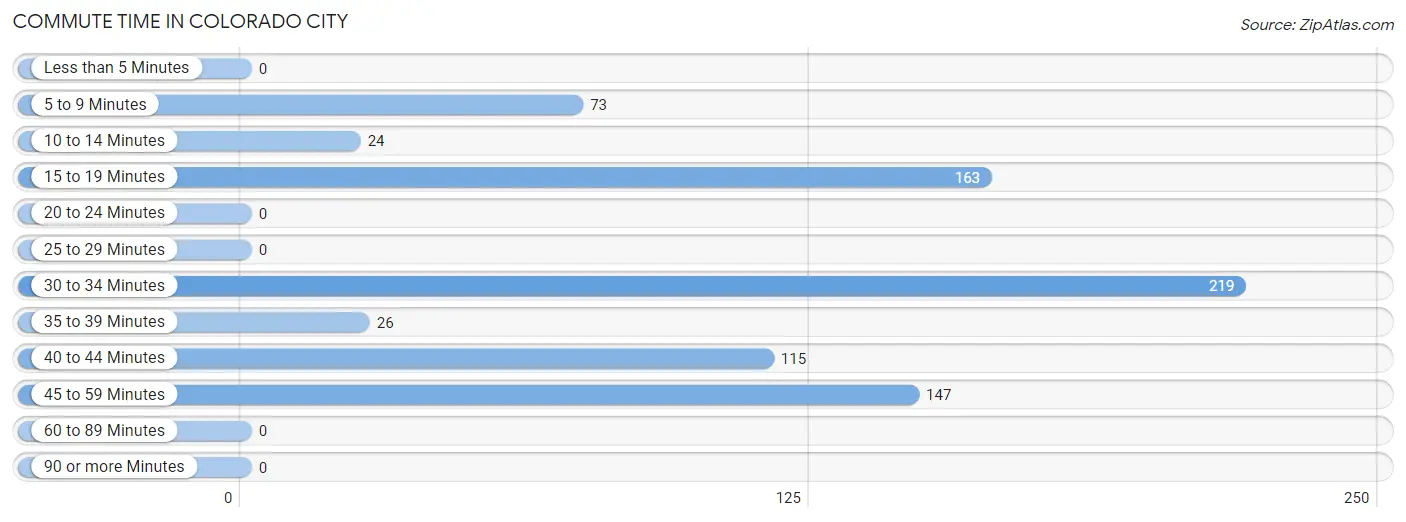
| Commute Time | # Commuters | % Commuters |
| Less than 5 Minutes | 0 | 0.0% |
| 5 to 9 Minutes | 73 | 9.5% |
| 10 to 14 Minutes | 24 | 3.1% |
| 15 to 19 Minutes | 163 | 21.2% |
| 20 to 24 Minutes | 0 | 0.0% |
| 25 to 29 Minutes | 0 | 0.0% |
| 30 to 34 Minutes | 219 | 28.5% |
| 35 to 39 Minutes | 26 | 3.4% |
| 40 to 44 Minutes | 115 | 15.0% |
| 45 to 59 Minutes | 147 | 19.2% |
| 60 to 89 Minutes | 0 | 0.0% |
| 90 or more Minutes | 0 | 0.0% |
Commute Time by Sex in Colorado City
The most common commute times in Colorado City are 15 to 19 minutes (135 commuters, 37.1%) for males and 30 to 34 minutes (113 commuters, 28.0%) for females.
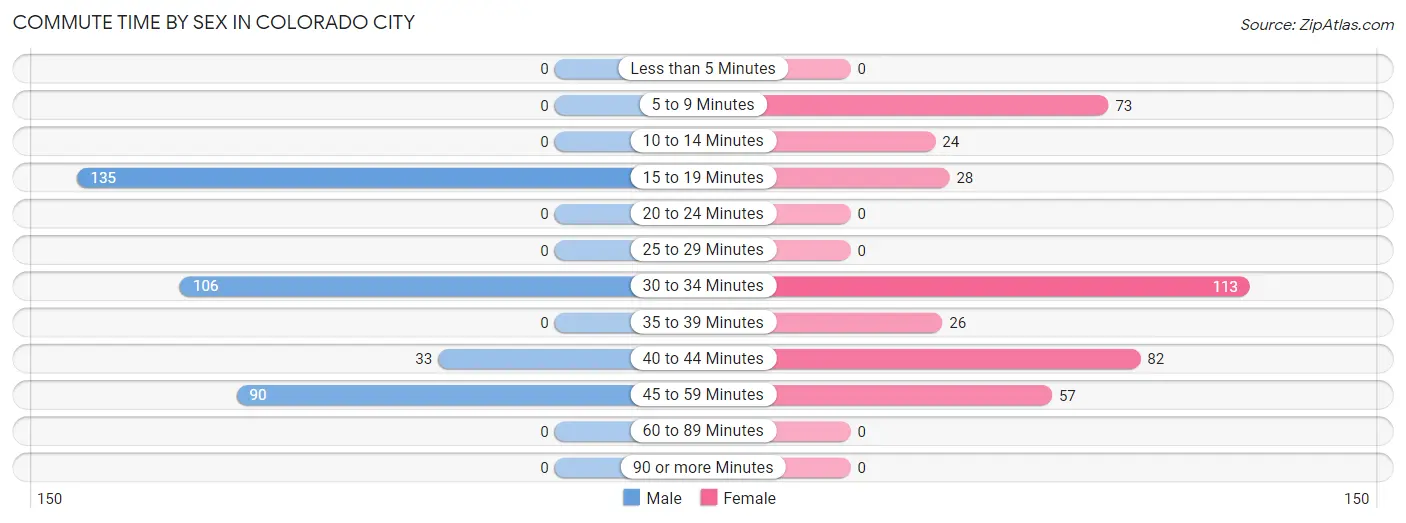
| Commute Time | Male | Female |
| Less than 5 Minutes | 0 (0.0%) | 0 (0.0%) |
| 5 to 9 Minutes | 0 (0.0%) | 73 (18.1%) |
| 10 to 14 Minutes | 0 (0.0%) | 24 (6.0%) |
| 15 to 19 Minutes | 135 (37.1%) | 28 (7.0%) |
| 20 to 24 Minutes | 0 (0.0%) | 0 (0.0%) |
| 25 to 29 Minutes | 0 (0.0%) | 0 (0.0%) |
| 30 to 34 Minutes | 106 (29.1%) | 113 (28.0%) |
| 35 to 39 Minutes | 0 (0.0%) | 26 (6.5%) |
| 40 to 44 Minutes | 33 (9.1%) | 82 (20.3%) |
| 45 to 59 Minutes | 90 (24.7%) | 57 (14.1%) |
| 60 to 89 Minutes | 0 (0.0%) | 0 (0.0%) |
| 90 or more Minutes | 0 (0.0%) | 0 (0.0%) |
Time of Departure to Work by Sex in Colorado City
The most frequent times of departure to work in Colorado City are 8:00 AM to 8:29 AM (124, 34.1%) for males and 6:00 AM to 6:29 AM (174, 43.2%) for females.
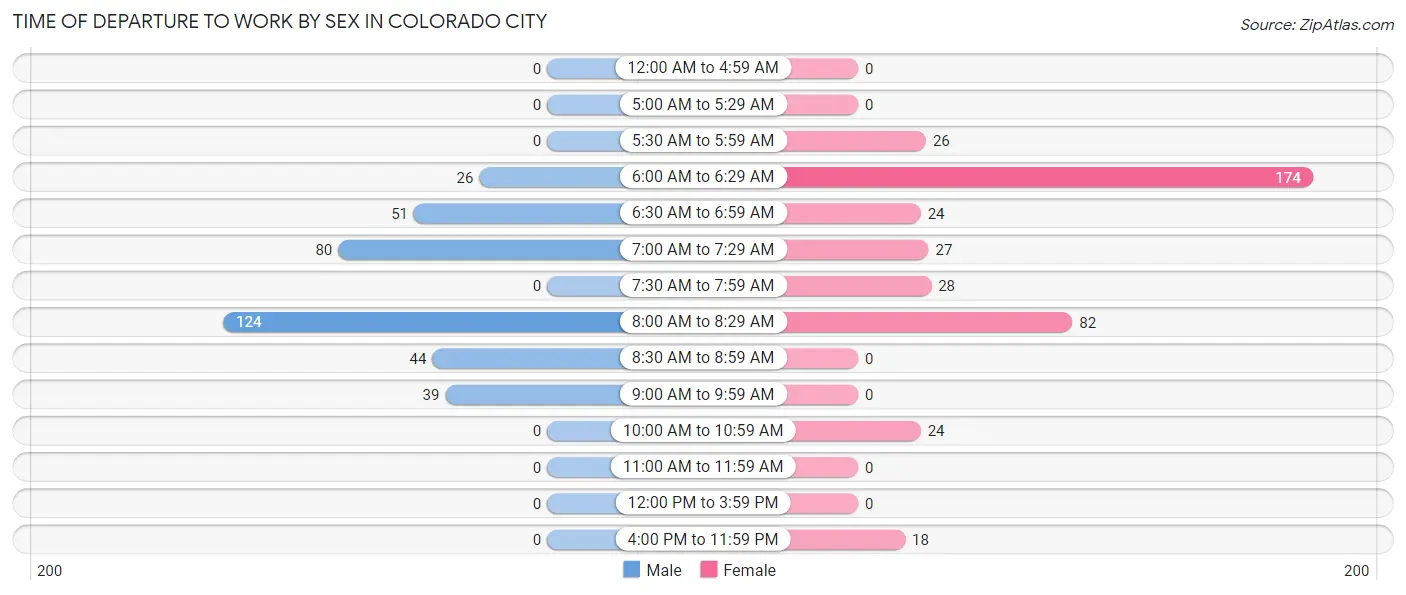
| Time of Departure | Male | Female |
| 12:00 AM to 4:59 AM | 0 (0.0%) | 0 (0.0%) |
| 5:00 AM to 5:29 AM | 0 (0.0%) | 0 (0.0%) |
| 5:30 AM to 5:59 AM | 0 (0.0%) | 26 (6.5%) |
| 6:00 AM to 6:29 AM | 26 (7.1%) | 174 (43.2%) |
| 6:30 AM to 6:59 AM | 51 (14.0%) | 24 (6.0%) |
| 7:00 AM to 7:29 AM | 80 (22.0%) | 27 (6.7%) |
| 7:30 AM to 7:59 AM | 0 (0.0%) | 28 (7.0%) |
| 8:00 AM to 8:29 AM | 124 (34.1%) | 82 (20.3%) |
| 8:30 AM to 8:59 AM | 44 (12.1%) | 0 (0.0%) |
| 9:00 AM to 9:59 AM | 39 (10.7%) | 0 (0.0%) |
| 10:00 AM to 10:59 AM | 0 (0.0%) | 24 (6.0%) |
| 11:00 AM to 11:59 AM | 0 (0.0%) | 0 (0.0%) |
| 12:00 PM to 3:59 PM | 0 (0.0%) | 0 (0.0%) |
| 4:00 PM to 11:59 PM | 0 (0.0%) | 18 (4.5%) |
| Total | 364 (100.0%) | 403 (100.0%) |
Housing Occupancy in Colorado City
Occupancy by Ownership in Colorado City
Of the total 809 dwellings in Colorado City, owner-occupied units account for 580 (71.7%), while renter-occupied units make up 229 (28.3%).
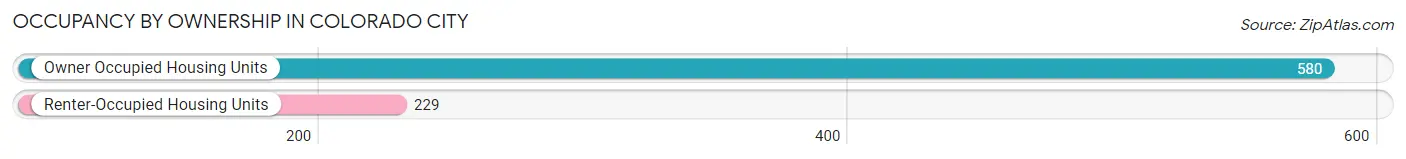
| Occupancy | # Housing Units | % Housing Units |
| Owner Occupied Housing Units | 580 | 71.7% |
| Renter-Occupied Housing Units | 229 | 28.3% |
| Total Occupied Housing Units | 809 | 100.0% |
Occupancy by Household Size in Colorado City
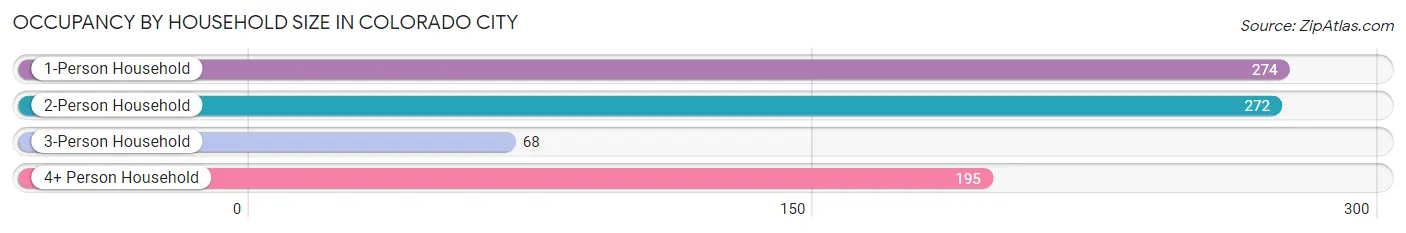
| Household Size | # Housing Units | % Housing Units |
| 1-Person Household | 274 | 33.9% |
| 2-Person Household | 272 | 33.6% |
| 3-Person Household | 68 | 8.4% |
| 4+ Person Household | 195 | 24.1% |
| Total Housing Units | 809 | 100.0% |
Occupancy by Ownership by Household Size in Colorado City
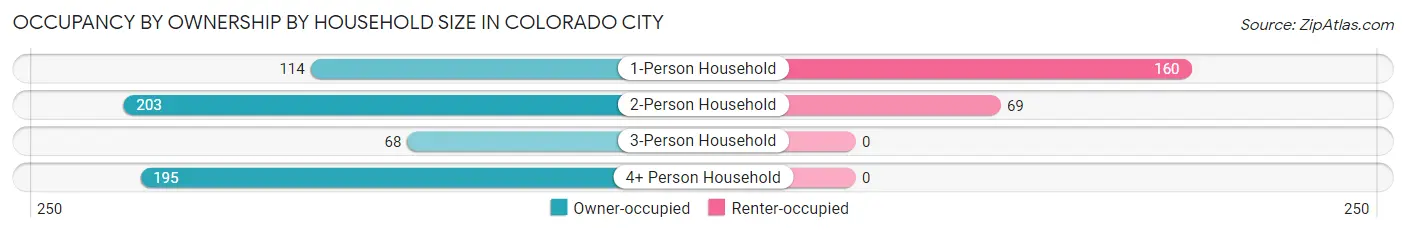
| Household Size | Owner-occupied | Renter-occupied |
| 1-Person Household | 114 (41.6%) | 160 (58.4%) |
| 2-Person Household | 203 (74.6%) | 69 (25.4%) |
| 3-Person Household | 68 (100.0%) | 0 (0.0%) |
| 4+ Person Household | 195 (100.0%) | 0 (0.0%) |
| Total Housing Units | 580 (71.7%) | 229 (28.3%) |
Occupancy by Educational Attainment in Colorado City
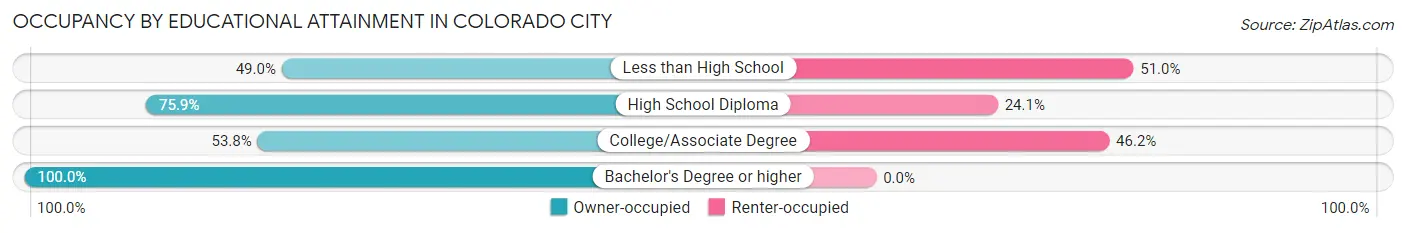
| Household Size | Owner-occupied | Renter-occupied |
| Less than High School | 25 (49.0%) | 26 (51.0%) |
| High School Diploma | 315 (75.9%) | 100 (24.1%) |
| College/Associate Degree | 120 (53.8%) | 103 (46.2%) |
| Bachelor's Degree or higher | 120 (100.0%) | 0 (0.0%) |
Occupancy by Age of Householder in Colorado City
| Age Bracket | # Households | % Households |
| Under 35 Years | 68 | 8.4% |
| 35 to 44 Years | 157 | 19.4% |
| 45 to 54 Years | 78 | 9.6% |
| 55 to 64 Years | 189 | 23.4% |
| 65 to 74 Years | 227 | 28.1% |
| 75 to 84 Years | 90 | 11.1% |
| 85 Years and Over | 0 | 0.0% |
| Total | 809 | 100.0% |
Housing Finances in Colorado City
Median Income by Occupancy in Colorado City
| Occupancy Type | # Households | Median Income |
| Owner-Occupied | 580 (71.7%) | $88,242 |
| Renter-Occupied | 229 (28.3%) | $0 |
| Average | 809 (100.0%) | $55,759 |
Occupancy by Householder Income Bracket in Colorado City
| Income Bracket | Owner-occupied | Renter-occupied |
| Less than $5,000 | 24 (4.1%) | 24 (10.5%) |
| $5,000 to $9,999 | 0 (0.0%) | 17 (7.4%) |
| $10,000 to $14,999 | 37 (6.4%) | 51 (22.3%) |
| $15,000 to $19,999 | 0 (0.0%) | 42 (18.3%) |
| $20,000 to $24,999 | 32 (5.5%) | 0 (0.0%) |
| $25,000 to $34,999 | 25 (4.3%) | 41 (17.9%) |
| $35,000 to $49,999 | 73 (12.6%) | 0 (0.0%) |
| $50,000 to $74,999 | 48 (8.3%) | 54 (23.6%) |
| $75,000 to $99,999 | 145 (25.0%) | 0 (0.0%) |
| $100,000 to $149,999 | 52 (9.0%) | 0 (0.0%) |
| $150,000 or more | 144 (24.8%) | 0 (0.0%) |
| Total | 580 (100.0%) | 229 (100.0%) |
Monthly Housing Cost Tiers in Colorado City
| Monthly Cost | Owner-occupied | Renter-occupied |
| Less than $300 | 0 (0.0%) | 0 (0.0%) |
| $300 to $499 | 127 (21.9%) | 0 (0.0%) |
| $500 to $799 | 143 (24.7%) | 12 (5.2%) |
| $800 to $999 | 59 (10.2%) | 41 (17.9%) |
| $1,000 to $1,499 | 24 (4.1%) | 97 (42.4%) |
| $1,500 to $1,999 | 202 (34.8%) | 0 (0.0%) |
| $2,000 to $2,499 | 25 (4.3%) | 30 (13.1%) |
| $2,500 to $2,999 | 0 (0.0%) | 0 (0.0%) |
| $3,000 or more | 0 (0.0%) | 0 (0.0%) |
| Total | 580 (100.0%) | 229 (100.0%) |
Physical Housing Characteristics in Colorado City
Housing Structures in Colorado City
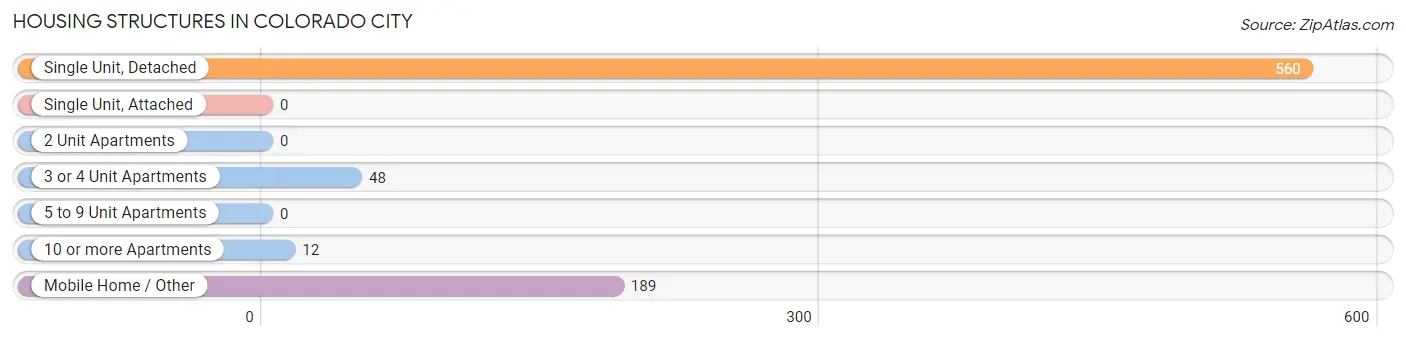
| Structure Type | # Housing Units | % Housing Units |
| Single Unit, Detached | 560 | 69.2% |
| Single Unit, Attached | 0 | 0.0% |
| 2 Unit Apartments | 0 | 0.0% |
| 3 or 4 Unit Apartments | 48 | 5.9% |
| 5 to 9 Unit Apartments | 0 | 0.0% |
| 10 or more Apartments | 12 | 1.5% |
| Mobile Home / Other | 189 | 23.4% |
| Total | 809 | 100.0% |
Housing Structures by Occupancy in Colorado City
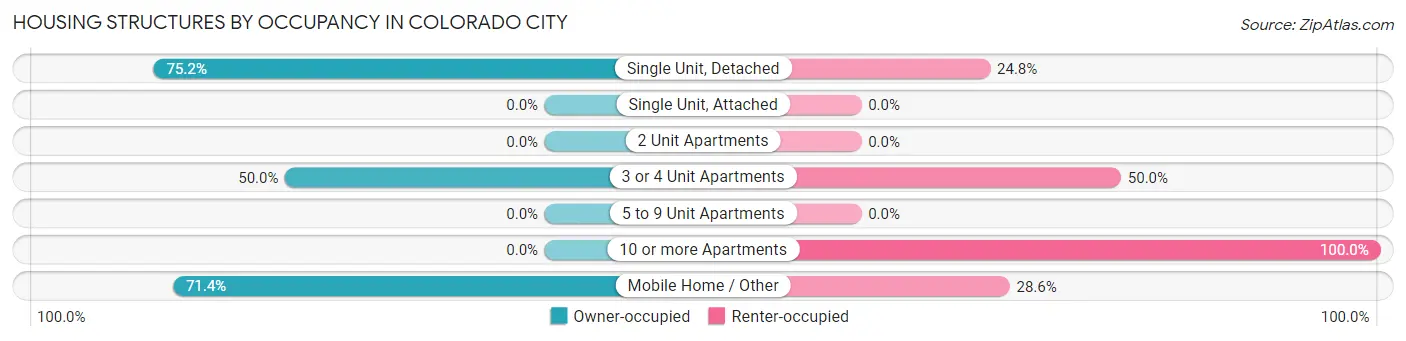
| Structure Type | Owner-occupied | Renter-occupied |
| Single Unit, Detached | 421 (75.2%) | 139 (24.8%) |
| Single Unit, Attached | 0 (0.0%) | 0 (0.0%) |
| 2 Unit Apartments | 0 (0.0%) | 0 (0.0%) |
| 3 or 4 Unit Apartments | 24 (50.0%) | 24 (50.0%) |
| 5 to 9 Unit Apartments | 0 (0.0%) | 0 (0.0%) |
| 10 or more Apartments | 0 (0.0%) | 12 (100.0%) |
| Mobile Home / Other | 135 (71.4%) | 54 (28.6%) |
| Total | 580 (71.7%) | 229 (28.3%) |
Housing Structures by Number of Rooms in Colorado City
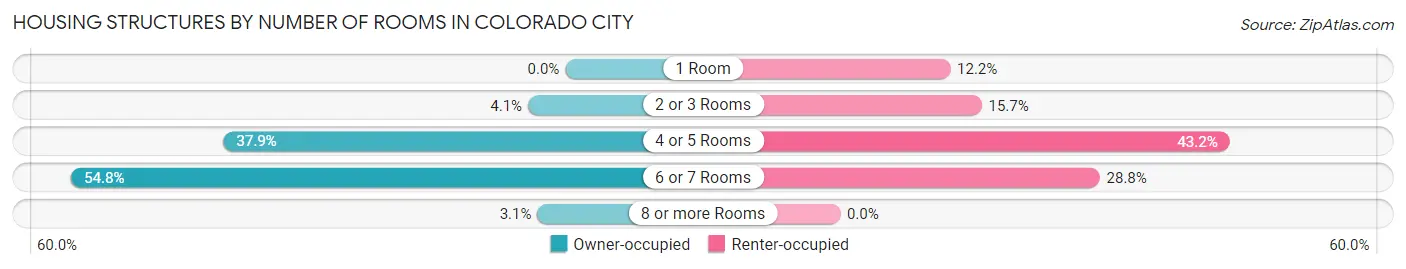
| Number of Rooms | Owner-occupied | Renter-occupied |
| 1 Room | 0 (0.0%) | 28 (12.2%) |
| 2 or 3 Rooms | 24 (4.1%) | 36 (15.7%) |
| 4 or 5 Rooms | 220 (37.9%) | 99 (43.2%) |
| 6 or 7 Rooms | 318 (54.8%) | 66 (28.8%) |
| 8 or more Rooms | 18 (3.1%) | 0 (0.0%) |
| Total | 580 (100.0%) | 229 (100.0%) |
Housing Structure by Heating Type in Colorado City
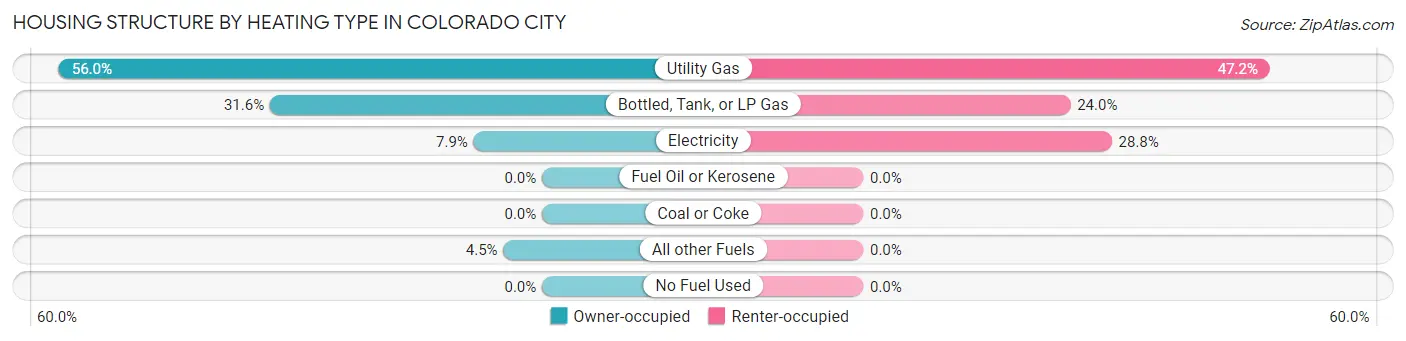
| Heating Type | Owner-occupied | Renter-occupied |
| Utility Gas | 325 (56.0%) | 108 (47.2%) |
| Bottled, Tank, or LP Gas | 183 (31.6%) | 55 (24.0%) |
| Electricity | 46 (7.9%) | 66 (28.8%) |
| Fuel Oil or Kerosene | 0 (0.0%) | 0 (0.0%) |
| Coal or Coke | 0 (0.0%) | 0 (0.0%) |
| All other Fuels | 26 (4.5%) | 0 (0.0%) |
| No Fuel Used | 0 (0.0%) | 0 (0.0%) |
| Total | 580 (100.0%) | 229 (100.0%) |
Household Vehicle Usage in Colorado City
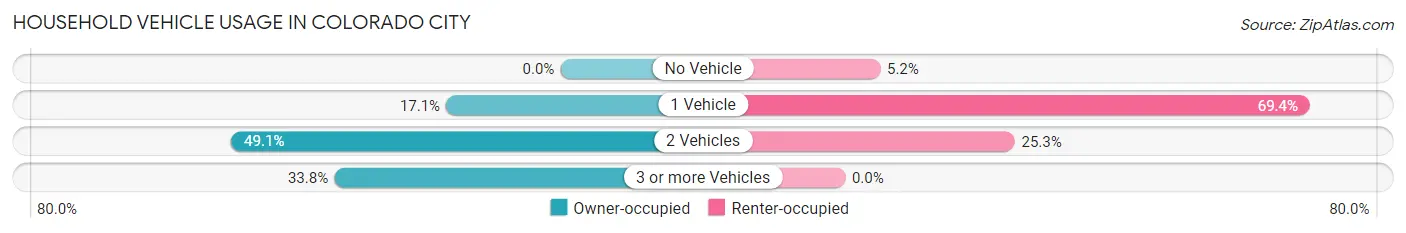
| Vehicles per Household | Owner-occupied | Renter-occupied |
| No Vehicle | 0 (0.0%) | 12 (5.2%) |
| 1 Vehicle | 99 (17.1%) | 159 (69.4%) |
| 2 Vehicles | 285 (49.1%) | 58 (25.3%) |
| 3 or more Vehicles | 196 (33.8%) | 0 (0.0%) |
| Total | 580 (100.0%) | 229 (100.0%) |
Real Estate & Mortgages in Colorado City
Real Estate and Mortgage Overview in Colorado City
| Characteristic | Without Mortgage | With Mortgage |
| Housing Units | 138 | 442 |
| Median Property Value | $194,700 | $204,500 |
| Median Household Income | $50,583 | $117 |
| Monthly Housing Costs | $758 | $0 |
| Real Estate Taxes | $1,155 | $135 |
Property Value by Mortgage Status in Colorado City
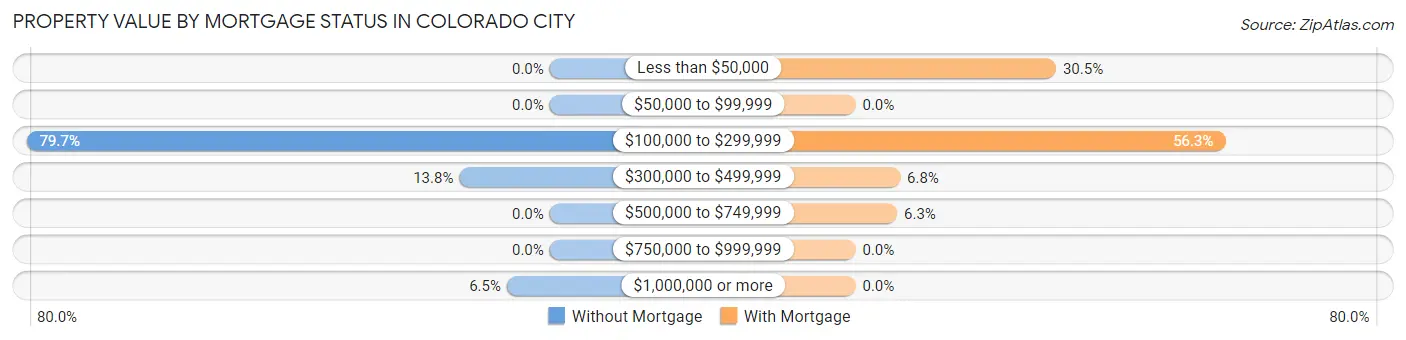
| Property Value | Without Mortgage | With Mortgage |
| Less than $50,000 | 0 (0.0%) | 135 (30.5%) |
| $50,000 to $99,999 | 0 (0.0%) | 0 (0.0%) |
| $100,000 to $299,999 | 110 (79.7%) | 249 (56.3%) |
| $300,000 to $499,999 | 19 (13.8%) | 30 (6.8%) |
| $500,000 to $749,999 | 0 (0.0%) | 28 (6.3%) |
| $750,000 to $999,999 | 0 (0.0%) | 0 (0.0%) |
| $1,000,000 or more | 9 (6.5%) | 0 (0.0%) |
| Total | 138 (100.0%) | 442 (100.0%) |
Household Income by Mortgage Status in Colorado City
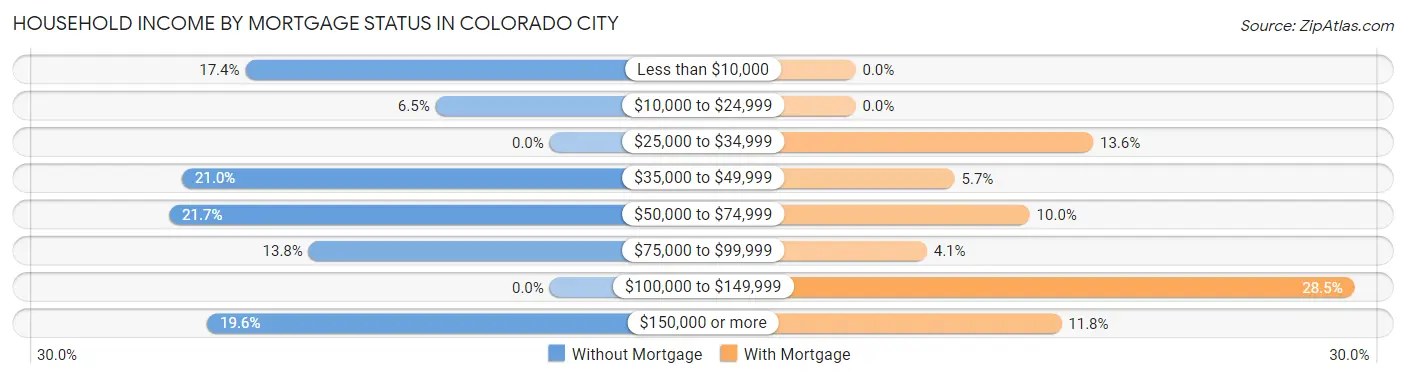
| Household Income | Without Mortgage | With Mortgage |
| Less than $10,000 | 24 (17.4%) | 0 (0.0%) |
| $10,000 to $24,999 | 9 (6.5%) | 0 (0.0%) |
| $25,000 to $34,999 | 0 (0.0%) | 60 (13.6%) |
| $35,000 to $49,999 | 29 (21.0%) | 25 (5.7%) |
| $50,000 to $74,999 | 30 (21.7%) | 44 (10.0%) |
| $75,000 to $99,999 | 19 (13.8%) | 18 (4.1%) |
| $100,000 to $149,999 | 0 (0.0%) | 126 (28.5%) |
| $150,000 or more | 27 (19.6%) | 52 (11.8%) |
| Total | 138 (100.0%) | 442 (100.0%) |
Property Value to Household Income Ratio in Colorado City
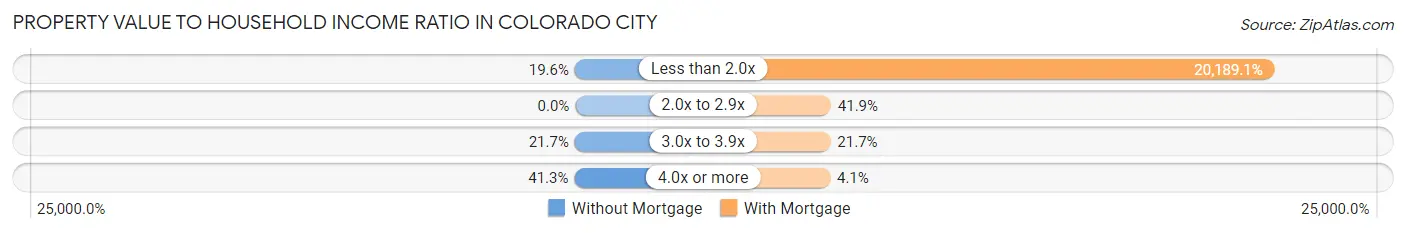
| Value-to-Income Ratio | Without Mortgage | With Mortgage |
| Less than 2.0x | 27 (19.6%) | 89,236 (20,189.1%) |
| 2.0x to 2.9x | 0 (0.0%) | 185 (41.9%) |
| 3.0x to 3.9x | 30 (21.7%) | 96 (21.7%) |
| 4.0x or more | 57 (41.3%) | 18 (4.1%) |
| Total | 138 (100.0%) | 442 (100.0%) |
Real Estate Taxes by Mortgage Status in Colorado City
| Property Taxes | Without Mortgage | With Mortgage |
| Less than $800 | 33 (23.9%) | 0 (0.0%) |
| $800 to $1,499 | 56 (40.6%) | 130 (29.4%) |
| $800 to $1,499 | 49 (35.5%) | 152 (34.4%) |
| Total | 138 (100.0%) | 442 (100.0%) |
Health & Disability in Colorado City
Health Insurance Coverage by Age in Colorado City
| Age Bracket | With Coverage | Without Coverage |
| Under 6 Years | 65 (100.0%) | 0 (0.0%) |
| 6 to 18 Years | 387 (100.0%) | 0 (0.0%) |
| 19 to 25 Years | 224 (100.0%) | 0 (0.0%) |
| 26 to 34 Years | 0 (0.0%) | 0 (0.0%) |
| 35 to 44 Years | 289 (100.0%) | 0 (0.0%) |
| 45 to 54 Years | 203 (100.0%) | 0 (0.0%) |
| 55 to 64 Years | 240 (90.2%) | 26 (9.8%) |
| 65 to 74 Years | 335 (100.0%) | 0 (0.0%) |
| 75 Years and older | 163 (100.0%) | 0 (0.0%) |
| Total | 1,906 (98.7%) | 26 (1.3%) |
Health Insurance Coverage by Citizenship Status in Colorado City

| Citizenship Status | With Coverage | Without Coverage |
| Native Born | 65 (100.0%) | 0 (0.0%) |
| Foreign Born, Citizen | 387 (100.0%) | 0 (0.0%) |
| Foreign Born, not a Citizen | 224 (100.0%) | 0 (0.0%) |
Health Insurance Coverage by Household Income in Colorado City
| Household Income | With Coverage | Without Coverage |
| Under $25,000 | 208 (88.9%) | 26 (11.1%) |
| $25,000 to $49,999 | 306 (100.0%) | 0 (0.0%) |
| $50,000 to $74,999 | 261 (100.0%) | 0 (0.0%) |
| $75,000 to $99,999 | 463 (100.0%) | 0 (0.0%) |
| $100,000 and over | 668 (100.0%) | 0 (0.0%) |
Public vs Private Health Insurance Coverage by Age in Colorado City
| Age Bracket | Public Insurance | Private Insurance |
| Under 6 | 37 (56.9%) | 65 (100.0%) |
| 6 to 18 Years | 0 (0.0%) | 387 (100.0%) |
| 19 to 25 Years | 74 (33.0%) | 194 (86.6%) |
| 25 to 34 Years | 0 (0.0%) | 0 (0.0%) |
| 35 to 44 Years | 17 (5.9%) | 272 (94.1%) |
| 45 to 54 Years | 0 (0.0%) | 203 (100.0%) |
| 55 to 64 Years | 104 (39.1%) | 159 (59.8%) |
| 65 to 74 Years | 335 (100.0%) | 217 (64.8%) |
| 75 Years and over | 163 (100.0%) | 34 (20.9%) |
| Total | 730 (37.8%) | 1,531 (79.2%) |
Disability Status by Sex by Age in Colorado City
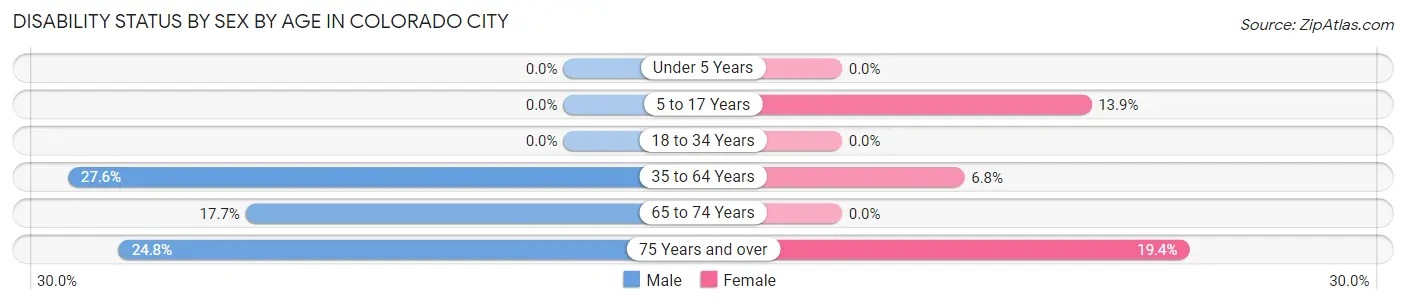
| Age Bracket | Male | Female |
| Under 5 Years | 0 (0.0%) | 0 (0.0%) |
| 5 to 17 Years | 0 (0.0%) | 25 (13.9%) |
| 18 to 34 Years | 0 (0.0%) | 0 (0.0%) |
| 35 to 64 Years | 104 (27.6%) | 26 (6.8%) |
| 65 to 74 Years | 26 (17.7%) | 0 (0.0%) |
| 75 Years and over | 25 (24.7%) | 12 (19.4%) |
Disability Class by Sex by Age in Colorado City
Disability Class: Hearing Difficulty
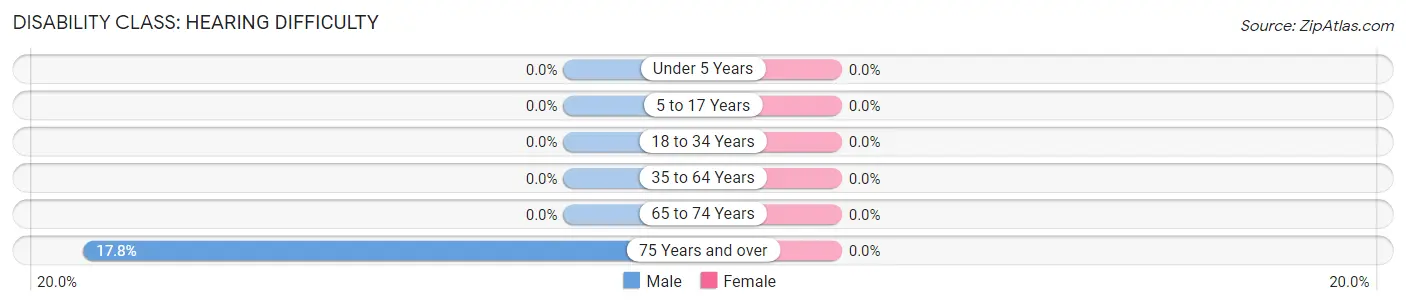
| Age Bracket | Male | Female |
| Under 5 Years | 0 (0.0%) | 0 (0.0%) |
| 5 to 17 Years | 0 (0.0%) | 0 (0.0%) |
| 18 to 34 Years | 0 (0.0%) | 0 (0.0%) |
| 35 to 64 Years | 0 (0.0%) | 0 (0.0%) |
| 65 to 74 Years | 0 (0.0%) | 0 (0.0%) |
| 75 Years and over | 18 (17.8%) | 0 (0.0%) |
Disability Class: Vision Difficulty
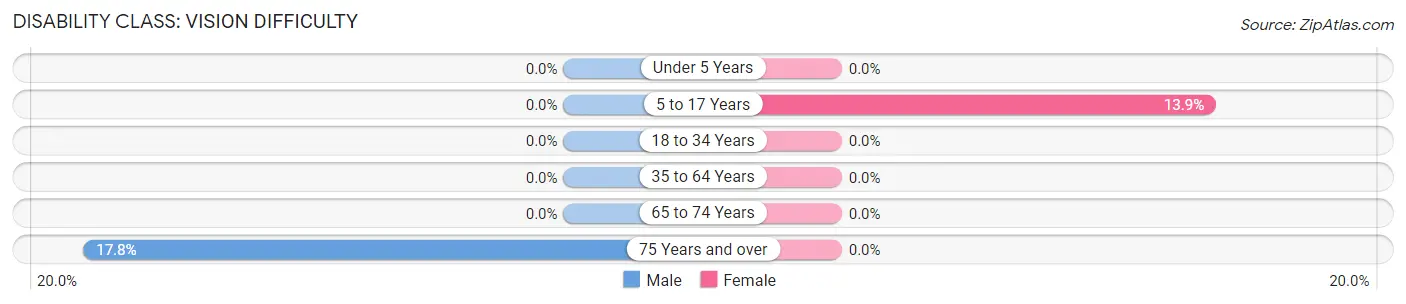
| Age Bracket | Male | Female |
| Under 5 Years | 0 (0.0%) | 0 (0.0%) |
| 5 to 17 Years | 0 (0.0%) | 25 (13.9%) |
| 18 to 34 Years | 0 (0.0%) | 0 (0.0%) |
| 35 to 64 Years | 0 (0.0%) | 0 (0.0%) |
| 65 to 74 Years | 0 (0.0%) | 0 (0.0%) |
| 75 Years and over | 18 (17.8%) | 0 (0.0%) |
Disability Class: Cognitive Difficulty
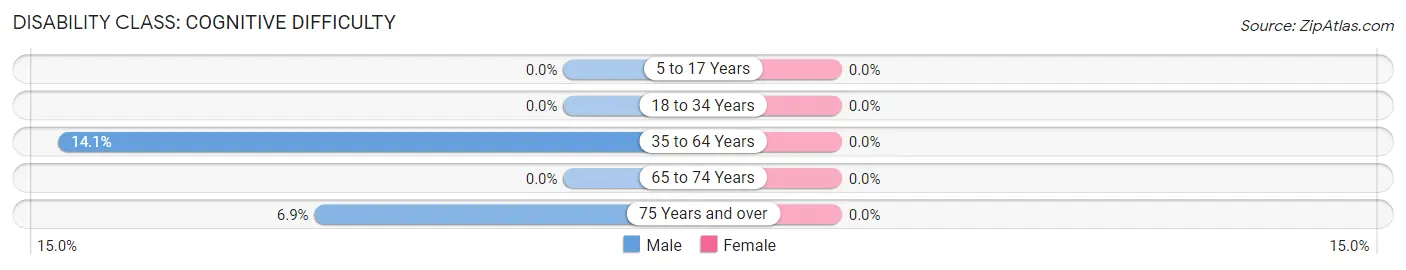
| Age Bracket | Male | Female |
| 5 to 17 Years | 0 (0.0%) | 0 (0.0%) |
| 18 to 34 Years | 0 (0.0%) | 0 (0.0%) |
| 35 to 64 Years | 53 (14.1%) | 0 (0.0%) |
| 65 to 74 Years | 0 (0.0%) | 0 (0.0%) |
| 75 Years and over | 7 (6.9%) | 0 (0.0%) |
Disability Class: Ambulatory Difficulty
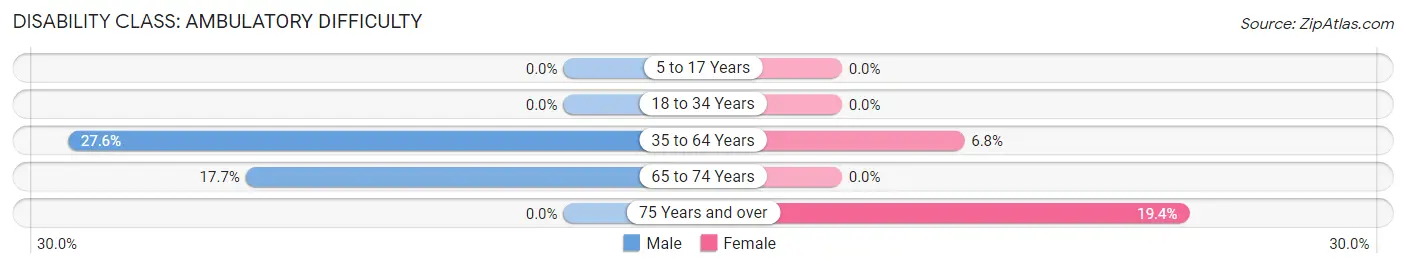
| Age Bracket | Male | Female |
| 5 to 17 Years | 0 (0.0%) | 0 (0.0%) |
| 18 to 34 Years | 0 (0.0%) | 0 (0.0%) |
| 35 to 64 Years | 104 (27.6%) | 26 (6.8%) |
| 65 to 74 Years | 26 (17.7%) | 0 (0.0%) |
| 75 Years and over | 0 (0.0%) | 12 (19.4%) |
Disability Class: Self-Care Difficulty
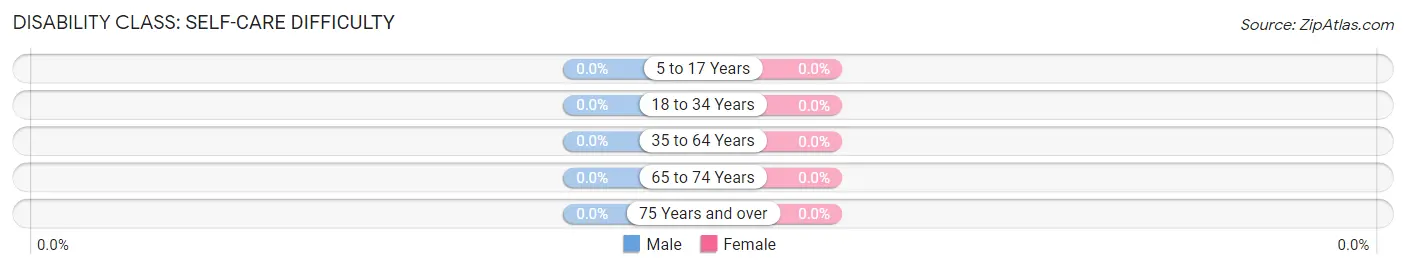
| Age Bracket | Male | Female |
| 5 to 17 Years | 0 (0.0%) | 0 (0.0%) |
| 18 to 34 Years | 0 (0.0%) | 0 (0.0%) |
| 35 to 64 Years | 0 (0.0%) | 0 (0.0%) |
| 65 to 74 Years | 0 (0.0%) | 0 (0.0%) |
| 75 Years and over | 0 (0.0%) | 0 (0.0%) |
Technology Access in Colorado City
Computing Device Access in Colorado City
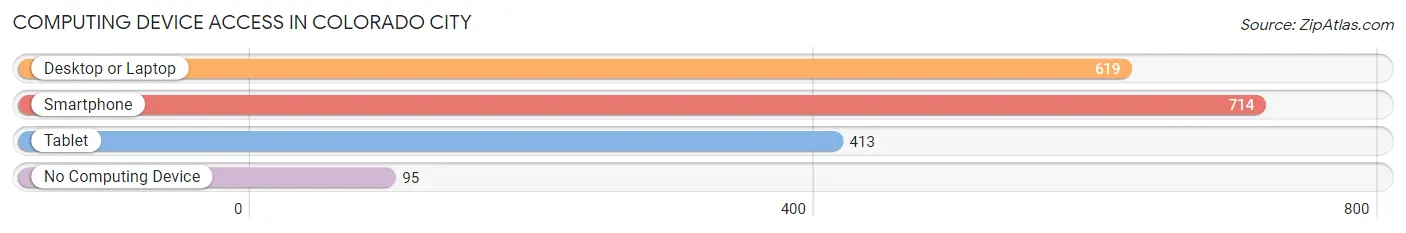
| Device Type | # Households | % Households |
| Desktop or Laptop | 619 | 76.5% |
| Smartphone | 714 | 88.3% |
| Tablet | 413 | 51.0% |
| No Computing Device | 95 | 11.7% |
| Total | 809 | 100.0% |
Internet Access in Colorado City
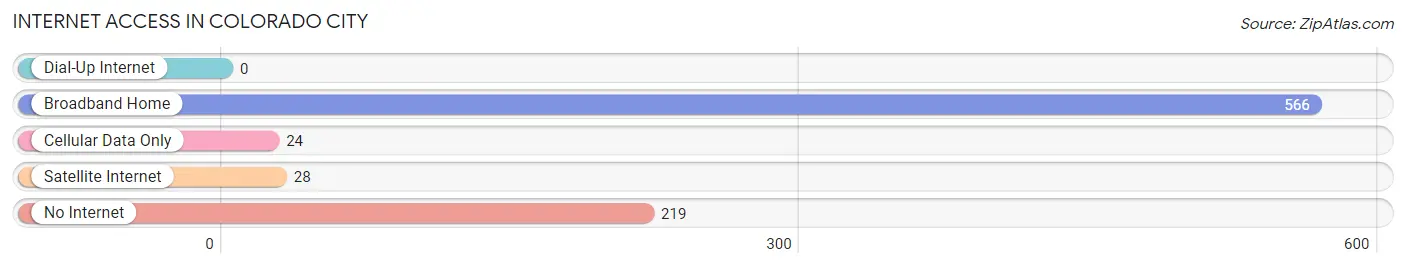
| Internet Type | # Households | % Households |
| Dial-Up Internet | 0 | 0.0% |
| Broadband Home | 566 | 70.0% |
| Cellular Data Only | 24 | 3.0% |
| Satellite Internet | 28 | 3.5% |
| No Internet | 219 | 27.1% |
| Total | 809 | 100.0% |
Colorado City Summary
City of Colorado City
Colorado City is a city located in the state of Colorado, United States. It is located in the south-central part of the state, in Pueblo County. The city is situated at the base of the Rocky Mountains, and is the county seat of Pueblo County. The city is home to a population of approximately 11,000 people, and is the largest city in the county.
History
The area that is now Colorado City was first settled in the late 1800s by settlers from the eastern United States. The city was originally known as "Pueblo City", and was founded in 1872. The city was named after the nearby Pueblo Indian tribe, who had inhabited the area for centuries.
The city was initially a small farming community, but began to grow in the early 1900s. The city was incorporated in 1909, and the population began to grow rapidly. By the 1920s, the city had become a major center for the coal mining industry. The city was also home to a large number of immigrants from Mexico and other Latin American countries.
The city experienced a period of decline in the 1950s and 1960s, as the coal mining industry began to decline. The city was also affected by the Great Depression, and many of the city's residents left in search of work elsewhere. However, the city began to experience a resurgence in the 1970s, as the city began to attract new businesses and industries.
Geography
Colorado City is located in the south-central part of the state, in Pueblo County. The city is situated at the base of the Rocky Mountains, and is the county seat of Pueblo County. The city is located at an elevation of 5,890 feet above sea level.
The city is located in a semi-arid climate, with hot summers and cold winters. The average annual temperature is around 50 degrees Fahrenheit. The city receives an average of 16 inches of precipitation per year.
Economy
The economy of Colorado City is largely based on the service industry. The city is home to a number of retail stores, restaurants, and other businesses. The city is also home to a number of manufacturing companies, including a number of food processing plants.
The city is also home to a number of government offices, including the Pueblo County Courthouse. The city is also home to a number of educational institutions, including the University of Colorado at Colorado Springs.
Demographics
As of the 2010 census, the population of Colorado City was 11,000. The racial makeup of the city was 79.3% White, 0.7% African American, 0.7% Native American, 0.7% Asian, 0.2% Pacific Islander, and 17.3% from other races. Hispanic or Latino of any race were 33.3% of the population.
The median household income in the city was $37,000, and the median family income was $45,000. The per capita income in the city was $19,000. The poverty rate in the city was 16.3%.
Conclusion
Colorado City is a city located in the state of Colorado, United States. It is located in the south-central part of the state, in Pueblo County. The city is situated at the base of the Rocky Mountains, and is the county seat of Pueblo County. The city is home to a population of approximately 11,000 people, and is the largest city in the county. The economy of Colorado City is largely based on the service industry, and the city is home to a number of retail stores, restaurants, and other businesses. The racial makeup of the city is 79.3% White, 0.7% African American, 0.7% Native American, 0.7% Asian, 0.2% Pacific Islander, and 17.3% from other races. The median household income in the city was $37,000, and the median family income was $45,000. The per capita income in the city was $19,000. The poverty rate in the city was 16.3%.
Common Questions
What is Per Capita Income in Colorado City?
Per Capita income in Colorado City is $32,717.
What is the Median Family Income in Colorado City?
Median Family Income in Colorado City is $88,420.
What is the Median Household income in Colorado City?
Median Household Income in Colorado City is $55,759.
What is Inequality or Gini Index in Colorado City?
Inequality or Gini Index in Colorado City is 0.48.
What is the Total Population of Colorado City?
Total Population of Colorado City is 1,932.
What is the Total Male Population of Colorado City?
Total Male Population of Colorado City is 850.
What is the Total Female Population of Colorado City?
Total Female Population of Colorado City is 1,082.
What is the Ratio of Males per 100 Females in Colorado City?
There are 78.56 Males per 100 Females in Colorado City.
What is the Ratio of Females per 100 Males in Colorado City?
There are 127.29 Females per 100 Males in Colorado City.
What is the Median Population Age in Colorado City?
Median Population Age in Colorado City is 48.0 Years.
What is the Average Family Size in Colorado City
Average Family Size in Colorado City is 3.1 People.
What is the Average Household Size in Colorado City
Average Household Size in Colorado City is 2.4 People.
How Large is the Labor Force in Colorado City?
There are 785 People in the Labor Forcein in Colorado City.
What is the Percentage of People in the Labor Force in Colorado City?
46.4% of People are in the Labor Force in Colorado City.