Zip Codes with the Highest Percentage of Population Employed in Security & Protection in Littleton, CO
RELATED REPORTS & OPTIONS
Security & Protection
Littleton
Compare Zip Codes
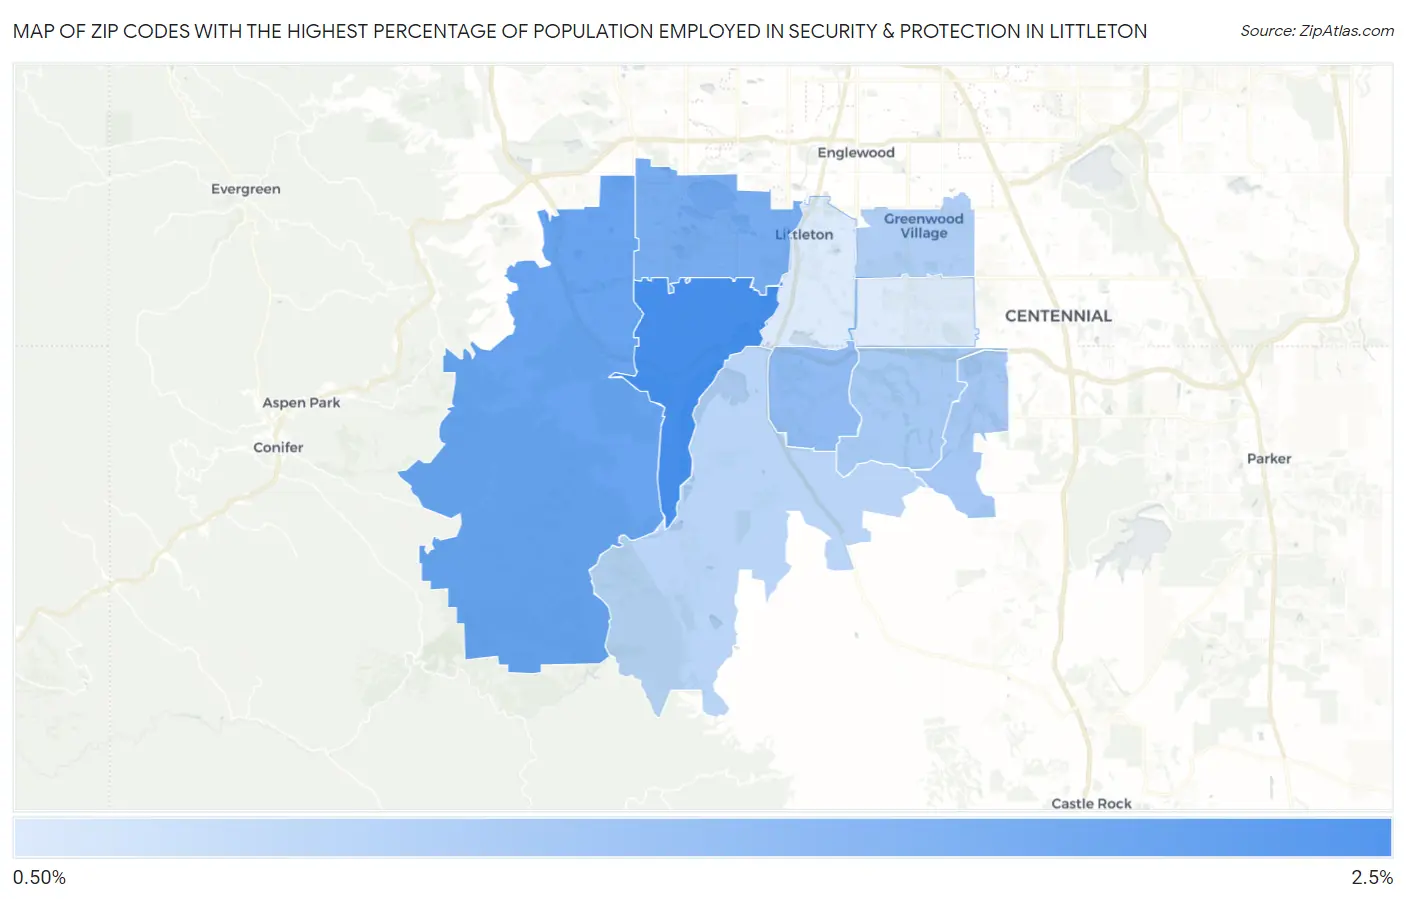
Map of Zip Codes with the Highest Percentage of Population Employed in Security & Protection in Littleton
1.0%
2.5%
Zip Codes with the Highest Percentage of Population Employed in Security & Protection in Littleton, CO
| Zip Code | % Employed | vs State | vs National | |
| 1. | 80128 | 2.5% | 2.0%(+0.450)#154 | 2.1%(+0.306)#9,762 |
| 2. | 80127 | 2.1% | 2.0%(+0.110)#184 | 2.1%(-0.034)#11,811 |
| 3. | 80123 | 2.0% | 2.0%(-0.014)#200 | 2.1%(-0.158)#12,617 |
| 4. | 80129 | 1.7% | 2.0%(-0.257)#227 | 2.1%(-0.401)#14,323 |
| 5. | 80130 | 1.6% | 2.0%(-0.454)#253 | 2.1%(-0.598)#15,793 |
| 6. | 80126 | 1.5% | 2.0%(-0.479)#258 | 2.1%(-0.622)#15,976 |
| 7. | 80121 | 1.5% | 2.0%(-0.551)#268 | 2.1%(-0.695)#16,548 |
| 8. | 80125 | 1.4% | 2.0%(-0.652)#280 | 2.1%(-0.796)#17,316 |
| 9. | 80120 | 1.0% | 2.0%(-0.982)#318 | 2.1%(-1.13)#19,860 |
| 10. | 80122 | 1.0% | 2.0%(-0.985)#319 | 2.1%(-1.13)#19,877 |
1
Common Questions
What are the Top 5 Zip Codes with the Highest Percentage of Population Employed in Security & Protection in Littleton, CO?
Top 5 Zip Codes with the Highest Percentage of Population Employed in Security & Protection in Littleton, CO are:
What zip code has the Highest Percentage of Population Employed in Security & Protection in Littleton, CO?
80128 has the Highest Percentage of Population Employed in Security & Protection in Littleton, CO with 2.5%.
What is the Percentage of Population Employed in Security & Protection in Littleton, CO?
Percentage of Population Employed in Security & Protection in Littleton is 0.86%.
What is the Percentage of Population Employed in Security & Protection in Colorado?
Percentage of Population Employed in Security & Protection in Colorado is 2.0%.
What is the Percentage of Population Employed in Security & Protection in the United States?
Percentage of Population Employed in Security & Protection in the United States is 2.1%.