Silver Plume, CO Map & Demographics
Silver Plume Map
Silver Plume Overview
$47,377
PER CAPITA INCOME
$115,938
AVG FAMILY INCOME
55.7%
WAGE / INCOME GAP [ % ]
44.3¢/ $1
WAGE / INCOME GAP [ $ ]
0.41
INEQUALITY / GINI INDEX
203
TOTAL POPULATION
86
MALE POPULATION
117
FEMALE POPULATION
73.50
MALES / 100 FEMALES
136.05
FEMALES / 100 MALES
46.0
MEDIAN AGE
2.9
AVG FAMILY SIZE
2.2
AVG HOUSEHOLD SIZE
91
LABOR FORCE [ PEOPLE ]
48.7%
PERCENT IN LABOR FORCE
Silver Plume Zip Codes
Silver Plume Area Codes
Income in Silver Plume
Income Overview in Silver Plume
| Characteristic | Number | Measure |
| Per Capita Income | 203 | $47,377 |
| Median Family Income | 53 | $115,938 |
| Mean Family Income | 53 | $105,915 |
| Median Household Income | 91 | $0 |
| Mean Household Income | 91 | $98,724 |
| Income Deficit | 53 | $0 |
| Wage / Income Gap (%) | 203 | 55.75% |
| Wage / Income Gap ($) | 203 | 44.25¢ per $1 |
| Gini / Inequality Index | 203 | 0.41 |
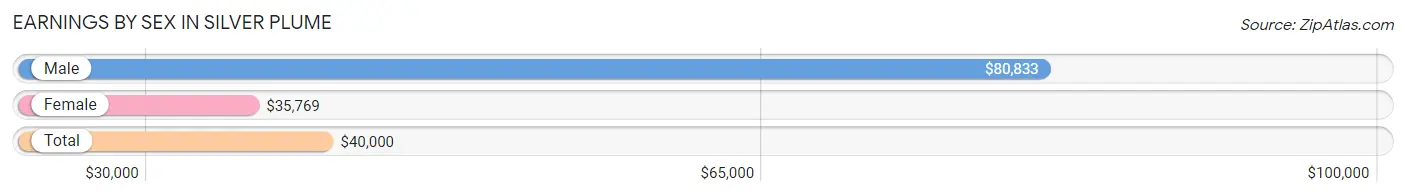
Earnings by Sex in Silver Plume
Average Earnings in Silver Plume are $40,000, $80,833 for men and $35,769 for women, a difference of 55.7%.
| Sex | Number | Average Earnings |
| Male | 36 (30.0%) | $80,833 |
| Female | 84 (70.0%) | $35,769 |
| Total | 120 (100.0%) | $40,000 |
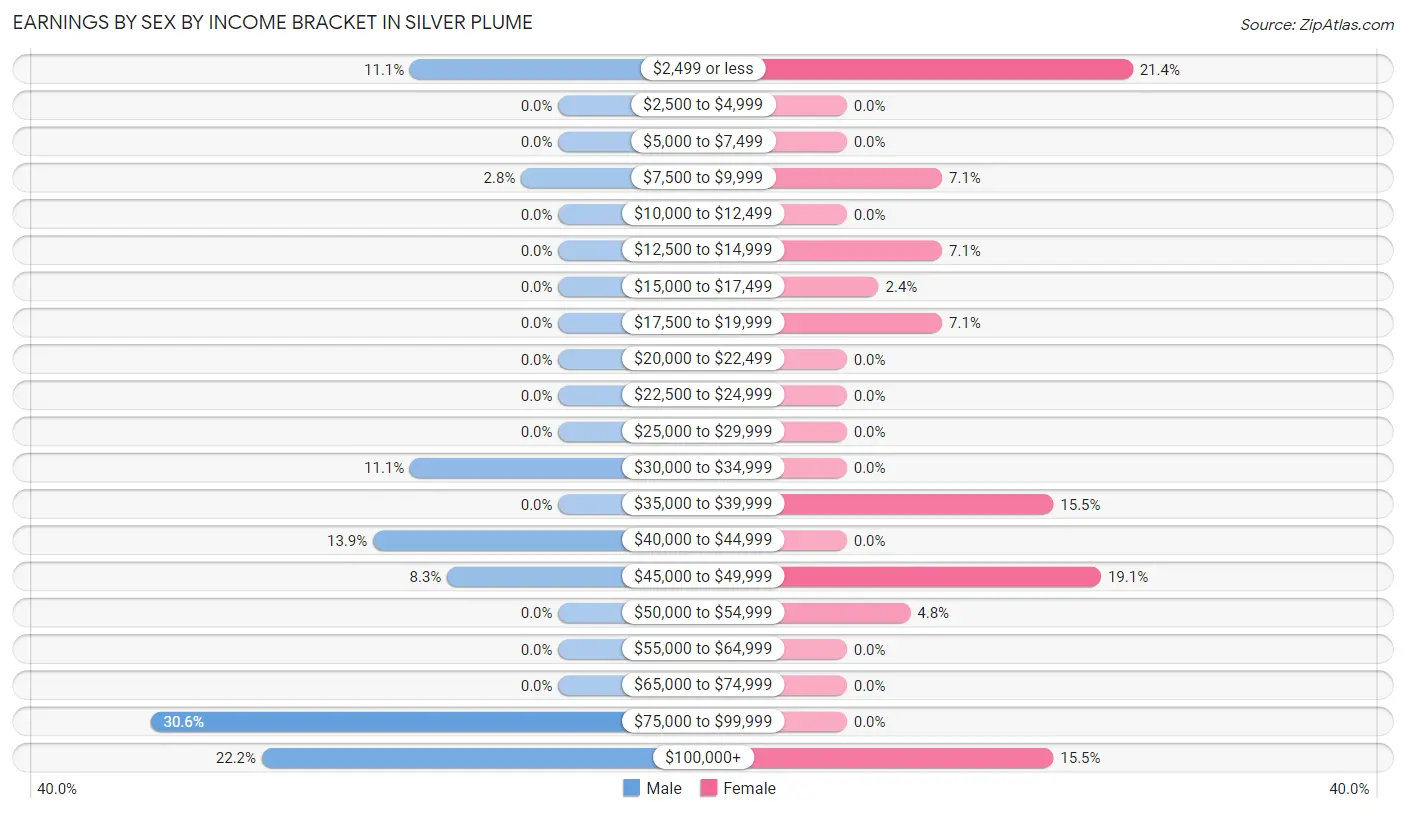
Earnings by Sex by Income Bracket in Silver Plume
The most common earnings brackets in Silver Plume are $75,000 to $99,999 for men (11 | 30.6%) and $2,499 or less for women (18 | 21.4%).
| Income | Male | Female |
| $2,499 or less | 4 (11.1%) | 18 (21.4%) |
| $2,500 to $4,999 | 0 (0.0%) | 0 (0.0%) |
| $5,000 to $7,499 | 0 (0.0%) | 0 (0.0%) |
| $7,500 to $9,999 | 1 (2.8%) | 6 (7.1%) |
| $10,000 to $12,499 | 0 (0.0%) | 0 (0.0%) |
| $12,500 to $14,999 | 0 (0.0%) | 6 (7.1%) |
| $15,000 to $17,499 | 0 (0.0%) | 2 (2.4%) |
| $17,500 to $19,999 | 0 (0.0%) | 6 (7.1%) |
| $20,000 to $22,499 | 0 (0.0%) | 0 (0.0%) |
| $22,500 to $24,999 | 0 (0.0%) | 0 (0.0%) |
| $25,000 to $29,999 | 0 (0.0%) | 0 (0.0%) |
| $30,000 to $34,999 | 4 (11.1%) | 0 (0.0%) |
| $35,000 to $39,999 | 0 (0.0%) | 13 (15.5%) |
| $40,000 to $44,999 | 5 (13.9%) | 0 (0.0%) |
| $45,000 to $49,999 | 3 (8.3%) | 16 (19.1%) |
| $50,000 to $54,999 | 0 (0.0%) | 4 (4.8%) |
| $55,000 to $64,999 | 0 (0.0%) | 0 (0.0%) |
| $65,000 to $74,999 | 0 (0.0%) | 0 (0.0%) |
| $75,000 to $99,999 | 11 (30.6%) | 0 (0.0%) |
| $100,000+ | 8 (22.2%) | 13 (15.5%) |
| Total | 36 (100.0%) | 84 (100.0%) |
Earnings by Sex by Educational Attainment in Silver Plume
| Educational Attainment | Male Income | Female Income |
| Less than High School | - | - |
| High School Diploma | - | - |
| College or Associate's Degree | - | - |
| Bachelor's Degree | - | - |
| Graduate Degree | - | - |
| Total | $80,833 | $35,769 |
Family Income in Silver Plume
Family Income Brackets in Silver Plume
According to the Silver Plume family income data, there are 18 families falling into the $100,000 to $149,999 income range, which is the most common income bracket and makes up 34.0% of all families.
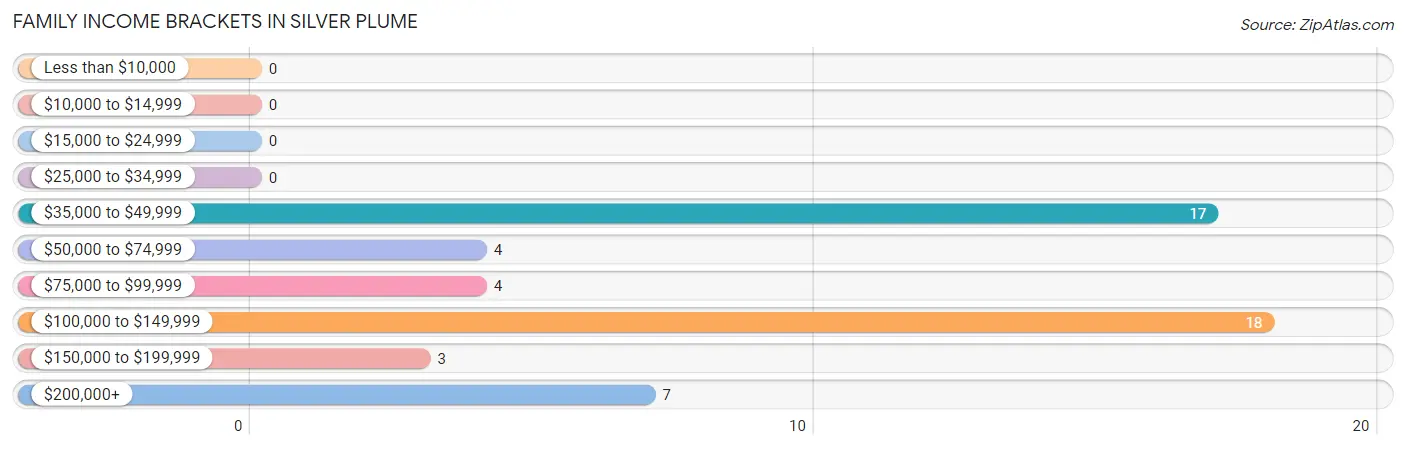
| Income Bracket | # Families | % Families |
| Less than $10,000 | 0 | 0.0% |
| $10,000 to $14,999 | 0 | 0.0% |
| $15,000 to $24,999 | 0 | 0.0% |
| $25,000 to $34,999 | 0 | 0.0% |
| $35,000 to $49,999 | 17 | 32.1% |
| $50,000 to $74,999 | 4 | 7.5% |
| $75,000 to $99,999 | 4 | 7.5% |
| $100,000 to $149,999 | 18 | 34.0% |
| $150,000 to $199,999 | 3 | 5.7% |
| $200,000+ | 7 | 13.2% |
Family Income by Famaliy Size in Silver Plume
2-person families (29 | 54.7%) account for the highest median family income in Silver Plume with $123,750 per family, while 2-person families (29 | 54.7%) have the highest median income of $61,875 per family member.
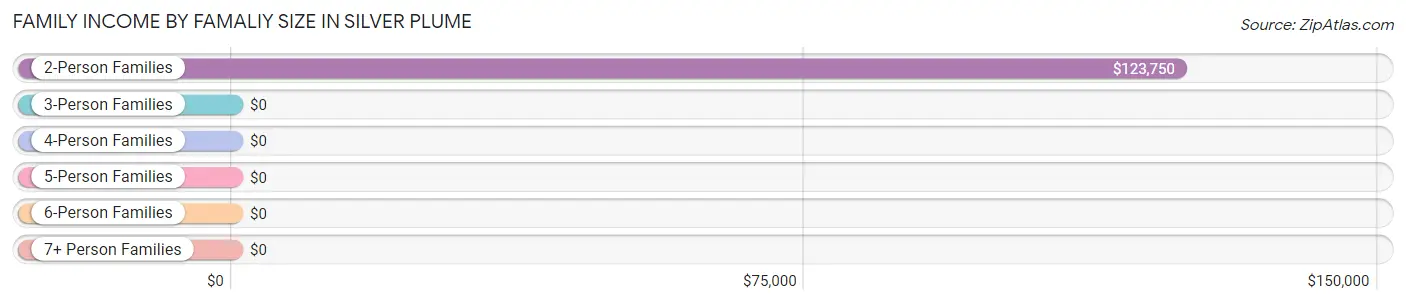
| Income Bracket | # Families | Median Income |
| 2-Person Families | 29 (54.7%) | $123,750 |
| 3-Person Families | 17 (32.1%) | $0 |
| 4-Person Families | 5 (9.4%) | $0 |
| 5-Person Families | 0 (0.0%) | $0 |
| 6-Person Families | 2 (3.8%) | $0 |
| 7+ Person Families | 0 (0.0%) | $0 |
| Total | 53 (100.0%) | $115,938 |
Family Income by Number of Earners in Silver Plume
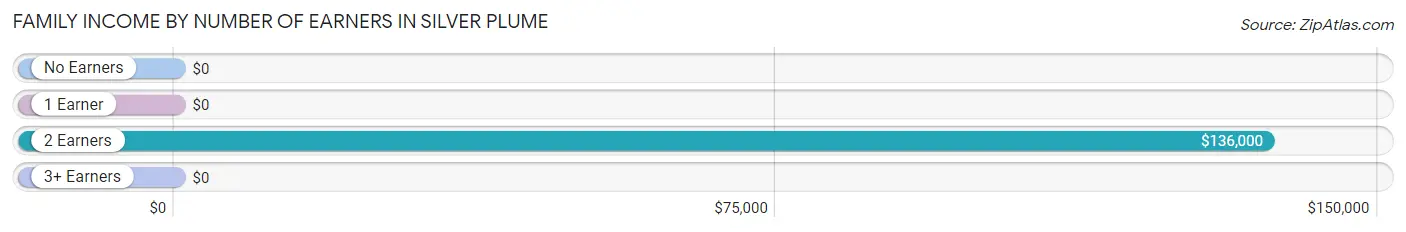
| Number of Earners | # Families | Median Income |
| No Earners | 5 (9.4%) | $0 |
| 1 Earner | 28 (52.8%) | $0 |
| 2 Earners | 20 (37.7%) | $136,000 |
| 3+ Earners | 0 (0.0%) | $0 |
| Total | 53 (100.0%) | $115,938 |
Household Income in Silver Plume
Household Income Brackets in Silver Plume
With 36 households falling in the category, the $35,000 to $49,999 income range is the most frequent in Silver Plume, accounting for 39.6% of all households.
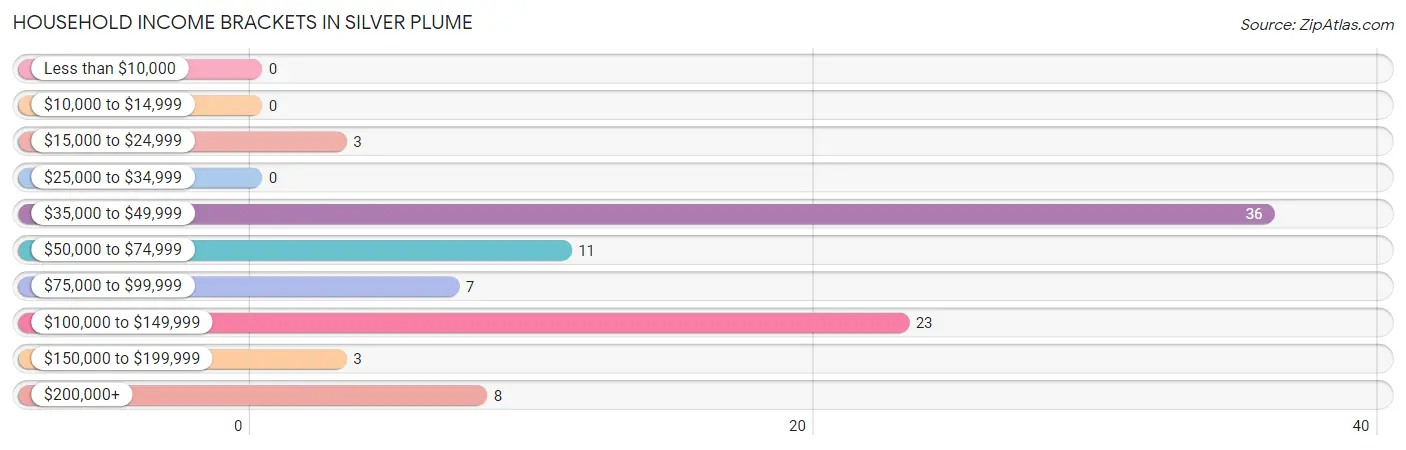
| Income Bracket | # Households | % Households |
| Less than $10,000 | 0 | 0.0% |
| $10,000 to $14,999 | 0 | 0.0% |
| $15,000 to $24,999 | 3 | 3.3% |
| $25,000 to $34,999 | 0 | 0.0% |
| $35,000 to $49,999 | 36 | 39.6% |
| $50,000 to $74,999 | 11 | 12.1% |
| $75,000 to $99,999 | 7 | 7.7% |
| $100,000 to $149,999 | 23 | 25.3% |
| $150,000 to $199,999 | 3 | 3.3% |
| $200,000+ | 8 | 8.8% |
Household Income by Householder Age in Silver Plume
The median household income in Silver Plume is $0, with the highest median household income of $136,500 found in the 45 to 64 years age bracket for the primary householder. A total of 26 households (28.6%) fall into this category.
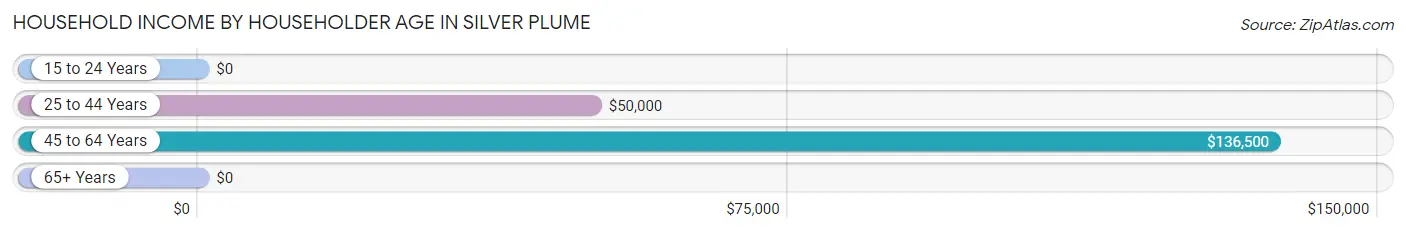
| Income Bracket | # Households | Median Income |
| 15 to 24 Years | 0 (0.0%) | $0 |
| 25 to 44 Years | 32 (35.2%) | $50,000 |
| 45 to 64 Years | 26 (28.6%) | $136,500 |
| 65+ Years | 33 (36.3%) | $0 |
| Total | 91 (100.0%) | $0 |
Poverty in Silver Plume
Income Below Poverty by Sex and Age in Silver Plume
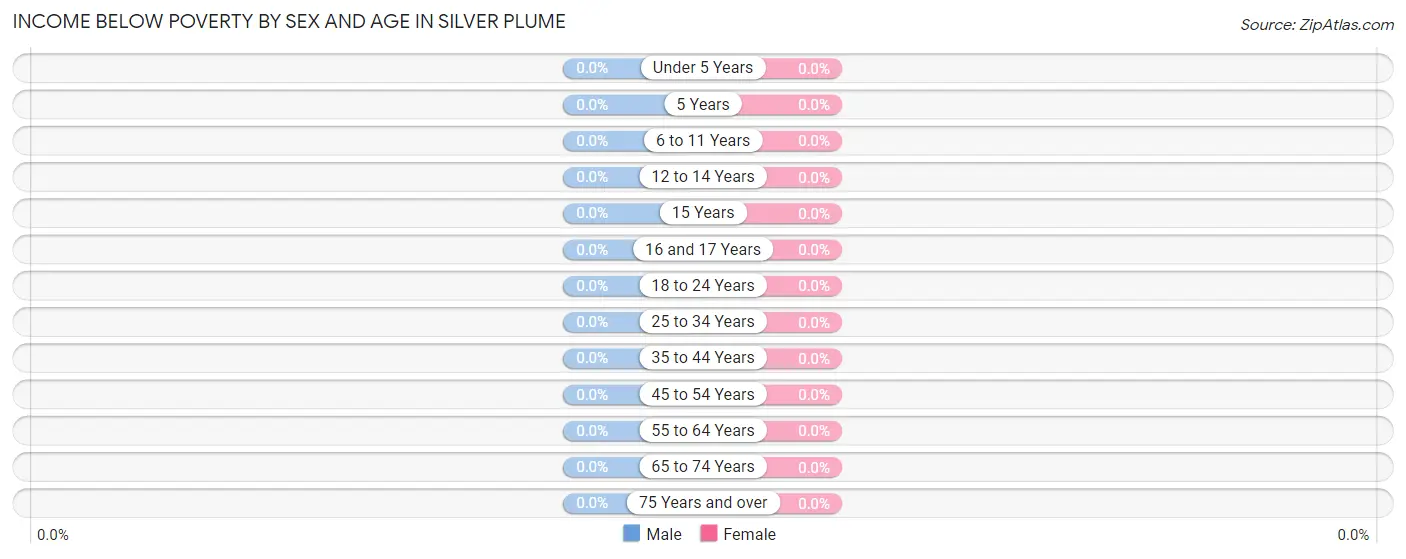
| Age Bracket | Male | Female |
| Under 5 Years | 0 (0.0%) | 0 (0.0%) |
| 5 Years | 0 (0.0%) | 0 (0.0%) |
| 6 to 11 Years | 0 (0.0%) | 0 (0.0%) |
| 12 to 14 Years | 0 (0.0%) | 0 (0.0%) |
| 15 Years | 0 (0.0%) | 0 (0.0%) |
| 16 and 17 Years | 0 (0.0%) | 0 (0.0%) |
| 18 to 24 Years | 0 (0.0%) | 0 (0.0%) |
| 25 to 34 Years | 0 (0.0%) | 0 (0.0%) |
| 35 to 44 Years | 0 (0.0%) | 0 (0.0%) |
| 45 to 54 Years | 0 (0.0%) | 0 (0.0%) |
| 55 to 64 Years | 0 (0.0%) | 0 (0.0%) |
| 65 to 74 Years | 0 (0.0%) | 0 (0.0%) |
| 75 Years and over | 0 (0.0%) | 0 (0.0%) |
| Total | 0 (0.0%) | 0 (0.0%) |
Income Above Poverty by Sex and Age in Silver Plume
According to the poverty statistics in Silver Plume, males aged 6 to 11 years and females aged 6 to 11 years are the age groups that are most secure financially, with 100.0% of males and 100.0% of females in these age groups living above the poverty line.
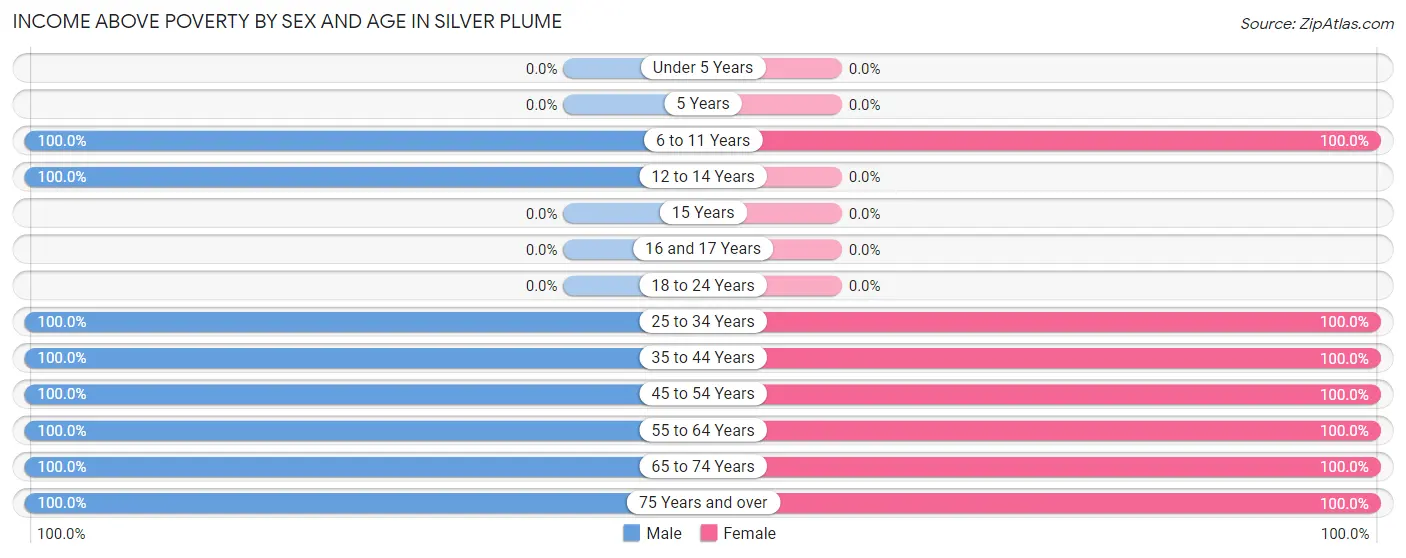
| Age Bracket | Male | Female |
| Under 5 Years | 0 (0.0%) | 0 (0.0%) |
| 5 Years | 0 (0.0%) | 0 (0.0%) |
| 6 to 11 Years | 4 (100.0%) | 5 (100.0%) |
| 12 to 14 Years | 7 (100.0%) | 0 (0.0%) |
| 15 Years | 0 (0.0%) | 0 (0.0%) |
| 16 and 17 Years | 0 (0.0%) | 0 (0.0%) |
| 18 to 24 Years | 0 (0.0%) | 0 (0.0%) |
| 25 to 34 Years | 8 (100.0%) | 20 (100.0%) |
| 35 to 44 Years | 5 (100.0%) | 29 (100.0%) |
| 45 to 54 Years | 29 (100.0%) | 18 (100.0%) |
| 55 to 64 Years | 16 (100.0%) | 5 (100.0%) |
| 65 to 74 Years | 13 (100.0%) | 37 (100.0%) |
| 75 Years and over | 4 (100.0%) | 3 (100.0%) |
| Total | 86 (100.0%) | 117 (100.0%) |
Income Below Poverty Among Married-Couple Families in Silver Plume
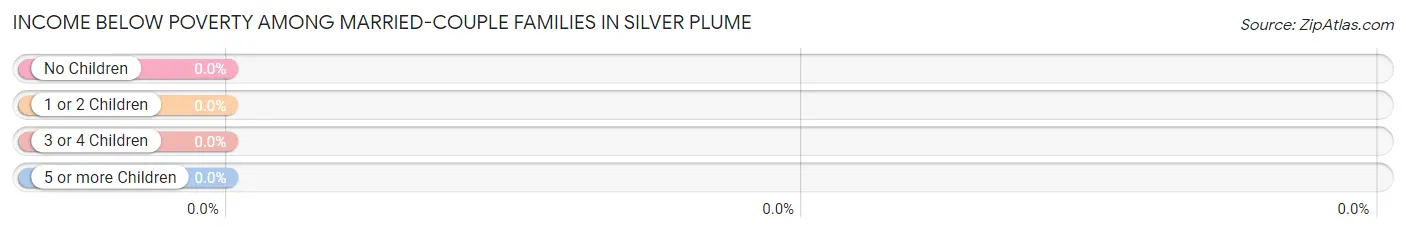
| Children | Above Poverty | Below Poverty |
| No Children | 29 (100.0%) | 0 (0.0%) |
| 1 or 2 Children | 5 (100.0%) | 0 (0.0%) |
| 3 or 4 Children | 2 (100.0%) | 0 (0.0%) |
| 5 or more Children | 0 (0.0%) | 0 (0.0%) |
| Total | 36 (100.0%) | 0 (0.0%) |
Income Below Poverty Among Single-Parent Households in Silver Plume
| Children | Single Father | Single Mother |
| No Children | 0 (0.0%) | 0 (0.0%) |
| 1 or 2 Children | 0 (0.0%) | 0 (0.0%) |
| 3 or 4 Children | 0 (0.0%) | 0 (0.0%) |
| 5 or more Children | 0 (0.0%) | 0 (0.0%) |
| Total | 0 (0.0%) | 0 (0.0%) |
Income Below Poverty Among Married-Couple vs Single-Parent Households in Silver Plume
| Children | Married-Couple Families | Single-Parent Households |
| No Children | 0 (0.0%) | 0 (0.0%) |
| 1 or 2 Children | 0 (0.0%) | 0 (0.0%) |
| 3 or 4 Children | 0 (0.0%) | 0 (0.0%) |
| 5 or more Children | 0 (0.0%) | 0 (0.0%) |
| Total | 0 (0.0%) | 0 (0.0%) |
Race in Silver Plume
The most populous races in Silver Plume are White / Caucasian (183 | 90.1%), Two or more Races (14 | 6.9%), and Asian (6 | 3.0%).
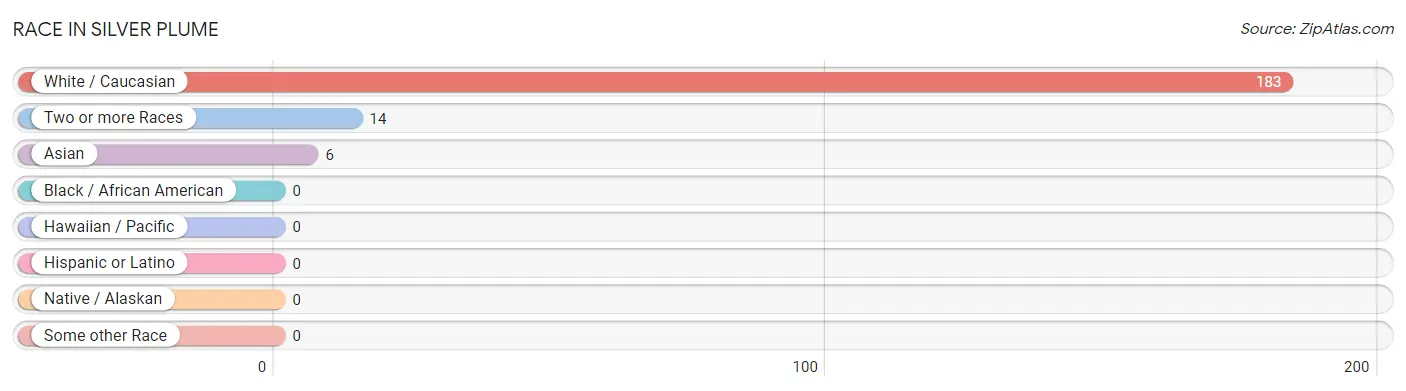
| Race | # Population | % Population |
| Asian | 6 | 3.0% |
| Black / African American | 0 | 0.0% |
| Hawaiian / Pacific | 0 | 0.0% |
| Hispanic or Latino | 0 | 0.0% |
| Native / Alaskan | 0 | 0.0% |
| White / Caucasian | 183 | 90.1% |
| Two or more Races | 14 | 6.9% |
| Some other Race | 0 | 0.0% |
| Total | 203 | 100.0% |
Ancestry in Silver Plume
The most populous ancestries reported in Silver Plume are Irish (100 | 49.3%), English (50 | 24.6%), Russian (16 | 7.9%), French (14 | 6.9%), and German (14 | 6.9%), together accounting for 95.6% of all Silver Plume residents.
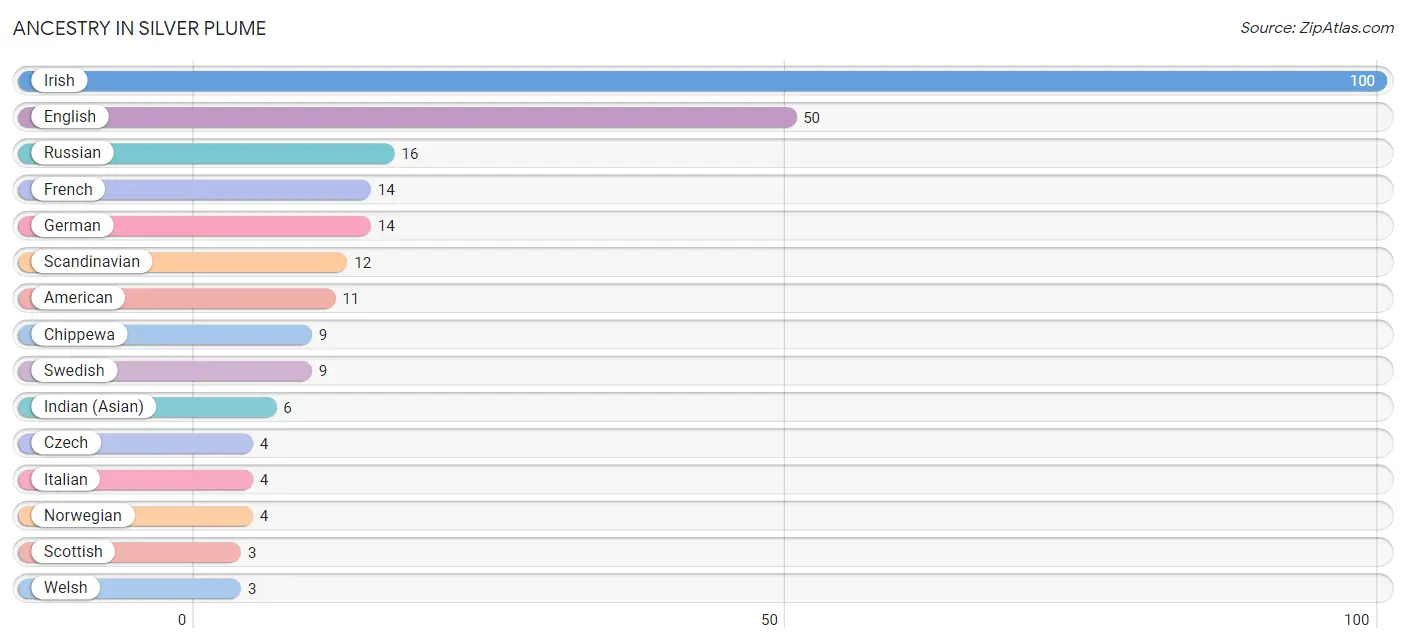
| Ancestry | # Population | % Population |
| American | 11 | 5.4% |
| Chippewa | 9 | 4.4% |
| Czech | 4 | 2.0% |
| English | 50 | 24.6% |
| French | 14 | 6.9% |
| German | 14 | 6.9% |
| Indian (Asian) | 6 | 3.0% |
| Irish | 100 | 49.3% |
| Italian | 4 | 2.0% |
| Norwegian | 4 | 2.0% |
| Russian | 16 | 7.9% |
| Scandinavian | 12 | 5.9% |
| Scotch-Irish | 2 | 1.0% |
| Scottish | 3 | 1.5% |
| Swedish | 9 | 4.4% |
| Welsh | 3 | 1.5% | View All 16 Rows |
Immigrants in Silver Plume

| Immigration Origin | # Population | % Population | View All 0 Rows |
Sex and Age in Silver Plume
Sex and Age in Silver Plume
The most populous age groups in Silver Plume are 45 to 49 Years (29 | 33.7%) for men and 70 to 74 Years (27 | 23.1%) for women.
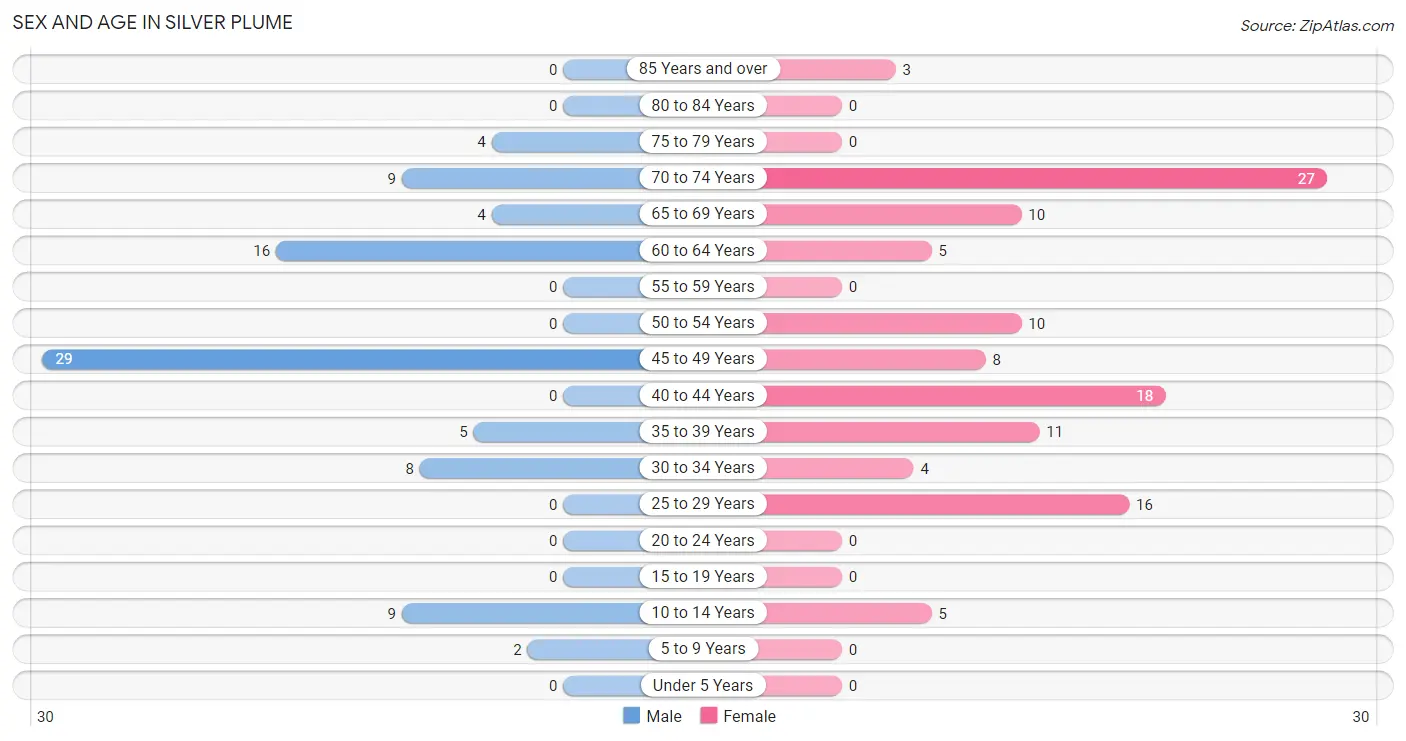
| Age Bracket | Male | Female |
| Under 5 Years | 0 (0.0%) | 0 (0.0%) |
| 5 to 9 Years | 2 (2.3%) | 0 (0.0%) |
| 10 to 14 Years | 9 (10.5%) | 5 (4.3%) |
| 15 to 19 Years | 0 (0.0%) | 0 (0.0%) |
| 20 to 24 Years | 0 (0.0%) | 0 (0.0%) |
| 25 to 29 Years | 0 (0.0%) | 16 (13.7%) |
| 30 to 34 Years | 8 (9.3%) | 4 (3.4%) |
| 35 to 39 Years | 5 (5.8%) | 11 (9.4%) |
| 40 to 44 Years | 0 (0.0%) | 18 (15.4%) |
| 45 to 49 Years | 29 (33.7%) | 8 (6.8%) |
| 50 to 54 Years | 0 (0.0%) | 10 (8.6%) |
| 55 to 59 Years | 0 (0.0%) | 0 (0.0%) |
| 60 to 64 Years | 16 (18.6%) | 5 (4.3%) |
| 65 to 69 Years | 4 (4.6%) | 10 (8.6%) |
| 70 to 74 Years | 9 (10.5%) | 27 (23.1%) |
| 75 to 79 Years | 4 (4.6%) | 0 (0.0%) |
| 80 to 84 Years | 0 (0.0%) | 0 (0.0%) |
| 85 Years and over | 0 (0.0%) | 3 (2.6%) |
| Total | 86 (100.0%) | 117 (100.0%) |
Families and Households in Silver Plume
Median Family Size in Silver Plume
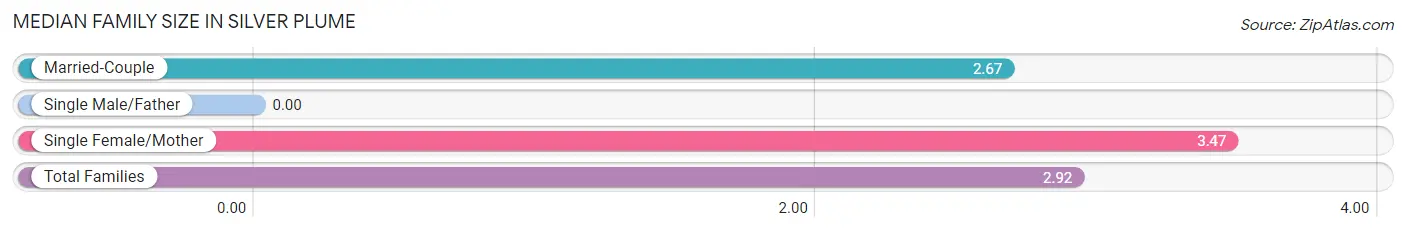
| Family Type | # Families | Family Size |
| Married-Couple | 36 (67.9%) | 2.67 |
| Single Male/Father | 0 (0.0%) | - |
| Single Female/Mother | 17 (32.1%) | 3.47 |
| Total Families | 53 (100.0%) | 2.92 |
Median Household Size in Silver Plume
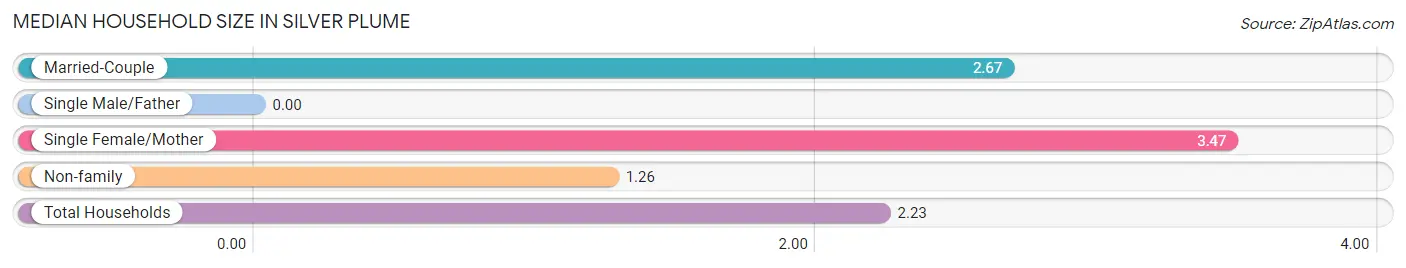
| Household Type | # Households | Household Size |
| Married-Couple | 36 (39.6%) | 2.67 |
| Single Male/Father | 0 (0.0%) | - |
| Single Female/Mother | 17 (18.7%) | 3.47 |
| Non-family | 38 (41.8%) | 1.26 |
| Total Households | 91 (100.0%) | 2.23 |
Household Size by Marriage Status in Silver Plume
Out of a total of 91 households in Silver Plume, 53 (58.2%) are family households, while 38 (41.8%) are nonfamily households. The most numerous type of family households are 2-person households, comprising 29, and the most common type of nonfamily households are 1-person households, comprising 29.
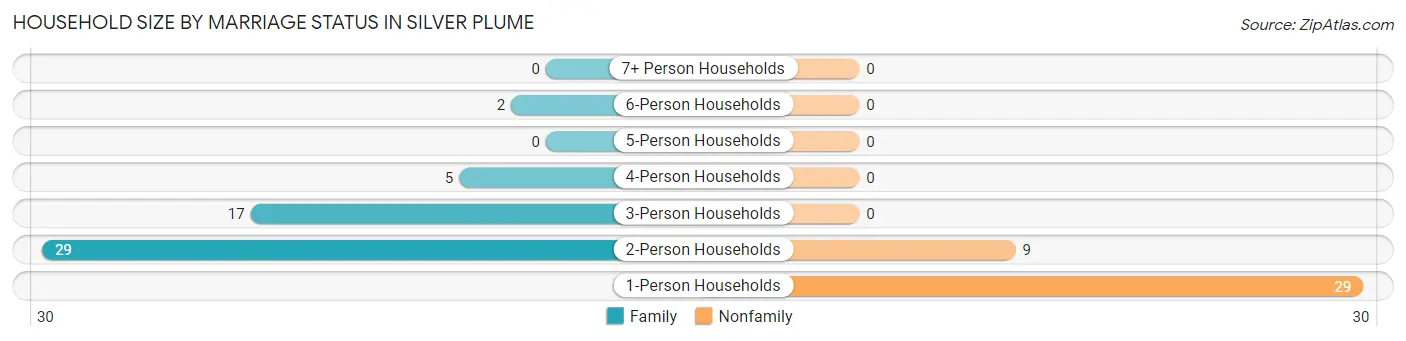
| Household Size | Family Households | Nonfamily Households |
| 1-Person Households | - | 29 (31.9%) |
| 2-Person Households | 29 (31.9%) | 9 (9.9%) |
| 3-Person Households | 17 (18.7%) | 0 (0.0%) |
| 4-Person Households | 5 (5.5%) | 0 (0.0%) |
| 5-Person Households | 0 (0.0%) | 0 (0.0%) |
| 6-Person Households | 2 (2.2%) | 0 (0.0%) |
| 7+ Person Households | 0 (0.0%) | 0 (0.0%) |
| Total | 53 (58.2%) | 38 (41.8%) |
Female Fertility in Silver Plume
Fertility by Age in Silver Plume
| Age Bracket | Women with Births | Births / 1,000 Women |
| 15 to 19 years | 0 (0.0%) | 0.0 |
| 20 to 34 years | 0 (0.0%) | 0.0 |
| 35 to 50 years | 0 (0.0%) | 0.0 |
| Total | 0 (0.0%) | 0.0 |
Fertility by Age by Marriage Status in Silver Plume
| Age Bracket | Married | Unmarried |
| 15 to 19 years | 0 (0.0%) | 0 (0.0%) |
| 20 to 34 years | 0 (0.0%) | 0 (0.0%) |
| 35 to 50 years | 0 (0.0%) | 0 (0.0%) |
| Total | 0 (0.0%) | 0 (0.0%) |
Fertility by Education in Silver Plume
| Educational Attainment | Women with Births | Births / 1,000 Women |
| Less than High School | 0 (0.0%) | 0.0 |
| High School Diploma | 0 (0.0%) | 0.0 |
| College or Associate's Degree | 0 (0.0%) | 0.0 |
| Bachelor's Degree | 0 (0.0%) | 0.0 |
| Graduate Degree | 0 (0.0%) | 0.0 |
| Total | 0 (0.0%) | 0.0 |
Fertility by Education by Marriage Status in Silver Plume
| Educational Attainment | Married | Unmarried |
| Less than High School | 0 (0.0%) | 0 (0.0%) |
| High School Diploma | 0 (0.0%) | 0 (0.0%) |
| College or Associate's Degree | 0 (0.0%) | 0 (0.0%) |
| Bachelor's Degree | 0 (0.0%) | 0 (0.0%) |
| Graduate Degree | 0 (0.0%) | 0 (0.0%) |
| Total | 0 (0.0%) | 0 (0.0%) |
Employment Characteristics in Silver Plume
Employment by Class of Employer in Silver Plume
Among the 91 employed individuals in Silver Plume, private company employees (37 | 40.7%), local government employees (21 | 23.1%), and not-for-profit organizations (17 | 18.7%) make up the most common classes of employment.
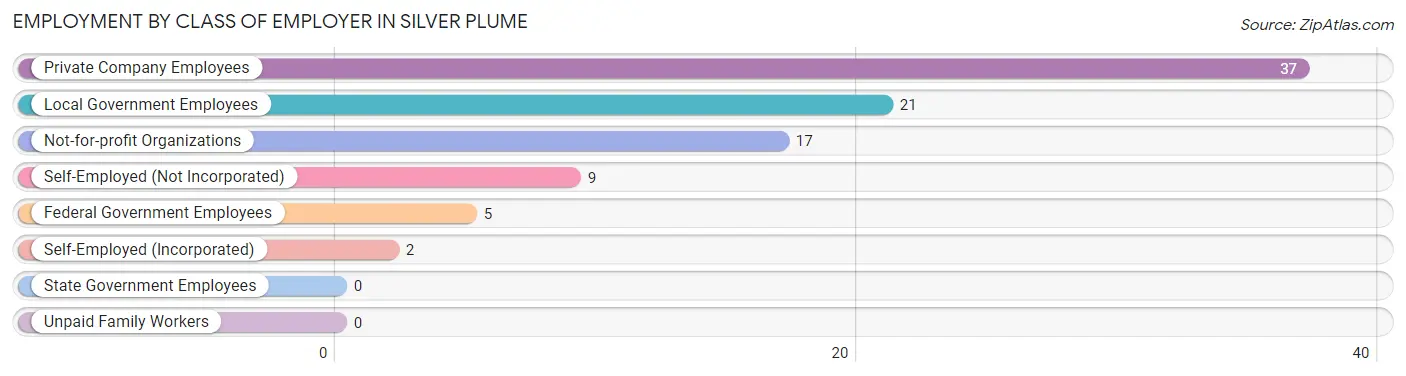
| Employer Class | # Employees | % Employees |
| Private Company Employees | 37 | 40.7% |
| Self-Employed (Incorporated) | 2 | 2.2% |
| Self-Employed (Not Incorporated) | 9 | 9.9% |
| Not-for-profit Organizations | 17 | 18.7% |
| Local Government Employees | 21 | 23.1% |
| State Government Employees | 0 | 0.0% |
| Federal Government Employees | 5 | 5.5% |
| Unpaid Family Workers | 0 | 0.0% |
| Total | 91 | 100.0% |
Employment Status by Age in Silver Plume
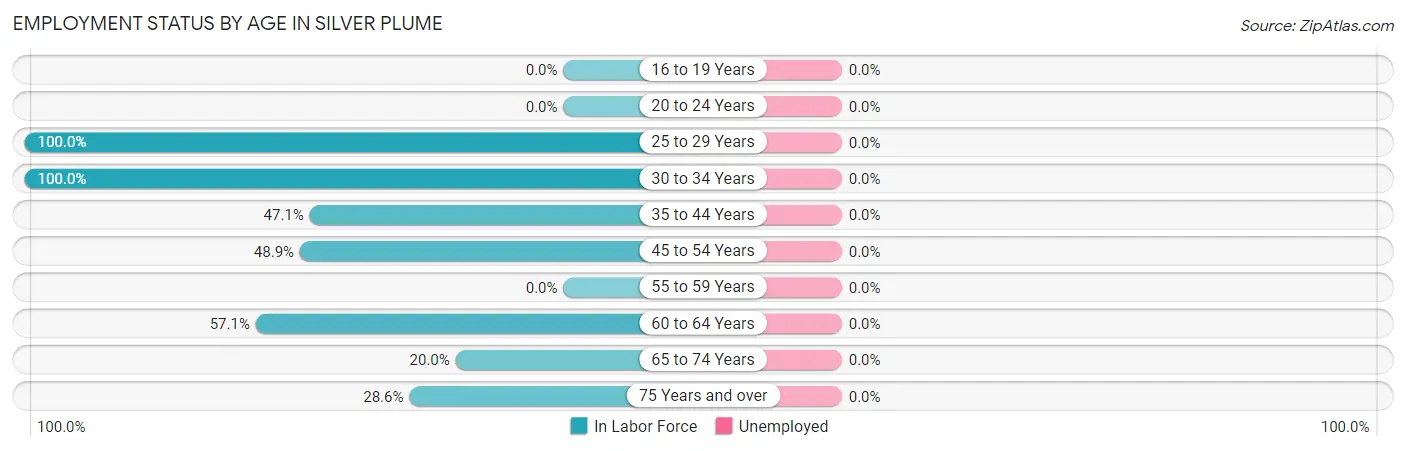
| Age Bracket | In Labor Force | Unemployed |
| 16 to 19 Years | 0 (0.0%) | 0 (0.0%) |
| 20 to 24 Years | 0 (0.0%) | 0 (0.0%) |
| 25 to 29 Years | 16 (100.0%) | 0 (0.0%) |
| 30 to 34 Years | 12 (100.0%) | 0 (0.0%) |
| 35 to 44 Years | 16 (47.1%) | 0 (0.0%) |
| 45 to 54 Years | 23 (48.9%) | 0 (0.0%) |
| 55 to 59 Years | 0 (0.0%) | 0 (0.0%) |
| 60 to 64 Years | 12 (57.1%) | 0 (0.0%) |
| 65 to 74 Years | 10 (20.0%) | 0 (0.0%) |
| 75 Years and over | 2 (28.6%) | 0 (0.0%) |
| Total | 91 (48.7%) | 0 (0.0%) |
Employment Status by Educational Attainment in Silver Plume
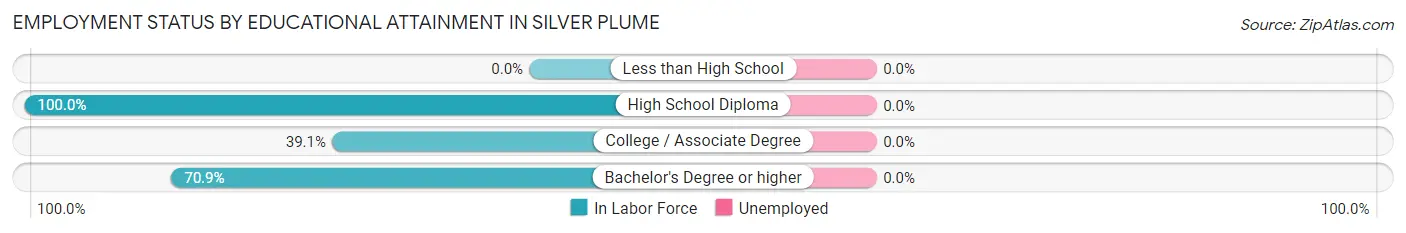
| Educational Attainment | In Labor Force | Unemployed |
| Less than High School | 0 (0.0%) | 0 (0.0%) |
| High School Diploma | 5 (100.0%) | 0 (0.0%) |
| College / Associate Degree | 18 (39.1%) | 0 (0.0%) |
| Bachelor's Degree or higher | 56 (70.9%) | 0 (0.0%) |
| Total | 79 (60.8%) | 0 (0.0%) |
Employment Occupations by Sex in Silver Plume
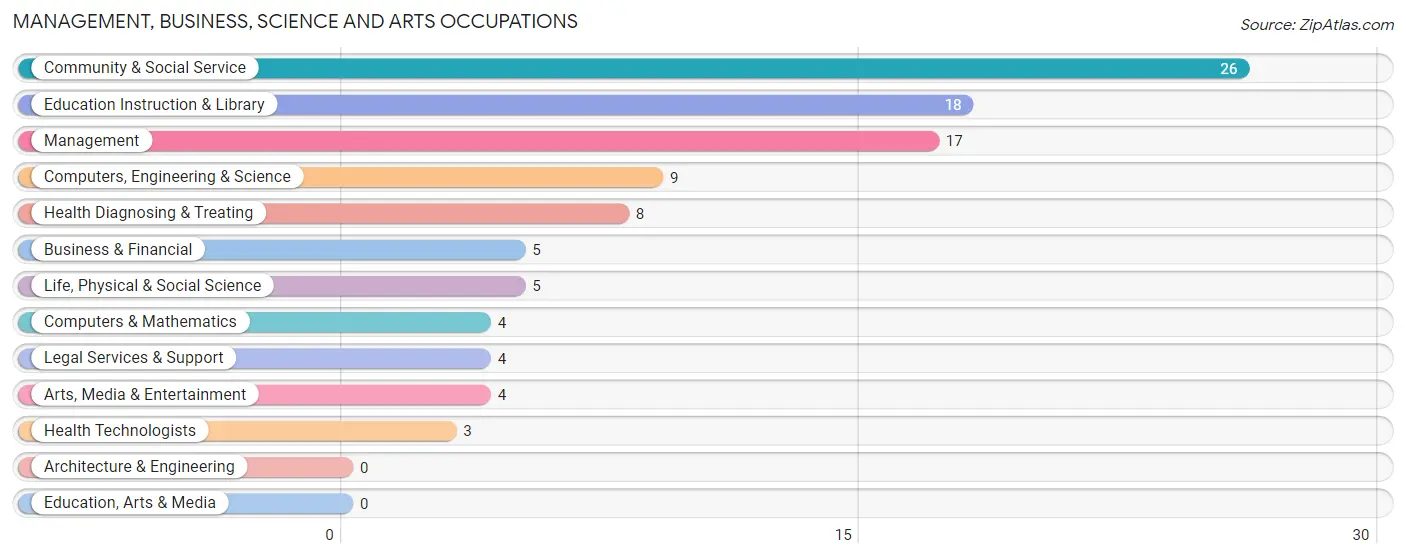
Management, Business, Science and Arts Occupations
The most common Management, Business, Science and Arts occupations in Silver Plume are Community & Social Service (26 | 28.6%), Education Instruction & Library (18 | 19.8%), Management (17 | 18.7%), Computers, Engineering & Science (9 | 9.9%), and Health Diagnosing & Treating (8 | 8.8%).
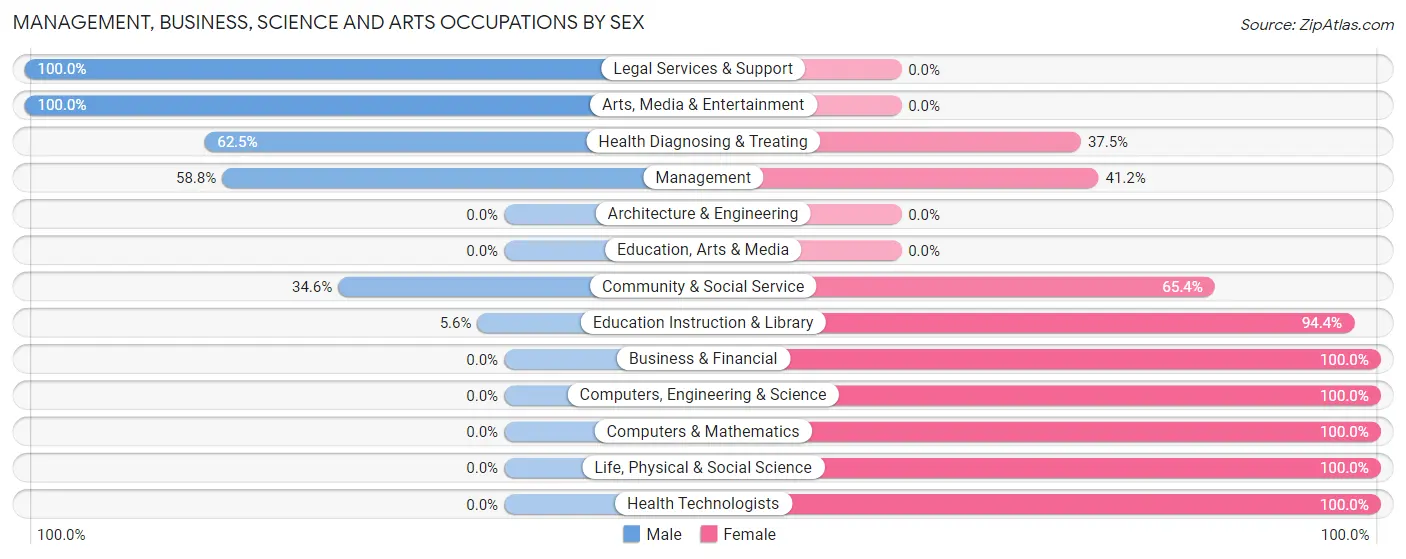
Management, Business, Science and Arts Occupations by Sex
Within the Management, Business, Science and Arts occupations in Silver Plume, the most male-oriented occupations are Legal Services & Support (100.0%), Arts, Media & Entertainment (100.0%), and Health Diagnosing & Treating (62.5%), while the most female-oriented occupations are Business & Financial (100.0%), Computers, Engineering & Science (100.0%), and Computers & Mathematics (100.0%).
| Occupation | Male | Female |
| Management | 10 (58.8%) | 7 (41.2%) |
| Business & Financial | 0 (0.0%) | 5 (100.0%) |
| Computers, Engineering & Science | 0 (0.0%) | 9 (100.0%) |
| Computers & Mathematics | 0 (0.0%) | 4 (100.0%) |
| Architecture & Engineering | 0 (0.0%) | 0 (0.0%) |
| Life, Physical & Social Science | 0 (0.0%) | 5 (100.0%) |
| Community & Social Service | 9 (34.6%) | 17 (65.4%) |
| Education, Arts & Media | 0 (0.0%) | 0 (0.0%) |
| Legal Services & Support | 4 (100.0%) | 0 (0.0%) |
| Education Instruction & Library | 1 (5.6%) | 17 (94.4%) |
| Arts, Media & Entertainment | 4 (100.0%) | 0 (0.0%) |
| Health Diagnosing & Treating | 5 (62.5%) | 3 (37.5%) |
| Health Technologists | 0 (0.0%) | 3 (100.0%) |
| Total (Category) | 24 (36.9%) | 41 (63.1%) |
| Total (Overall) | 36 (39.6%) | 55 (60.4%) |
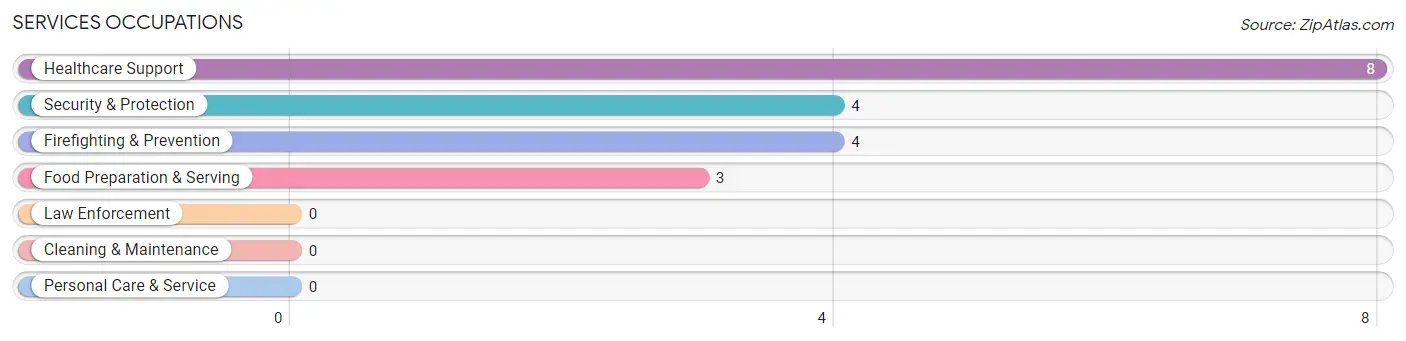
Services Occupations
The most common Services occupations in Silver Plume are Healthcare Support (8 | 8.8%), Security & Protection (4 | 4.4%), Firefighting & Prevention (4 | 4.4%), and Food Preparation & Serving (3 | 3.3%).
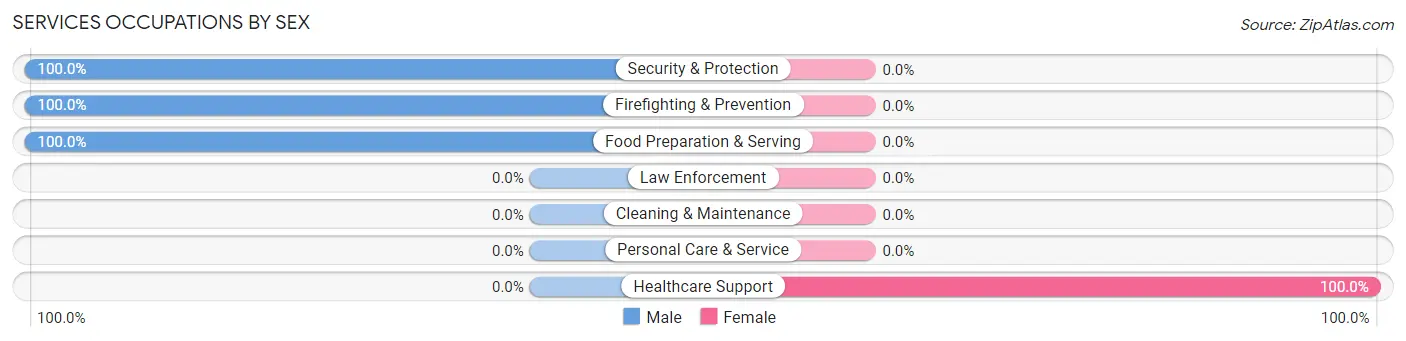
Services Occupations by Sex
| Occupation | Male | Female |
| Healthcare Support | 0 (0.0%) | 8 (100.0%) |
| Security & Protection | 4 (100.0%) | 0 (0.0%) |
| Firefighting & Prevention | 4 (100.0%) | 0 (0.0%) |
| Law Enforcement | 0 (0.0%) | 0 (0.0%) |
| Food Preparation & Serving | 3 (100.0%) | 0 (0.0%) |
| Cleaning & Maintenance | 0 (0.0%) | 0 (0.0%) |
| Personal Care & Service | 0 (0.0%) | 0 (0.0%) |
| Total (Category) | 7 (46.7%) | 8 (53.3%) |
| Total (Overall) | 36 (39.6%) | 55 (60.4%) |
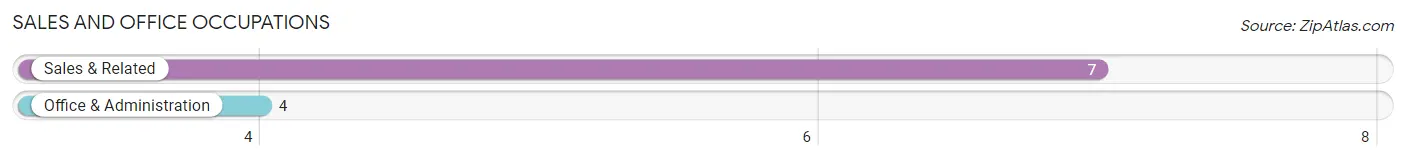
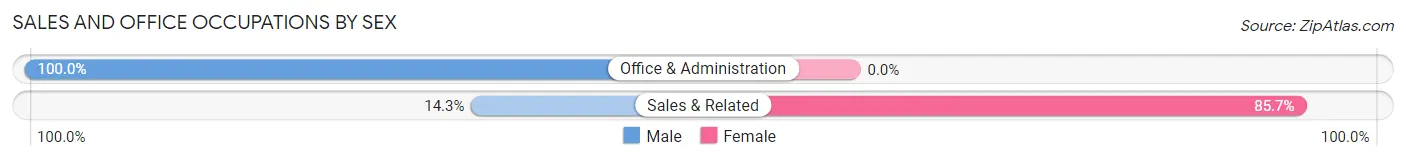
Sales and Office Occupations
The most common Sales and Office occupations in Silver Plume are Sales & Related (7 | 7.7%), and Office & Administration (4 | 4.4%).
Sales and Office Occupations by Sex
| Occupation | Male | Female |
| Sales & Related | 1 (14.3%) | 6 (85.7%) |
| Office & Administration | 4 (100.0%) | 0 (0.0%) |
| Total (Category) | 5 (45.5%) | 6 (54.5%) |
| Total (Overall) | 36 (39.6%) | 55 (60.4%) |
Natural Resources, Construction and Maintenance Occupations
Natural Resources, Construction and Maintenance Occupations by Sex
| Occupation | Male | Female |
| Farming, Fishing & Forestry | 0 (0.0%) | 0 (0.0%) |
| Construction & Extraction | 0 (0.0%) | 0 (0.0%) |
| Installation, Maintenance & Repair | 0 (0.0%) | 0 (0.0%) |
| Total (Category) | 0 (0.0%) | 0 (0.0%) |
| Total (Overall) | 36 (39.6%) | 55 (60.4%) |
Production, Transportation and Moving Occupations
Production, Transportation and Moving Occupations by Sex
| Occupation | Male | Female |
| Production | 0 (0.0%) | 0 (0.0%) |
| Transportation | 0 (0.0%) | 0 (0.0%) |
| Material Moving | 0 (0.0%) | 0 (0.0%) |
| Total (Category) | 0 (0.0%) | 0 (0.0%) |
| Total (Overall) | 36 (39.6%) | 55 (60.4%) |
Employment Industries by Sex in Silver Plume
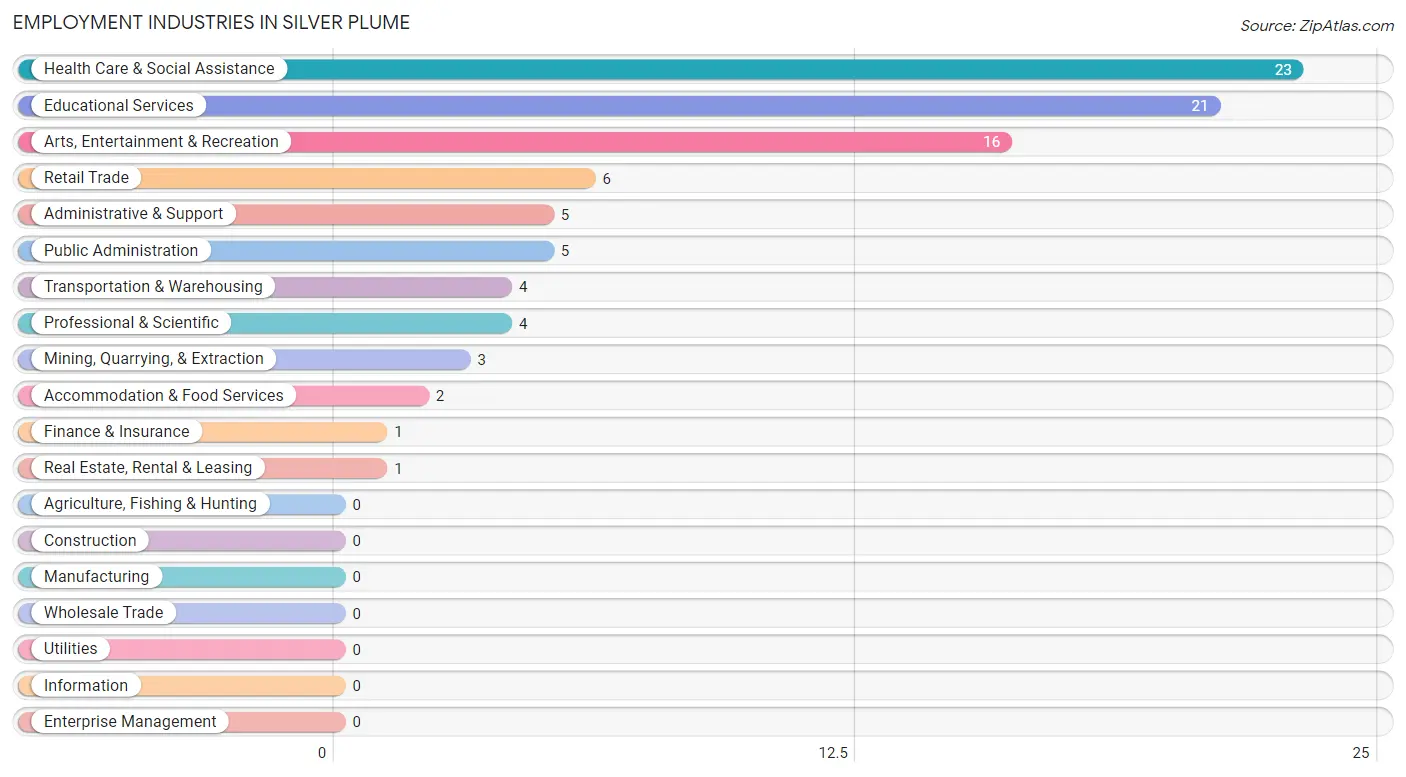
Employment Industries in Silver Plume
The major employment industries in Silver Plume include Health Care & Social Assistance (23 | 25.3%), Educational Services (21 | 23.1%), Arts, Entertainment & Recreation (16 | 17.6%), Retail Trade (6 | 6.6%), and Administrative & Support (5 | 5.5%).
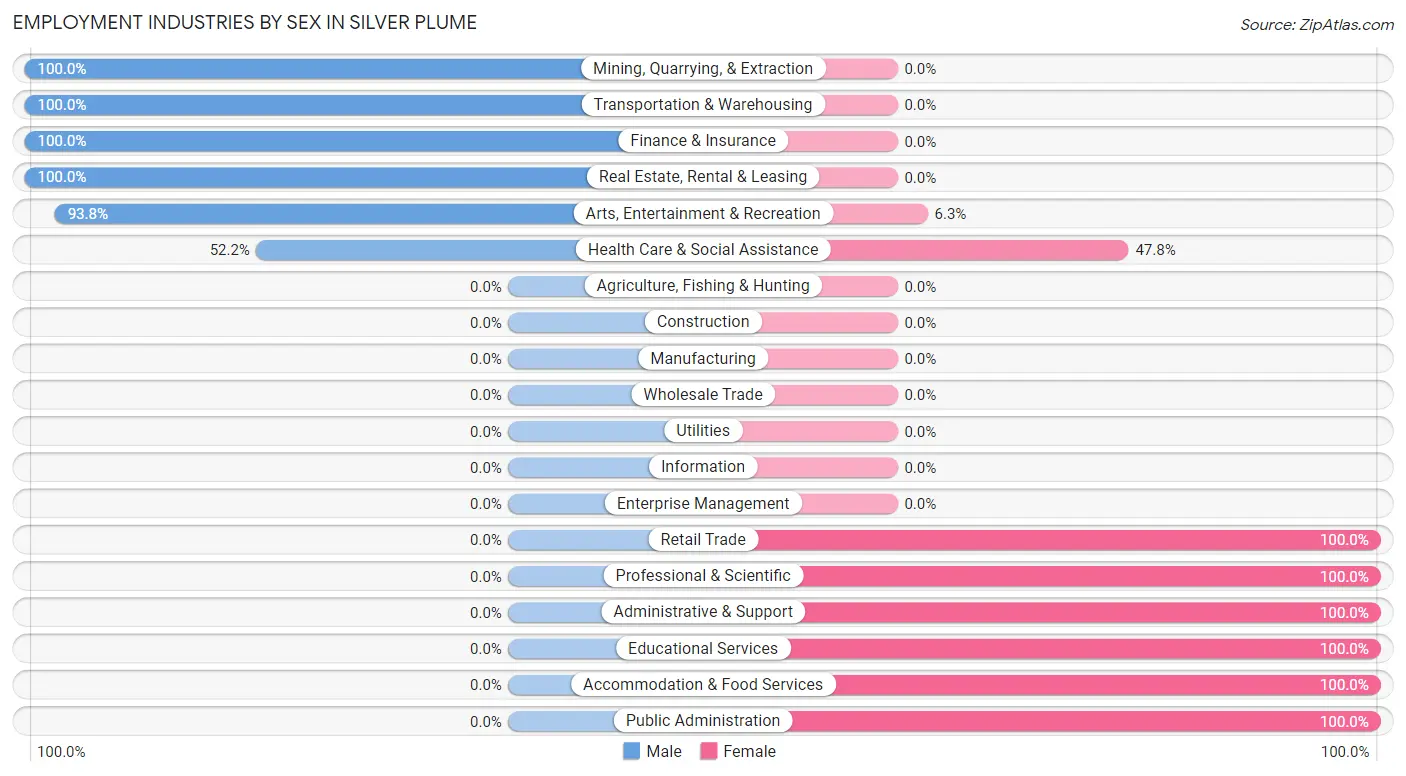
Employment Industries by Sex in Silver Plume
The Silver Plume industries that see more men than women are Mining, Quarrying, & Extraction (100.0%), Transportation & Warehousing (100.0%), and Finance & Insurance (100.0%), whereas the industries that tend to have a higher number of women are Retail Trade (100.0%), Professional & Scientific (100.0%), and Administrative & Support (100.0%).
| Industry | Male | Female |
| Agriculture, Fishing & Hunting | 0 (0.0%) | 0 (0.0%) |
| Mining, Quarrying, & Extraction | 3 (100.0%) | 0 (0.0%) |
| Construction | 0 (0.0%) | 0 (0.0%) |
| Manufacturing | 0 (0.0%) | 0 (0.0%) |
| Wholesale Trade | 0 (0.0%) | 0 (0.0%) |
| Retail Trade | 0 (0.0%) | 6 (100.0%) |
| Transportation & Warehousing | 4 (100.0%) | 0 (0.0%) |
| Utilities | 0 (0.0%) | 0 (0.0%) |
| Information | 0 (0.0%) | 0 (0.0%) |
| Finance & Insurance | 1 (100.0%) | 0 (0.0%) |
| Real Estate, Rental & Leasing | 1 (100.0%) | 0 (0.0%) |
| Professional & Scientific | 0 (0.0%) | 4 (100.0%) |
| Enterprise Management | 0 (0.0%) | 0 (0.0%) |
| Administrative & Support | 0 (0.0%) | 5 (100.0%) |
| Educational Services | 0 (0.0%) | 21 (100.0%) |
| Health Care & Social Assistance | 12 (52.2%) | 11 (47.8%) |
| Arts, Entertainment & Recreation | 15 (93.8%) | 1 (6.2%) |
| Accommodation & Food Services | 0 (0.0%) | 2 (100.0%) |
| Public Administration | 0 (0.0%) | 5 (100.0%) |
| Total | 36 (39.6%) | 55 (60.4%) |
Education in Silver Plume
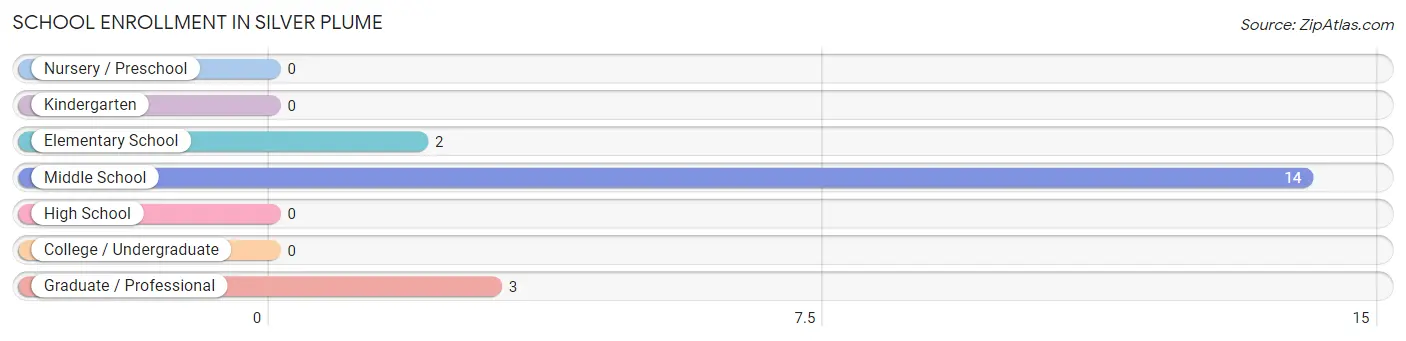
School Enrollment in Silver Plume
The most common levels of schooling among the 19 students in Silver Plume are middle school (14 | 73.7%), graduate / professional (3 | 15.8%), and elementary school (2 | 10.5%).
| School Level | # Students | % Students |
| Nursery / Preschool | 0 | 0.0% |
| Kindergarten | 0 | 0.0% |
| Elementary School | 2 | 10.5% |
| Middle School | 14 | 73.7% |
| High School | 0 | 0.0% |
| College / Undergraduate | 0 | 0.0% |
| Graduate / Professional | 3 | 15.8% |
| Total | 19 | 100.0% |
School Enrollment by Age by Funding Source in Silver Plume
Out of a total of 19 students who are enrolled in schools in Silver Plume, 3 (15.8%) attend a private institution, while the remaining 16 (84.2%) are enrolled in public schools. The age group of 35 years and over has the highest likelihood of being enrolled in private schools, with 3 (100.0% in the age bracket) enrolled. Conversely, the age group of 5 to 9 year old has the lowest likelihood of being enrolled in a private school, with 2 (100.0% in the age bracket) attending a public institution.
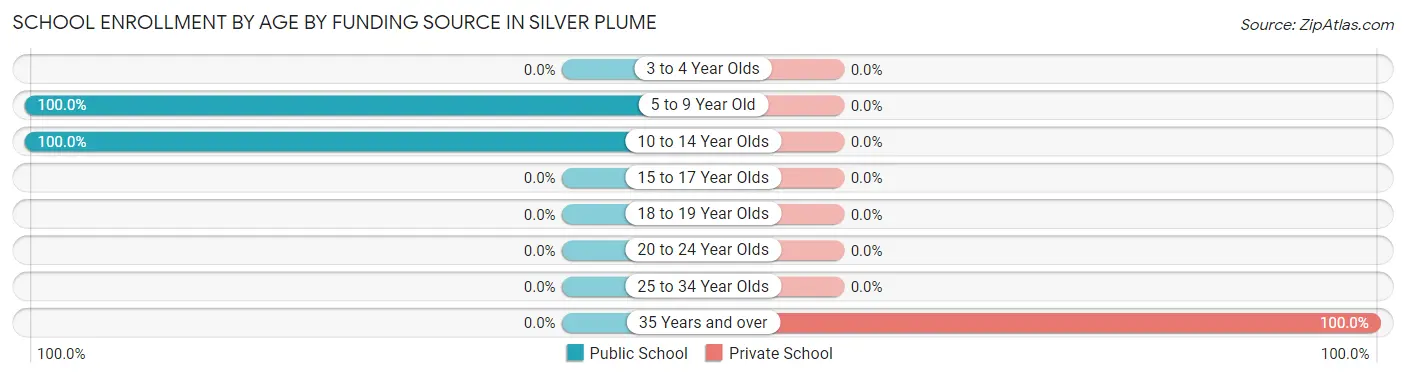
| Age Bracket | Public School | Private School |
| 3 to 4 Year Olds | 0 (0.0%) | 0 (0.0%) |
| 5 to 9 Year Old | 2 (100.0%) | 0 (0.0%) |
| 10 to 14 Year Olds | 14 (100.0%) | 0 (0.0%) |
| 15 to 17 Year Olds | 0 (0.0%) | 0 (0.0%) |
| 18 to 19 Year Olds | 0 (0.0%) | 0 (0.0%) |
| 20 to 24 Year Olds | 0 (0.0%) | 0 (0.0%) |
| 25 to 34 Year Olds | 0 (0.0%) | 0 (0.0%) |
| 35 Years and over | 0 (0.0%) | 3 (100.0%) |
| Total | 16 (84.2%) | 3 (15.8%) |
Educational Attainment by Field of Study in Silver Plume
Education (23 | 16.9%), visual & performing arts (22 | 16.2%), engineering (17 | 12.5%), social sciences (16 | 11.8%), and psychology (12 | 8.8%) are the most common fields of study among 136 individuals in Silver Plume who have obtained a bachelor's degree or higher.
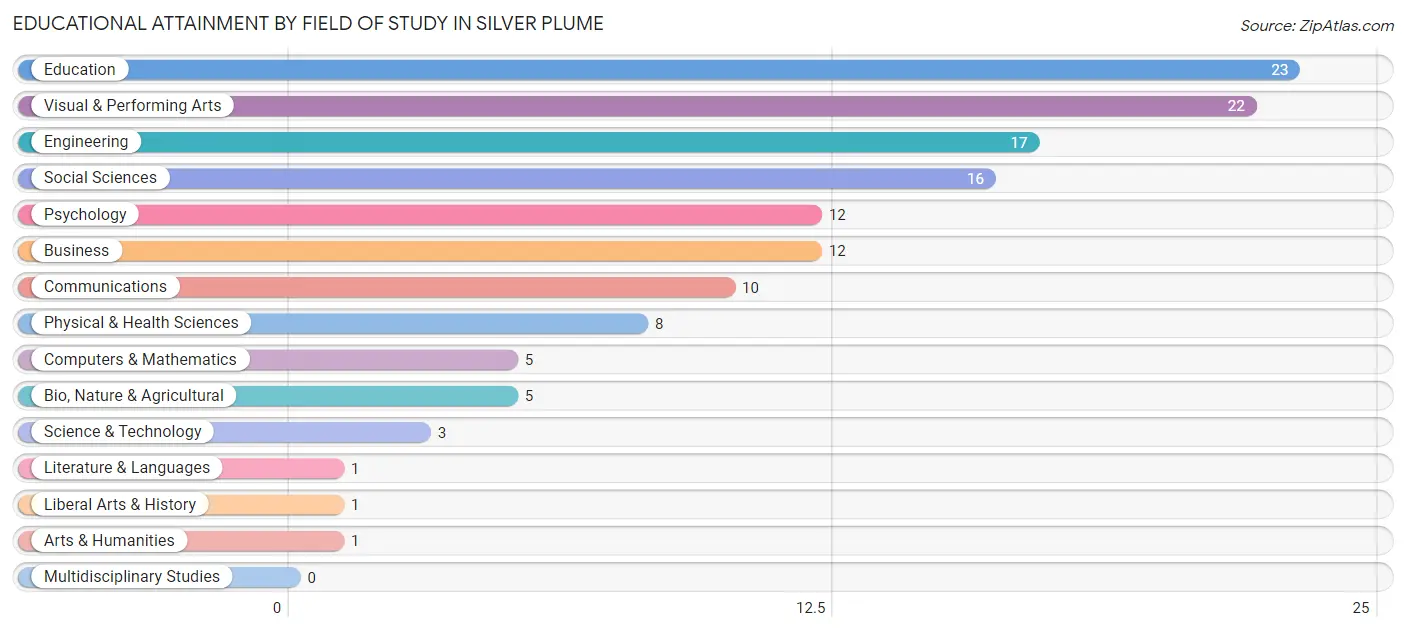
| Field of Study | # Graduates | % Graduates |
| Computers & Mathematics | 5 | 3.7% |
| Bio, Nature & Agricultural | 5 | 3.7% |
| Physical & Health Sciences | 8 | 5.9% |
| Psychology | 12 | 8.8% |
| Social Sciences | 16 | 11.8% |
| Engineering | 17 | 12.5% |
| Multidisciplinary Studies | 0 | 0.0% |
| Science & Technology | 3 | 2.2% |
| Business | 12 | 8.8% |
| Education | 23 | 16.9% |
| Literature & Languages | 1 | 0.7% |
| Liberal Arts & History | 1 | 0.7% |
| Visual & Performing Arts | 22 | 16.2% |
| Communications | 10 | 7.3% |
| Arts & Humanities | 1 | 0.7% |
| Total | 136 | 100.0% |
Transportation & Commute in Silver Plume
Vehicle Availability by Sex in Silver Plume
The most prevalent vehicle ownership categories in Silver Plume are males with 3 vehicles (16, accounting for 44.4%) and females with 3 vehicles (14, making up 29.1%).
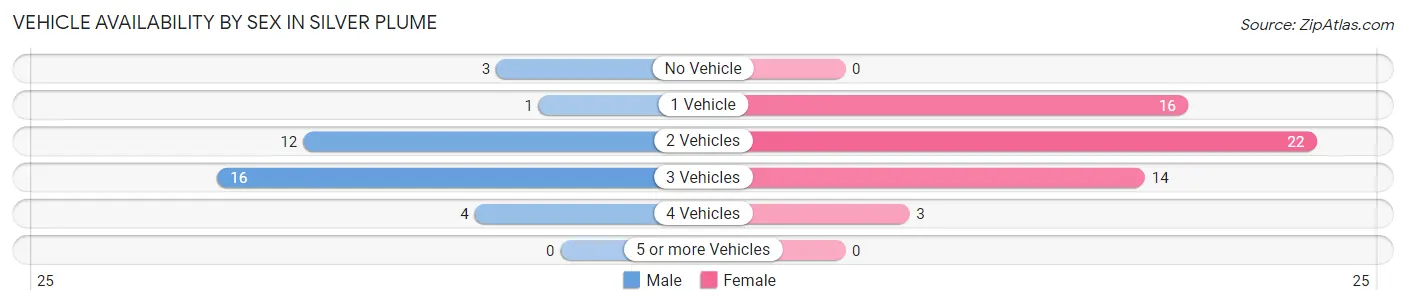
| Vehicles Available | Male | Female |
| No Vehicle | 3 (8.3%) | 0 (0.0%) |
| 1 Vehicle | 1 (2.8%) | 16 (29.1%) |
| 2 Vehicles | 12 (33.3%) | 22 (40.0%) |
| 3 Vehicles | 16 (44.4%) | 14 (25.5%) |
| 4 Vehicles | 4 (11.1%) | 3 (5.4%) |
| 5 or more Vehicles | 0 (0.0%) | 0 (0.0%) |
| Total | 36 (100.0%) | 55 (100.0%) |
Commute Time in Silver Plume
The most frequently occuring commute durations in Silver Plume are 5 to 9 minutes (22 commuters, 28.9%), 10 to 14 minutes (16 commuters, 21.0%), and 30 to 34 minutes (11 commuters, 14.5%).
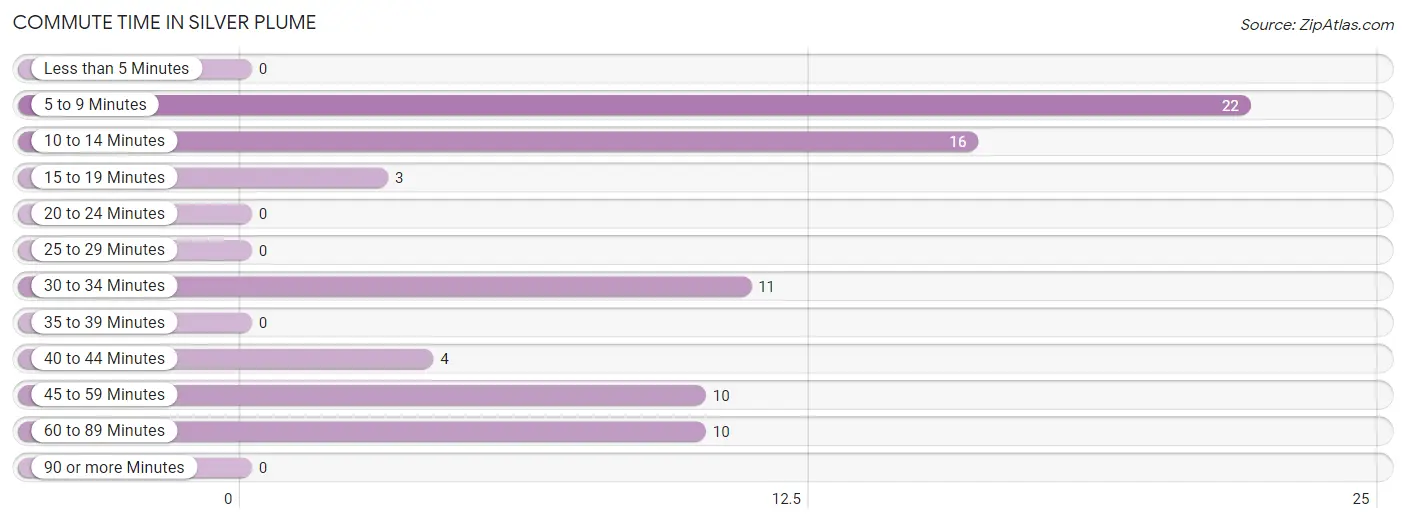
| Commute Time | # Commuters | % Commuters |
| Less than 5 Minutes | 0 | 0.0% |
| 5 to 9 Minutes | 22 | 28.9% |
| 10 to 14 Minutes | 16 | 21.0% |
| 15 to 19 Minutes | 3 | 4.0% |
| 20 to 24 Minutes | 0 | 0.0% |
| 25 to 29 Minutes | 0 | 0.0% |
| 30 to 34 Minutes | 11 | 14.5% |
| 35 to 39 Minutes | 0 | 0.0% |
| 40 to 44 Minutes | 4 | 5.3% |
| 45 to 59 Minutes | 10 | 13.2% |
| 60 to 89 Minutes | 10 | 13.2% |
| 90 or more Minutes | 0 | 0.0% |
Commute Time by Sex in Silver Plume
The most common commute times in Silver Plume are 10 to 14 minutes (10 commuters, 31.2%) for males and 5 to 9 minutes (22 commuters, 50.0%) for females.
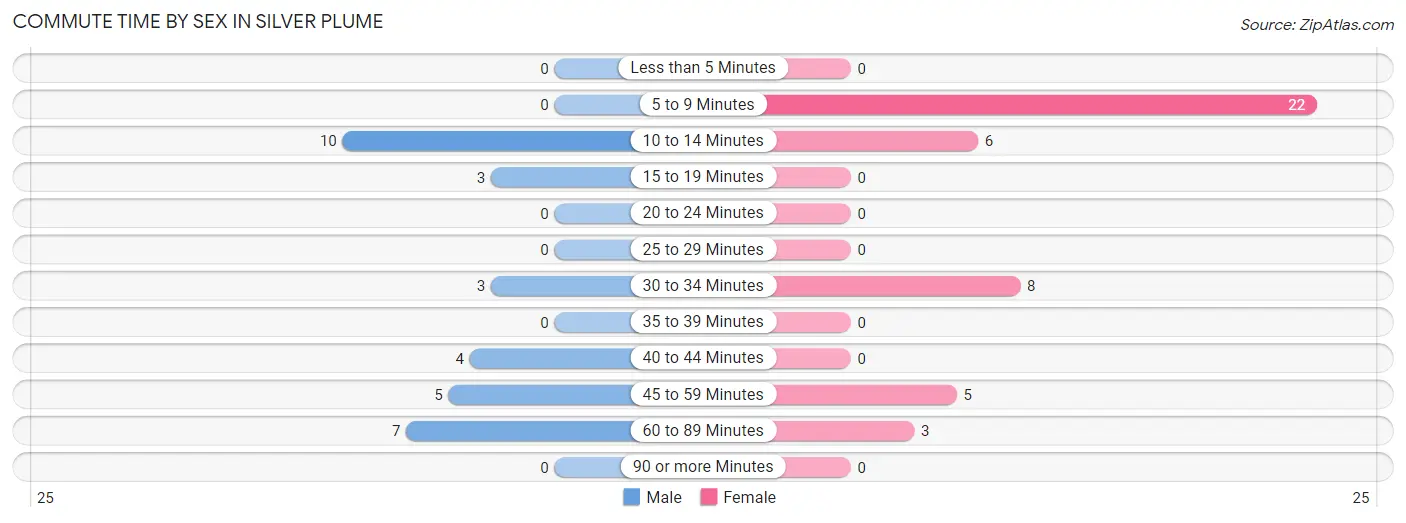
| Commute Time | Male | Female |
| Less than 5 Minutes | 0 (0.0%) | 0 (0.0%) |
| 5 to 9 Minutes | 0 (0.0%) | 22 (50.0%) |
| 10 to 14 Minutes | 10 (31.2%) | 6 (13.6%) |
| 15 to 19 Minutes | 3 (9.4%) | 0 (0.0%) |
| 20 to 24 Minutes | 0 (0.0%) | 0 (0.0%) |
| 25 to 29 Minutes | 0 (0.0%) | 0 (0.0%) |
| 30 to 34 Minutes | 3 (9.4%) | 8 (18.2%) |
| 35 to 39 Minutes | 0 (0.0%) | 0 (0.0%) |
| 40 to 44 Minutes | 4 (12.5%) | 0 (0.0%) |
| 45 to 59 Minutes | 5 (15.6%) | 5 (11.4%) |
| 60 to 89 Minutes | 7 (21.9%) | 3 (6.8%) |
| 90 or more Minutes | 0 (0.0%) | 0 (0.0%) |
Time of Departure to Work by Sex in Silver Plume
The most frequent times of departure to work in Silver Plume are 8:00 AM to 8:29 AM (8, 25.0%) for males and 7:00 AM to 7:29 AM (19, 43.2%) for females.
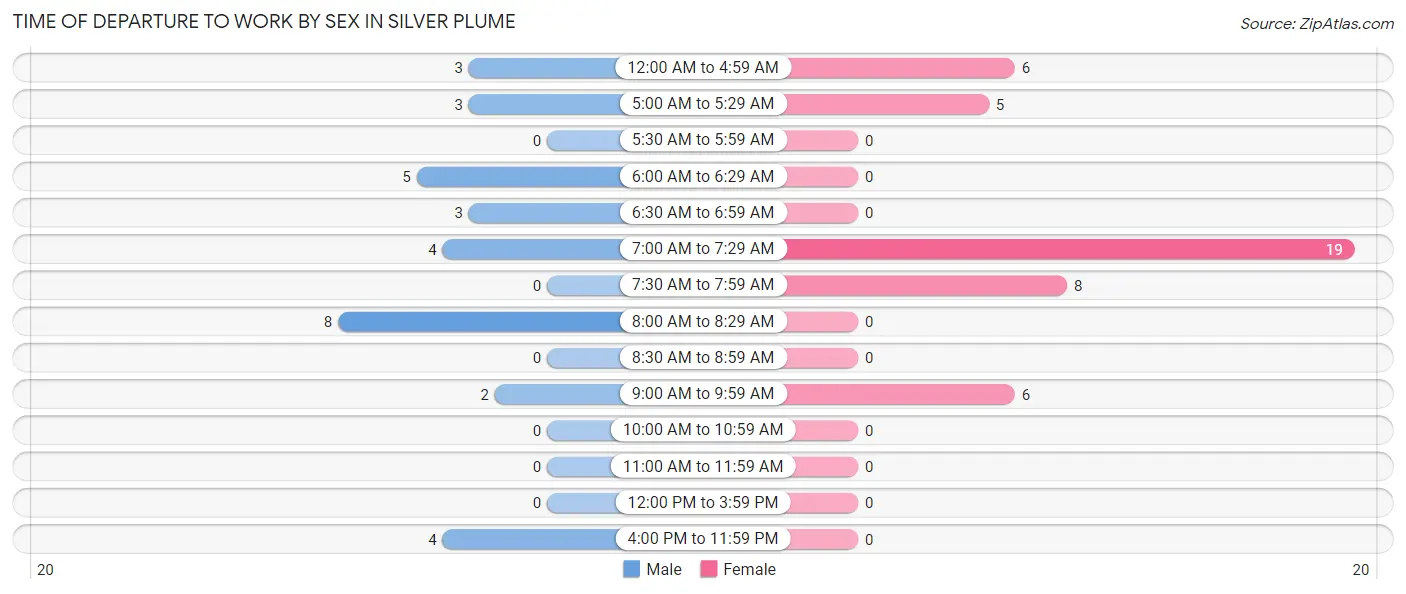
| Time of Departure | Male | Female |
| 12:00 AM to 4:59 AM | 3 (9.4%) | 6 (13.6%) |
| 5:00 AM to 5:29 AM | 3 (9.4%) | 5 (11.4%) |
| 5:30 AM to 5:59 AM | 0 (0.0%) | 0 (0.0%) |
| 6:00 AM to 6:29 AM | 5 (15.6%) | 0 (0.0%) |
| 6:30 AM to 6:59 AM | 3 (9.4%) | 0 (0.0%) |
| 7:00 AM to 7:29 AM | 4 (12.5%) | 19 (43.2%) |
| 7:30 AM to 7:59 AM | 0 (0.0%) | 8 (18.2%) |
| 8:00 AM to 8:29 AM | 8 (25.0%) | 0 (0.0%) |
| 8:30 AM to 8:59 AM | 0 (0.0%) | 0 (0.0%) |
| 9:00 AM to 9:59 AM | 2 (6.2%) | 6 (13.6%) |
| 10:00 AM to 10:59 AM | 0 (0.0%) | 0 (0.0%) |
| 11:00 AM to 11:59 AM | 0 (0.0%) | 0 (0.0%) |
| 12:00 PM to 3:59 PM | 0 (0.0%) | 0 (0.0%) |
| 4:00 PM to 11:59 PM | 4 (12.5%) | 0 (0.0%) |
| Total | 32 (100.0%) | 44 (100.0%) |
Housing Occupancy in Silver Plume
Occupancy by Ownership in Silver Plume
Of the total 91 dwellings in Silver Plume, owner-occupied units account for 60 (65.9%), while renter-occupied units make up 31 (34.1%).
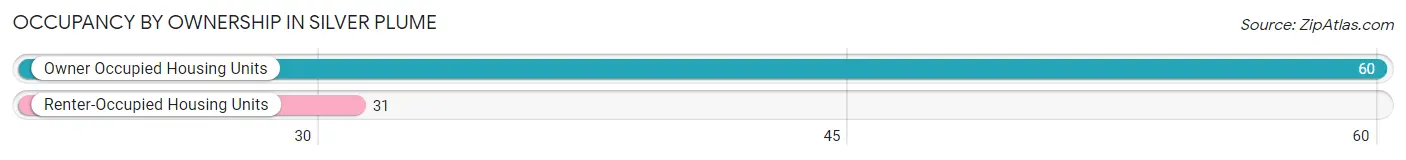
| Occupancy | # Housing Units | % Housing Units |
| Owner Occupied Housing Units | 60 | 65.9% |
| Renter-Occupied Housing Units | 31 | 34.1% |
| Total Occupied Housing Units | 91 | 100.0% |
Occupancy by Household Size in Silver Plume
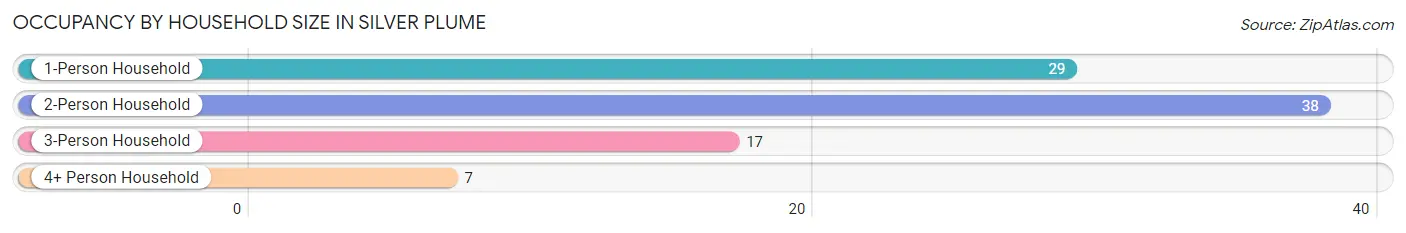
| Household Size | # Housing Units | % Housing Units |
| 1-Person Household | 29 | 31.9% |
| 2-Person Household | 38 | 41.8% |
| 3-Person Household | 17 | 18.7% |
| 4+ Person Household | 7 | 7.7% |
| Total Housing Units | 91 | 100.0% |
Occupancy by Ownership by Household Size in Silver Plume
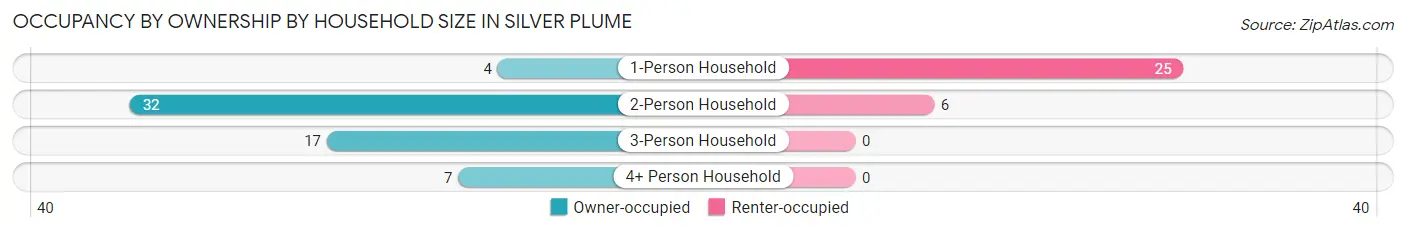
| Household Size | Owner-occupied | Renter-occupied |
| 1-Person Household | 4 (13.8%) | 25 (86.2%) |
| 2-Person Household | 32 (84.2%) | 6 (15.8%) |
| 3-Person Household | 17 (100.0%) | 0 (0.0%) |
| 4+ Person Household | 7 (100.0%) | 0 (0.0%) |
| Total Housing Units | 60 (65.9%) | 31 (34.1%) |
Occupancy by Educational Attainment in Silver Plume
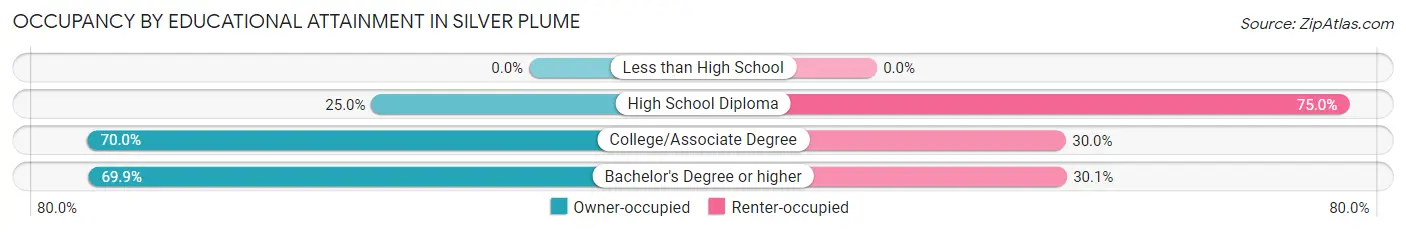
| Household Size | Owner-occupied | Renter-occupied |
| Less than High School | 0 (0.0%) | 0 (0.0%) |
| High School Diploma | 2 (25.0%) | 6 (75.0%) |
| College/Associate Degree | 7 (70.0%) | 3 (30.0%) |
| Bachelor's Degree or higher | 51 (69.9%) | 22 (30.1%) |
Occupancy by Age of Householder in Silver Plume
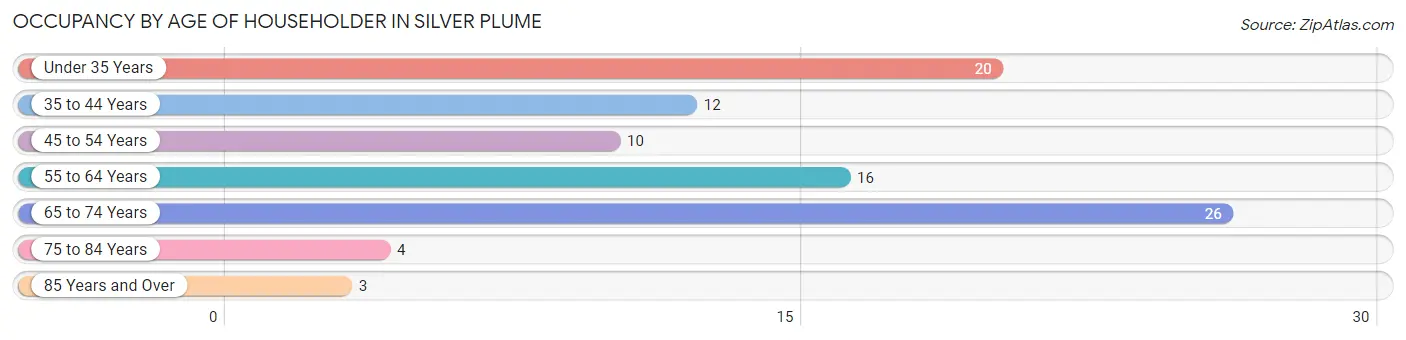
| Age Bracket | # Households | % Households |
| Under 35 Years | 20 | 22.0% |
| 35 to 44 Years | 12 | 13.2% |
| 45 to 54 Years | 10 | 11.0% |
| 55 to 64 Years | 16 | 17.6% |
| 65 to 74 Years | 26 | 28.6% |
| 75 to 84 Years | 4 | 4.4% |
| 85 Years and Over | 3 | 3.3% |
| Total | 91 | 100.0% |
Housing Finances in Silver Plume
Median Income by Occupancy in Silver Plume
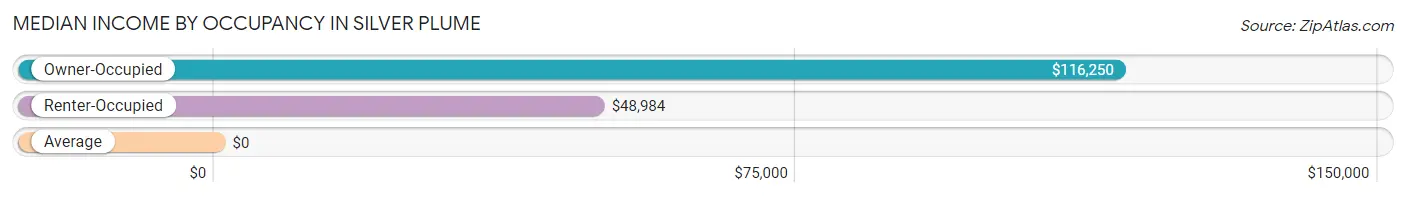
| Occupancy Type | # Households | Median Income |
| Owner-Occupied | 60 (65.9%) | $116,250 |
| Renter-Occupied | 31 (34.1%) | $48,984 |
| Average | 91 (100.0%) | $0 |
Occupancy by Householder Income Bracket in Silver Plume
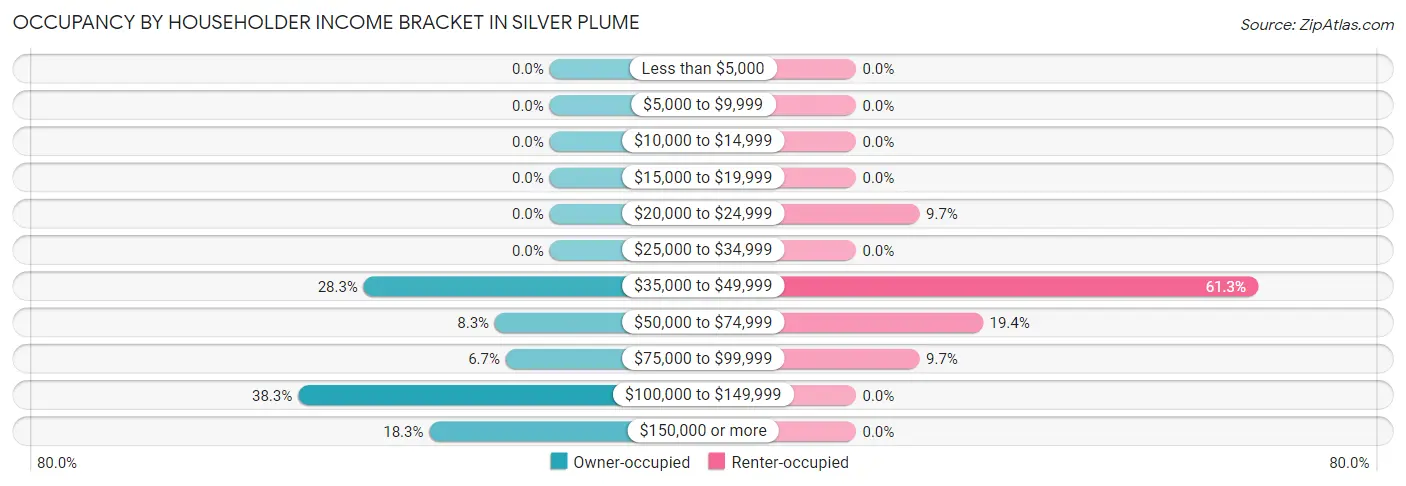
| Income Bracket | Owner-occupied | Renter-occupied |
| Less than $5,000 | 0 (0.0%) | 0 (0.0%) |
| $5,000 to $9,999 | 0 (0.0%) | 0 (0.0%) |
| $10,000 to $14,999 | 0 (0.0%) | 0 (0.0%) |
| $15,000 to $19,999 | 0 (0.0%) | 0 (0.0%) |
| $20,000 to $24,999 | 0 (0.0%) | 3 (9.7%) |
| $25,000 to $34,999 | 0 (0.0%) | 0 (0.0%) |
| $35,000 to $49,999 | 17 (28.3%) | 19 (61.3%) |
| $50,000 to $74,999 | 5 (8.3%) | 6 (19.4%) |
| $75,000 to $99,999 | 4 (6.7%) | 3 (9.7%) |
| $100,000 to $149,999 | 23 (38.3%) | 0 (0.0%) |
| $150,000 or more | 11 (18.3%) | 0 (0.0%) |
| Total | 60 (100.0%) | 31 (100.0%) |
Monthly Housing Cost Tiers in Silver Plume
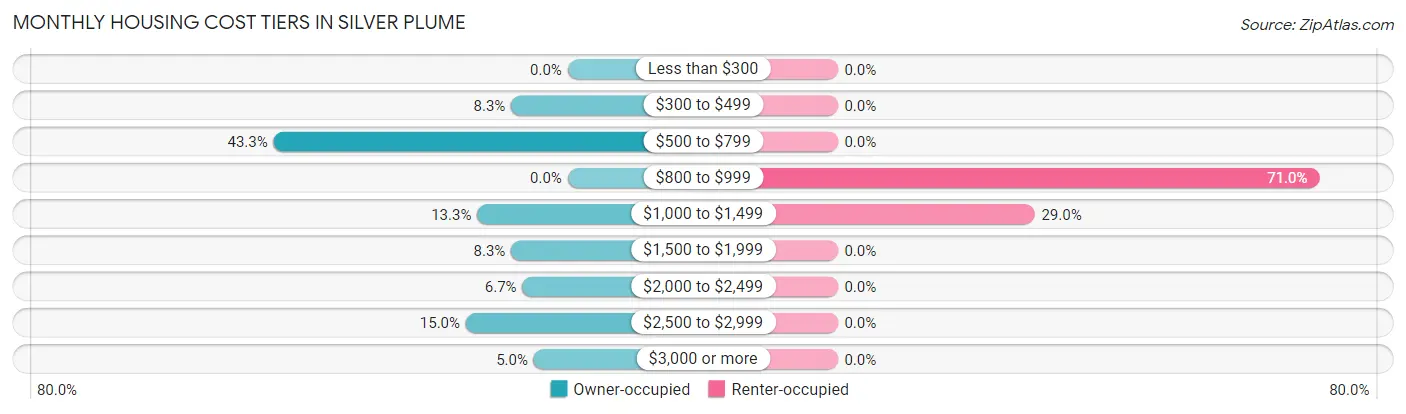
| Monthly Cost | Owner-occupied | Renter-occupied |
| Less than $300 | 0 (0.0%) | 0 (0.0%) |
| $300 to $499 | 5 (8.3%) | 0 (0.0%) |
| $500 to $799 | 26 (43.3%) | 0 (0.0%) |
| $800 to $999 | 0 (0.0%) | 22 (71.0%) |
| $1,000 to $1,499 | 8 (13.3%) | 9 (29.0%) |
| $1,500 to $1,999 | 5 (8.3%) | 0 (0.0%) |
| $2,000 to $2,499 | 4 (6.7%) | 0 (0.0%) |
| $2,500 to $2,999 | 9 (15.0%) | 0 (0.0%) |
| $3,000 or more | 3 (5.0%) | 0 (0.0%) |
| Total | 60 (100.0%) | 31 (100.0%) |
Physical Housing Characteristics in Silver Plume
Housing Structures in Silver Plume
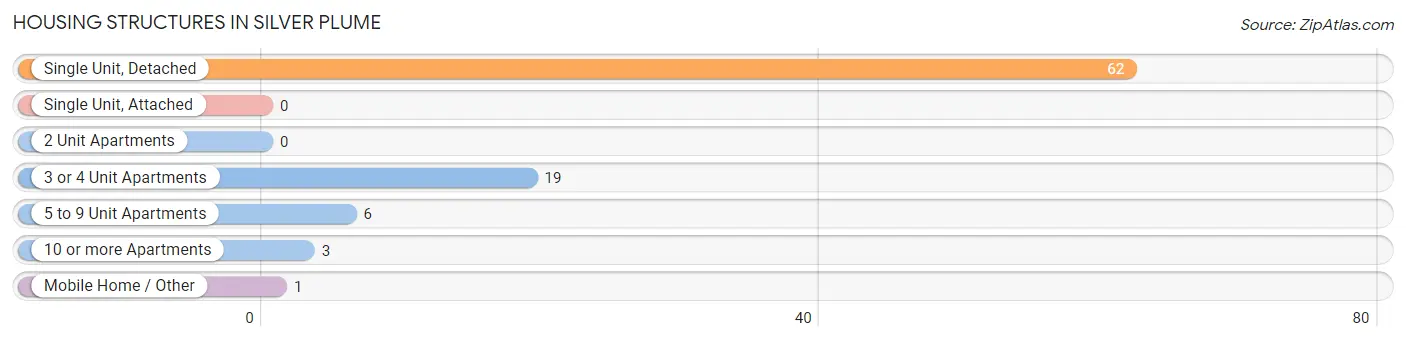
| Structure Type | # Housing Units | % Housing Units |
| Single Unit, Detached | 62 | 68.1% |
| Single Unit, Attached | 0 | 0.0% |
| 2 Unit Apartments | 0 | 0.0% |
| 3 or 4 Unit Apartments | 19 | 20.9% |
| 5 to 9 Unit Apartments | 6 | 6.6% |
| 10 or more Apartments | 3 | 3.3% |
| Mobile Home / Other | 1 | 1.1% |
| Total | 91 | 100.0% |
Housing Structures by Occupancy in Silver Plume
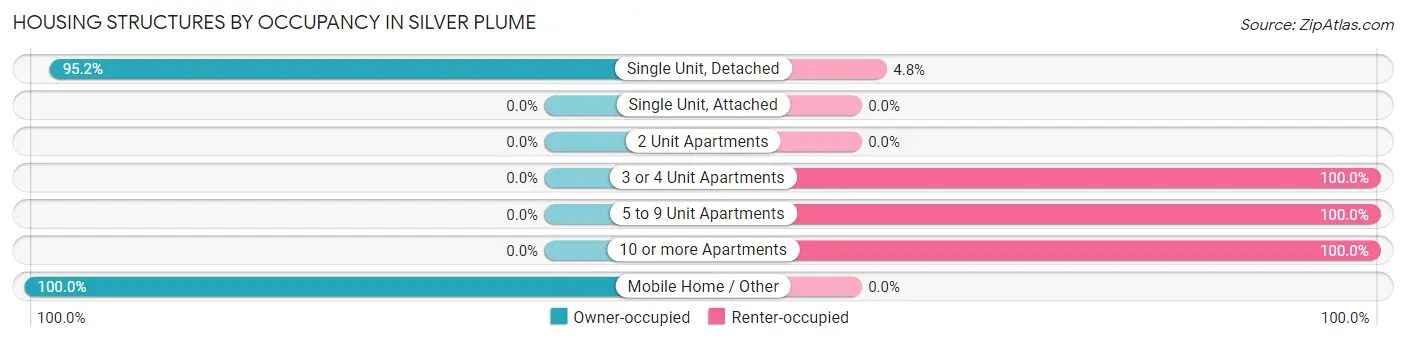
| Structure Type | Owner-occupied | Renter-occupied |
| Single Unit, Detached | 59 (95.2%) | 3 (4.8%) |
| Single Unit, Attached | 0 (0.0%) | 0 (0.0%) |
| 2 Unit Apartments | 0 (0.0%) | 0 (0.0%) |
| 3 or 4 Unit Apartments | 0 (0.0%) | 19 (100.0%) |
| 5 to 9 Unit Apartments | 0 (0.0%) | 6 (100.0%) |
| 10 or more Apartments | 0 (0.0%) | 3 (100.0%) |
| Mobile Home / Other | 1 (100.0%) | 0 (0.0%) |
| Total | 60 (65.9%) | 31 (34.1%) |
Housing Structures by Number of Rooms in Silver Plume
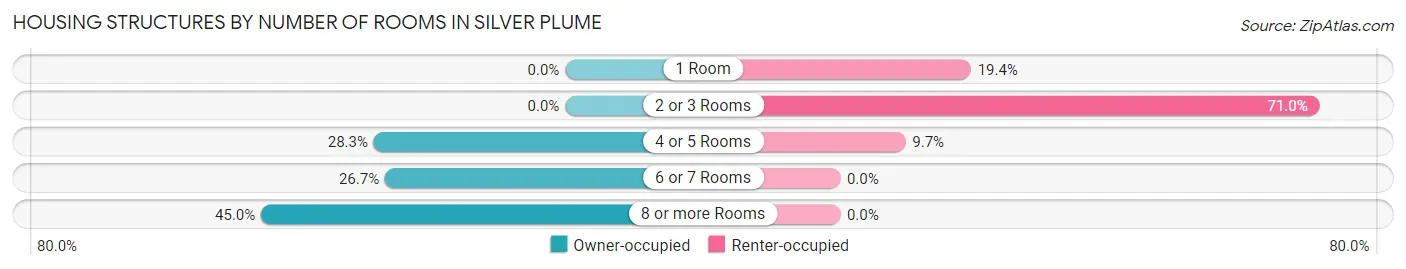
| Number of Rooms | Owner-occupied | Renter-occupied |
| 1 Room | 0 (0.0%) | 6 (19.4%) |
| 2 or 3 Rooms | 0 (0.0%) | 22 (71.0%) |
| 4 or 5 Rooms | 17 (28.3%) | 3 (9.7%) |
| 6 or 7 Rooms | 16 (26.7%) | 0 (0.0%) |
| 8 or more Rooms | 27 (45.0%) | 0 (0.0%) |
| Total | 60 (100.0%) | 31 (100.0%) |
Housing Structure by Heating Type in Silver Plume
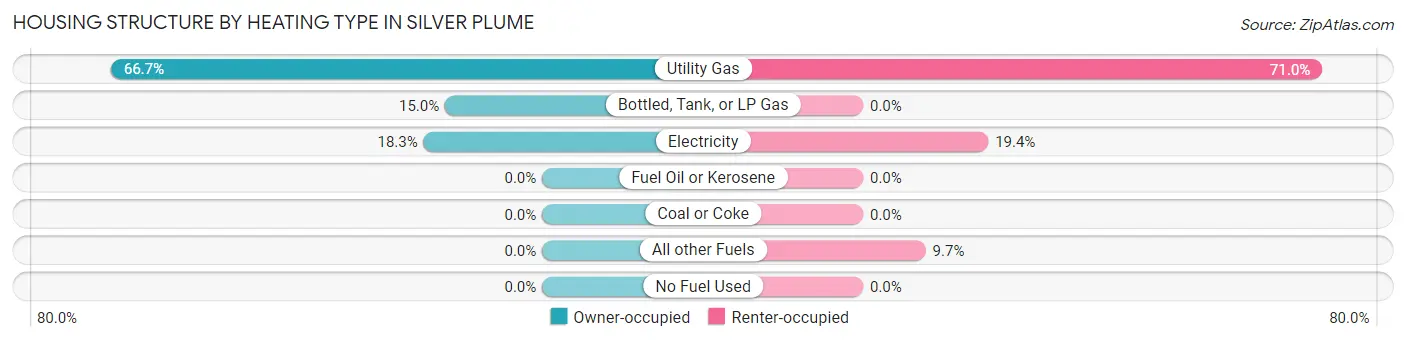
| Heating Type | Owner-occupied | Renter-occupied |
| Utility Gas | 40 (66.7%) | 22 (71.0%) |
| Bottled, Tank, or LP Gas | 9 (15.0%) | 0 (0.0%) |
| Electricity | 11 (18.3%) | 6 (19.4%) |
| Fuel Oil or Kerosene | 0 (0.0%) | 0 (0.0%) |
| Coal or Coke | 0 (0.0%) | 0 (0.0%) |
| All other Fuels | 0 (0.0%) | 3 (9.7%) |
| No Fuel Used | 0 (0.0%) | 0 (0.0%) |
| Total | 60 (100.0%) | 31 (100.0%) |
Household Vehicle Usage in Silver Plume
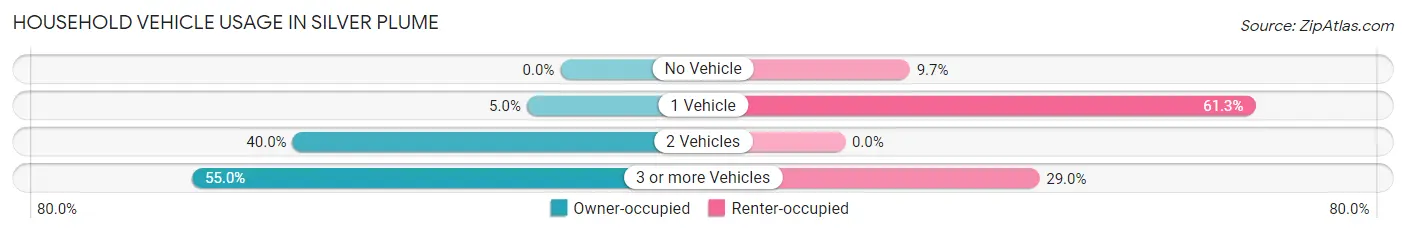
| Vehicles per Household | Owner-occupied | Renter-occupied |
| No Vehicle | 0 (0.0%) | 3 (9.7%) |
| 1 Vehicle | 3 (5.0%) | 19 (61.3%) |
| 2 Vehicles | 24 (40.0%) | 0 (0.0%) |
| 3 or more Vehicles | 33 (55.0%) | 9 (29.0%) |
| Total | 60 (100.0%) | 31 (100.0%) |
Real Estate & Mortgages in Silver Plume
Real Estate and Mortgage Overview in Silver Plume
| Characteristic | Without Mortgage | With Mortgage |
| Housing Units | 35 | 25 |
| Median Property Value | $551,500 | $392,900 |
| Median Household Income | - | - |
| Monthly Housing Costs | $739 | $3 |
| Real Estate Taxes | $2,206 | $0 |
Property Value by Mortgage Status in Silver Plume
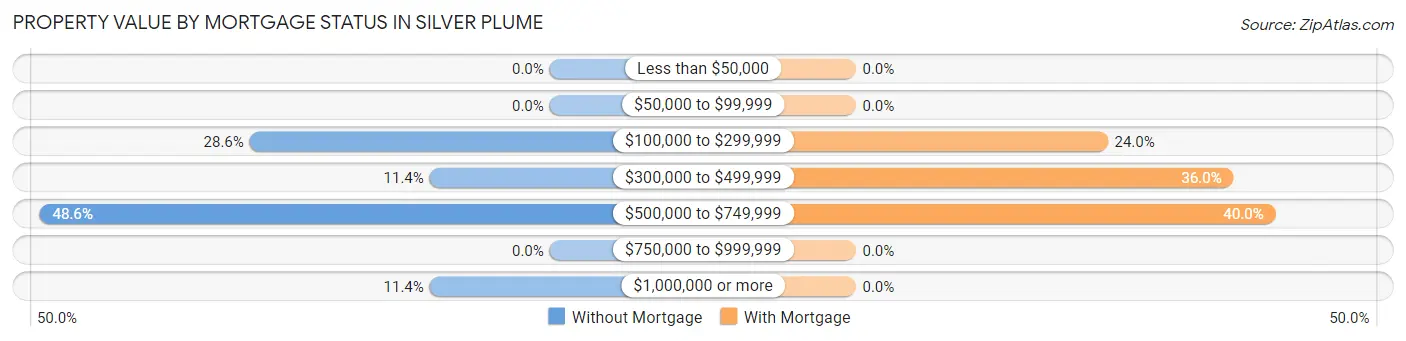
| Property Value | Without Mortgage | With Mortgage |
| Less than $50,000 | 0 (0.0%) | 0 (0.0%) |
| $50,000 to $99,999 | 0 (0.0%) | 0 (0.0%) |
| $100,000 to $299,999 | 10 (28.6%) | 6 (24.0%) |
| $300,000 to $499,999 | 4 (11.4%) | 9 (36.0%) |
| $500,000 to $749,999 | 17 (48.6%) | 10 (40.0%) |
| $750,000 to $999,999 | 0 (0.0%) | 0 (0.0%) |
| $1,000,000 or more | 4 (11.4%) | 0 (0.0%) |
| Total | 35 (100.0%) | 25 (100.0%) |
Household Income by Mortgage Status in Silver Plume
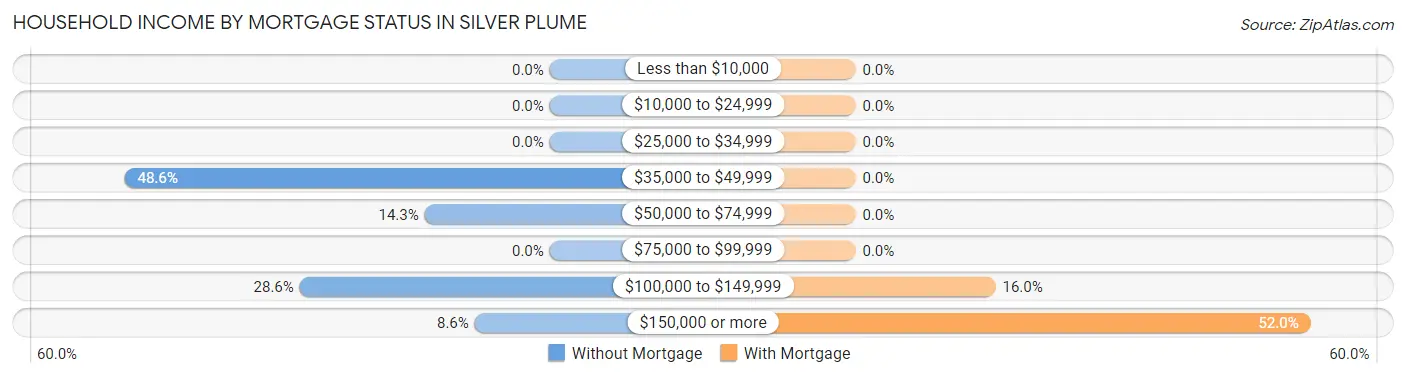
| Household Income | Without Mortgage | With Mortgage |
| Less than $10,000 | 0 (0.0%) | 0 (0.0%) |
| $10,000 to $24,999 | 0 (0.0%) | 0 (0.0%) |
| $25,000 to $34,999 | 0 (0.0%) | 0 (0.0%) |
| $35,000 to $49,999 | 17 (48.6%) | 0 (0.0%) |
| $50,000 to $74,999 | 5 (14.3%) | 0 (0.0%) |
| $75,000 to $99,999 | 0 (0.0%) | 0 (0.0%) |
| $100,000 to $149,999 | 10 (28.6%) | 4 (16.0%) |
| $150,000 or more | 3 (8.6%) | 13 (52.0%) |
| Total | 35 (100.0%) | 25 (100.0%) |
Property Value to Household Income Ratio in Silver Plume
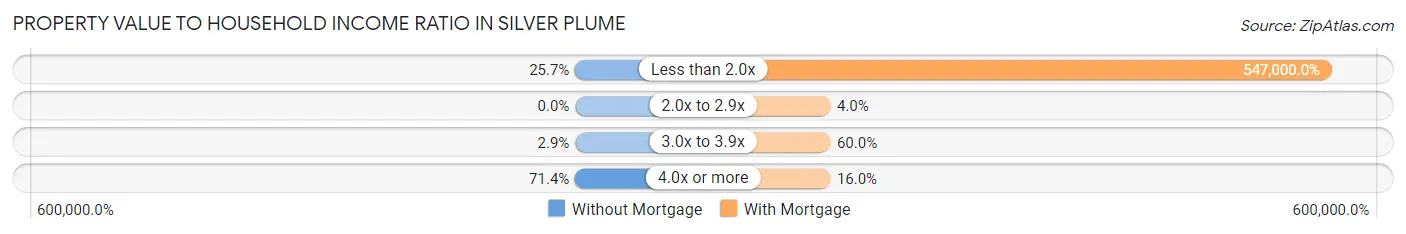
| Value-to-Income Ratio | Without Mortgage | With Mortgage |
| Less than 2.0x | 9 (25.7%) | 136,750 (547,000.0%) |
| 2.0x to 2.9x | 0 (0.0%) | 1 (4.0%) |
| 3.0x to 3.9x | 1 (2.9%) | 15 (60.0%) |
| 4.0x or more | 25 (71.4%) | 4 (16.0%) |
| Total | 35 (100.0%) | 25 (100.0%) |
Real Estate Taxes by Mortgage Status in Silver Plume
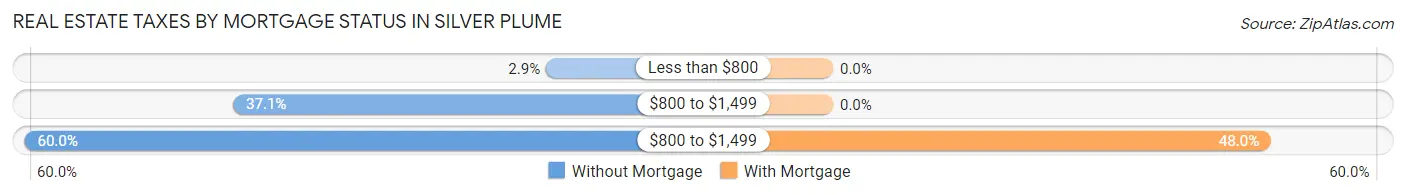
| Property Taxes | Without Mortgage | With Mortgage |
| Less than $800 | 1 (2.9%) | 0 (0.0%) |
| $800 to $1,499 | 13 (37.1%) | 0 (0.0%) |
| $800 to $1,499 | 21 (60.0%) | 12 (48.0%) |
| Total | 35 (100.0%) | 25 (100.0%) |
Health & Disability in Silver Plume
Health Insurance Coverage by Age in Silver Plume
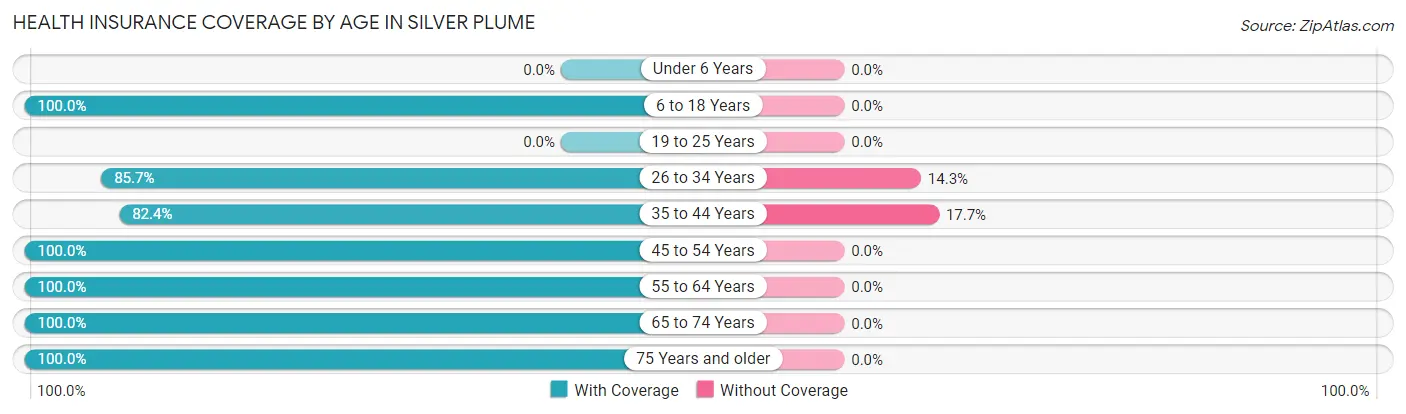
| Age Bracket | With Coverage | Without Coverage |
| Under 6 Years | 0 (0.0%) | 0 (0.0%) |
| 6 to 18 Years | 16 (100.0%) | 0 (0.0%) |
| 19 to 25 Years | 0 (0.0%) | 0 (0.0%) |
| 26 to 34 Years | 24 (85.7%) | 4 (14.3%) |
| 35 to 44 Years | 28 (82.4%) | 6 (17.6%) |
| 45 to 54 Years | 47 (100.0%) | 0 (0.0%) |
| 55 to 64 Years | 21 (100.0%) | 0 (0.0%) |
| 65 to 74 Years | 50 (100.0%) | 0 (0.0%) |
| 75 Years and older | 7 (100.0%) | 0 (0.0%) |
| Total | 193 (95.1%) | 10 (4.9%) |
Health Insurance Coverage by Citizenship Status in Silver Plume
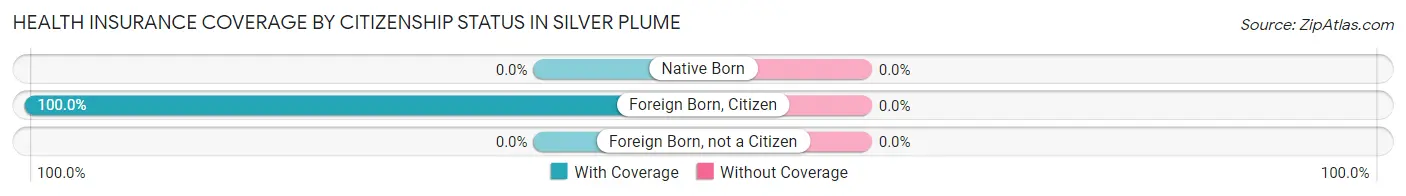
| Citizenship Status | With Coverage | Without Coverage |
| Native Born | 0 (0.0%) | 0 (0.0%) |
| Foreign Born, Citizen | 16 (100.0%) | 0 (0.0%) |
| Foreign Born, not a Citizen | 0 (0.0%) | 0 (0.0%) |
Health Insurance Coverage by Household Income in Silver Plume
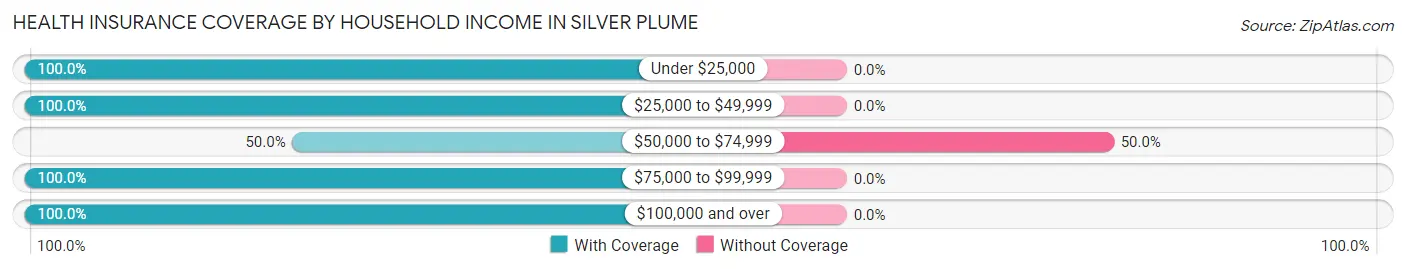
| Household Income | With Coverage | Without Coverage |
| Under $25,000 | 3 (100.0%) | 0 (0.0%) |
| $25,000 to $49,999 | 78 (100.0%) | 0 (0.0%) |
| $50,000 to $74,999 | 10 (50.0%) | 10 (50.0%) |
| $75,000 to $99,999 | 11 (100.0%) | 0 (0.0%) |
| $100,000 and over | 91 (100.0%) | 0 (0.0%) |
Public vs Private Health Insurance Coverage by Age in Silver Plume
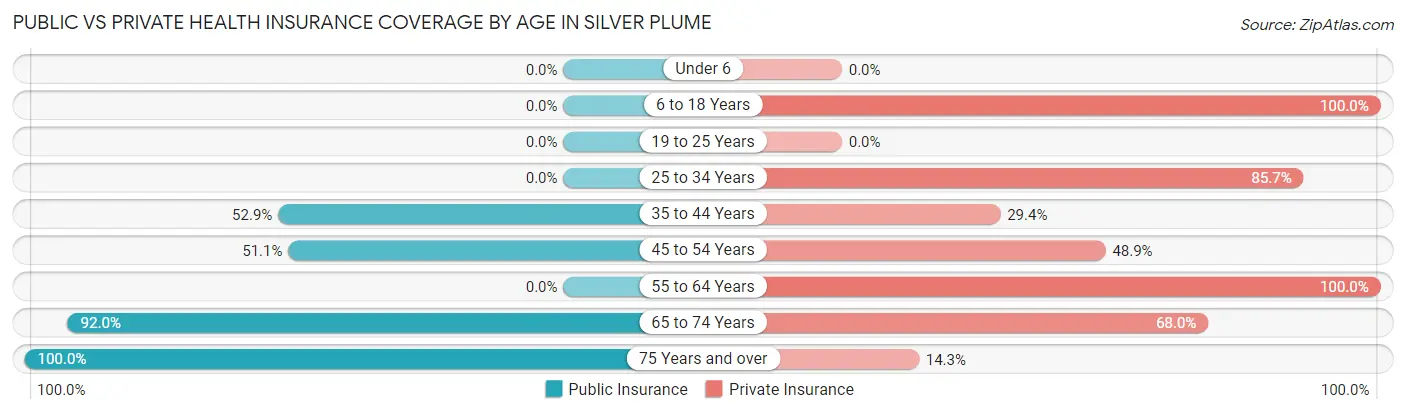
| Age Bracket | Public Insurance | Private Insurance |
| Under 6 | 0 (0.0%) | 0 (0.0%) |
| 6 to 18 Years | 0 (0.0%) | 16 (100.0%) |
| 19 to 25 Years | 0 (0.0%) | 0 (0.0%) |
| 25 to 34 Years | 0 (0.0%) | 24 (85.7%) |
| 35 to 44 Years | 18 (52.9%) | 10 (29.4%) |
| 45 to 54 Years | 24 (51.1%) | 23 (48.9%) |
| 55 to 64 Years | 0 (0.0%) | 21 (100.0%) |
| 65 to 74 Years | 46 (92.0%) | 34 (68.0%) |
| 75 Years and over | 7 (100.0%) | 1 (14.3%) |
| Total | 95 (46.8%) | 129 (63.5%) |
Disability Status by Sex by Age in Silver Plume
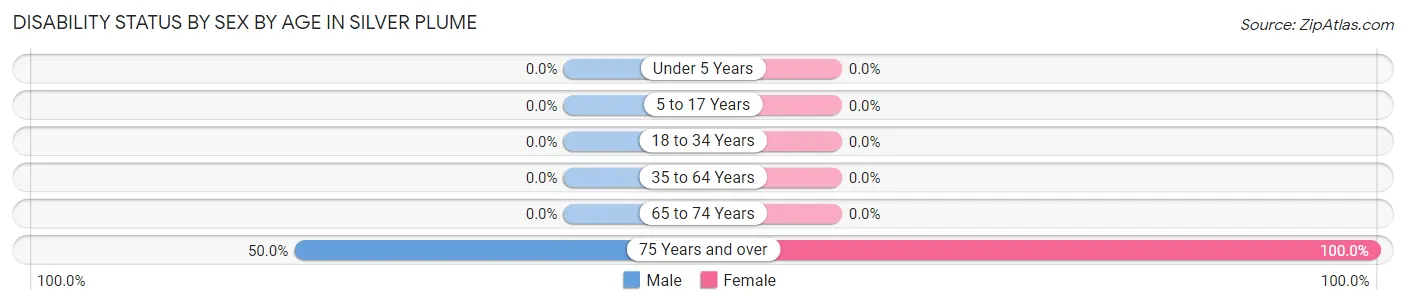
| Age Bracket | Male | Female |
| Under 5 Years | 0 (0.0%) | 0 (0.0%) |
| 5 to 17 Years | 0 (0.0%) | 0 (0.0%) |
| 18 to 34 Years | 0 (0.0%) | 0 (0.0%) |
| 35 to 64 Years | 0 (0.0%) | 0 (0.0%) |
| 65 to 74 Years | 0 (0.0%) | 0 (0.0%) |
| 75 Years and over | 2 (50.0%) | 3 (100.0%) |
Disability Class by Sex by Age in Silver Plume
Disability Class: Hearing Difficulty
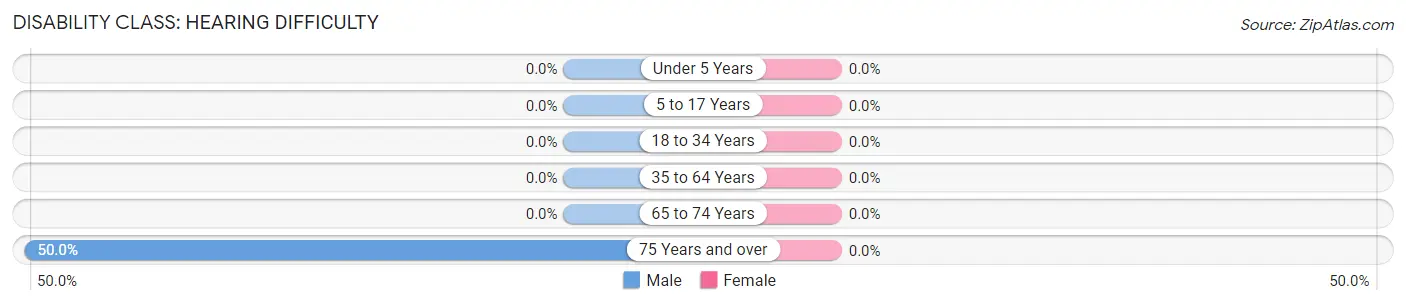
| Age Bracket | Male | Female |
| Under 5 Years | 0 (0.0%) | 0 (0.0%) |
| 5 to 17 Years | 0 (0.0%) | 0 (0.0%) |
| 18 to 34 Years | 0 (0.0%) | 0 (0.0%) |
| 35 to 64 Years | 0 (0.0%) | 0 (0.0%) |
| 65 to 74 Years | 0 (0.0%) | 0 (0.0%) |
| 75 Years and over | 2 (50.0%) | 0 (0.0%) |
Disability Class: Vision Difficulty
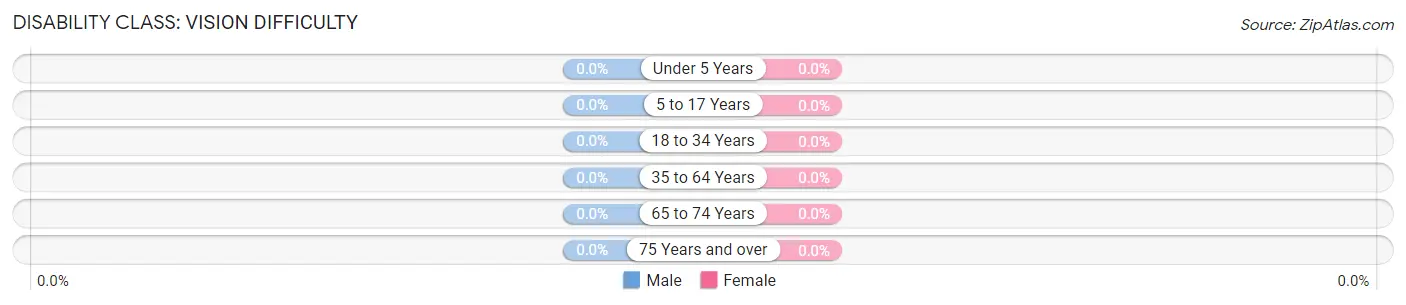
| Age Bracket | Male | Female |
| Under 5 Years | 0 (0.0%) | 0 (0.0%) |
| 5 to 17 Years | 0 (0.0%) | 0 (0.0%) |
| 18 to 34 Years | 0 (0.0%) | 0 (0.0%) |
| 35 to 64 Years | 0 (0.0%) | 0 (0.0%) |
| 65 to 74 Years | 0 (0.0%) | 0 (0.0%) |
| 75 Years and over | 0 (0.0%) | 0 (0.0%) |
Disability Class: Cognitive Difficulty
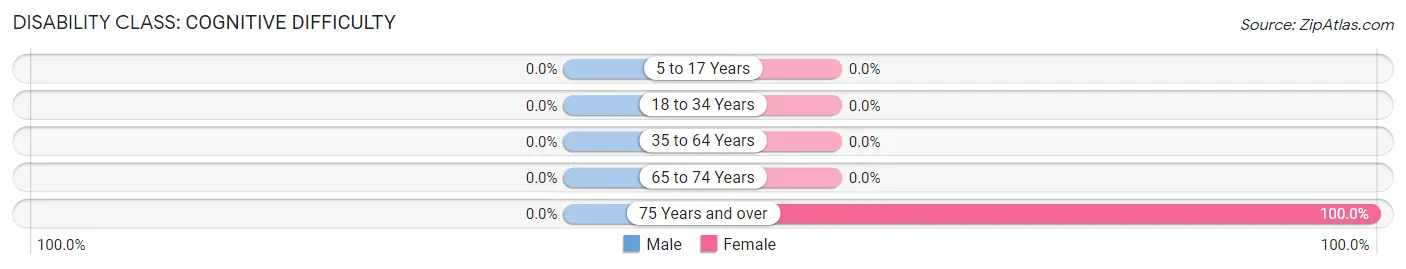
| Age Bracket | Male | Female |
| 5 to 17 Years | 0 (0.0%) | 0 (0.0%) |
| 18 to 34 Years | 0 (0.0%) | 0 (0.0%) |
| 35 to 64 Years | 0 (0.0%) | 0 (0.0%) |
| 65 to 74 Years | 0 (0.0%) | 0 (0.0%) |
| 75 Years and over | 0 (0.0%) | 3 (100.0%) |
Disability Class: Ambulatory Difficulty
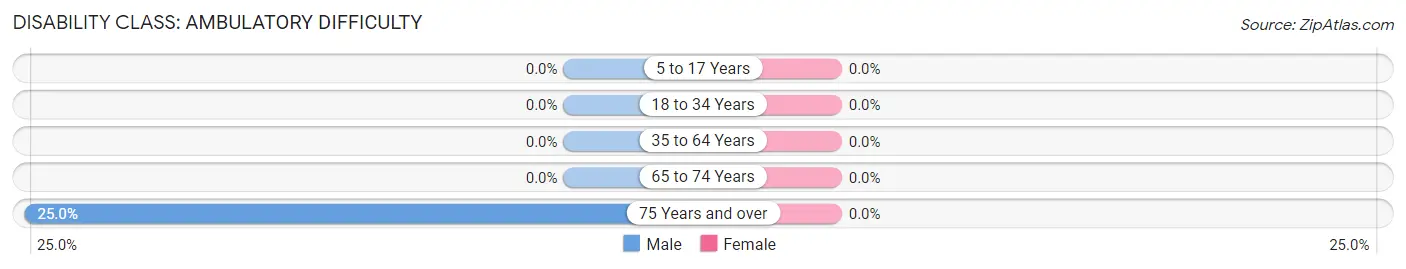
| Age Bracket | Male | Female |
| 5 to 17 Years | 0 (0.0%) | 0 (0.0%) |
| 18 to 34 Years | 0 (0.0%) | 0 (0.0%) |
| 35 to 64 Years | 0 (0.0%) | 0 (0.0%) |
| 65 to 74 Years | 0 (0.0%) | 0 (0.0%) |
| 75 Years and over | 1 (25.0%) | 0 (0.0%) |
Disability Class: Self-Care Difficulty
| Age Bracket | Male | Female |
| 5 to 17 Years | 0 (0.0%) | 0 (0.0%) |
| 18 to 34 Years | 0 (0.0%) | 0 (0.0%) |
| 35 to 64 Years | 0 (0.0%) | 0 (0.0%) |
| 65 to 74 Years | 0 (0.0%) | 0 (0.0%) |
| 75 Years and over | 0 (0.0%) | 0 (0.0%) |
Technology Access in Silver Plume
Computing Device Access in Silver Plume
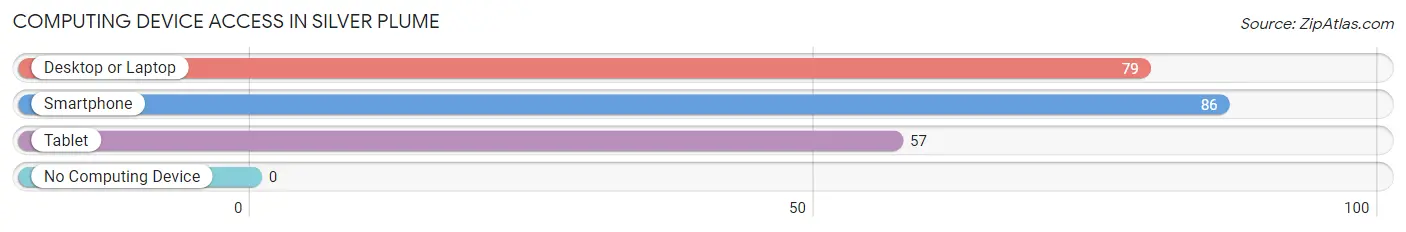
| Device Type | # Households | % Households |
| Desktop or Laptop | 79 | 86.8% |
| Smartphone | 86 | 94.5% |
| Tablet | 57 | 62.6% |
| No Computing Device | 0 | 0.0% |
| Total | 91 | 100.0% |
Internet Access in Silver Plume
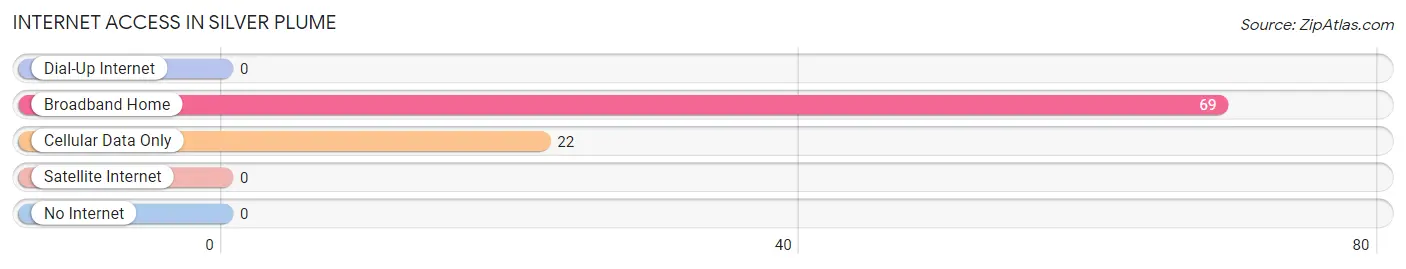
| Internet Type | # Households | % Households |
| Dial-Up Internet | 0 | 0.0% |
| Broadband Home | 69 | 75.8% |
| Cellular Data Only | 22 | 24.2% |
| Satellite Internet | 0 | 0.0% |
| No Internet | 0 | 0.0% |
| Total | 91 | 100.0% |
Silver Plume Summary
Silver Plume, Colorado is a small mountain town located in Clear Creek County, Colorado. It is situated in the Rocky Mountains, approximately 40 miles west of Denver. The town was founded in 1859 during the Colorado Gold Rush and is one of the oldest towns in the state. Silver Plume is known for its historic buildings, scenic views, and outdoor activities.
Geography
Silver Plume is located in the Rocky Mountains at an elevation of 8,890 feet. The town is situated in a narrow valley between two mountain ranges, the Front Range and the Tenmile Range. The town is surrounded by the Arapaho National Forest and is close to several ski resorts, including Loveland Ski Area and Arapahoe Basin. The town is also close to several mountain lakes, including Lake Dillon and Green Mountain Reservoir.
The town is located along the South Platte River, which is a major tributary of the Colorado River. The river is used for fishing, rafting, and kayaking. The town is also close to several hiking trails, including the Continental Divide Trail and the Colorado Trail.
Climate
Silver Plume has a humid continental climate, with cold winters and warm summers. The average high temperature in the summer is around 75°F, and the average low temperature in the winter is around 10°F. The town receives an average of 30 inches of precipitation per year, with most of it falling in the form of snow.
Demographics
As of the 2010 census, Silver Plume had a population of 463. The racial makeup of the town was 97.3% White, 0.2% African American, 0.2% Native American, 0.2% Asian, 0.2% from other races, and 1.9% from two or more races. Hispanic or Latino of any race were 1.3% of the population.
Economy
Silver Plume’s economy is largely based on tourism. The town is home to several historic buildings, including the Silver Plume Depot, which is listed on the National Register of Historic Places. The town is also home to several restaurants, shops, and galleries.
The town is also home to several outdoor recreation businesses, including a ski resort, a rafting company, and a kayaking company. The town is also home to several mining companies, which are involved in the extraction of gold, silver, and other minerals.
Conclusion
Silver Plume, Colorado is a small mountain town located in Clear Creek County, Colorado. It is situated in the Rocky Mountains, approximately 40 miles west of Denver. The town was founded in 1859 during the Colorado Gold Rush and is one of the oldest towns in the state. Silver Plume is known for its historic buildings, scenic views, and outdoor activities. The town has a humid continental climate, with cold winters and warm summers. As of the 2010 census, Silver Plume had a population of 463. The town’s economy is largely based on tourism, outdoor recreation, and mining.
Common Questions
What is Per Capita Income in Silver Plume?
Per Capita income in Silver Plume is $47,377.
What is the Median Family Income in Silver Plume?
Median Family Income in Silver Plume is $115,938.
What is Income or Wage Gap in Silver Plume?
Income or Wage Gap in Silver Plume is 55.7%.
Women in Silver Plume earn 44.3 cents for every dollar earned by a man.
What is Inequality or Gini Index in Silver Plume?
Inequality or Gini Index in Silver Plume is 0.41.
What is the Total Population of Silver Plume?
Total Population of Silver Plume is 203.
What is the Total Male Population of Silver Plume?
Total Male Population of Silver Plume is 86.
What is the Total Female Population of Silver Plume?
Total Female Population of Silver Plume is 117.
What is the Ratio of Males per 100 Females in Silver Plume?
There are 73.50 Males per 100 Females in Silver Plume.
What is the Ratio of Females per 100 Males in Silver Plume?
There are 136.05 Females per 100 Males in Silver Plume.
What is the Median Population Age in Silver Plume?
Median Population Age in Silver Plume is 46.0 Years.
What is the Average Family Size in Silver Plume
Average Family Size in Silver Plume is 2.9 People.
What is the Average Household Size in Silver Plume
Average Household Size in Silver Plume is 2.2 People.
How Large is the Labor Force in Silver Plume?
There are 91 People in the Labor Forcein in Silver Plume.
What is the Percentage of People in the Labor Force in Silver Plume?
48.7% of People are in the Labor Force in Silver Plume.