Florence, CO Map & Demographics
Florence Map
Florence Overview
$29,632
PER CAPITA INCOME
$74,531
AVG FAMILY INCOME
$58,167
AVG HOUSEHOLD INCOME
13.6%
WAGE / INCOME GAP [ % ]
86.4¢/ $1
WAGE / INCOME GAP [ $ ]
0.36
INEQUALITY / GINI INDEX
3,874
TOTAL POPULATION
2,112
MALE POPULATION
1,762
FEMALE POPULATION
119.86
MALES / 100 FEMALES
83.43
FEMALES / 100 MALES
44.6
MEDIAN AGE
2.8
AVG FAMILY SIZE
2.3
AVG HOUSEHOLD SIZE
1,953
LABOR FORCE [ PEOPLE ]
59.1%
PERCENT IN LABOR FORCE
1.6%
UNEMPLOYMENT RATE
Florence Zip Codes
Florence Area Codes
Income in Florence
Income Overview in Florence
Per Capita Income in Florence is $29,632, while median incomes of families and households are $74,531 and $58,167 respectively.
| Characteristic | Number | Measure |
| Per Capita Income | 3,874 | $29,632 |
| Median Family Income | 975 | $74,531 |
| Mean Family Income | 975 | $80,180 |
| Median Household Income | 1,652 | $58,167 |
| Mean Household Income | 1,652 | $69,050 |
| Income Deficit | 975 | $0 |
| Wage / Income Gap (%) | 3,874 | 13.57% |
| Wage / Income Gap ($) | 3,874 | 86.43¢ per $1 |
| Gini / Inequality Index | 3,874 | 0.36 |
Earnings by Sex in Florence
Average Earnings in Florence are $36,728, $37,994 for men and $32,837 for women, a difference of 13.6%.
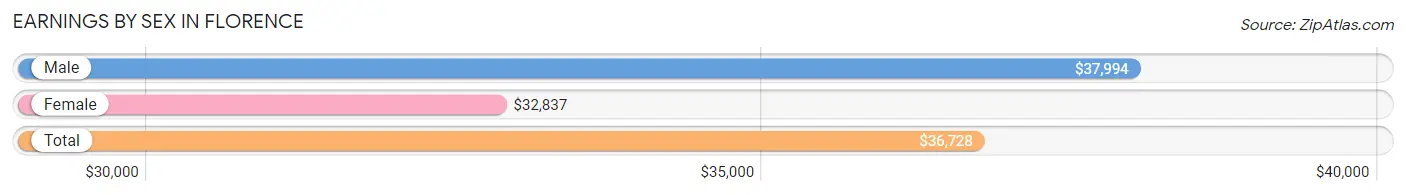
| Sex | Number | Average Earnings |
| Male | 1,242 (59.4%) | $37,994 |
| Female | 849 (40.6%) | $32,837 |
| Total | 2,091 (100.0%) | $36,728 |
Earnings by Sex by Income Bracket in Florence
The most common earnings brackets in Florence are $25,000 to $29,999 for men (161 | 13.0%) and $45,000 to $49,999 for women (97 | 11.4%).
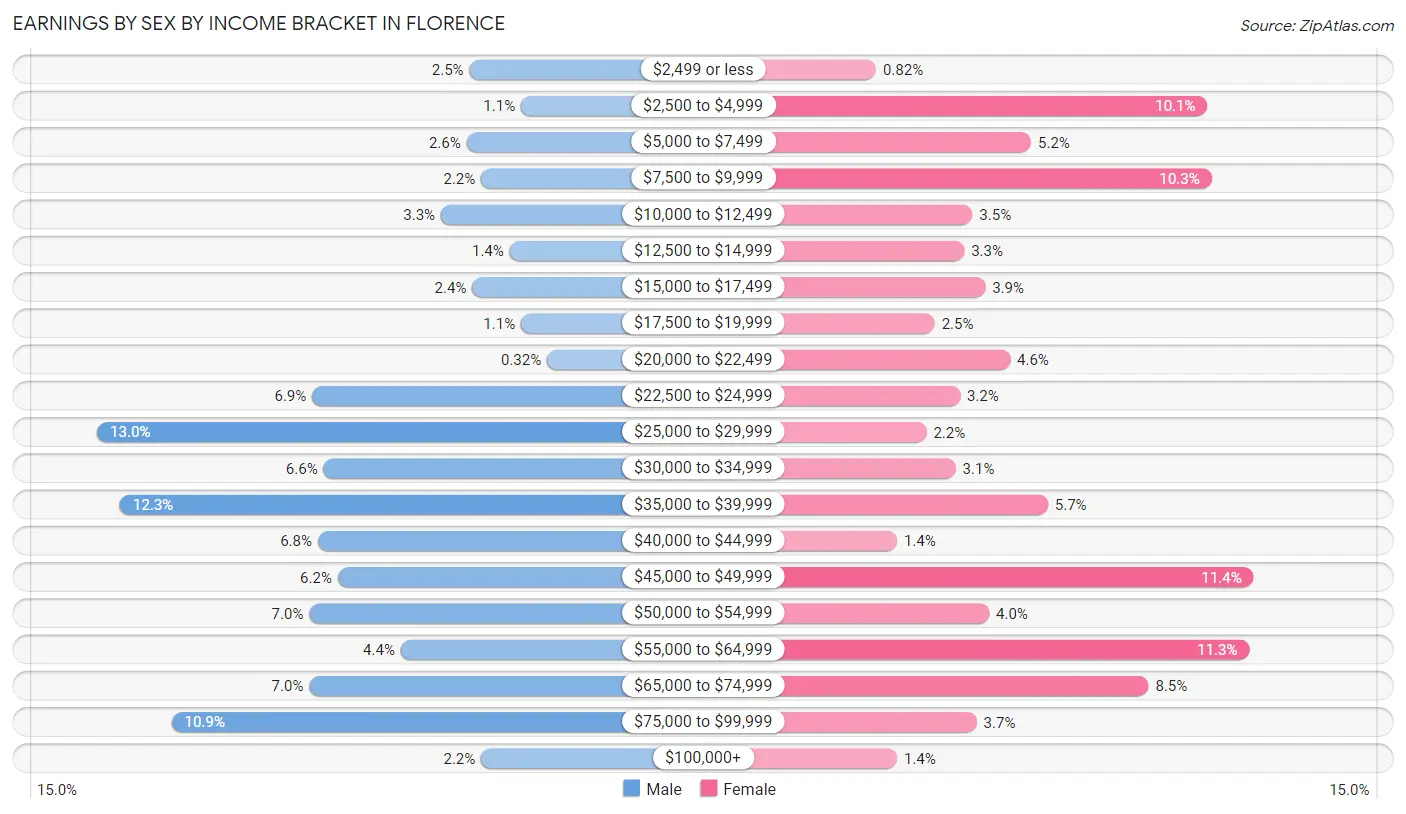
| Income | Male | Female |
| $2,499 or less | 31 (2.5%) | 7 (0.8%) |
| $2,500 to $4,999 | 13 (1.1%) | 86 (10.1%) |
| $5,000 to $7,499 | 32 (2.6%) | 44 (5.2%) |
| $7,500 to $9,999 | 27 (2.2%) | 87 (10.2%) |
| $10,000 to $12,499 | 41 (3.3%) | 30 (3.5%) |
| $12,500 to $14,999 | 17 (1.4%) | 28 (3.3%) |
| $15,000 to $17,499 | 30 (2.4%) | 33 (3.9%) |
| $17,500 to $19,999 | 13 (1.1%) | 21 (2.5%) |
| $20,000 to $22,499 | 4 (0.3%) | 39 (4.6%) |
| $22,500 to $24,999 | 86 (6.9%) | 27 (3.2%) |
| $25,000 to $29,999 | 161 (13.0%) | 19 (2.2%) |
| $30,000 to $34,999 | 82 (6.6%) | 26 (3.1%) |
| $35,000 to $39,999 | 153 (12.3%) | 48 (5.7%) |
| $40,000 to $44,999 | 84 (6.8%) | 12 (1.4%) |
| $45,000 to $49,999 | 77 (6.2%) | 97 (11.4%) |
| $50,000 to $54,999 | 87 (7.0%) | 34 (4.0%) |
| $55,000 to $64,999 | 55 (4.4%) | 96 (11.3%) |
| $65,000 to $74,999 | 87 (7.0%) | 72 (8.5%) |
| $75,000 to $99,999 | 135 (10.9%) | 31 (3.6%) |
| $100,000+ | 27 (2.2%) | 12 (1.4%) |
| Total | 1,242 (100.0%) | 849 (100.0%) |
Earnings by Sex by Educational Attainment in Florence
Average earnings in Florence are $40,015 for men and $39,760 for women, a difference of 0.6%. Men with an educational attainment of graduate degree enjoy the highest average annual earnings of $70,357, while those with high school diploma education earn the least with $28,644. Women with an educational attainment of graduate degree earn the most with the average annual earnings of $59,333, while those with high school diploma education have the smallest earnings of $21,090.
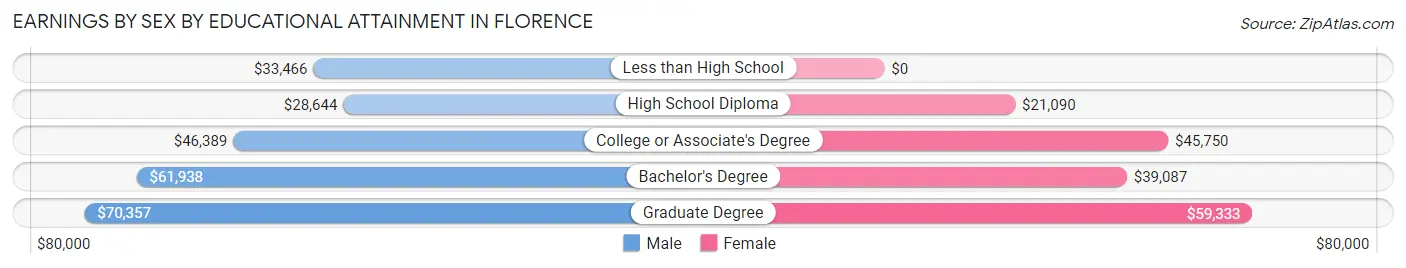
| Educational Attainment | Male Income | Female Income |
| Less than High School | $33,466 | $0 |
| High School Diploma | $28,644 | $21,090 |
| College or Associate's Degree | $46,389 | $45,750 |
| Bachelor's Degree | $61,938 | $39,087 |
| Graduate Degree | $70,357 | $59,333 |
| Total | $40,015 | $39,760 |
Family Income in Florence
Family Income Brackets in Florence
According to the Florence family income data, there are 244 families falling into the $75,000 to $99,999 income range, which is the most common income bracket and makes up 25.0% of all families. Conversely, the $200,000+ income bracket is the least frequent group with only 14 families (1.4%) belonging to this category.
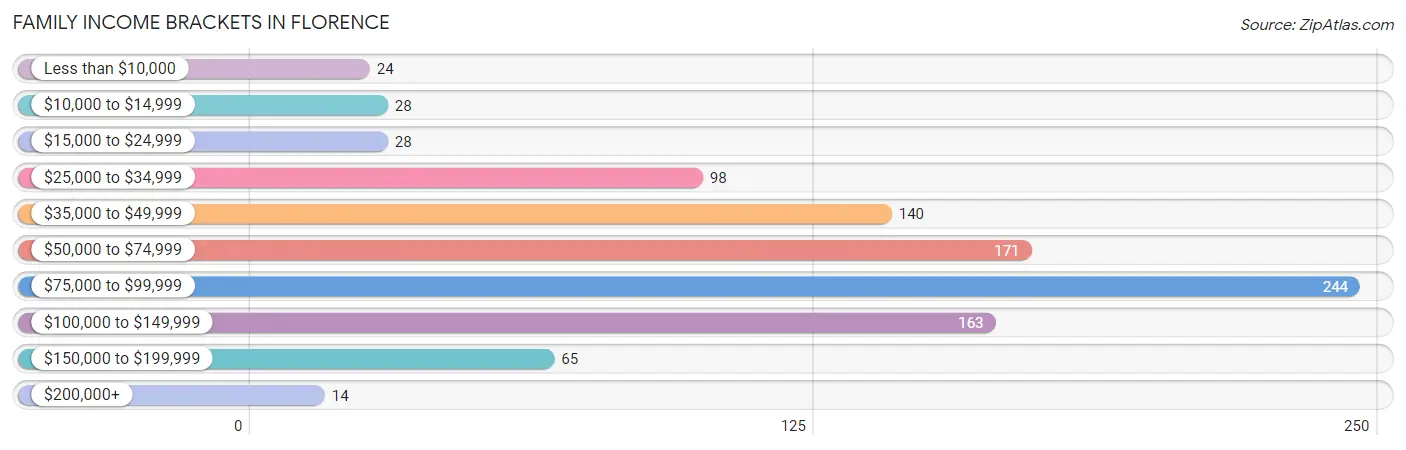
| Income Bracket | # Families | % Families |
| Less than $10,000 | 24 | 2.5% |
| $10,000 to $14,999 | 28 | 2.9% |
| $15,000 to $24,999 | 28 | 2.9% |
| $25,000 to $34,999 | 98 | 10.1% |
| $35,000 to $49,999 | 140 | 14.4% |
| $50,000 to $74,999 | 171 | 17.5% |
| $75,000 to $99,999 | 244 | 25.0% |
| $100,000 to $149,999 | 163 | 16.7% |
| $150,000 to $199,999 | 65 | 6.7% |
| $200,000+ | 14 | 1.4% |
Family Income by Famaliy Size in Florence
5-person families (39 | 4.0%) account for the highest median family income in Florence with $96,250 per family, while 2-person families (558 | 57.2%) have the highest median income of $35,500 per family member.
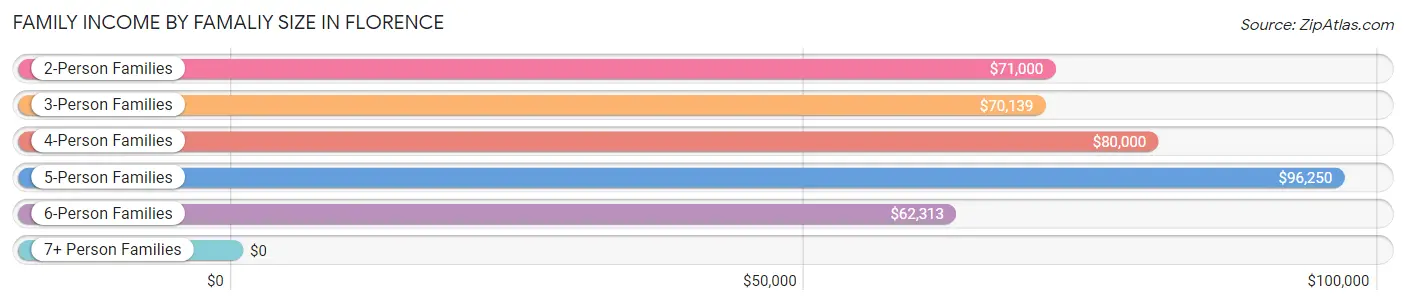
| Income Bracket | # Families | Median Income |
| 2-Person Families | 558 (57.2%) | $71,000 |
| 3-Person Families | 185 (19.0%) | $70,139 |
| 4-Person Families | 132 (13.5%) | $80,000 |
| 5-Person Families | 39 (4.0%) | $96,250 |
| 6-Person Families | 51 (5.2%) | $62,313 |
| 7+ Person Families | 10 (1.0%) | $0 |
| Total | 975 (100.0%) | $74,531 |
Family Income by Number of Earners in Florence
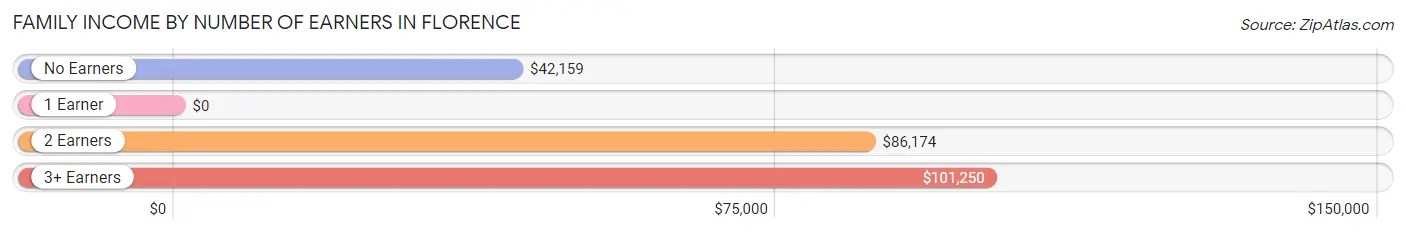
| Number of Earners | # Families | Median Income |
| No Earners | 118 (12.1%) | $42,159 |
| 1 Earner | 380 (39.0%) | $0 |
| 2 Earners | 413 (42.4%) | $86,174 |
| 3+ Earners | 64 (6.6%) | $101,250 |
| Total | 975 (100.0%) | $74,531 |
Household Income in Florence
Household Income Brackets in Florence
With 335 households falling in the category, the $50,000 to $74,999 income range is the most frequent in Florence, accounting for 20.3% of all households.
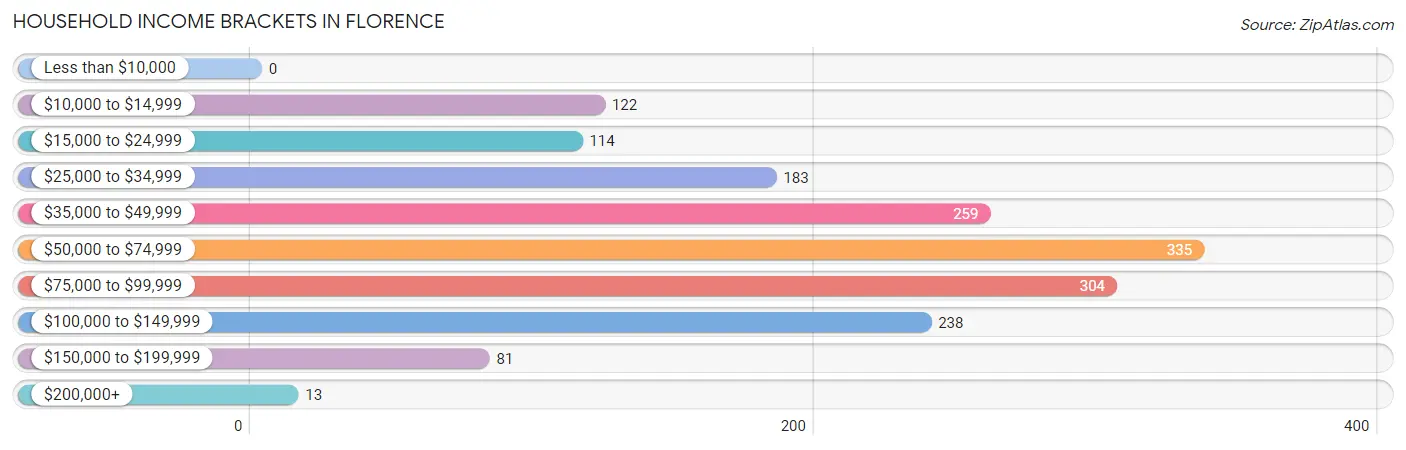
| Income Bracket | # Households | % Households |
| Less than $10,000 | 0 | 0.0% |
| $10,000 to $14,999 | 122 | 7.4% |
| $15,000 to $24,999 | 114 | 6.9% |
| $25,000 to $34,999 | 183 | 11.1% |
| $35,000 to $49,999 | 259 | 15.7% |
| $50,000 to $74,999 | 335 | 20.3% |
| $75,000 to $99,999 | 304 | 18.4% |
| $100,000 to $149,999 | 238 | 14.4% |
| $150,000 to $199,999 | 81 | 4.9% |
| $200,000+ | 13 | 0.8% |
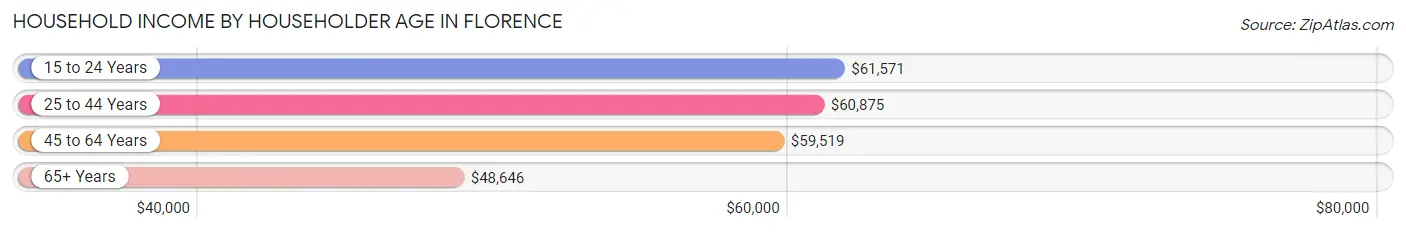
Household Income by Householder Age in Florence
The median household income in Florence is $58,167, with the highest median household income of $61,571 found in the 15 to 24 years age bracket for the primary householder. A total of 67 households (4.1%) fall into this category. Meanwhile, the 65+ years age bracket for the primary householder has the lowest median household income of $48,646, with 407 households (24.6%) in this group.
| Income Bracket | # Households | Median Income |
| 15 to 24 Years | 67 (4.1%) | $61,571 |
| 25 to 44 Years | 472 (28.6%) | $60,875 |
| 45 to 64 Years | 706 (42.7%) | $59,519 |
| 65+ Years | 407 (24.6%) | $48,646 |
| Total | 1,652 (100.0%) | $58,167 |
Poverty in Florence
Income Below Poverty by Sex and Age in Florence
With 10.6% poverty level for males and 18.4% for females among the residents of Florence, 6 to 11 year old males and 15 year old females are the most vulnerable to poverty, with 52 males (40.6%) and 11 females (100.0%) in their respective age groups living below the poverty level.
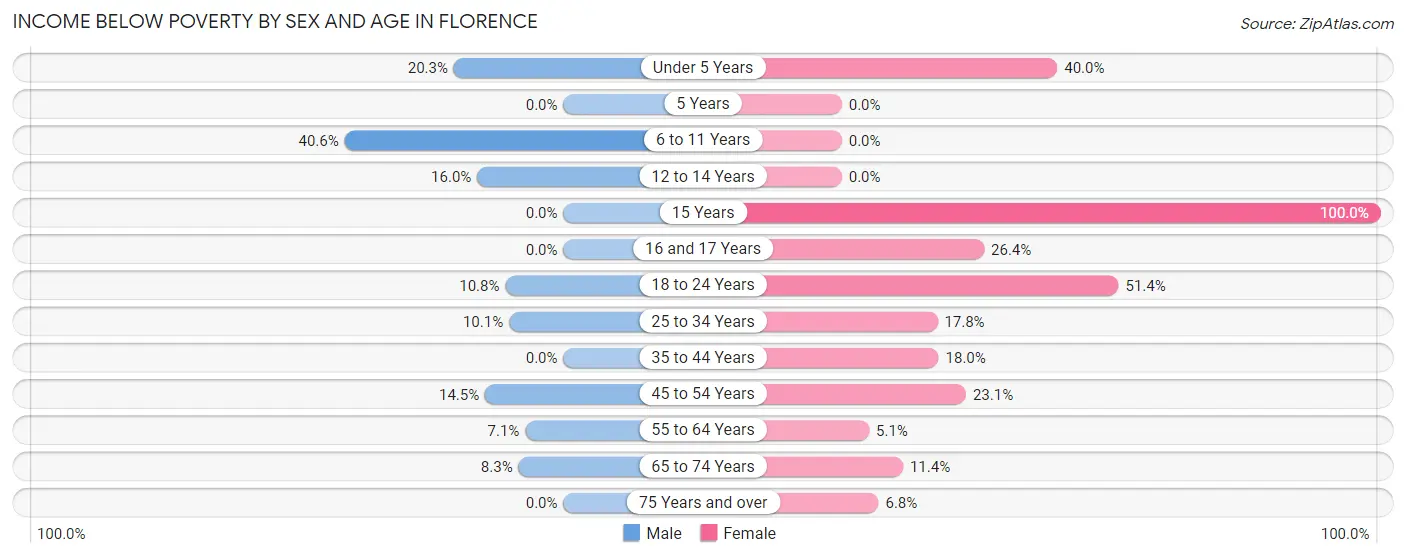
| Age Bracket | Male | Female |
| Under 5 Years | 12 (20.3%) | 24 (40.0%) |
| 5 Years | 0 (0.0%) | 0 (0.0%) |
| 6 to 11 Years | 52 (40.6%) | 0 (0.0%) |
| 12 to 14 Years | 12 (16.0%) | 0 (0.0%) |
| 15 Years | 0 (0.0%) | 11 (100.0%) |
| 16 and 17 Years | 0 (0.0%) | 14 (26.4%) |
| 18 to 24 Years | 25 (10.8%) | 94 (51.4%) |
| 25 to 34 Years | 32 (10.1%) | 30 (17.7%) |
| 35 to 44 Years | 0 (0.0%) | 39 (18.0%) |
| 45 to 54 Years | 50 (14.5%) | 59 (23.1%) |
| 55 to 64 Years | 17 (7.1%) | 17 (5.1%) |
| 65 to 74 Years | 20 (8.3%) | 20 (11.4%) |
| 75 Years and over | 0 (0.0%) | 6 (6.8%) |
| Total | 220 (10.6%) | 314 (18.4%) |
Income Above Poverty by Sex and Age in Florence
According to the poverty statistics in Florence, males aged 5 years and females aged 5 years are the age groups that are most secure financially, with 100.0% of males and 100.0% of females in these age groups living above the poverty line.
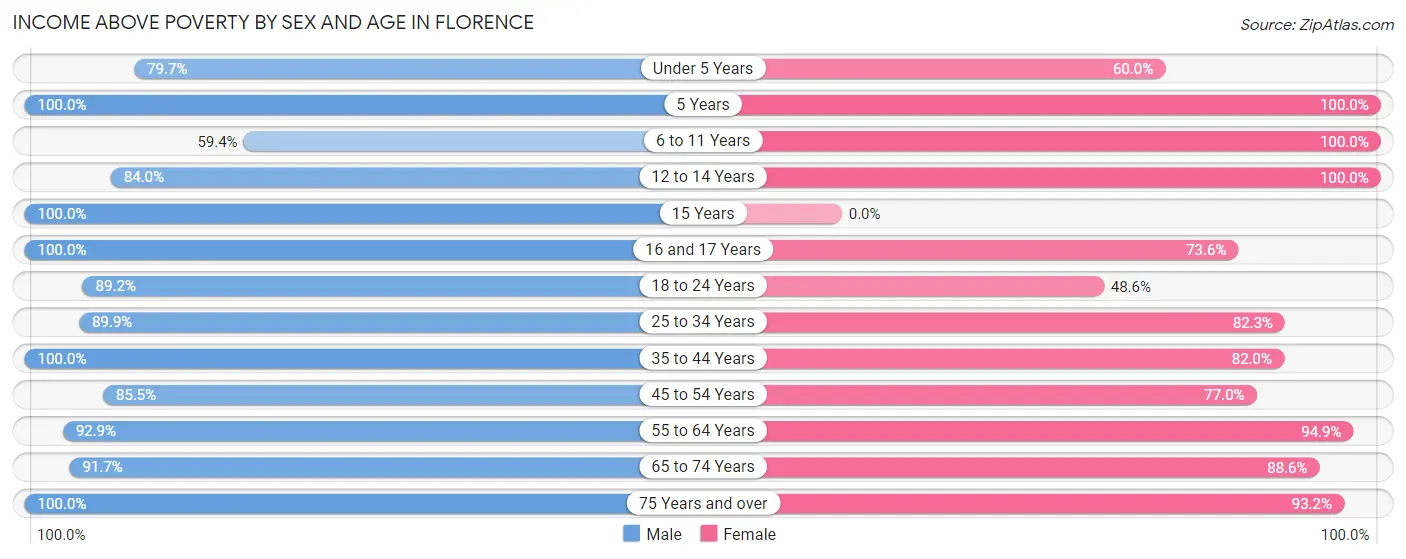
| Age Bracket | Male | Female |
| Under 5 Years | 47 (79.7%) | 36 (60.0%) |
| 5 Years | 9 (100.0%) | 30 (100.0%) |
| 6 to 11 Years | 76 (59.4%) | 73 (100.0%) |
| 12 to 14 Years | 63 (84.0%) | 51 (100.0%) |
| 15 Years | 73 (100.0%) | 0 (0.0%) |
| 16 and 17 Years | 7 (100.0%) | 39 (73.6%) |
| 18 to 24 Years | 207 (89.2%) | 89 (48.6%) |
| 25 to 34 Years | 285 (89.9%) | 139 (82.3%) |
| 35 to 44 Years | 227 (100.0%) | 178 (82.0%) |
| 45 to 54 Years | 294 (85.5%) | 197 (76.9%) |
| 55 to 64 Years | 223 (92.9%) | 318 (94.9%) |
| 65 to 74 Years | 220 (91.7%) | 156 (88.6%) |
| 75 Years and over | 126 (100.0%) | 82 (93.2%) |
| Total | 1,857 (89.4%) | 1,388 (81.6%) |
Income Below Poverty Among Married-Couple Families in Florence
The poverty statistics for married-couple families in Florence show that 2.6% or 19 of the total 731 families live below the poverty line. Families with 3 or 4 children have the highest poverty rate of 11.7%, comprising of 7 families. On the other hand, families with no children have the lowest poverty rate of 0.0%, which includes 0 families.
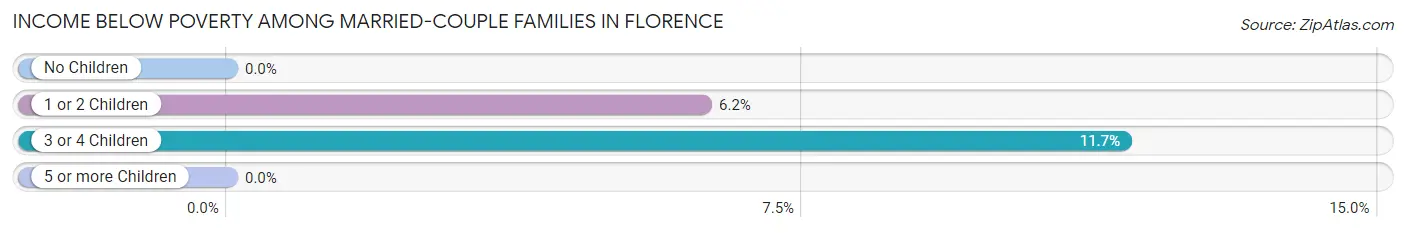
| Children | Above Poverty | Below Poverty |
| No Children | 477 (100.0%) | 0 (0.0%) |
| 1 or 2 Children | 182 (93.8%) | 12 (6.2%) |
| 3 or 4 Children | 53 (88.3%) | 7 (11.7%) |
| 5 or more Children | 0 (0.0%) | 0 (0.0%) |
| Total | 712 (97.4%) | 19 (2.6%) |
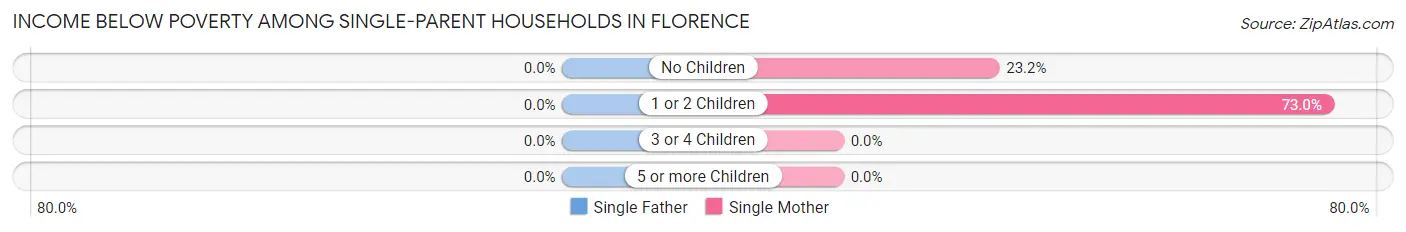
Income Below Poverty Among Single-Parent Households in Florence
| Children | Single Father | Single Mother |
| No Children | 0 (0.0%) | 16 (23.2%) |
| 1 or 2 Children | 0 (0.0%) | 46 (73.0%) |
| 3 or 4 Children | 0 (0.0%) | 0 (0.0%) |
| 5 or more Children | 0 (0.0%) | 0 (0.0%) |
| Total | 0 (0.0%) | 62 (47.0%) |
Income Below Poverty Among Married-Couple vs Single-Parent Households in Florence
The poverty data for Florence shows that 19 of the married-couple family households (2.6%) and 62 of the single-parent households (25.4%) are living below the poverty level. Within the married-couple family households, those with 3 or 4 children have the highest poverty rate, with 7 households (11.7%) falling below the poverty line. Among the single-parent households, those with 1 or 2 children have the highest poverty rate, with 46 household (30.5%) living below poverty.
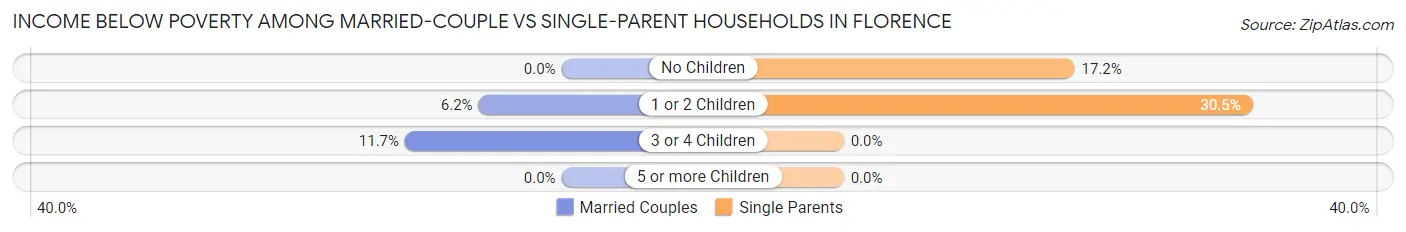
| Children | Married-Couple Families | Single-Parent Households |
| No Children | 0 (0.0%) | 16 (17.2%) |
| 1 or 2 Children | 12 (6.2%) | 46 (30.5%) |
| 3 or 4 Children | 7 (11.7%) | 0 (0.0%) |
| 5 or more Children | 0 (0.0%) | 0 (0.0%) |
| Total | 19 (2.6%) | 62 (25.4%) |
Race in Florence
The most populous races in Florence are White / Caucasian (3,532 | 91.2%), Hispanic or Latino (478 | 12.3%), and Two or more Races (240 | 6.2%).
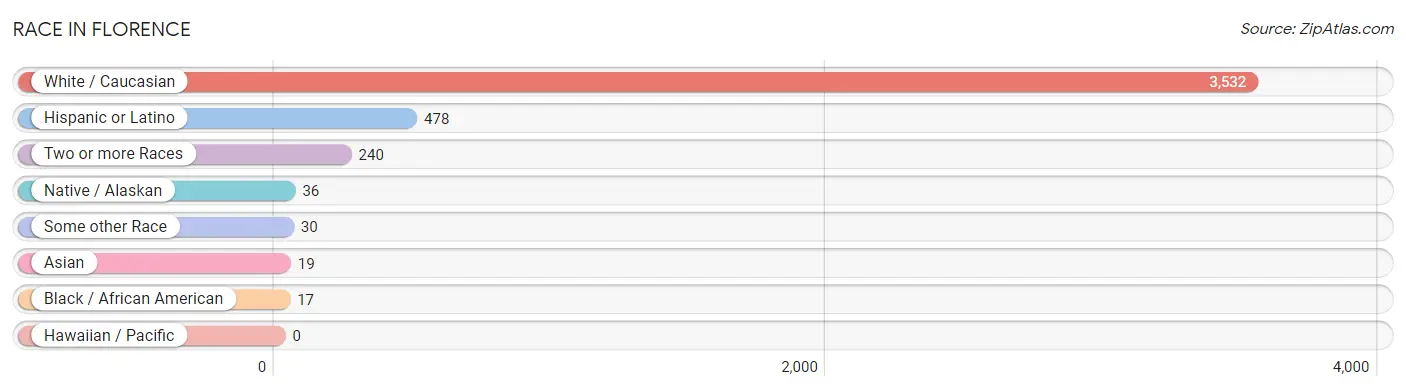
| Race | # Population | % Population |
| Asian | 19 | 0.5% |
| Black / African American | 17 | 0.4% |
| Hawaiian / Pacific | 0 | 0.0% |
| Hispanic or Latino | 478 | 12.3% |
| Native / Alaskan | 36 | 0.9% |
| White / Caucasian | 3,532 | 91.2% |
| Two or more Races | 240 | 6.2% |
| Some other Race | 30 | 0.8% |
| Total | 3,874 | 100.0% |
Ancestry in Florence
The most populous ancestries reported in Florence are German (642 | 16.6%), English (426 | 11.0%), Irish (380 | 9.8%), Mexican (232 | 6.0%), and French (144 | 3.7%), together accounting for 47.1% of all Florence residents.
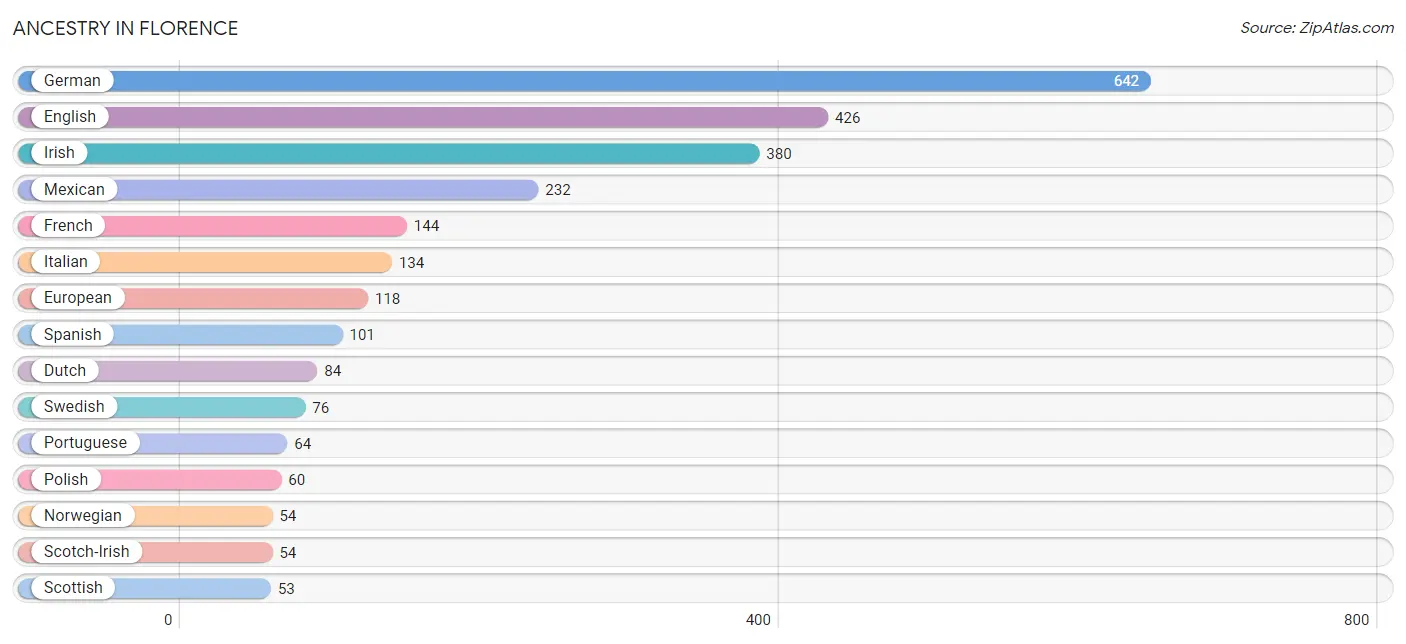
| Ancestry | # Population | % Population |
| American | 16 | 0.4% |
| Austrian | 49 | 1.3% |
| Bhutanese | 19 | 0.5% |
| Cherokee | 49 | 1.3% |
| Cuban | 36 | 0.9% |
| Danish | 5 | 0.1% |
| Dutch | 84 | 2.2% |
| Eastern European | 8 | 0.2% |
| English | 426 | 11.0% |
| European | 118 | 3.0% |
| Finnish | 22 | 0.6% |
| French | 144 | 3.7% |
| French Canadian | 5 | 0.1% |
| German | 642 | 16.6% |
| Hungarian | 4 | 0.1% |
| Irish | 380 | 9.8% |
| Iroquois | 2 | 0.1% |
| Israeli | 9 | 0.2% |
| Italian | 134 | 3.5% |
| Kiowa | 49 | 1.3% |
| Lithuanian | 16 | 0.4% |
| Mexican | 232 | 6.0% |
| Navajo | 16 | 0.4% |
| Northern European | 15 | 0.4% |
| Norwegian | 54 | 1.4% |
| Polish | 60 | 1.5% |
| Portuguese | 64 | 1.7% |
| Scandinavian | 12 | 0.3% |
| Scotch-Irish | 54 | 1.4% |
| Scottish | 53 | 1.4% |
| Spaniard | 46 | 1.2% |
| Spanish | 101 | 2.6% |
| Swedish | 76 | 2.0% |
| Swiss | 17 | 0.4% |
| Welsh | 49 | 1.3% | View All 35 Rows |
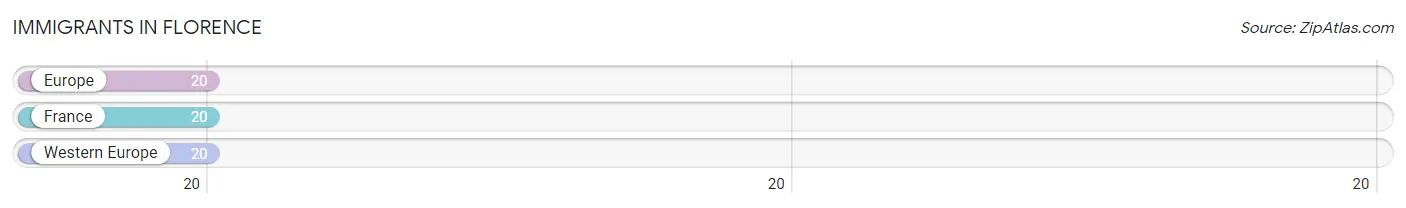
Immigrants in Florence
The most numerous immigrant groups reported in Florence came from Europe (20 | 0.5%), France (20 | 0.5%), and Western Europe (20 | 0.5%), together accounting for 1.6% of all Florence residents.
| Immigration Origin | # Population | % Population |
| Europe | 20 | 0.5% |
| France | 20 | 0.5% |
| Western Europe | 20 | 0.5% | View All 3 Rows |
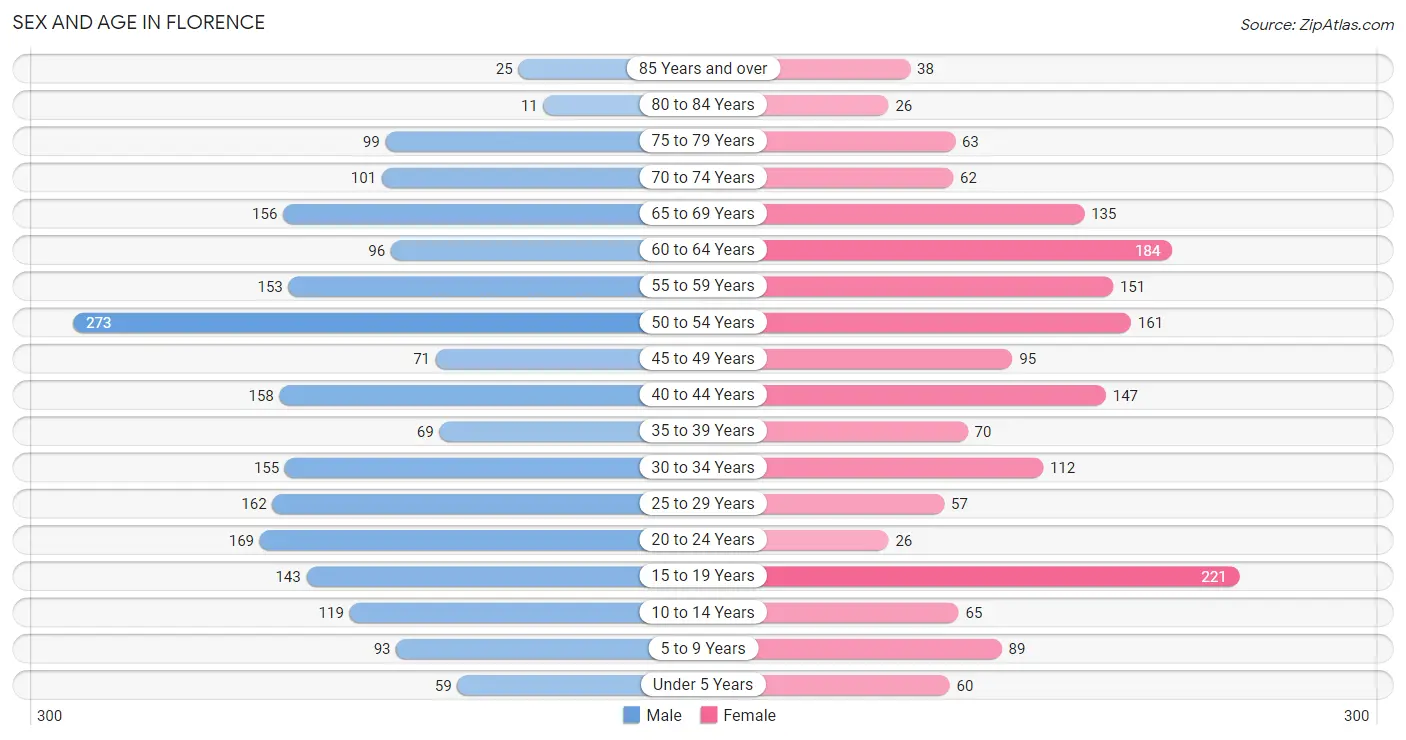
Sex and Age in Florence
Sex and Age in Florence
The most populous age groups in Florence are 50 to 54 Years (273 | 12.9%) for men and 15 to 19 Years (221 | 12.5%) for women.
| Age Bracket | Male | Female |
| Under 5 Years | 59 (2.8%) | 60 (3.4%) |
| 5 to 9 Years | 93 (4.4%) | 89 (5.1%) |
| 10 to 14 Years | 119 (5.6%) | 65 (3.7%) |
| 15 to 19 Years | 143 (6.8%) | 221 (12.5%) |
| 20 to 24 Years | 169 (8.0%) | 26 (1.5%) |
| 25 to 29 Years | 162 (7.7%) | 57 (3.2%) |
| 30 to 34 Years | 155 (7.3%) | 112 (6.4%) |
| 35 to 39 Years | 69 (3.3%) | 70 (4.0%) |
| 40 to 44 Years | 158 (7.5%) | 147 (8.3%) |
| 45 to 49 Years | 71 (3.4%) | 95 (5.4%) |
| 50 to 54 Years | 273 (12.9%) | 161 (9.1%) |
| 55 to 59 Years | 153 (7.2%) | 151 (8.6%) |
| 60 to 64 Years | 96 (4.5%) | 184 (10.4%) |
| 65 to 69 Years | 156 (7.4%) | 135 (7.7%) |
| 70 to 74 Years | 101 (4.8%) | 62 (3.5%) |
| 75 to 79 Years | 99 (4.7%) | 63 (3.6%) |
| 80 to 84 Years | 11 (0.5%) | 26 (1.5%) |
| 85 Years and over | 25 (1.2%) | 38 (2.2%) |
| Total | 2,112 (100.0%) | 1,762 (100.0%) |
Families and Households in Florence
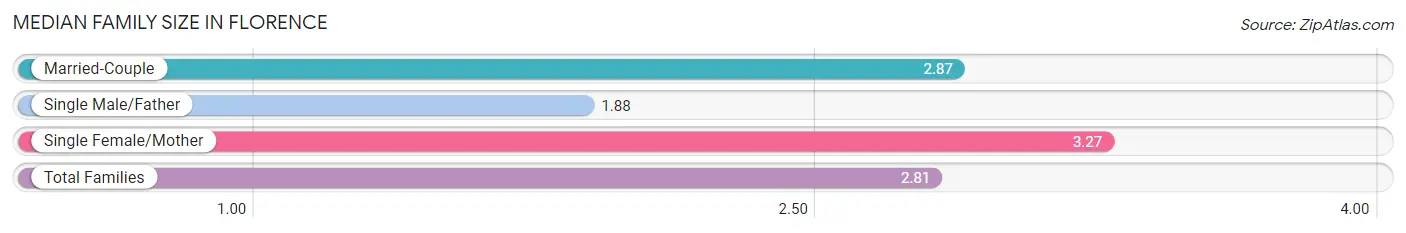
Median Family Size in Florence
The median family size in Florence is 2.81 persons per family, with single female/mother families (132 | 13.5%) accounting for the largest median family size of 3.27 persons per family. On the other hand, single male/father families (112 | 11.5%) represent the smallest median family size with 1.88 persons per family.
| Family Type | # Families | Family Size |
| Married-Couple | 731 (75.0%) | 2.87 |
| Single Male/Father | 112 (11.5%) | 1.88 |
| Single Female/Mother | 132 (13.5%) | 3.27 |
| Total Families | 975 (100.0%) | 2.81 |
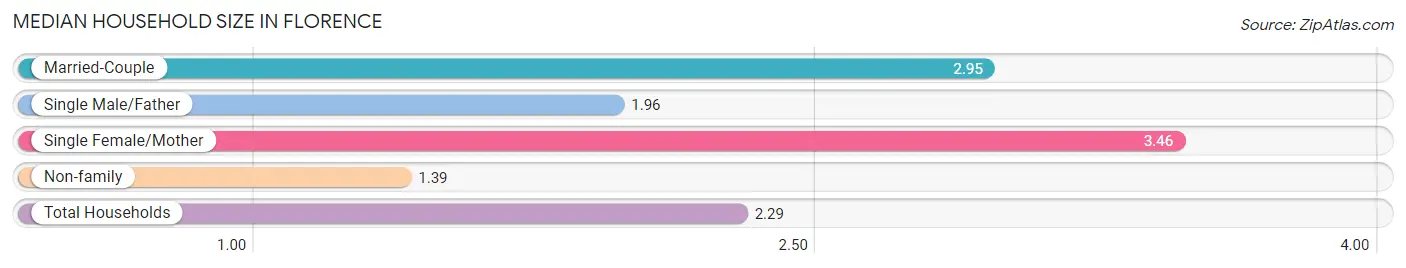
Median Household Size in Florence
The median household size in Florence is 2.29 persons per household, with single female/mother households (132 | 8.0%) accounting for the largest median household size of 3.46 persons per household. non-family households (677 | 41.0%) represent the smallest median household size with 1.39 persons per household.
| Household Type | # Households | Household Size |
| Married-Couple | 731 (44.3%) | 2.95 |
| Single Male/Father | 112 (6.8%) | 1.96 |
| Single Female/Mother | 132 (8.0%) | 3.46 |
| Non-family | 677 (41.0%) | 1.39 |
| Total Households | 1,652 (100.0%) | 2.29 |
Household Size by Marriage Status in Florence
Out of a total of 1,652 households in Florence, 975 (59.0%) are family households, while 677 (41.0%) are nonfamily households. The most numerous type of family households are 2-person households, comprising 549, and the most common type of nonfamily households are 1-person households, comprising 539.
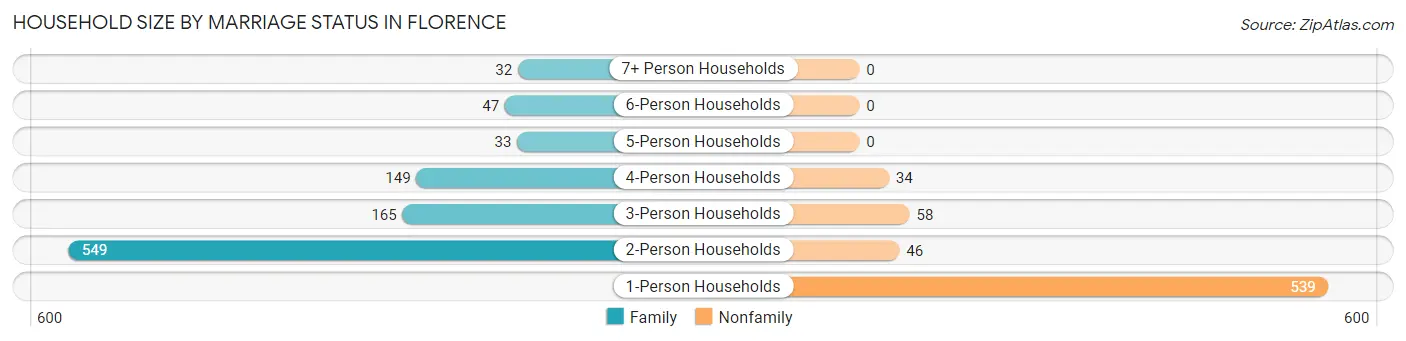
| Household Size | Family Households | Nonfamily Households |
| 1-Person Households | - | 539 (32.6%) |
| 2-Person Households | 549 (33.2%) | 46 (2.8%) |
| 3-Person Households | 165 (10.0%) | 58 (3.5%) |
| 4-Person Households | 149 (9.0%) | 34 (2.1%) |
| 5-Person Households | 33 (2.0%) | 0 (0.0%) |
| 6-Person Households | 47 (2.9%) | 0 (0.0%) |
| 7+ Person Households | 32 (1.9%) | 0 (0.0%) |
| Total | 975 (59.0%) | 677 (41.0%) |
Female Fertility in Florence
Fertility by Age in Florence
Average fertility rate in Florence is 3.0 births per 1,000 women. Women in the age bracket of 20 to 34 years have the highest fertility rate with 10.0 births per 1,000 women. Women in the age bracket of 20 to 34 years acount for 100.0% of all women with births.
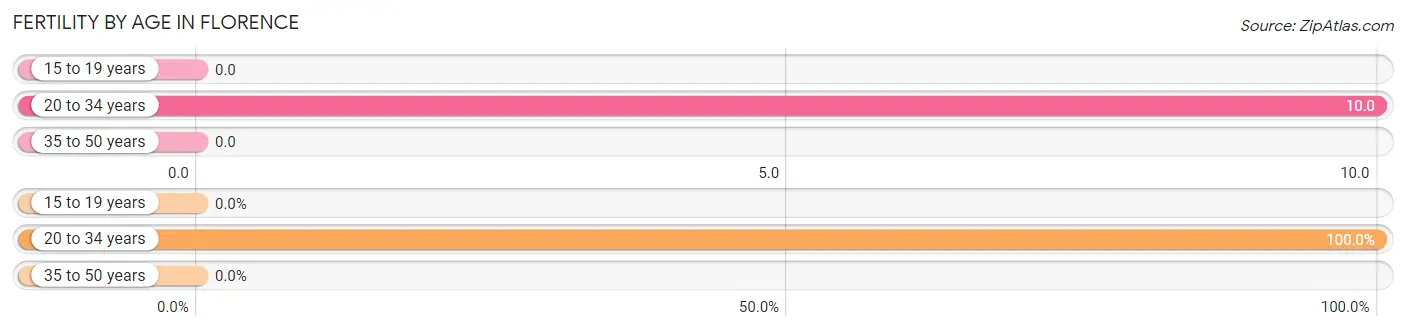
| Age Bracket | Women with Births | Births / 1,000 Women |
| 15 to 19 years | 0 (0.0%) | 0.0 |
| 20 to 34 years | 2 (100.0%) | 10.0 |
| 35 to 50 years | 0 (0.0%) | 0.0 |
| Total | 2 (100.0%) | 3.0 |
Fertility by Age by Marriage Status in Florence
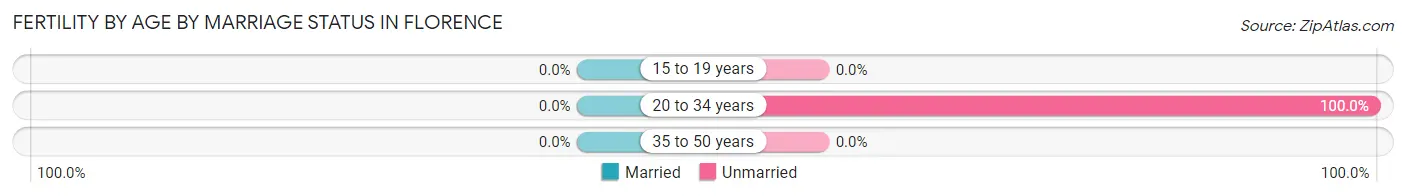
| Age Bracket | Married | Unmarried |
| 15 to 19 years | 0 (0.0%) | 0 (0.0%) |
| 20 to 34 years | 0 (0.0%) | 2 (100.0%) |
| 35 to 50 years | 0 (0.0%) | 0 (0.0%) |
| Total | 0 (0.0%) | 2 (100.0%) |
Fertility by Education in Florence
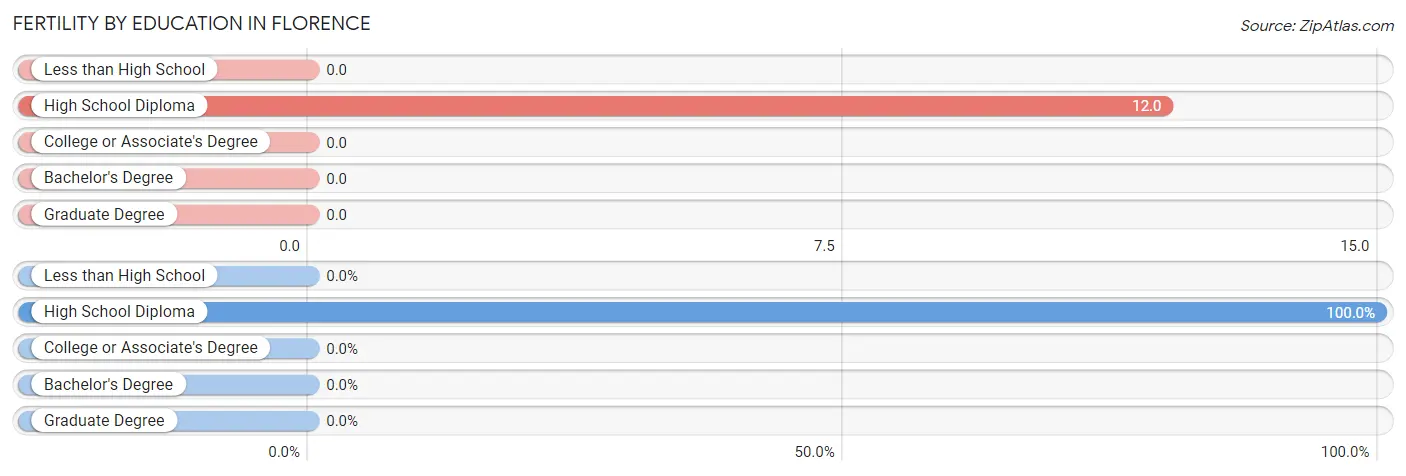
| Educational Attainment | Women with Births | Births / 1,000 Women |
| Less than High School | 0 (0.0%) | 0.0 |
| High School Diploma | 2 (100.0%) | 12.0 |
| College or Associate's Degree | 0 (0.0%) | 0.0 |
| Bachelor's Degree | 0 (0.0%) | 0.0 |
| Graduate Degree | 0 (0.0%) | 0.0 |
| Total | 2 (100.0%) | 3.0 |
Fertility by Education by Marriage Status in Florence
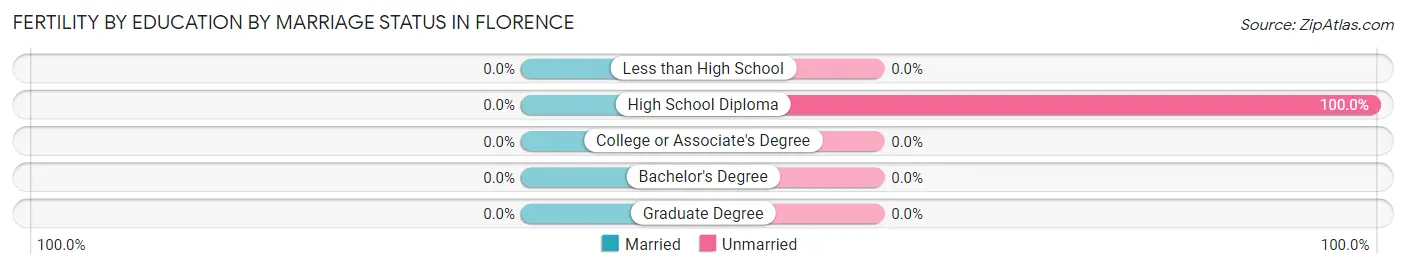
| Educational Attainment | Married | Unmarried |
| Less than High School | 0 (0.0%) | 0 (0.0%) |
| High School Diploma | 0 (0.0%) | 2 (100.0%) |
| College or Associate's Degree | 0 (0.0%) | 0 (0.0%) |
| Bachelor's Degree | 0 (0.0%) | 0 (0.0%) |
| Graduate Degree | 0 (0.0%) | 0 (0.0%) |
| Total | 0 (0.0%) | 2 (100.0%) |
Employment Characteristics in Florence
Employment by Class of Employer in Florence
Among the 1,881 employed individuals in Florence, private company employees (1,010 | 53.7%), self-employed (not incorporated) (198 | 10.5%), and local government employees (163 | 8.7%) make up the most common classes of employment.
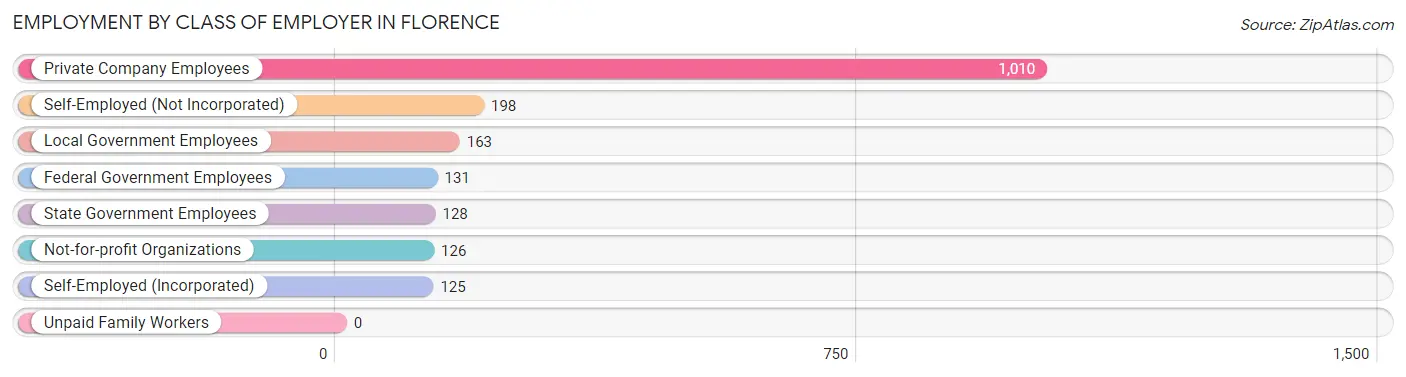
| Employer Class | # Employees | % Employees |
| Private Company Employees | 1,010 | 53.7% |
| Self-Employed (Incorporated) | 125 | 6.7% |
| Self-Employed (Not Incorporated) | 198 | 10.5% |
| Not-for-profit Organizations | 126 | 6.7% |
| Local Government Employees | 163 | 8.7% |
| State Government Employees | 128 | 6.8% |
| Federal Government Employees | 131 | 7.0% |
| Unpaid Family Workers | 0 | 0.0% |
| Total | 1,881 | 100.0% |
Employment Status by Age in Florence
According to the labor force statistics for Florence, out of the total population over 16 years of age (3,305), 59.1% or 1,953 individuals are in the labor force, with 1.6% or 31 of them unemployed. The age group with the highest labor force participation rate is 30 to 34 years, with 85.4% or 228 individuals in the labor force. Within the labor force, the 75 years and over age range has the highest percentage of unemployed individuals, with 36.4% or 4 of them being unemployed.
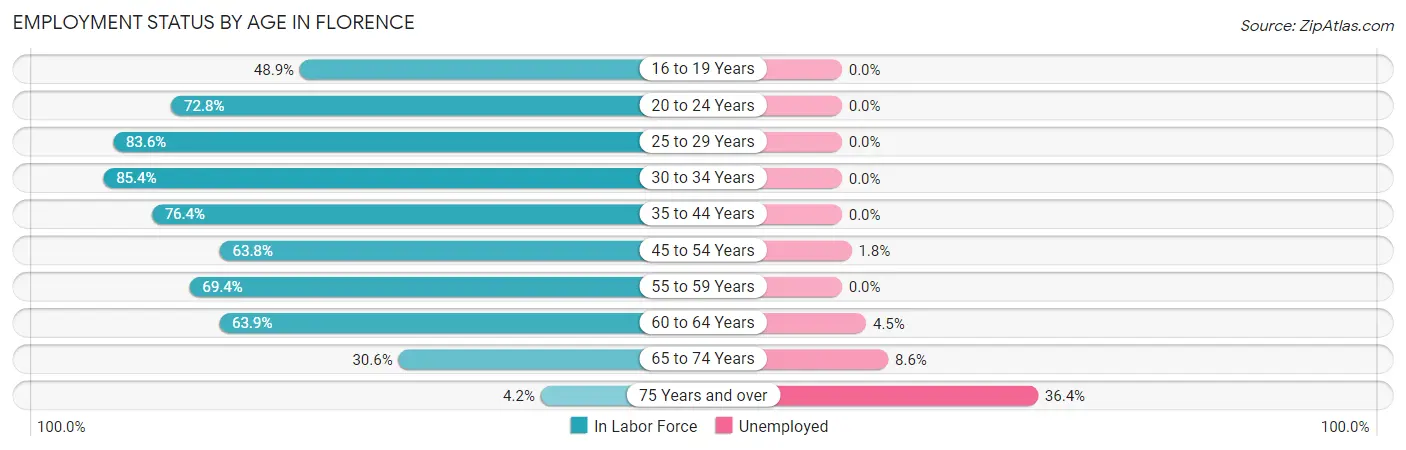
| Age Bracket | In Labor Force | Unemployed |
| 16 to 19 Years | 137 (48.9%) | 0 (0.0%) |
| 20 to 24 Years | 142 (72.8%) | 0 (0.0%) |
| 25 to 29 Years | 183 (83.6%) | 0 (0.0%) |
| 30 to 34 Years | 228 (85.4%) | 0 (0.0%) |
| 35 to 44 Years | 339 (76.4%) | 0 (0.0%) |
| 45 to 54 Years | 383 (63.8%) | 7 (1.8%) |
| 55 to 59 Years | 211 (69.4%) | 0 (0.0%) |
| 60 to 64 Years | 179 (63.9%) | 8 (4.5%) |
| 65 to 74 Years | 139 (30.6%) | 12 (8.6%) |
| 75 Years and over | 11 (4.2%) | 4 (36.4%) |
| Total | 1,953 (59.1%) | 31 (1.6%) |
Employment Status by Educational Attainment in Florence
According to labor force statistics for Florence, 72.0% of individuals (1,522) out of the total population between 25 and 64 years of age (2,114) are in the labor force, with 1.0% or 15 of them being unemployed. The group with the highest labor force participation rate are those with the educational attainment of college / associate degree, with 84.3% or 675 individuals in the labor force. Within the labor force, individuals with bachelor's degree or higher education have the highest percentage of unemployment, with 2.2% or 8 of them being unemployed.
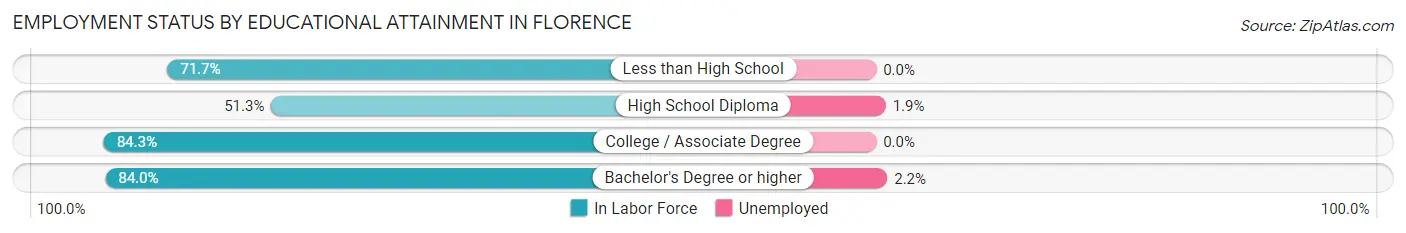
| Educational Attainment | In Labor Force | Unemployed |
| Less than High School | 119 (71.7%) | 0 (0.0%) |
| High School Diploma | 367 (51.3%) | 14 (1.9%) |
| College / Associate Degree | 675 (84.3%) | 0 (0.0%) |
| Bachelor's Degree or higher | 362 (84.0%) | 9 (2.2%) |
| Total | 1,522 (72.0%) | 21 (1.0%) |
Employment Occupations by Sex in Florence
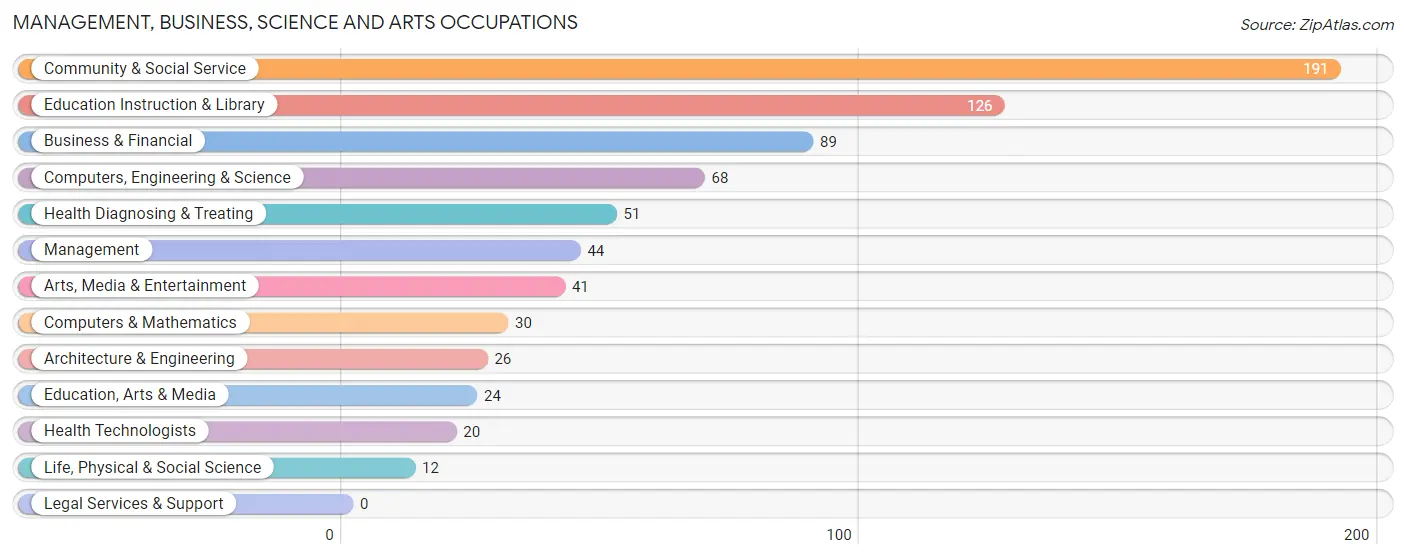
Management, Business, Science and Arts Occupations
The most common Management, Business, Science and Arts occupations in Florence are Community & Social Service (191 | 9.9%), Education Instruction & Library (126 | 6.6%), Business & Financial (89 | 4.6%), Computers, Engineering & Science (68 | 3.5%), and Health Diagnosing & Treating (51 | 2.6%).
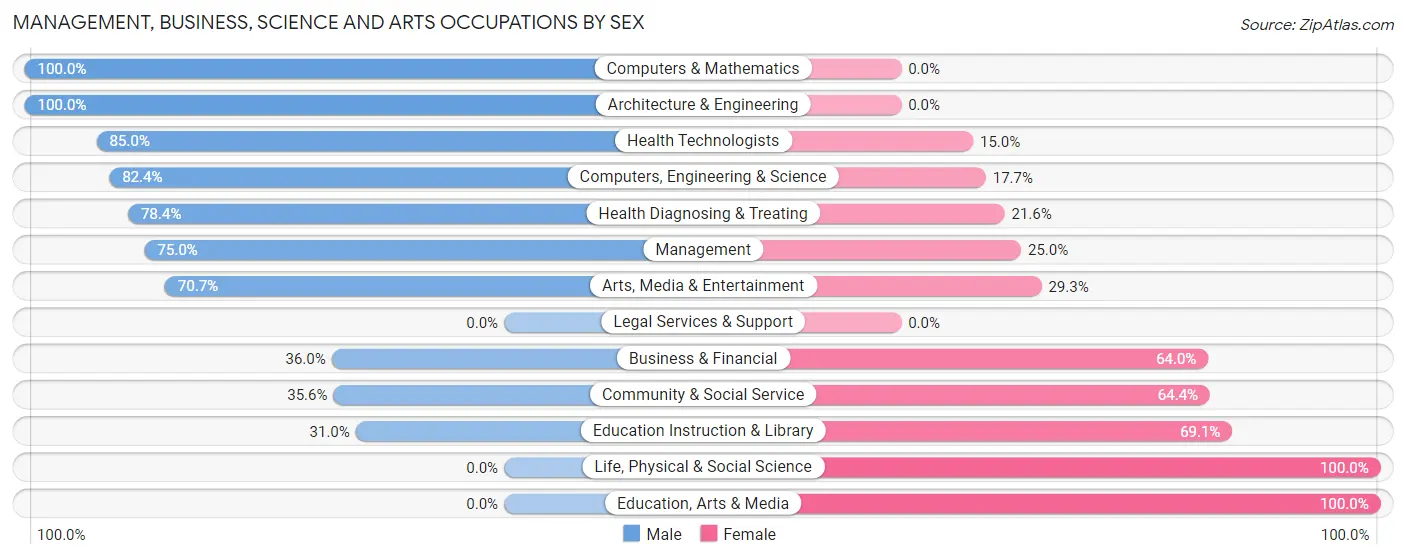
Management, Business, Science and Arts Occupations by Sex
Within the Management, Business, Science and Arts occupations in Florence, the most male-oriented occupations are Computers & Mathematics (100.0%), Architecture & Engineering (100.0%), and Health Technologists (85.0%), while the most female-oriented occupations are Life, Physical & Social Science (100.0%), Education, Arts & Media (100.0%), and Education Instruction & Library (69.1%).
| Occupation | Male | Female |
| Management | 33 (75.0%) | 11 (25.0%) |
| Business & Financial | 32 (36.0%) | 57 (64.0%) |
| Computers, Engineering & Science | 56 (82.4%) | 12 (17.6%) |
| Computers & Mathematics | 30 (100.0%) | 0 (0.0%) |
| Architecture & Engineering | 26 (100.0%) | 0 (0.0%) |
| Life, Physical & Social Science | 0 (0.0%) | 12 (100.0%) |
| Community & Social Service | 68 (35.6%) | 123 (64.4%) |
| Education, Arts & Media | 0 (0.0%) | 24 (100.0%) |
| Legal Services & Support | 0 (0.0%) | 0 (0.0%) |
| Education Instruction & Library | 39 (30.9%) | 87 (69.1%) |
| Arts, Media & Entertainment | 29 (70.7%) | 12 (29.3%) |
| Health Diagnosing & Treating | 40 (78.4%) | 11 (21.6%) |
| Health Technologists | 17 (85.0%) | 3 (15.0%) |
| Total (Category) | 229 (51.7%) | 214 (48.3%) |
| Total (Overall) | 1,211 (63.0%) | 710 (37.0%) |
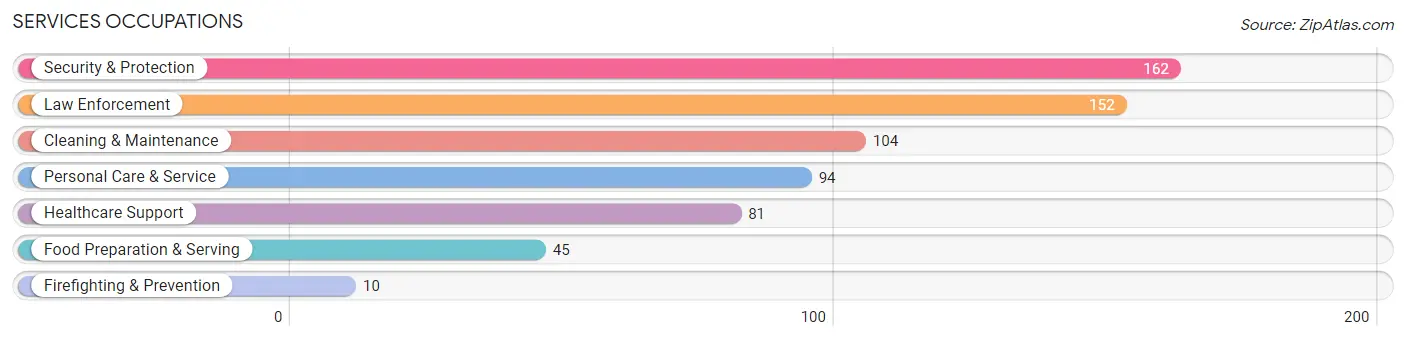
Services Occupations
The most common Services occupations in Florence are Security & Protection (162 | 8.4%), Law Enforcement (152 | 7.9%), Cleaning & Maintenance (104 | 5.4%), Personal Care & Service (94 | 4.9%), and Healthcare Support (81 | 4.2%).
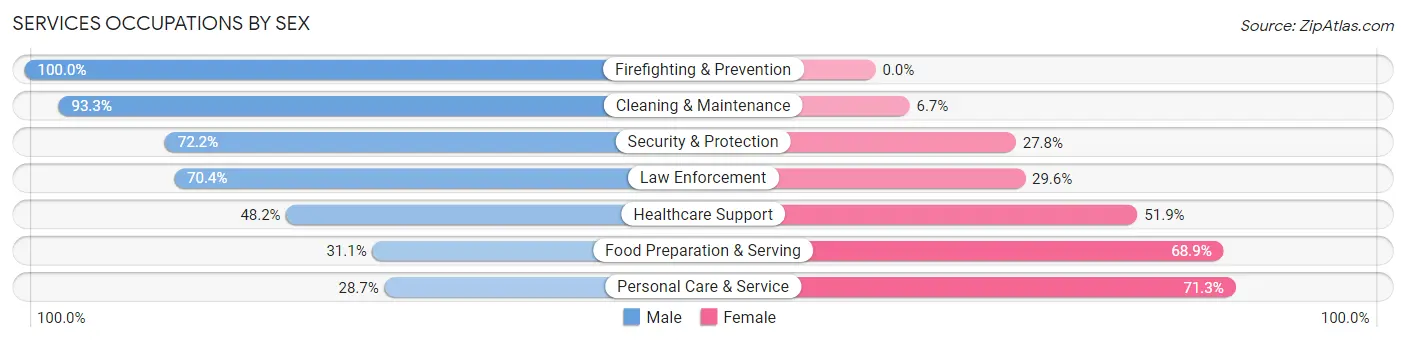
Services Occupations by Sex
Within the Services occupations in Florence, the most male-oriented occupations are Firefighting & Prevention (100.0%), Cleaning & Maintenance (93.3%), and Security & Protection (72.2%), while the most female-oriented occupations are Personal Care & Service (71.3%), Food Preparation & Serving (68.9%), and Healthcare Support (51.8%).
| Occupation | Male | Female |
| Healthcare Support | 39 (48.1%) | 42 (51.8%) |
| Security & Protection | 117 (72.2%) | 45 (27.8%) |
| Firefighting & Prevention | 10 (100.0%) | 0 (0.0%) |
| Law Enforcement | 107 (70.4%) | 45 (29.6%) |
| Food Preparation & Serving | 14 (31.1%) | 31 (68.9%) |
| Cleaning & Maintenance | 97 (93.3%) | 7 (6.7%) |
| Personal Care & Service | 27 (28.7%) | 67 (71.3%) |
| Total (Category) | 294 (60.5%) | 192 (39.5%) |
| Total (Overall) | 1,211 (63.0%) | 710 (37.0%) |
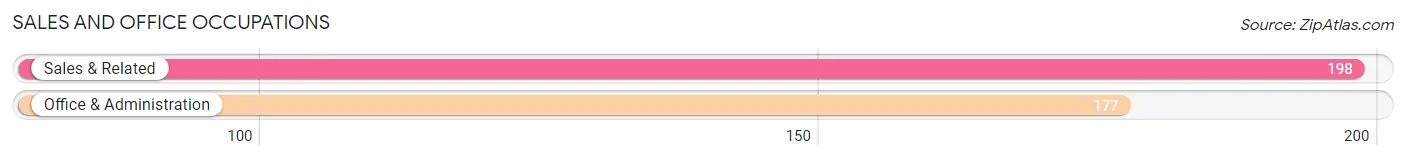
Sales and Office Occupations
The most common Sales and Office occupations in Florence are Sales & Related (198 | 10.3%), and Office & Administration (177 | 9.2%).
Sales and Office Occupations by Sex
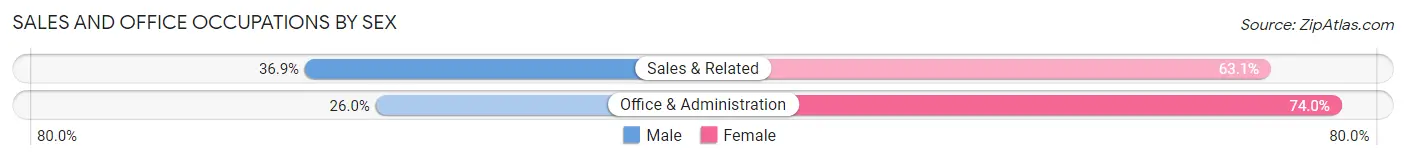
| Occupation | Male | Female |
| Sales & Related | 73 (36.9%) | 125 (63.1%) |
| Office & Administration | 46 (26.0%) | 131 (74.0%) |
| Total (Category) | 119 (31.7%) | 256 (68.3%) |
| Total (Overall) | 1,211 (63.0%) | 710 (37.0%) |
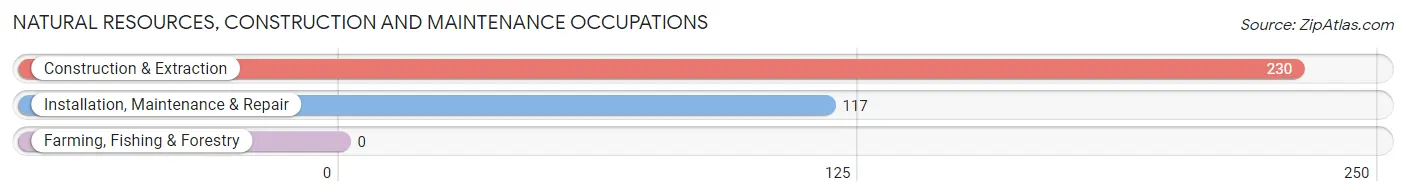
Natural Resources, Construction and Maintenance Occupations
The most common Natural Resources, Construction and Maintenance occupations in Florence are Construction & Extraction (230 | 12.0%), and Installation, Maintenance & Repair (117 | 6.1%).
Natural Resources, Construction and Maintenance Occupations by Sex
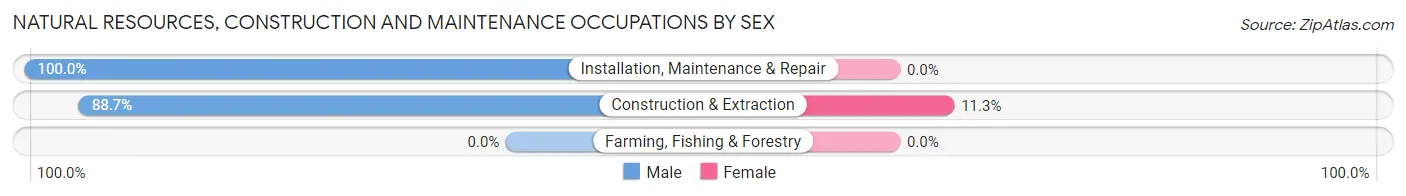
| Occupation | Male | Female |
| Farming, Fishing & Forestry | 0 (0.0%) | 0 (0.0%) |
| Construction & Extraction | 204 (88.7%) | 26 (11.3%) |
| Installation, Maintenance & Repair | 117 (100.0%) | 0 (0.0%) |
| Total (Category) | 321 (92.5%) | 26 (7.5%) |
| Total (Overall) | 1,211 (63.0%) | 710 (37.0%) |
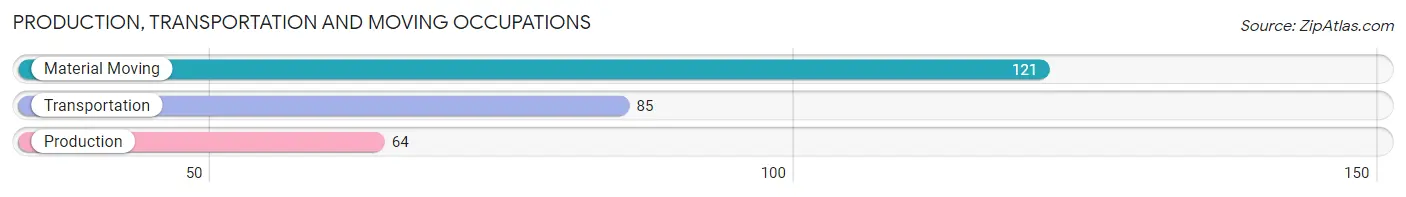
Production, Transportation and Moving Occupations
The most common Production, Transportation and Moving occupations in Florence are Material Moving (121 | 6.3%), Transportation (85 | 4.4%), and Production (64 | 3.3%).
Production, Transportation and Moving Occupations by Sex
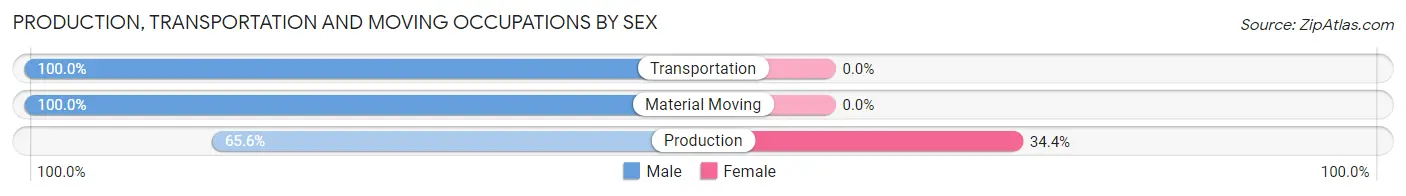
| Occupation | Male | Female |
| Production | 42 (65.6%) | 22 (34.4%) |
| Transportation | 85 (100.0%) | 0 (0.0%) |
| Material Moving | 121 (100.0%) | 0 (0.0%) |
| Total (Category) | 248 (91.8%) | 22 (8.2%) |
| Total (Overall) | 1,211 (63.0%) | 710 (37.0%) |
Employment Industries by Sex in Florence
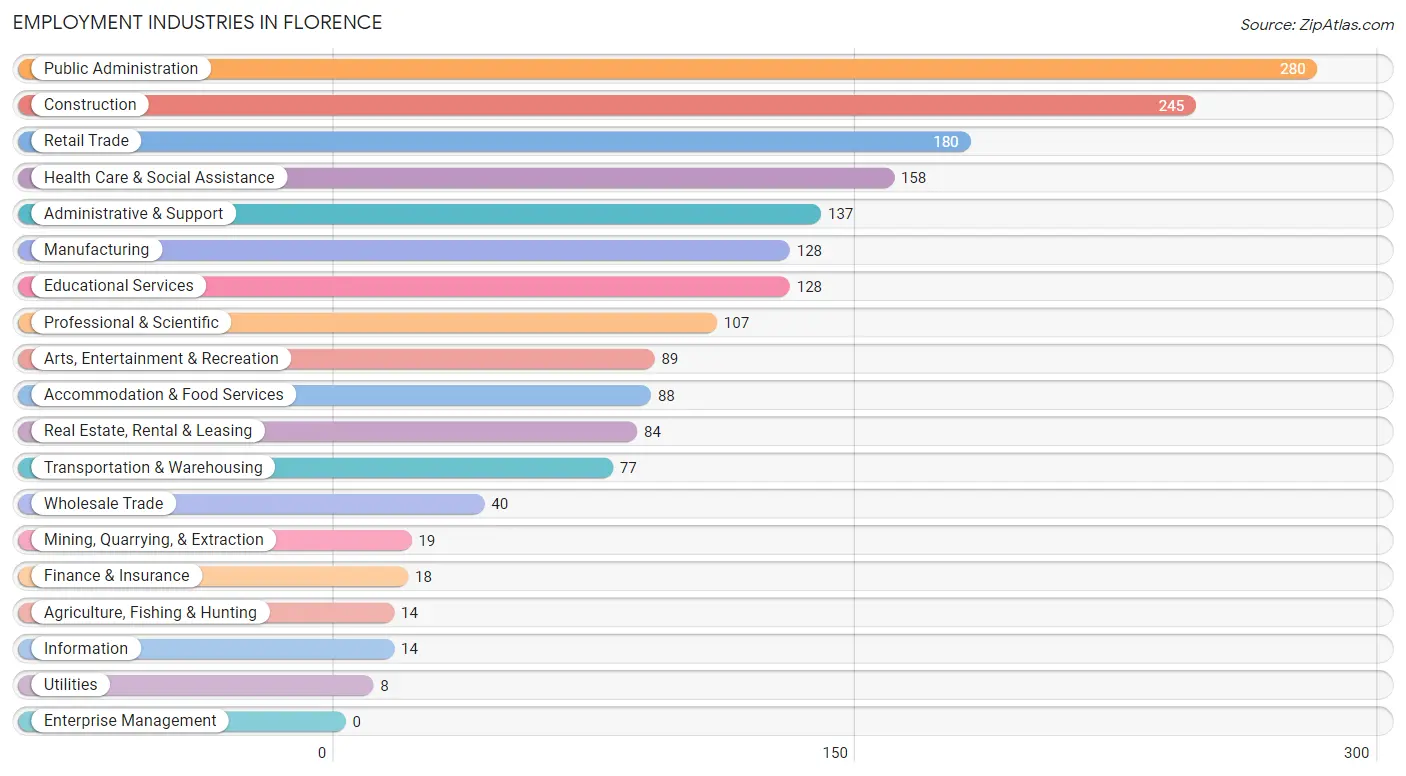
Employment Industries in Florence
The major employment industries in Florence include Public Administration (280 | 14.6%), Construction (245 | 12.8%), Retail Trade (180 | 9.4%), Health Care & Social Assistance (158 | 8.2%), and Administrative & Support (137 | 7.1%).
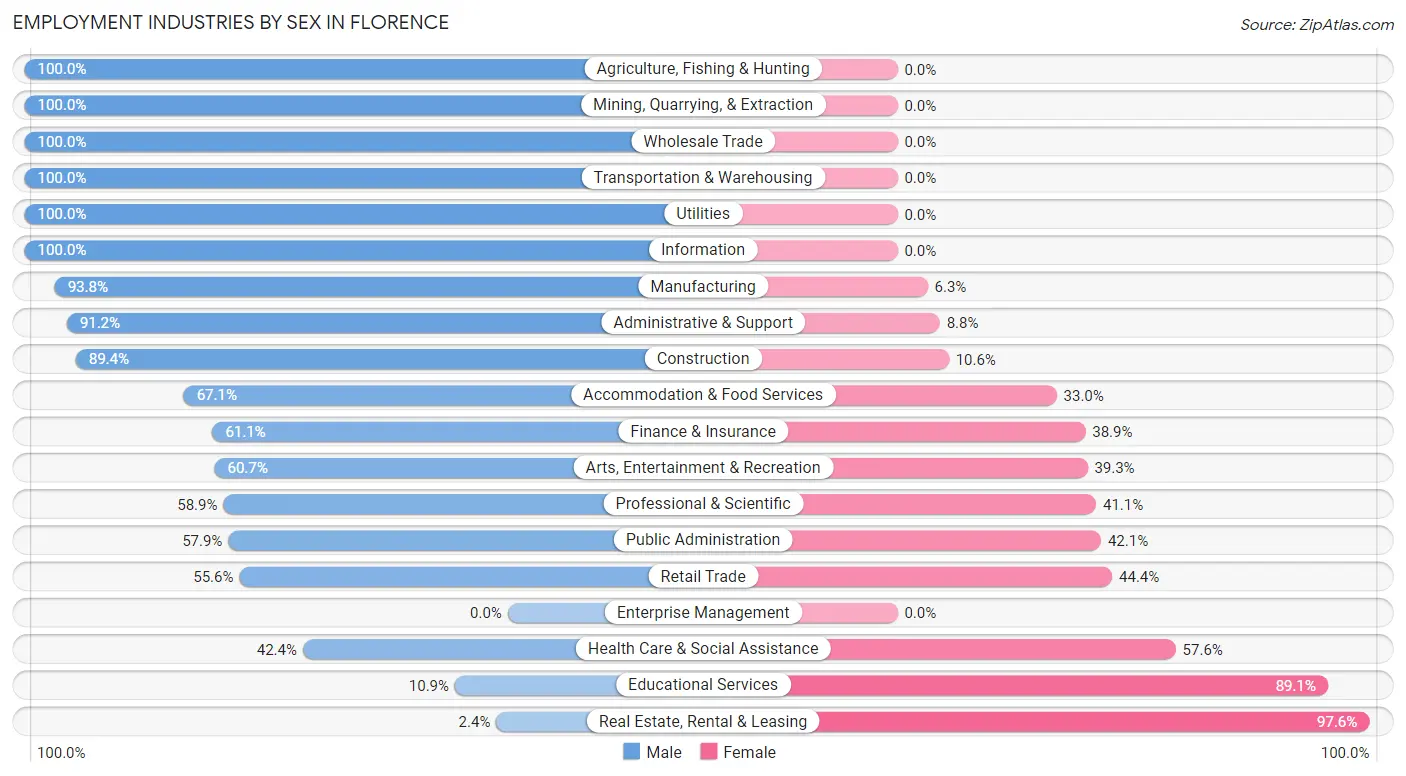
Employment Industries by Sex in Florence
The Florence industries that see more men than women are Agriculture, Fishing & Hunting (100.0%), Mining, Quarrying, & Extraction (100.0%), and Wholesale Trade (100.0%), whereas the industries that tend to have a higher number of women are Real Estate, Rental & Leasing (97.6%), Educational Services (89.1%), and Health Care & Social Assistance (57.6%).
| Industry | Male | Female |
| Agriculture, Fishing & Hunting | 14 (100.0%) | 0 (0.0%) |
| Mining, Quarrying, & Extraction | 19 (100.0%) | 0 (0.0%) |
| Construction | 219 (89.4%) | 26 (10.6%) |
| Manufacturing | 120 (93.8%) | 8 (6.2%) |
| Wholesale Trade | 40 (100.0%) | 0 (0.0%) |
| Retail Trade | 100 (55.6%) | 80 (44.4%) |
| Transportation & Warehousing | 77 (100.0%) | 0 (0.0%) |
| Utilities | 8 (100.0%) | 0 (0.0%) |
| Information | 14 (100.0%) | 0 (0.0%) |
| Finance & Insurance | 11 (61.1%) | 7 (38.9%) |
| Real Estate, Rental & Leasing | 2 (2.4%) | 82 (97.6%) |
| Professional & Scientific | 63 (58.9%) | 44 (41.1%) |
| Enterprise Management | 0 (0.0%) | 0 (0.0%) |
| Administrative & Support | 125 (91.2%) | 12 (8.8%) |
| Educational Services | 14 (10.9%) | 114 (89.1%) |
| Health Care & Social Assistance | 67 (42.4%) | 91 (57.6%) |
| Arts, Entertainment & Recreation | 54 (60.7%) | 35 (39.3%) |
| Accommodation & Food Services | 59 (67.0%) | 29 (33.0%) |
| Public Administration | 162 (57.9%) | 118 (42.1%) |
| Total | 1,211 (63.0%) | 710 (37.0%) |
Education in Florence
School Enrollment in Florence
The most common levels of schooling among the 828 students in Florence are high school (294 | 35.5%), elementary school (187 | 22.6%), and college / undergraduate (130 | 15.7%).
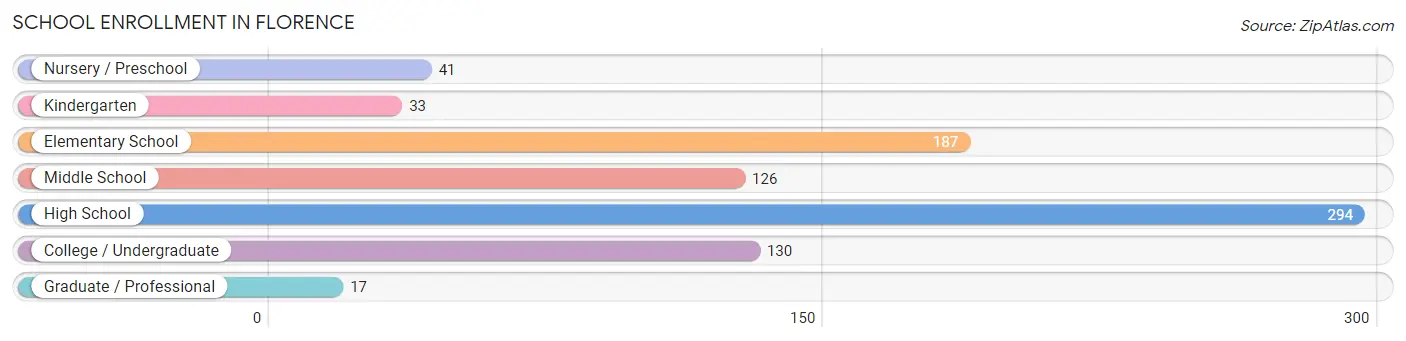
| School Level | # Students | % Students |
| Nursery / Preschool | 41 | 5.0% |
| Kindergarten | 33 | 4.0% |
| Elementary School | 187 | 22.6% |
| Middle School | 126 | 15.2% |
| High School | 294 | 35.5% |
| College / Undergraduate | 130 | 15.7% |
| Graduate / Professional | 17 | 2.1% |
| Total | 828 | 100.0% |
School Enrollment by Age by Funding Source in Florence
Out of a total of 828 students who are enrolled in schools in Florence, 71 (8.6%) attend a private institution, while the remaining 757 (91.4%) are enrolled in public schools. The age group of 20 to 24 year olds has the highest likelihood of being enrolled in private schools, with 10 (34.5% in the age bracket) enrolled. Conversely, the age group of 18 to 19 year olds has the lowest likelihood of being enrolled in a private school, with 220 (100.0% in the age bracket) attending a public institution.
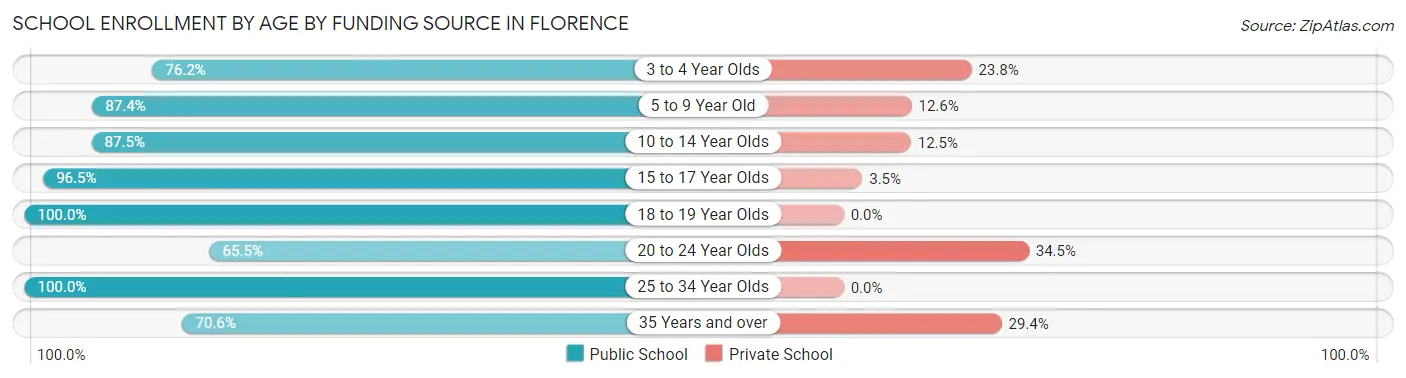
| Age Bracket | Public School | Private School |
| 3 to 4 Year Olds | 16 (76.2%) | 5 (23.8%) |
| 5 to 9 Year Old | 159 (87.4%) | 23 (12.6%) |
| 10 to 14 Year Olds | 161 (87.5%) | 23 (12.5%) |
| 15 to 17 Year Olds | 139 (96.5%) | 5 (3.5%) |
| 18 to 19 Year Olds | 220 (100.0%) | 0 (0.0%) |
| 20 to 24 Year Olds | 19 (65.5%) | 10 (34.5%) |
| 25 to 34 Year Olds | 31 (100.0%) | 0 (0.0%) |
| 35 Years and over | 12 (70.6%) | 5 (29.4%) |
| Total | 757 (91.4%) | 71 (8.6%) |
Educational Attainment by Field of Study in Florence
Business (90 | 13.7%), science & technology (77 | 11.7%), communications (65 | 9.9%), psychology (62 | 9.4%), and physical & health sciences (60 | 9.1%) are the most common fields of study among 658 individuals in Florence who have obtained a bachelor's degree or higher.
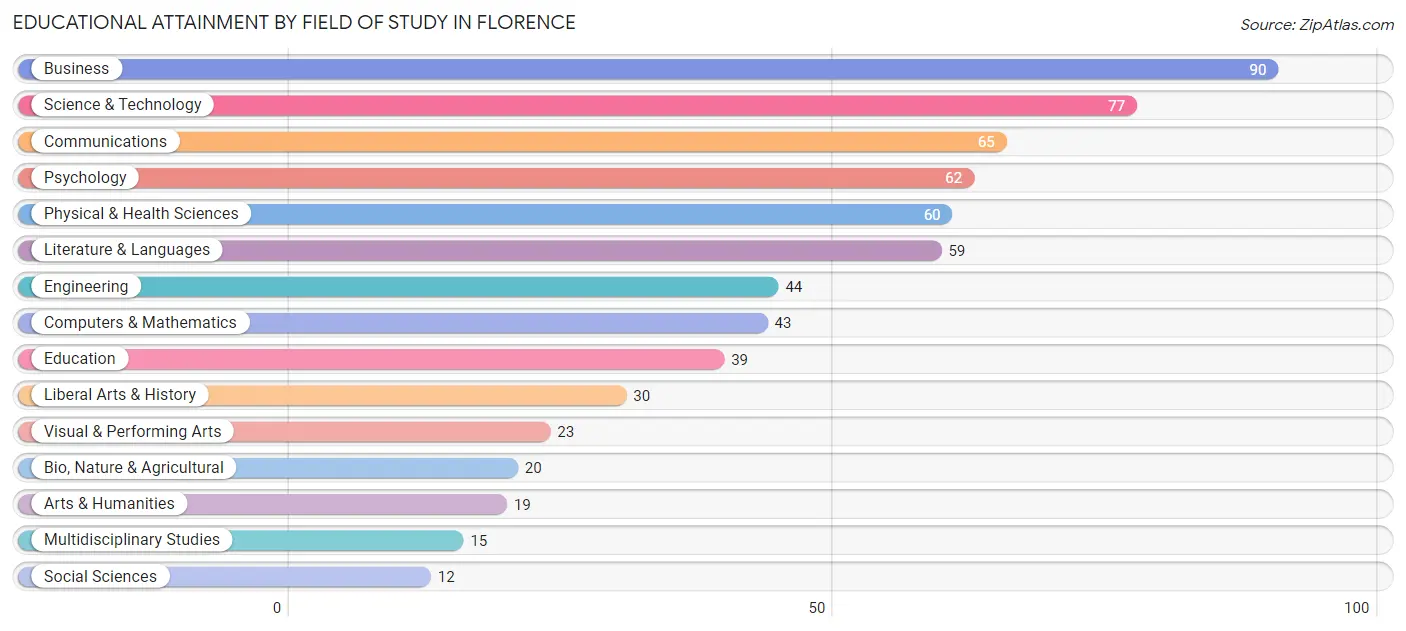
| Field of Study | # Graduates | % Graduates |
| Computers & Mathematics | 43 | 6.5% |
| Bio, Nature & Agricultural | 20 | 3.0% |
| Physical & Health Sciences | 60 | 9.1% |
| Psychology | 62 | 9.4% |
| Social Sciences | 12 | 1.8% |
| Engineering | 44 | 6.7% |
| Multidisciplinary Studies | 15 | 2.3% |
| Science & Technology | 77 | 11.7% |
| Business | 90 | 13.7% |
| Education | 39 | 5.9% |
| Literature & Languages | 59 | 9.0% |
| Liberal Arts & History | 30 | 4.6% |
| Visual & Performing Arts | 23 | 3.5% |
| Communications | 65 | 9.9% |
| Arts & Humanities | 19 | 2.9% |
| Total | 658 | 100.0% |
Transportation & Commute in Florence
Vehicle Availability by Sex in Florence
The most prevalent vehicle ownership categories in Florence are males with 2 vehicles (418, accounting for 35.6%) and females with 2 vehicles (284, making up 59.0%).
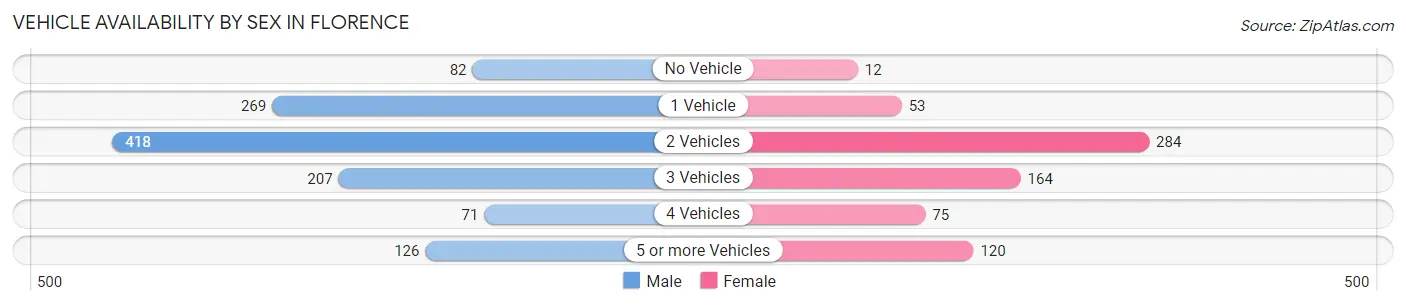
| Vehicles Available | Male | Female |
| No Vehicle | 82 (7.0%) | 12 (1.7%) |
| 1 Vehicle | 269 (22.9%) | 53 (7.5%) |
| 2 Vehicles | 418 (35.6%) | 284 (40.1%) |
| 3 Vehicles | 207 (17.6%) | 164 (23.2%) |
| 4 Vehicles | 71 (6.0%) | 75 (10.6%) |
| 5 or more Vehicles | 126 (10.7%) | 120 (17.0%) |
| Total | 1,173 (100.0%) | 708 (100.0%) |
Commute Time in Florence
The most frequently occuring commute durations in Florence are 20 to 24 minutes (303 commuters, 17.8%), 15 to 19 minutes (277 commuters, 16.3%), and 5 to 9 minutes (248 commuters, 14.6%).
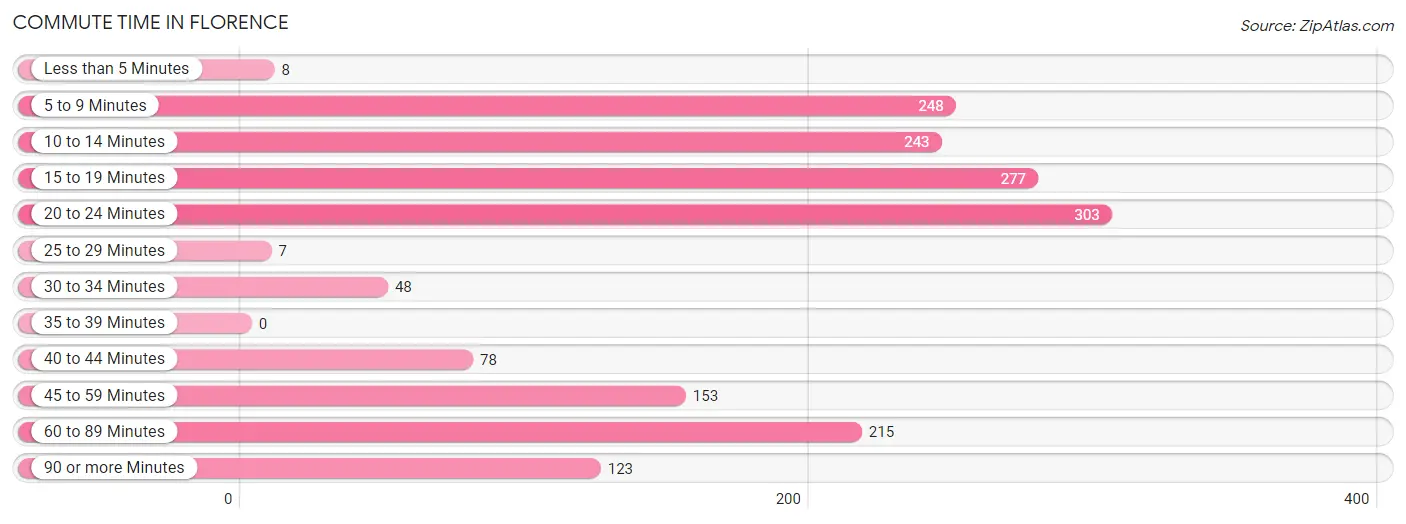
| Commute Time | # Commuters | % Commuters |
| Less than 5 Minutes | 8 | 0.5% |
| 5 to 9 Minutes | 248 | 14.6% |
| 10 to 14 Minutes | 243 | 14.3% |
| 15 to 19 Minutes | 277 | 16.3% |
| 20 to 24 Minutes | 303 | 17.8% |
| 25 to 29 Minutes | 7 | 0.4% |
| 30 to 34 Minutes | 48 | 2.8% |
| 35 to 39 Minutes | 0 | 0.0% |
| 40 to 44 Minutes | 78 | 4.6% |
| 45 to 59 Minutes | 153 | 9.0% |
| 60 to 89 Minutes | 215 | 12.6% |
| 90 or more Minutes | 123 | 7.2% |
Commute Time by Sex in Florence
The most common commute times in Florence are 60 to 89 minutes (182 commuters, 17.1%) for males and 20 to 24 minutes (203 commuters, 31.9%) for females.
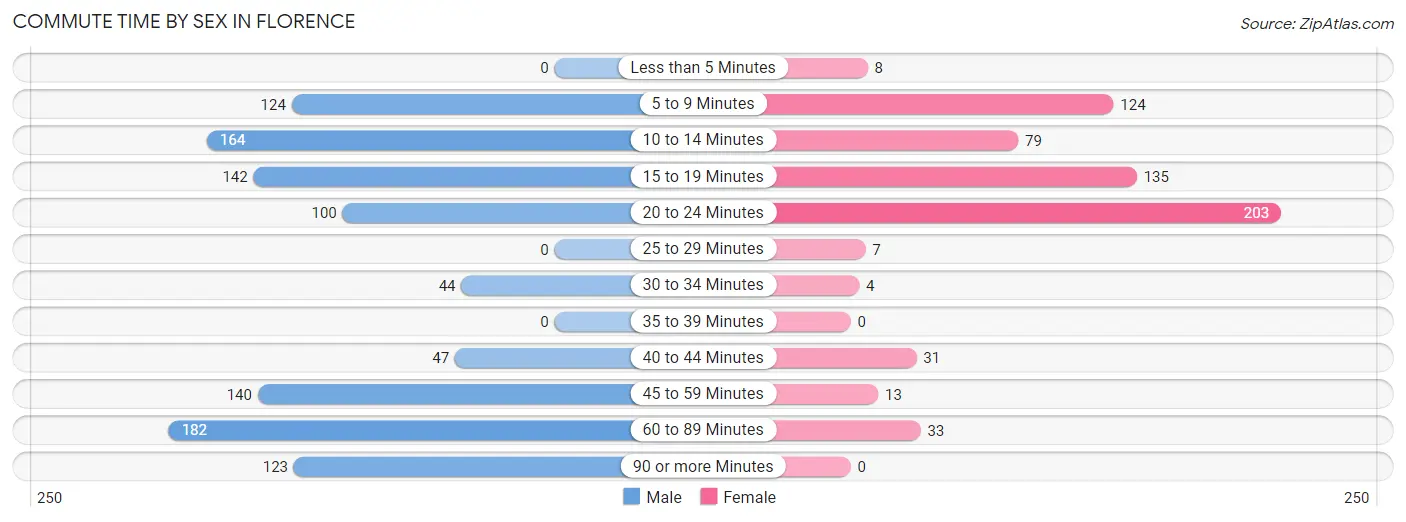
| Commute Time | Male | Female |
| Less than 5 Minutes | 0 (0.0%) | 8 (1.3%) |
| 5 to 9 Minutes | 124 (11.6%) | 124 (19.5%) |
| 10 to 14 Minutes | 164 (15.4%) | 79 (12.4%) |
| 15 to 19 Minutes | 142 (13.3%) | 135 (21.2%) |
| 20 to 24 Minutes | 100 (9.4%) | 203 (31.9%) |
| 25 to 29 Minutes | 0 (0.0%) | 7 (1.1%) |
| 30 to 34 Minutes | 44 (4.1%) | 4 (0.6%) |
| 35 to 39 Minutes | 0 (0.0%) | 0 (0.0%) |
| 40 to 44 Minutes | 47 (4.4%) | 31 (4.9%) |
| 45 to 59 Minutes | 140 (13.1%) | 13 (2.0%) |
| 60 to 89 Minutes | 182 (17.1%) | 33 (5.2%) |
| 90 or more Minutes | 123 (11.5%) | 0 (0.0%) |
Time of Departure to Work by Sex in Florence
The most frequent times of departure to work in Florence are 6:00 AM to 6:29 AM (150, 14.1%) for males and 7:00 AM to 7:29 AM (226, 35.5%) for females.
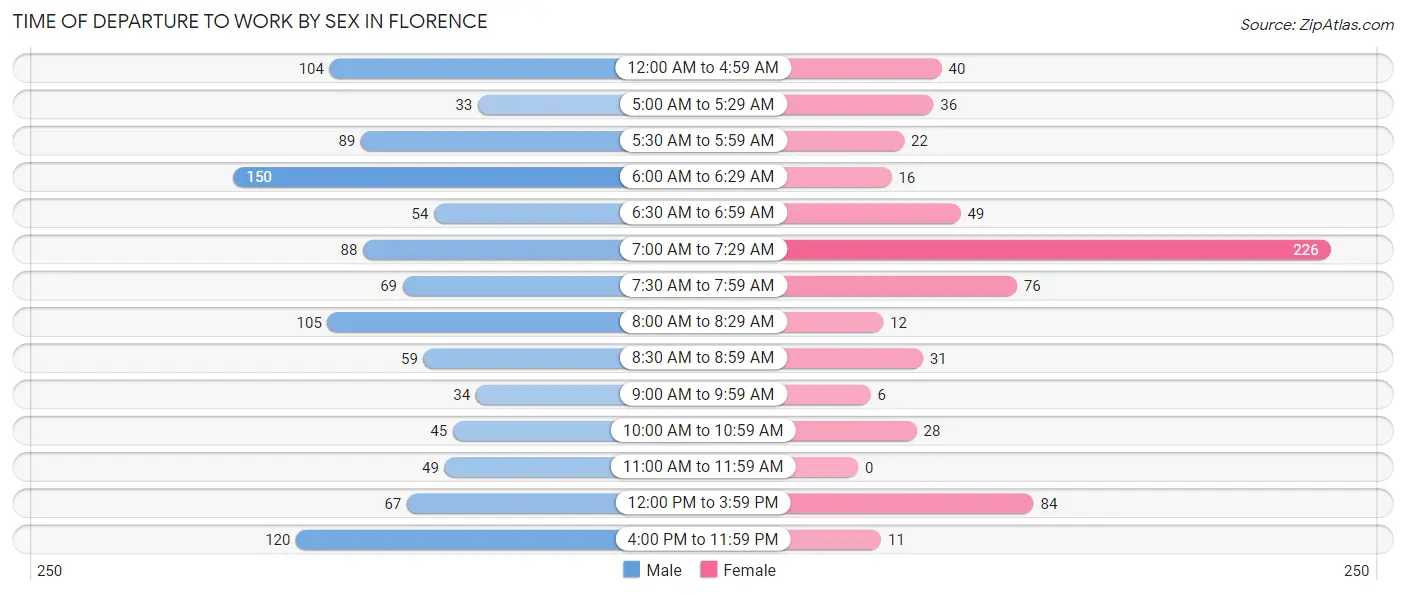
| Time of Departure | Male | Female |
| 12:00 AM to 4:59 AM | 104 (9.8%) | 40 (6.3%) |
| 5:00 AM to 5:29 AM | 33 (3.1%) | 36 (5.7%) |
| 5:30 AM to 5:59 AM | 89 (8.4%) | 22 (3.5%) |
| 6:00 AM to 6:29 AM | 150 (14.1%) | 16 (2.5%) |
| 6:30 AM to 6:59 AM | 54 (5.1%) | 49 (7.7%) |
| 7:00 AM to 7:29 AM | 88 (8.3%) | 226 (35.5%) |
| 7:30 AM to 7:59 AM | 69 (6.5%) | 76 (11.9%) |
| 8:00 AM to 8:29 AM | 105 (9.9%) | 12 (1.9%) |
| 8:30 AM to 8:59 AM | 59 (5.5%) | 31 (4.9%) |
| 9:00 AM to 9:59 AM | 34 (3.2%) | 6 (0.9%) |
| 10:00 AM to 10:59 AM | 45 (4.2%) | 28 (4.4%) |
| 11:00 AM to 11:59 AM | 49 (4.6%) | 0 (0.0%) |
| 12:00 PM to 3:59 PM | 67 (6.3%) | 84 (13.2%) |
| 4:00 PM to 11:59 PM | 120 (11.3%) | 11 (1.7%) |
| Total | 1,066 (100.0%) | 637 (100.0%) |
Housing Occupancy in Florence
Occupancy by Ownership in Florence
Of the total 1,652 dwellings in Florence, owner-occupied units account for 1,117 (67.6%), while renter-occupied units make up 535 (32.4%).
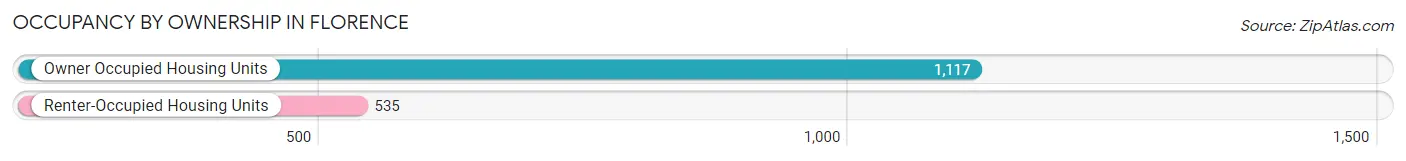
| Occupancy | # Housing Units | % Housing Units |
| Owner Occupied Housing Units | 1,117 | 67.6% |
| Renter-Occupied Housing Units | 535 | 32.4% |
| Total Occupied Housing Units | 1,652 | 100.0% |
Occupancy by Household Size in Florence
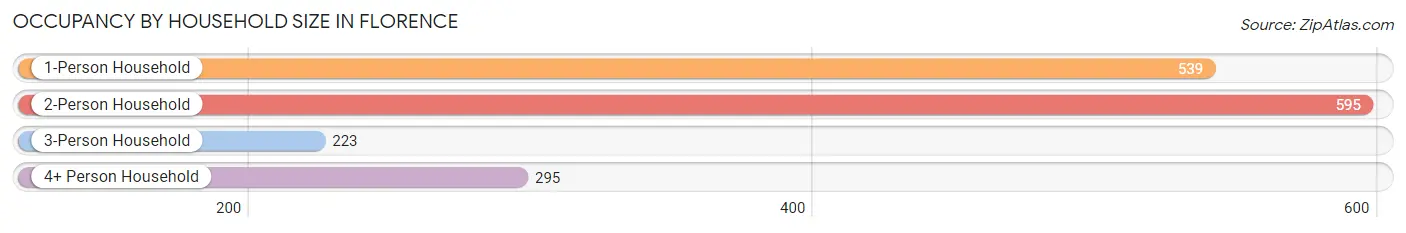
| Household Size | # Housing Units | % Housing Units |
| 1-Person Household | 539 | 32.6% |
| 2-Person Household | 595 | 36.0% |
| 3-Person Household | 223 | 13.5% |
| 4+ Person Household | 295 | 17.9% |
| Total Housing Units | 1,652 | 100.0% |
Occupancy by Ownership by Household Size in Florence
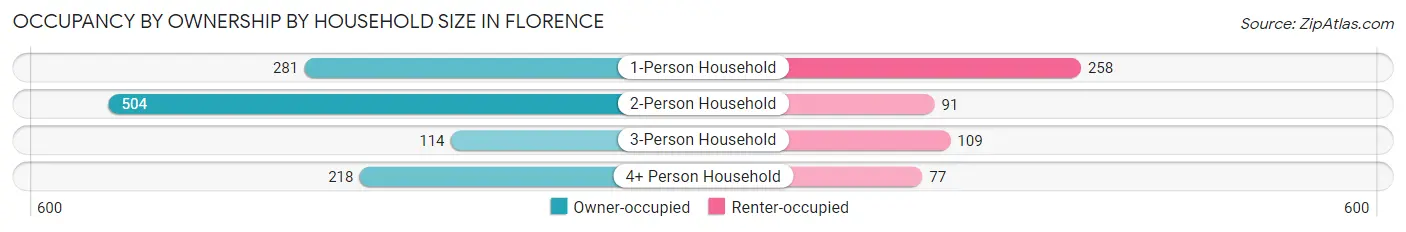
| Household Size | Owner-occupied | Renter-occupied |
| 1-Person Household | 281 (52.1%) | 258 (47.9%) |
| 2-Person Household | 504 (84.7%) | 91 (15.3%) |
| 3-Person Household | 114 (51.1%) | 109 (48.9%) |
| 4+ Person Household | 218 (73.9%) | 77 (26.1%) |
| Total Housing Units | 1,117 (67.6%) | 535 (32.4%) |
Occupancy by Educational Attainment in Florence
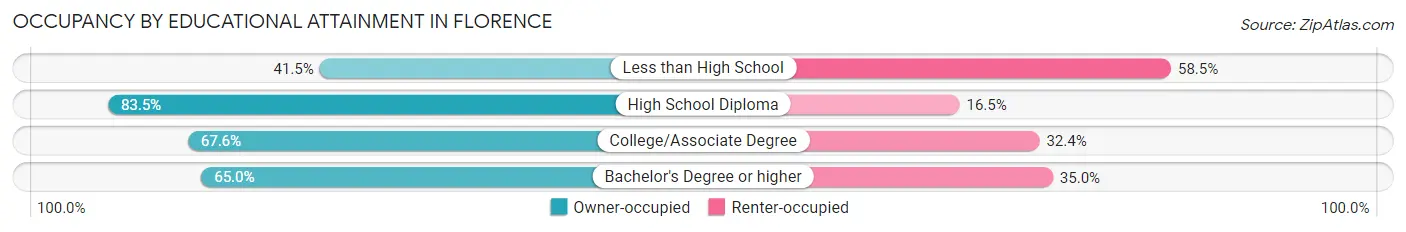
| Household Size | Owner-occupied | Renter-occupied |
| Less than High School | 76 (41.5%) | 107 (58.5%) |
| High School Diploma | 303 (83.5%) | 60 (16.5%) |
| College/Associate Degree | 497 (67.6%) | 238 (32.4%) |
| Bachelor's Degree or higher | 241 (65.0%) | 130 (35.0%) |
Occupancy by Age of Householder in Florence
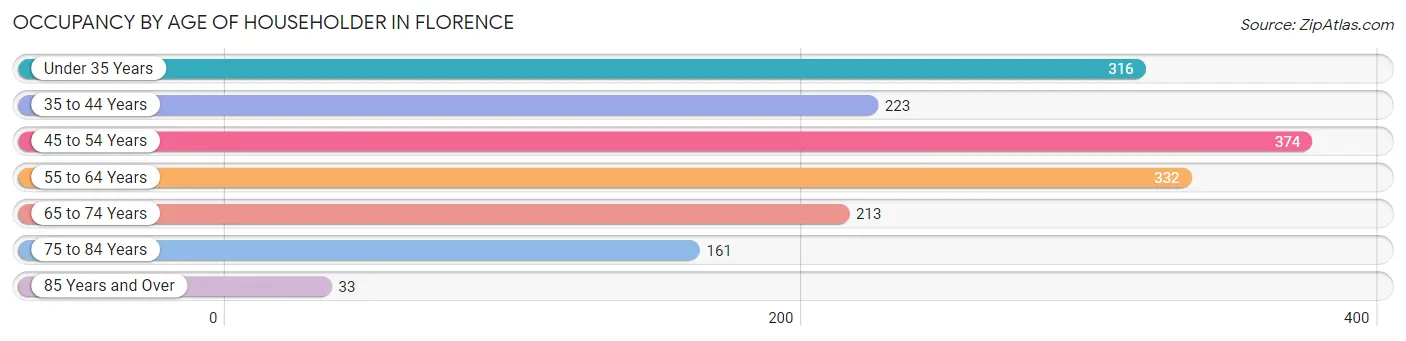
| Age Bracket | # Households | % Households |
| Under 35 Years | 316 | 19.1% |
| 35 to 44 Years | 223 | 13.5% |
| 45 to 54 Years | 374 | 22.6% |
| 55 to 64 Years | 332 | 20.1% |
| 65 to 74 Years | 213 | 12.9% |
| 75 to 84 Years | 161 | 9.8% |
| 85 Years and Over | 33 | 2.0% |
| Total | 1,652 | 100.0% |
Housing Finances in Florence
Median Income by Occupancy in Florence
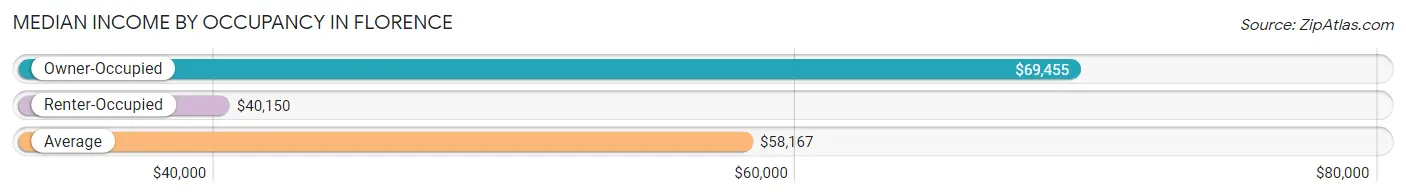
| Occupancy Type | # Households | Median Income |
| Owner-Occupied | 1,117 (67.6%) | $69,455 |
| Renter-Occupied | 535 (32.4%) | $40,150 |
| Average | 1,652 (100.0%) | $58,167 |
Occupancy by Householder Income Bracket in Florence
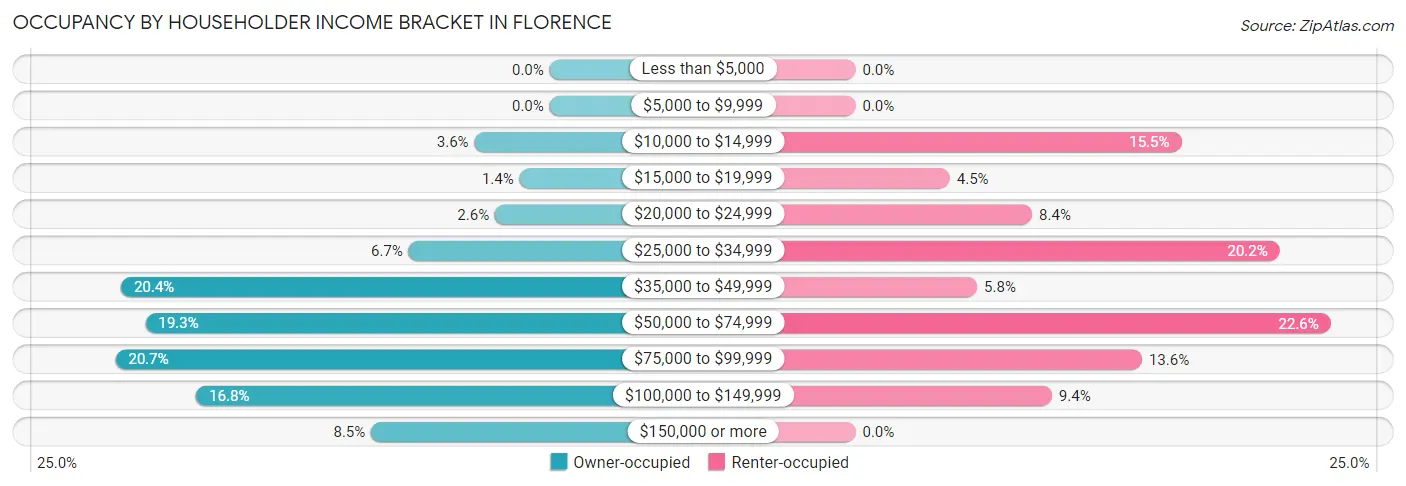
| Income Bracket | Owner-occupied | Renter-occupied |
| Less than $5,000 | 0 (0.0%) | 0 (0.0%) |
| $5,000 to $9,999 | 0 (0.0%) | 0 (0.0%) |
| $10,000 to $14,999 | 40 (3.6%) | 83 (15.5%) |
| $15,000 to $19,999 | 16 (1.4%) | 24 (4.5%) |
| $20,000 to $24,999 | 29 (2.6%) | 45 (8.4%) |
| $25,000 to $34,999 | 75 (6.7%) | 108 (20.2%) |
| $35,000 to $49,999 | 228 (20.4%) | 31 (5.8%) |
| $50,000 to $74,999 | 215 (19.3%) | 121 (22.6%) |
| $75,000 to $99,999 | 231 (20.7%) | 73 (13.6%) |
| $100,000 to $149,999 | 188 (16.8%) | 50 (9.3%) |
| $150,000 or more | 95 (8.5%) | 0 (0.0%) |
| Total | 1,117 (100.0%) | 535 (100.0%) |
Monthly Housing Cost Tiers in Florence
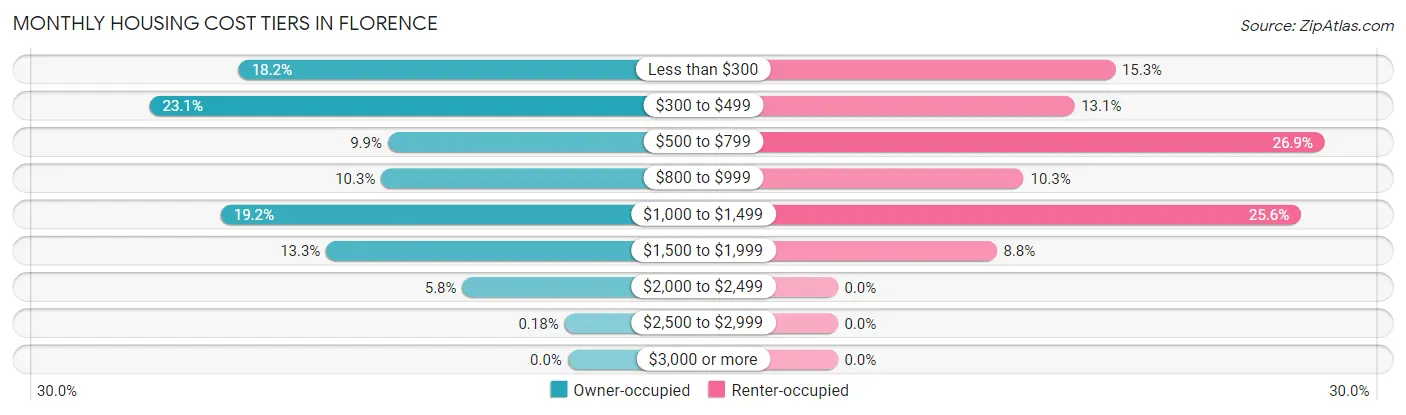
| Monthly Cost | Owner-occupied | Renter-occupied |
| Less than $300 | 203 (18.2%) | 82 (15.3%) |
| $300 to $499 | 258 (23.1%) | 70 (13.1%) |
| $500 to $799 | 111 (9.9%) | 144 (26.9%) |
| $800 to $999 | 115 (10.3%) | 55 (10.3%) |
| $1,000 to $1,499 | 214 (19.2%) | 137 (25.6%) |
| $1,500 to $1,999 | 149 (13.3%) | 47 (8.8%) |
| $2,000 to $2,499 | 65 (5.8%) | 0 (0.0%) |
| $2,500 to $2,999 | 2 (0.2%) | 0 (0.0%) |
| $3,000 or more | 0 (0.0%) | 0 (0.0%) |
| Total | 1,117 (100.0%) | 535 (100.0%) |
Physical Housing Characteristics in Florence
Housing Structures in Florence
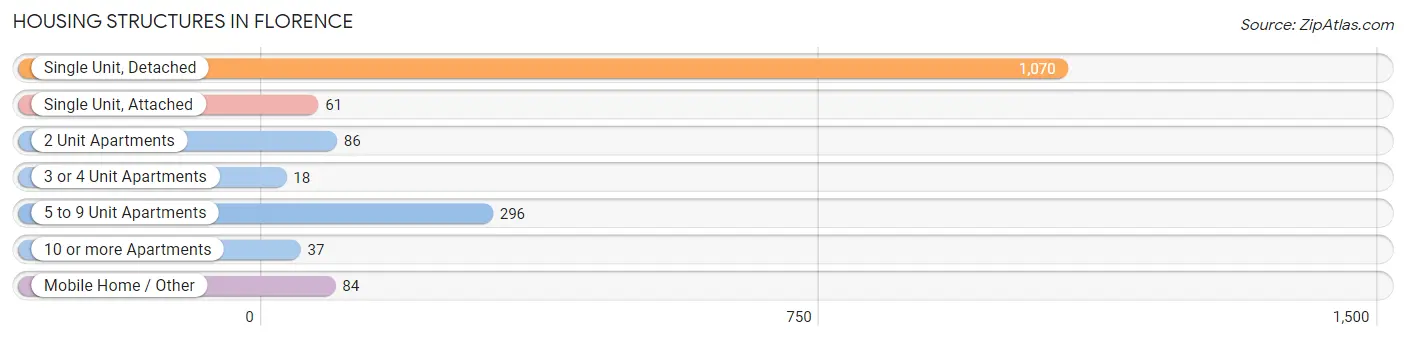
| Structure Type | # Housing Units | % Housing Units |
| Single Unit, Detached | 1,070 | 64.8% |
| Single Unit, Attached | 61 | 3.7% |
| 2 Unit Apartments | 86 | 5.2% |
| 3 or 4 Unit Apartments | 18 | 1.1% |
| 5 to 9 Unit Apartments | 296 | 17.9% |
| 10 or more Apartments | 37 | 2.2% |
| Mobile Home / Other | 84 | 5.1% |
| Total | 1,652 | 100.0% |
Housing Structures by Occupancy in Florence
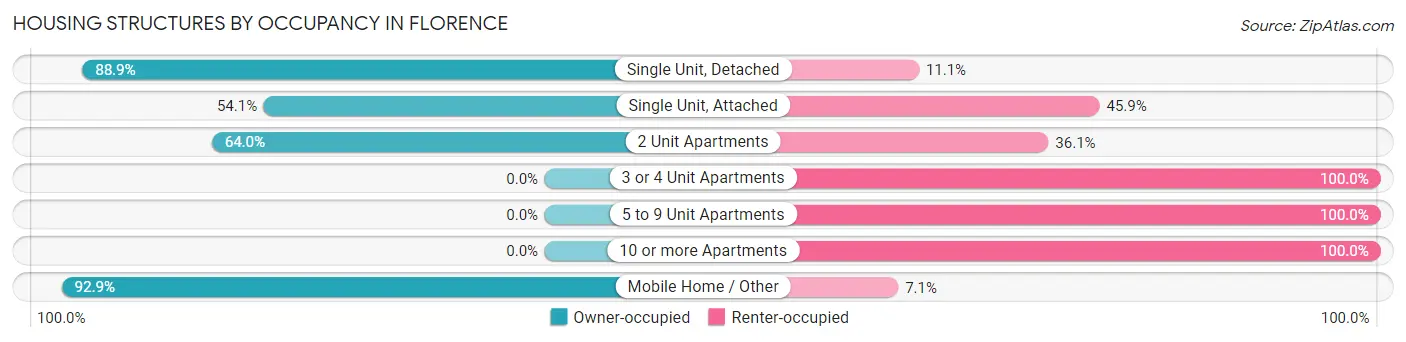
| Structure Type | Owner-occupied | Renter-occupied |
| Single Unit, Detached | 951 (88.9%) | 119 (11.1%) |
| Single Unit, Attached | 33 (54.1%) | 28 (45.9%) |
| 2 Unit Apartments | 55 (63.9%) | 31 (36.0%) |
| 3 or 4 Unit Apartments | 0 (0.0%) | 18 (100.0%) |
| 5 to 9 Unit Apartments | 0 (0.0%) | 296 (100.0%) |
| 10 or more Apartments | 0 (0.0%) | 37 (100.0%) |
| Mobile Home / Other | 78 (92.9%) | 6 (7.1%) |
| Total | 1,117 (67.6%) | 535 (32.4%) |
Housing Structures by Number of Rooms in Florence
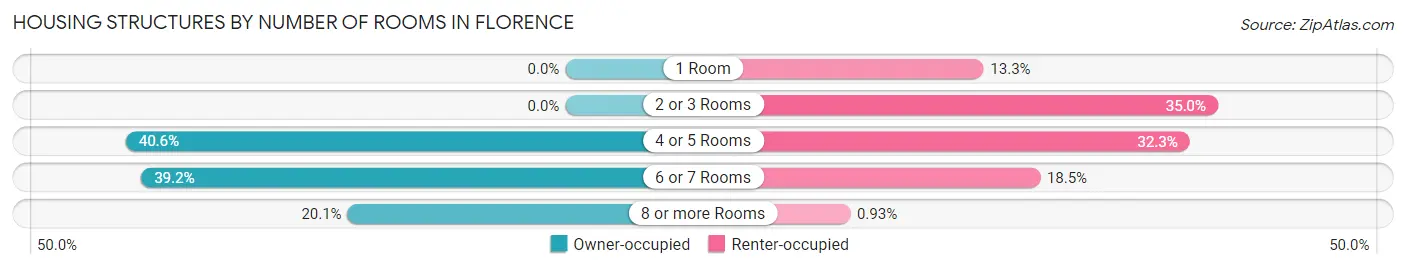
| Number of Rooms | Owner-occupied | Renter-occupied |
| 1 Room | 0 (0.0%) | 71 (13.3%) |
| 2 or 3 Rooms | 0 (0.0%) | 187 (34.9%) |
| 4 or 5 Rooms | 454 (40.6%) | 173 (32.3%) |
| 6 or 7 Rooms | 438 (39.2%) | 99 (18.5%) |
| 8 or more Rooms | 225 (20.1%) | 5 (0.9%) |
| Total | 1,117 (100.0%) | 535 (100.0%) |
Housing Structure by Heating Type in Florence
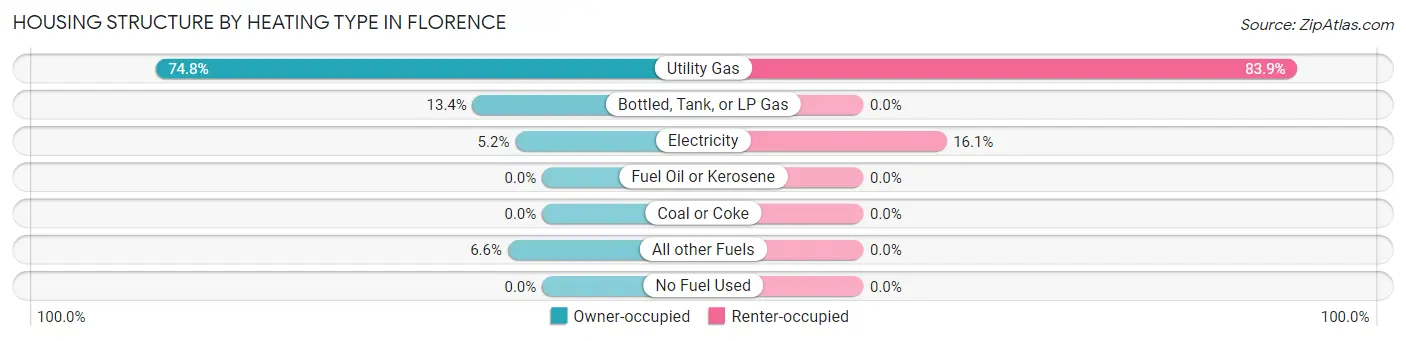
| Heating Type | Owner-occupied | Renter-occupied |
| Utility Gas | 835 (74.8%) | 449 (83.9%) |
| Bottled, Tank, or LP Gas | 150 (13.4%) | 0 (0.0%) |
| Electricity | 58 (5.2%) | 86 (16.1%) |
| Fuel Oil or Kerosene | 0 (0.0%) | 0 (0.0%) |
| Coal or Coke | 0 (0.0%) | 0 (0.0%) |
| All other Fuels | 74 (6.6%) | 0 (0.0%) |
| No Fuel Used | 0 (0.0%) | 0 (0.0%) |
| Total | 1,117 (100.0%) | 535 (100.0%) |
Household Vehicle Usage in Florence
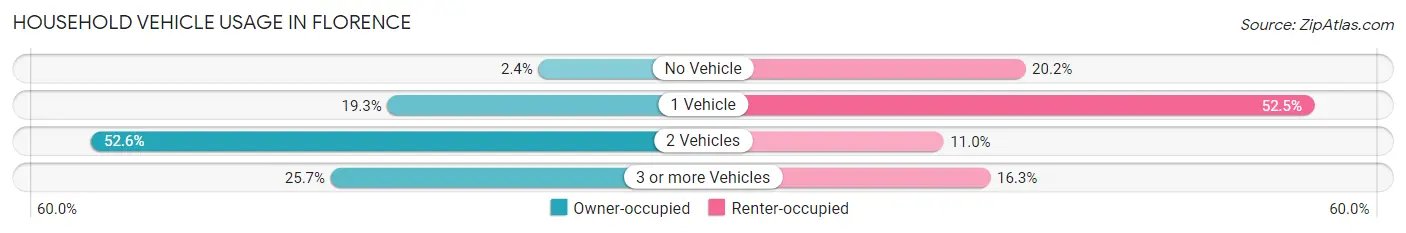
| Vehicles per Household | Owner-occupied | Renter-occupied |
| No Vehicle | 27 (2.4%) | 108 (20.2%) |
| 1 Vehicle | 216 (19.3%) | 281 (52.5%) |
| 2 Vehicles | 587 (52.5%) | 59 (11.0%) |
| 3 or more Vehicles | 287 (25.7%) | 87 (16.3%) |
| Total | 1,117 (100.0%) | 535 (100.0%) |
Real Estate & Mortgages in Florence
Real Estate and Mortgage Overview in Florence
| Characteristic | Without Mortgage | With Mortgage |
| Housing Units | 563 | 554 |
| Median Property Value | $230,600 | $211,300 |
| Median Household Income | $50,262 | $56 |
| Monthly Housing Costs | $407 | $0 |
| Real Estate Taxes | $930 | $0 |
Property Value by Mortgage Status in Florence
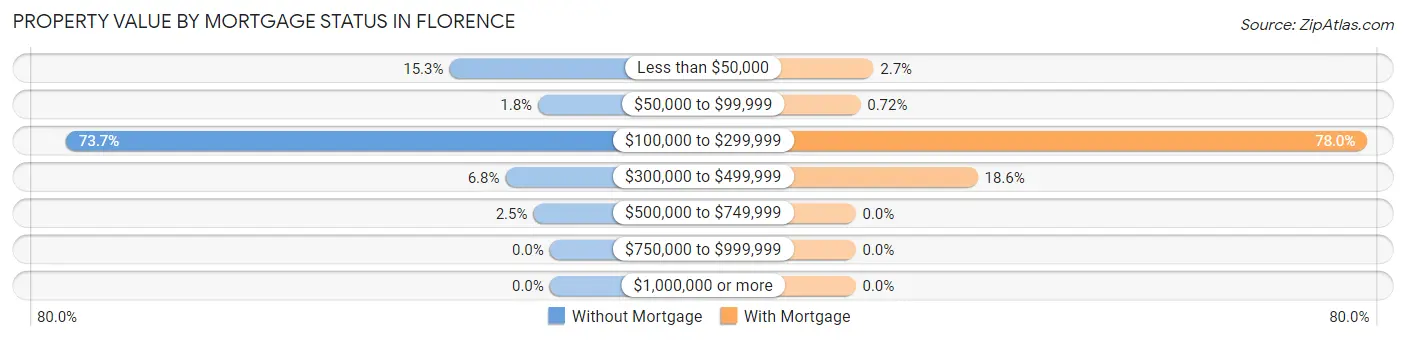
| Property Value | Without Mortgage | With Mortgage |
| Less than $50,000 | 86 (15.3%) | 15 (2.7%) |
| $50,000 to $99,999 | 10 (1.8%) | 4 (0.7%) |
| $100,000 to $299,999 | 415 (73.7%) | 432 (78.0%) |
| $300,000 to $499,999 | 38 (6.8%) | 103 (18.6%) |
| $500,000 to $749,999 | 14 (2.5%) | 0 (0.0%) |
| $750,000 to $999,999 | 0 (0.0%) | 0 (0.0%) |
| $1,000,000 or more | 0 (0.0%) | 0 (0.0%) |
| Total | 563 (100.0%) | 554 (100.0%) |
Household Income by Mortgage Status in Florence
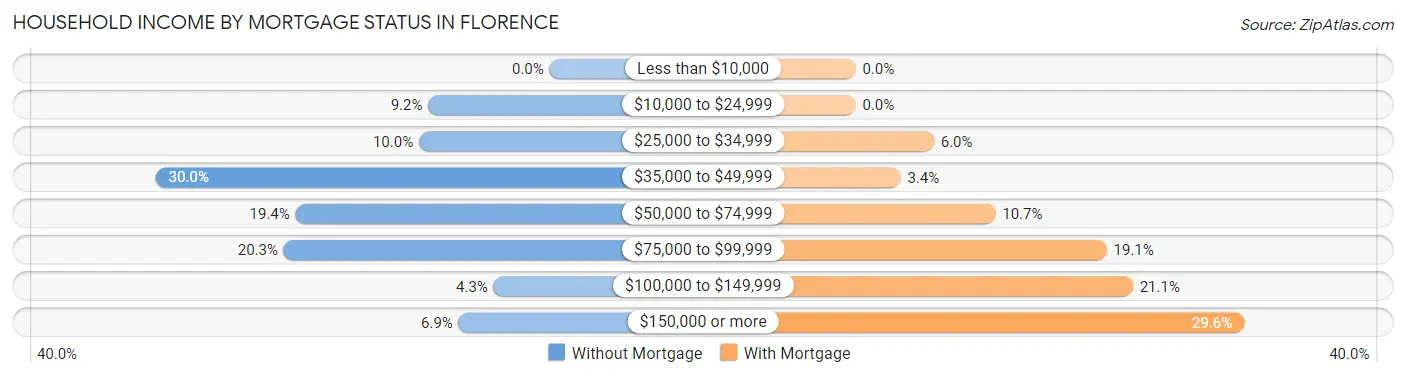
| Household Income | Without Mortgage | With Mortgage |
| Less than $10,000 | 0 (0.0%) | 0 (0.0%) |
| $10,000 to $24,999 | 52 (9.2%) | 0 (0.0%) |
| $25,000 to $34,999 | 56 (10.0%) | 33 (6.0%) |
| $35,000 to $49,999 | 169 (30.0%) | 19 (3.4%) |
| $50,000 to $74,999 | 109 (19.4%) | 59 (10.6%) |
| $75,000 to $99,999 | 114 (20.3%) | 106 (19.1%) |
| $100,000 to $149,999 | 24 (4.3%) | 117 (21.1%) |
| $150,000 or more | 39 (6.9%) | 164 (29.6%) |
| Total | 563 (100.0%) | 554 (100.0%) |
Property Value to Household Income Ratio in Florence
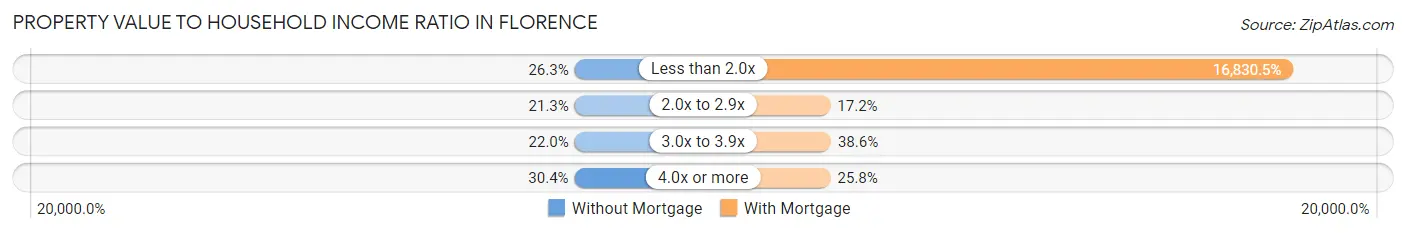
| Value-to-Income Ratio | Without Mortgage | With Mortgage |
| Less than 2.0x | 148 (26.3%) | 93,241 (16,830.5%) |
| 2.0x to 2.9x | 120 (21.3%) | 95 (17.2%) |
| 3.0x to 3.9x | 124 (22.0%) | 214 (38.6%) |
| 4.0x or more | 171 (30.4%) | 143 (25.8%) |
| Total | 563 (100.0%) | 554 (100.0%) |
Real Estate Taxes by Mortgage Status in Florence
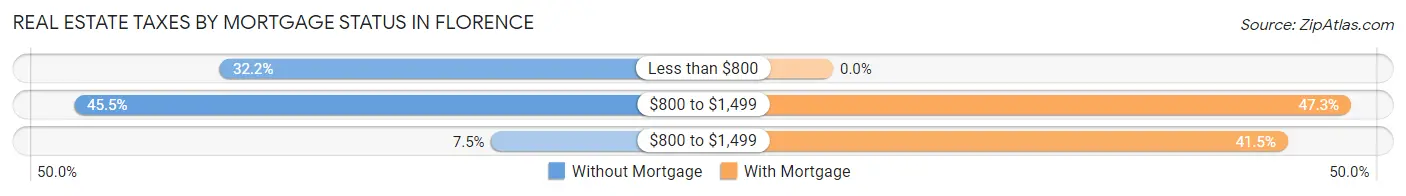
| Property Taxes | Without Mortgage | With Mortgage |
| Less than $800 | 181 (32.2%) | 0 (0.0%) |
| $800 to $1,499 | 256 (45.5%) | 262 (47.3%) |
| $800 to $1,499 | 42 (7.5%) | 230 (41.5%) |
| Total | 563 (100.0%) | 554 (100.0%) |
Health & Disability in Florence
Health Insurance Coverage by Age in Florence
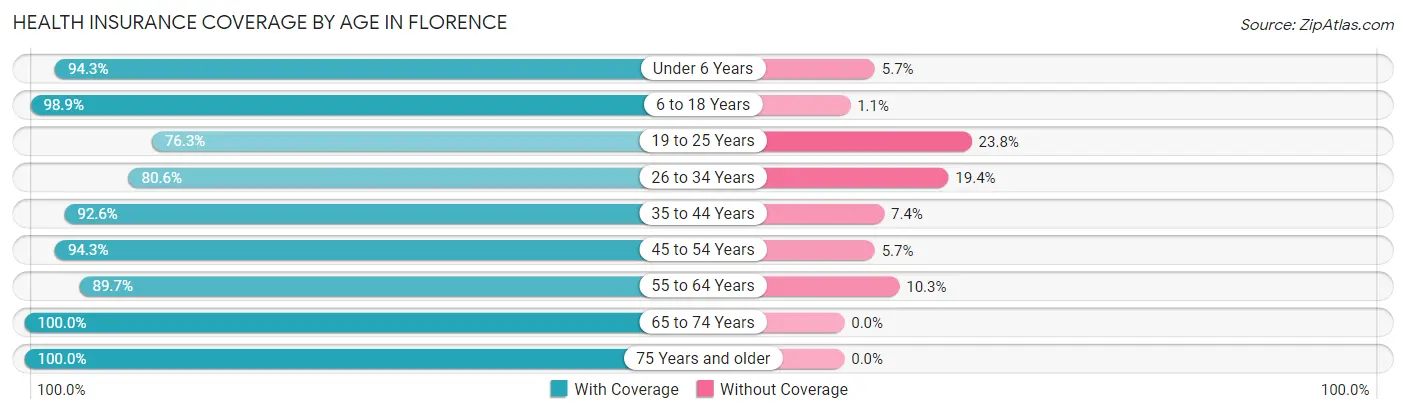
| Age Bracket | With Coverage | Without Coverage |
| Under 6 Years | 149 (94.3%) | 9 (5.7%) |
| 6 to 18 Years | 628 (98.9%) | 7 (1.1%) |
| 19 to 25 Years | 228 (76.2%) | 71 (23.7%) |
| 26 to 34 Years | 353 (80.6%) | 85 (19.4%) |
| 35 to 44 Years | 411 (92.6%) | 33 (7.4%) |
| 45 to 54 Years | 566 (94.3%) | 34 (5.7%) |
| 55 to 64 Years | 516 (89.7%) | 59 (10.3%) |
| 65 to 74 Years | 416 (100.0%) | 0 (0.0%) |
| 75 Years and older | 214 (100.0%) | 0 (0.0%) |
| Total | 3,481 (92.1%) | 298 (7.9%) |
Health Insurance Coverage by Citizenship Status in Florence
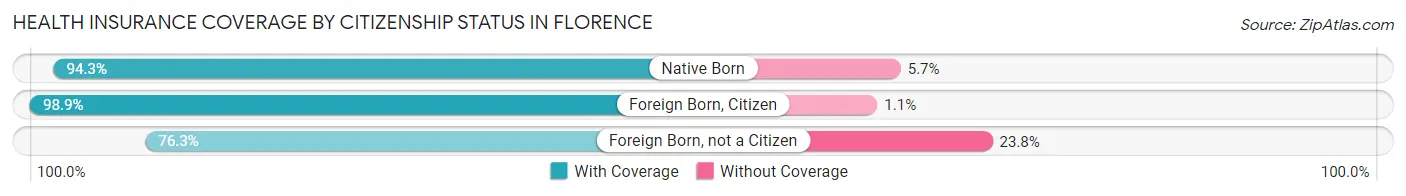
| Citizenship Status | With Coverage | Without Coverage |
| Native Born | 149 (94.3%) | 9 (5.7%) |
| Foreign Born, Citizen | 628 (98.9%) | 7 (1.1%) |
| Foreign Born, not a Citizen | 228 (76.2%) | 71 (23.7%) |
Health Insurance Coverage by Household Income in Florence
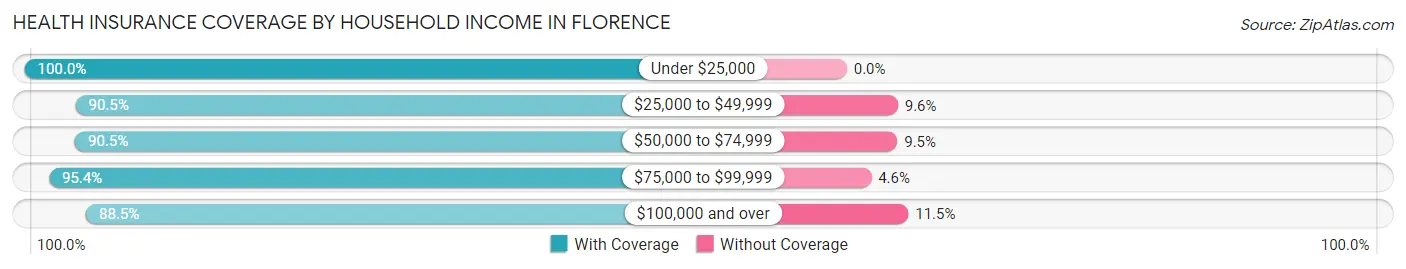
| Household Income | With Coverage | Without Coverage |
| Under $25,000 | 363 (100.0%) | 0 (0.0%) |
| $25,000 to $49,999 | 691 (90.4%) | 73 (9.6%) |
| $50,000 to $74,999 | 737 (90.5%) | 77 (9.5%) |
| $75,000 to $99,999 | 877 (95.4%) | 42 (4.6%) |
| $100,000 and over | 813 (88.5%) | 106 (11.5%) |
Public vs Private Health Insurance Coverage by Age in Florence
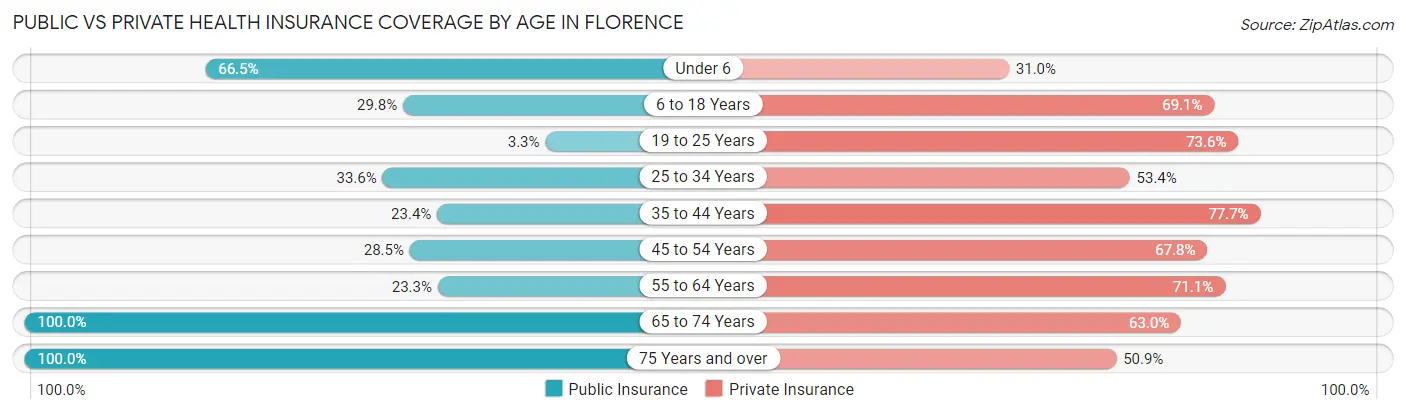
| Age Bracket | Public Insurance | Private Insurance |
| Under 6 | 105 (66.5%) | 49 (31.0%) |
| 6 to 18 Years | 189 (29.8%) | 439 (69.1%) |
| 19 to 25 Years | 10 (3.3%) | 220 (73.6%) |
| 25 to 34 Years | 147 (33.6%) | 234 (53.4%) |
| 35 to 44 Years | 104 (23.4%) | 345 (77.7%) |
| 45 to 54 Years | 171 (28.5%) | 407 (67.8%) |
| 55 to 64 Years | 134 (23.3%) | 409 (71.1%) |
| 65 to 74 Years | 416 (100.0%) | 262 (63.0%) |
| 75 Years and over | 214 (100.0%) | 109 (50.9%) |
| Total | 1,490 (39.4%) | 2,474 (65.5%) |
Disability Status by Sex by Age in Florence
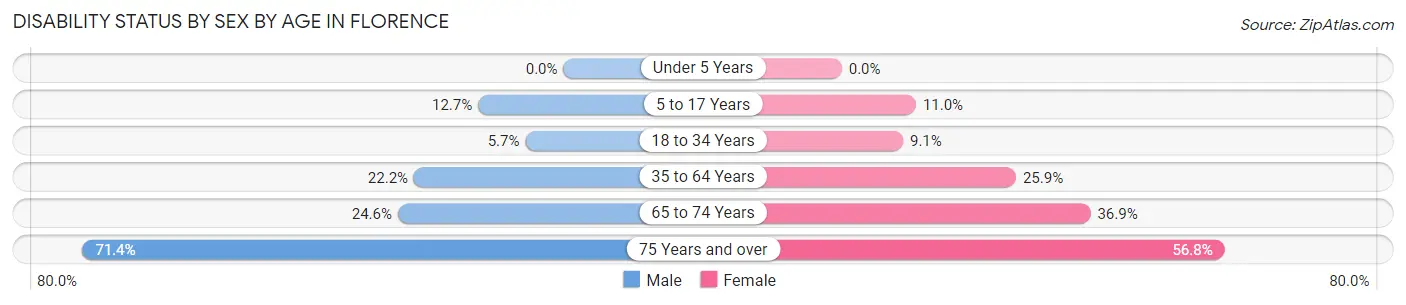
| Age Bracket | Male | Female |
| Under 5 Years | 0 (0.0%) | 0 (0.0%) |
| 5 to 17 Years | 37 (12.7%) | 24 (11.0%) |
| 18 to 34 Years | 31 (5.7%) | 32 (9.1%) |
| 35 to 64 Years | 180 (22.2%) | 209 (25.9%) |
| 65 to 74 Years | 59 (24.6%) | 65 (36.9%) |
| 75 Years and over | 90 (71.4%) | 50 (56.8%) |
Disability Class by Sex by Age in Florence
Disability Class: Hearing Difficulty
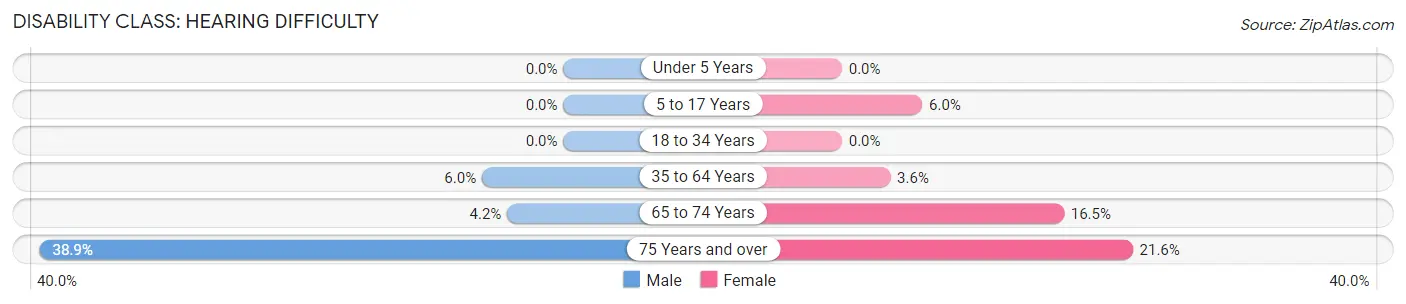
| Age Bracket | Male | Female |
| Under 5 Years | 0 (0.0%) | 0 (0.0%) |
| 5 to 17 Years | 0 (0.0%) | 13 (6.0%) |
| 18 to 34 Years | 0 (0.0%) | 0 (0.0%) |
| 35 to 64 Years | 49 (6.0%) | 29 (3.6%) |
| 65 to 74 Years | 10 (4.2%) | 29 (16.5%) |
| 75 Years and over | 49 (38.9%) | 19 (21.6%) |
Disability Class: Vision Difficulty
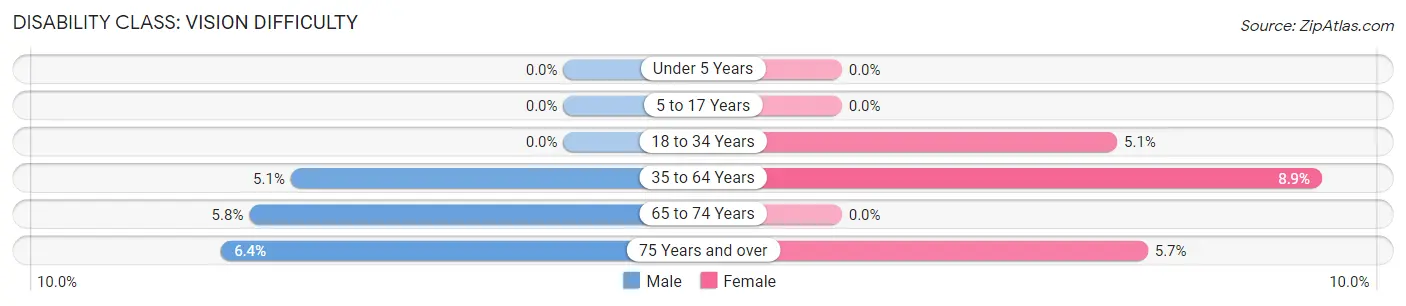
| Age Bracket | Male | Female |
| Under 5 Years | 0 (0.0%) | 0 (0.0%) |
| 5 to 17 Years | 0 (0.0%) | 0 (0.0%) |
| 18 to 34 Years | 0 (0.0%) | 18 (5.1%) |
| 35 to 64 Years | 41 (5.1%) | 72 (8.9%) |
| 65 to 74 Years | 14 (5.8%) | 0 (0.0%) |
| 75 Years and over | 8 (6.4%) | 5 (5.7%) |
Disability Class: Cognitive Difficulty
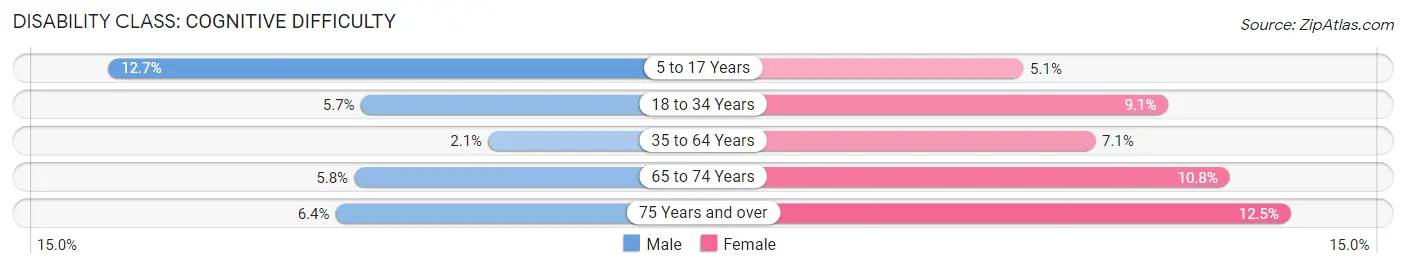
| Age Bracket | Male | Female |
| 5 to 17 Years | 37 (12.7%) | 11 (5.1%) |
| 18 to 34 Years | 31 (5.7%) | 32 (9.1%) |
| 35 to 64 Years | 17 (2.1%) | 57 (7.0%) |
| 65 to 74 Years | 14 (5.8%) | 19 (10.8%) |
| 75 Years and over | 8 (6.4%) | 11 (12.5%) |
Disability Class: Ambulatory Difficulty
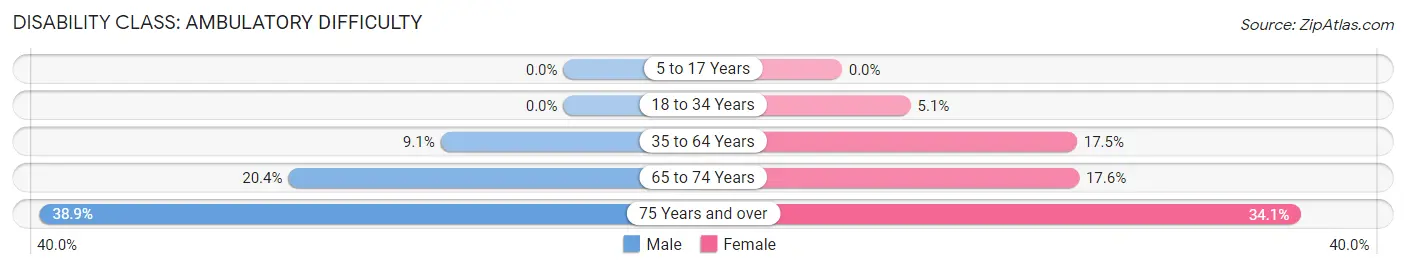
| Age Bracket | Male | Female |
| 5 to 17 Years | 0 (0.0%) | 0 (0.0%) |
| 18 to 34 Years | 0 (0.0%) | 18 (5.1%) |
| 35 to 64 Years | 74 (9.1%) | 141 (17.4%) |
| 65 to 74 Years | 49 (20.4%) | 31 (17.6%) |
| 75 Years and over | 49 (38.9%) | 30 (34.1%) |
Disability Class: Self-Care Difficulty
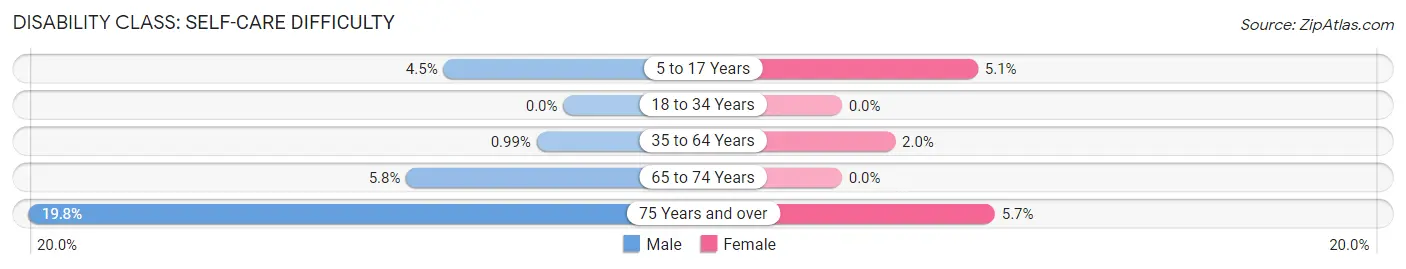
| Age Bracket | Male | Female |
| 5 to 17 Years | 13 (4.4%) | 11 (5.1%) |
| 18 to 34 Years | 0 (0.0%) | 0 (0.0%) |
| 35 to 64 Years | 8 (1.0%) | 16 (2.0%) |
| 65 to 74 Years | 14 (5.8%) | 0 (0.0%) |
| 75 Years and over | 25 (19.8%) | 5 (5.7%) |
Technology Access in Florence
Computing Device Access in Florence
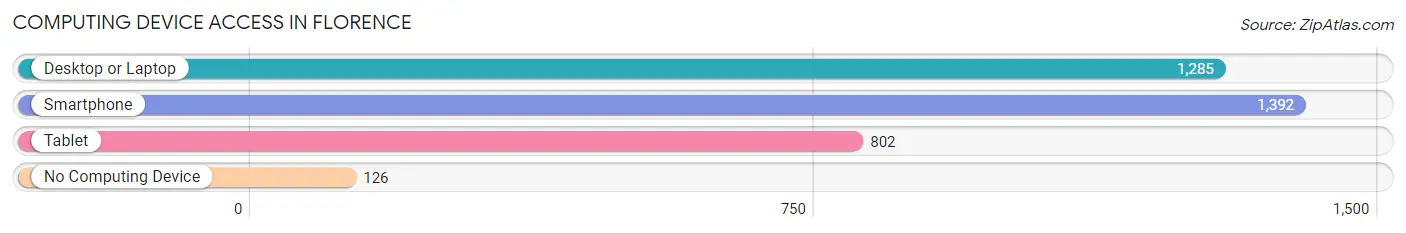
| Device Type | # Households | % Households |
| Desktop or Laptop | 1,285 | 77.8% |
| Smartphone | 1,392 | 84.3% |
| Tablet | 802 | 48.5% |
| No Computing Device | 126 | 7.6% |
| Total | 1,652 | 100.0% |
Internet Access in Florence
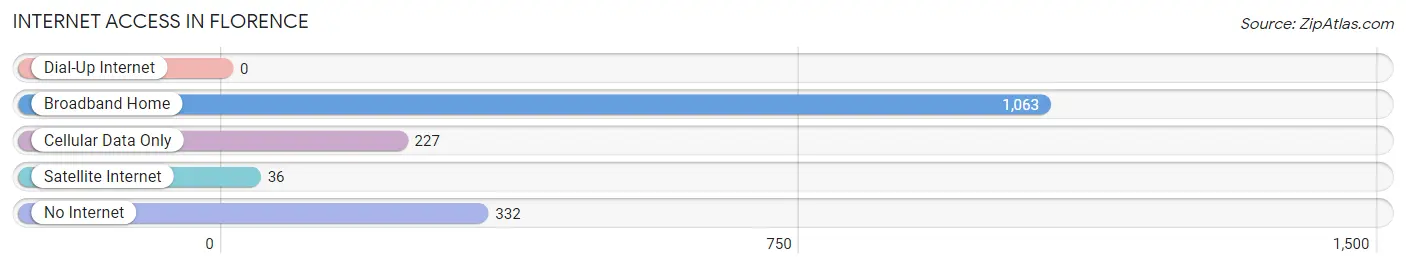
| Internet Type | # Households | % Households |
| Dial-Up Internet | 0 | 0.0% |
| Broadband Home | 1,063 | 64.3% |
| Cellular Data Only | 227 | 13.7% |
| Satellite Internet | 36 | 2.2% |
| No Internet | 332 | 20.1% |
| Total | 1,652 | 100.0% |
Florence Summary
Florence, Colorado is a small town located in Fremont County in the south-central part of the state. It is situated at the base of the Rocky Mountains, and is surrounded by the Arkansas River and the Wet Mountains. The town has a population of approximately 3,000 people, and is the county seat of Fremont County.
History
Florence was founded in 1866 by a group of miners who were searching for gold in the area. The town was named after Florence, Italy, and was originally known as Florence City. The town quickly grew, and by 1872, it had become the county seat of Fremont County.
In the late 1800s, Florence was a bustling mining town, with many of the miners coming from Italy, Germany, and other European countries. The town was also home to a large number of Chinese immigrants, who worked in the mines and on the railroads.
In the early 1900s, Florence began to experience a decline in its mining industry, and the town began to focus more on agriculture and ranching. The town also became a popular tourist destination, with many people coming to visit the nearby Royal Gorge.
Geography
Florence is located in the south-central part of Colorado, at the base of the Rocky Mountains. The town is situated at an elevation of 6,000 feet, and is surrounded by the Arkansas River and the Wet Mountains.
The town is located in a semi-arid climate, with hot summers and cold winters. The average annual temperature is around 50 degrees Fahrenheit, and the average annual precipitation is around 16 inches.
Economy
The economy of Florence is largely based on agriculture and ranching. The town is home to several large farms and ranches, and is also home to a number of small businesses.
The town is also home to a number of tourist attractions, including the Royal Gorge Bridge and Park, the Royal Gorge Railroad, and the Royal Gorge Dinosaur Experience.
Demographics
As of the 2010 census, the population of Florence was 3,068. The racial makeup of the town was 90.3% White, 0.7% African American, 0.7% Native American, 0.3% Asian, 0.1% Pacific Islander, 5.2% from other races, and 2.1% from two or more races. Hispanic or Latino of any race were 11.2% of the population.
The median household income in Florence was $37,917, and the median family income was $45,938. The per capita income for the town was $19,945. About 11.2% of families and 14.2% of the population were below the poverty line, including 19.2% of those under age 18 and 8.2% of those age 65 or over.
Common Questions
What is Per Capita Income in Florence?
Per Capita income in Florence is $29,632.
What is the Median Family Income in Florence?
Median Family Income in Florence is $74,531.
What is the Median Household income in Florence?
Median Household Income in Florence is $58,167.
What is Income or Wage Gap in Florence?
Income or Wage Gap in Florence is 13.6%.
Women in Florence earn 86.4 cents for every dollar earned by a man.
What is Inequality or Gini Index in Florence?
Inequality or Gini Index in Florence is 0.36.
What is the Total Population of Florence?
Total Population of Florence is 3,874.
What is the Total Male Population of Florence?
Total Male Population of Florence is 2,112.
What is the Total Female Population of Florence?
Total Female Population of Florence is 1,762.
What is the Ratio of Males per 100 Females in Florence?
There are 119.86 Males per 100 Females in Florence.
What is the Ratio of Females per 100 Males in Florence?
There are 83.43 Females per 100 Males in Florence.
What is the Median Population Age in Florence?
Median Population Age in Florence is 44.6 Years.
What is the Average Family Size in Florence
Average Family Size in Florence is 2.8 People.
What is the Average Household Size in Florence
Average Household Size in Florence is 2.3 People.
How Large is the Labor Force in Florence?
There are 1,953 People in the Labor Forcein in Florence.
What is the Percentage of People in the Labor Force in Florence?
59.1% of People are in the Labor Force in Florence.
What is the Unemployment Rate in Florence?
Unemployment Rate in Florence is 1.6%.