Simla, CO Map & Demographics
Simla Map
Simla Overview
$40,870
PER CAPITA INCOME
$35,441
AVG FAMILY INCOME
$41,625
AVG HOUSEHOLD INCOME
$9,420
FAMILY INCOME DEFICIT
0.62
INEQUALITY / GINI INDEX
588
TOTAL POPULATION
274
MALE POPULATION
314
FEMALE POPULATION
87.26
MALES / 100 FEMALES
114.60
FEMALES / 100 MALES
39.1
MEDIAN AGE
2.8
AVG FAMILY SIZE
2.3
AVG HOUSEHOLD SIZE
288
LABOR FORCE [ PEOPLE ]
57.9%
PERCENT IN LABOR FORCE
Simla Zip Codes
Simla Area Codes
Income in Simla
Income Overview in Simla
Per Capita Income in Simla is $40,870, while median incomes of families and households are $35,441 and $41,625 respectively.
| Characteristic | Number | Measure |
| Per Capita Income | 588 | $40,870 |
| Median Family Income | 146 | $35,441 |
| Mean Family Income | 146 | $125,884 |
| Median Household Income | 246 | $41,625 |
| Mean Household Income | 246 | $99,341 |
| Income Deficit | 146 | $9,420 |
| Wage / Income Gap (%) | 588 | 0.00% |
| Wage / Income Gap ($) | 588 | 100.00¢ per $1 |
| Gini / Inequality Index | 588 | 0.62 |
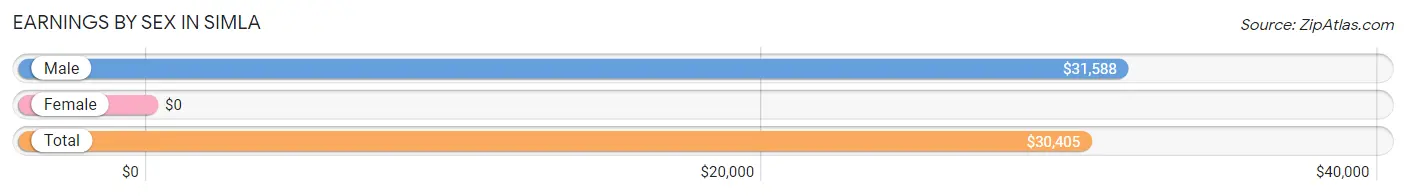
Earnings by Sex in Simla
| Sex | Number | Average Earnings |
| Male | 151 (50.7%) | $31,588 |
| Female | 147 (49.3%) | $0 |
| Total | 298 (100.0%) | $30,405 |
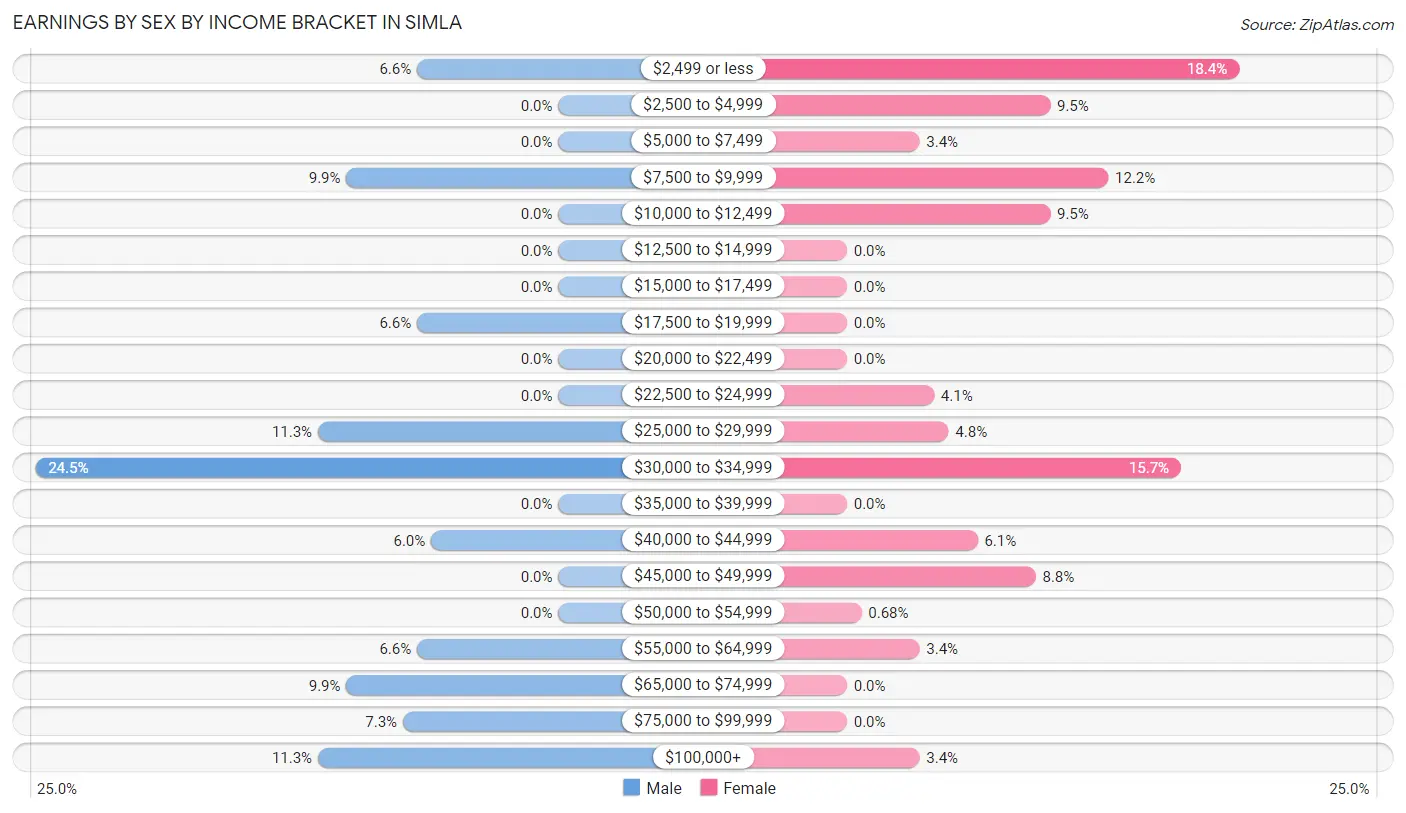
Earnings by Sex by Income Bracket in Simla
The most common earnings brackets in Simla are $30,000 to $34,999 for men (37 | 24.5%) and $2,499 or less for women (27 | 18.4%).
| Income | Male | Female |
| $2,499 or less | 10 (6.6%) | 27 (18.4%) |
| $2,500 to $4,999 | 0 (0.0%) | 14 (9.5%) |
| $5,000 to $7,499 | 0 (0.0%) | 5 (3.4%) |
| $7,500 to $9,999 | 15 (9.9%) | 18 (12.2%) |
| $10,000 to $12,499 | 0 (0.0%) | 14 (9.5%) |
| $12,500 to $14,999 | 0 (0.0%) | 0 (0.0%) |
| $15,000 to $17,499 | 0 (0.0%) | 0 (0.0%) |
| $17,500 to $19,999 | 10 (6.6%) | 0 (0.0%) |
| $20,000 to $22,499 | 0 (0.0%) | 0 (0.0%) |
| $22,500 to $24,999 | 0 (0.0%) | 6 (4.1%) |
| $25,000 to $29,999 | 17 (11.3%) | 7 (4.8%) |
| $30,000 to $34,999 | 37 (24.5%) | 23 (15.7%) |
| $35,000 to $39,999 | 0 (0.0%) | 0 (0.0%) |
| $40,000 to $44,999 | 9 (6.0%) | 9 (6.1%) |
| $45,000 to $49,999 | 0 (0.0%) | 13 (8.8%) |
| $50,000 to $54,999 | 0 (0.0%) | 1 (0.7%) |
| $55,000 to $64,999 | 10 (6.6%) | 5 (3.4%) |
| $65,000 to $74,999 | 15 (9.9%) | 0 (0.0%) |
| $75,000 to $99,999 | 11 (7.3%) | 0 (0.0%) |
| $100,000+ | 17 (11.3%) | 5 (3.4%) |
| Total | 151 (100.0%) | 147 (100.0%) |
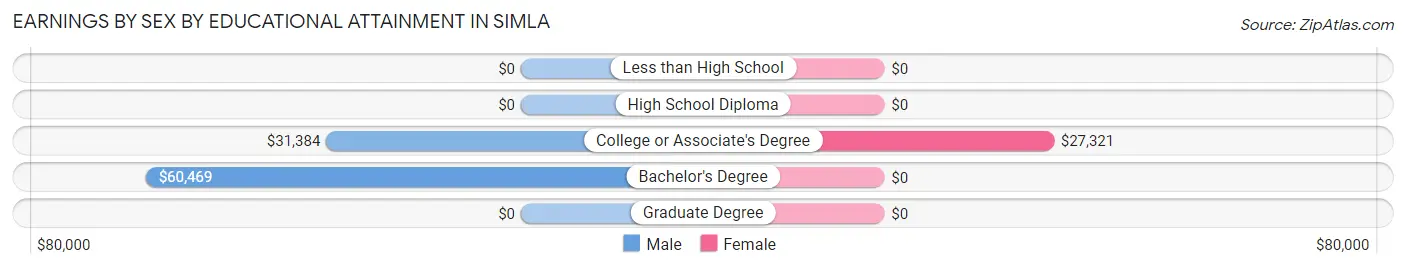
Earnings by Sex by Educational Attainment in Simla
Average earnings in Simla are $31,588 for men and $32,663 for women, a difference of 3.3%. Men with an educational attainment of bachelor's degree enjoy the highest average annual earnings of $60,469, while those with college or associate's degree education earn the least with $31,384. Women with an educational attainment of college or associate's degree earn the most with the average annual earnings of $27,321, while those with college or associate's degree education have the smallest earnings of $27,321.
| Educational Attainment | Male Income | Female Income |
| Less than High School | - | - |
| High School Diploma | - | - |
| College or Associate's Degree | $31,384 | $27,321 |
| Bachelor's Degree | $60,469 | $0 |
| Graduate Degree | - | - |
| Total | $31,588 | $32,663 |
Family Income in Simla
Family Income Brackets in Simla
According to the Simla family income data, there are 35 families falling into the $25,000 to $34,999 income range, which is the most common income bracket and makes up 24.0% of all families. Conversely, the $10,000 to $14,999 income bracket is the least frequent group with only 3 families (2.1%) belonging to this category.
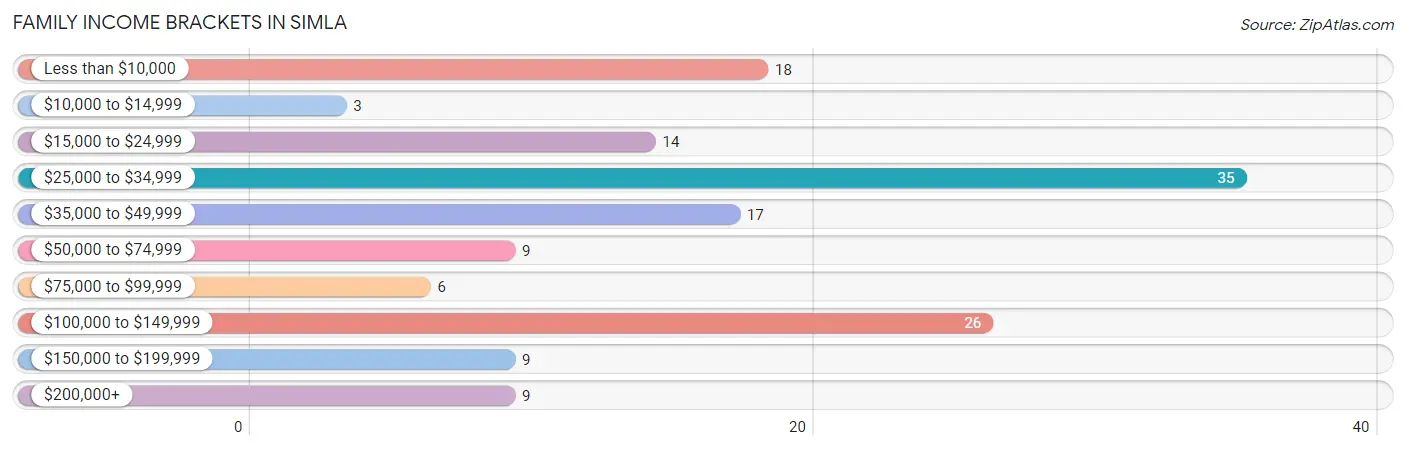
| Income Bracket | # Families | % Families |
| Less than $10,000 | 18 | 12.3% |
| $10,000 to $14,999 | 3 | 2.1% |
| $15,000 to $24,999 | 14 | 9.6% |
| $25,000 to $34,999 | 35 | 24.0% |
| $35,000 to $49,999 | 17 | 11.6% |
| $50,000 to $74,999 | 9 | 6.2% |
| $75,000 to $99,999 | 6 | 4.1% |
| $100,000 to $149,999 | 26 | 17.8% |
| $150,000 to $199,999 | 9 | 6.2% |
| $200,000+ | 9 | 6.2% |
Family Income by Famaliy Size in Simla
| Income Bracket | # Families | Median Income |
| 2-Person Families | 77 (52.7%) | $0 |
| 3-Person Families | 37 (25.3%) | $0 |
| 4-Person Families | 14 (9.6%) | $0 |
| 5-Person Families | 7 (4.8%) | $0 |
| 6-Person Families | 11 (7.5%) | $0 |
| 7+ Person Families | 0 (0.0%) | $0 |
| Total | 146 (100.0%) | $35,441 |
Family Income by Number of Earners in Simla
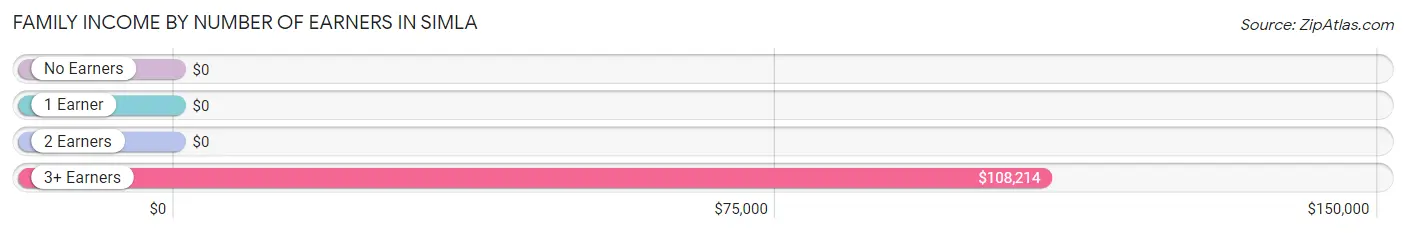
| Number of Earners | # Families | Median Income |
| No Earners | 14 (9.6%) | $0 |
| 1 Earner | 95 (65.1%) | $0 |
| 2 Earners | 19 (13.0%) | $0 |
| 3+ Earners | 18 (12.3%) | $108,214 |
| Total | 146 (100.0%) | $35,441 |
Household Income in Simla
Household Income Brackets in Simla
With 48 households falling in the category, the $15,000 to $24,999 income range is the most frequent in Simla, accounting for 19.5% of all households. In contrast, only 3 households (1.2%) fall into the $10,000 to $14,999 income bracket, making it the least populous group.
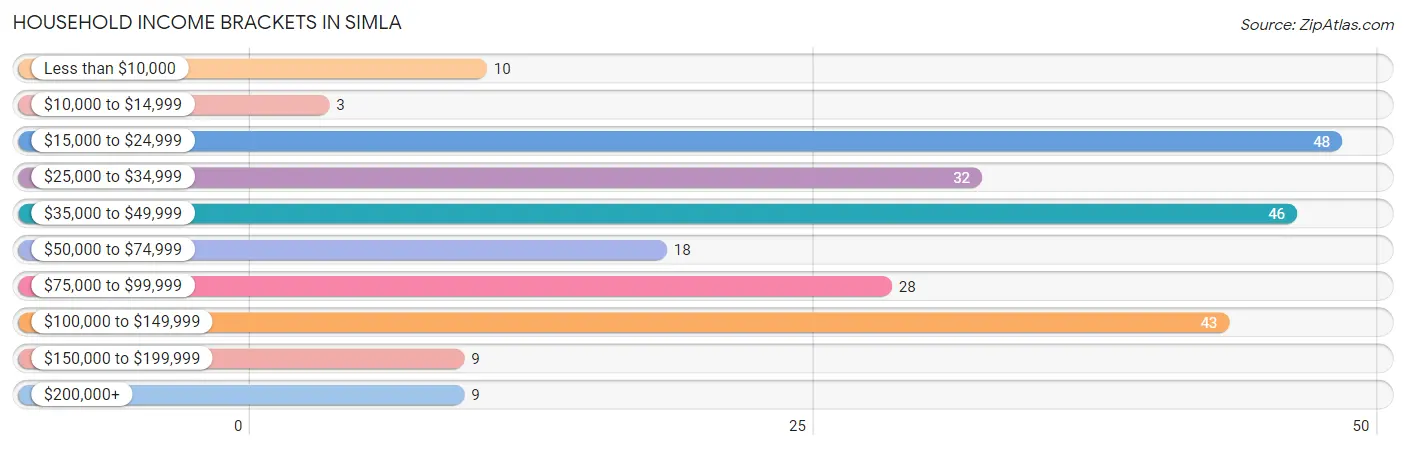
| Income Bracket | # Households | % Households |
| Less than $10,000 | 10 | 4.1% |
| $10,000 to $14,999 | 3 | 1.2% |
| $15,000 to $24,999 | 48 | 19.5% |
| $25,000 to $34,999 | 32 | 13.0% |
| $35,000 to $49,999 | 46 | 18.7% |
| $50,000 to $74,999 | 18 | 7.3% |
| $75,000 to $99,999 | 28 | 11.4% |
| $100,000 to $149,999 | 43 | 17.5% |
| $150,000 to $199,999 | 9 | 3.7% |
| $200,000+ | 9 | 3.7% |
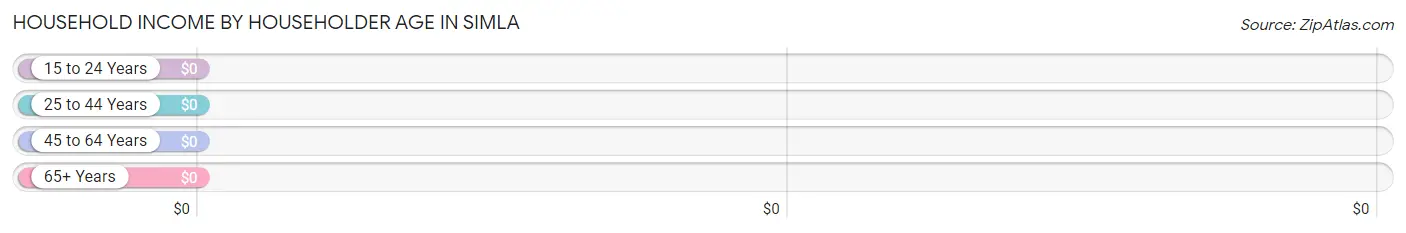
Household Income by Householder Age in Simla
| Income Bracket | # Households | Median Income |
| 15 to 24 Years | 18 (7.3%) | $0 |
| 25 to 44 Years | 122 (49.6%) | $0 |
| 45 to 64 Years | 54 (22.0%) | $0 |
| 65+ Years | 52 (21.1%) | $0 |
| Total | 246 (100.0%) | $41,625 |
Poverty in Simla
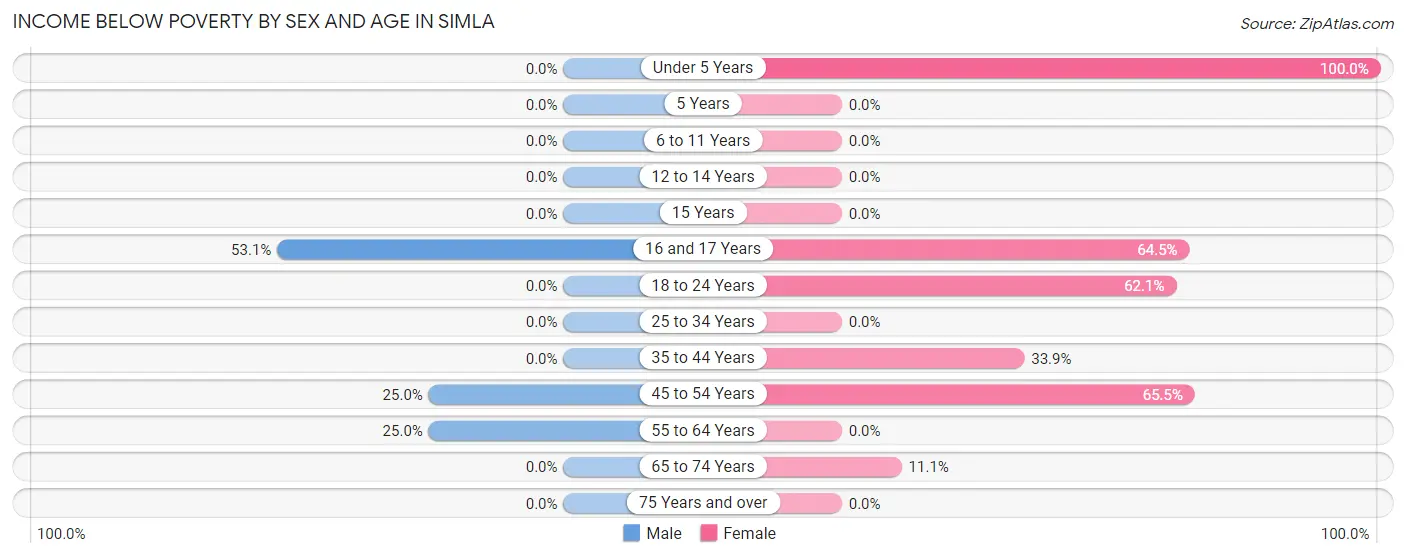
Income Below Poverty by Sex and Age in Simla
With 11.7% poverty level for males and 30.7% for females among the residents of Simla, 16 and 17 year old males and under 5 year old females are the most vulnerable to poverty, with 17 males (53.1%) and 11 females (100.0%) in their respective age groups living below the poverty level.
| Age Bracket | Male | Female |
| Under 5 Years | 0 (0.0%) | 11 (100.0%) |
| 5 Years | 0 (0.0%) | 0 (0.0%) |
| 6 to 11 Years | 0 (0.0%) | 0 (0.0%) |
| 12 to 14 Years | 0 (0.0%) | 0 (0.0%) |
| 15 Years | 0 (0.0%) | 0 (0.0%) |
| 16 and 17 Years | 17 (53.1%) | 20 (64.5%) |
| 18 to 24 Years | 0 (0.0%) | 18 (62.1%) |
| 25 to 34 Years | 0 (0.0%) | 0 (0.0%) |
| 35 to 44 Years | 0 (0.0%) | 21 (33.9%) |
| 45 to 54 Years | 4 (25.0%) | 19 (65.5%) |
| 55 to 64 Years | 10 (25.0%) | 0 (0.0%) |
| 65 to 74 Years | 0 (0.0%) | 3 (11.1%) |
| 75 Years and over | 0 (0.0%) | 0 (0.0%) |
| Total | 31 (11.7%) | 92 (30.7%) |
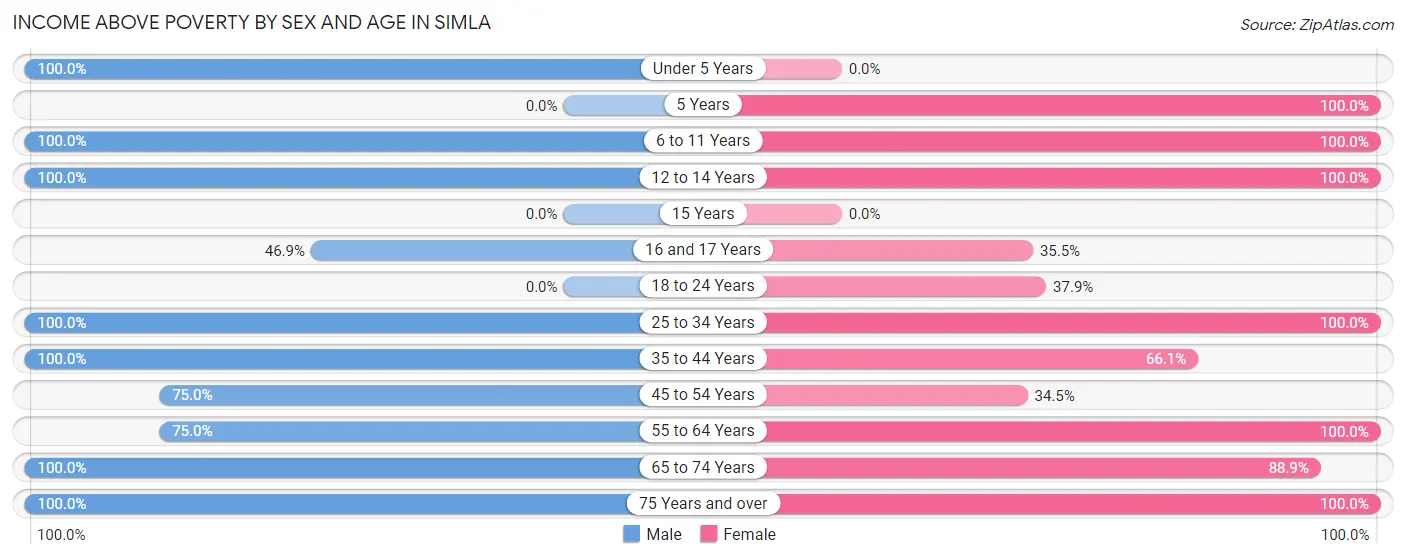
Income Above Poverty by Sex and Age in Simla
According to the poverty statistics in Simla, males aged under 5 years and females aged 5 years are the age groups that are most secure financially, with 100.0% of males and 100.0% of females in these age groups living above the poverty line.
| Age Bracket | Male | Female |
| Under 5 Years | 13 (100.0%) | 0 (0.0%) |
| 5 Years | 0 (0.0%) | 4 (100.0%) |
| 6 to 11 Years | 20 (100.0%) | 8 (100.0%) |
| 12 to 14 Years | 6 (100.0%) | 29 (100.0%) |
| 15 Years | 0 (0.0%) | 0 (0.0%) |
| 16 and 17 Years | 15 (46.9%) | 11 (35.5%) |
| 18 to 24 Years | 0 (0.0%) | 11 (37.9%) |
| 25 to 34 Years | 60 (100.0%) | 27 (100.0%) |
| 35 to 44 Years | 58 (100.0%) | 41 (66.1%) |
| 45 to 54 Years | 12 (75.0%) | 10 (34.5%) |
| 55 to 64 Years | 30 (75.0%) | 32 (100.0%) |
| 65 to 74 Years | 9 (100.0%) | 24 (88.9%) |
| 75 Years and over | 12 (100.0%) | 11 (100.0%) |
| Total | 235 (88.3%) | 208 (69.3%) |
Income Below Poverty Among Married-Couple Families in Simla
| Children | Above Poverty | Below Poverty |
| No Children | 29 (100.0%) | 0 (0.0%) |
| 1 or 2 Children | 7 (100.0%) | 0 (0.0%) |
| 3 or 4 Children | 11 (100.0%) | 0 (0.0%) |
| 5 or more Children | 0 (0.0%) | 0 (0.0%) |
| Total | 47 (100.0%) | 0 (0.0%) |
Income Below Poverty Among Single-Parent Households in Simla
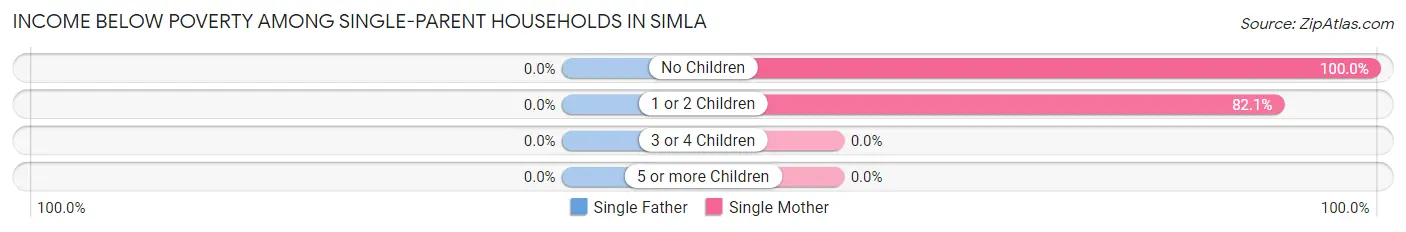
| Children | Single Father | Single Mother |
| No Children | 0 (0.0%) | 3 (100.0%) |
| 1 or 2 Children | 0 (0.0%) | 32 (82.1%) |
| 3 or 4 Children | 0 (0.0%) | 0 (0.0%) |
| 5 or more Children | 0 (0.0%) | 0 (0.0%) |
| Total | 0 (0.0%) | 35 (83.3%) |
Income Below Poverty Among Married-Couple vs Single-Parent Households in Simla
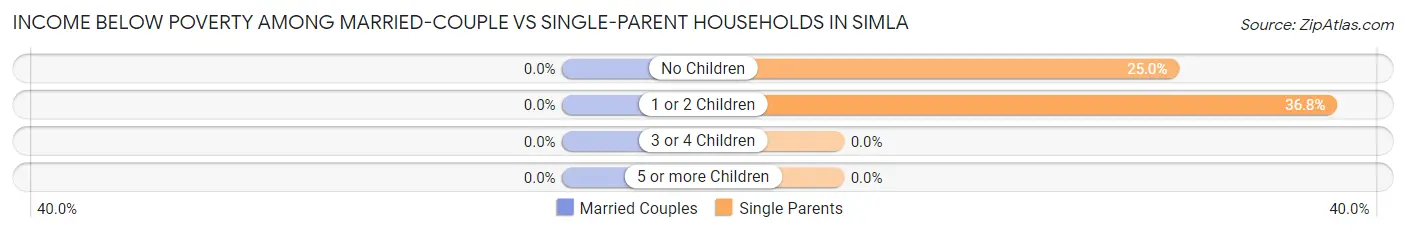
| Children | Married-Couple Families | Single-Parent Households |
| No Children | 0 (0.0%) | 3 (25.0%) |
| 1 or 2 Children | 0 (0.0%) | 32 (36.8%) |
| 3 or 4 Children | 0 (0.0%) | 0 (0.0%) |
| 5 or more Children | 0 (0.0%) | 0 (0.0%) |
| Total | 0 (0.0%) | 35 (35.3%) |
Race in Simla
The most populous races in Simla are White / Caucasian (474 | 80.6%), Two or more Races (67 | 11.4%), and Black / African American (28 | 4.8%).
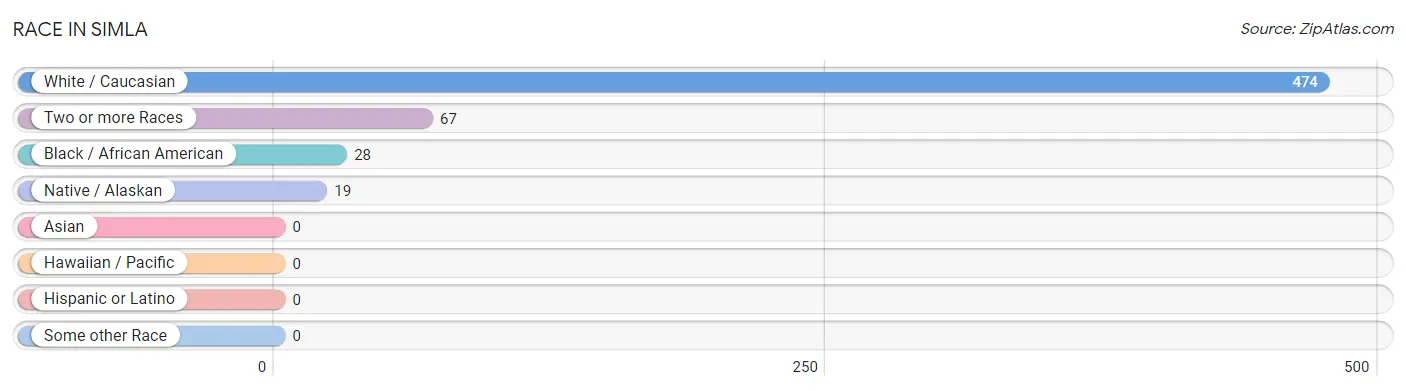
| Race | # Population | % Population |
| Asian | 0 | 0.0% |
| Black / African American | 28 | 4.8% |
| Hawaiian / Pacific | 0 | 0.0% |
| Hispanic or Latino | 0 | 0.0% |
| Native / Alaskan | 19 | 3.2% |
| White / Caucasian | 474 | 80.6% |
| Two or more Races | 67 | 11.4% |
| Some other Race | 0 | 0.0% |
| Total | 588 | 100.0% |
Ancestry in Simla
The most populous ancestries reported in Simla are German (158 | 26.9%), Irish (93 | 15.8%), English (66 | 11.2%), Scottish (22 | 3.7%), and Cherokee (19 | 3.2%), together accounting for 60.9% of all Simla residents.
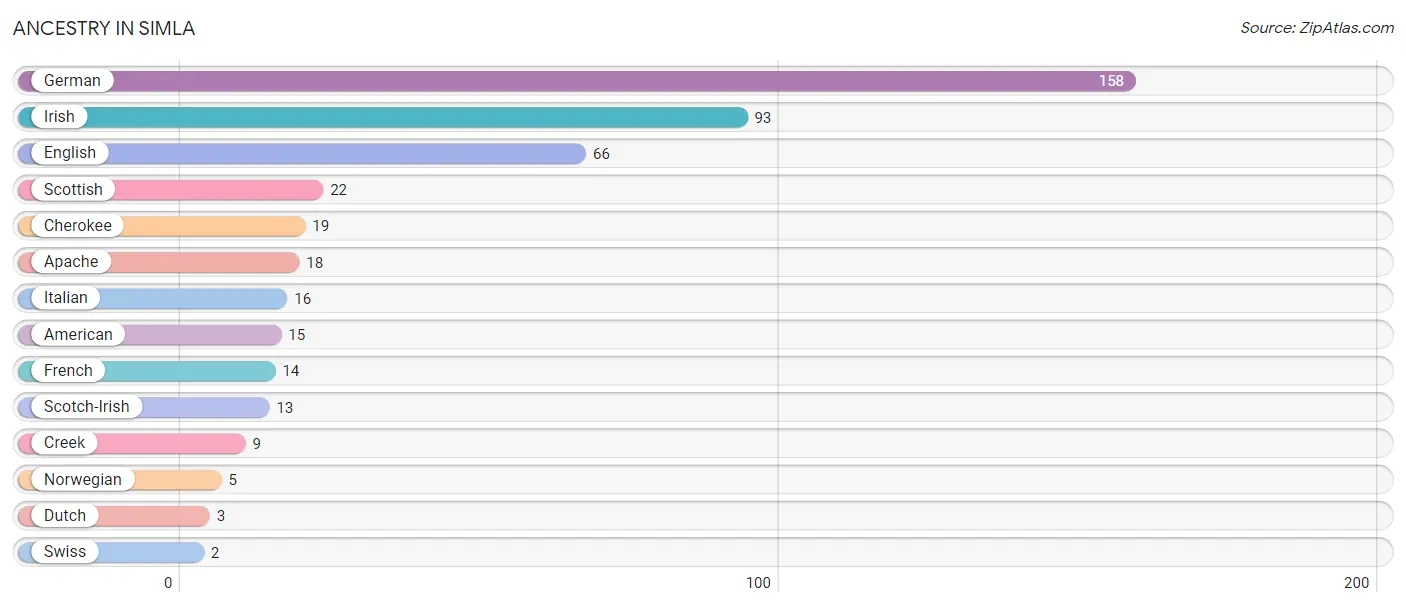
| Ancestry | # Population | % Population |
| American | 15 | 2.5% |
| Apache | 18 | 3.1% |
| Cherokee | 19 | 3.2% |
| Creek | 9 | 1.5% |
| Dutch | 3 | 0.5% |
| English | 66 | 11.2% |
| French | 14 | 2.4% |
| German | 158 | 26.9% |
| Irish | 93 | 15.8% |
| Italian | 16 | 2.7% |
| Norwegian | 5 | 0.9% |
| Scotch-Irish | 13 | 2.2% |
| Scottish | 22 | 3.7% |
| Swiss | 2 | 0.3% | View All 14 Rows |
Immigrants in Simla
The most numerous immigrant groups reported in Simla came from , and Canada (3 | 0.5%), together accounting for 0.5% of all Simla residents.

| Immigration Origin | # Population | % Population |
| Canada | 3 | 0.5% | View All 1 Rows |
Sex and Age in Simla
Sex and Age in Simla
The most populous age groups in Simla are 40 to 44 Years (47 | 17.2%) for men and 15 to 19 Years (42 | 13.4%) for women.
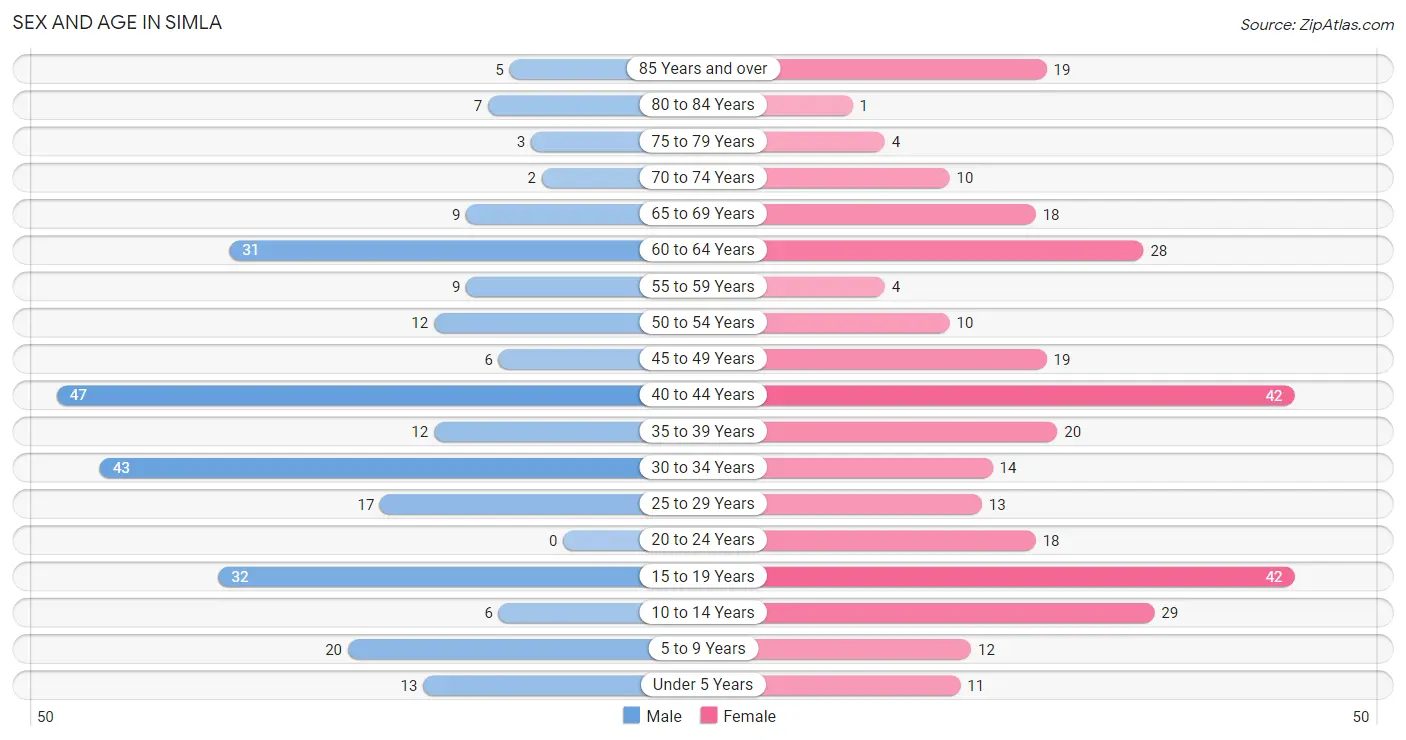
| Age Bracket | Male | Female |
| Under 5 Years | 13 (4.7%) | 11 (3.5%) |
| 5 to 9 Years | 20 (7.3%) | 12 (3.8%) |
| 10 to 14 Years | 6 (2.2%) | 29 (9.2%) |
| 15 to 19 Years | 32 (11.7%) | 42 (13.4%) |
| 20 to 24 Years | 0 (0.0%) | 18 (5.7%) |
| 25 to 29 Years | 17 (6.2%) | 13 (4.1%) |
| 30 to 34 Years | 43 (15.7%) | 14 (4.5%) |
| 35 to 39 Years | 12 (4.4%) | 20 (6.4%) |
| 40 to 44 Years | 47 (17.2%) | 42 (13.4%) |
| 45 to 49 Years | 6 (2.2%) | 19 (6.0%) |
| 50 to 54 Years | 12 (4.4%) | 10 (3.2%) |
| 55 to 59 Years | 9 (3.3%) | 4 (1.3%) |
| 60 to 64 Years | 31 (11.3%) | 28 (8.9%) |
| 65 to 69 Years | 9 (3.3%) | 18 (5.7%) |
| 70 to 74 Years | 2 (0.7%) | 10 (3.2%) |
| 75 to 79 Years | 3 (1.1%) | 4 (1.3%) |
| 80 to 84 Years | 7 (2.5%) | 1 (0.3%) |
| 85 Years and over | 5 (1.8%) | 19 (6.0%) |
| Total | 274 (100.0%) | 314 (100.0%) |
Families and Households in Simla
Median Family Size in Simla
The median family size in Simla is 2.82 persons per family, with married-couple families (47 | 32.2%) accounting for the largest median family size of 3.43 persons per family. On the other hand, single male/father families (57 | 39.0%) represent the smallest median family size with 2.40 persons per family.
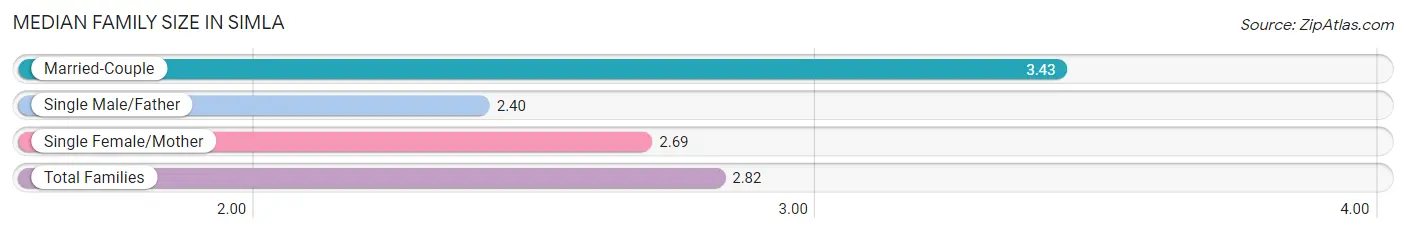
| Family Type | # Families | Family Size |
| Married-Couple | 47 (32.2%) | 3.43 |
| Single Male/Father | 57 (39.0%) | 2.40 |
| Single Female/Mother | 42 (28.8%) | 2.69 |
| Total Families | 146 (100.0%) | 2.82 |
Median Household Size in Simla
The median household size in Simla is 2.30 persons per household, with married-couple households (47 | 19.1%) accounting for the largest median household size of 3.43 persons per household. non-family households (100 | 40.6%) represent the smallest median household size with 1.30 persons per household.
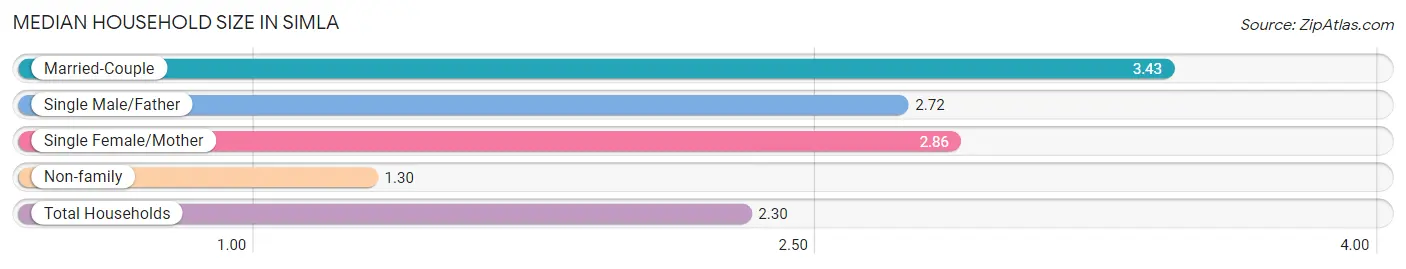
| Household Type | # Households | Household Size |
| Married-Couple | 47 (19.1%) | 3.43 |
| Single Male/Father | 57 (23.2%) | 2.72 |
| Single Female/Mother | 42 (17.1%) | 2.86 |
| Non-family | 100 (40.6%) | 1.30 |
| Total Households | 246 (100.0%) | 2.30 |
Household Size by Marriage Status in Simla
Out of a total of 246 households in Simla, 146 (59.4%) are family households, while 100 (40.6%) are nonfamily households. The most numerous type of family households are 3-person households, comprising 77, and the most common type of nonfamily households are 1-person households, comprising 79.
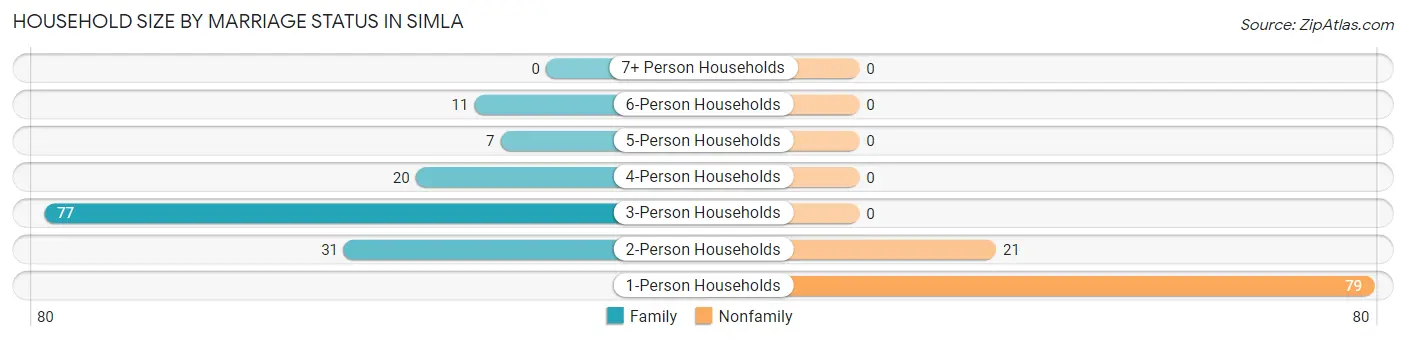
| Household Size | Family Households | Nonfamily Households |
| 1-Person Households | - | 79 (32.1%) |
| 2-Person Households | 31 (12.6%) | 21 (8.5%) |
| 3-Person Households | 77 (31.3%) | 0 (0.0%) |
| 4-Person Households | 20 (8.1%) | 0 (0.0%) |
| 5-Person Households | 7 (2.9%) | 0 (0.0%) |
| 6-Person Households | 11 (4.5%) | 0 (0.0%) |
| 7+ Person Households | 0 (0.0%) | 0 (0.0%) |
| Total | 146 (59.4%) | 100 (40.6%) |
Female Fertility in Simla
Fertility by Age in Simla
| Age Bracket | Women with Births | Births / 1,000 Women |
| 15 to 19 years | 0 (0.0%) | 0.0 |
| 20 to 34 years | 0 (0.0%) | 0.0 |
| 35 to 50 years | 0 (0.0%) | 0.0 |
| Total | 0 (0.0%) | 0.0 |
Fertility by Age by Marriage Status in Simla
| Age Bracket | Married | Unmarried |
| 15 to 19 years | 0 (0.0%) | 0 (0.0%) |
| 20 to 34 years | 0 (0.0%) | 0 (0.0%) |
| 35 to 50 years | 0 (0.0%) | 0 (0.0%) |
| Total | 0 (0.0%) | 0 (0.0%) |
Fertility by Education in Simla
| Educational Attainment | Women with Births | Births / 1,000 Women |
| Less than High School | 0 (0.0%) | 0.0 |
| High School Diploma | 0 (0.0%) | 0.0 |
| College or Associate's Degree | 0 (0.0%) | 0.0 |
| Bachelor's Degree | 0 (0.0%) | 0.0 |
| Graduate Degree | 0 (0.0%) | 0.0 |
| Total | 0 (0.0%) | 0.0 |
Fertility by Education by Marriage Status in Simla
| Educational Attainment | Married | Unmarried |
| Less than High School | 0 (0.0%) | 0 (0.0%) |
| High School Diploma | 0 (0.0%) | 0 (0.0%) |
| College or Associate's Degree | 0 (0.0%) | 0 (0.0%) |
| Bachelor's Degree | 0 (0.0%) | 0 (0.0%) |
| Graduate Degree | 0 (0.0%) | 0 (0.0%) |
| Total | 0 (0.0%) | 0 (0.0%) |
Employment Characteristics in Simla
Employment by Class of Employer in Simla
Among the 268 employed individuals in Simla, private company employees (225 | 84.0%), local government employees (40 | 14.9%), and self-employed (not incorporated) (2 | 0.7%) make up the most common classes of employment.
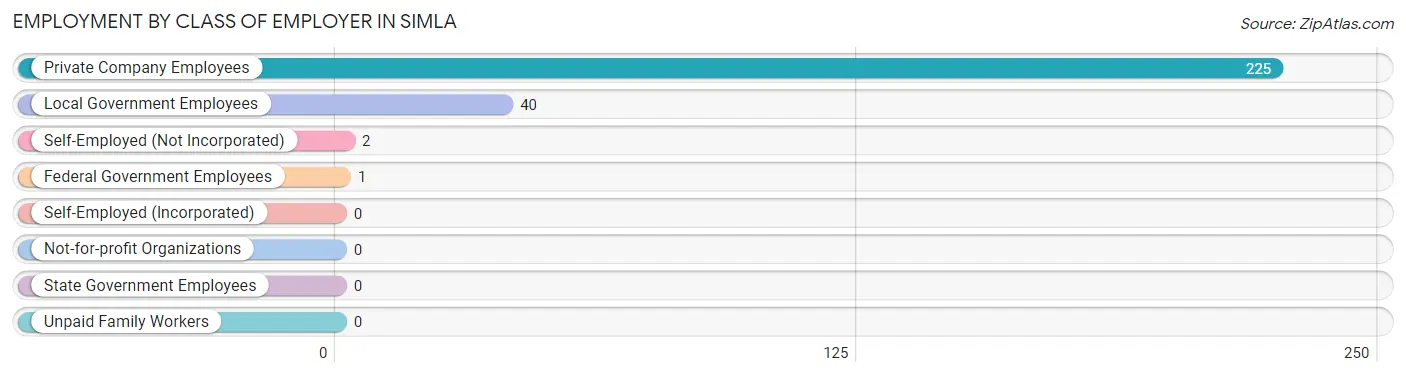
| Employer Class | # Employees | % Employees |
| Private Company Employees | 225 | 84.0% |
| Self-Employed (Incorporated) | 0 | 0.0% |
| Self-Employed (Not Incorporated) | 2 | 0.7% |
| Not-for-profit Organizations | 0 | 0.0% |
| Local Government Employees | 40 | 14.9% |
| State Government Employees | 0 | 0.0% |
| Federal Government Employees | 1 | 0.4% |
| Unpaid Family Workers | 0 | 0.0% |
| Total | 268 | 100.0% |
Employment Status by Age in Simla
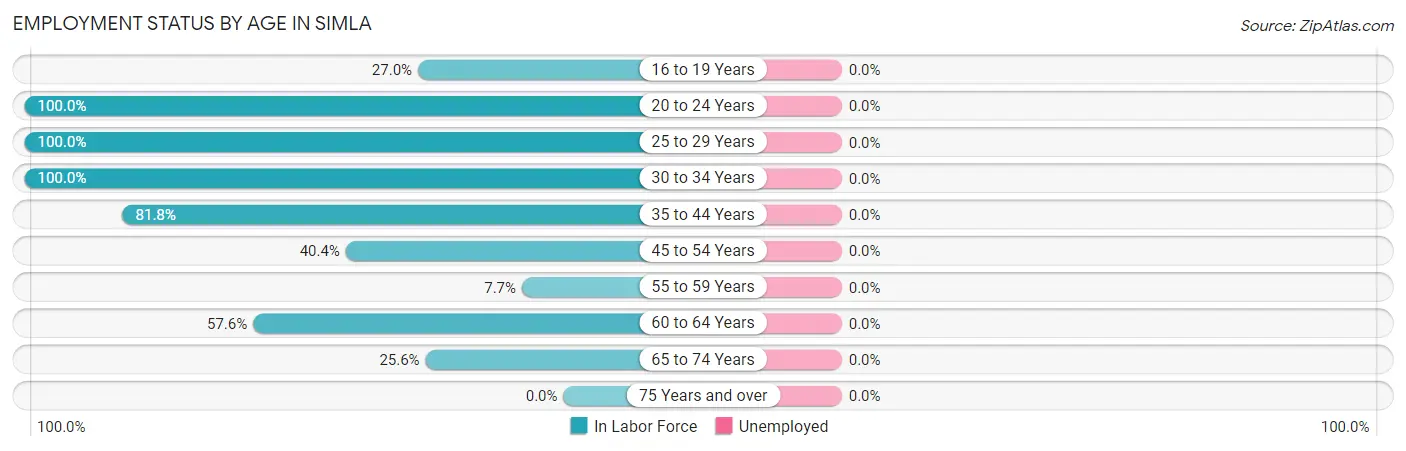
| Age Bracket | In Labor Force | Unemployed |
| 16 to 19 Years | 20 (27.0%) | 0 (0.0%) |
| 20 to 24 Years | 18 (100.0%) | 0 (0.0%) |
| 25 to 29 Years | 30 (100.0%) | 0 (0.0%) |
| 30 to 34 Years | 57 (100.0%) | 0 (0.0%) |
| 35 to 44 Years | 99 (81.8%) | 0 (0.0%) |
| 45 to 54 Years | 19 (40.4%) | 0 (0.0%) |
| 55 to 59 Years | 1 (7.7%) | 0 (0.0%) |
| 60 to 64 Years | 34 (57.6%) | 0 (0.0%) |
| 65 to 74 Years | 10 (25.6%) | 0 (0.0%) |
| 75 Years and over | 0 (0.0%) | 0 (0.0%) |
| Total | 288 (57.9%) | 0 (0.0%) |
Employment Status by Educational Attainment in Simla
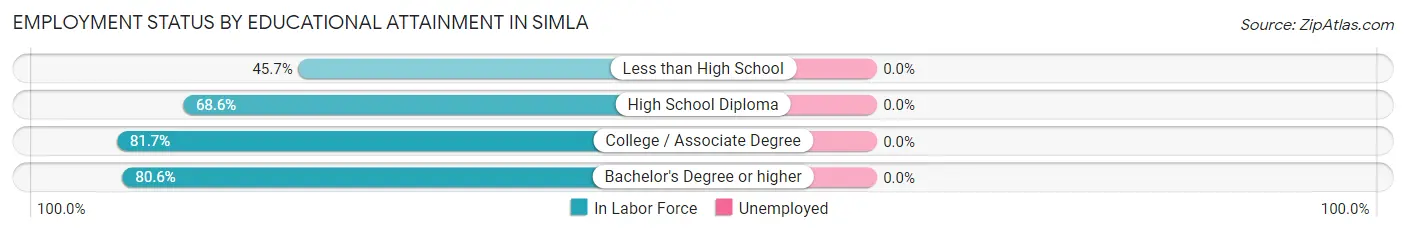
| Educational Attainment | In Labor Force | Unemployed |
| Less than High School | 16 (45.7%) | 0 (0.0%) |
| High School Diploma | 72 (68.6%) | 0 (0.0%) |
| College / Associate Degree | 98 (81.7%) | 0 (0.0%) |
| Bachelor's Degree or higher | 54 (80.6%) | 0 (0.0%) |
| Total | 240 (73.4%) | 0 (0.0%) |
Employment Occupations by Sex in Simla
Management, Business, Science and Arts Occupations
The most common Management, Business, Science and Arts occupations in Simla are Health Diagnosing & Treating (20 | 6.9%), Health Technologists (13 | 4.5%), Management (12 | 4.2%), Community & Social Service (11 | 3.8%), and Education Instruction & Library (11 | 3.8%).
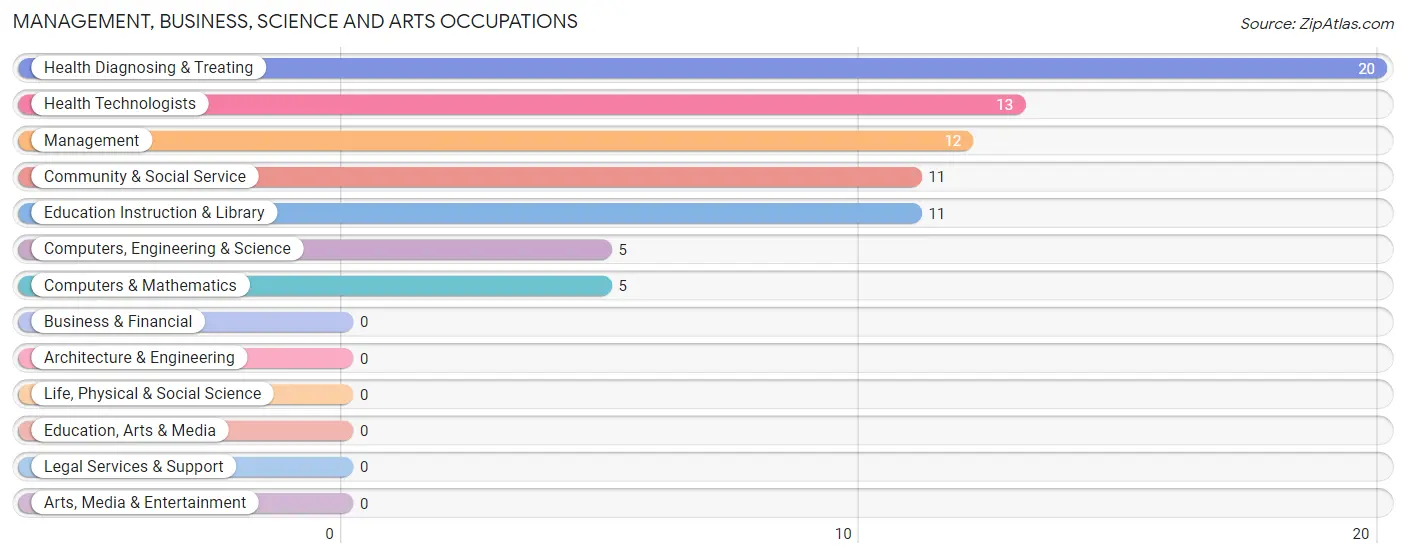
Management, Business, Science and Arts Occupations by Sex
Within the Management, Business, Science and Arts occupations in Simla, the most male-oriented occupations are Computers, Engineering & Science (100.0%), Computers & Mathematics (100.0%), and Community & Social Service (81.8%), while the most female-oriented occupations are Management (100.0%), Health Diagnosing & Treating (100.0%), and Health Technologists (100.0%).
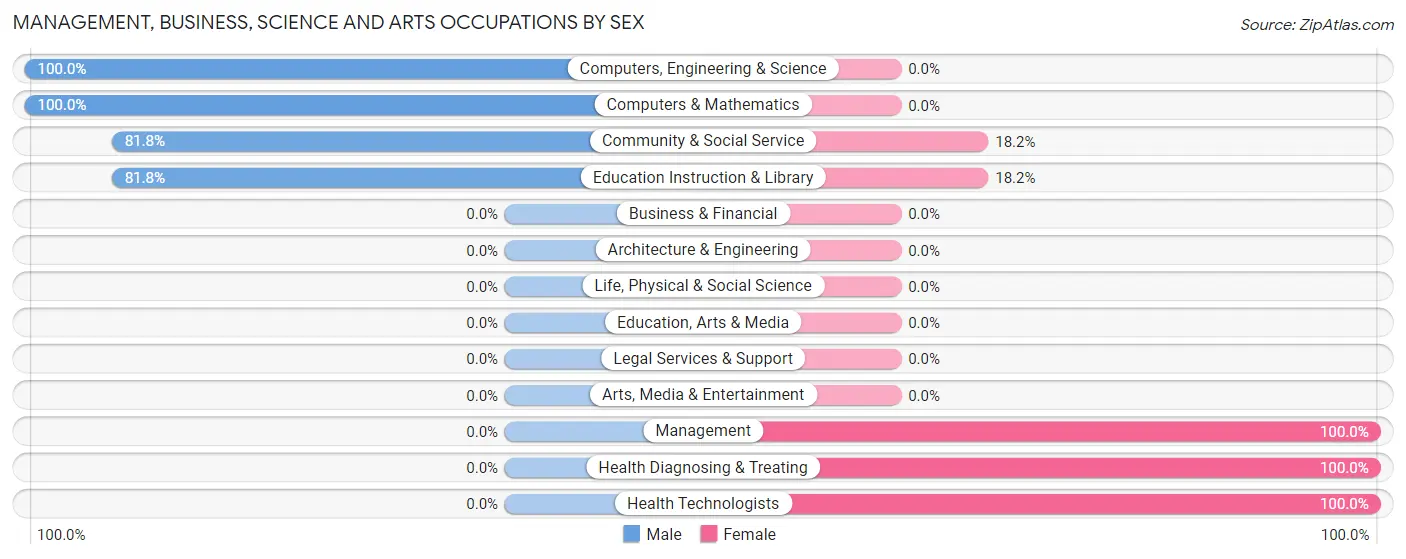
| Occupation | Male | Female |
| Management | 0 (0.0%) | 12 (100.0%) |
| Business & Financial | 0 (0.0%) | 0 (0.0%) |
| Computers, Engineering & Science | 5 (100.0%) | 0 (0.0%) |
| Computers & Mathematics | 5 (100.0%) | 0 (0.0%) |
| Architecture & Engineering | 0 (0.0%) | 0 (0.0%) |
| Life, Physical & Social Science | 0 (0.0%) | 0 (0.0%) |
| Community & Social Service | 9 (81.8%) | 2 (18.2%) |
| Education, Arts & Media | 0 (0.0%) | 0 (0.0%) |
| Legal Services & Support | 0 (0.0%) | 0 (0.0%) |
| Education Instruction & Library | 9 (81.8%) | 2 (18.2%) |
| Arts, Media & Entertainment | 0 (0.0%) | 0 (0.0%) |
| Health Diagnosing & Treating | 0 (0.0%) | 20 (100.0%) |
| Health Technologists | 0 (0.0%) | 13 (100.0%) |
| Total (Category) | 14 (29.2%) | 34 (70.8%) |
| Total (Overall) | 149 (51.7%) | 139 (48.3%) |
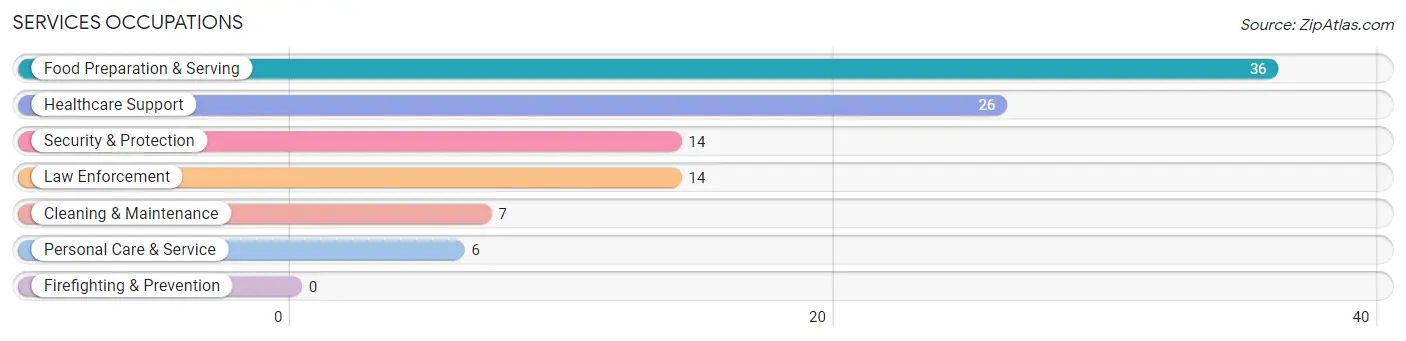
Services Occupations
The most common Services occupations in Simla are Food Preparation & Serving (36 | 12.5%), Healthcare Support (26 | 9.0%), Security & Protection (14 | 4.9%), Law Enforcement (14 | 4.9%), and Cleaning & Maintenance (7 | 2.4%).
Services Occupations by Sex
Within the Services occupations in Simla, the most male-oriented occupations are Security & Protection (100.0%), Law Enforcement (100.0%), and Cleaning & Maintenance (100.0%), while the most female-oriented occupations are Healthcare Support (100.0%), Personal Care & Service (100.0%), and Food Preparation & Serving (77.8%).
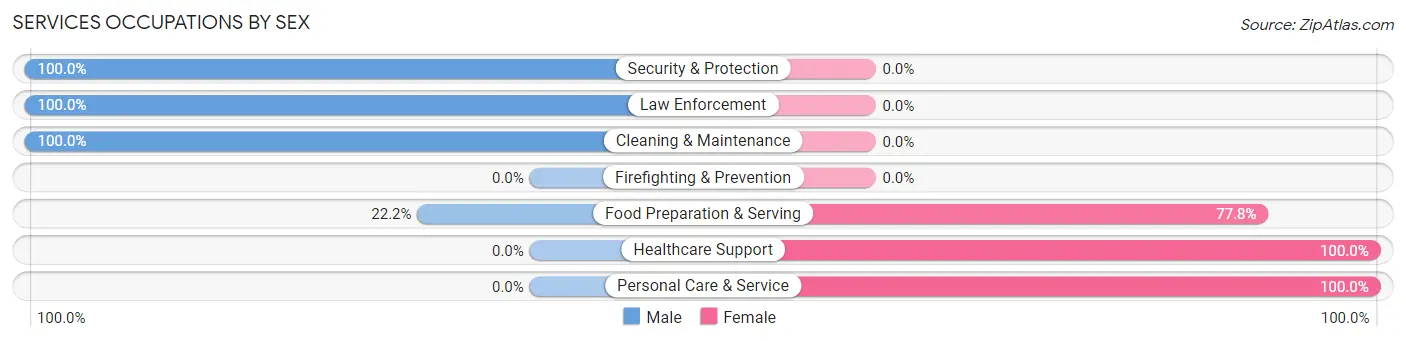
| Occupation | Male | Female |
| Healthcare Support | 0 (0.0%) | 26 (100.0%) |
| Security & Protection | 14 (100.0%) | 0 (0.0%) |
| Firefighting & Prevention | 0 (0.0%) | 0 (0.0%) |
| Law Enforcement | 14 (100.0%) | 0 (0.0%) |
| Food Preparation & Serving | 8 (22.2%) | 28 (77.8%) |
| Cleaning & Maintenance | 7 (100.0%) | 0 (0.0%) |
| Personal Care & Service | 0 (0.0%) | 6 (100.0%) |
| Total (Category) | 29 (32.6%) | 60 (67.4%) |
| Total (Overall) | 149 (51.7%) | 139 (48.3%) |
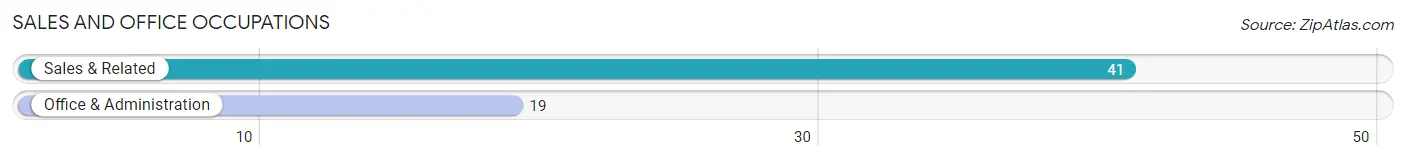
Sales and Office Occupations
The most common Sales and Office occupations in Simla are Sales & Related (41 | 14.2%), and Office & Administration (19 | 6.6%).
Sales and Office Occupations by Sex
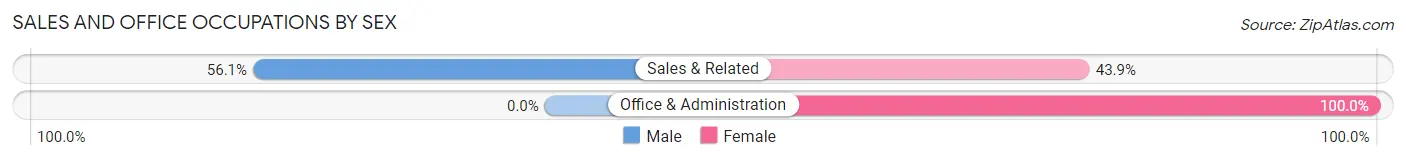
| Occupation | Male | Female |
| Sales & Related | 23 (56.1%) | 18 (43.9%) |
| Office & Administration | 0 (0.0%) | 19 (100.0%) |
| Total (Category) | 23 (38.3%) | 37 (61.7%) |
| Total (Overall) | 149 (51.7%) | 139 (48.3%) |
Natural Resources, Construction and Maintenance Occupations
The most common Natural Resources, Construction and Maintenance occupations in Simla are Installation, Maintenance & Repair (58 | 20.1%), and Construction & Extraction (14 | 4.9%).
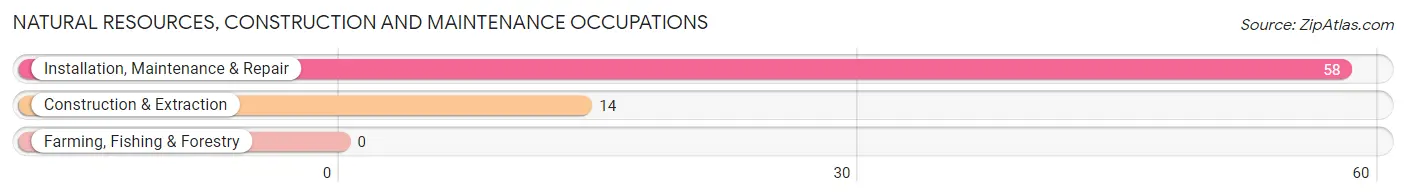
Natural Resources, Construction and Maintenance Occupations by Sex
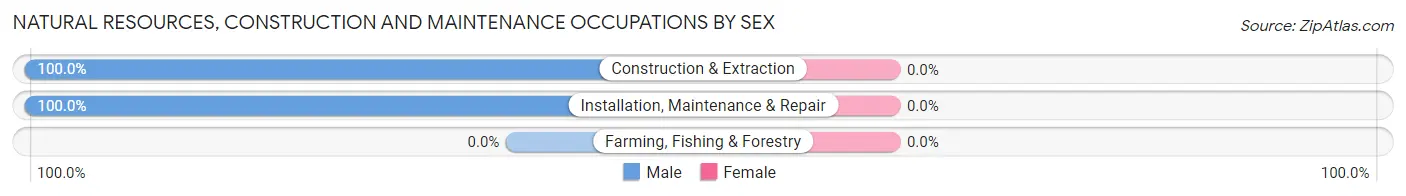
| Occupation | Male | Female |
| Farming, Fishing & Forestry | 0 (0.0%) | 0 (0.0%) |
| Construction & Extraction | 14 (100.0%) | 0 (0.0%) |
| Installation, Maintenance & Repair | 58 (100.0%) | 0 (0.0%) |
| Total (Category) | 72 (100.0%) | 0 (0.0%) |
| Total (Overall) | 149 (51.7%) | 139 (48.3%) |
Production, Transportation and Moving Occupations
The most common Production, Transportation and Moving occupations in Simla are Production (11 | 3.8%), and Material Moving (8 | 2.8%).
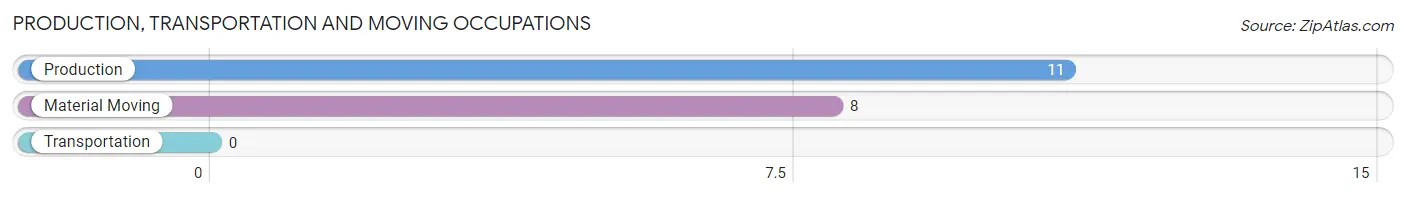
Production, Transportation and Moving Occupations by Sex
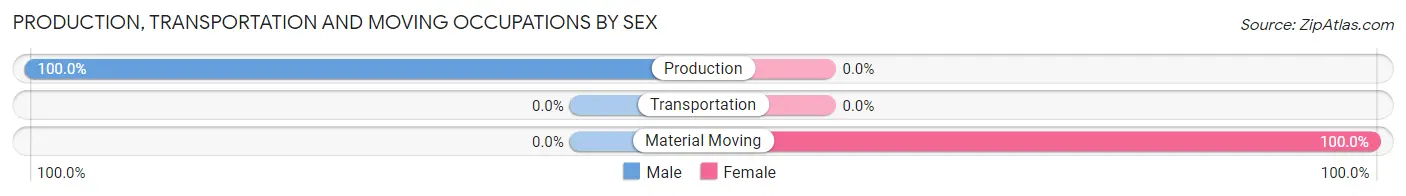
| Occupation | Male | Female |
| Production | 11 (100.0%) | 0 (0.0%) |
| Transportation | 0 (0.0%) | 0 (0.0%) |
| Material Moving | 0 (0.0%) | 8 (100.0%) |
| Total (Category) | 11 (57.9%) | 8 (42.1%) |
| Total (Overall) | 149 (51.7%) | 139 (48.3%) |
Employment Industries by Sex in Simla
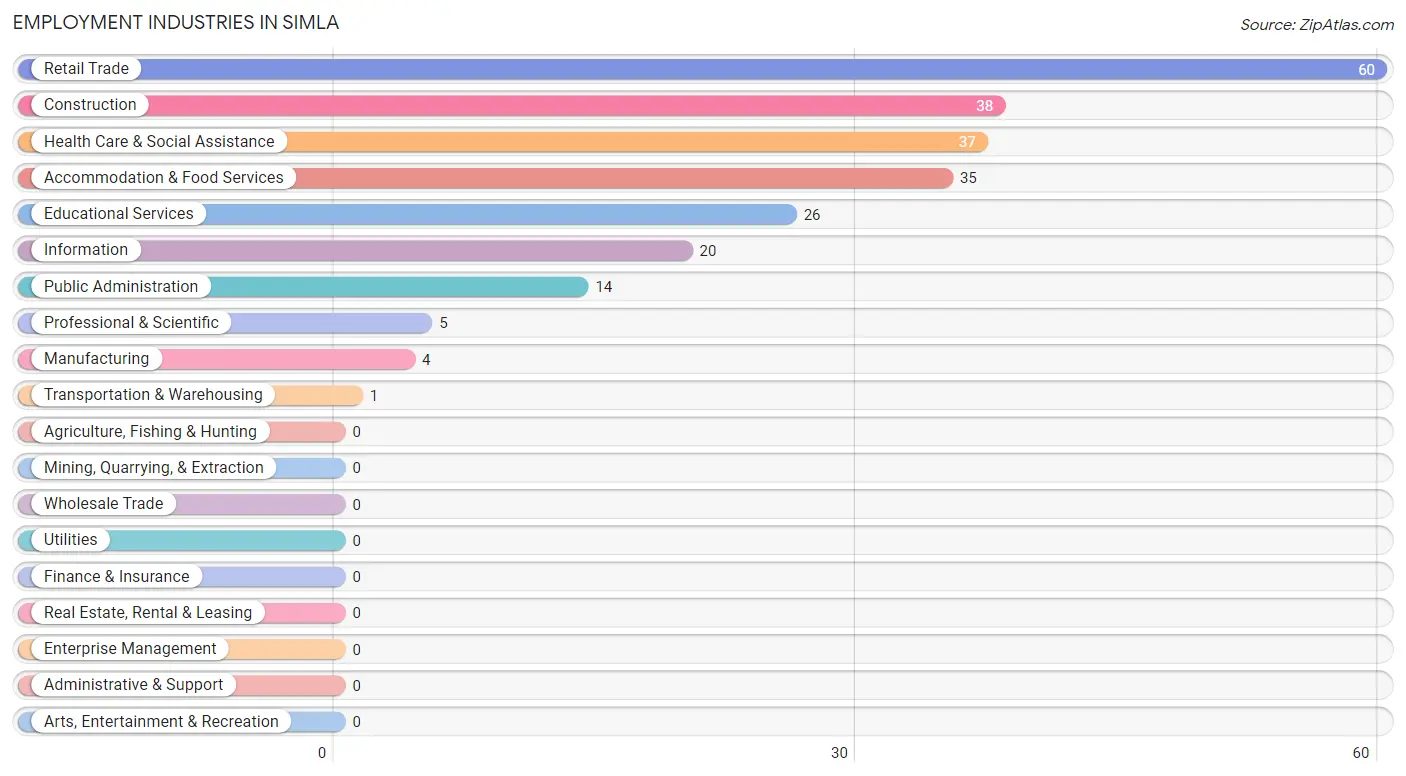
Employment Industries in Simla
The major employment industries in Simla include Retail Trade (60 | 20.8%), Construction (38 | 13.2%), Health Care & Social Assistance (37 | 12.9%), Accommodation & Food Services (35 | 12.1%), and Educational Services (26 | 9.0%).
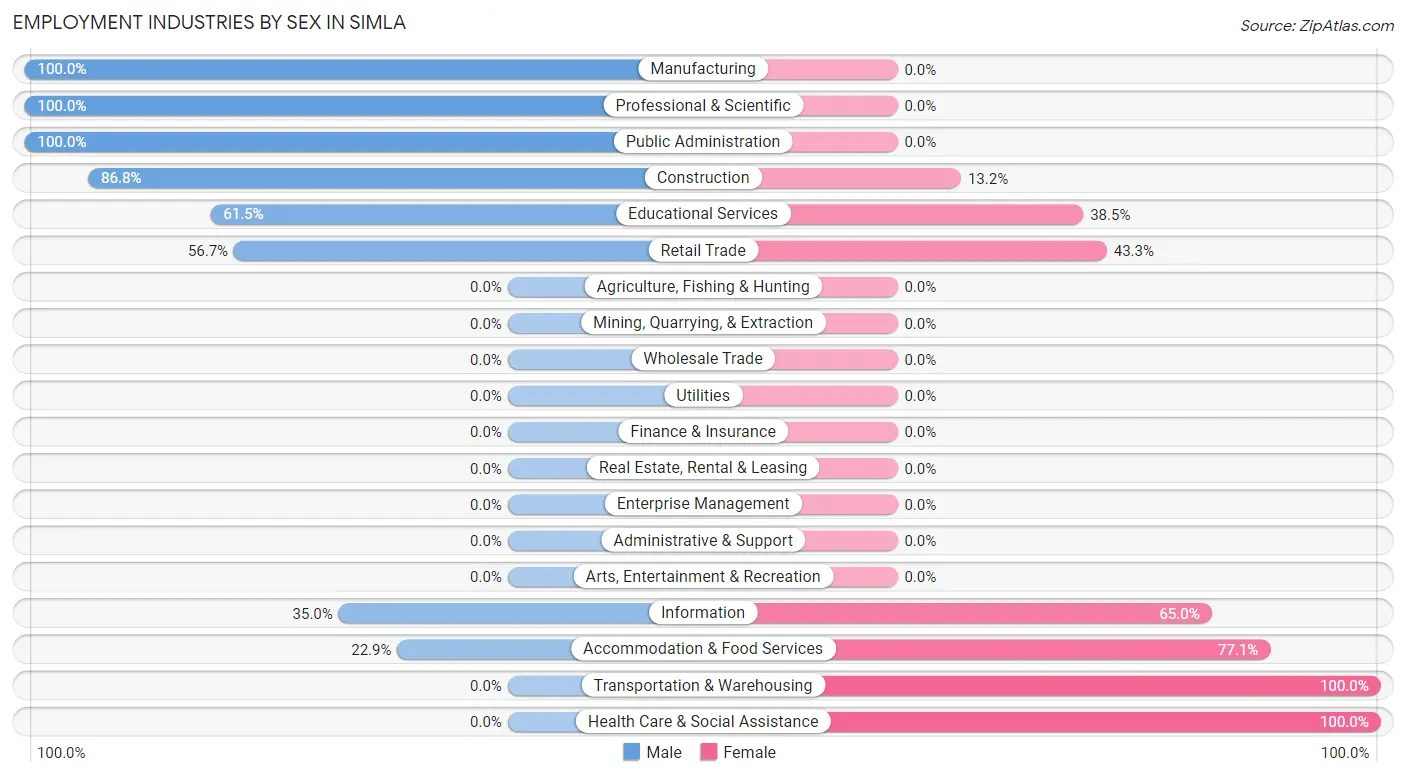
Employment Industries by Sex in Simla
The Simla industries that see more men than women are Manufacturing (100.0%), Professional & Scientific (100.0%), and Public Administration (100.0%), whereas the industries that tend to have a higher number of women are Transportation & Warehousing (100.0%), Health Care & Social Assistance (100.0%), and Accommodation & Food Services (77.1%).
| Industry | Male | Female |
| Agriculture, Fishing & Hunting | 0 (0.0%) | 0 (0.0%) |
| Mining, Quarrying, & Extraction | 0 (0.0%) | 0 (0.0%) |
| Construction | 33 (86.8%) | 5 (13.2%) |
| Manufacturing | 4 (100.0%) | 0 (0.0%) |
| Wholesale Trade | 0 (0.0%) | 0 (0.0%) |
| Retail Trade | 34 (56.7%) | 26 (43.3%) |
| Transportation & Warehousing | 0 (0.0%) | 1 (100.0%) |
| Utilities | 0 (0.0%) | 0 (0.0%) |
| Information | 7 (35.0%) | 13 (65.0%) |
| Finance & Insurance | 0 (0.0%) | 0 (0.0%) |
| Real Estate, Rental & Leasing | 0 (0.0%) | 0 (0.0%) |
| Professional & Scientific | 5 (100.0%) | 0 (0.0%) |
| Enterprise Management | 0 (0.0%) | 0 (0.0%) |
| Administrative & Support | 0 (0.0%) | 0 (0.0%) |
| Educational Services | 16 (61.5%) | 10 (38.5%) |
| Health Care & Social Assistance | 0 (0.0%) | 37 (100.0%) |
| Arts, Entertainment & Recreation | 0 (0.0%) | 0 (0.0%) |
| Accommodation & Food Services | 8 (22.9%) | 27 (77.1%) |
| Public Administration | 14 (100.0%) | 0 (0.0%) |
| Total | 149 (51.7%) | 139 (48.3%) |
Education in Simla
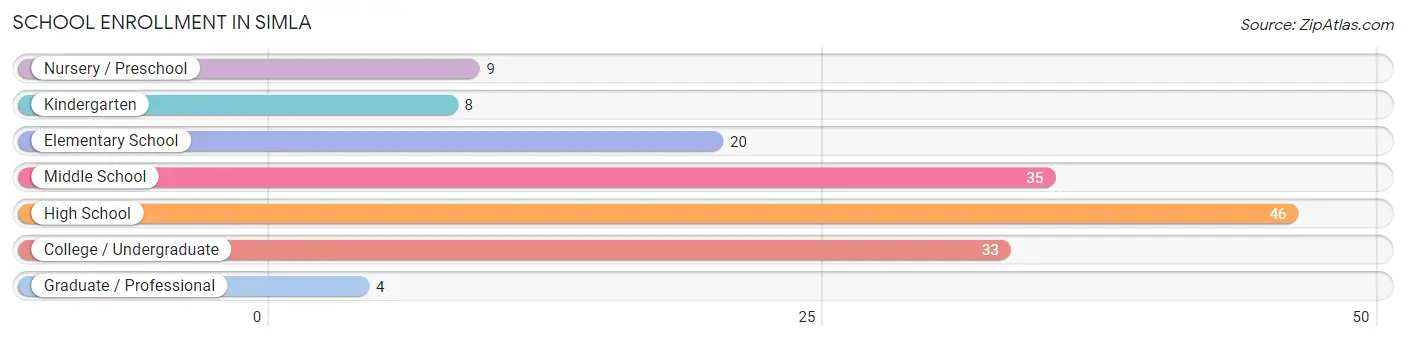
School Enrollment in Simla
The most common levels of schooling among the 155 students in Simla are high school (46 | 29.7%), middle school (35 | 22.6%), and college / undergraduate (33 | 21.3%).
| School Level | # Students | % Students |
| Nursery / Preschool | 9 | 5.8% |
| Kindergarten | 8 | 5.2% |
| Elementary School | 20 | 12.9% |
| Middle School | 35 | 22.6% |
| High School | 46 | 29.7% |
| College / Undergraduate | 33 | 21.3% |
| Graduate / Professional | 4 | 2.6% |
| Total | 155 | 100.0% |
School Enrollment by Age by Funding Source in Simla
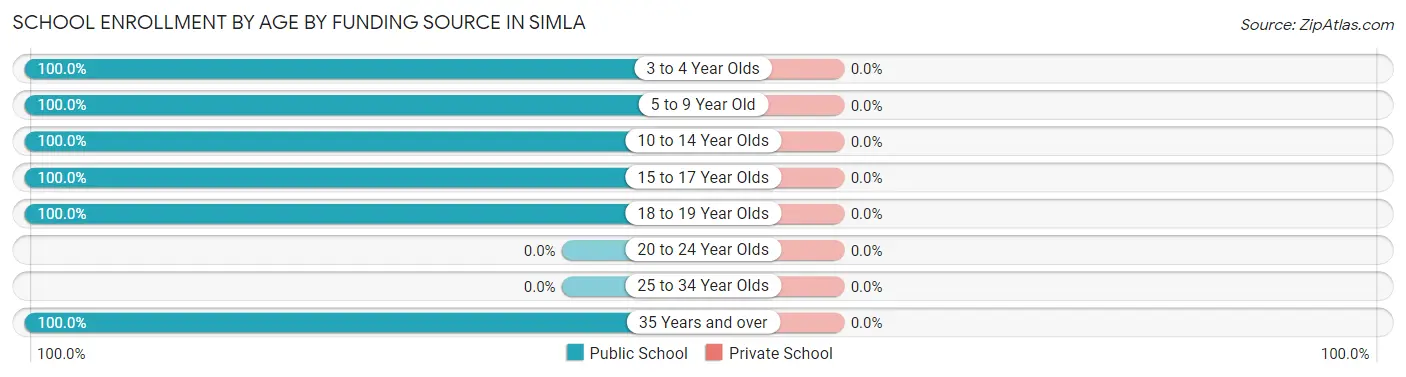
| Age Bracket | Public School | Private School |
| 3 to 4 Year Olds | 5 (100.0%) | 0 (0.0%) |
| 5 to 9 Year Old | 32 (100.0%) | 0 (0.0%) |
| 10 to 14 Year Olds | 35 (100.0%) | 0 (0.0%) |
| 15 to 17 Year Olds | 63 (100.0%) | 0 (0.0%) |
| 18 to 19 Year Olds | 11 (100.0%) | 0 (0.0%) |
| 20 to 24 Year Olds | 0 (0.0%) | 0 (0.0%) |
| 25 to 34 Year Olds | 0 (0.0%) | 0 (0.0%) |
| 35 Years and over | 9 (100.0%) | 0 (0.0%) |
| Total | 155 (100.0%) | 0 (0.0%) |
Educational Attainment by Field of Study in Simla
Education (39 | 43.8%), business (11 | 12.4%), physical & health sciences (9 | 10.1%), social sciences (8 | 9.0%), and liberal arts & history (8 | 9.0%) are the most common fields of study among 89 individuals in Simla who have obtained a bachelor's degree or higher.
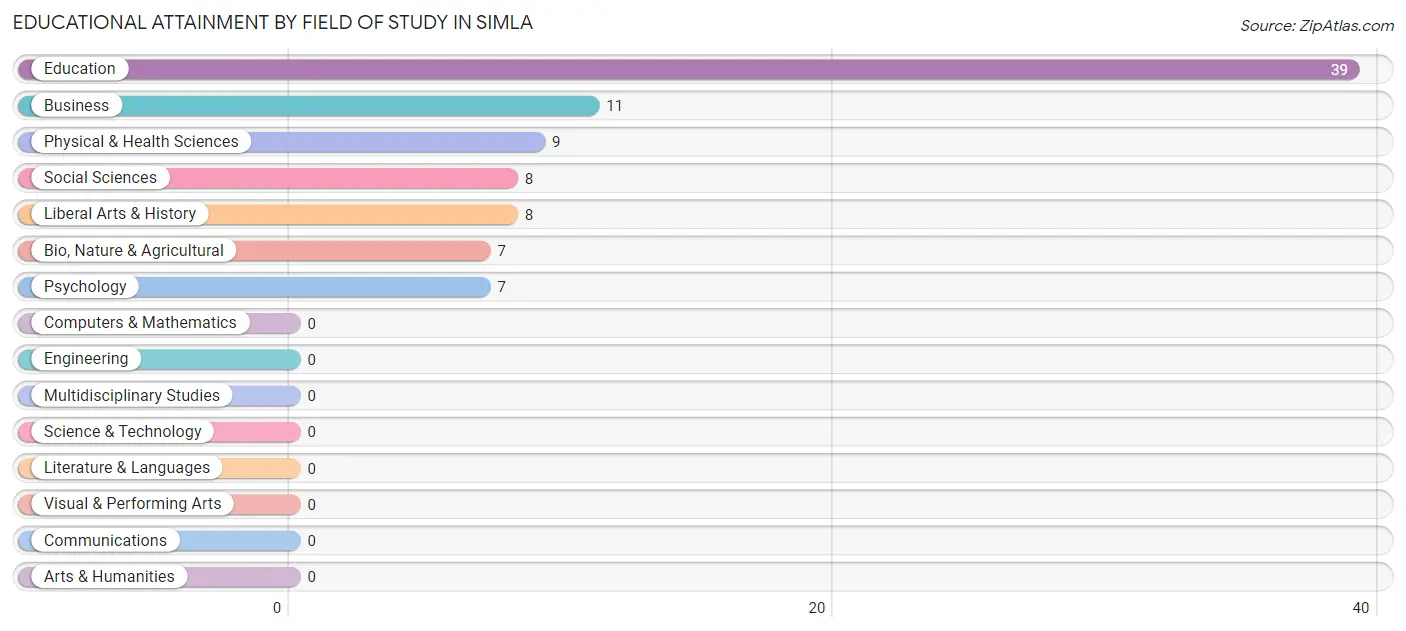
| Field of Study | # Graduates | % Graduates |
| Computers & Mathematics | 0 | 0.0% |
| Bio, Nature & Agricultural | 7 | 7.9% |
| Physical & Health Sciences | 9 | 10.1% |
| Psychology | 7 | 7.9% |
| Social Sciences | 8 | 9.0% |
| Engineering | 0 | 0.0% |
| Multidisciplinary Studies | 0 | 0.0% |
| Science & Technology | 0 | 0.0% |
| Business | 11 | 12.4% |
| Education | 39 | 43.8% |
| Literature & Languages | 0 | 0.0% |
| Liberal Arts & History | 8 | 9.0% |
| Visual & Performing Arts | 0 | 0.0% |
| Communications | 0 | 0.0% |
| Arts & Humanities | 0 | 0.0% |
| Total | 89 | 100.0% |
Transportation & Commute in Simla
Vehicle Availability by Sex in Simla
The most prevalent vehicle ownership categories in Simla are males with 3 vehicles (82, accounting for 55.0%) and females with 3 vehicles (61, making up 68.9%).
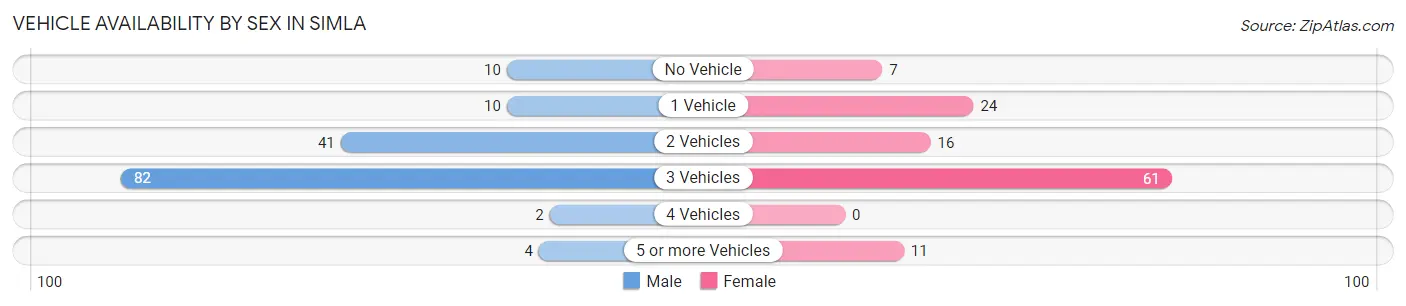
| Vehicles Available | Male | Female |
| No Vehicle | 10 (6.7%) | 7 (5.9%) |
| 1 Vehicle | 10 (6.7%) | 24 (20.2%) |
| 2 Vehicles | 41 (27.5%) | 16 (13.5%) |
| 3 Vehicles | 82 (55.0%) | 61 (51.3%) |
| 4 Vehicles | 2 (1.3%) | 0 (0.0%) |
| 5 or more Vehicles | 4 (2.7%) | 11 (9.2%) |
| Total | 149 (100.0%) | 119 (100.0%) |
Commute Time in Simla
The most frequently occuring commute durations in Simla are 45 to 59 minutes (75 commuters, 31.1%), less than 5 minutes (56 commuters, 23.2%), and 5 to 9 minutes (38 commuters, 15.8%).
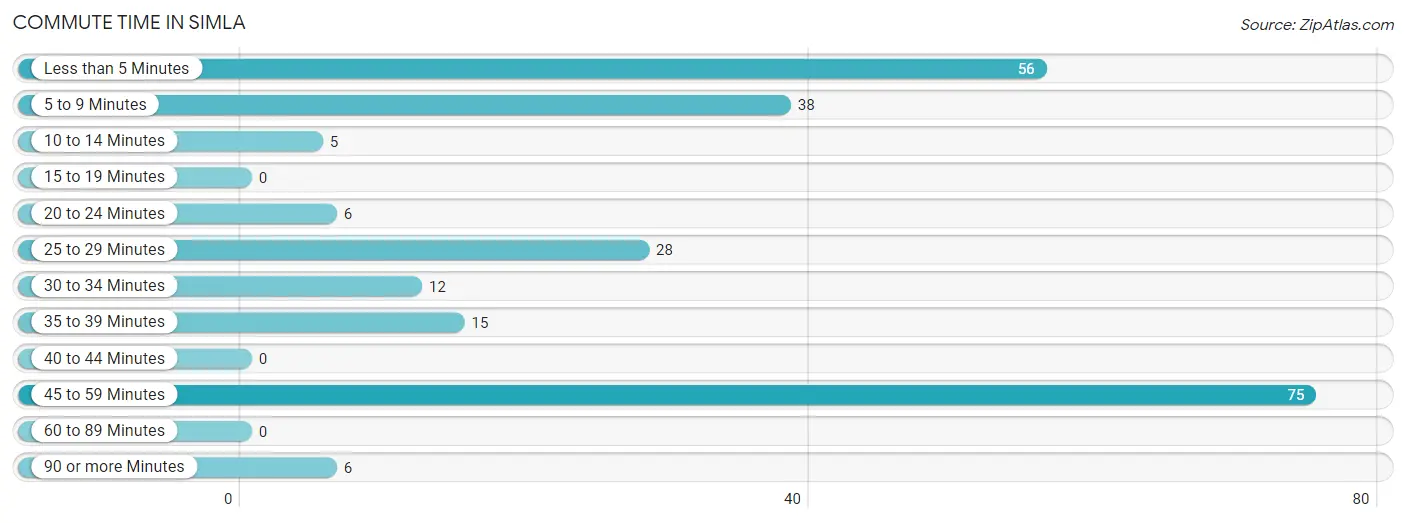
| Commute Time | # Commuters | % Commuters |
| Less than 5 Minutes | 56 | 23.2% |
| 5 to 9 Minutes | 38 | 15.8% |
| 10 to 14 Minutes | 5 | 2.1% |
| 15 to 19 Minutes | 0 | 0.0% |
| 20 to 24 Minutes | 6 | 2.5% |
| 25 to 29 Minutes | 28 | 11.6% |
| 30 to 34 Minutes | 12 | 5.0% |
| 35 to 39 Minutes | 15 | 6.2% |
| 40 to 44 Minutes | 0 | 0.0% |
| 45 to 59 Minutes | 75 | 31.1% |
| 60 to 89 Minutes | 0 | 0.0% |
| 90 or more Minutes | 6 | 2.5% |
Commute Time by Sex in Simla
The most common commute times in Simla are 45 to 59 minutes (43 commuters, 28.9%) for males and 45 to 59 minutes (32 commuters, 34.8%) for females.
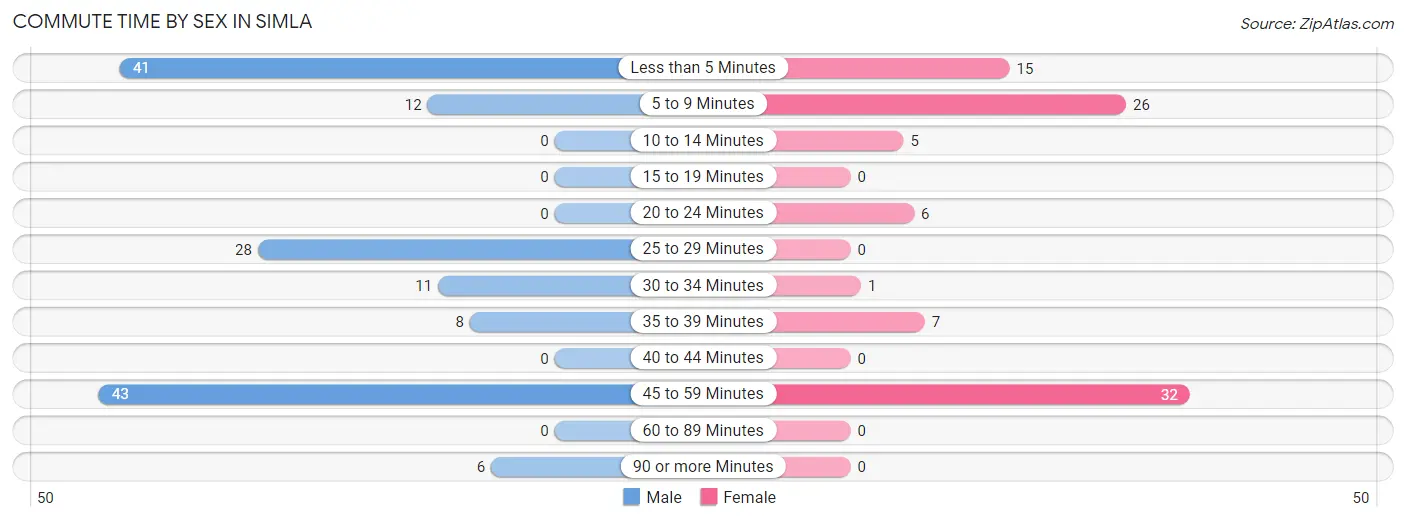
| Commute Time | Male | Female |
| Less than 5 Minutes | 41 (27.5%) | 15 (16.3%) |
| 5 to 9 Minutes | 12 (8.1%) | 26 (28.3%) |
| 10 to 14 Minutes | 0 (0.0%) | 5 (5.4%) |
| 15 to 19 Minutes | 0 (0.0%) | 0 (0.0%) |
| 20 to 24 Minutes | 0 (0.0%) | 6 (6.5%) |
| 25 to 29 Minutes | 28 (18.8%) | 0 (0.0%) |
| 30 to 34 Minutes | 11 (7.4%) | 1 (1.1%) |
| 35 to 39 Minutes | 8 (5.4%) | 7 (7.6%) |
| 40 to 44 Minutes | 0 (0.0%) | 0 (0.0%) |
| 45 to 59 Minutes | 43 (28.9%) | 32 (34.8%) |
| 60 to 89 Minutes | 0 (0.0%) | 0 (0.0%) |
| 90 or more Minutes | 6 (4.0%) | 0 (0.0%) |
Time of Departure to Work by Sex in Simla
The most frequent times of departure to work in Simla are 7:00 AM to 7:29 AM (71, 47.6%) for males and 8:00 AM to 8:29 AM (33, 35.9%) for females.

| Time of Departure | Male | Female |
| 12:00 AM to 4:59 AM | 4 (2.7%) | 0 (0.0%) |
| 5:00 AM to 5:29 AM | 17 (11.4%) | 0 (0.0%) |
| 5:30 AM to 5:59 AM | 0 (0.0%) | 0 (0.0%) |
| 6:00 AM to 6:29 AM | 6 (4.0%) | 12 (13.0%) |
| 6:30 AM to 6:59 AM | 14 (9.4%) | 0 (0.0%) |
| 7:00 AM to 7:29 AM | 71 (47.6%) | 16 (17.4%) |
| 7:30 AM to 7:59 AM | 0 (0.0%) | 6 (6.5%) |
| 8:00 AM to 8:29 AM | 18 (12.1%) | 33 (35.9%) |
| 8:30 AM to 8:59 AM | 0 (0.0%) | 7 (7.6%) |
| 9:00 AM to 9:59 AM | 12 (8.1%) | 0 (0.0%) |
| 10:00 AM to 10:59 AM | 7 (4.7%) | 0 (0.0%) |
| 11:00 AM to 11:59 AM | 0 (0.0%) | 18 (19.6%) |
| 12:00 PM to 3:59 PM | 0 (0.0%) | 0 (0.0%) |
| 4:00 PM to 11:59 PM | 0 (0.0%) | 0 (0.0%) |
| Total | 149 (100.0%) | 92 (100.0%) |
Housing Occupancy in Simla
Occupancy by Ownership in Simla
Of the total 246 dwellings in Simla, owner-occupied units account for 135 (54.9%), while renter-occupied units make up 111 (45.1%).

| Occupancy | # Housing Units | % Housing Units |
| Owner Occupied Housing Units | 135 | 54.9% |
| Renter-Occupied Housing Units | 111 | 45.1% |
| Total Occupied Housing Units | 246 | 100.0% |
Occupancy by Household Size in Simla
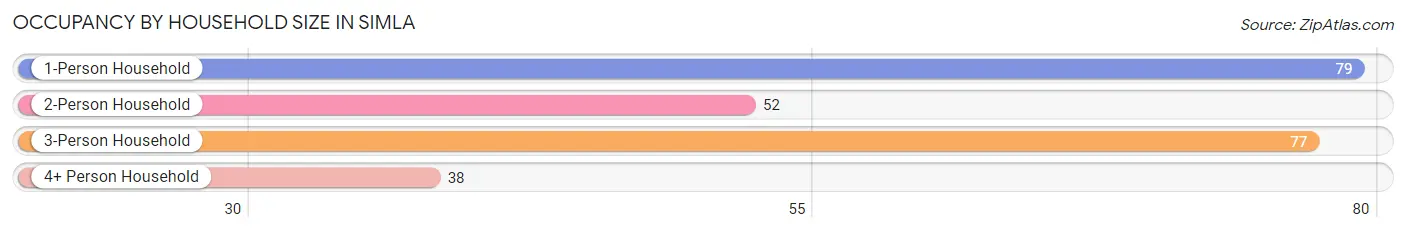
| Household Size | # Housing Units | % Housing Units |
| 1-Person Household | 79 | 32.1% |
| 2-Person Household | 52 | 21.1% |
| 3-Person Household | 77 | 31.3% |
| 4+ Person Household | 38 | 15.4% |
| Total Housing Units | 246 | 100.0% |
Occupancy by Ownership by Household Size in Simla
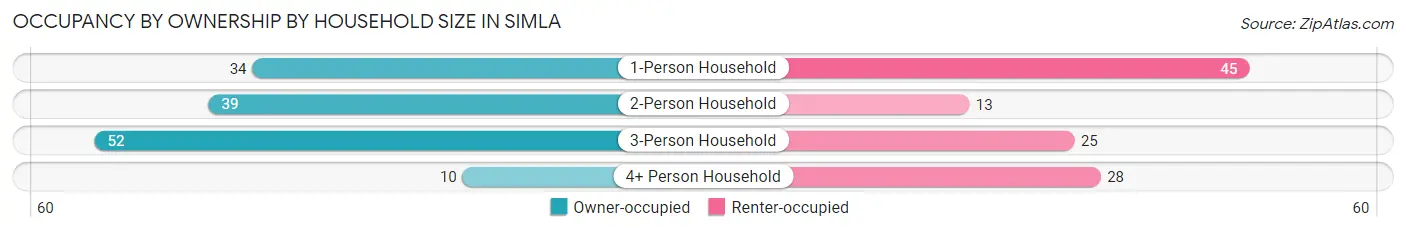
| Household Size | Owner-occupied | Renter-occupied |
| 1-Person Household | 34 (43.0%) | 45 (57.0%) |
| 2-Person Household | 39 (75.0%) | 13 (25.0%) |
| 3-Person Household | 52 (67.5%) | 25 (32.5%) |
| 4+ Person Household | 10 (26.3%) | 28 (73.7%) |
| Total Housing Units | 135 (54.9%) | 111 (45.1%) |
Occupancy by Educational Attainment in Simla
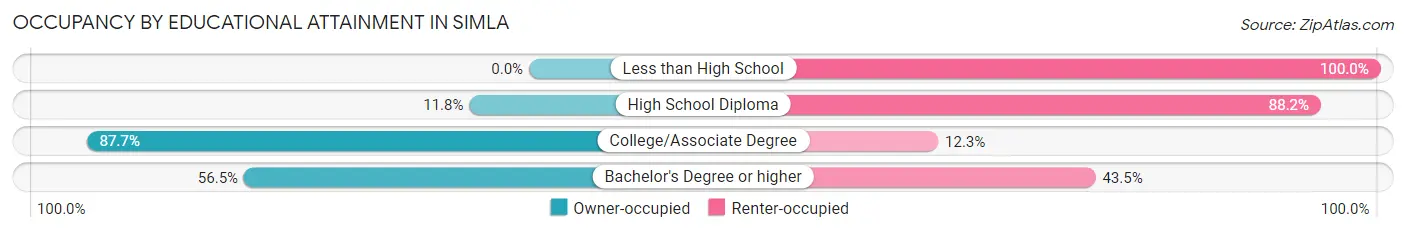
| Household Size | Owner-occupied | Renter-occupied |
| Less than High School | 0 (0.0%) | 10 (100.0%) |
| High School Diploma | 9 (11.8%) | 67 (88.2%) |
| College/Associate Degree | 100 (87.7%) | 14 (12.3%) |
| Bachelor's Degree or higher | 26 (56.5%) | 20 (43.5%) |
Occupancy by Age of Householder in Simla
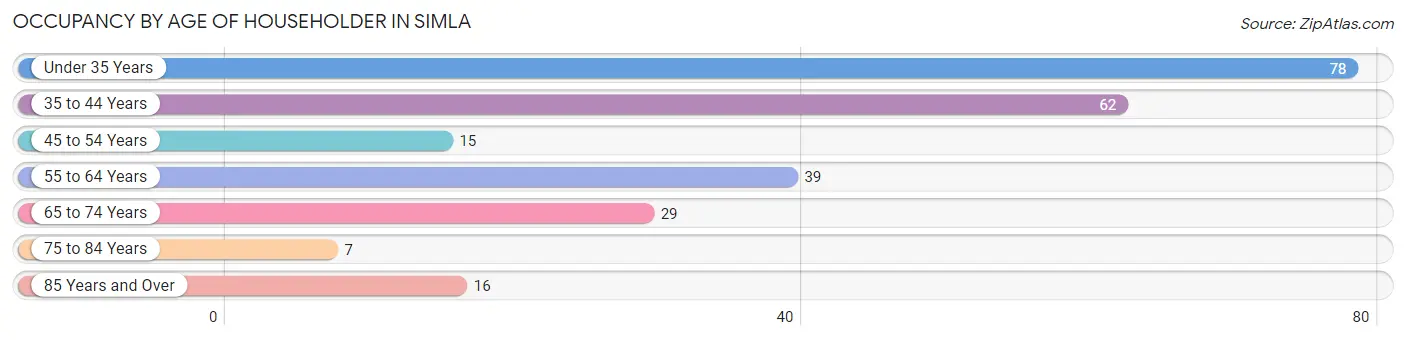
| Age Bracket | # Households | % Households |
| Under 35 Years | 78 | 31.7% |
| 35 to 44 Years | 62 | 25.2% |
| 45 to 54 Years | 15 | 6.1% |
| 55 to 64 Years | 39 | 15.9% |
| 65 to 74 Years | 29 | 11.8% |
| 75 to 84 Years | 7 | 2.9% |
| 85 Years and Over | 16 | 6.5% |
| Total | 246 | 100.0% |
Housing Finances in Simla
Median Income by Occupancy in Simla
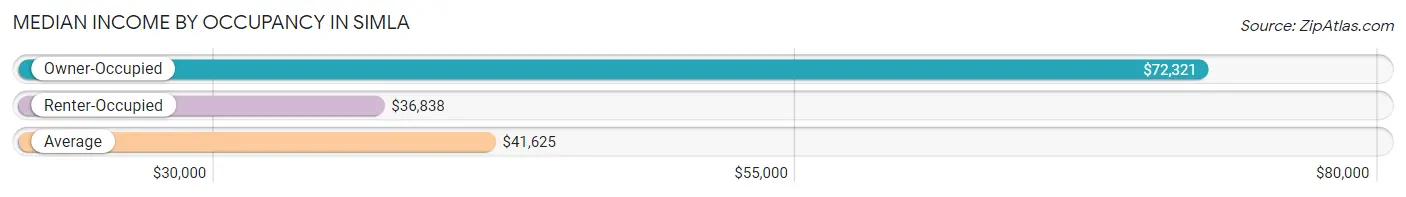
| Occupancy Type | # Households | Median Income |
| Owner-Occupied | 135 (54.9%) | $72,321 |
| Renter-Occupied | 111 (45.1%) | $36,838 |
| Average | 246 (100.0%) | $41,625 |
Occupancy by Householder Income Bracket in Simla
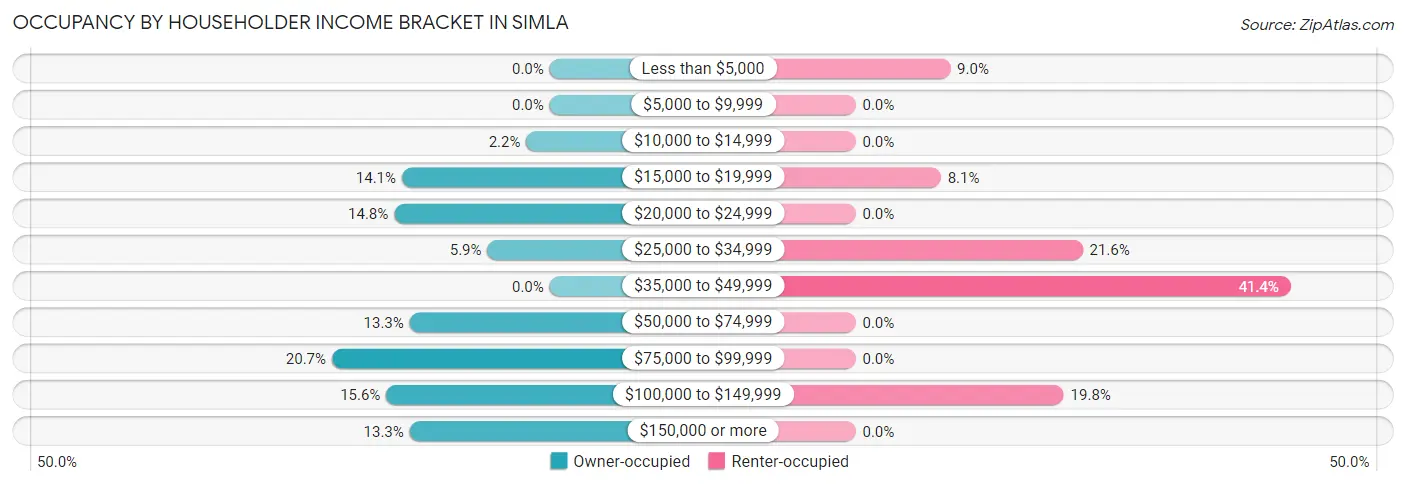
| Income Bracket | Owner-occupied | Renter-occupied |
| Less than $5,000 | 0 (0.0%) | 10 (9.0%) |
| $5,000 to $9,999 | 0 (0.0%) | 0 (0.0%) |
| $10,000 to $14,999 | 3 (2.2%) | 0 (0.0%) |
| $15,000 to $19,999 | 19 (14.1%) | 9 (8.1%) |
| $20,000 to $24,999 | 20 (14.8%) | 0 (0.0%) |
| $25,000 to $34,999 | 8 (5.9%) | 24 (21.6%) |
| $35,000 to $49,999 | 0 (0.0%) | 46 (41.4%) |
| $50,000 to $74,999 | 18 (13.3%) | 0 (0.0%) |
| $75,000 to $99,999 | 28 (20.7%) | 0 (0.0%) |
| $100,000 to $149,999 | 21 (15.6%) | 22 (19.8%) |
| $150,000 or more | 18 (13.3%) | 0 (0.0%) |
| Total | 135 (100.0%) | 111 (100.0%) |
Monthly Housing Cost Tiers in Simla
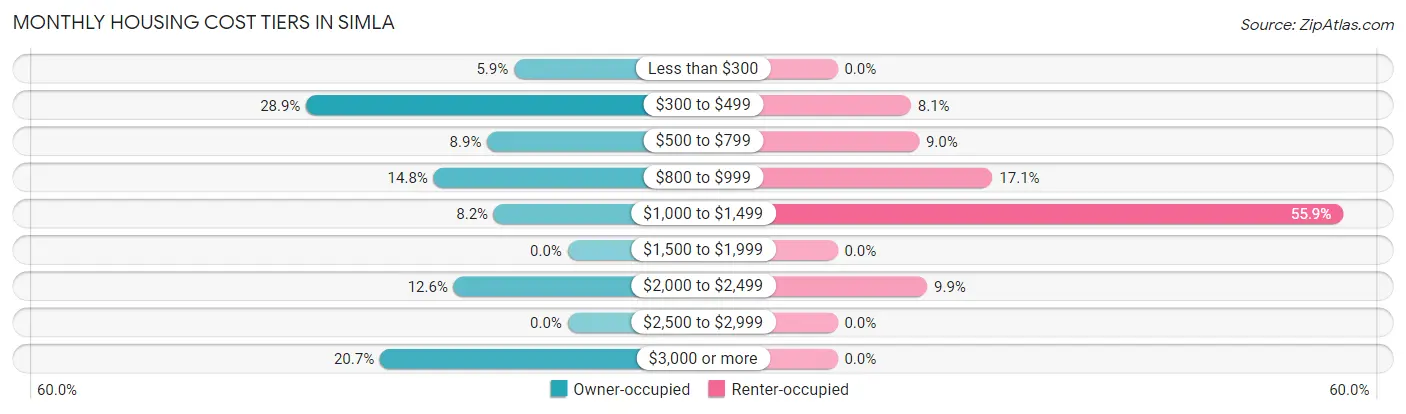
| Monthly Cost | Owner-occupied | Renter-occupied |
| Less than $300 | 8 (5.9%) | 0 (0.0%) |
| $300 to $499 | 39 (28.9%) | 9 (8.1%) |
| $500 to $799 | 12 (8.9%) | 10 (9.0%) |
| $800 to $999 | 20 (14.8%) | 19 (17.1%) |
| $1,000 to $1,499 | 11 (8.2%) | 62 (55.9%) |
| $1,500 to $1,999 | 0 (0.0%) | 0 (0.0%) |
| $2,000 to $2,499 | 17 (12.6%) | 11 (9.9%) |
| $2,500 to $2,999 | 0 (0.0%) | 0 (0.0%) |
| $3,000 or more | 28 (20.7%) | 0 (0.0%) |
| Total | 135 (100.0%) | 111 (100.0%) |
Physical Housing Characteristics in Simla
Housing Structures in Simla
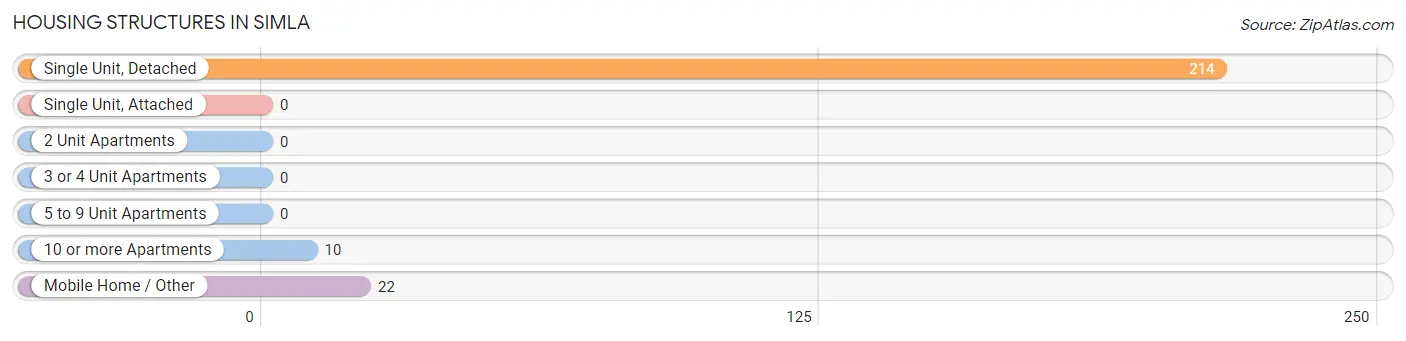
| Structure Type | # Housing Units | % Housing Units |
| Single Unit, Detached | 214 | 87.0% |
| Single Unit, Attached | 0 | 0.0% |
| 2 Unit Apartments | 0 | 0.0% |
| 3 or 4 Unit Apartments | 0 | 0.0% |
| 5 to 9 Unit Apartments | 0 | 0.0% |
| 10 or more Apartments | 10 | 4.1% |
| Mobile Home / Other | 22 | 8.9% |
| Total | 246 | 100.0% |
Housing Structures by Occupancy in Simla
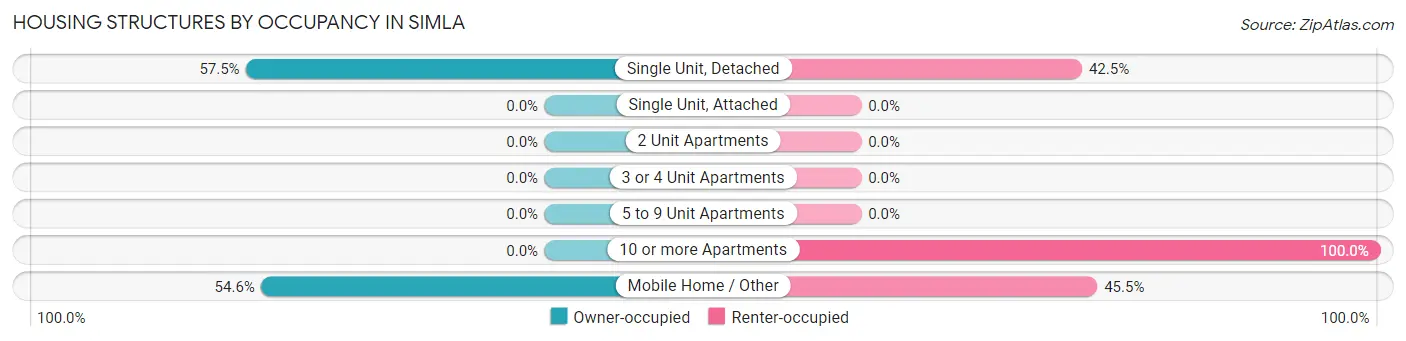
| Structure Type | Owner-occupied | Renter-occupied |
| Single Unit, Detached | 123 (57.5%) | 91 (42.5%) |
| Single Unit, Attached | 0 (0.0%) | 0 (0.0%) |
| 2 Unit Apartments | 0 (0.0%) | 0 (0.0%) |
| 3 or 4 Unit Apartments | 0 (0.0%) | 0 (0.0%) |
| 5 to 9 Unit Apartments | 0 (0.0%) | 0 (0.0%) |
| 10 or more Apartments | 0 (0.0%) | 10 (100.0%) |
| Mobile Home / Other | 12 (54.5%) | 10 (45.5%) |
| Total | 135 (54.9%) | 111 (45.1%) |
Housing Structures by Number of Rooms in Simla
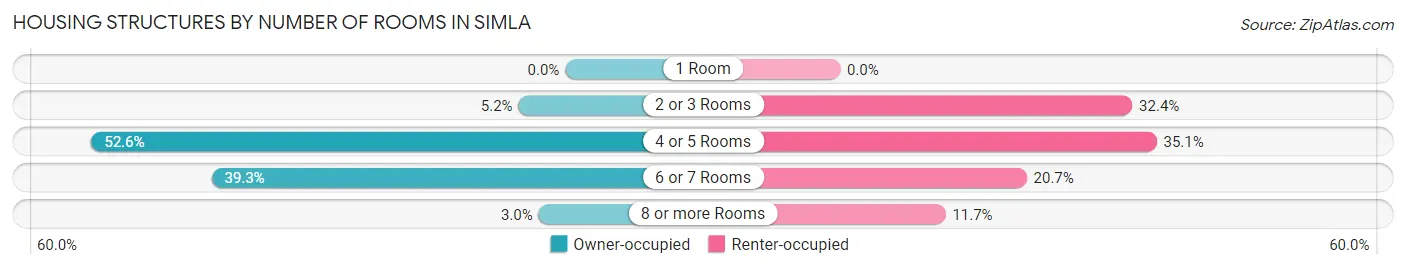
| Number of Rooms | Owner-occupied | Renter-occupied |
| 1 Room | 0 (0.0%) | 0 (0.0%) |
| 2 or 3 Rooms | 7 (5.2%) | 36 (32.4%) |
| 4 or 5 Rooms | 71 (52.6%) | 39 (35.1%) |
| 6 or 7 Rooms | 53 (39.3%) | 23 (20.7%) |
| 8 or more Rooms | 4 (3.0%) | 13 (11.7%) |
| Total | 135 (100.0%) | 111 (100.0%) |
Housing Structure by Heating Type in Simla
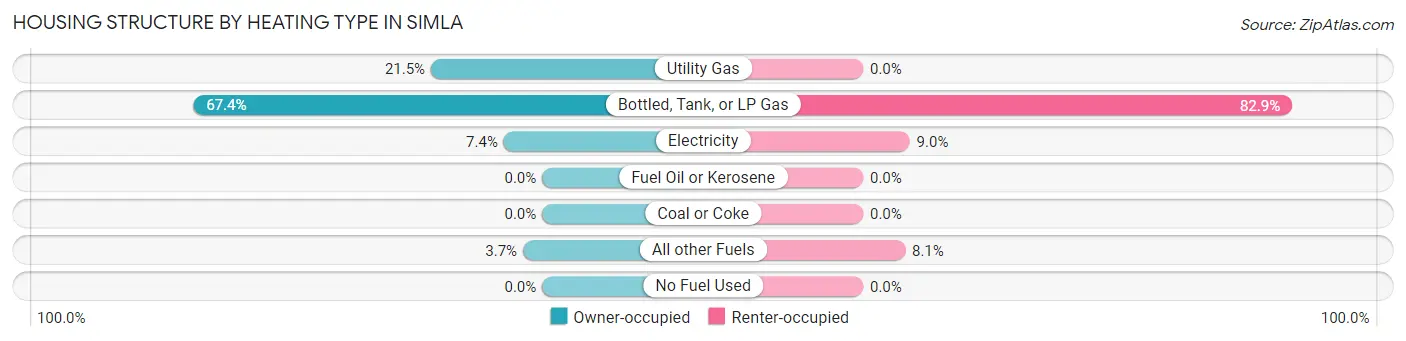
| Heating Type | Owner-occupied | Renter-occupied |
| Utility Gas | 29 (21.5%) | 0 (0.0%) |
| Bottled, Tank, or LP Gas | 91 (67.4%) | 92 (82.9%) |
| Electricity | 10 (7.4%) | 10 (9.0%) |
| Fuel Oil or Kerosene | 0 (0.0%) | 0 (0.0%) |
| Coal or Coke | 0 (0.0%) | 0 (0.0%) |
| All other Fuels | 5 (3.7%) | 9 (8.1%) |
| No Fuel Used | 0 (0.0%) | 0 (0.0%) |
| Total | 135 (100.0%) | 111 (100.0%) |
Household Vehicle Usage in Simla
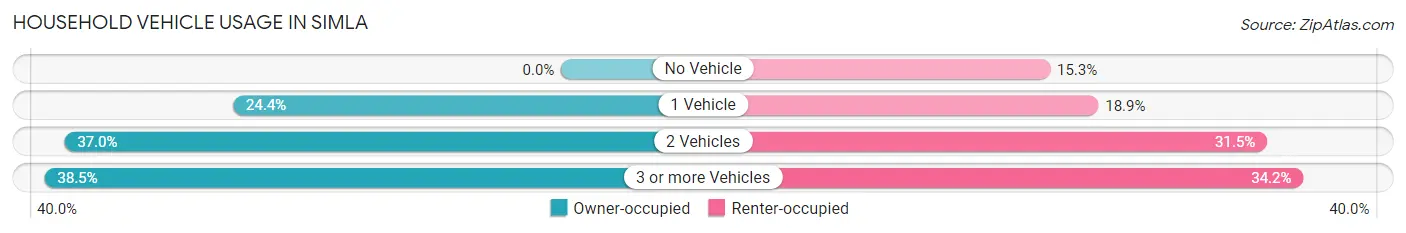
| Vehicles per Household | Owner-occupied | Renter-occupied |
| No Vehicle | 0 (0.0%) | 17 (15.3%) |
| 1 Vehicle | 33 (24.4%) | 21 (18.9%) |
| 2 Vehicles | 50 (37.0%) | 35 (31.5%) |
| 3 or more Vehicles | 52 (38.5%) | 38 (34.2%) |
| Total | 135 (100.0%) | 111 (100.0%) |
Real Estate & Mortgages in Simla
Real Estate and Mortgage Overview in Simla
| Characteristic | Without Mortgage | With Mortgage |
| Housing Units | 57 | 78 |
| Median Property Value | $218,200 | $164,300 |
| Median Household Income | - | - |
| Monthly Housing Costs | $395 | $28 |
| Real Estate Taxes | $529 | $0 |
Property Value by Mortgage Status in Simla
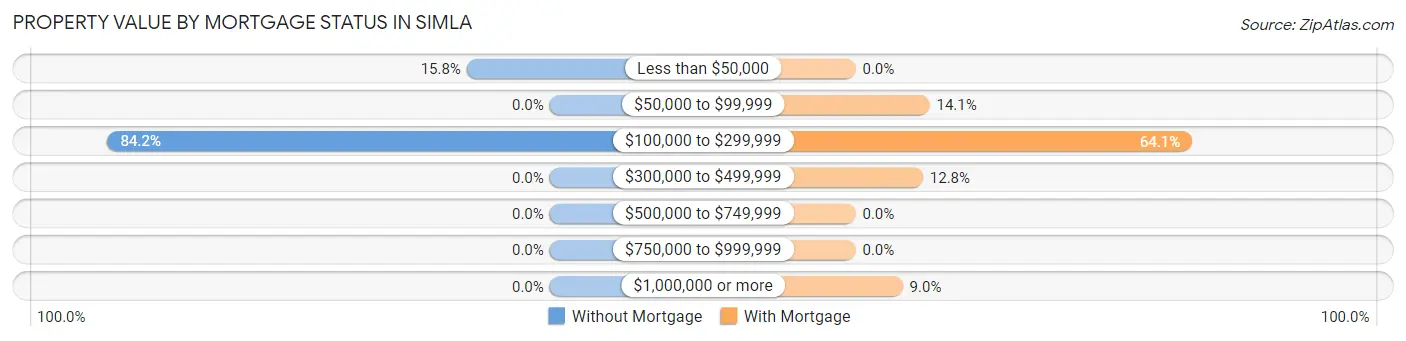
| Property Value | Without Mortgage | With Mortgage |
| Less than $50,000 | 9 (15.8%) | 0 (0.0%) |
| $50,000 to $99,999 | 0 (0.0%) | 11 (14.1%) |
| $100,000 to $299,999 | 48 (84.2%) | 50 (64.1%) |
| $300,000 to $499,999 | 0 (0.0%) | 10 (12.8%) |
| $500,000 to $749,999 | 0 (0.0%) | 0 (0.0%) |
| $750,000 to $999,999 | 0 (0.0%) | 0 (0.0%) |
| $1,000,000 or more | 0 (0.0%) | 7 (9.0%) |
| Total | 57 (100.0%) | 78 (100.0%) |
Household Income by Mortgage Status in Simla
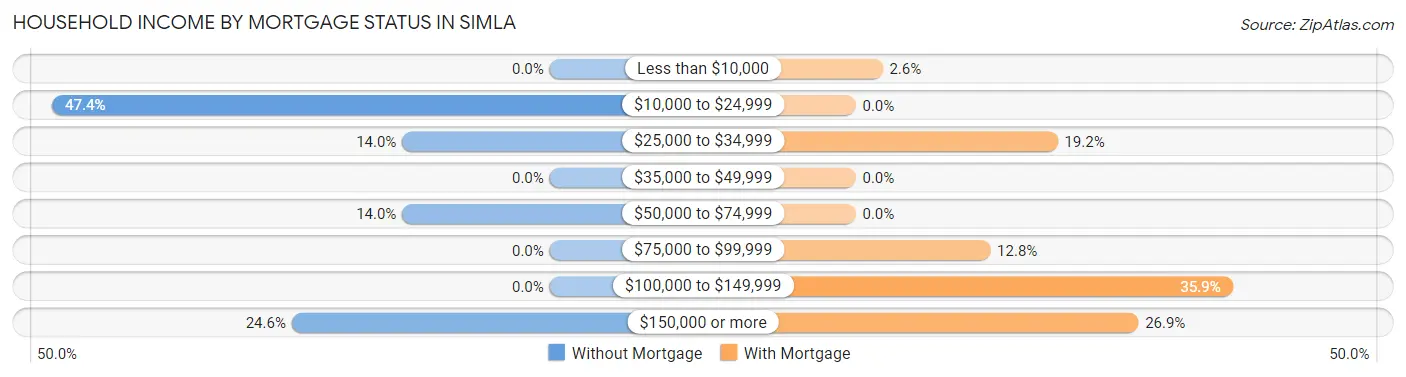
| Household Income | Without Mortgage | With Mortgage |
| Less than $10,000 | 0 (0.0%) | 2 (2.6%) |
| $10,000 to $24,999 | 27 (47.4%) | 0 (0.0%) |
| $25,000 to $34,999 | 8 (14.0%) | 15 (19.2%) |
| $35,000 to $49,999 | 0 (0.0%) | 0 (0.0%) |
| $50,000 to $74,999 | 8 (14.0%) | 0 (0.0%) |
| $75,000 to $99,999 | 0 (0.0%) | 10 (12.8%) |
| $100,000 to $149,999 | 0 (0.0%) | 28 (35.9%) |
| $150,000 or more | 14 (24.6%) | 21 (26.9%) |
| Total | 57 (100.0%) | 78 (100.0%) |
Property Value to Household Income Ratio in Simla
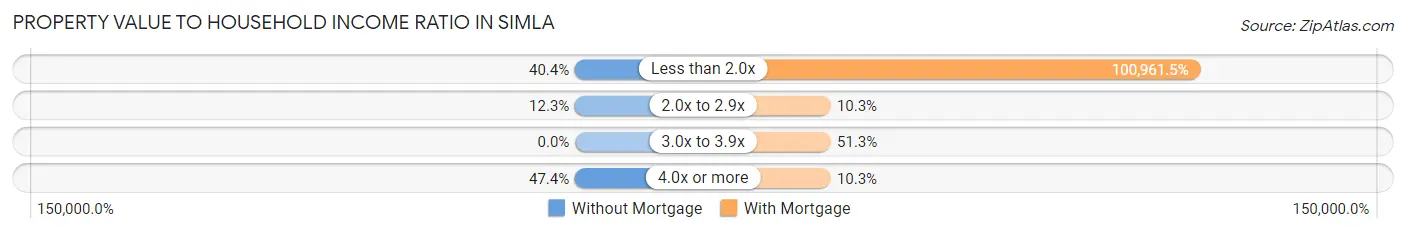
| Value-to-Income Ratio | Without Mortgage | With Mortgage |
| Less than 2.0x | 23 (40.4%) | 78,750 (100,961.5%) |
| 2.0x to 2.9x | 7 (12.3%) | 8 (10.3%) |
| 3.0x to 3.9x | 0 (0.0%) | 40 (51.3%) |
| 4.0x or more | 27 (47.4%) | 8 (10.3%) |
| Total | 57 (100.0%) | 78 (100.0%) |
Real Estate Taxes by Mortgage Status in Simla
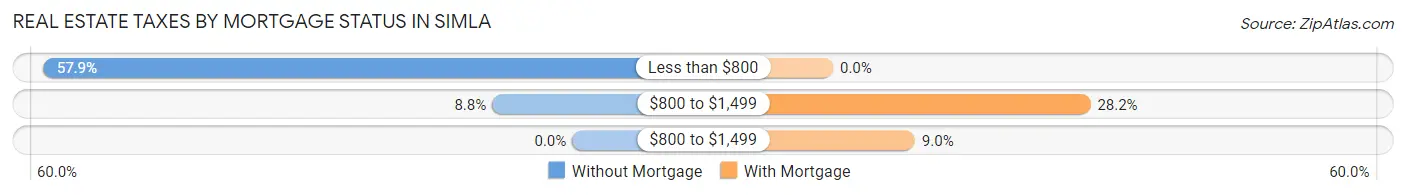
| Property Taxes | Without Mortgage | With Mortgage |
| Less than $800 | 33 (57.9%) | 0 (0.0%) |
| $800 to $1,499 | 5 (8.8%) | 22 (28.2%) |
| $800 to $1,499 | 0 (0.0%) | 7 (9.0%) |
| Total | 57 (100.0%) | 78 (100.0%) |
Health & Disability in Simla
Health Insurance Coverage by Age in Simla
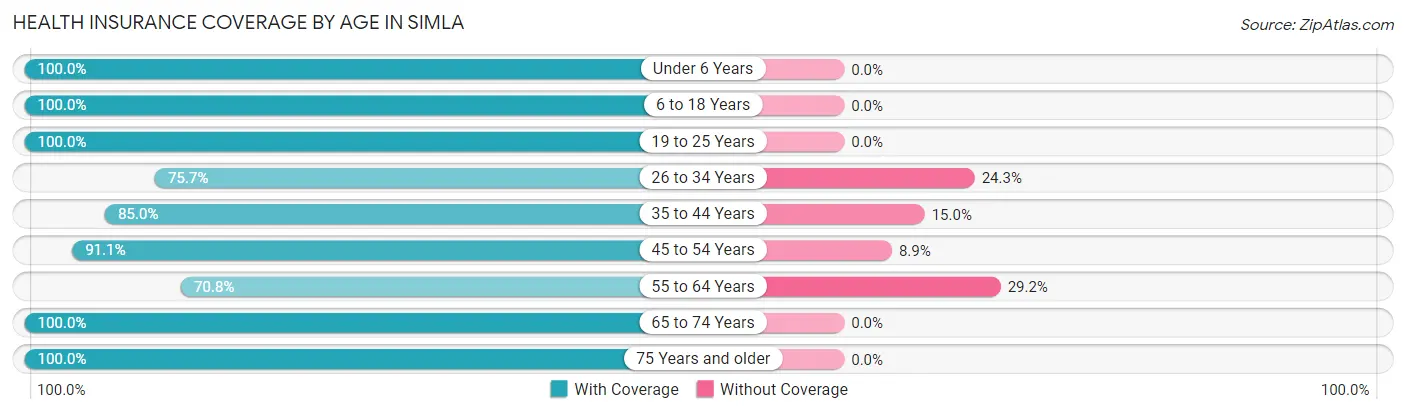
| Age Bracket | With Coverage | Without Coverage |
| Under 6 Years | 28 (100.0%) | 0 (0.0%) |
| 6 to 18 Years | 137 (100.0%) | 0 (0.0%) |
| 19 to 25 Years | 31 (100.0%) | 0 (0.0%) |
| 26 to 34 Years | 56 (75.7%) | 18 (24.3%) |
| 35 to 44 Years | 102 (85.0%) | 18 (15.0%) |
| 45 to 54 Years | 41 (91.1%) | 4 (8.9%) |
| 55 to 64 Years | 51 (70.8%) | 21 (29.2%) |
| 65 to 74 Years | 36 (100.0%) | 0 (0.0%) |
| 75 Years and older | 23 (100.0%) | 0 (0.0%) |
| Total | 505 (89.2%) | 61 (10.8%) |
Health Insurance Coverage by Citizenship Status in Simla
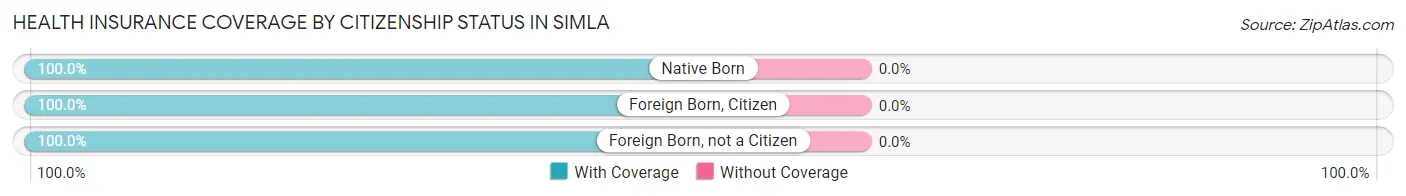
| Citizenship Status | With Coverage | Without Coverage |
| Native Born | 28 (100.0%) | 0 (0.0%) |
| Foreign Born, Citizen | 137 (100.0%) | 0 (0.0%) |
| Foreign Born, not a Citizen | 31 (100.0%) | 0 (0.0%) |
Health Insurance Coverage by Household Income in Simla
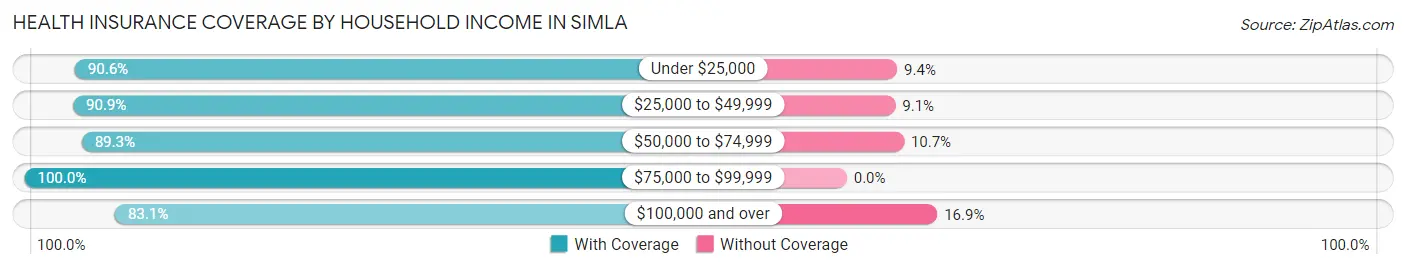
| Household Income | With Coverage | Without Coverage |
| Under $25,000 | 96 (90.6%) | 10 (9.4%) |
| $25,000 to $49,999 | 170 (90.9%) | 17 (9.1%) |
| $50,000 to $74,999 | 25 (89.3%) | 3 (10.7%) |
| $75,000 to $99,999 | 62 (100.0%) | 0 (0.0%) |
| $100,000 and over | 152 (83.1%) | 31 (16.9%) |
Public vs Private Health Insurance Coverage by Age in Simla
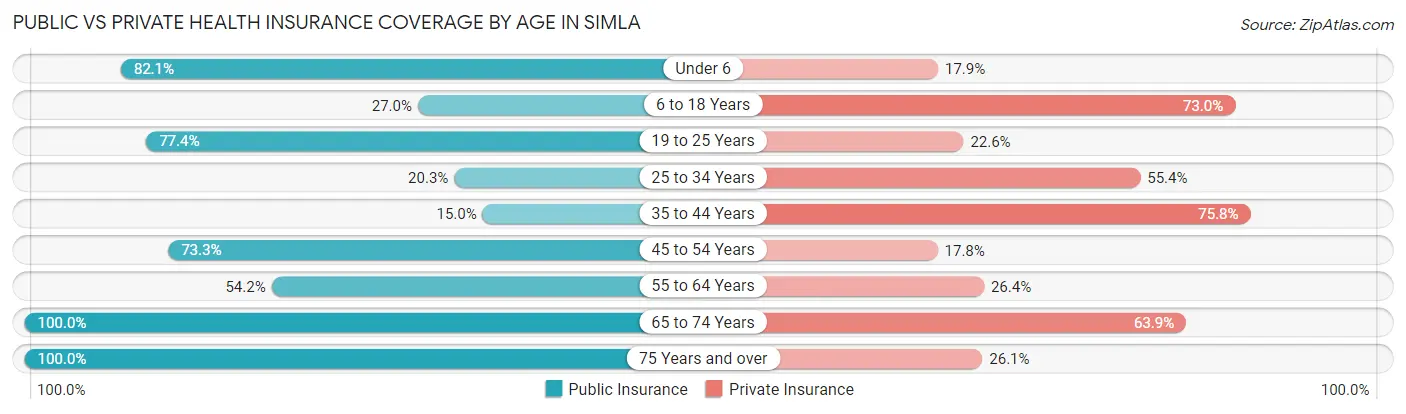
| Age Bracket | Public Insurance | Private Insurance |
| Under 6 | 23 (82.1%) | 5 (17.9%) |
| 6 to 18 Years | 37 (27.0%) | 100 (73.0%) |
| 19 to 25 Years | 24 (77.4%) | 7 (22.6%) |
| 25 to 34 Years | 15 (20.3%) | 41 (55.4%) |
| 35 to 44 Years | 18 (15.0%) | 91 (75.8%) |
| 45 to 54 Years | 33 (73.3%) | 8 (17.8%) |
| 55 to 64 Years | 39 (54.2%) | 19 (26.4%) |
| 65 to 74 Years | 36 (100.0%) | 23 (63.9%) |
| 75 Years and over | 23 (100.0%) | 6 (26.1%) |
| Total | 248 (43.8%) | 300 (53.0%) |
Disability Status by Sex by Age in Simla
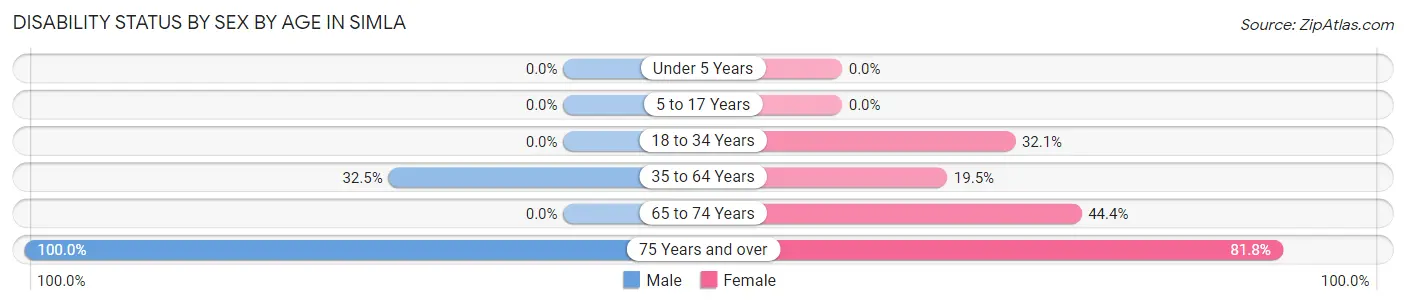
| Age Bracket | Male | Female |
| Under 5 Years | 0 (0.0%) | 0 (0.0%) |
| 5 to 17 Years | 0 (0.0%) | 0 (0.0%) |
| 18 to 34 Years | 0 (0.0%) | 18 (32.1%) |
| 35 to 64 Years | 37 (32.5%) | 24 (19.5%) |
| 65 to 74 Years | 0 (0.0%) | 12 (44.4%) |
| 75 Years and over | 12 (100.0%) | 9 (81.8%) |
Disability Class by Sex by Age in Simla
Disability Class: Hearing Difficulty
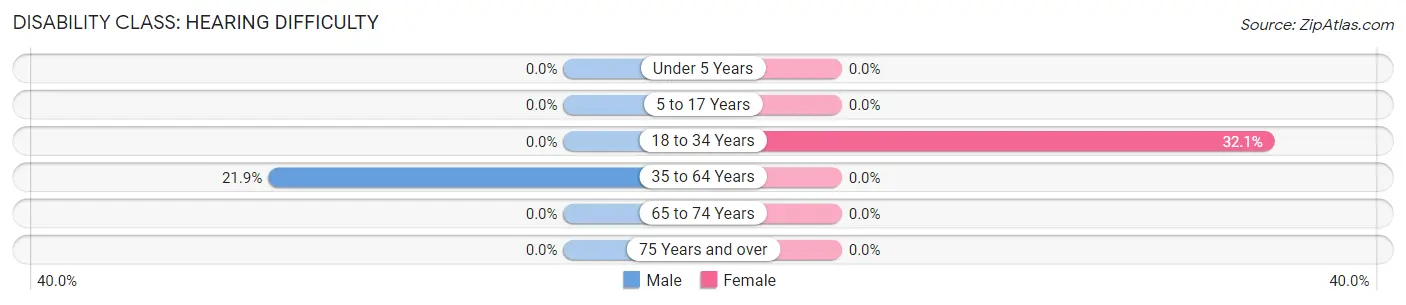
| Age Bracket | Male | Female |
| Under 5 Years | 0 (0.0%) | 0 (0.0%) |
| 5 to 17 Years | 0 (0.0%) | 0 (0.0%) |
| 18 to 34 Years | 0 (0.0%) | 18 (32.1%) |
| 35 to 64 Years | 25 (21.9%) | 0 (0.0%) |
| 65 to 74 Years | 0 (0.0%) | 0 (0.0%) |
| 75 Years and over | 0 (0.0%) | 0 (0.0%) |
Disability Class: Vision Difficulty
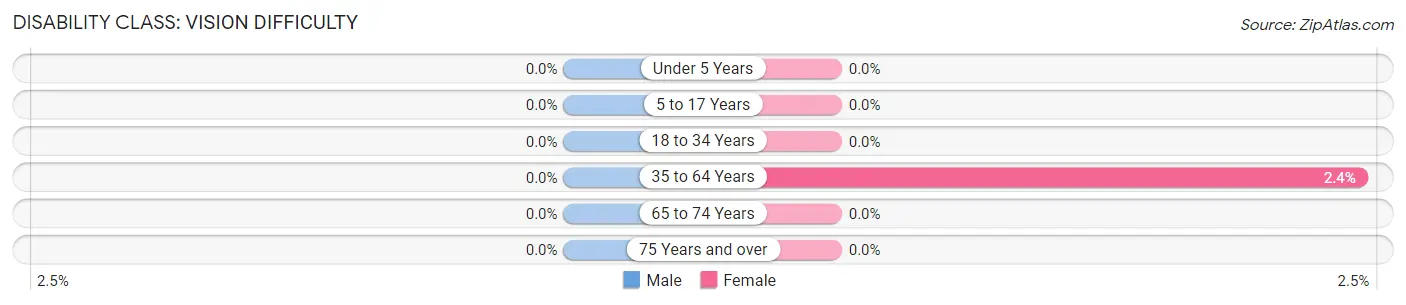
| Age Bracket | Male | Female |
| Under 5 Years | 0 (0.0%) | 0 (0.0%) |
| 5 to 17 Years | 0 (0.0%) | 0 (0.0%) |
| 18 to 34 Years | 0 (0.0%) | 0 (0.0%) |
| 35 to 64 Years | 0 (0.0%) | 3 (2.4%) |
| 65 to 74 Years | 0 (0.0%) | 0 (0.0%) |
| 75 Years and over | 0 (0.0%) | 0 (0.0%) |
Disability Class: Cognitive Difficulty
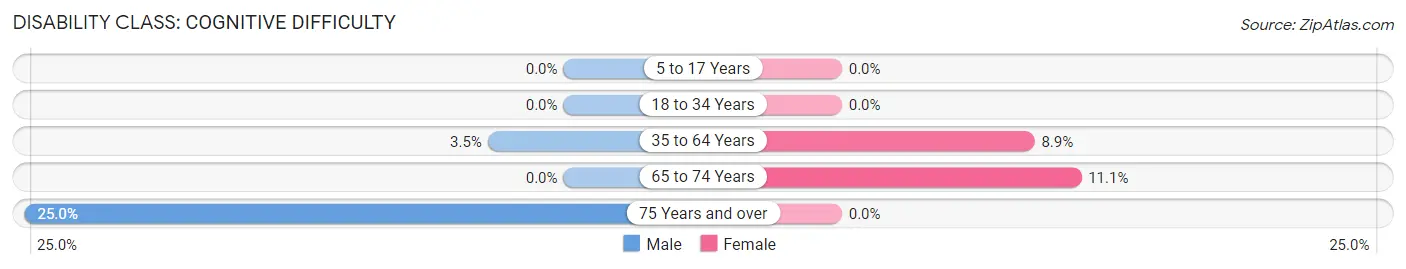
| Age Bracket | Male | Female |
| 5 to 17 Years | 0 (0.0%) | 0 (0.0%) |
| 18 to 34 Years | 0 (0.0%) | 0 (0.0%) |
| 35 to 64 Years | 4 (3.5%) | 11 (8.9%) |
| 65 to 74 Years | 0 (0.0%) | 3 (11.1%) |
| 75 Years and over | 3 (25.0%) | 0 (0.0%) |
Disability Class: Ambulatory Difficulty
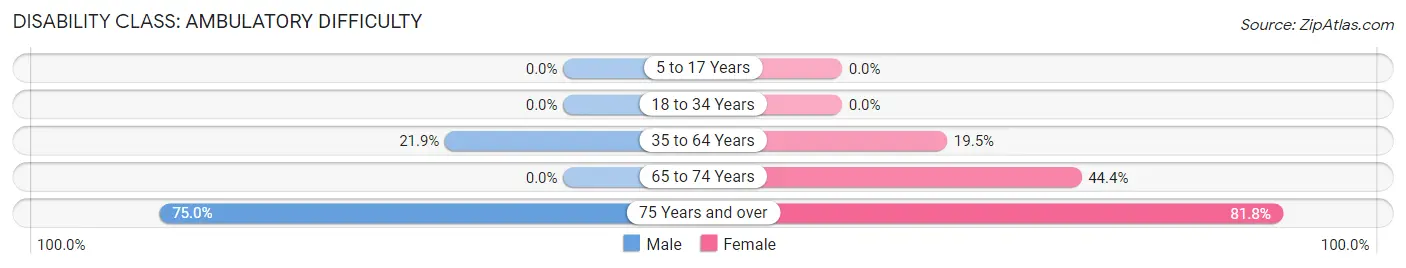
| Age Bracket | Male | Female |
| 5 to 17 Years | 0 (0.0%) | 0 (0.0%) |
| 18 to 34 Years | 0 (0.0%) | 0 (0.0%) |
| 35 to 64 Years | 25 (21.9%) | 24 (19.5%) |
| 65 to 74 Years | 0 (0.0%) | 12 (44.4%) |
| 75 Years and over | 9 (75.0%) | 9 (81.8%) |
Disability Class: Self-Care Difficulty
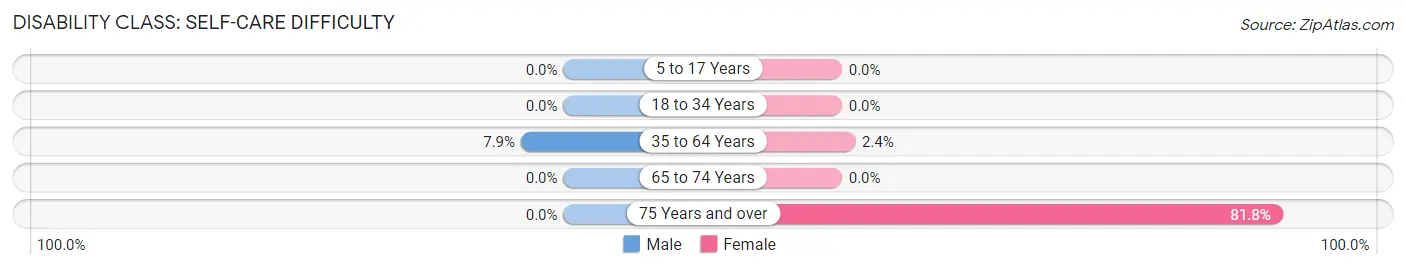
| Age Bracket | Male | Female |
| 5 to 17 Years | 0 (0.0%) | 0 (0.0%) |
| 18 to 34 Years | 0 (0.0%) | 0 (0.0%) |
| 35 to 64 Years | 9 (7.9%) | 3 (2.4%) |
| 65 to 74 Years | 0 (0.0%) | 0 (0.0%) |
| 75 Years and over | 0 (0.0%) | 9 (81.8%) |
Technology Access in Simla
Computing Device Access in Simla
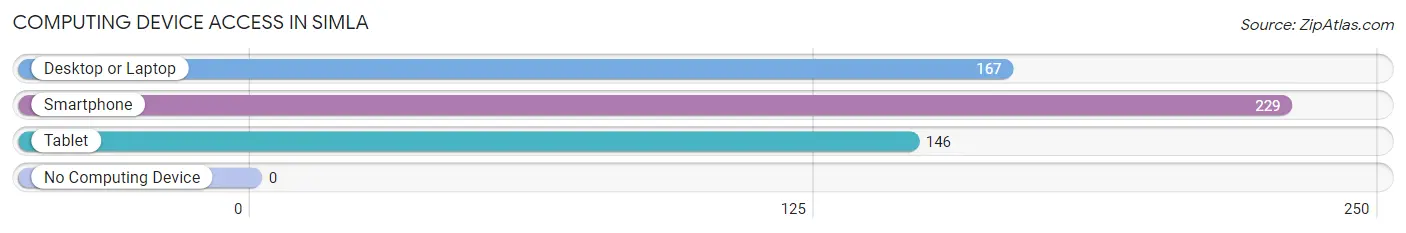
| Device Type | # Households | % Households |
| Desktop or Laptop | 167 | 67.9% |
| Smartphone | 229 | 93.1% |
| Tablet | 146 | 59.4% |
| No Computing Device | 0 | 0.0% |
| Total | 246 | 100.0% |
Internet Access in Simla
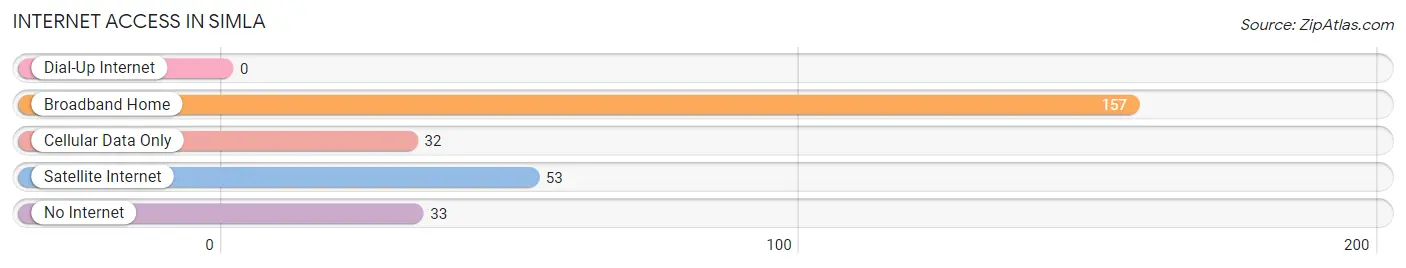
| Internet Type | # Households | % Households |
| Dial-Up Internet | 0 | 0.0% |
| Broadband Home | 157 | 63.8% |
| Cellular Data Only | 32 | 13.0% |
| Satellite Internet | 53 | 21.5% |
| No Internet | 33 | 13.4% |
| Total | 246 | 100.0% |
Simla Summary
Simla, Colorado is a small town located in the foothills of the Rocky Mountains in the United States. It is situated in the county of Elbert, and is part of the Denver-Aurora-Lakewood Metropolitan Statistical Area. The town has a population of approximately 1,000 people, and is located at an elevation of 6,890 feet above sea level.
History
Simla was founded in 1881 by a group of settlers from Kansas. The town was named after the city of Simla in India, and was originally intended to be a farming community. The settlers built a school, a church, and a post office, and the town quickly grew. By the early 1900s, Simla had become a thriving agricultural center, with a population of over 1,000 people.
In the 1920s, Simla began to experience a decline in population as many of the settlers moved away in search of better opportunities. The town was nearly abandoned by the 1940s, but was revived in the 1950s when the Denver and Rio Grande Western Railroad began to operate a line through the town. This allowed Simla to become a popular tourist destination, and the population began to grow again.
Geography
Simla is located in the foothills of the Rocky Mountains, and is surrounded by rolling hills and open plains. The town is situated at an elevation of 6,890 feet above sea level, and is located approximately 40 miles southeast of Denver. The town is situated in the Elbert County, and is part of the Denver-Aurora-Lakewood Metropolitan Statistical Area.
The climate in Simla is semi-arid, with hot summers and cold winters. The average annual temperature is around 50 degrees Fahrenheit, and the average annual precipitation is around 16 inches.
Economy
Simla’s economy is largely based on tourism and agriculture. The town is home to several tourist attractions, including the Simla Historical Museum, the Simla Railroad Museum, and the Simla Rodeo. The town also hosts several annual events, such as the Simla Days Festival and the Simla Rodeo.
Agriculture is also an important part of the local economy. The town is home to several farms, which produce a variety of crops, including wheat, corn, and hay.
Demographics
As of the 2010 census, Simla had a population of 1,000 people. The racial makeup of the town was 95.2% White, 0.7% African American, 0.7% Native American, 0.3% Asian, 0.1% Pacific Islander, and 2.1% from other races. The median household income was $37,500, and the median family income was $41,250.
Simla is a small town with a rich history and a vibrant economy. The town is home to a variety of attractions, and is a popular tourist destination. The town is also home to several farms, which produce a variety of crops. Simla is a great place to live, work, and visit.
Common Questions
What is Per Capita Income in Simla?
Per Capita income in Simla is $40,870.
What is the Median Family Income in Simla?
Median Family Income in Simla is $35,441.
What is the Median Household income in Simla?
Median Household Income in Simla is $41,625.
What is Family Income Deficit in Simla?
Family Income Deficit in Simla is $9,420.
Families that are below poverty line in Simla earn $9,420 less on average than the poverty threshold level.
What is Inequality or Gini Index in Simla?
Inequality or Gini Index in Simla is 0.62.
What is the Total Population of Simla?
Total Population of Simla is 588.
What is the Total Male Population of Simla?
Total Male Population of Simla is 274.
What is the Total Female Population of Simla?
Total Female Population of Simla is 314.
What is the Ratio of Males per 100 Females in Simla?
There are 87.26 Males per 100 Females in Simla.
What is the Ratio of Females per 100 Males in Simla?
There are 114.60 Females per 100 Males in Simla.
What is the Median Population Age in Simla?
Median Population Age in Simla is 39.1 Years.
What is the Average Family Size in Simla
Average Family Size in Simla is 2.8 People.
What is the Average Household Size in Simla
Average Household Size in Simla is 2.3 People.
How Large is the Labor Force in Simla?
There are 288 People in the Labor Forcein in Simla.
What is the Percentage of People in the Labor Force in Simla?
57.9% of People are in the Labor Force in Simla.