Brick Center, CO Map & Demographics
Brick Center Map
Brick Center Overview
$84,313
PER CAPITA INCOME
$134,635
AVG HOUSEHOLD INCOME
0.14
INEQUALITY / GINI INDEX
88
TOTAL POPULATION
48
MALE POPULATION
40
FEMALE POPULATION
120.00
MALES / 100 FEMALES
83.33
FEMALES / 100 MALES
53.8
MEDIAN AGE
2.2
AVG FAMILY SIZE
2.1
AVG HOUSEHOLD SIZE
88
LABOR FORCE [ PEOPLE ]
100.0%
PERCENT IN LABOR FORCE
Income in Brick Center
Income Overview in Brick Center
| Characteristic | Number | Measure |
| Per Capita Income | 88 | $84,313 |
| Median Family Income | 33 | $0 |
| Mean Family Income | 33 | $0 |
| Median Household Income | 41 | $134,635 |
| Mean Household Income | 41 | $168,407 |
| Income Deficit | 33 | $0 |
| Wage / Income Gap (%) | 88 | 0.00% |
| Wage / Income Gap ($) | 88 | 100.00¢ per $1 |
| Gini / Inequality Index | 88 | 0.14 |
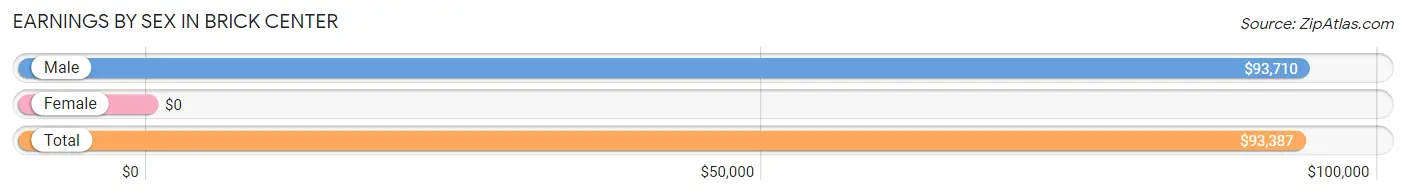
Earnings by Sex in Brick Center
| Sex | Number | Average Earnings |
| Male | 48 (54.5%) | $93,710 |
| Female | 40 (45.5%) | $0 |
| Total | 88 (100.0%) | $93,387 |
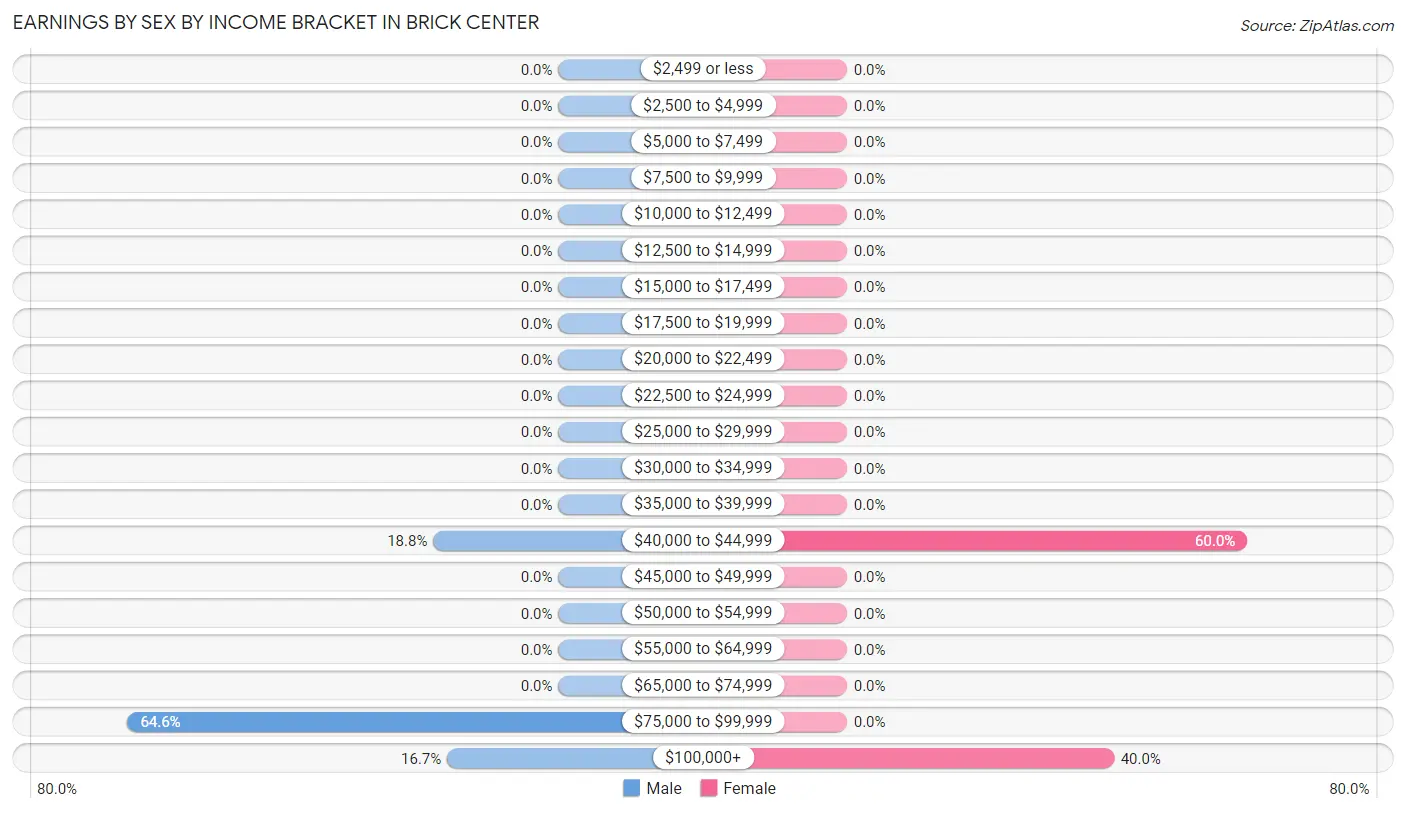
Earnings by Sex by Income Bracket in Brick Center
The most common earnings brackets in Brick Center are $75,000 to $99,999 for men (31 | 64.6%) and $40,000 to $44,999 for women (24 | 60.0%).
| Income | Male | Female |
| $2,499 or less | 0 (0.0%) | 0 (0.0%) |
| $2,500 to $4,999 | 0 (0.0%) | 0 (0.0%) |
| $5,000 to $7,499 | 0 (0.0%) | 0 (0.0%) |
| $7,500 to $9,999 | 0 (0.0%) | 0 (0.0%) |
| $10,000 to $12,499 | 0 (0.0%) | 0 (0.0%) |
| $12,500 to $14,999 | 0 (0.0%) | 0 (0.0%) |
| $15,000 to $17,499 | 0 (0.0%) | 0 (0.0%) |
| $17,500 to $19,999 | 0 (0.0%) | 0 (0.0%) |
| $20,000 to $22,499 | 0 (0.0%) | 0 (0.0%) |
| $22,500 to $24,999 | 0 (0.0%) | 0 (0.0%) |
| $25,000 to $29,999 | 0 (0.0%) | 0 (0.0%) |
| $30,000 to $34,999 | 0 (0.0%) | 0 (0.0%) |
| $35,000 to $39,999 | 0 (0.0%) | 0 (0.0%) |
| $40,000 to $44,999 | 9 (18.8%) | 24 (60.0%) |
| $45,000 to $49,999 | 0 (0.0%) | 0 (0.0%) |
| $50,000 to $54,999 | 0 (0.0%) | 0 (0.0%) |
| $55,000 to $64,999 | 0 (0.0%) | 0 (0.0%) |
| $65,000 to $74,999 | 0 (0.0%) | 0 (0.0%) |
| $75,000 to $99,999 | 31 (64.6%) | 0 (0.0%) |
| $100,000+ | 8 (16.7%) | 16 (40.0%) |
| Total | 48 (100.0%) | 40 (100.0%) |
Earnings by Sex by Educational Attainment in Brick Center
| Educational Attainment | Male Income | Female Income |
| Less than High School | - | - |
| High School Diploma | - | - |
| College or Associate's Degree | - | - |
| Bachelor's Degree | - | - |
| Graduate Degree | - | - |
| Total | $93,710 | $0 |
Family Income in Brick Center
Family Income Brackets in Brick Center
According to the Brick Center family income data, there are 24 families falling into the $100,000 to $149,999 income range, which is the most common income bracket and makes up 72.7% of all families.
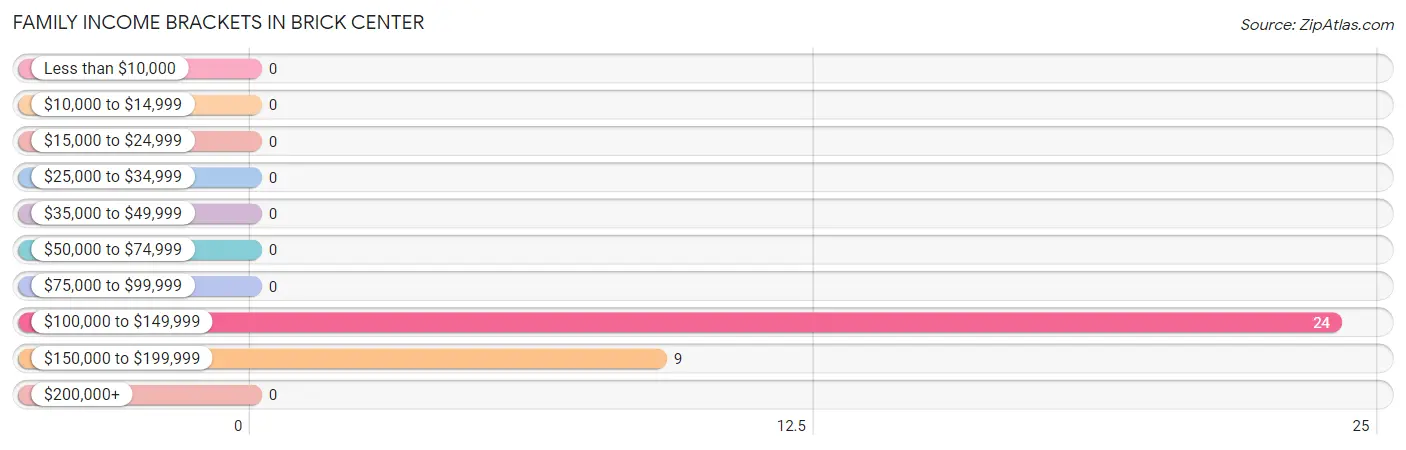
| Income Bracket | # Families | % Families |
| Less than $10,000 | 0 | 0.0% |
| $10,000 to $14,999 | 0 | 0.0% |
| $15,000 to $24,999 | 0 | 0.0% |
| $25,000 to $34,999 | 0 | 0.0% |
| $35,000 to $49,999 | 0 | 0.0% |
| $50,000 to $74,999 | 0 | 0.0% |
| $75,000 to $99,999 | 0 | 0.0% |
| $100,000 to $149,999 | 24 | 72.7% |
| $150,000 to $199,999 | 9 | 27.3% |
| $200,000+ | 0 | 0.0% |
Family Income by Famaliy Size in Brick Center
| Income Bracket | # Families | Median Income |
| 2-Person Families | 33 (100.0%) | $0 |
| 3-Person Families | 0 (0.0%) | $0 |
| 4-Person Families | 0 (0.0%) | $0 |
| 5-Person Families | 0 (0.0%) | $0 |
| 6-Person Families | 0 (0.0%) | $0 |
| 7+ Person Families | 0 (0.0%) | $0 |
| Total | 33 (100.0%) | $0 |
Family Income by Number of Earners in Brick Center
| Number of Earners | # Families | Median Income |
| No Earners | 0 (0.0%) | $0 |
| 1 Earner | 0 (0.0%) | $0 |
| 2 Earners | 33 (100.0%) | $0 |
| 3+ Earners | 0 (0.0%) | $0 |
| Total | 33 (100.0%) | $0 |
Household Income in Brick Center
Household Income Brackets in Brick Center
With 24 households falling in the category, the $100,000 to $149,999 income range is the most frequent in Brick Center, accounting for 58.5% of all households.
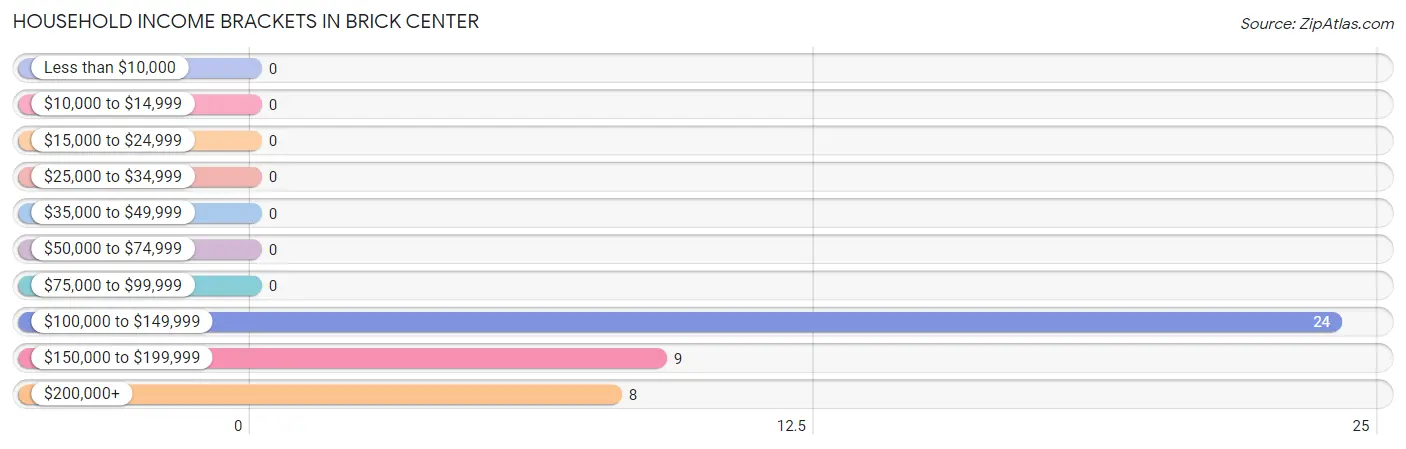
| Income Bracket | # Households | % Households |
| Less than $10,000 | 0 | 0.0% |
| $10,000 to $14,999 | 0 | 0.0% |
| $15,000 to $24,999 | 0 | 0.0% |
| $25,000 to $34,999 | 0 | 0.0% |
| $35,000 to $49,999 | 0 | 0.0% |
| $50,000 to $74,999 | 0 | 0.0% |
| $75,000 to $99,999 | 0 | 0.0% |
| $100,000 to $149,999 | 24 | 58.5% |
| $150,000 to $199,999 | 9 | 22.0% |
| $200,000+ | 8 | 19.5% |
Household Income by Householder Age in Brick Center
The median household income in Brick Center is $134,635, with the highest median household income of $134,635 found in the 45 to 64 years age bracket for the primary householder. A total of 41 households (100.0%) fall into this category.
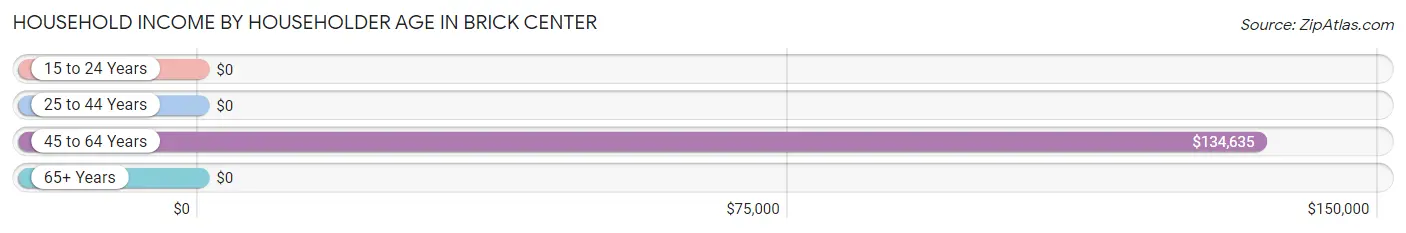
| Income Bracket | # Households | Median Income |
| 15 to 24 Years | 0 (0.0%) | $0 |
| 25 to 44 Years | 0 (0.0%) | $0 |
| 45 to 64 Years | 41 (100.0%) | $134,635 |
| 65+ Years | 0 (0.0%) | $0 |
| Total | 41 (100.0%) | $134,635 |
Poverty in Brick Center
Income Below Poverty by Sex and Age in Brick Center
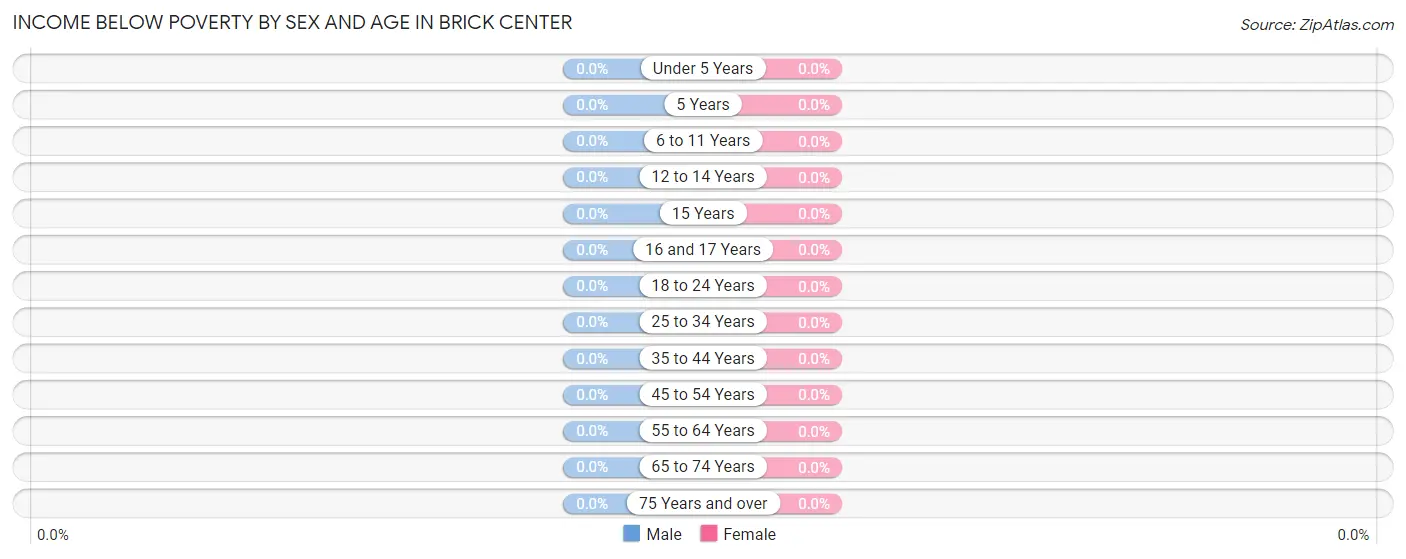
| Age Bracket | Male | Female |
| Under 5 Years | 0 (0.0%) | 0 (0.0%) |
| 5 Years | 0 (0.0%) | 0 (0.0%) |
| 6 to 11 Years | 0 (0.0%) | 0 (0.0%) |
| 12 to 14 Years | 0 (0.0%) | 0 (0.0%) |
| 15 Years | 0 (0.0%) | 0 (0.0%) |
| 16 and 17 Years | 0 (0.0%) | 0 (0.0%) |
| 18 to 24 Years | 0 (0.0%) | 0 (0.0%) |
| 25 to 34 Years | 0 (0.0%) | 0 (0.0%) |
| 35 to 44 Years | 0 (0.0%) | 0 (0.0%) |
| 45 to 54 Years | 0 (0.0%) | 0 (0.0%) |
| 55 to 64 Years | 0 (0.0%) | 0 (0.0%) |
| 65 to 74 Years | 0 (0.0%) | 0 (0.0%) |
| 75 Years and over | 0 (0.0%) | 0 (0.0%) |
| Total | 0 (0.0%) | 0 (0.0%) |
Income Above Poverty by Sex and Age in Brick Center
According to the poverty statistics in Brick Center, males aged 45 to 54 years and females aged 45 to 54 years are the age groups that are most secure financially, with 100.0% of males and 100.0% of females in these age groups living above the poverty line.
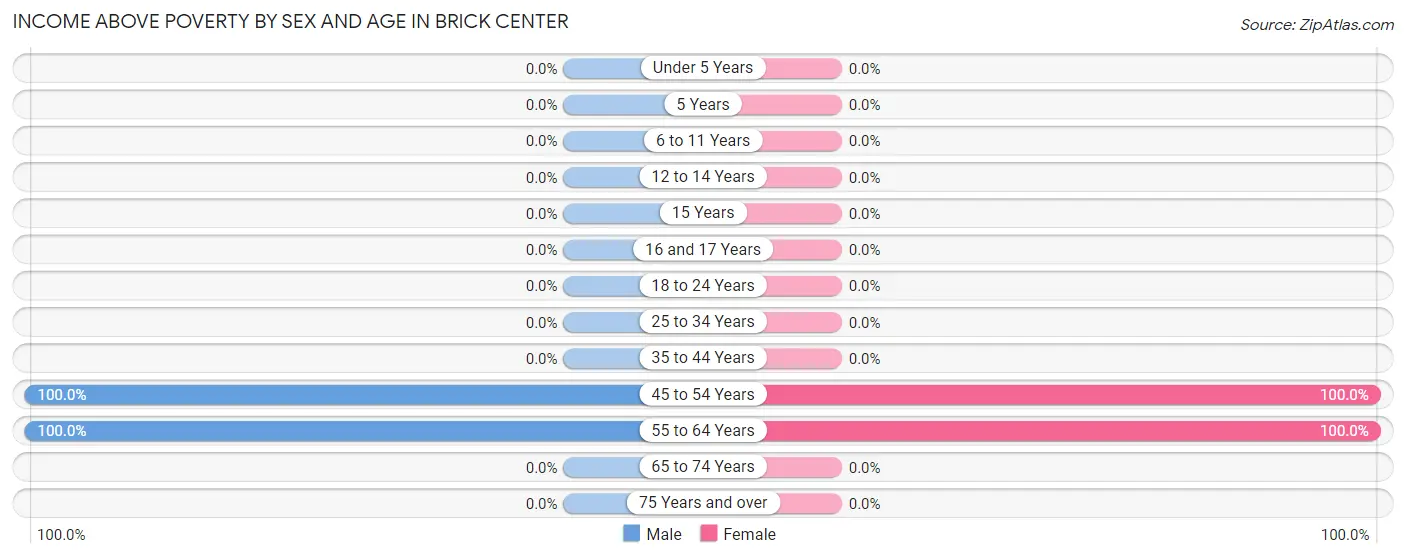
| Age Bracket | Male | Female |
| Under 5 Years | 0 (0.0%) | 0 (0.0%) |
| 5 Years | 0 (0.0%) | 0 (0.0%) |
| 6 to 11 Years | 0 (0.0%) | 0 (0.0%) |
| 12 to 14 Years | 0 (0.0%) | 0 (0.0%) |
| 15 Years | 0 (0.0%) | 0 (0.0%) |
| 16 and 17 Years | 0 (0.0%) | 0 (0.0%) |
| 18 to 24 Years | 0 (0.0%) | 0 (0.0%) |
| 25 to 34 Years | 0 (0.0%) | 0 (0.0%) |
| 35 to 44 Years | 0 (0.0%) | 0 (0.0%) |
| 45 to 54 Years | 40 (100.0%) | 24 (100.0%) |
| 55 to 64 Years | 8 (100.0%) | 16 (100.0%) |
| 65 to 74 Years | 0 (0.0%) | 0 (0.0%) |
| 75 Years and over | 0 (0.0%) | 0 (0.0%) |
| Total | 48 (100.0%) | 40 (100.0%) |
Income Below Poverty Among Married-Couple Families in Brick Center
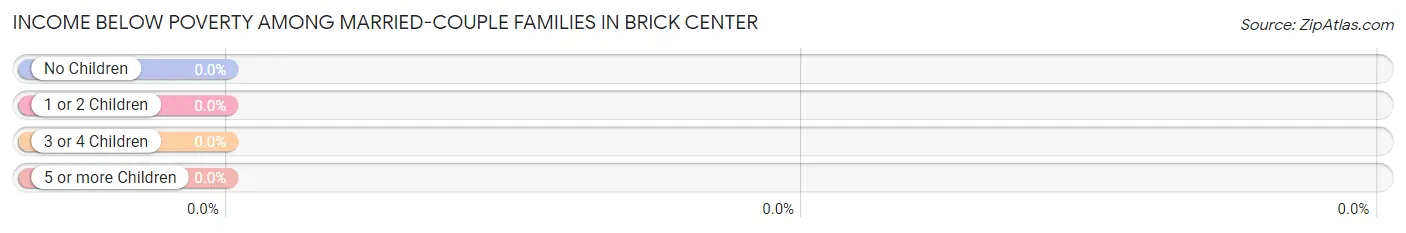
| Children | Above Poverty | Below Poverty |
| No Children | 33 (100.0%) | 0 (0.0%) |
| 1 or 2 Children | 0 (0.0%) | 0 (0.0%) |
| 3 or 4 Children | 0 (0.0%) | 0 (0.0%) |
| 5 or more Children | 0 (0.0%) | 0 (0.0%) |
| Total | 33 (100.0%) | 0 (0.0%) |
Income Below Poverty Among Single-Parent Households in Brick Center
| Children | Single Father | Single Mother |
| No Children | 0 (0.0%) | 0 (0.0%) |
| 1 or 2 Children | 0 (0.0%) | 0 (0.0%) |
| 3 or 4 Children | 0 (0.0%) | 0 (0.0%) |
| 5 or more Children | 0 (0.0%) | 0 (0.0%) |
| Total | 0 (0.0%) | 0 (0.0%) |
Income Below Poverty Among Married-Couple vs Single-Parent Households in Brick Center
| Children | Married-Couple Families | Single-Parent Households |
| No Children | 0 (0.0%) | 0 (0.0%) |
| 1 or 2 Children | 0 (0.0%) | 0 (0.0%) |
| 3 or 4 Children | 0 (0.0%) | 0 (0.0%) |
| 5 or more Children | 0 (0.0%) | 0 (0.0%) |
| Total | 0 (0.0%) | 0 (0.0%) |
Race in Brick Center
The most populous races in Brick Center are White / Caucasian (71 | 80.7%), Hispanic or Latino (31 | 35.2%), and Two or more Races (17 | 19.3%).
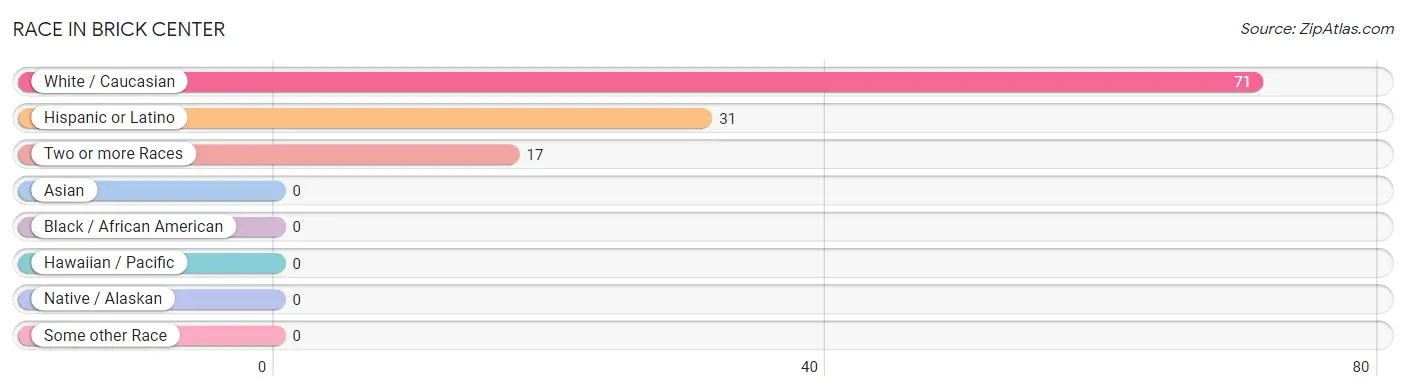
| Race | # Population | % Population |
| Asian | 0 | 0.0% |
| Black / African American | 0 | 0.0% |
| Hawaiian / Pacific | 0 | 0.0% |
| Hispanic or Latino | 31 | 35.2% |
| Native / Alaskan | 0 | 0.0% |
| White / Caucasian | 71 | 80.7% |
| Two or more Races | 17 | 19.3% |
| Some other Race | 0 | 0.0% |
| Total | 88 | 100.0% |
Ancestry in Brick Center
The most populous ancestries reported in Brick Center are Italian (31 | 35.2%), South American (31 | 35.2%), Uruguayan (31 | 35.2%), American (24 | 27.3%), and English (8 | 9.1%), together accounting for 142.0% of all Brick Center residents.
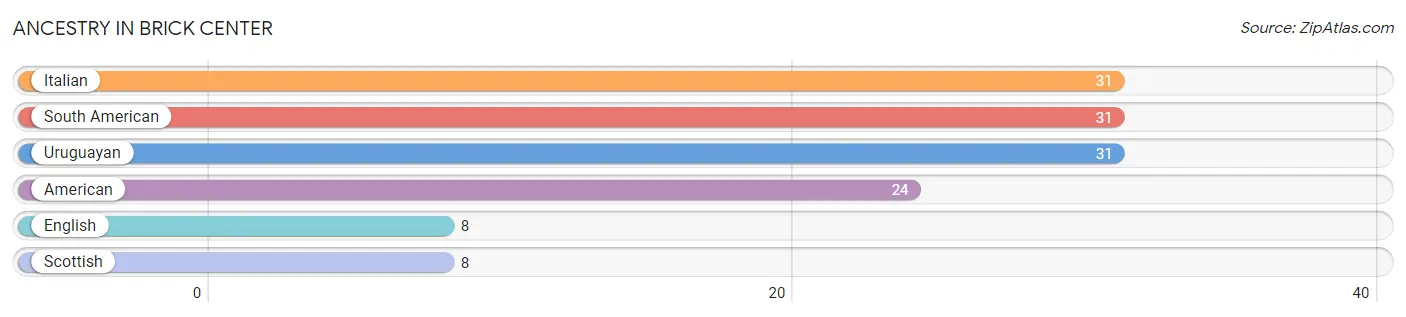
| Ancestry | # Population | % Population |
| American | 24 | 27.3% |
| English | 8 | 9.1% |
| Italian | 31 | 35.2% |
| Scottish | 8 | 9.1% |
| South American | 31 | 35.2% |
| Uruguayan | 31 | 35.2% | View All 6 Rows |
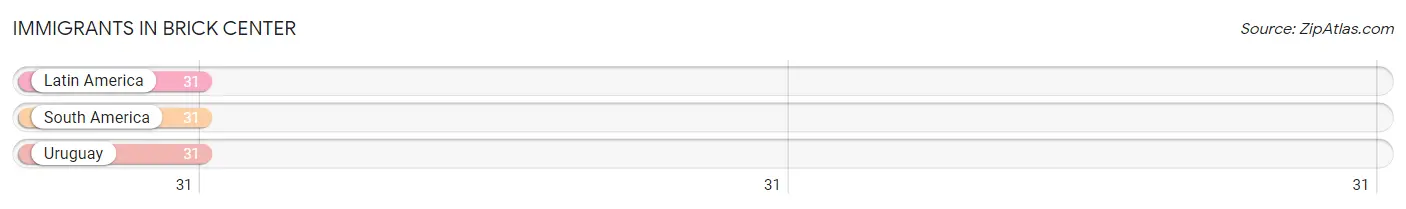
Immigrants in Brick Center
The most numerous immigrant groups reported in Brick Center came from Latin America (31 | 35.2%), South America (31 | 35.2%), and Uruguay (31 | 35.2%), together accounting for 105.7% of all Brick Center residents.
| Immigration Origin | # Population | % Population |
| Latin America | 31 | 35.2% |
| South America | 31 | 35.2% |
| Uruguay | 31 | 35.2% | View All 3 Rows |
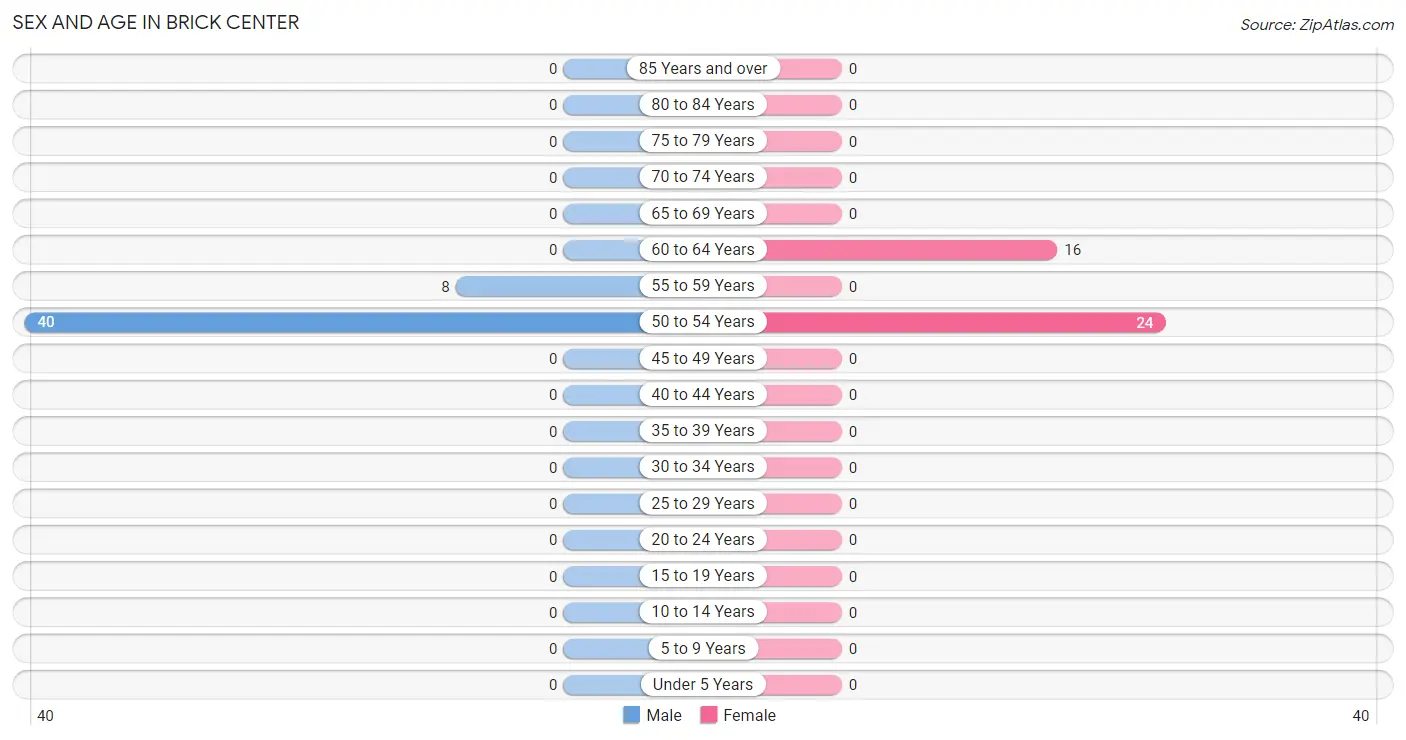
Sex and Age in Brick Center
Sex and Age in Brick Center
The most populous age groups in Brick Center are 50 to 54 Years (40 | 83.3%) for men and 50 to 54 Years (24 | 60.0%) for women.
| Age Bracket | Male | Female |
| Under 5 Years | 0 (0.0%) | 0 (0.0%) |
| 5 to 9 Years | 0 (0.0%) | 0 (0.0%) |
| 10 to 14 Years | 0 (0.0%) | 0 (0.0%) |
| 15 to 19 Years | 0 (0.0%) | 0 (0.0%) |
| 20 to 24 Years | 0 (0.0%) | 0 (0.0%) |
| 25 to 29 Years | 0 (0.0%) | 0 (0.0%) |
| 30 to 34 Years | 0 (0.0%) | 0 (0.0%) |
| 35 to 39 Years | 0 (0.0%) | 0 (0.0%) |
| 40 to 44 Years | 0 (0.0%) | 0 (0.0%) |
| 45 to 49 Years | 0 (0.0%) | 0 (0.0%) |
| 50 to 54 Years | 40 (83.3%) | 24 (60.0%) |
| 55 to 59 Years | 8 (16.7%) | 0 (0.0%) |
| 60 to 64 Years | 0 (0.0%) | 16 (40.0%) |
| 65 to 69 Years | 0 (0.0%) | 0 (0.0%) |
| 70 to 74 Years | 0 (0.0%) | 0 (0.0%) |
| 75 to 79 Years | 0 (0.0%) | 0 (0.0%) |
| 80 to 84 Years | 0 (0.0%) | 0 (0.0%) |
| 85 Years and over | 0 (0.0%) | 0 (0.0%) |
| Total | 48 (100.0%) | 40 (100.0%) |
Families and Households in Brick Center
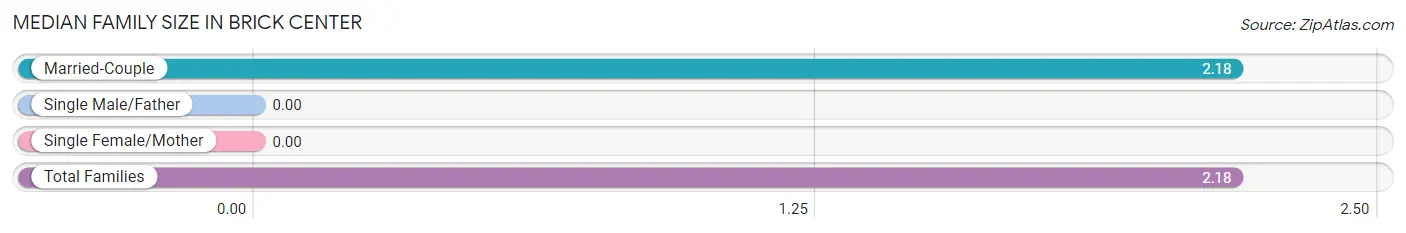
Median Family Size in Brick Center
| Family Type | # Families | Family Size |
| Married-Couple | 33 (100.0%) | 2.18 |
| Single Male/Father | 0 (0.0%) | - |
| Single Female/Mother | 0 (0.0%) | - |
| Total Families | 33 (100.0%) | 2.18 |
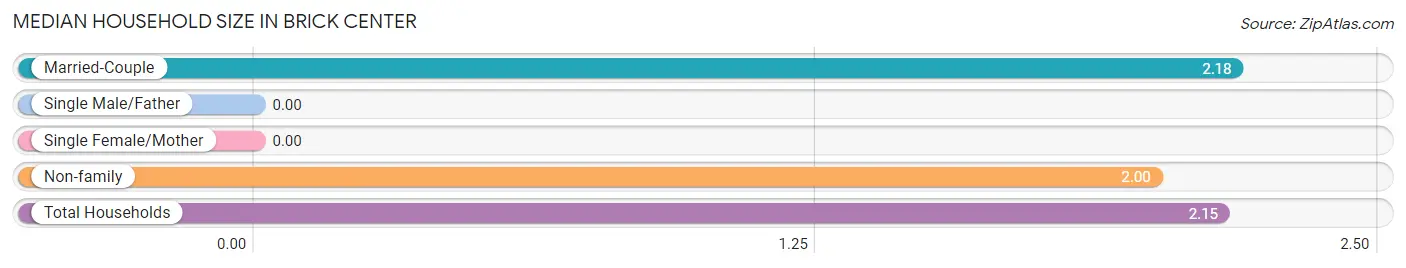
Median Household Size in Brick Center
| Household Type | # Households | Household Size |
| Married-Couple | 33 (80.5%) | 2.18 |
| Single Male/Father | 0 (0.0%) | - |
| Single Female/Mother | 0 (0.0%) | - |
| Non-family | 8 (19.5%) | 2.00 |
| Total Households | 41 (100.0%) | 2.15 |
Household Size by Marriage Status in Brick Center
Out of a total of 41 households in Brick Center, 33 (80.5%) are family households, while 8 (19.5%) are nonfamily households. The most numerous type of family households are 2-person households, comprising 33, and the most common type of nonfamily households are 2-person households, comprising 8.
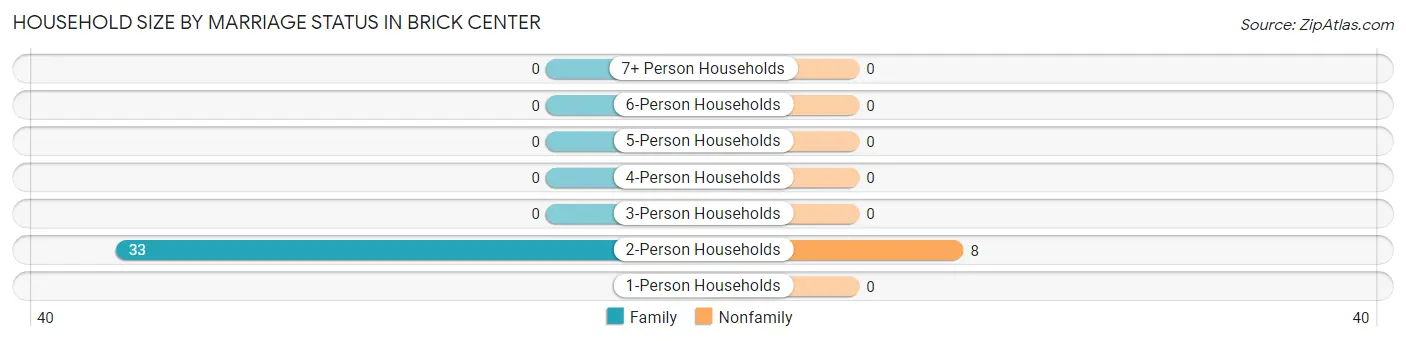
| Household Size | Family Households | Nonfamily Households |
| 1-Person Households | - | 0 (0.0%) |
| 2-Person Households | 33 (80.5%) | 8 (19.5%) |
| 3-Person Households | 0 (0.0%) | 0 (0.0%) |
| 4-Person Households | 0 (0.0%) | 0 (0.0%) |
| 5-Person Households | 0 (0.0%) | 0 (0.0%) |
| 6-Person Households | 0 (0.0%) | 0 (0.0%) |
| 7+ Person Households | 0 (0.0%) | 0 (0.0%) |
| Total | 33 (80.5%) | 8 (19.5%) |
Female Fertility in Brick Center
Fertility by Age in Brick Center
| Age Bracket | Women with Births | Births / 1,000 Women |
| 15 to 19 years | 0 (0.0%) | 0.0 |
| 20 to 34 years | 0 (0.0%) | 0.0 |
| 35 to 50 years | 0 (0.0%) | 0.0 |
| Total | 0 (0.0%) | 0.0 |
Fertility by Age by Marriage Status in Brick Center
| Age Bracket | Married | Unmarried |
| 15 to 19 years | 0 (0.0%) | 0 (0.0%) |
| 20 to 34 years | 0 (0.0%) | 0 (0.0%) |
| 35 to 50 years | 0 (0.0%) | 0 (0.0%) |
| Total | 0 (0.0%) | 0 (0.0%) |
Fertility by Education in Brick Center
| Educational Attainment | Women with Births | Births / 1,000 Women |
| Less than High School | 0 (0.0%) | 0.0 |
| High School Diploma | 0 (0.0%) | 0.0 |
| College or Associate's Degree | 0 (0.0%) | 0.0 |
| Bachelor's Degree | 0 (0.0%) | 0.0 |
| Graduate Degree | 0 (0.0%) | 0.0 |
| Total | 0 (0.0%) | 0.0 |
Fertility by Education by Marriage Status in Brick Center
| Educational Attainment | Married | Unmarried |
| Less than High School | 0 (0.0%) | 0 (0.0%) |
| High School Diploma | 0 (0.0%) | 0 (0.0%) |
| College or Associate's Degree | 0 (0.0%) | 0 (0.0%) |
| Bachelor's Degree | 0 (0.0%) | 0 (0.0%) |
| Graduate Degree | 0 (0.0%) | 0 (0.0%) |
| Total | 0 (0.0%) | 0 (0.0%) |
Employment Characteristics in Brick Center
Employment by Class of Employer in Brick Center
Among the 88 employed individuals in Brick Center, local government employees (72 | 81.8%), private company employees (8 | 9.1%), and federal government employees (8 | 9.1%) make up the most common classes of employment.
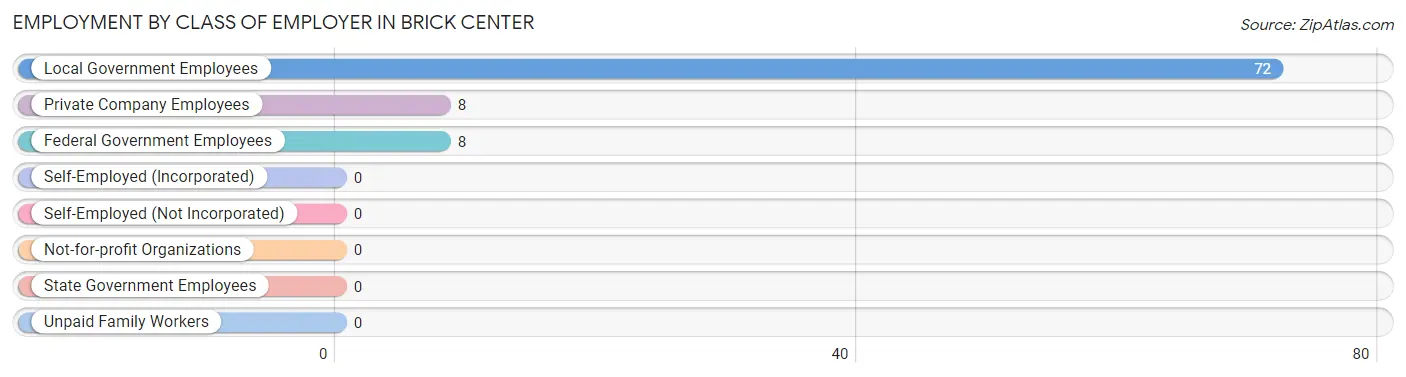
| Employer Class | # Employees | % Employees |
| Private Company Employees | 8 | 9.1% |
| Self-Employed (Incorporated) | 0 | 0.0% |
| Self-Employed (Not Incorporated) | 0 | 0.0% |
| Not-for-profit Organizations | 0 | 0.0% |
| Local Government Employees | 72 | 81.8% |
| State Government Employees | 0 | 0.0% |
| Federal Government Employees | 8 | 9.1% |
| Unpaid Family Workers | 0 | 0.0% |
| Total | 88 | 100.0% |
Employment Status by Age in Brick Center
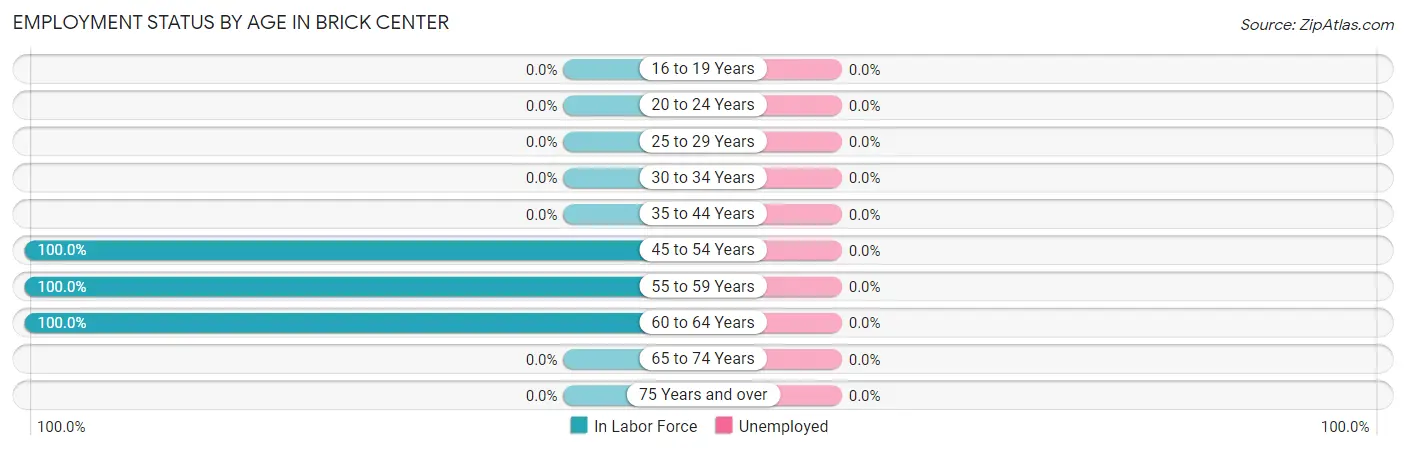
| Age Bracket | In Labor Force | Unemployed |
| 16 to 19 Years | 0 (0.0%) | 0 (0.0%) |
| 20 to 24 Years | 0 (0.0%) | 0 (0.0%) |
| 25 to 29 Years | 0 (0.0%) | 0 (0.0%) |
| 30 to 34 Years | 0 (0.0%) | 0 (0.0%) |
| 35 to 44 Years | 0 (0.0%) | 0 (0.0%) |
| 45 to 54 Years | 64 (100.0%) | 0 (0.0%) |
| 55 to 59 Years | 8 (100.0%) | 0 (0.0%) |
| 60 to 64 Years | 16 (100.0%) | 0 (0.0%) |
| 65 to 74 Years | 0 (0.0%) | 0 (0.0%) |
| 75 Years and over | 0 (0.0%) | 0 (0.0%) |
| Total | 88 (100.0%) | 0 (0.0%) |
Employment Status by Educational Attainment in Brick Center
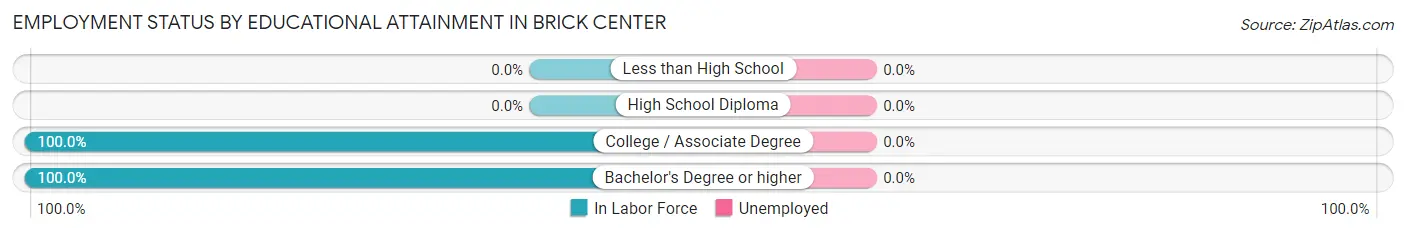
| Educational Attainment | In Labor Force | Unemployed |
| Less than High School | 0 (0.0%) | 0 (0.0%) |
| High School Diploma | 0 (0.0%) | 0 (0.0%) |
| College / Associate Degree | 80 (100.0%) | 0 (0.0%) |
| Bachelor's Degree or higher | 8 (100.0%) | 0 (0.0%) |
| Total | 88 (100.0%) | 0 (0.0%) |
Employment Occupations by Sex in Brick Center
Management, Business, Science and Arts Occupations
The most common Management, Business, Science and Arts occupations in Brick Center are , and Management (8 | 9.1%).
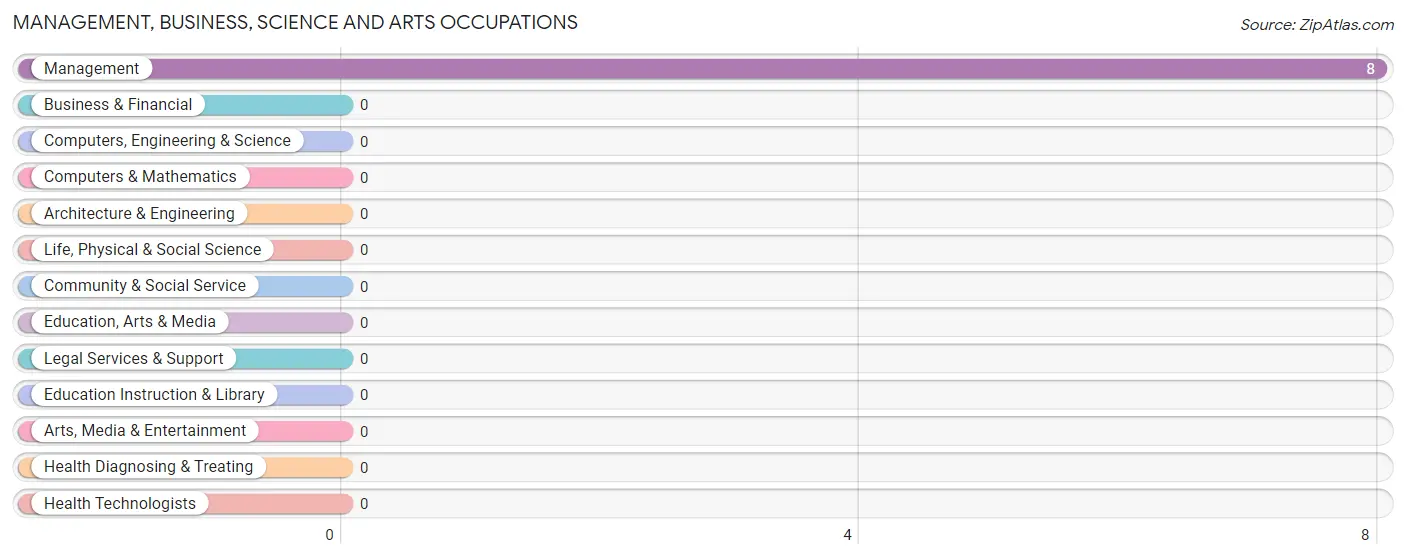
Management, Business, Science and Arts Occupations by Sex
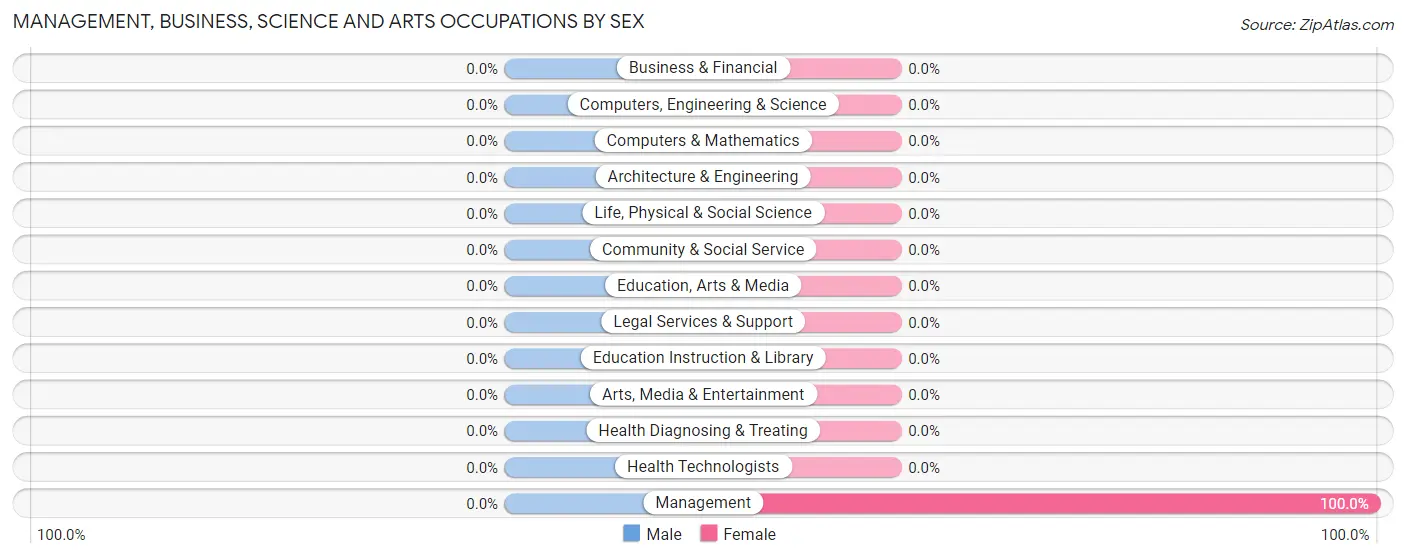
| Occupation | Male | Female |
| Management | 0 (0.0%) | 8 (100.0%) |
| Business & Financial | 0 (0.0%) | 0 (0.0%) |
| Computers, Engineering & Science | 0 (0.0%) | 0 (0.0%) |
| Computers & Mathematics | 0 (0.0%) | 0 (0.0%) |
| Architecture & Engineering | 0 (0.0%) | 0 (0.0%) |
| Life, Physical & Social Science | 0 (0.0%) | 0 (0.0%) |
| Community & Social Service | 0 (0.0%) | 0 (0.0%) |
| Education, Arts & Media | 0 (0.0%) | 0 (0.0%) |
| Legal Services & Support | 0 (0.0%) | 0 (0.0%) |
| Education Instruction & Library | 0 (0.0%) | 0 (0.0%) |
| Arts, Media & Entertainment | 0 (0.0%) | 0 (0.0%) |
| Health Diagnosing & Treating | 0 (0.0%) | 0 (0.0%) |
| Health Technologists | 0 (0.0%) | 0 (0.0%) |
| Total (Category) | 0 (0.0%) | 8 (100.0%) |
| Total (Overall) | 48 (54.5%) | 40 (45.5%) |
Services Occupations
The most common Services occupations in Brick Center are Security & Protection (39 | 44.3%), Firefighting & Prevention (31 | 35.2%), and Law Enforcement (8 | 9.1%).
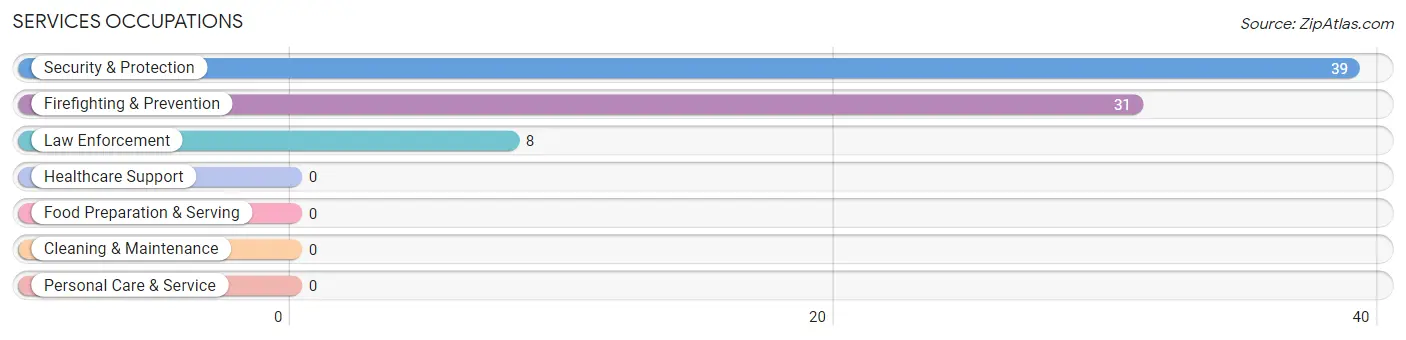
Services Occupations by Sex
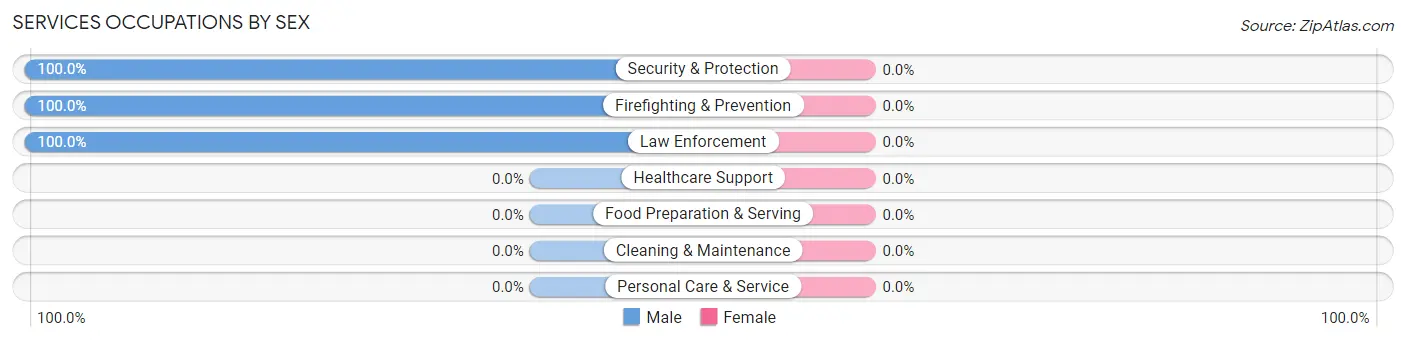
| Occupation | Male | Female |
| Healthcare Support | 0 (0.0%) | 0 (0.0%) |
| Security & Protection | 39 (100.0%) | 0 (0.0%) |
| Firefighting & Prevention | 31 (100.0%) | 0 (0.0%) |
| Law Enforcement | 8 (100.0%) | 0 (0.0%) |
| Food Preparation & Serving | 0 (0.0%) | 0 (0.0%) |
| Cleaning & Maintenance | 0 (0.0%) | 0 (0.0%) |
| Personal Care & Service | 0 (0.0%) | 0 (0.0%) |
| Total (Category) | 39 (100.0%) | 0 (0.0%) |
| Total (Overall) | 48 (54.5%) | 40 (45.5%) |
Sales and Office Occupations
The most common Sales and Office occupations in Brick Center are , and Office & Administration (32 | 36.4%).
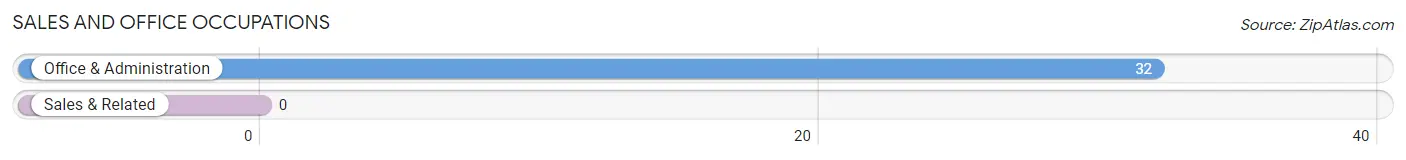
Sales and Office Occupations by Sex
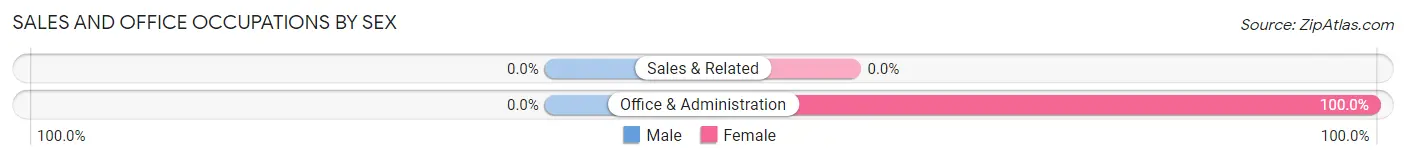
| Occupation | Male | Female |
| Sales & Related | 0 (0.0%) | 0 (0.0%) |
| Office & Administration | 0 (0.0%) | 32 (100.0%) |
| Total (Category) | 0 (0.0%) | 32 (100.0%) |
| Total (Overall) | 48 (54.5%) | 40 (45.5%) |
Natural Resources, Construction and Maintenance Occupations
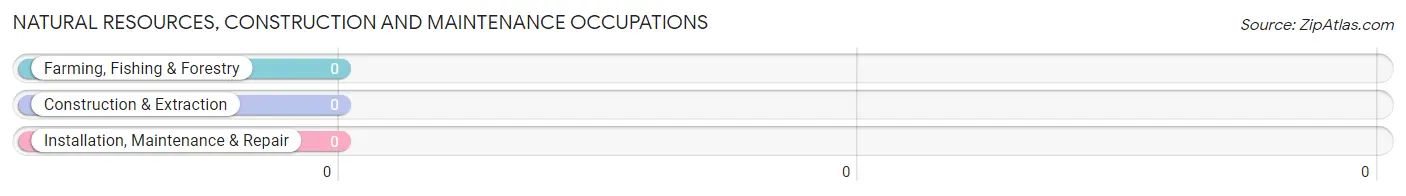
Natural Resources, Construction and Maintenance Occupations by Sex
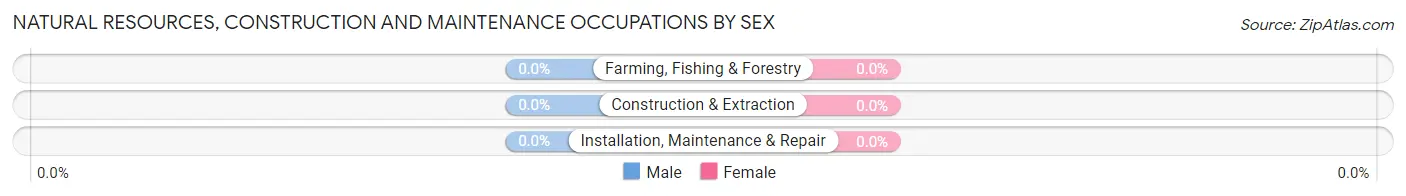
| Occupation | Male | Female |
| Farming, Fishing & Forestry | 0 (0.0%) | 0 (0.0%) |
| Construction & Extraction | 0 (0.0%) | 0 (0.0%) |
| Installation, Maintenance & Repair | 0 (0.0%) | 0 (0.0%) |
| Total (Category) | 0 (0.0%) | 0 (0.0%) |
| Total (Overall) | 48 (54.5%) | 40 (45.5%) |
Production, Transportation and Moving Occupations
The most common Production, Transportation and Moving occupations in Brick Center are , and Transportation (9 | 10.2%).
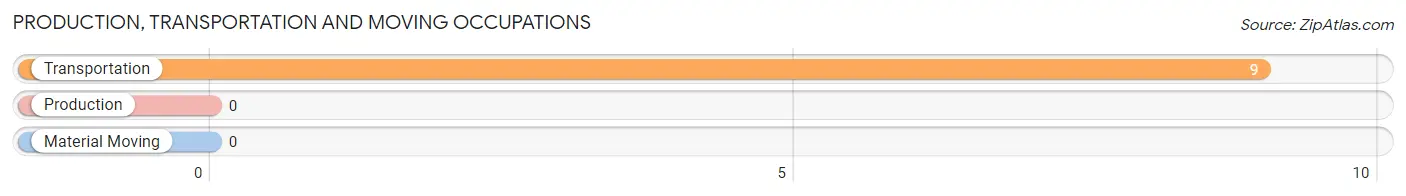
Production, Transportation and Moving Occupations by Sex
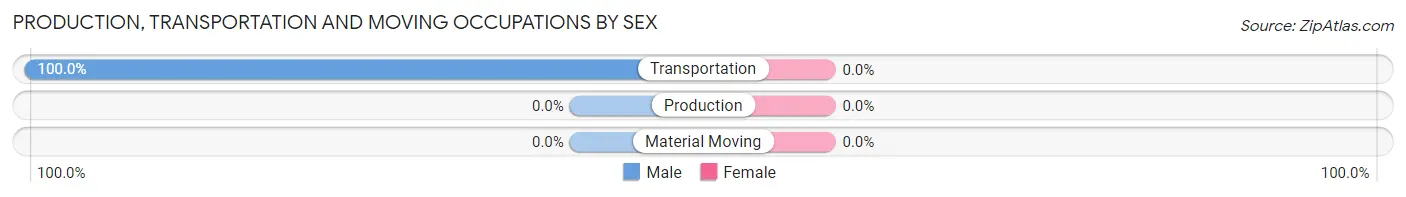
| Occupation | Male | Female |
| Production | 0 (0.0%) | 0 (0.0%) |
| Transportation | 9 (100.0%) | 0 (0.0%) |
| Material Moving | 0 (0.0%) | 0 (0.0%) |
| Total (Category) | 9 (100.0%) | 0 (0.0%) |
| Total (Overall) | 48 (54.5%) | 40 (45.5%) |
Employment Industries by Sex in Brick Center
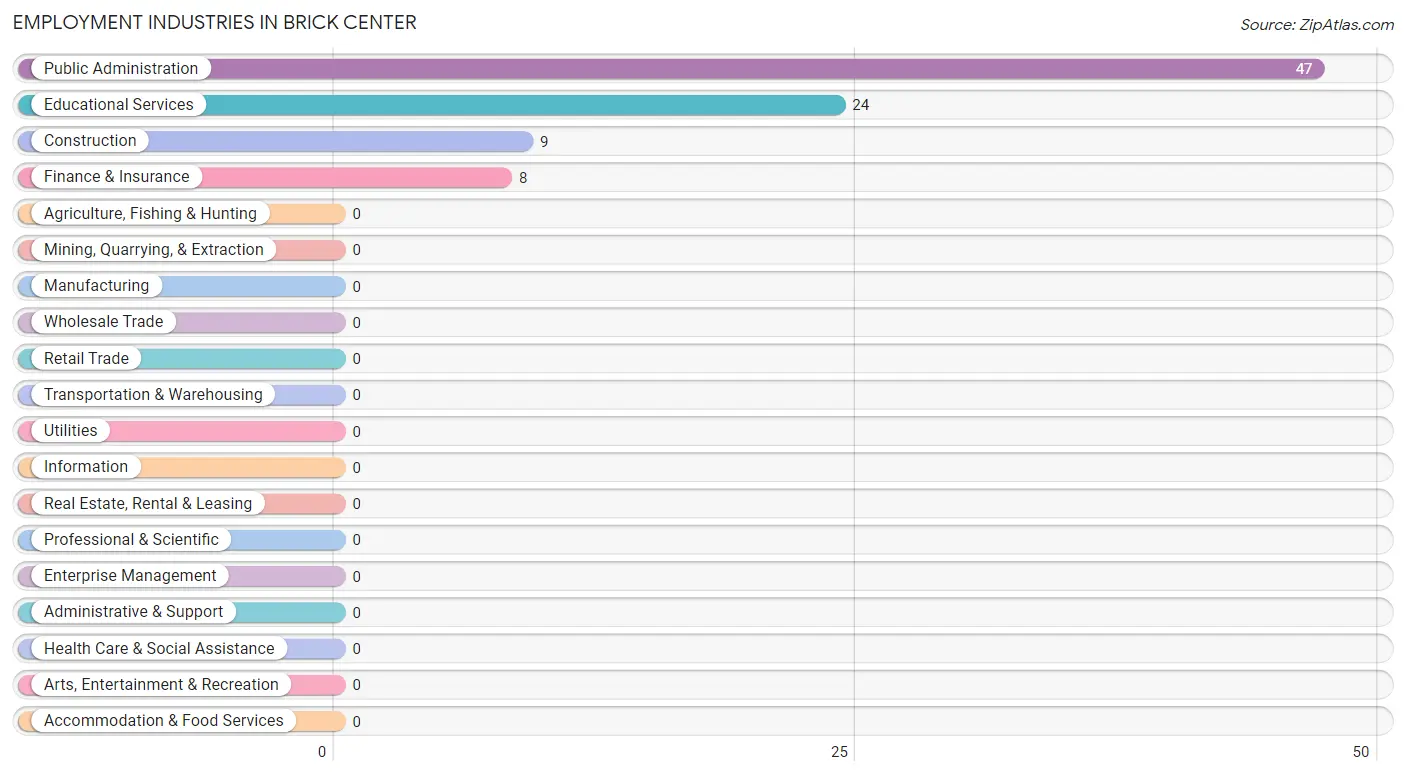
Employment Industries in Brick Center
The major employment industries in Brick Center include Public Administration (47 | 53.4%), Educational Services (24 | 27.3%), Construction (9 | 10.2%), and Finance & Insurance (8 | 9.1%).
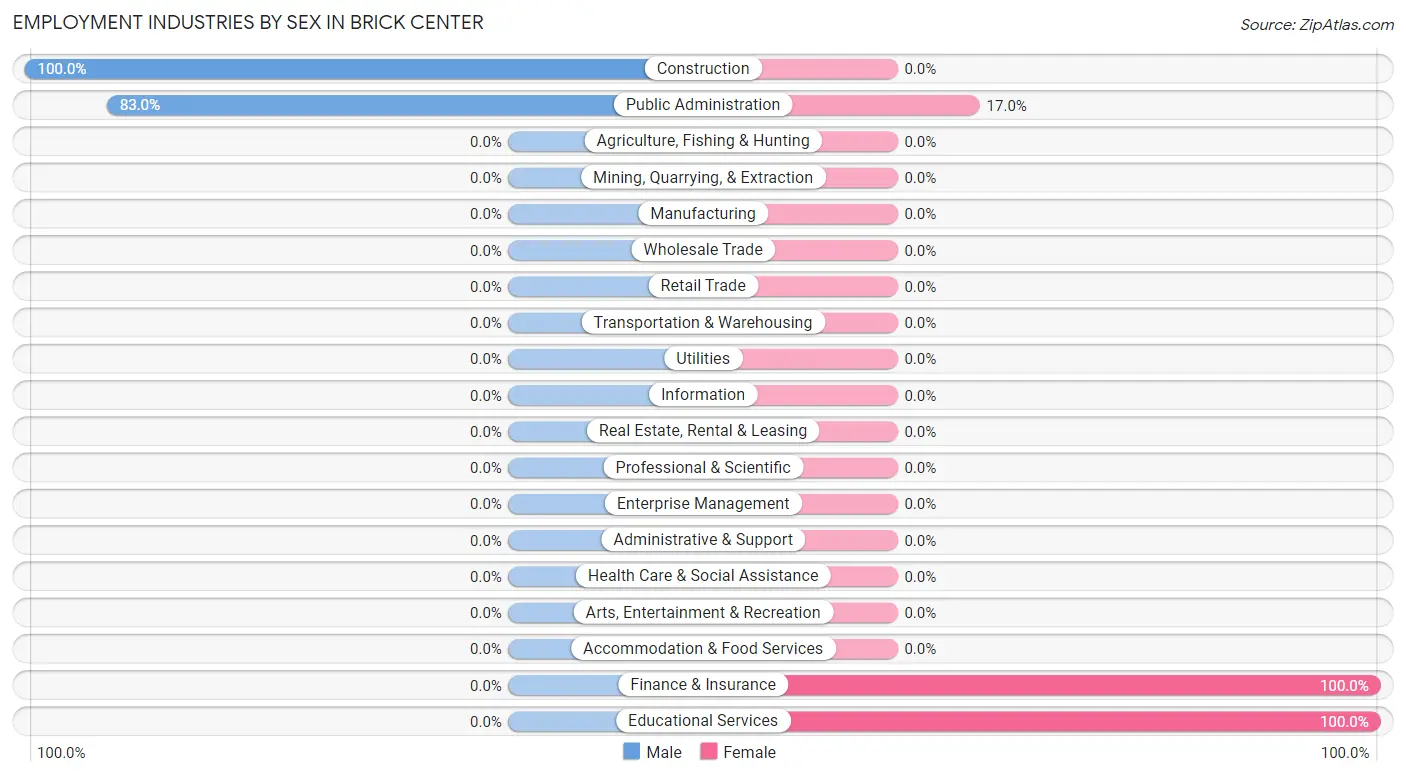
Employment Industries by Sex in Brick Center
The Brick Center industries that see more men than women are Construction (100.0%), and Public Administration (83.0%), whereas the industries that tend to have a higher number of women are Finance & Insurance (100.0%), Educational Services (100.0%), and Public Administration (17.0%).
| Industry | Male | Female |
| Agriculture, Fishing & Hunting | 0 (0.0%) | 0 (0.0%) |
| Mining, Quarrying, & Extraction | 0 (0.0%) | 0 (0.0%) |
| Construction | 9 (100.0%) | 0 (0.0%) |
| Manufacturing | 0 (0.0%) | 0 (0.0%) |
| Wholesale Trade | 0 (0.0%) | 0 (0.0%) |
| Retail Trade | 0 (0.0%) | 0 (0.0%) |
| Transportation & Warehousing | 0 (0.0%) | 0 (0.0%) |
| Utilities | 0 (0.0%) | 0 (0.0%) |
| Information | 0 (0.0%) | 0 (0.0%) |
| Finance & Insurance | 0 (0.0%) | 8 (100.0%) |
| Real Estate, Rental & Leasing | 0 (0.0%) | 0 (0.0%) |
| Professional & Scientific | 0 (0.0%) | 0 (0.0%) |
| Enterprise Management | 0 (0.0%) | 0 (0.0%) |
| Administrative & Support | 0 (0.0%) | 0 (0.0%) |
| Educational Services | 0 (0.0%) | 24 (100.0%) |
| Health Care & Social Assistance | 0 (0.0%) | 0 (0.0%) |
| Arts, Entertainment & Recreation | 0 (0.0%) | 0 (0.0%) |
| Accommodation & Food Services | 0 (0.0%) | 0 (0.0%) |
| Public Administration | 39 (83.0%) | 8 (17.0%) |
| Total | 48 (54.5%) | 40 (45.5%) |
Education in Brick Center
School Enrollment in Brick Center
| School Level | # Students | % Students |
| Nursery / Preschool | 0 | 0.0% |
| Kindergarten | 0 | 0.0% |
| Elementary School | 0 | 0.0% |
| Middle School | 0 | 0.0% |
| High School | 0 | 0.0% |
| College / Undergraduate | 0 | 0.0% |
| Graduate / Professional | 0 | 0.0% |
| Total | 0 | 0.0% |
School Enrollment by Age by Funding Source in Brick Center
| Age Bracket | Public School | Private School |
| 3 to 4 Year Olds | 0 (0.0%) | 0 (0.0%) |
| 5 to 9 Year Old | 0 (0.0%) | 0 (0.0%) |
| 10 to 14 Year Olds | 0 (0.0%) | 0 (0.0%) |
| 15 to 17 Year Olds | 0 (0.0%) | 0 (0.0%) |
| 18 to 19 Year Olds | 0 (0.0%) | 0 (0.0%) |
| 20 to 24 Year Olds | 0 (0.0%) | 0 (0.0%) |
| 25 to 34 Year Olds | 0 (0.0%) | 0 (0.0%) |
| 35 Years and over | 0 (0.0%) | 0 (0.0%) |
| Total | 0 (0.0%) | 0 (0.0%) |
Educational Attainment by Field of Study in Brick Center
, and business (8 | 100.0%) are the most common fields of study among 8 individuals in Brick Center who have obtained a bachelor's degree or higher.
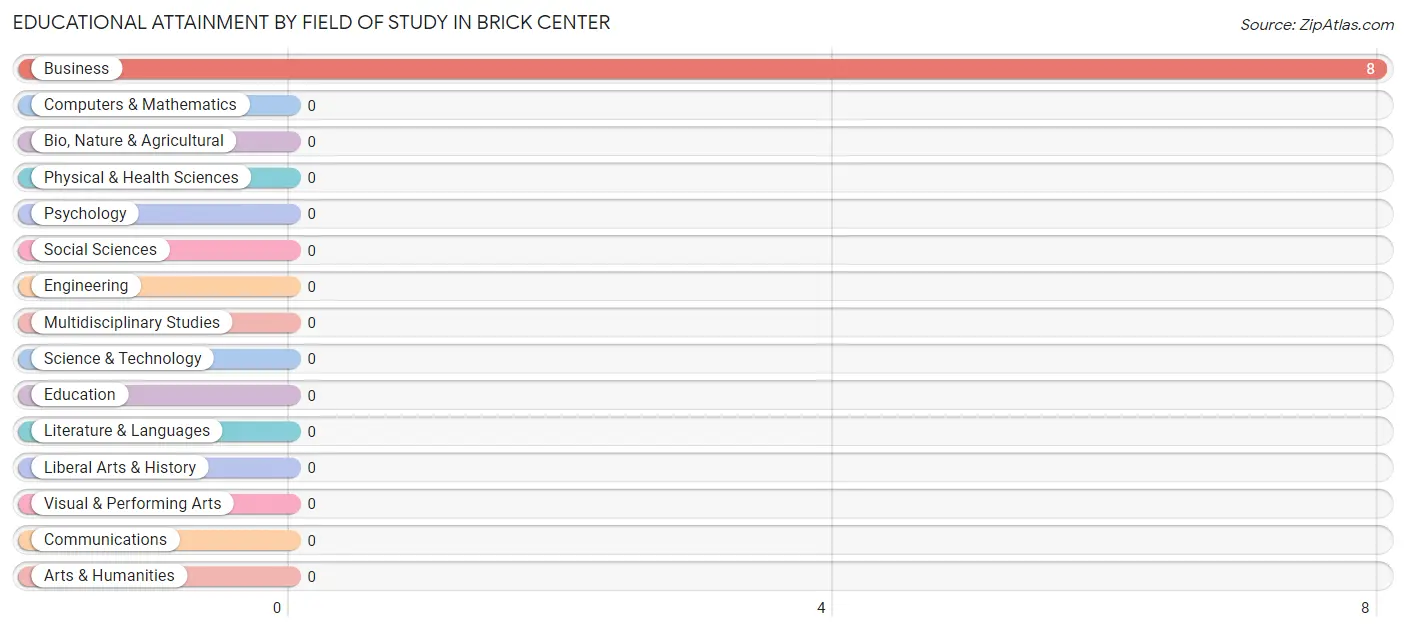
| Field of Study | # Graduates | % Graduates |
| Computers & Mathematics | 0 | 0.0% |
| Bio, Nature & Agricultural | 0 | 0.0% |
| Physical & Health Sciences | 0 | 0.0% |
| Psychology | 0 | 0.0% |
| Social Sciences | 0 | 0.0% |
| Engineering | 0 | 0.0% |
| Multidisciplinary Studies | 0 | 0.0% |
| Science & Technology | 0 | 0.0% |
| Business | 8 | 100.0% |
| Education | 0 | 0.0% |
| Literature & Languages | 0 | 0.0% |
| Liberal Arts & History | 0 | 0.0% |
| Visual & Performing Arts | 0 | 0.0% |
| Communications | 0 | 0.0% |
| Arts & Humanities | 0 | 0.0% |
| Total | 8 | 100.0% |
Transportation & Commute in Brick Center
Vehicle Availability by Sex in Brick Center
The most prevalent vehicle ownership categories in Brick Center are males with 3 vehicles (31, accounting for 64.6%) and females with 3 vehicles (24, making up 77.5%).
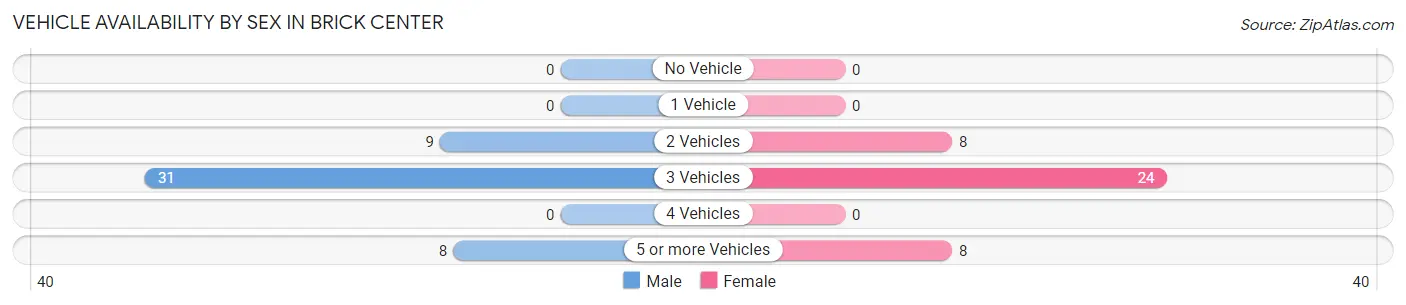
| Vehicles Available | Male | Female |
| No Vehicle | 0 (0.0%) | 0 (0.0%) |
| 1 Vehicle | 0 (0.0%) | 0 (0.0%) |
| 2 Vehicles | 9 (18.8%) | 8 (20.0%) |
| 3 Vehicles | 31 (64.6%) | 24 (60.0%) |
| 4 Vehicles | 0 (0.0%) | 0 (0.0%) |
| 5 or more Vehicles | 8 (16.7%) | 8 (20.0%) |
| Total | 48 (100.0%) | 40 (100.0%) |
Commute Time in Brick Center
The most frequently occuring commute durations in Brick Center are 20 to 24 minutes (55 commuters, 68.8%), 60 to 89 minutes (16 commuters, 20.0%), and 10 to 14 minutes (9 commuters, 11.3%).
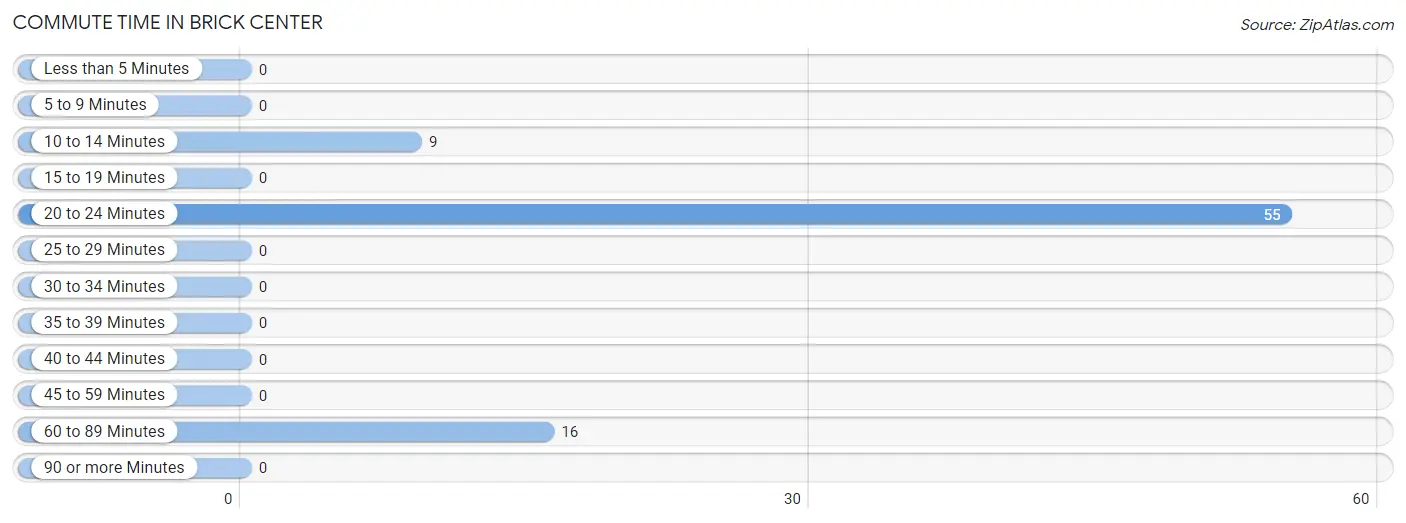
| Commute Time | # Commuters | % Commuters |
| Less than 5 Minutes | 0 | 0.0% |
| 5 to 9 Minutes | 0 | 0.0% |
| 10 to 14 Minutes | 9 | 11.3% |
| 15 to 19 Minutes | 0 | 0.0% |
| 20 to 24 Minutes | 55 | 68.8% |
| 25 to 29 Minutes | 0 | 0.0% |
| 30 to 34 Minutes | 0 | 0.0% |
| 35 to 39 Minutes | 0 | 0.0% |
| 40 to 44 Minutes | 0 | 0.0% |
| 45 to 59 Minutes | 0 | 0.0% |
| 60 to 89 Minutes | 16 | 20.0% |
| 90 or more Minutes | 0 | 0.0% |
Commute Time by Sex in Brick Center
The most common commute times in Brick Center are 20 to 24 minutes (31 commuters, 64.6%) for males and 20 to 24 minutes (24 commuters, 75.0%) for females.
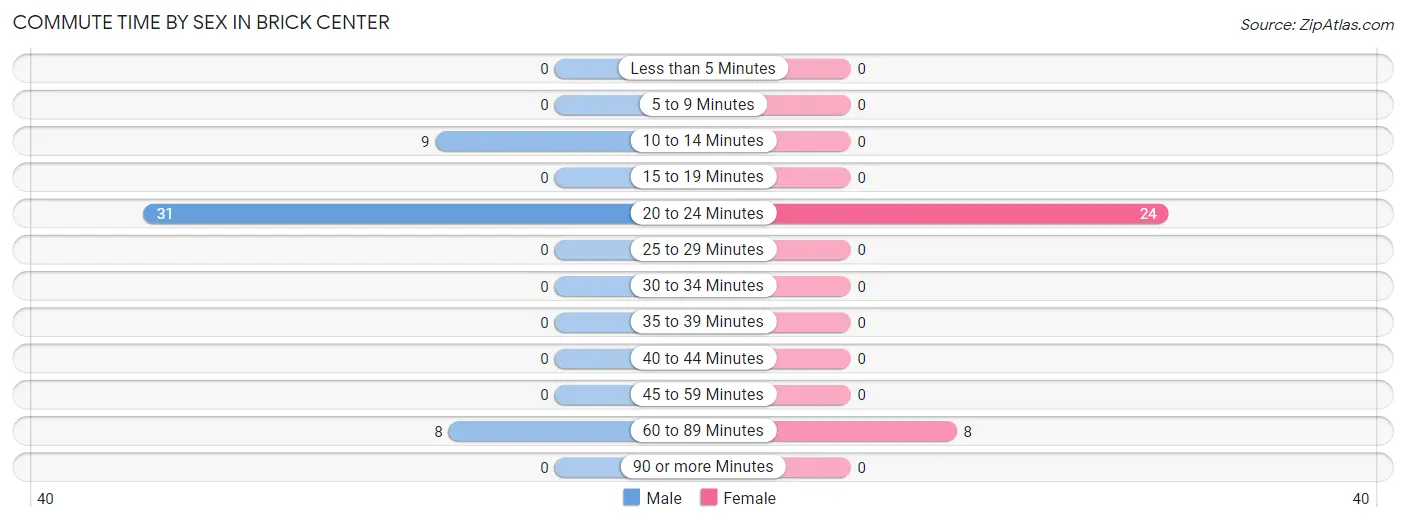
| Commute Time | Male | Female |
| Less than 5 Minutes | 0 (0.0%) | 0 (0.0%) |
| 5 to 9 Minutes | 0 (0.0%) | 0 (0.0%) |
| 10 to 14 Minutes | 9 (18.8%) | 0 (0.0%) |
| 15 to 19 Minutes | 0 (0.0%) | 0 (0.0%) |
| 20 to 24 Minutes | 31 (64.6%) | 24 (75.0%) |
| 25 to 29 Minutes | 0 (0.0%) | 0 (0.0%) |
| 30 to 34 Minutes | 0 (0.0%) | 0 (0.0%) |
| 35 to 39 Minutes | 0 (0.0%) | 0 (0.0%) |
| 40 to 44 Minutes | 0 (0.0%) | 0 (0.0%) |
| 45 to 59 Minutes | 0 (0.0%) | 0 (0.0%) |
| 60 to 89 Minutes | 8 (16.7%) | 8 (25.0%) |
| 90 or more Minutes | 0 (0.0%) | 0 (0.0%) |
Time of Departure to Work by Sex in Brick Center
The most frequent times of departure to work in Brick Center are 6:30 AM to 6:59 AM (40, 83.3%) for males and 6:00 AM to 6:29 AM (24, 75.0%) for females.
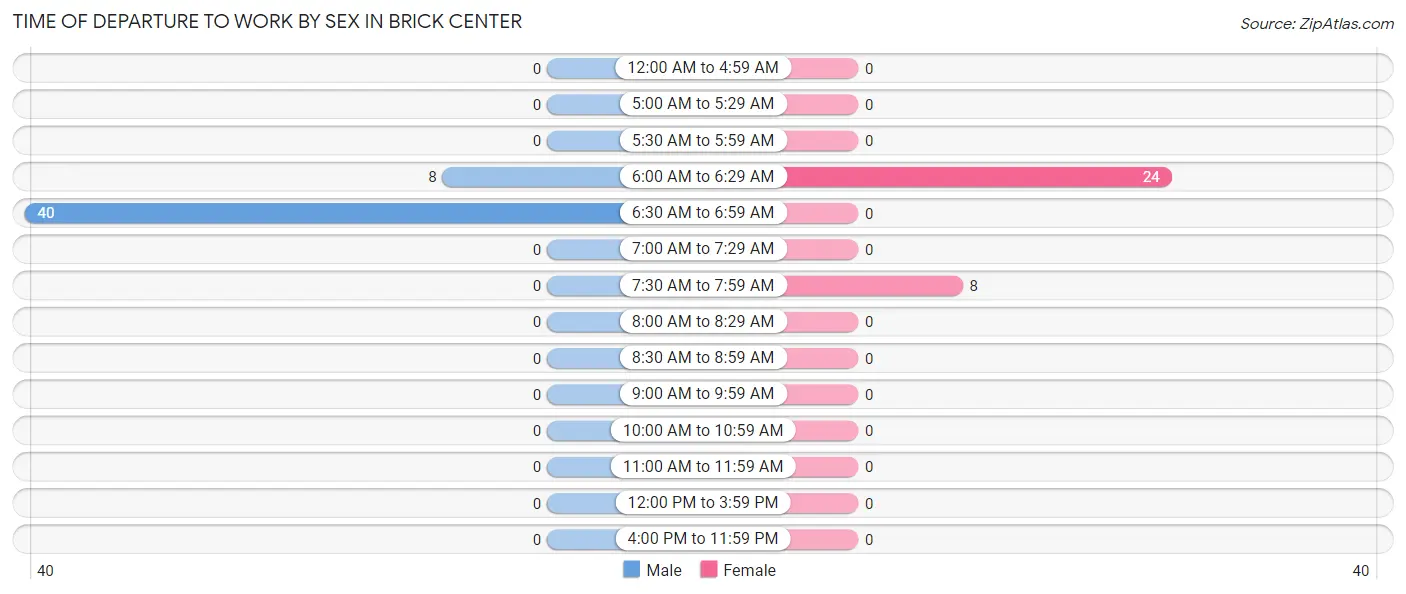
| Time of Departure | Male | Female |
| 12:00 AM to 4:59 AM | 0 (0.0%) | 0 (0.0%) |
| 5:00 AM to 5:29 AM | 0 (0.0%) | 0 (0.0%) |
| 5:30 AM to 5:59 AM | 0 (0.0%) | 0 (0.0%) |
| 6:00 AM to 6:29 AM | 8 (16.7%) | 24 (75.0%) |
| 6:30 AM to 6:59 AM | 40 (83.3%) | 0 (0.0%) |
| 7:00 AM to 7:29 AM | 0 (0.0%) | 0 (0.0%) |
| 7:30 AM to 7:59 AM | 0 (0.0%) | 8 (25.0%) |
| 8:00 AM to 8:29 AM | 0 (0.0%) | 0 (0.0%) |
| 8:30 AM to 8:59 AM | 0 (0.0%) | 0 (0.0%) |
| 9:00 AM to 9:59 AM | 0 (0.0%) | 0 (0.0%) |
| 10:00 AM to 10:59 AM | 0 (0.0%) | 0 (0.0%) |
| 11:00 AM to 11:59 AM | 0 (0.0%) | 0 (0.0%) |
| 12:00 PM to 3:59 PM | 0 (0.0%) | 0 (0.0%) |
| 4:00 PM to 11:59 PM | 0 (0.0%) | 0 (0.0%) |
| Total | 48 (100.0%) | 32 (100.0%) |
Housing Occupancy in Brick Center
Occupancy by Ownership in Brick Center
Of the total 41 dwellings in Brick Center, owner-occupied units account for 41 (100.0%), while renter-occupied units make up 0 (0.0%).
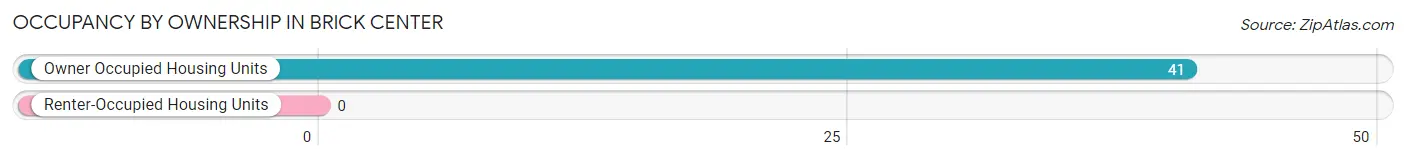
| Occupancy | # Housing Units | % Housing Units |
| Owner Occupied Housing Units | 41 | 100.0% |
| Renter-Occupied Housing Units | 0 | 0.0% |
| Total Occupied Housing Units | 41 | 100.0% |
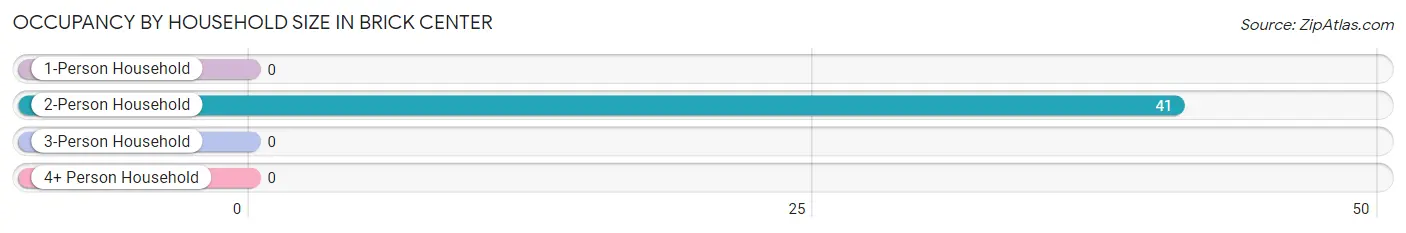
Occupancy by Household Size in Brick Center
| Household Size | # Housing Units | % Housing Units |
| 1-Person Household | 0 | 0.0% |
| 2-Person Household | 41 | 100.0% |
| 3-Person Household | 0 | 0.0% |
| 4+ Person Household | 0 | 0.0% |
| Total Housing Units | 41 | 100.0% |
Occupancy by Ownership by Household Size in Brick Center
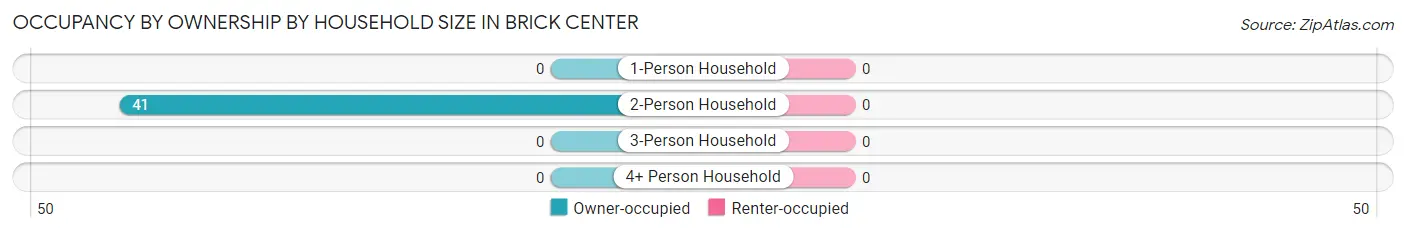
| Household Size | Owner-occupied | Renter-occupied |
| 1-Person Household | 0 (0.0%) | 0 (0.0%) |
| 2-Person Household | 41 (100.0%) | 0 (0.0%) |
| 3-Person Household | 0 (0.0%) | 0 (0.0%) |
| 4+ Person Household | 0 (0.0%) | 0 (0.0%) |
| Total Housing Units | 41 (100.0%) | 0 (0.0%) |
Occupancy by Educational Attainment in Brick Center
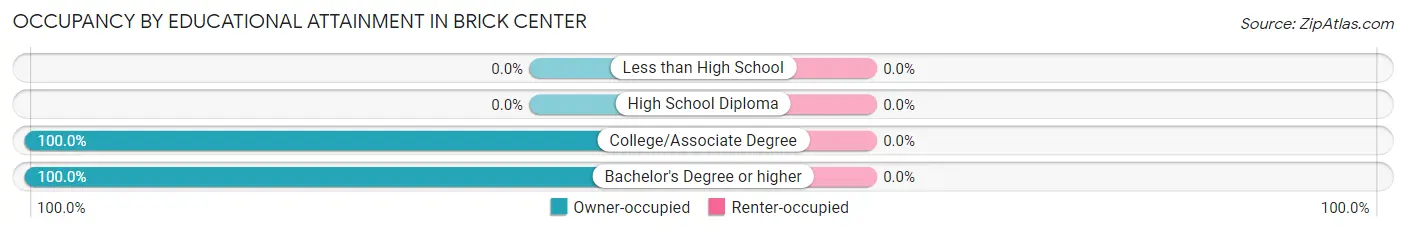
| Household Size | Owner-occupied | Renter-occupied |
| Less than High School | 0 (0.0%) | 0 (0.0%) |
| High School Diploma | 0 (0.0%) | 0 (0.0%) |
| College/Associate Degree | 33 (100.0%) | 0 (0.0%) |
| Bachelor's Degree or higher | 8 (100.0%) | 0 (0.0%) |
Occupancy by Age of Householder in Brick Center
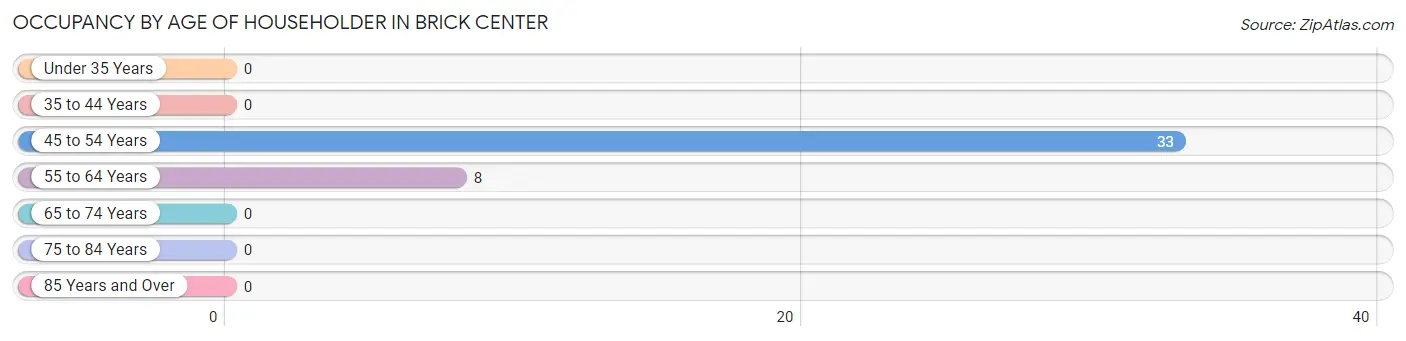
| Age Bracket | # Households | % Households |
| Under 35 Years | 0 | 0.0% |
| 35 to 44 Years | 0 | 0.0% |
| 45 to 54 Years | 33 | 80.5% |
| 55 to 64 Years | 8 | 19.5% |
| 65 to 74 Years | 0 | 0.0% |
| 75 to 84 Years | 0 | 0.0% |
| 85 Years and Over | 0 | 0.0% |
| Total | 41 | 100.0% |
Housing Finances in Brick Center
Median Income by Occupancy in Brick Center
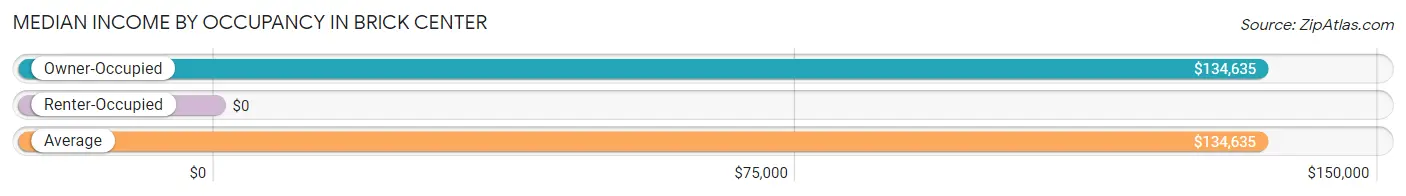
| Occupancy Type | # Households | Median Income |
| Owner-Occupied | 41 (100.0%) | $134,635 |
| Renter-Occupied | 0 (0.0%) | $0 |
| Average | 41 (100.0%) | $134,635 |
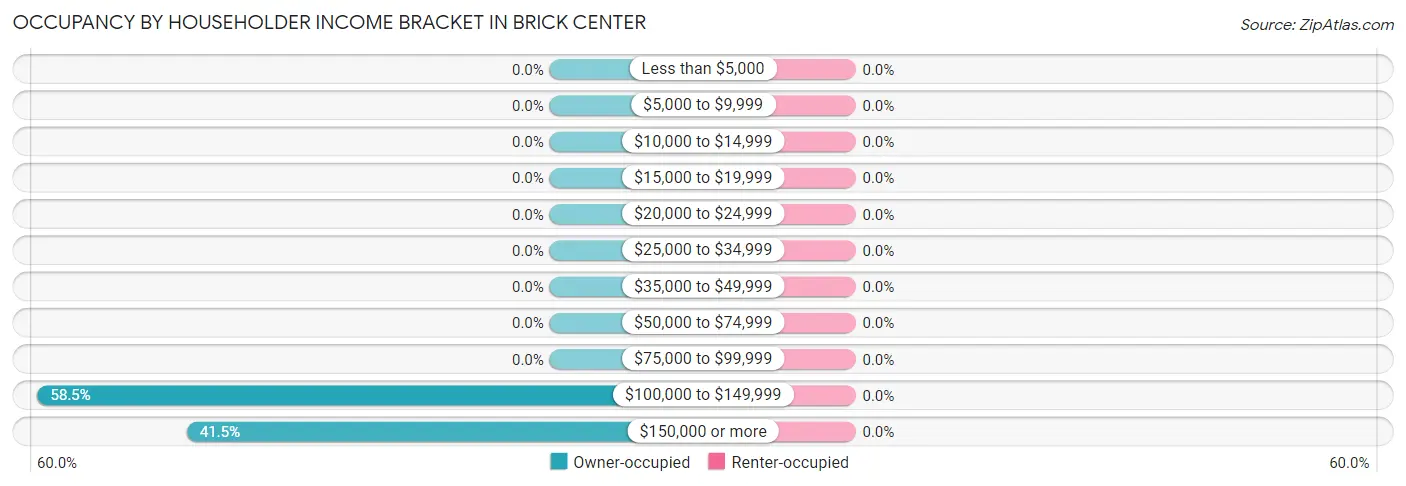
Occupancy by Householder Income Bracket in Brick Center
| Income Bracket | Owner-occupied | Renter-occupied |
| Less than $5,000 | 0 (0.0%) | 0 (0.0%) |
| $5,000 to $9,999 | 0 (0.0%) | 0 (0.0%) |
| $10,000 to $14,999 | 0 (0.0%) | 0 (0.0%) |
| $15,000 to $19,999 | 0 (0.0%) | 0 (0.0%) |
| $20,000 to $24,999 | 0 (0.0%) | 0 (0.0%) |
| $25,000 to $34,999 | 0 (0.0%) | 0 (0.0%) |
| $35,000 to $49,999 | 0 (0.0%) | 0 (0.0%) |
| $50,000 to $74,999 | 0 (0.0%) | 0 (0.0%) |
| $75,000 to $99,999 | 0 (0.0%) | 0 (0.0%) |
| $100,000 to $149,999 | 24 (58.5%) | 0 (0.0%) |
| $150,000 or more | 17 (41.5%) | 0 (0.0%) |
| Total | 41 (100.0%) | 0 (0.0%) |
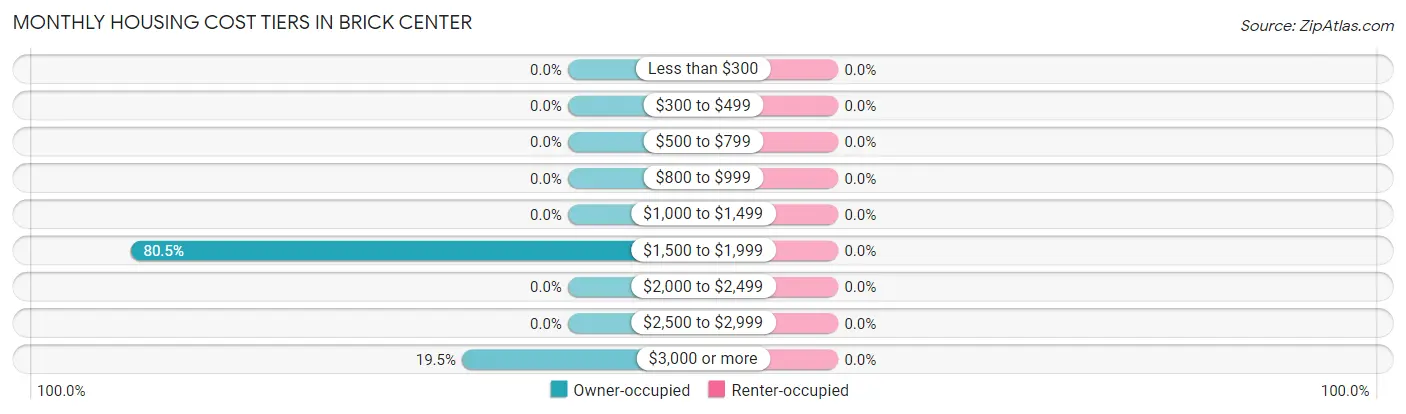
Monthly Housing Cost Tiers in Brick Center
| Monthly Cost | Owner-occupied | Renter-occupied |
| Less than $300 | 0 (0.0%) | 0 (0.0%) |
| $300 to $499 | 0 (0.0%) | 0 (0.0%) |
| $500 to $799 | 0 (0.0%) | 0 (0.0%) |
| $800 to $999 | 0 (0.0%) | 0 (0.0%) |
| $1,000 to $1,499 | 0 (0.0%) | 0 (0.0%) |
| $1,500 to $1,999 | 33 (80.5%) | 0 (0.0%) |
| $2,000 to $2,499 | 0 (0.0%) | 0 (0.0%) |
| $2,500 to $2,999 | 0 (0.0%) | 0 (0.0%) |
| $3,000 or more | 8 (19.5%) | 0 (0.0%) |
| Total | 41 (100.0%) | 0 (0.0%) |
Physical Housing Characteristics in Brick Center
Housing Structures in Brick Center
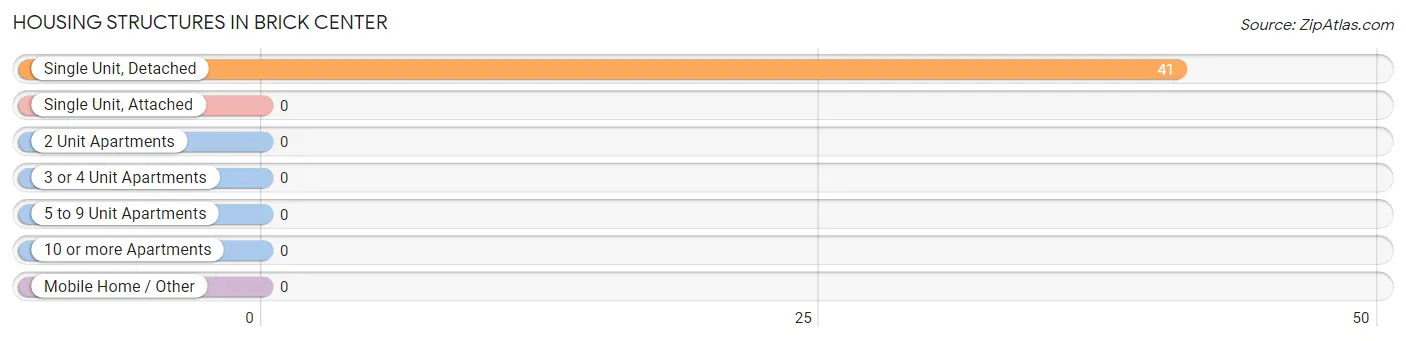
| Structure Type | # Housing Units | % Housing Units |
| Single Unit, Detached | 41 | 100.0% |
| Single Unit, Attached | 0 | 0.0% |
| 2 Unit Apartments | 0 | 0.0% |
| 3 or 4 Unit Apartments | 0 | 0.0% |
| 5 to 9 Unit Apartments | 0 | 0.0% |
| 10 or more Apartments | 0 | 0.0% |
| Mobile Home / Other | 0 | 0.0% |
| Total | 41 | 100.0% |
Housing Structures by Occupancy in Brick Center
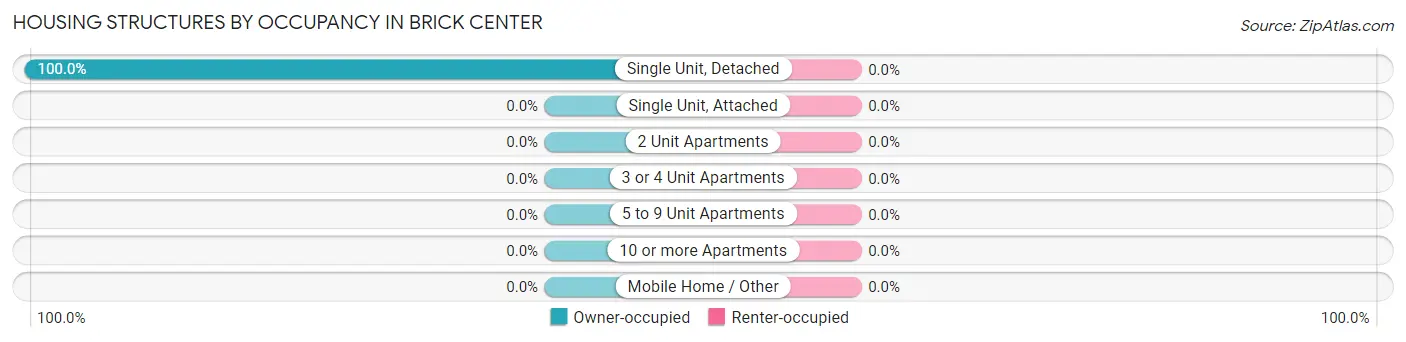
| Structure Type | Owner-occupied | Renter-occupied |
| Single Unit, Detached | 41 (100.0%) | 0 (0.0%) |
| Single Unit, Attached | 0 (0.0%) | 0 (0.0%) |
| 2 Unit Apartments | 0 (0.0%) | 0 (0.0%) |
| 3 or 4 Unit Apartments | 0 (0.0%) | 0 (0.0%) |
| 5 to 9 Unit Apartments | 0 (0.0%) | 0 (0.0%) |
| 10 or more Apartments | 0 (0.0%) | 0 (0.0%) |
| Mobile Home / Other | 0 (0.0%) | 0 (0.0%) |
| Total | 41 (100.0%) | 0 (0.0%) |
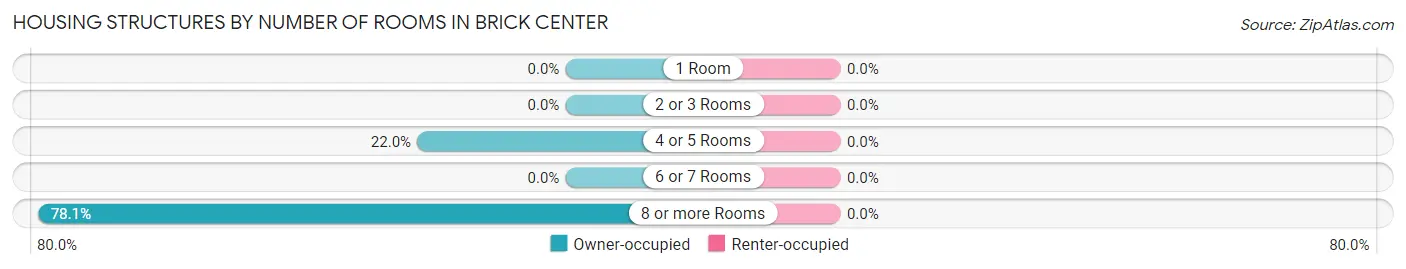
Housing Structures by Number of Rooms in Brick Center
| Number of Rooms | Owner-occupied | Renter-occupied |
| 1 Room | 0 (0.0%) | 0 (0.0%) |
| 2 or 3 Rooms | 0 (0.0%) | 0 (0.0%) |
| 4 or 5 Rooms | 9 (22.0%) | 0 (0.0%) |
| 6 or 7 Rooms | 0 (0.0%) | 0 (0.0%) |
| 8 or more Rooms | 32 (78.0%) | 0 (0.0%) |
| Total | 41 (100.0%) | 0 (0.0%) |
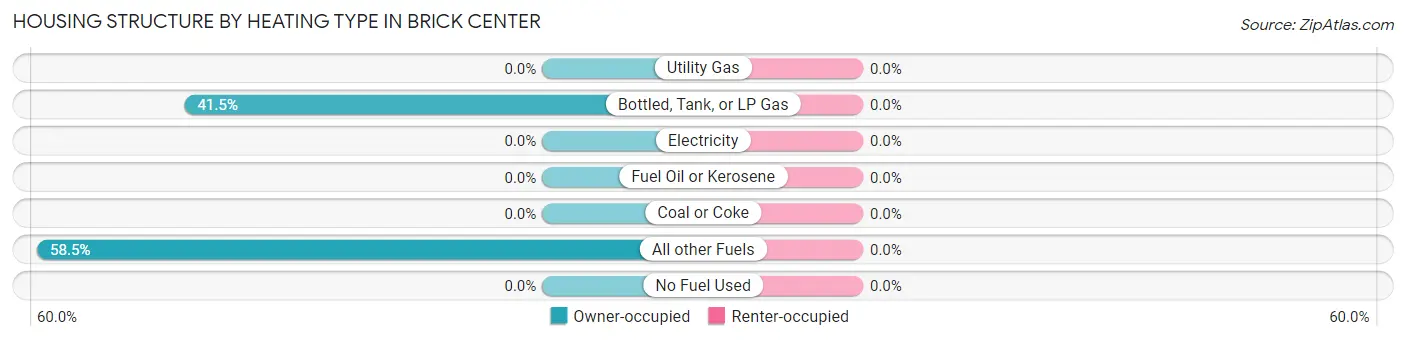
Housing Structure by Heating Type in Brick Center
| Heating Type | Owner-occupied | Renter-occupied |
| Utility Gas | 0 (0.0%) | 0 (0.0%) |
| Bottled, Tank, or LP Gas | 17 (41.5%) | 0 (0.0%) |
| Electricity | 0 (0.0%) | 0 (0.0%) |
| Fuel Oil or Kerosene | 0 (0.0%) | 0 (0.0%) |
| Coal or Coke | 0 (0.0%) | 0 (0.0%) |
| All other Fuels | 24 (58.5%) | 0 (0.0%) |
| No Fuel Used | 0 (0.0%) | 0 (0.0%) |
| Total | 41 (100.0%) | 0 (0.0%) |
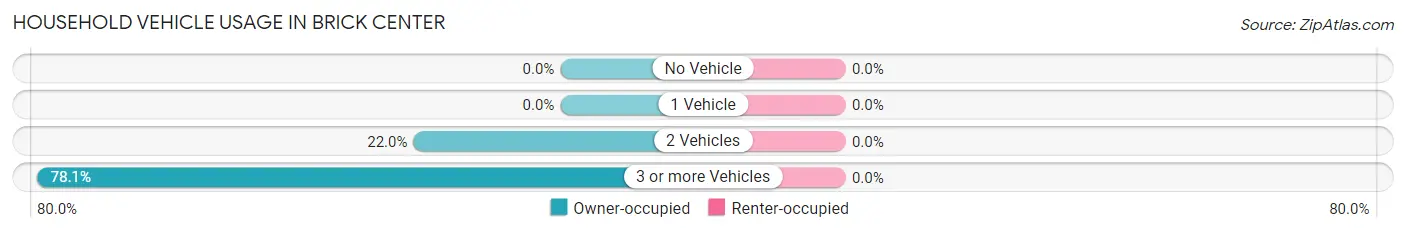
Household Vehicle Usage in Brick Center
| Vehicles per Household | Owner-occupied | Renter-occupied |
| No Vehicle | 0 (0.0%) | 0 (0.0%) |
| 1 Vehicle | 0 (0.0%) | 0 (0.0%) |
| 2 Vehicles | 9 (22.0%) | 0 (0.0%) |
| 3 or more Vehicles | 32 (78.0%) | 0 (0.0%) |
| Total | 41 (100.0%) | 0 (0.0%) |
Real Estate & Mortgages in Brick Center
Real Estate and Mortgage Overview in Brick Center
| Characteristic | Without Mortgage | With Mortgage |
| Housing Units | 0 | 41 |
| Median Property Value | - | - |
| Median Household Income | - | - |
| Monthly Housing Costs | - | - |
| Real Estate Taxes | - | - |
Property Value by Mortgage Status in Brick Center
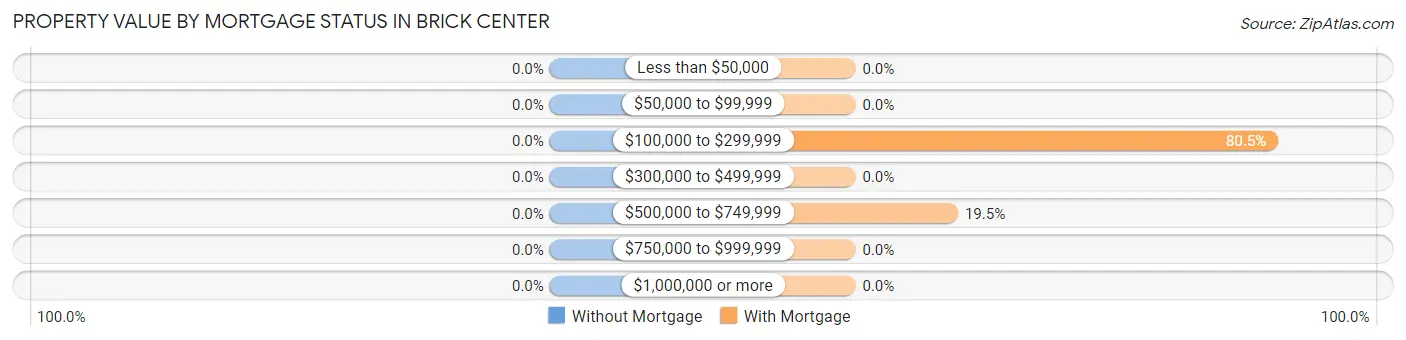
| Property Value | Without Mortgage | With Mortgage |
| Less than $50,000 | 0 (0.0%) | 0 (0.0%) |
| $50,000 to $99,999 | 0 (0.0%) | 0 (0.0%) |
| $100,000 to $299,999 | 0 (0.0%) | 33 (80.5%) |
| $300,000 to $499,999 | 0 (0.0%) | 0 (0.0%) |
| $500,000 to $749,999 | 0 (0.0%) | 8 (19.5%) |
| $750,000 to $999,999 | 0 (0.0%) | 0 (0.0%) |
| $1,000,000 or more | 0 (0.0%) | 0 (0.0%) |
| Total | 0 (0.0%) | 41 (100.0%) |
Household Income by Mortgage Status in Brick Center
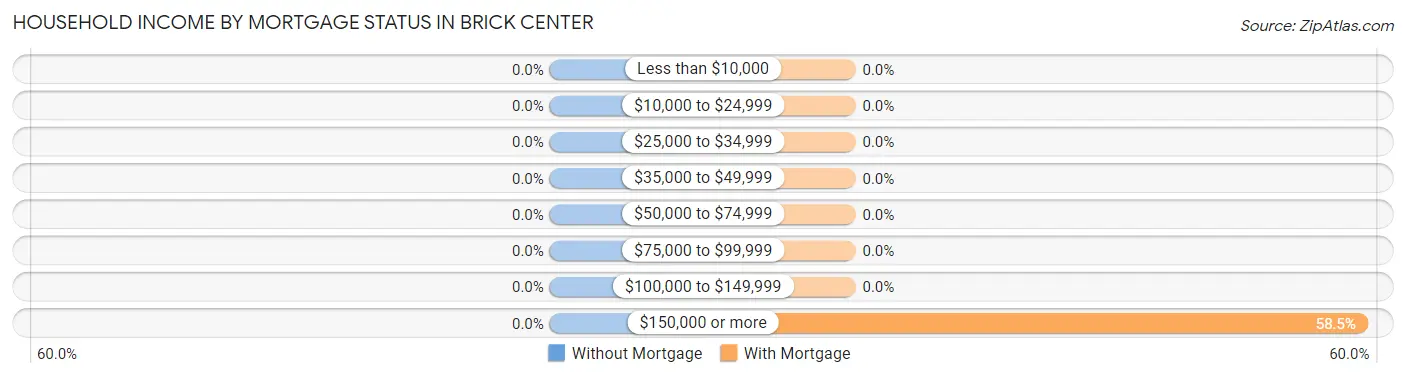
| Household Income | Without Mortgage | With Mortgage |
| Less than $10,000 | 0 (0.0%) | 0 (0.0%) |
| $10,000 to $24,999 | 0 (0.0%) | 0 (0.0%) |
| $25,000 to $34,999 | 0 (0.0%) | 0 (0.0%) |
| $35,000 to $49,999 | 0 (0.0%) | 0 (0.0%) |
| $50,000 to $74,999 | 0 (0.0%) | 0 (0.0%) |
| $75,000 to $99,999 | 0 (0.0%) | 0 (0.0%) |
| $100,000 to $149,999 | 0 (0.0%) | 0 (0.0%) |
| $150,000 or more | 0 (0.0%) | 24 (58.5%) |
| Total | 0 (0.0%) | 41 (100.0%) |
Property Value to Household Income Ratio in Brick Center
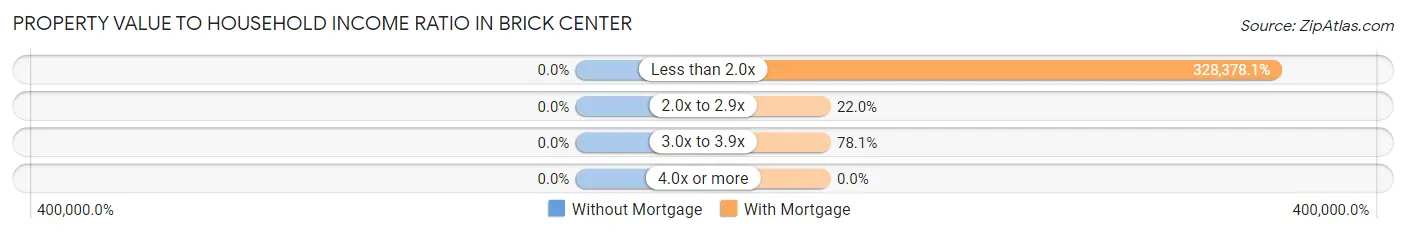
| Value-to-Income Ratio | Without Mortgage | With Mortgage |
| Less than 2.0x | 0 (0.0%) | 134,635 (328,378.0%) |
| 2.0x to 2.9x | 0 (0.0%) | 9 (22.0%) |
| 3.0x to 3.9x | 0 (0.0%) | 32 (78.0%) |
| 4.0x or more | 0 (0.0%) | 0 (0.0%) |
| Total | 0 (0.0%) | 41 (100.0%) |
Real Estate Taxes by Mortgage Status in Brick Center
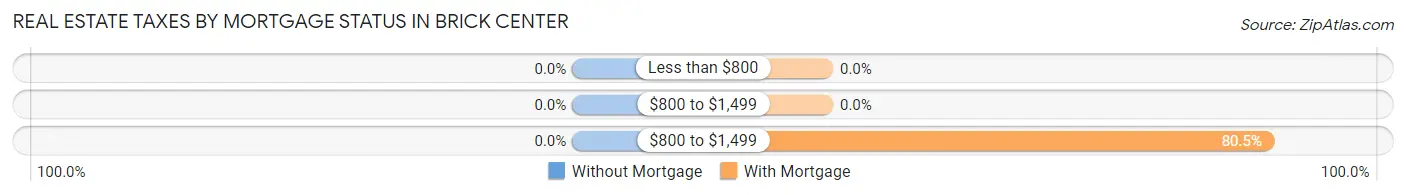
| Property Taxes | Without Mortgage | With Mortgage |
| Less than $800 | 0 (0.0%) | 0 (0.0%) |
| $800 to $1,499 | 0 (0.0%) | 0 (0.0%) |
| $800 to $1,499 | 0 (0.0%) | 33 (80.5%) |
| Total | 0 (0.0%) | 41 (100.0%) |
Health & Disability in Brick Center
Health Insurance Coverage by Age in Brick Center
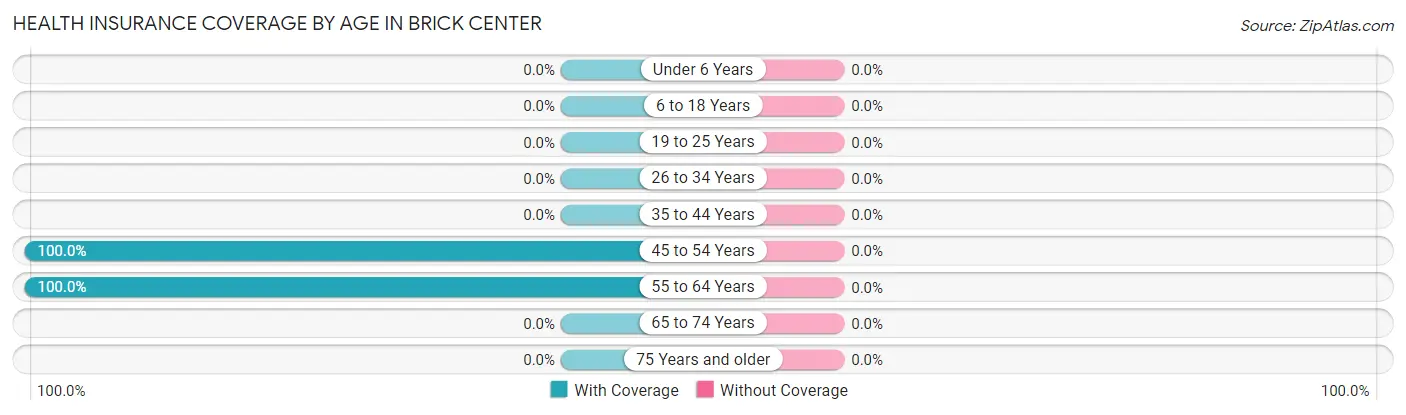
| Age Bracket | With Coverage | Without Coverage |
| Under 6 Years | 0 (0.0%) | 0 (0.0%) |
| 6 to 18 Years | 0 (0.0%) | 0 (0.0%) |
| 19 to 25 Years | 0 (0.0%) | 0 (0.0%) |
| 26 to 34 Years | 0 (0.0%) | 0 (0.0%) |
| 35 to 44 Years | 0 (0.0%) | 0 (0.0%) |
| 45 to 54 Years | 64 (100.0%) | 0 (0.0%) |
| 55 to 64 Years | 24 (100.0%) | 0 (0.0%) |
| 65 to 74 Years | 0 (0.0%) | 0 (0.0%) |
| 75 Years and older | 0 (0.0%) | 0 (0.0%) |
| Total | 88 (100.0%) | 0 (0.0%) |
Health Insurance Coverage by Citizenship Status in Brick Center
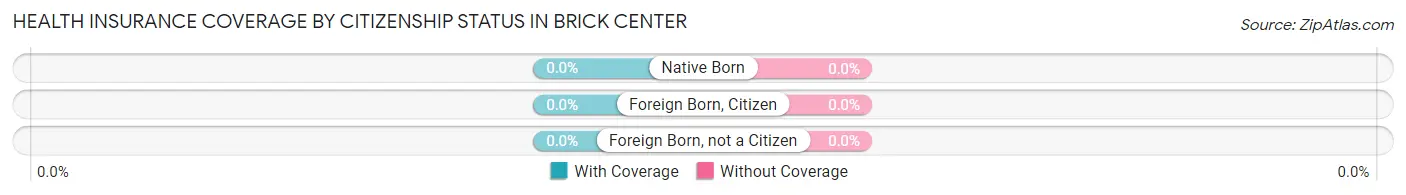
| Citizenship Status | With Coverage | Without Coverage |
| Native Born | 0 (0.0%) | 0 (0.0%) |
| Foreign Born, Citizen | 0 (0.0%) | 0 (0.0%) |
| Foreign Born, not a Citizen | 0 (0.0%) | 0 (0.0%) |
Health Insurance Coverage by Household Income in Brick Center
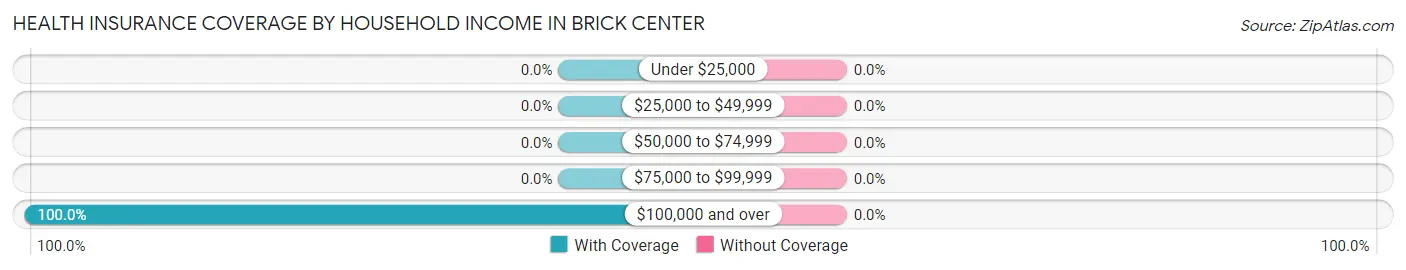
| Household Income | With Coverage | Without Coverage |
| Under $25,000 | 0 (0.0%) | 0 (0.0%) |
| $25,000 to $49,999 | 0 (0.0%) | 0 (0.0%) |
| $50,000 to $74,999 | 0 (0.0%) | 0 (0.0%) |
| $75,000 to $99,999 | 0 (0.0%) | 0 (0.0%) |
| $100,000 and over | 88 (100.0%) | 0 (0.0%) |
Public vs Private Health Insurance Coverage by Age in Brick Center
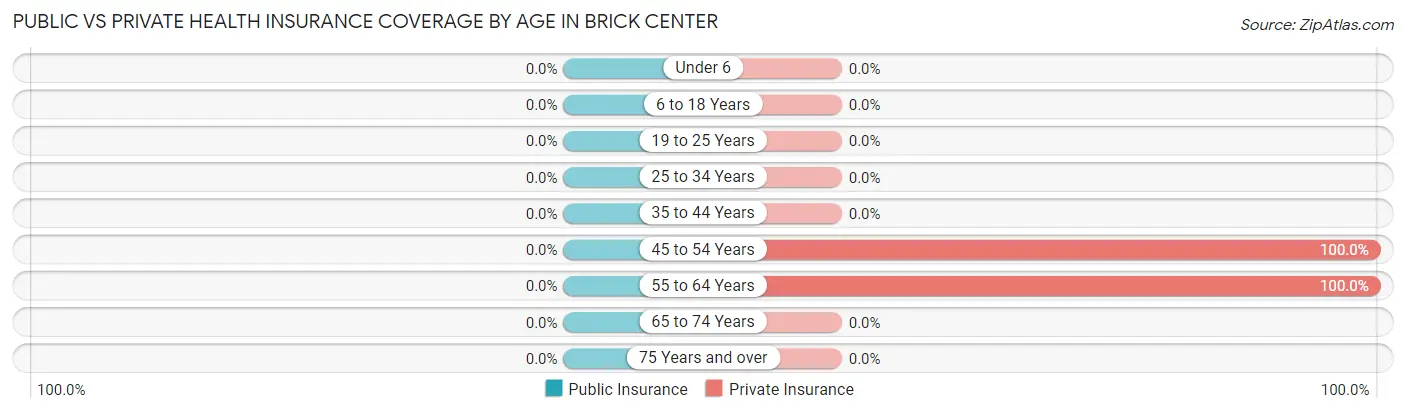
| Age Bracket | Public Insurance | Private Insurance |
| Under 6 | 0 (0.0%) | 0 (0.0%) |
| 6 to 18 Years | 0 (0.0%) | 0 (0.0%) |
| 19 to 25 Years | 0 (0.0%) | 0 (0.0%) |
| 25 to 34 Years | 0 (0.0%) | 0 (0.0%) |
| 35 to 44 Years | 0 (0.0%) | 0 (0.0%) |
| 45 to 54 Years | 0 (0.0%) | 64 (100.0%) |
| 55 to 64 Years | 0 (0.0%) | 24 (100.0%) |
| 65 to 74 Years | 0 (0.0%) | 0 (0.0%) |
| 75 Years and over | 0 (0.0%) | 0 (0.0%) |
| Total | 0 (0.0%) | 88 (100.0%) |
Disability Status by Sex by Age in Brick Center
| Age Bracket | Male | Female |
| Under 5 Years | 0 (0.0%) | 0 (0.0%) |
| 5 to 17 Years | 0 (0.0%) | 0 (0.0%) |
| 18 to 34 Years | 0 (0.0%) | 0 (0.0%) |
| 35 to 64 Years | 0 (0.0%) | 0 (0.0%) |
| 65 to 74 Years | 0 (0.0%) | 0 (0.0%) |
| 75 Years and over | 0 (0.0%) | 0 (0.0%) |
Disability Class by Sex by Age in Brick Center
Disability Class: Hearing Difficulty
| Age Bracket | Male | Female |
| Under 5 Years | 0 (0.0%) | 0 (0.0%) |
| 5 to 17 Years | 0 (0.0%) | 0 (0.0%) |
| 18 to 34 Years | 0 (0.0%) | 0 (0.0%) |
| 35 to 64 Years | 0 (0.0%) | 0 (0.0%) |
| 65 to 74 Years | 0 (0.0%) | 0 (0.0%) |
| 75 Years and over | 0 (0.0%) | 0 (0.0%) |
Disability Class: Vision Difficulty
| Age Bracket | Male | Female |
| Under 5 Years | 0 (0.0%) | 0 (0.0%) |
| 5 to 17 Years | 0 (0.0%) | 0 (0.0%) |
| 18 to 34 Years | 0 (0.0%) | 0 (0.0%) |
| 35 to 64 Years | 0 (0.0%) | 0 (0.0%) |
| 65 to 74 Years | 0 (0.0%) | 0 (0.0%) |
| 75 Years and over | 0 (0.0%) | 0 (0.0%) |
Disability Class: Cognitive Difficulty
| Age Bracket | Male | Female |
| 5 to 17 Years | 0 (0.0%) | 0 (0.0%) |
| 18 to 34 Years | 0 (0.0%) | 0 (0.0%) |
| 35 to 64 Years | 0 (0.0%) | 0 (0.0%) |
| 65 to 74 Years | 0 (0.0%) | 0 (0.0%) |
| 75 Years and over | 0 (0.0%) | 0 (0.0%) |
Disability Class: Ambulatory Difficulty
| Age Bracket | Male | Female |
| 5 to 17 Years | 0 (0.0%) | 0 (0.0%) |
| 18 to 34 Years | 0 (0.0%) | 0 (0.0%) |
| 35 to 64 Years | 0 (0.0%) | 0 (0.0%) |
| 65 to 74 Years | 0 (0.0%) | 0 (0.0%) |
| 75 Years and over | 0 (0.0%) | 0 (0.0%) |
Disability Class: Self-Care Difficulty
| Age Bracket | Male | Female |
| 5 to 17 Years | 0 (0.0%) | 0 (0.0%) |
| 18 to 34 Years | 0 (0.0%) | 0 (0.0%) |
| 35 to 64 Years | 0 (0.0%) | 0 (0.0%) |
| 65 to 74 Years | 0 (0.0%) | 0 (0.0%) |
| 75 Years and over | 0 (0.0%) | 0 (0.0%) |
Technology Access in Brick Center
Computing Device Access in Brick Center
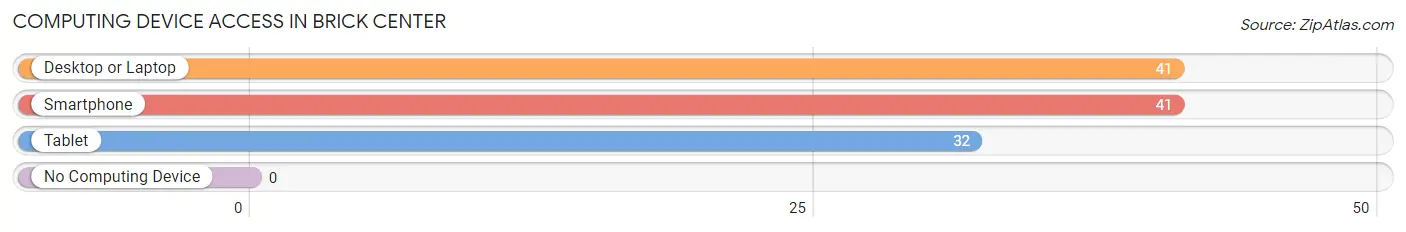
| Device Type | # Households | % Households |
| Desktop or Laptop | 41 | 100.0% |
| Smartphone | 41 | 100.0% |
| Tablet | 32 | 78.0% |
| No Computing Device | 0 | 0.0% |
| Total | 41 | 100.0% |
Internet Access in Brick Center
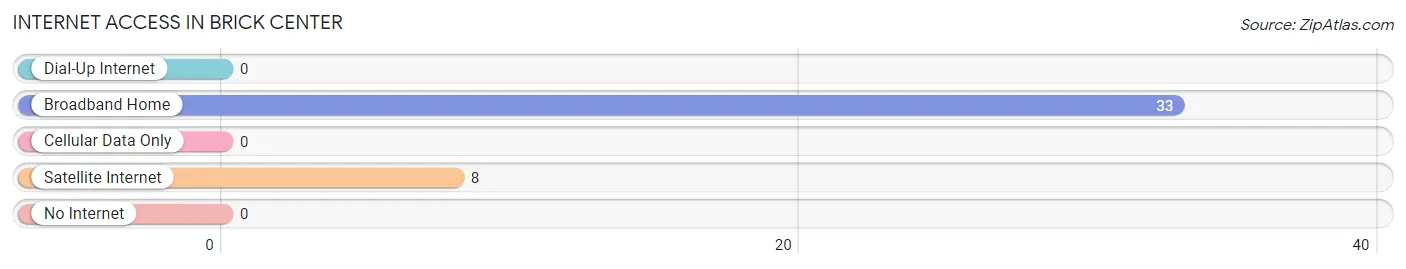
| Internet Type | # Households | % Households |
| Dial-Up Internet | 0 | 0.0% |
| Broadband Home | 33 | 80.5% |
| Cellular Data Only | 0 | 0.0% |
| Satellite Internet | 8 | 19.5% |
| No Internet | 0 | 0.0% |
| Total | 41 | 100.0% |
Brick Center Summary
Brick Center is a small town located in the state of Colorado, United States. It is situated in the foothills of the Rocky Mountains, approximately 25 miles northwest of Denver. The town has a population of approximately 1,500 people and is known for its rural charm and small-town atmosphere.
History
Brick Center was founded in 1876 by a group of settlers from the Midwest. The town was named after the brick-making industry that was established in the area. The bricks were used to build many of the buildings in the town, including the first schoolhouse.
In the early 1900s, Brick Center became a popular destination for tourists, who came to enjoy the scenic beauty of the area. The town was also known for its mineral springs, which were believed to have healing properties.
In the 1950s, Brick Center began to experience a decline in population as people moved away to larger cities. However, the town has since experienced a resurgence in population, as people have moved back to the area to enjoy the rural lifestyle.
Geography
Brick Center is located in the foothills of the Rocky Mountains, approximately 25 miles northwest of Denver. The town is situated at an elevation of 6,000 feet above sea level. The town is surrounded by mountains and forests, providing a beautiful backdrop for the town.
The climate in Brick Center is generally mild, with temperatures ranging from the low 30s in the winter to the high 80s in the summer. The town receives an average of 18 inches of precipitation per year, with most of it falling in the form of snow.
Economy
The economy of Brick Center is largely based on tourism and agriculture. The town is home to several small businesses, including restaurants, shops, and galleries. The town also has a small airport, which serves as a hub for private and commercial flights.
Agriculture is an important part of the economy in Brick Center. The town is home to several farms, which produce a variety of crops, including corn, wheat, and hay. The town also has several wineries, which produce a variety of wines.
Demographics
As of the 2010 census, the population of Brick Center was 1,500 people. The town is predominantly white, with approximately 95% of the population being of European descent. The median household income in Brick Center is $45,000, and the median age is 40 years old.
The town is home to several churches, including the Brick Center United Methodist Church, the Brick Center Presbyterian Church, and the Brick Center Baptist Church. The town also has a public library, which offers a variety of books and other resources.
Conclusion
Brick Center is a small town located in the foothills of the Rocky Mountains in Colorado. The town has a population of approximately 1,500 people and is known for its rural charm and small-town atmosphere. The economy of Brick Center is largely based on tourism and agriculture, and the town is home to several small businesses, churches, and a public library. The town is predominantly white, with approximately 95% of the population being of European descent.
Common Questions
What is Per Capita Income in Brick Center?
Per Capita income in Brick Center is $84,313.
What is the Median Household income in Brick Center?
Median Household Income in Brick Center is $134,635.
What is Inequality or Gini Index in Brick Center?
Inequality or Gini Index in Brick Center is 0.14.
What is the Total Population of Brick Center?
Total Population of Brick Center is 88.
What is the Total Male Population of Brick Center?
Total Male Population of Brick Center is 48.
What is the Total Female Population of Brick Center?
Total Female Population of Brick Center is 40.
What is the Ratio of Males per 100 Females in Brick Center?
There are 120.00 Males per 100 Females in Brick Center.
What is the Ratio of Females per 100 Males in Brick Center?
There are 83.33 Females per 100 Males in Brick Center.
What is the Median Population Age in Brick Center?
Median Population Age in Brick Center is 53.8 Years.
What is the Average Family Size in Brick Center
Average Family Size in Brick Center is 2.2 People.
What is the Average Household Size in Brick Center
Average Household Size in Brick Center is 2.1 People.
How Large is the Labor Force in Brick Center?
There are 88 People in the Labor Forcein in Brick Center.
What is the Percentage of People in the Labor Force in Brick Center?
100.0% of People are in the Labor Force in Brick Center.