Cattle Creek, CO Map & Demographics
Cattle Creek Map
Cattle Creek Overview
$30,650
PER CAPITA INCOME
$41,926
AVG HOUSEHOLD INCOME
0.45
INEQUALITY / GINI INDEX
538
TOTAL POPULATION
247
MALE POPULATION
291
FEMALE POPULATION
84.88
MALES / 100 FEMALES
117.81
FEMALES / 100 MALES
42.4
MEDIAN AGE
2.8
AVG FAMILY SIZE
2.2
AVG HOUSEHOLD SIZE
302
LABOR FORCE [ PEOPLE ]
65.9%
PERCENT IN LABOR FORCE
3.3%
UNEMPLOYMENT RATE
Income in Cattle Creek
Income Overview in Cattle Creek
| Characteristic | Number | Measure |
| Per Capita Income | 538 | $30,650 |
| Median Family Income | 164 | $0 |
| Mean Family Income | 164 | $61,700 |
| Median Household Income | 243 | $41,926 |
| Mean Household Income | 243 | $77,715 |
| Income Deficit | 164 | $0 |
| Wage / Income Gap (%) | 538 | 0.00% |
| Wage / Income Gap ($) | 538 | 100.00¢ per $1 |
| Gini / Inequality Index | 538 | 0.45 |
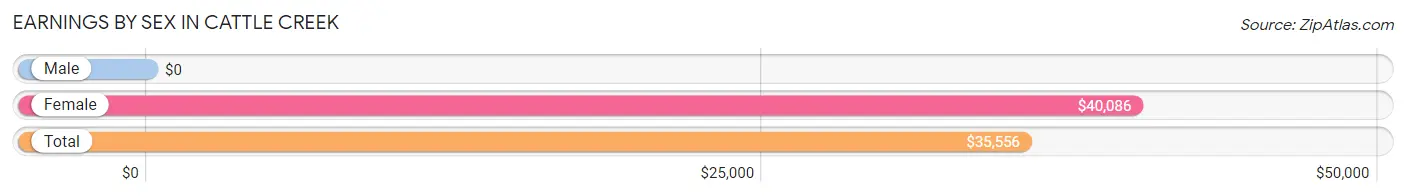
Earnings by Sex in Cattle Creek
| Sex | Number | Average Earnings |
| Male | 180 (58.4%) | $0 |
| Female | 128 (41.6%) | $40,086 |
| Total | 308 (100.0%) | $35,556 |
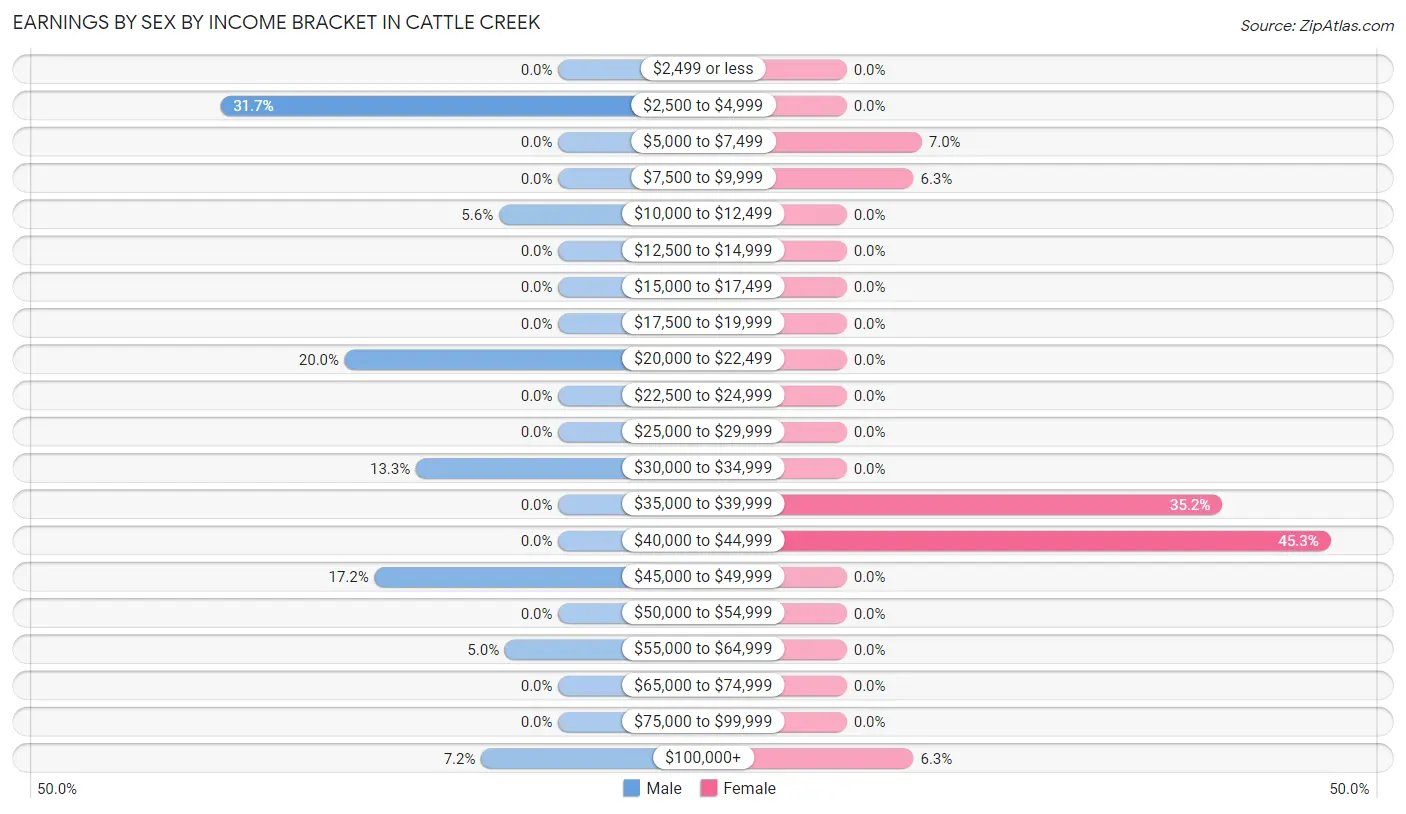
Earnings by Sex by Income Bracket in Cattle Creek
The most common earnings brackets in Cattle Creek are $2,500 to $4,999 for men (57 | 31.7%) and $40,000 to $44,999 for women (58 | 45.3%).
| Income | Male | Female |
| $2,499 or less | 0 (0.0%) | 0 (0.0%) |
| $2,500 to $4,999 | 57 (31.7%) | 0 (0.0%) |
| $5,000 to $7,499 | 0 (0.0%) | 9 (7.0%) |
| $7,500 to $9,999 | 0 (0.0%) | 8 (6.2%) |
| $10,000 to $12,499 | 10 (5.6%) | 0 (0.0%) |
| $12,500 to $14,999 | 0 (0.0%) | 0 (0.0%) |
| $15,000 to $17,499 | 0 (0.0%) | 0 (0.0%) |
| $17,500 to $19,999 | 0 (0.0%) | 0 (0.0%) |
| $20,000 to $22,499 | 36 (20.0%) | 0 (0.0%) |
| $22,500 to $24,999 | 0 (0.0%) | 0 (0.0%) |
| $25,000 to $29,999 | 0 (0.0%) | 0 (0.0%) |
| $30,000 to $34,999 | 24 (13.3%) | 0 (0.0%) |
| $35,000 to $39,999 | 0 (0.0%) | 45 (35.2%) |
| $40,000 to $44,999 | 0 (0.0%) | 58 (45.3%) |
| $45,000 to $49,999 | 31 (17.2%) | 0 (0.0%) |
| $50,000 to $54,999 | 0 (0.0%) | 0 (0.0%) |
| $55,000 to $64,999 | 9 (5.0%) | 0 (0.0%) |
| $65,000 to $74,999 | 0 (0.0%) | 0 (0.0%) |
| $75,000 to $99,999 | 0 (0.0%) | 0 (0.0%) |
| $100,000+ | 13 (7.2%) | 8 (6.2%) |
| Total | 180 (100.0%) | 128 (100.0%) |
Earnings by Sex by Educational Attainment in Cattle Creek
| Educational Attainment | Male Income | Female Income |
| Less than High School | - | - |
| High School Diploma | - | - |
| College or Associate's Degree | - | - |
| Bachelor's Degree | - | - |
| Graduate Degree | - | - |
| Total | $34,688 | $40,280 |
Family Income in Cattle Creek
Family Income Brackets in Cattle Creek
According to the Cattle Creek family income data, there are 59 families falling into the $100,000 to $149,999 income range, which is the most common income bracket and makes up 36.0% of all families.
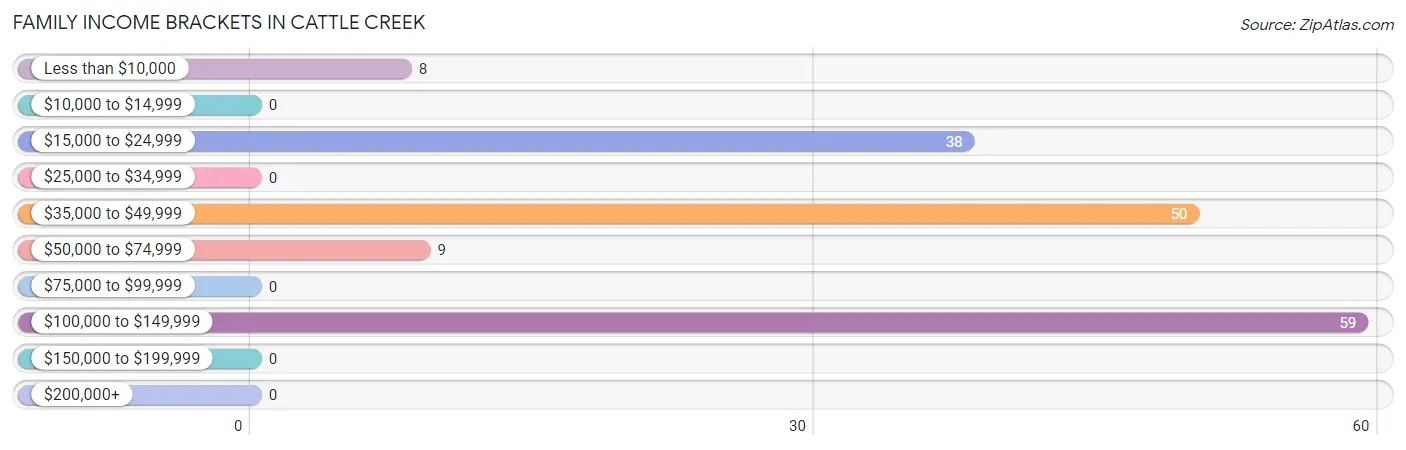
| Income Bracket | # Families | % Families |
| Less than $10,000 | 8 | 4.9% |
| $10,000 to $14,999 | 0 | 0.0% |
| $15,000 to $24,999 | 38 | 23.2% |
| $25,000 to $34,999 | 0 | 0.0% |
| $35,000 to $49,999 | 50 | 30.5% |
| $50,000 to $74,999 | 9 | 5.5% |
| $75,000 to $99,999 | 0 | 0.0% |
| $100,000 to $149,999 | 59 | 36.0% |
| $150,000 to $199,999 | 0 | 0.0% |
| $200,000+ | 0 | 0.0% |
Family Income by Famaliy Size in Cattle Creek
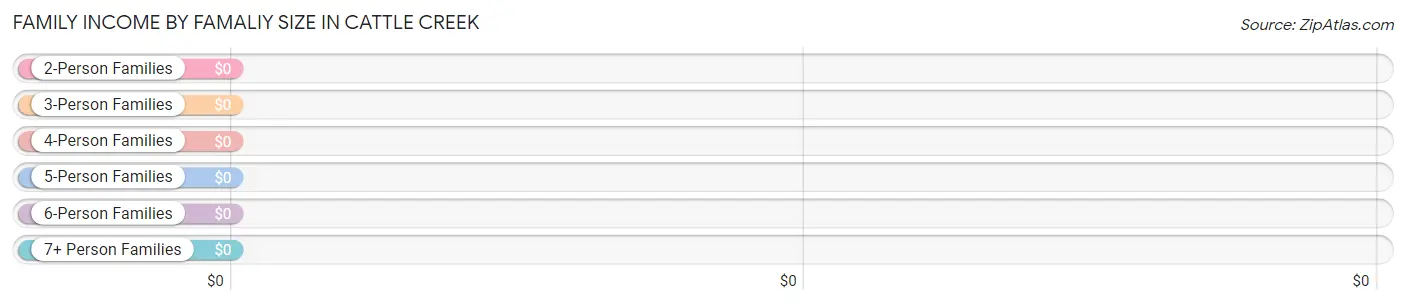
| Income Bracket | # Families | Median Income |
| 2-Person Families | 88 (53.7%) | $0 |
| 3-Person Families | 10 (6.1%) | $0 |
| 4-Person Families | 17 (10.4%) | $0 |
| 5-Person Families | 49 (29.9%) | $0 |
| 6-Person Families | 0 (0.0%) | $0 |
| 7+ Person Families | 0 (0.0%) | $0 |
| Total | 164 (100.0%) | $0 |
Family Income by Number of Earners in Cattle Creek
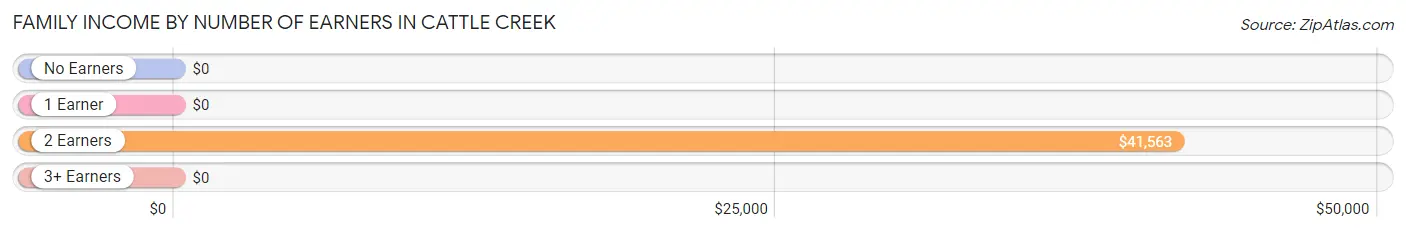
| Number of Earners | # Families | Median Income |
| No Earners | 8 (4.9%) | $0 |
| 1 Earner | 57 (34.8%) | $0 |
| 2 Earners | 50 (30.5%) | $41,563 |
| 3+ Earners | 49 (29.9%) | $0 |
| Total | 164 (100.0%) | $0 |
Household Income in Cattle Creek
Household Income Brackets in Cattle Creek
With 108 households falling in the category, the $35,000 to $49,999 income range is the most frequent in Cattle Creek, accounting for 44.4% of all households.
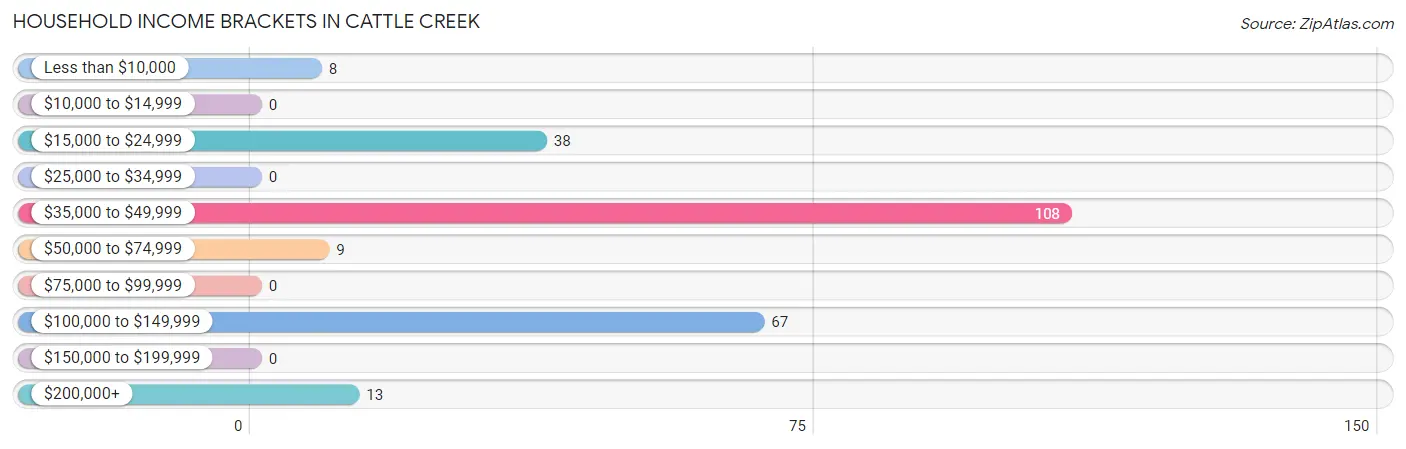
| Income Bracket | # Households | % Households |
| Less than $10,000 | 8 | 3.3% |
| $10,000 to $14,999 | 0 | 0.0% |
| $15,000 to $24,999 | 38 | 15.6% |
| $25,000 to $34,999 | 0 | 0.0% |
| $35,000 to $49,999 | 108 | 44.4% |
| $50,000 to $74,999 | 9 | 3.7% |
| $75,000 to $99,999 | 0 | 0.0% |
| $100,000 to $149,999 | 67 | 27.6% |
| $150,000 to $199,999 | 0 | 0.0% |
| $200,000+ | 13 | 5.3% |
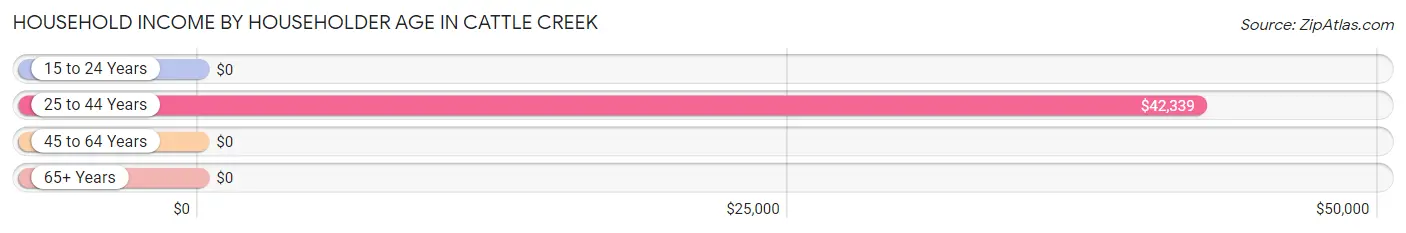
Household Income by Householder Age in Cattle Creek
The median household income in Cattle Creek is $41,926, with the highest median household income of $42,339 found in the 25 to 44 years age bracket for the primary householder. A total of 58 households (23.9%) fall into this category. Meanwhile, the 15 to 24 years age bracket for the primary householder has the lowest median household income of $0, with 32 households (13.2%) in this group.
| Income Bracket | # Households | Median Income |
| 15 to 24 Years | 32 (13.2%) | $0 |
| 25 to 44 Years | 58 (23.9%) | $42,339 |
| 45 to 64 Years | 135 (55.6%) | $0 |
| 65+ Years | 18 (7.4%) | $0 |
| Total | 243 (100.0%) | $41,926 |
Poverty in Cattle Creek
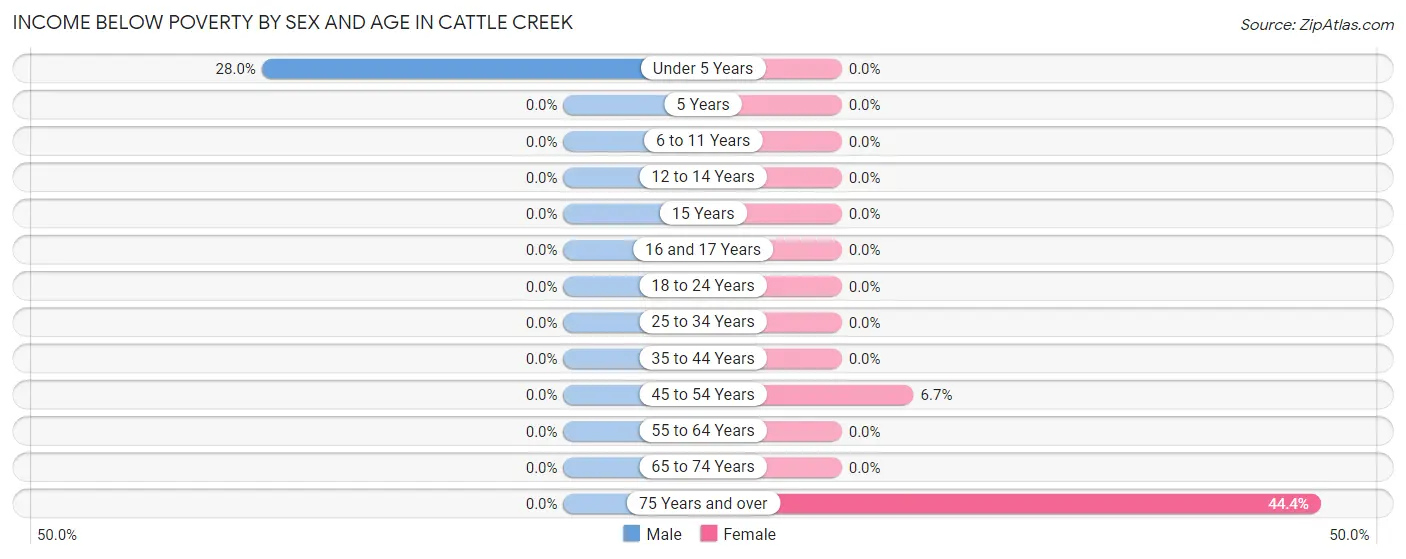
Income Below Poverty by Sex and Age in Cattle Creek
With 2.8% poverty level for males and 4.8% for females among the residents of Cattle Creek, under 5 year old males and 75 year old and over females are the most vulnerable to poverty, with 7 males (28.0%) and 8 females (44.4%) in their respective age groups living below the poverty level.
| Age Bracket | Male | Female |
| Under 5 Years | 7 (28.0%) | 0 (0.0%) |
| 5 Years | 0 (0.0%) | 0 (0.0%) |
| 6 to 11 Years | 0 (0.0%) | 0 (0.0%) |
| 12 to 14 Years | 0 (0.0%) | 0 (0.0%) |
| 15 Years | 0 (0.0%) | 0 (0.0%) |
| 16 and 17 Years | 0 (0.0%) | 0 (0.0%) |
| 18 to 24 Years | 0 (0.0%) | 0 (0.0%) |
| 25 to 34 Years | 0 (0.0%) | 0 (0.0%) |
| 35 to 44 Years | 0 (0.0%) | 0 (0.0%) |
| 45 to 54 Years | 0 (0.0%) | 6 (6.7%) |
| 55 to 64 Years | 0 (0.0%) | 0 (0.0%) |
| 65 to 74 Years | 0 (0.0%) | 0 (0.0%) |
| 75 Years and over | 0 (0.0%) | 8 (44.4%) |
| Total | 7 (2.8%) | 14 (4.8%) |
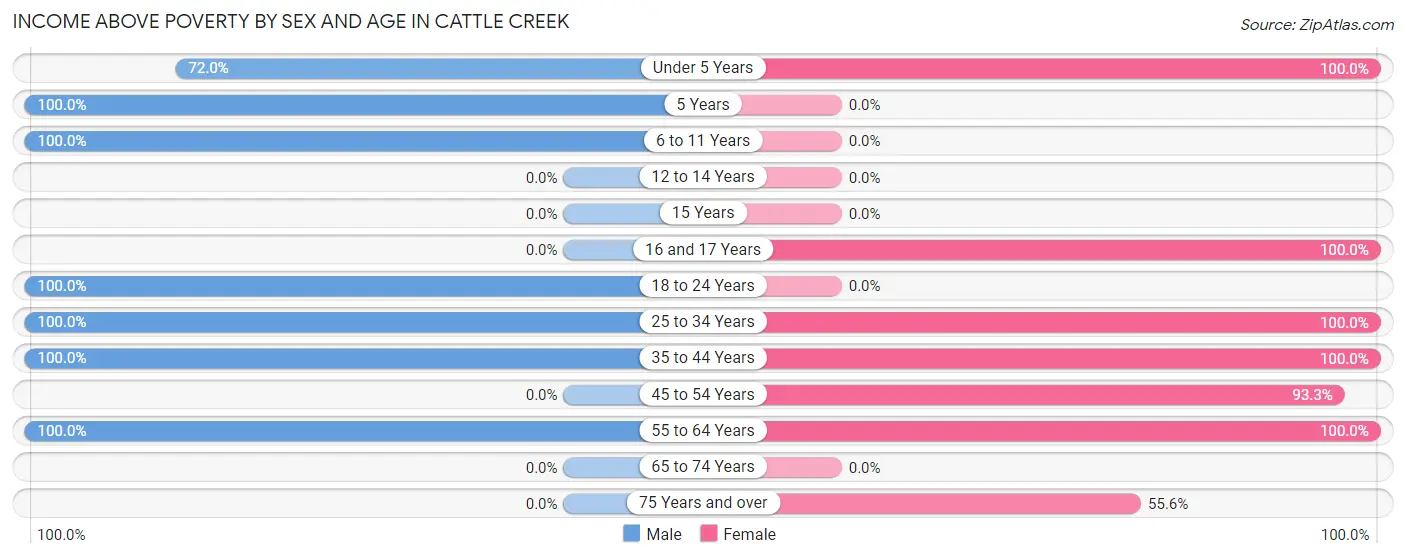
Income Above Poverty by Sex and Age in Cattle Creek
According to the poverty statistics in Cattle Creek, males aged 5 years and females aged under 5 years are the age groups that are most secure financially, with 100.0% of males and 100.0% of females in these age groups living above the poverty line.
| Age Bracket | Male | Female |
| Under 5 Years | 18 (72.0%) | 13 (100.0%) |
| 5 Years | 27 (100.0%) | 0 (0.0%) |
| 6 to 11 Years | 15 (100.0%) | 0 (0.0%) |
| 12 to 14 Years | 0 (0.0%) | 0 (0.0%) |
| 15 Years | 0 (0.0%) | 0 (0.0%) |
| 16 and 17 Years | 0 (0.0%) | 9 (100.0%) |
| 18 to 24 Years | 68 (100.0%) | 0 (0.0%) |
| 25 to 34 Years | 34 (100.0%) | 47 (100.0%) |
| 35 to 44 Years | 9 (100.0%) | 41 (100.0%) |
| 45 to 54 Years | 0 (0.0%) | 84 (93.3%) |
| 55 to 64 Years | 69 (100.0%) | 73 (100.0%) |
| 65 to 74 Years | 0 (0.0%) | 0 (0.0%) |
| 75 Years and over | 0 (0.0%) | 10 (55.6%) |
| Total | 240 (97.2%) | 277 (95.2%) |
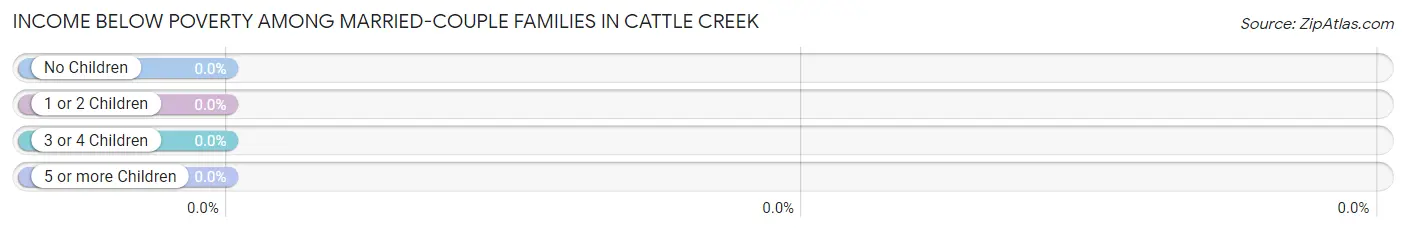
Income Below Poverty Among Married-Couple Families in Cattle Creek
| Children | Above Poverty | Below Poverty |
| No Children | 87 (100.0%) | 0 (0.0%) |
| 1 or 2 Children | 17 (100.0%) | 0 (0.0%) |
| 3 or 4 Children | 0 (0.0%) | 0 (0.0%) |
| 5 or more Children | 0 (0.0%) | 0 (0.0%) |
| Total | 104 (100.0%) | 0 (0.0%) |
Income Below Poverty Among Single-Parent Households in Cattle Creek
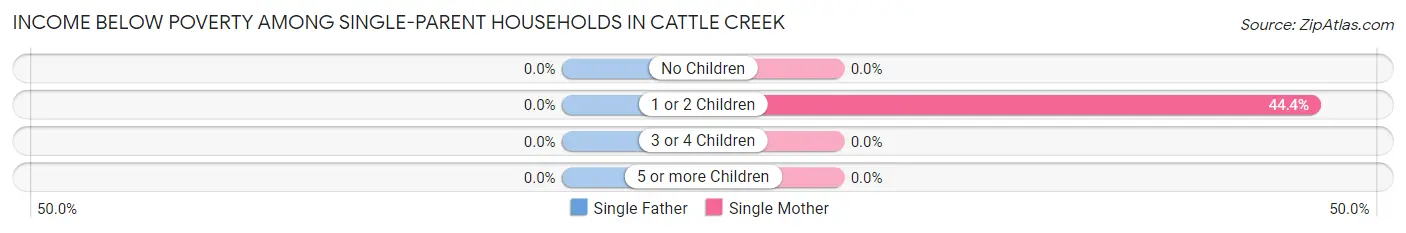
| Children | Single Father | Single Mother |
| No Children | 0 (0.0%) | 0 (0.0%) |
| 1 or 2 Children | 0 (0.0%) | 8 (44.4%) |
| 3 or 4 Children | 0 (0.0%) | 0 (0.0%) |
| 5 or more Children | 0 (0.0%) | 0 (0.0%) |
| Total | 0 (0.0%) | 8 (28.6%) |
Income Below Poverty Among Married-Couple vs Single-Parent Households in Cattle Creek
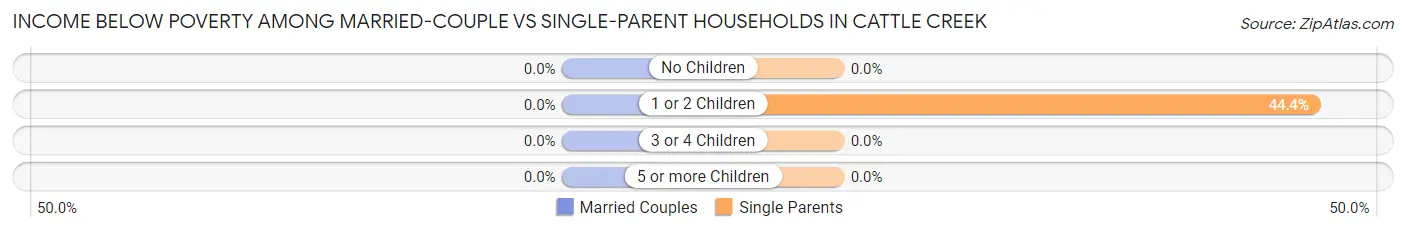
| Children | Married-Couple Families | Single-Parent Households |
| No Children | 0 (0.0%) | 0 (0.0%) |
| 1 or 2 Children | 0 (0.0%) | 8 (44.4%) |
| 3 or 4 Children | 0 (0.0%) | 0 (0.0%) |
| 5 or more Children | 0 (0.0%) | 0 (0.0%) |
| Total | 0 (0.0%) | 8 (13.3%) |
Race in Cattle Creek
The most populous races in Cattle Creek are White / Caucasian (508 | 94.4%), Hispanic or Latino (277 | 51.5%), and Some other Race (23 | 4.3%).
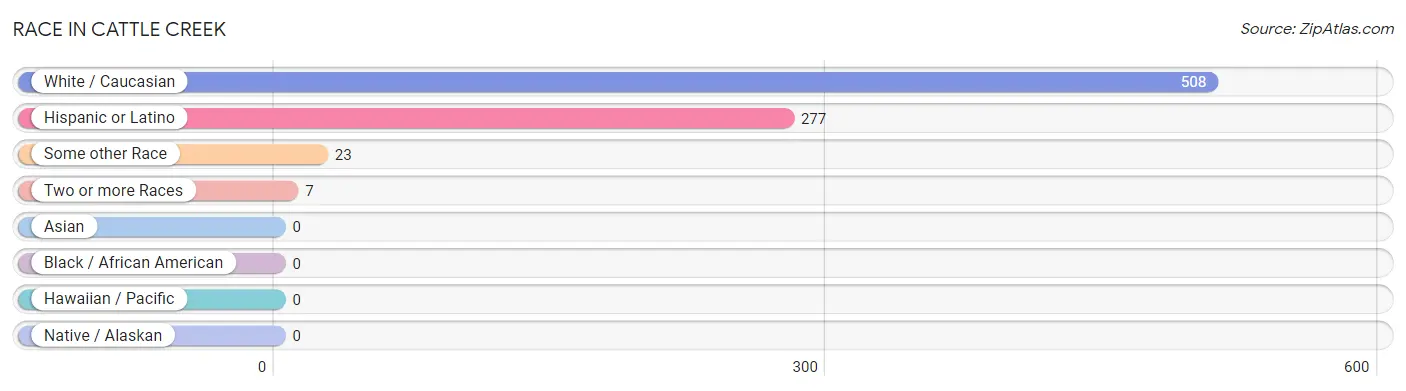
| Race | # Population | % Population |
| Asian | 0 | 0.0% |
| Black / African American | 0 | 0.0% |
| Hawaiian / Pacific | 0 | 0.0% |
| Hispanic or Latino | 277 | 51.5% |
| Native / Alaskan | 0 | 0.0% |
| White / Caucasian | 508 | 94.4% |
| Two or more Races | 7 | 1.3% |
| Some other Race | 23 | 4.3% |
| Total | 538 | 100.0% |
Ancestry in Cattle Creek
The most populous ancestries reported in Cattle Creek are Mexican (219 | 40.7%), Norwegian (44 | 8.2%), Arab (38 | 7.1%), Lebanese (38 | 7.1%), and Central American (25 | 4.6%), together accounting for 67.7% of all Cattle Creek residents.
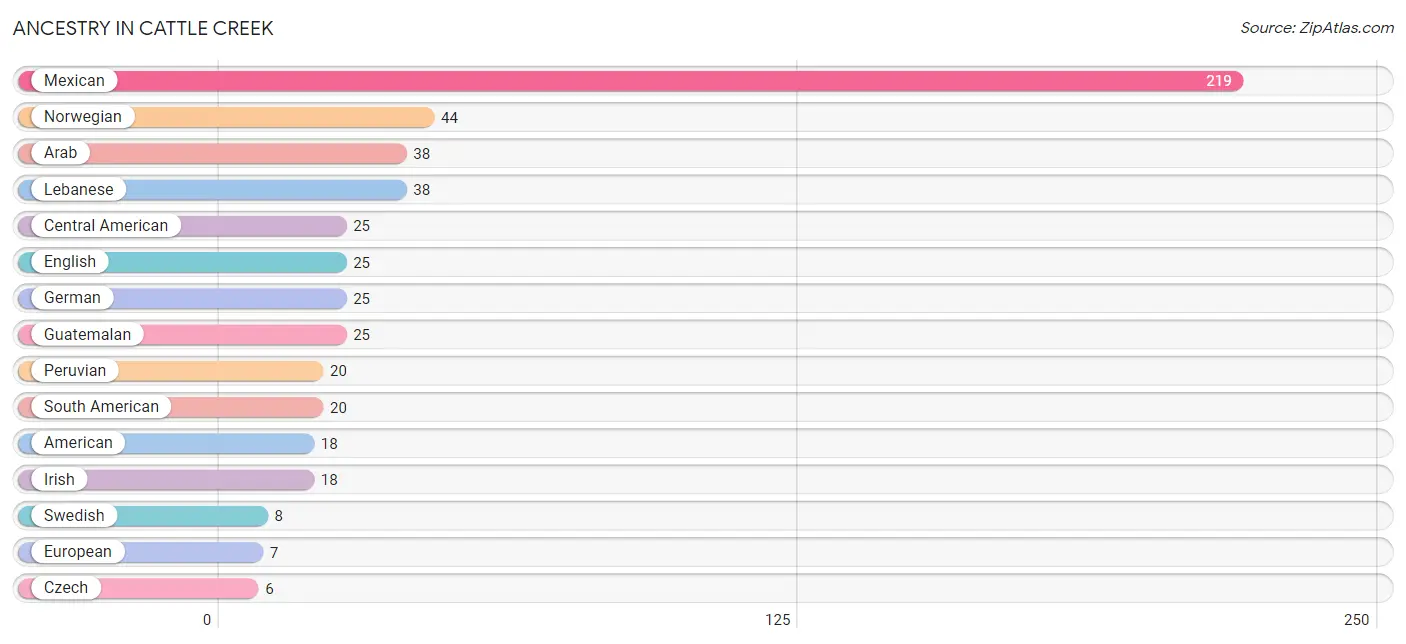
| Ancestry | # Population | % Population |
| American | 18 | 3.4% |
| Arab | 38 | 7.1% |
| Central American | 25 | 4.6% |
| Czech | 6 | 1.1% |
| Dutch | 6 | 1.1% |
| English | 25 | 4.6% |
| European | 7 | 1.3% |
| German | 25 | 4.6% |
| Guatemalan | 25 | 4.6% |
| Irish | 18 | 3.4% |
| Lebanese | 38 | 7.1% |
| Mexican | 219 | 40.7% |
| Norwegian | 44 | 8.2% |
| Peruvian | 20 | 3.7% |
| South American | 20 | 3.7% |
| Swedish | 8 | 1.5% | View All 16 Rows |
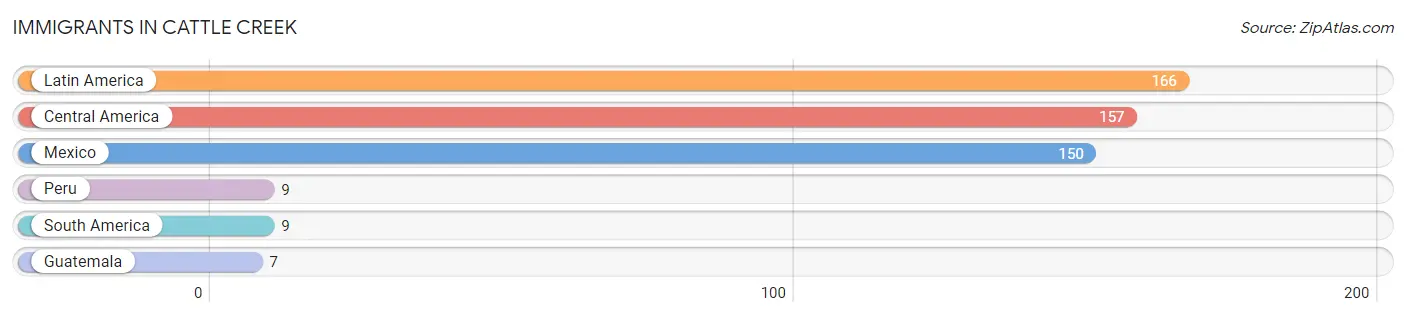
Immigrants in Cattle Creek
The most numerous immigrant groups reported in Cattle Creek came from Latin America (166 | 30.9%), Central America (157 | 29.2%), Mexico (150 | 27.9%), Peru (9 | 1.7%), and South America (9 | 1.7%), together accounting for 91.3% of all Cattle Creek residents.
| Immigration Origin | # Population | % Population |
| Central America | 157 | 29.2% |
| Guatemala | 7 | 1.3% |
| Latin America | 166 | 30.9% |
| Mexico | 150 | 27.9% |
| Peru | 9 | 1.7% |
| South America | 9 | 1.7% | View All 6 Rows |
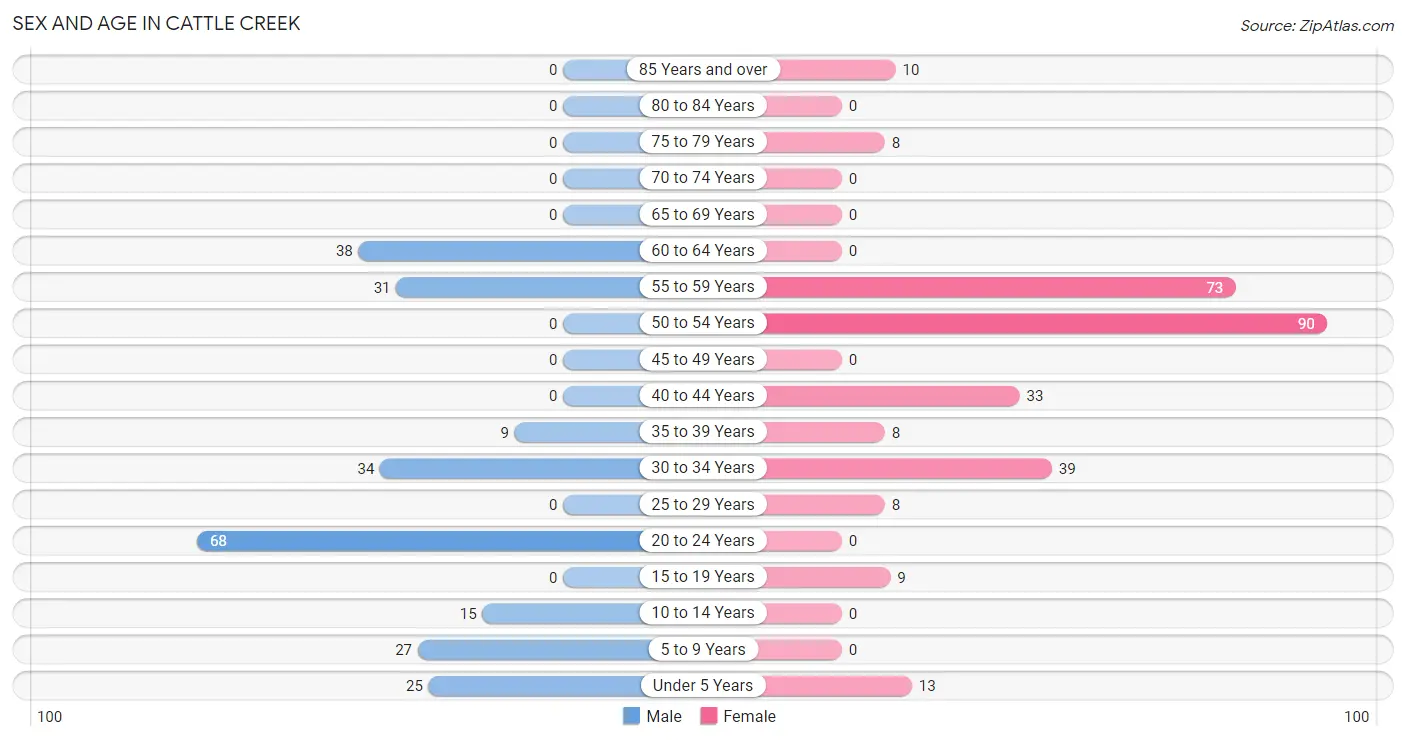
Sex and Age in Cattle Creek
Sex and Age in Cattle Creek
The most populous age groups in Cattle Creek are 20 to 24 Years (68 | 27.5%) for men and 50 to 54 Years (90 | 30.9%) for women.
| Age Bracket | Male | Female |
| Under 5 Years | 25 (10.1%) | 13 (4.5%) |
| 5 to 9 Years | 27 (10.9%) | 0 (0.0%) |
| 10 to 14 Years | 15 (6.1%) | 0 (0.0%) |
| 15 to 19 Years | 0 (0.0%) | 9 (3.1%) |
| 20 to 24 Years | 68 (27.5%) | 0 (0.0%) |
| 25 to 29 Years | 0 (0.0%) | 8 (2.8%) |
| 30 to 34 Years | 34 (13.8%) | 39 (13.4%) |
| 35 to 39 Years | 9 (3.6%) | 8 (2.8%) |
| 40 to 44 Years | 0 (0.0%) | 33 (11.3%) |
| 45 to 49 Years | 0 (0.0%) | 0 (0.0%) |
| 50 to 54 Years | 0 (0.0%) | 90 (30.9%) |
| 55 to 59 Years | 31 (12.6%) | 73 (25.1%) |
| 60 to 64 Years | 38 (15.4%) | 0 (0.0%) |
| 65 to 69 Years | 0 (0.0%) | 0 (0.0%) |
| 70 to 74 Years | 0 (0.0%) | 0 (0.0%) |
| 75 to 79 Years | 0 (0.0%) | 8 (2.8%) |
| 80 to 84 Years | 0 (0.0%) | 0 (0.0%) |
| 85 Years and over | 0 (0.0%) | 10 (3.4%) |
| Total | 247 (100.0%) | 291 (100.0%) |
Families and Households in Cattle Creek
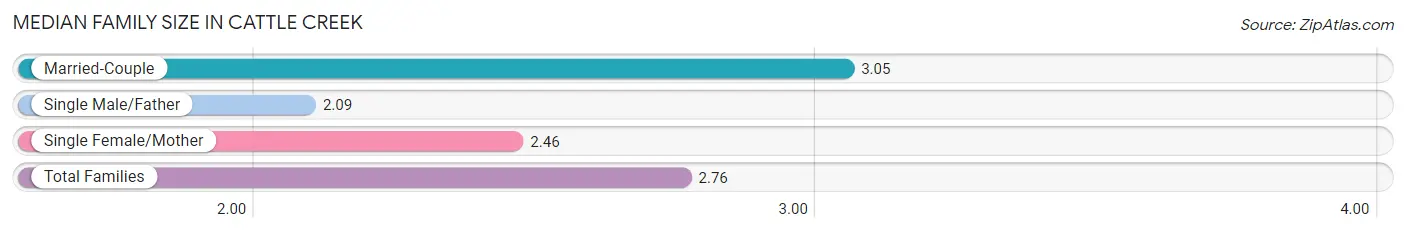
Median Family Size in Cattle Creek
The median family size in Cattle Creek is 2.76 persons per family, with married-couple families (104 | 63.4%) accounting for the largest median family size of 3.05 persons per family. On the other hand, single male/father families (32 | 19.5%) represent the smallest median family size with 2.09 persons per family.
| Family Type | # Families | Family Size |
| Married-Couple | 104 (63.4%) | 3.05 |
| Single Male/Father | 32 (19.5%) | 2.09 |
| Single Female/Mother | 28 (17.1%) | 2.46 |
| Total Families | 164 (100.0%) | 2.76 |
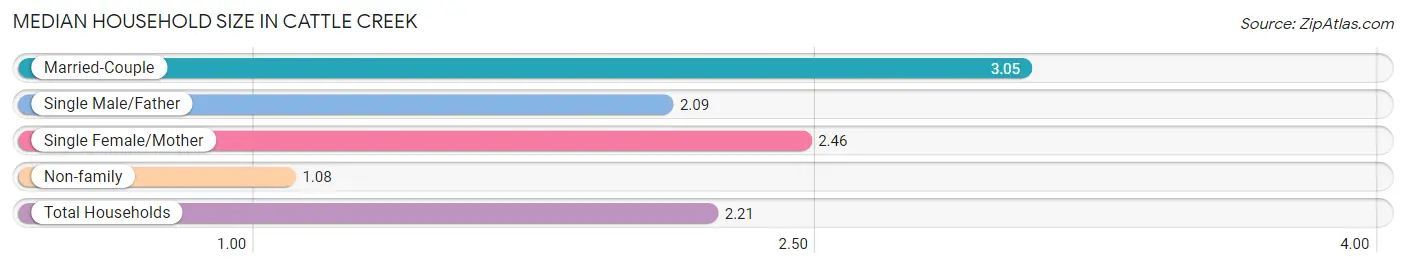
Median Household Size in Cattle Creek
The median household size in Cattle Creek is 2.21 persons per household, with married-couple households (104 | 42.8%) accounting for the largest median household size of 3.05 persons per household. non-family households (79 | 32.5%) represent the smallest median household size with 1.08 persons per household.
| Household Type | # Households | Household Size |
| Married-Couple | 104 (42.8%) | 3.05 |
| Single Male/Father | 32 (13.2%) | 2.09 |
| Single Female/Mother | 28 (11.5%) | 2.46 |
| Non-family | 79 (32.5%) | 1.08 |
| Total Households | 243 (100.0%) | 2.21 |
Household Size by Marriage Status in Cattle Creek
Out of a total of 243 households in Cattle Creek, 164 (67.5%) are family households, while 79 (32.5%) are nonfamily households. The most numerous type of family households are 2-person households, comprising 88, and the most common type of nonfamily households are 1-person households, comprising 73.
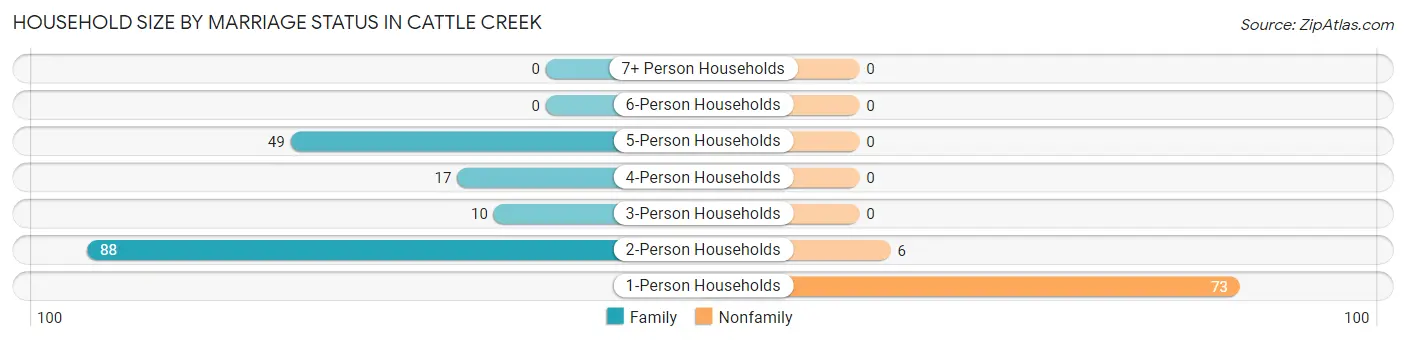
| Household Size | Family Households | Nonfamily Households |
| 1-Person Households | - | 73 (30.0%) |
| 2-Person Households | 88 (36.2%) | 6 (2.5%) |
| 3-Person Households | 10 (4.1%) | 0 (0.0%) |
| 4-Person Households | 17 (7.0%) | 0 (0.0%) |
| 5-Person Households | 49 (20.2%) | 0 (0.0%) |
| 6-Person Households | 0 (0.0%) | 0 (0.0%) |
| 7+ Person Households | 0 (0.0%) | 0 (0.0%) |
| Total | 164 (67.5%) | 79 (32.5%) |
Female Fertility in Cattle Creek
Fertility by Age in Cattle Creek
| Age Bracket | Women with Births | Births / 1,000 Women |
| 15 to 19 years | 0 (0.0%) | 0.0 |
| 20 to 34 years | 0 (0.0%) | 0.0 |
| 35 to 50 years | 0 (0.0%) | 0.0 |
| Total | 0 (0.0%) | 0.0 |
Fertility by Age by Marriage Status in Cattle Creek
| Age Bracket | Married | Unmarried |
| 15 to 19 years | 0 (0.0%) | 0 (0.0%) |
| 20 to 34 years | 0 (0.0%) | 0 (0.0%) |
| 35 to 50 years | 0 (0.0%) | 0 (0.0%) |
| Total | 0 (0.0%) | 0 (0.0%) |
Fertility by Education in Cattle Creek
| Educational Attainment | Women with Births | Births / 1,000 Women |
| Less than High School | 0 (0.0%) | 0.0 |
| High School Diploma | 0 (0.0%) | 0.0 |
| College or Associate's Degree | 0 (0.0%) | 0.0 |
| Bachelor's Degree | 0 (0.0%) | 0.0 |
| Graduate Degree | 0 (0.0%) | 0.0 |
| Total | 0 (0.0%) | 0.0 |
Fertility by Education by Marriage Status in Cattle Creek
| Educational Attainment | Married | Unmarried |
| Less than High School | 0 (0.0%) | 0 (0.0%) |
| High School Diploma | 0 (0.0%) | 0 (0.0%) |
| College or Associate's Degree | 0 (0.0%) | 0 (0.0%) |
| Bachelor's Degree | 0 (0.0%) | 0 (0.0%) |
| Graduate Degree | 0 (0.0%) | 0 (0.0%) |
| Total | 0 (0.0%) | 0 (0.0%) |
Employment Characteristics in Cattle Creek
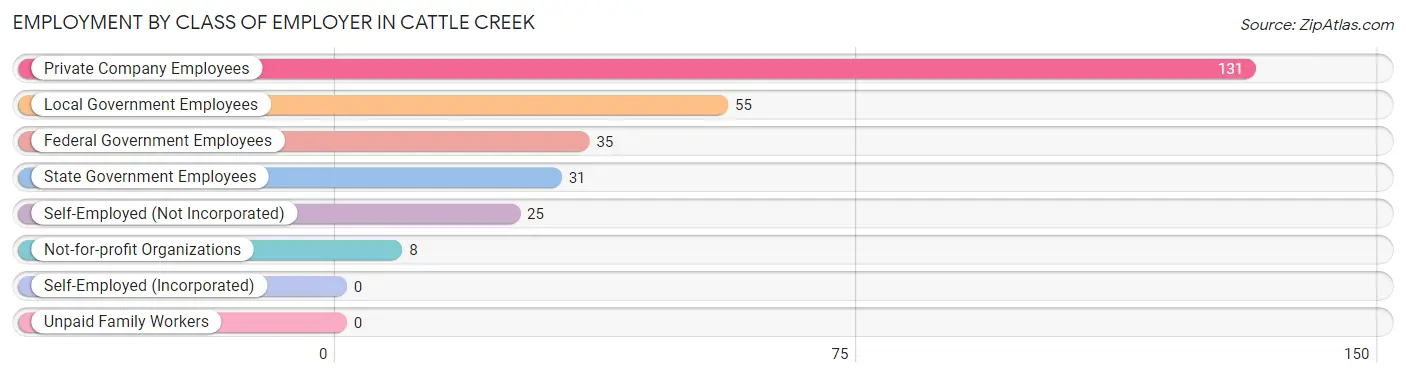
Employment by Class of Employer in Cattle Creek
Among the 285 employed individuals in Cattle Creek, private company employees (131 | 46.0%), local government employees (55 | 19.3%), and federal government employees (35 | 12.3%) make up the most common classes of employment.
| Employer Class | # Employees | % Employees |
| Private Company Employees | 131 | 46.0% |
| Self-Employed (Incorporated) | 0 | 0.0% |
| Self-Employed (Not Incorporated) | 25 | 8.8% |
| Not-for-profit Organizations | 8 | 2.8% |
| Local Government Employees | 55 | 19.3% |
| State Government Employees | 31 | 10.9% |
| Federal Government Employees | 35 | 12.3% |
| Unpaid Family Workers | 0 | 0.0% |
| Total | 285 | 100.0% |
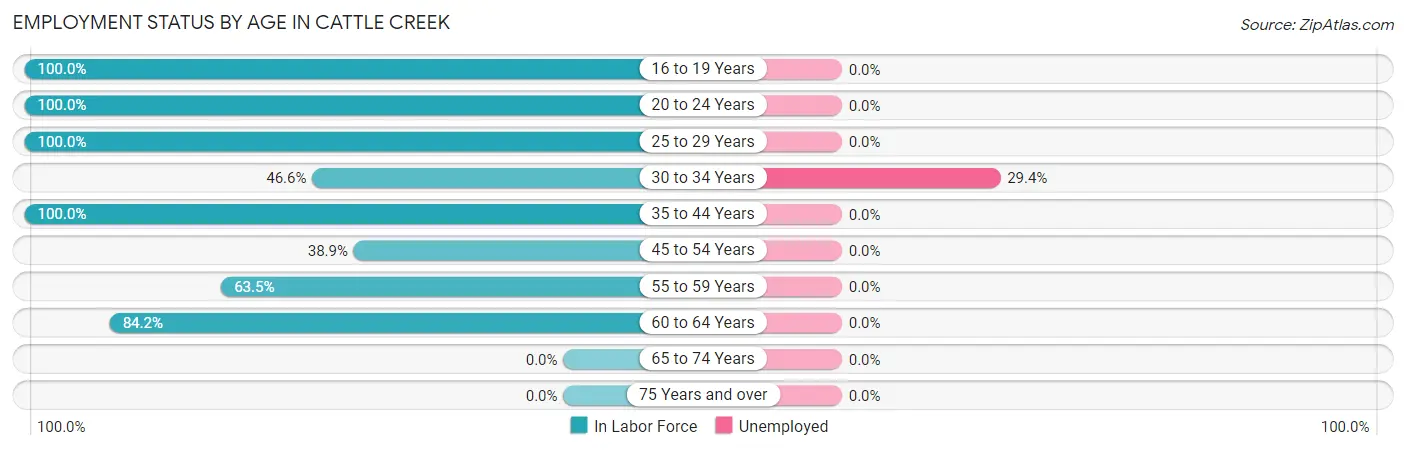
Employment Status by Age in Cattle Creek
According to the labor force statistics for Cattle Creek, out of the total population over 16 years of age (458), 65.9% or 302 individuals are in the labor force, with 3.3% or 10 of them unemployed. The age group with the highest labor force participation rate is 16 to 19 years, with 100.0% or 9 individuals in the labor force. Within the labor force, the 30 to 34 years age range has the highest percentage of unemployed individuals, with 29.4% or 10 of them being unemployed.
| Age Bracket | In Labor Force | Unemployed |
| 16 to 19 Years | 9 (100.0%) | 0 (0.0%) |
| 20 to 24 Years | 68 (100.0%) | 0 (0.0%) |
| 25 to 29 Years | 8 (100.0%) | 0 (0.0%) |
| 30 to 34 Years | 34 (46.6%) | 10 (29.4%) |
| 35 to 44 Years | 50 (100.0%) | 0 (0.0%) |
| 45 to 54 Years | 35 (38.9%) | 0 (0.0%) |
| 55 to 59 Years | 66 (63.5%) | 0 (0.0%) |
| 60 to 64 Years | 32 (84.2%) | 0 (0.0%) |
| 65 to 74 Years | 0 (0.0%) | 0 (0.0%) |
| 75 Years and over | 0 (0.0%) | 0 (0.0%) |
| Total | 302 (65.9%) | 10 (3.3%) |
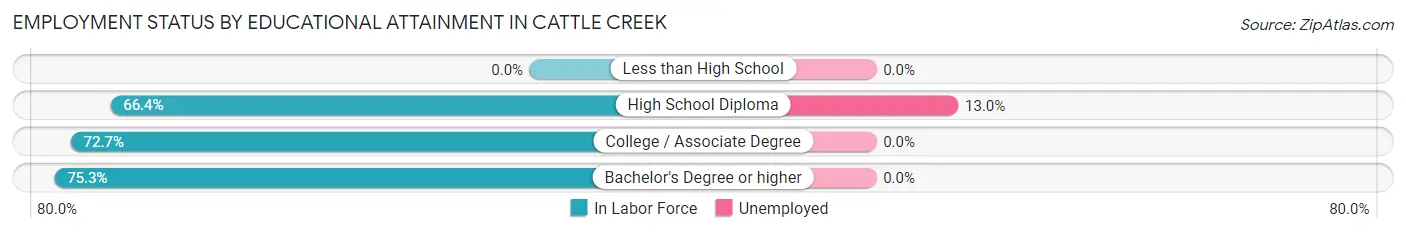
Employment Status by Educational Attainment in Cattle Creek
According to labor force statistics for Cattle Creek, 62.0% of individuals (225) out of the total population between 25 and 64 years of age (363) are in the labor force, with 4.4% or 10 of them being unemployed. The group with the highest labor force participation rate are those with the educational attainment of bachelor's degree or higher, with 75.3% or 116 individuals in the labor force. Within the labor force, individuals with high school diploma education have the highest percentage of unemployment, with 13.0% or 10 of them being unemployed.
| Educational Attainment | In Labor Force | Unemployed |
| Less than High School | 0 (0.0%) | 0 (0.0%) |
| High School Diploma | 77 (66.4%) | 15 (13.0%) |
| College / Associate Degree | 32 (72.7%) | 0 (0.0%) |
| Bachelor's Degree or higher | 116 (75.3%) | 0 (0.0%) |
| Total | 225 (62.0%) | 16 (4.4%) |
Employment Occupations by Sex in Cattle Creek
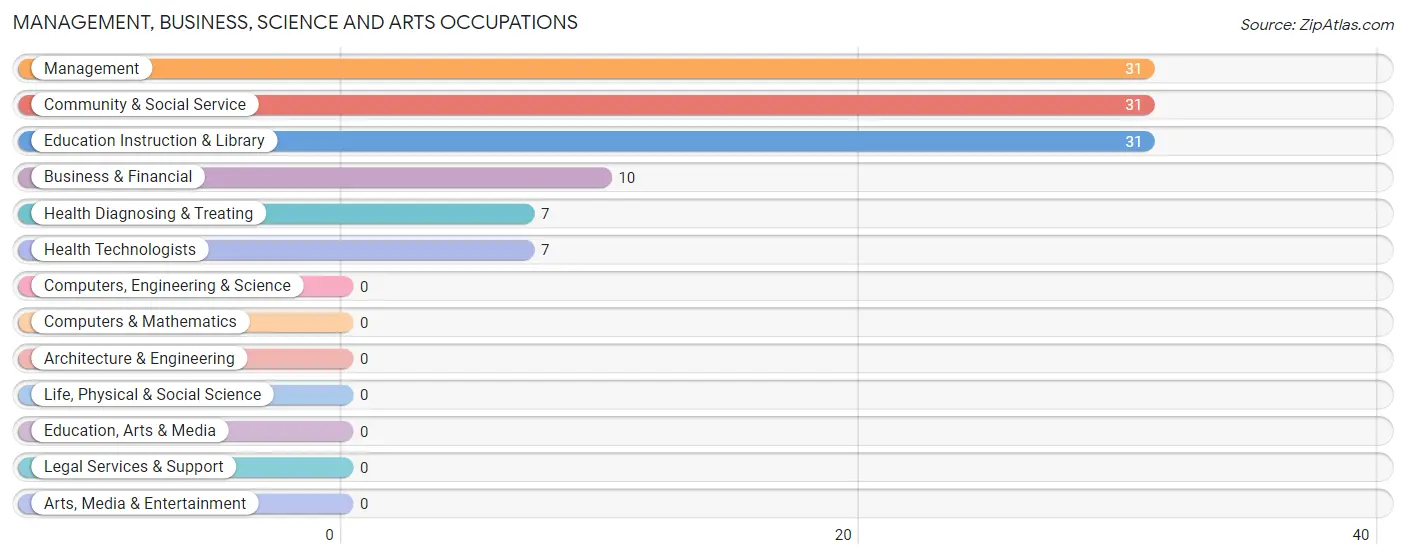
Management, Business, Science and Arts Occupations
The most common Management, Business, Science and Arts occupations in Cattle Creek are Management (31 | 10.6%), Community & Social Service (31 | 10.6%), Education Instruction & Library (31 | 10.6%), Business & Financial (10 | 3.4%), and Health Diagnosing & Treating (7 | 2.4%).
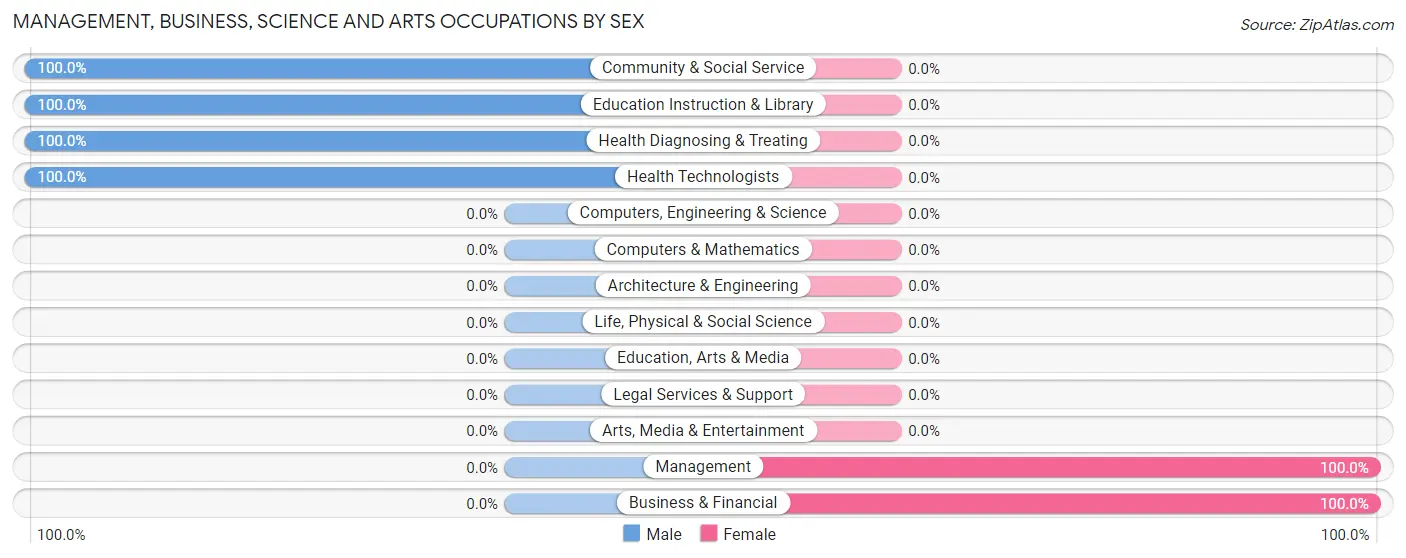
Management, Business, Science and Arts Occupations by Sex
Within the Management, Business, Science and Arts occupations in Cattle Creek, the most male-oriented occupations are Community & Social Service (100.0%), Education Instruction & Library (100.0%), and Health Diagnosing & Treating (100.0%), while the most female-oriented occupations are Management (100.0%), and Business & Financial (100.0%).
| Occupation | Male | Female |
| Management | 0 (0.0%) | 31 (100.0%) |
| Business & Financial | 0 (0.0%) | 10 (100.0%) |
| Computers, Engineering & Science | 0 (0.0%) | 0 (0.0%) |
| Computers & Mathematics | 0 (0.0%) | 0 (0.0%) |
| Architecture & Engineering | 0 (0.0%) | 0 (0.0%) |
| Life, Physical & Social Science | 0 (0.0%) | 0 (0.0%) |
| Community & Social Service | 31 (100.0%) | 0 (0.0%) |
| Education, Arts & Media | 0 (0.0%) | 0 (0.0%) |
| Legal Services & Support | 0 (0.0%) | 0 (0.0%) |
| Education Instruction & Library | 31 (100.0%) | 0 (0.0%) |
| Arts, Media & Entertainment | 0 (0.0%) | 0 (0.0%) |
| Health Diagnosing & Treating | 7 (100.0%) | 0 (0.0%) |
| Health Technologists | 7 (100.0%) | 0 (0.0%) |
| Total (Category) | 38 (48.1%) | 41 (51.9%) |
| Total (Overall) | 164 (56.2%) | 128 (43.8%) |
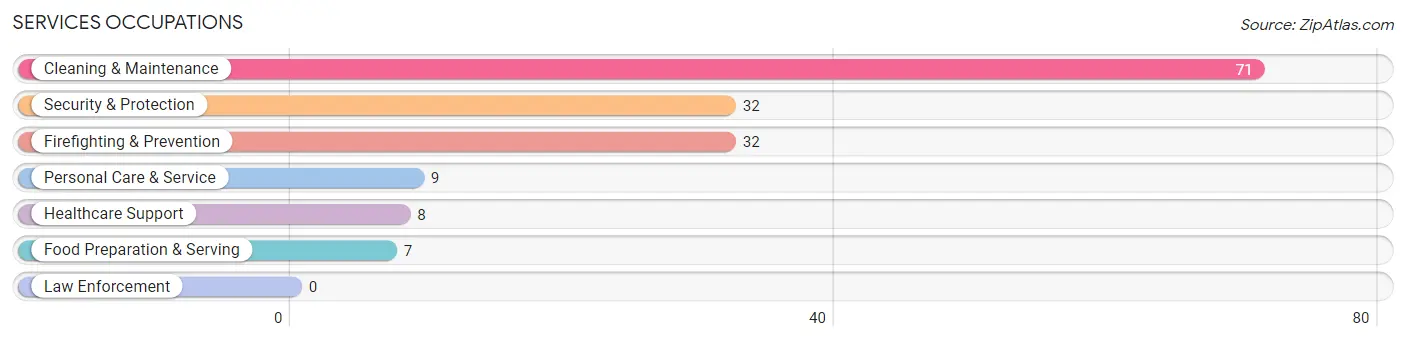
Services Occupations
The most common Services occupations in Cattle Creek are Cleaning & Maintenance (71 | 24.3%), Security & Protection (32 | 11.0%), Firefighting & Prevention (32 | 11.0%), Personal Care & Service (9 | 3.1%), and Healthcare Support (8 | 2.7%).
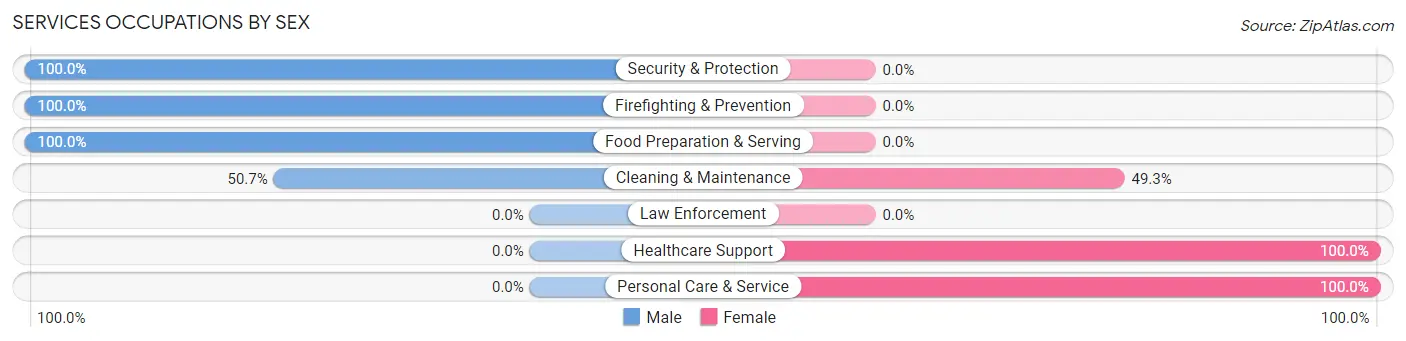
Services Occupations by Sex
Within the Services occupations in Cattle Creek, the most male-oriented occupations are Security & Protection (100.0%), Firefighting & Prevention (100.0%), and Food Preparation & Serving (100.0%), while the most female-oriented occupations are Healthcare Support (100.0%), Personal Care & Service (100.0%), and Cleaning & Maintenance (49.3%).
| Occupation | Male | Female |
| Healthcare Support | 0 (0.0%) | 8 (100.0%) |
| Security & Protection | 32 (100.0%) | 0 (0.0%) |
| Firefighting & Prevention | 32 (100.0%) | 0 (0.0%) |
| Law Enforcement | 0 (0.0%) | 0 (0.0%) |
| Food Preparation & Serving | 7 (100.0%) | 0 (0.0%) |
| Cleaning & Maintenance | 36 (50.7%) | 35 (49.3%) |
| Personal Care & Service | 0 (0.0%) | 9 (100.0%) |
| Total (Category) | 75 (59.1%) | 52 (40.9%) |
| Total (Overall) | 164 (56.2%) | 128 (43.8%) |
Sales and Office Occupations
The most common Sales and Office occupations in Cattle Creek are Office & Administration (35 | 12.0%), and Sales & Related (17 | 5.8%).
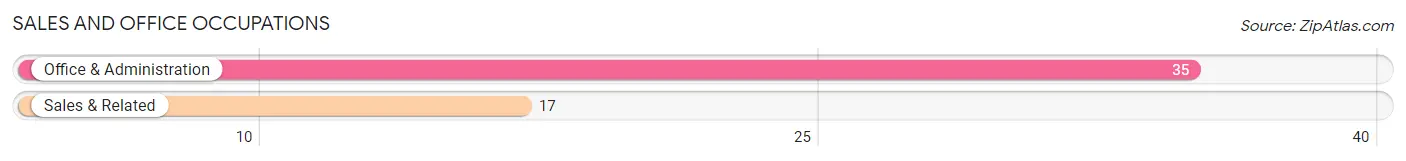
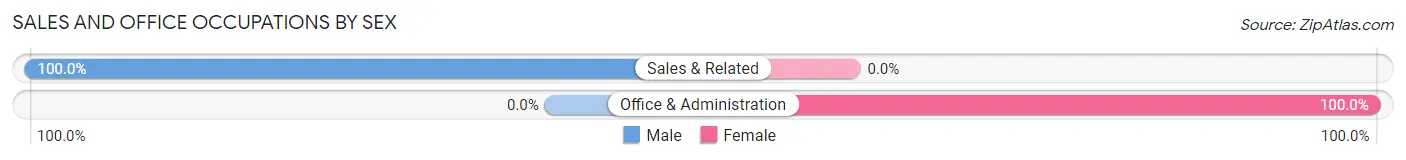
Sales and Office Occupations by Sex
| Occupation | Male | Female |
| Sales & Related | 17 (100.0%) | 0 (0.0%) |
| Office & Administration | 0 (0.0%) | 35 (100.0%) |
| Total (Category) | 17 (32.7%) | 35 (67.3%) |
| Total (Overall) | 164 (56.2%) | 128 (43.8%) |
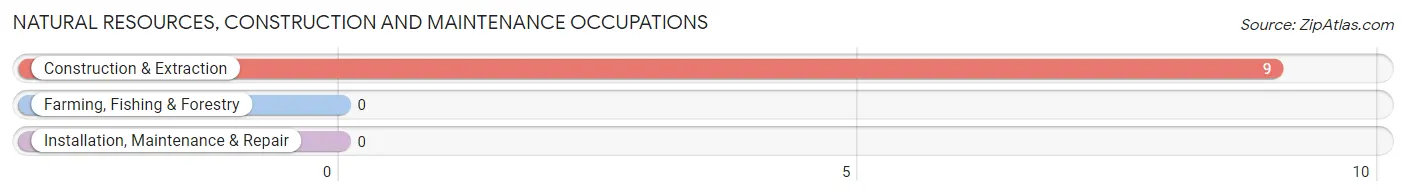
Natural Resources, Construction and Maintenance Occupations
The most common Natural Resources, Construction and Maintenance occupations in Cattle Creek are , and Construction & Extraction (9 | 3.1%).
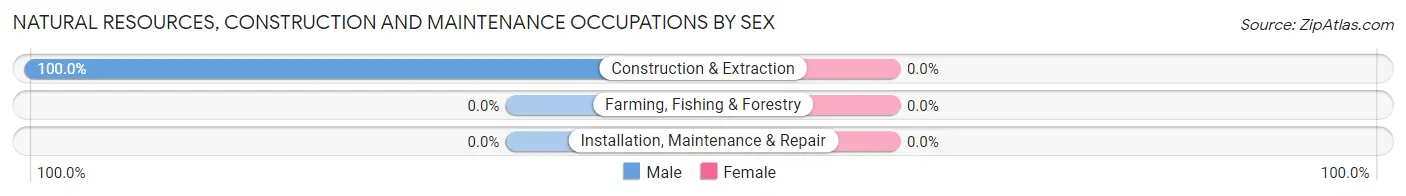
Natural Resources, Construction and Maintenance Occupations by Sex
| Occupation | Male | Female |
| Farming, Fishing & Forestry | 0 (0.0%) | 0 (0.0%) |
| Construction & Extraction | 9 (100.0%) | 0 (0.0%) |
| Installation, Maintenance & Repair | 0 (0.0%) | 0 (0.0%) |
| Total (Category) | 9 (100.0%) | 0 (0.0%) |
| Total (Overall) | 164 (56.2%) | 128 (43.8%) |
Production, Transportation and Moving Occupations
The most common Production, Transportation and Moving occupations in Cattle Creek are , and Production (25 | 8.6%).
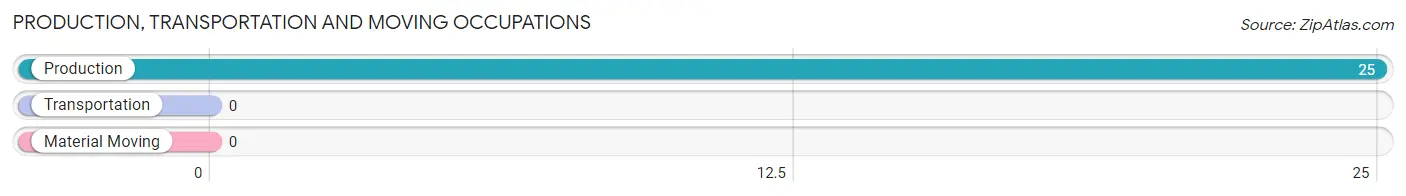
Production, Transportation and Moving Occupations by Sex
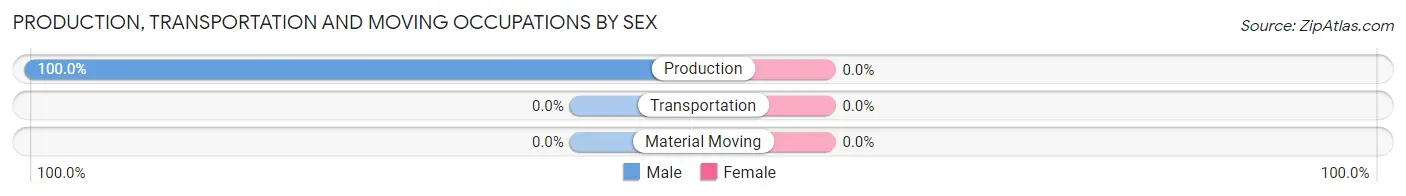
| Occupation | Male | Female |
| Production | 25 (100.0%) | 0 (0.0%) |
| Transportation | 0 (0.0%) | 0 (0.0%) |
| Material Moving | 0 (0.0%) | 0 (0.0%) |
| Total (Category) | 25 (100.0%) | 0 (0.0%) |
| Total (Overall) | 164 (56.2%) | 128 (43.8%) |
Employment Industries by Sex in Cattle Creek
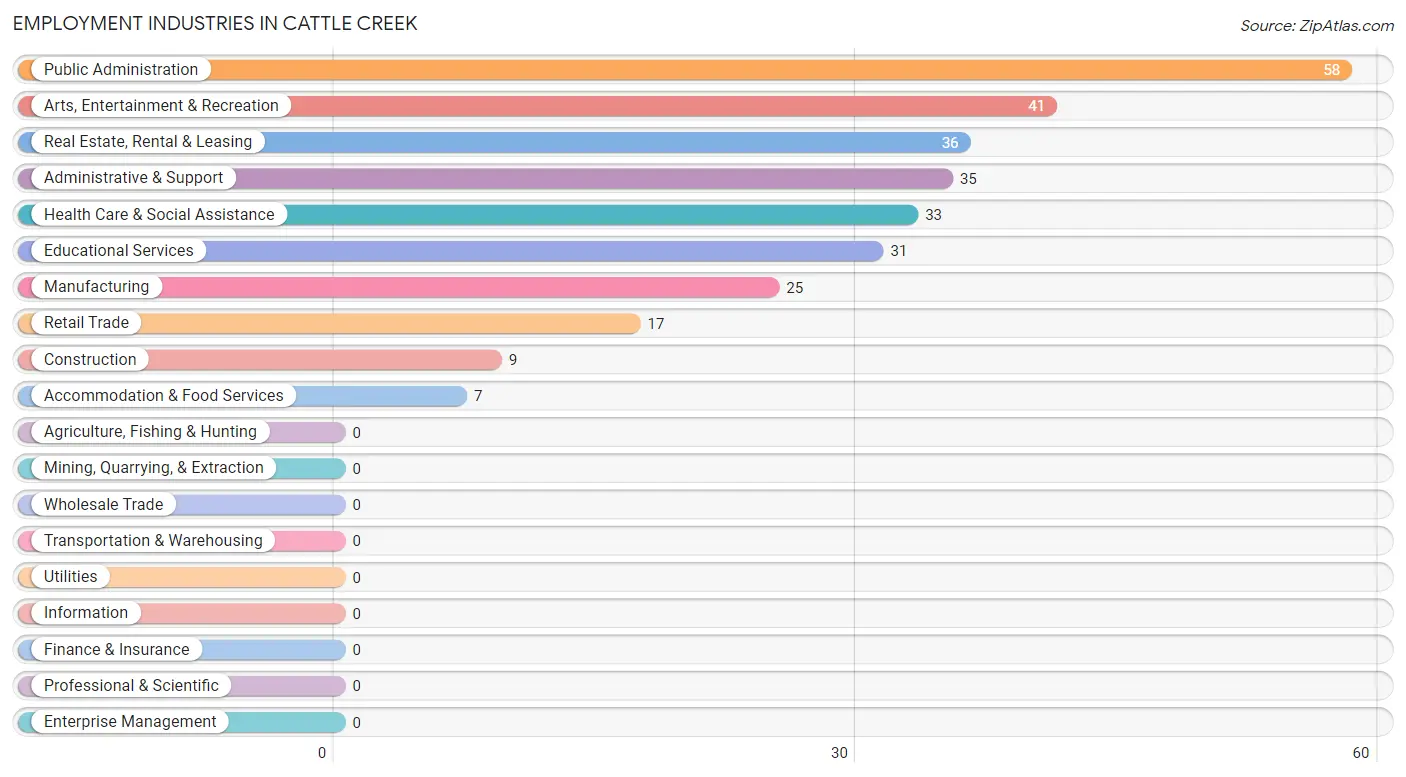
Employment Industries in Cattle Creek
The major employment industries in Cattle Creek include Public Administration (58 | 19.9%), Arts, Entertainment & Recreation (41 | 14.0%), Real Estate, Rental & Leasing (36 | 12.3%), Administrative & Support (35 | 12.0%), and Health Care & Social Assistance (33 | 11.3%).
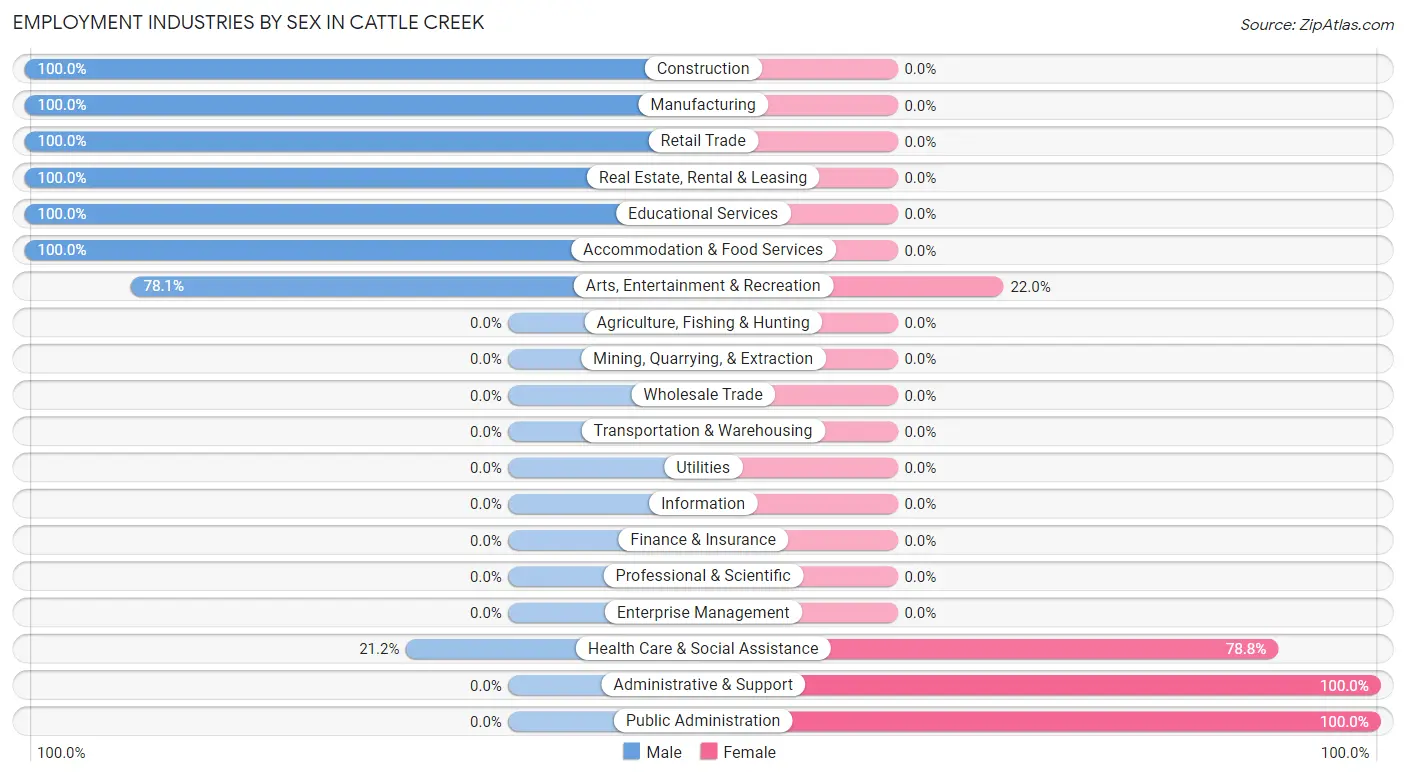
Employment Industries by Sex in Cattle Creek
The Cattle Creek industries that see more men than women are Construction (100.0%), Manufacturing (100.0%), and Retail Trade (100.0%), whereas the industries that tend to have a higher number of women are Administrative & Support (100.0%), Public Administration (100.0%), and Health Care & Social Assistance (78.8%).
| Industry | Male | Female |
| Agriculture, Fishing & Hunting | 0 (0.0%) | 0 (0.0%) |
| Mining, Quarrying, & Extraction | 0 (0.0%) | 0 (0.0%) |
| Construction | 9 (100.0%) | 0 (0.0%) |
| Manufacturing | 25 (100.0%) | 0 (0.0%) |
| Wholesale Trade | 0 (0.0%) | 0 (0.0%) |
| Retail Trade | 17 (100.0%) | 0 (0.0%) |
| Transportation & Warehousing | 0 (0.0%) | 0 (0.0%) |
| Utilities | 0 (0.0%) | 0 (0.0%) |
| Information | 0 (0.0%) | 0 (0.0%) |
| Finance & Insurance | 0 (0.0%) | 0 (0.0%) |
| Real Estate, Rental & Leasing | 36 (100.0%) | 0 (0.0%) |
| Professional & Scientific | 0 (0.0%) | 0 (0.0%) |
| Enterprise Management | 0 (0.0%) | 0 (0.0%) |
| Administrative & Support | 0 (0.0%) | 35 (100.0%) |
| Educational Services | 31 (100.0%) | 0 (0.0%) |
| Health Care & Social Assistance | 7 (21.2%) | 26 (78.8%) |
| Arts, Entertainment & Recreation | 32 (78.0%) | 9 (22.0%) |
| Accommodation & Food Services | 7 (100.0%) | 0 (0.0%) |
| Public Administration | 0 (0.0%) | 58 (100.0%) |
| Total | 164 (56.2%) | 128 (43.8%) |
Education in Cattle Creek
School Enrollment in Cattle Creek
The most common levels of schooling among the 72 students in Cattle Creek are kindergarten (27 | 37.5%), middle school (15 | 20.8%), and nursery / preschool (13 | 18.1%).
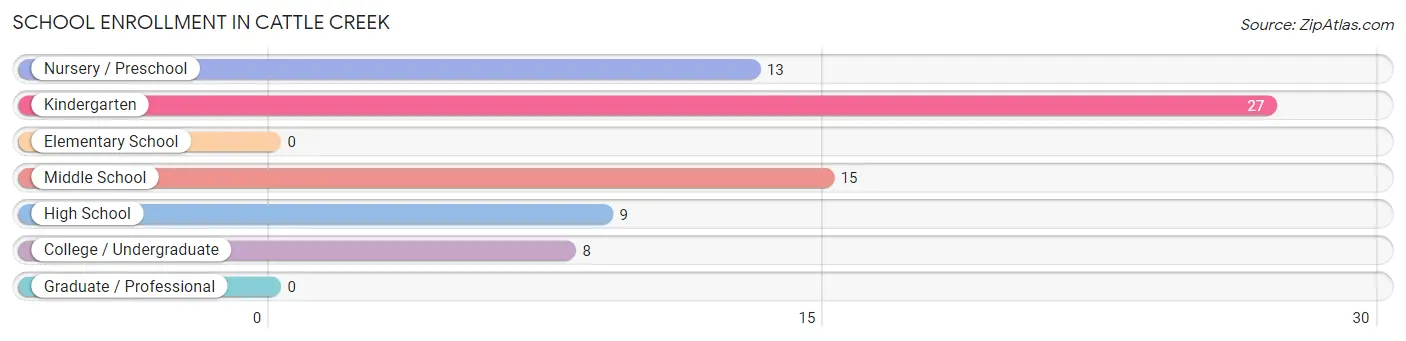
| School Level | # Students | % Students |
| Nursery / Preschool | 13 | 18.1% |
| Kindergarten | 27 | 37.5% |
| Elementary School | 0 | 0.0% |
| Middle School | 15 | 20.8% |
| High School | 9 | 12.5% |
| College / Undergraduate | 8 | 11.1% |
| Graduate / Professional | 0 | 0.0% |
| Total | 72 | 100.0% |
School Enrollment by Age by Funding Source in Cattle Creek
Out of a total of 72 students who are enrolled in schools in Cattle Creek, 15 (20.8%) attend a private institution, while the remaining 57 (79.2%) are enrolled in public schools. The age group of 10 to 14 year olds has the highest likelihood of being enrolled in private schools, with 15 (100.0% in the age bracket) enrolled. Conversely, the age group of 3 to 4 year olds has the lowest likelihood of being enrolled in a private school, with 13 (100.0% in the age bracket) attending a public institution.
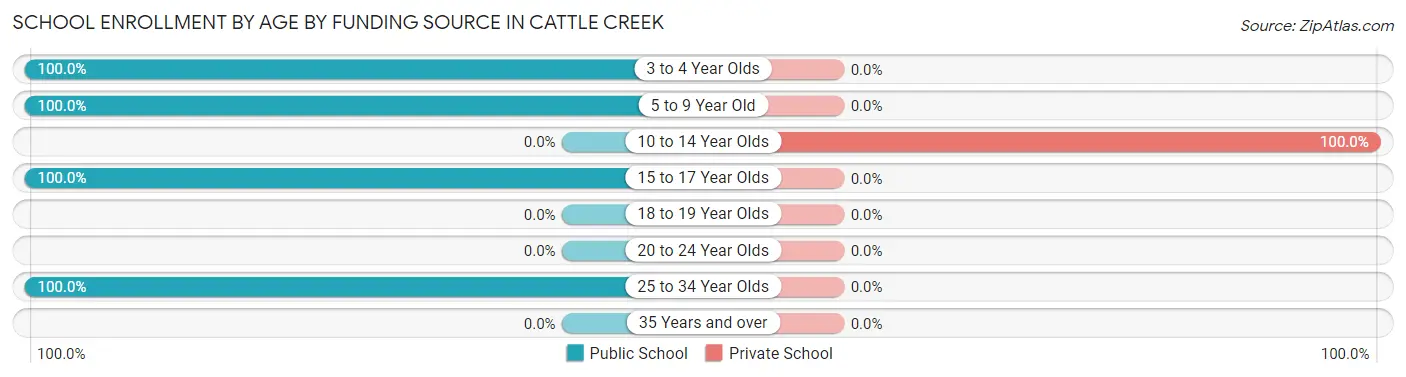
| Age Bracket | Public School | Private School |
| 3 to 4 Year Olds | 13 (100.0%) | 0 (0.0%) |
| 5 to 9 Year Old | 27 (100.0%) | 0 (0.0%) |
| 10 to 14 Year Olds | 0 (0.0%) | 15 (100.0%) |
| 15 to 17 Year Olds | 9 (100.0%) | 0 (0.0%) |
| 18 to 19 Year Olds | 0 (0.0%) | 0 (0.0%) |
| 20 to 24 Year Olds | 0 (0.0%) | 0 (0.0%) |
| 25 to 34 Year Olds | 8 (100.0%) | 0 (0.0%) |
| 35 Years and over | 0 (0.0%) | 0 (0.0%) |
| Total | 57 (79.2%) | 15 (20.8%) |
Educational Attainment by Field of Study in Cattle Creek
Computers & mathematics (69 | 42.6%), education (68 | 42.0%), business (10 | 6.2%), communications (8 | 4.9%), and bio, nature & agricultural (7 | 4.3%) are the most common fields of study among 162 individuals in Cattle Creek who have obtained a bachelor's degree or higher.
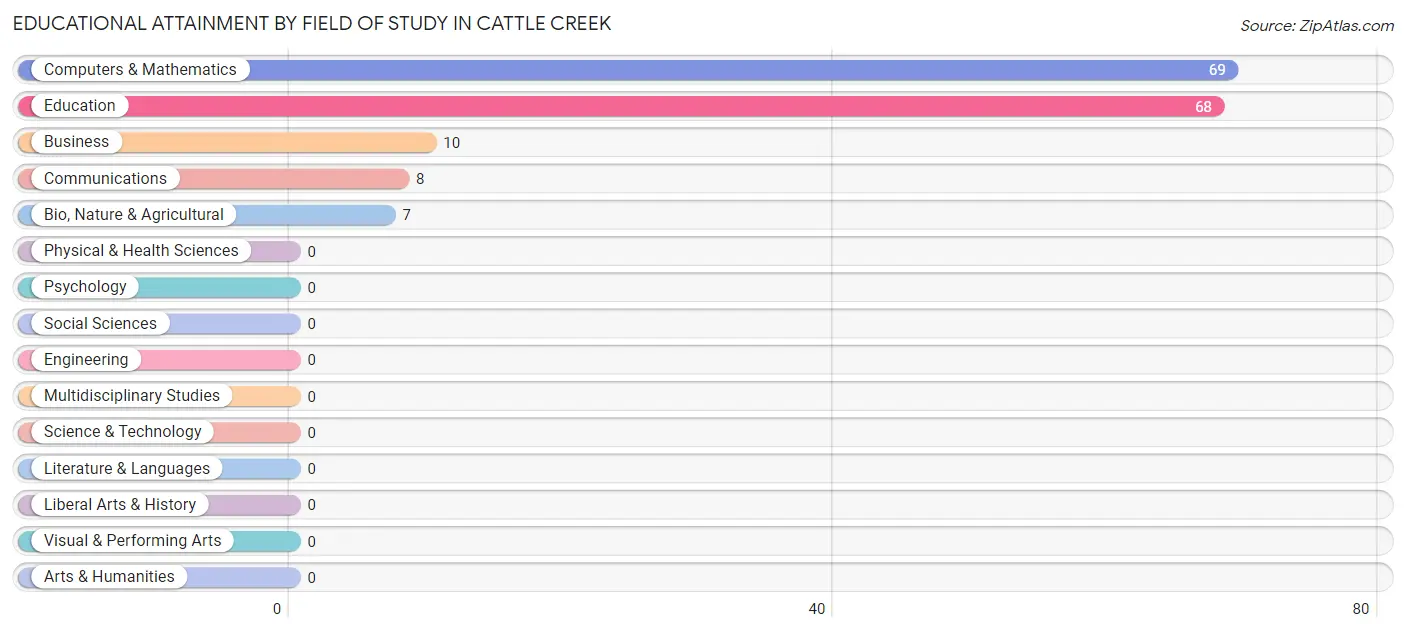
| Field of Study | # Graduates | % Graduates |
| Computers & Mathematics | 69 | 42.6% |
| Bio, Nature & Agricultural | 7 | 4.3% |
| Physical & Health Sciences | 0 | 0.0% |
| Psychology | 0 | 0.0% |
| Social Sciences | 0 | 0.0% |
| Engineering | 0 | 0.0% |
| Multidisciplinary Studies | 0 | 0.0% |
| Science & Technology | 0 | 0.0% |
| Business | 10 | 6.2% |
| Education | 68 | 42.0% |
| Literature & Languages | 0 | 0.0% |
| Liberal Arts & History | 0 | 0.0% |
| Visual & Performing Arts | 0 | 0.0% |
| Communications | 8 | 4.9% |
| Arts & Humanities | 0 | 0.0% |
| Total | 162 | 100.0% |
Transportation & Commute in Cattle Creek
Vehicle Availability by Sex in Cattle Creek
The most prevalent vehicle ownership categories in Cattle Creek are males with 4 vehicles (109, accounting for 69.4%) and females with 4 vehicles (0, making up 85.2%).
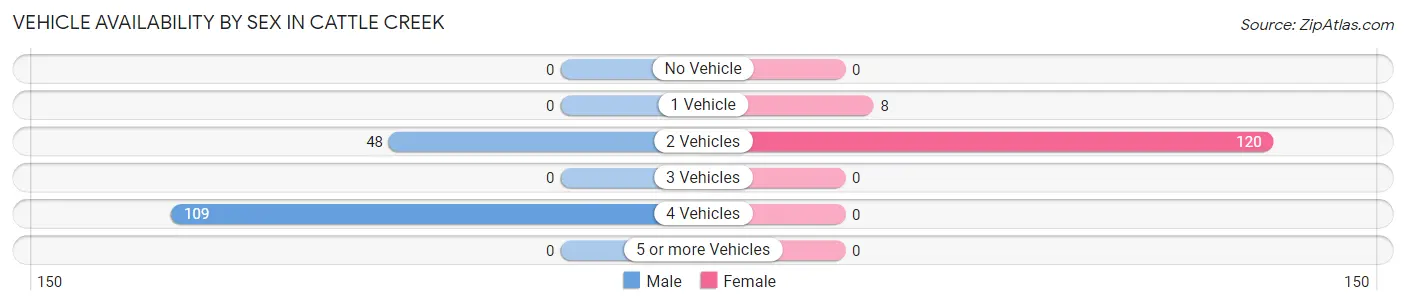
| Vehicles Available | Male | Female |
| No Vehicle | 0 (0.0%) | 0 (0.0%) |
| 1 Vehicle | 0 (0.0%) | 8 (6.2%) |
| 2 Vehicles | 48 (30.6%) | 120 (93.8%) |
| 3 Vehicles | 0 (0.0%) | 0 (0.0%) |
| 4 Vehicles | 109 (69.4%) | 0 (0.0%) |
| 5 or more Vehicles | 0 (0.0%) | 0 (0.0%) |
| Total | 157 (100.0%) | 128 (100.0%) |
Commute Time in Cattle Creek
The most frequently occuring commute durations in Cattle Creek are 15 to 19 minutes (169 commuters, 59.3%), 45 to 59 minutes (53 commuters, 18.6%), and 40 to 44 minutes (40 commuters, 14.0%).
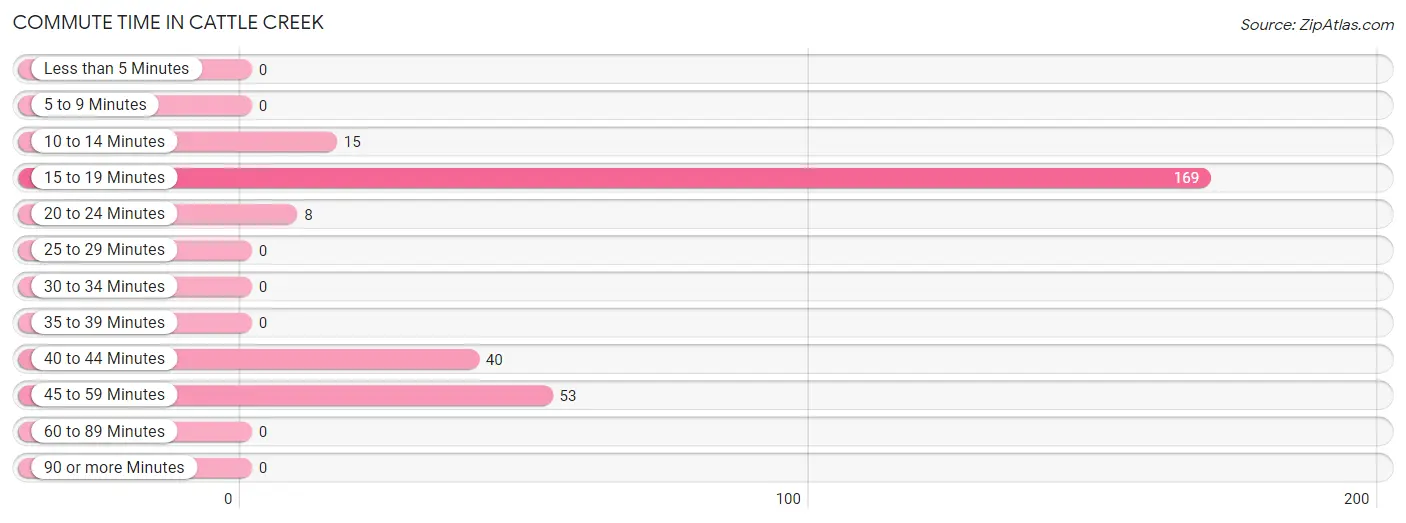
| Commute Time | # Commuters | % Commuters |
| Less than 5 Minutes | 0 | 0.0% |
| 5 to 9 Minutes | 0 | 0.0% |
| 10 to 14 Minutes | 15 | 5.3% |
| 15 to 19 Minutes | 169 | 59.3% |
| 20 to 24 Minutes | 8 | 2.8% |
| 25 to 29 Minutes | 0 | 0.0% |
| 30 to 34 Minutes | 0 | 0.0% |
| 35 to 39 Minutes | 0 | 0.0% |
| 40 to 44 Minutes | 40 | 14.0% |
| 45 to 59 Minutes | 53 | 18.6% |
| 60 to 89 Minutes | 0 | 0.0% |
| 90 or more Minutes | 0 | 0.0% |
Commute Time by Sex in Cattle Creek
The most common commute times in Cattle Creek are 15 to 19 minutes (57 commuters, 36.3%) for males and 15 to 19 minutes (112 commuters, 87.5%) for females.
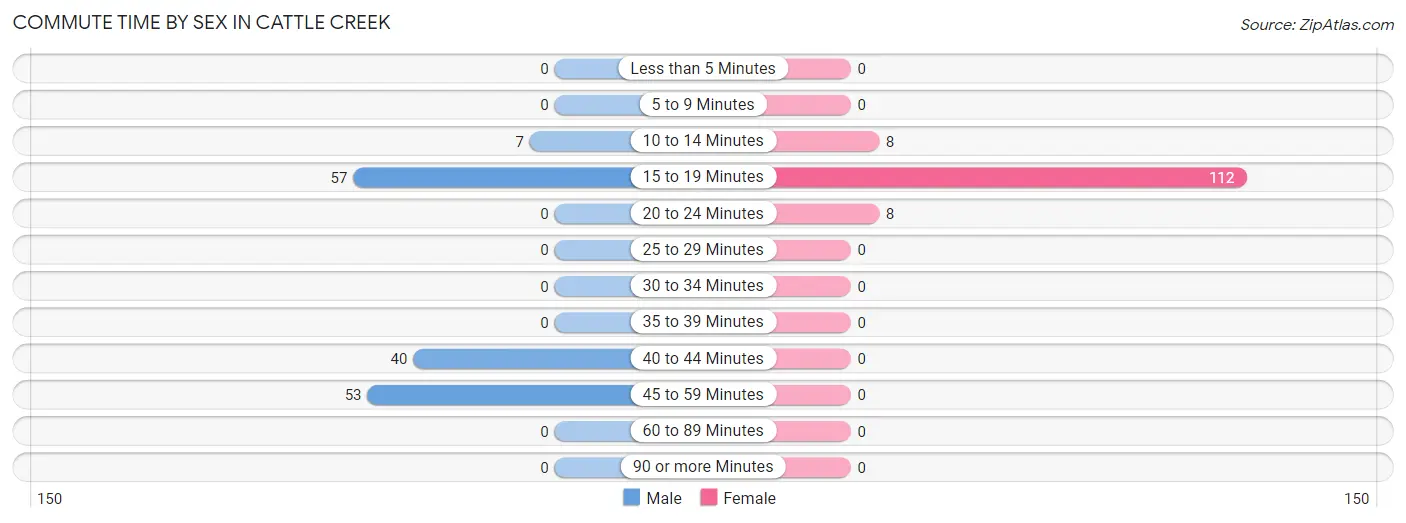
| Commute Time | Male | Female |
| Less than 5 Minutes | 0 (0.0%) | 0 (0.0%) |
| 5 to 9 Minutes | 0 (0.0%) | 0 (0.0%) |
| 10 to 14 Minutes | 7 (4.5%) | 8 (6.2%) |
| 15 to 19 Minutes | 57 (36.3%) | 112 (87.5%) |
| 20 to 24 Minutes | 0 (0.0%) | 8 (6.2%) |
| 25 to 29 Minutes | 0 (0.0%) | 0 (0.0%) |
| 30 to 34 Minutes | 0 (0.0%) | 0 (0.0%) |
| 35 to 39 Minutes | 0 (0.0%) | 0 (0.0%) |
| 40 to 44 Minutes | 40 (25.5%) | 0 (0.0%) |
| 45 to 59 Minutes | 53 (33.8%) | 0 (0.0%) |
| 60 to 89 Minutes | 0 (0.0%) | 0 (0.0%) |
| 90 or more Minutes | 0 (0.0%) | 0 (0.0%) |
Time of Departure to Work by Sex in Cattle Creek
The most frequent times of departure to work in Cattle Creek are 7:00 AM to 7:29 AM (60, 38.2%) for males and 6:30 AM to 6:59 AM (35, 27.3%) for females.
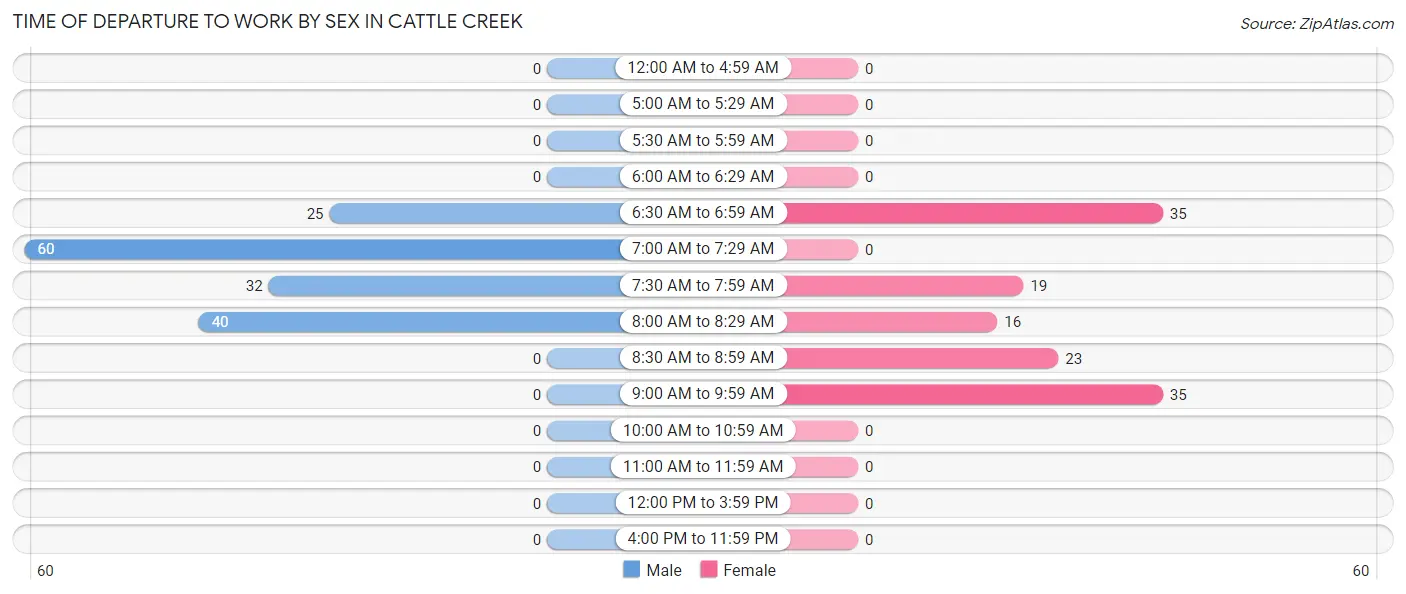
| Time of Departure | Male | Female |
| 12:00 AM to 4:59 AM | 0 (0.0%) | 0 (0.0%) |
| 5:00 AM to 5:29 AM | 0 (0.0%) | 0 (0.0%) |
| 5:30 AM to 5:59 AM | 0 (0.0%) | 0 (0.0%) |
| 6:00 AM to 6:29 AM | 0 (0.0%) | 0 (0.0%) |
| 6:30 AM to 6:59 AM | 25 (15.9%) | 35 (27.3%) |
| 7:00 AM to 7:29 AM | 60 (38.2%) | 0 (0.0%) |
| 7:30 AM to 7:59 AM | 32 (20.4%) | 19 (14.8%) |
| 8:00 AM to 8:29 AM | 40 (25.5%) | 16 (12.5%) |
| 8:30 AM to 8:59 AM | 0 (0.0%) | 23 (18.0%) |
| 9:00 AM to 9:59 AM | 0 (0.0%) | 35 (27.3%) |
| 10:00 AM to 10:59 AM | 0 (0.0%) | 0 (0.0%) |
| 11:00 AM to 11:59 AM | 0 (0.0%) | 0 (0.0%) |
| 12:00 PM to 3:59 PM | 0 (0.0%) | 0 (0.0%) |
| 4:00 PM to 11:59 PM | 0 (0.0%) | 0 (0.0%) |
| Total | 157 (100.0%) | 128 (100.0%) |
Housing Occupancy in Cattle Creek
Occupancy by Ownership in Cattle Creek
Of the total 243 dwellings in Cattle Creek, owner-occupied units account for 188 (77.4%), while renter-occupied units make up 55 (22.6%).
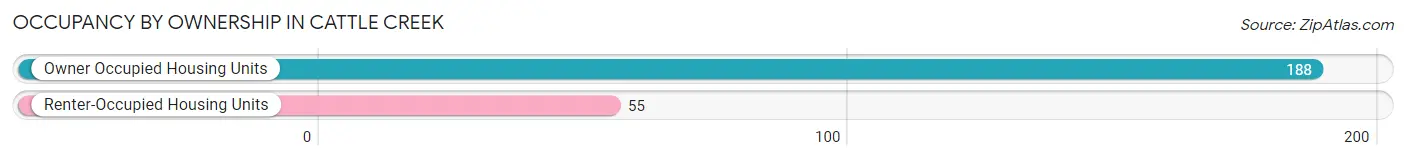
| Occupancy | # Housing Units | % Housing Units |
| Owner Occupied Housing Units | 188 | 77.4% |
| Renter-Occupied Housing Units | 55 | 22.6% |
| Total Occupied Housing Units | 243 | 100.0% |
Occupancy by Household Size in Cattle Creek
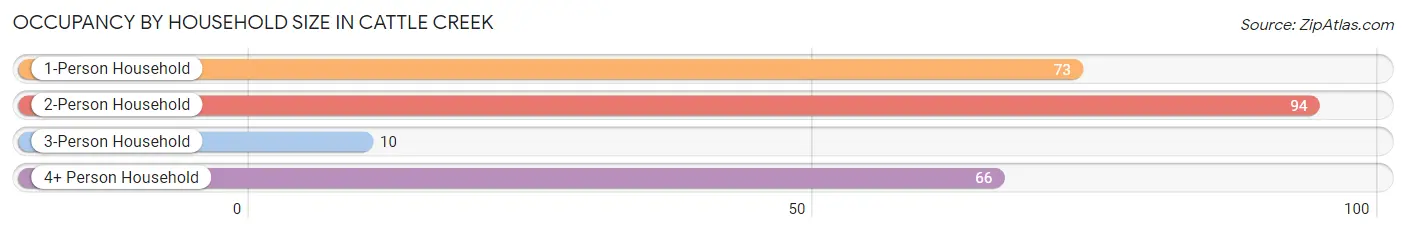
| Household Size | # Housing Units | % Housing Units |
| 1-Person Household | 73 | 30.0% |
| 2-Person Household | 94 | 38.7% |
| 3-Person Household | 10 | 4.1% |
| 4+ Person Household | 66 | 27.2% |
| Total Housing Units | 243 | 100.0% |
Occupancy by Ownership by Household Size in Cattle Creek
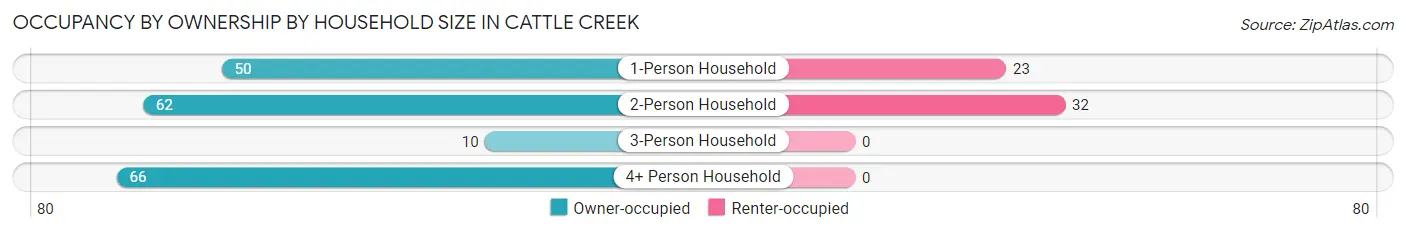
| Household Size | Owner-occupied | Renter-occupied |
| 1-Person Household | 50 (68.5%) | 23 (31.5%) |
| 2-Person Household | 62 (66.0%) | 32 (34.0%) |
| 3-Person Household | 10 (100.0%) | 0 (0.0%) |
| 4+ Person Household | 66 (100.0%) | 0 (0.0%) |
| Total Housing Units | 188 (77.4%) | 55 (22.6%) |
Occupancy by Educational Attainment in Cattle Creek
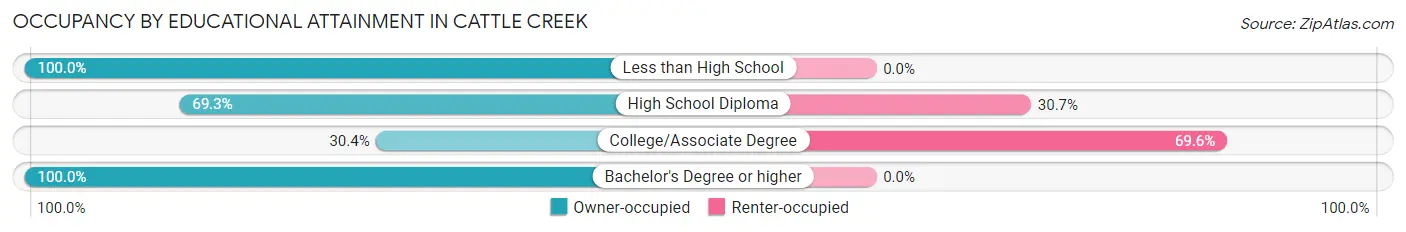
| Household Size | Owner-occupied | Renter-occupied |
| Less than High School | 59 (100.0%) | 0 (0.0%) |
| High School Diploma | 52 (69.3%) | 23 (30.7%) |
| College/Associate Degree | 14 (30.4%) | 32 (69.6%) |
| Bachelor's Degree or higher | 63 (100.0%) | 0 (0.0%) |
Occupancy by Age of Householder in Cattle Creek
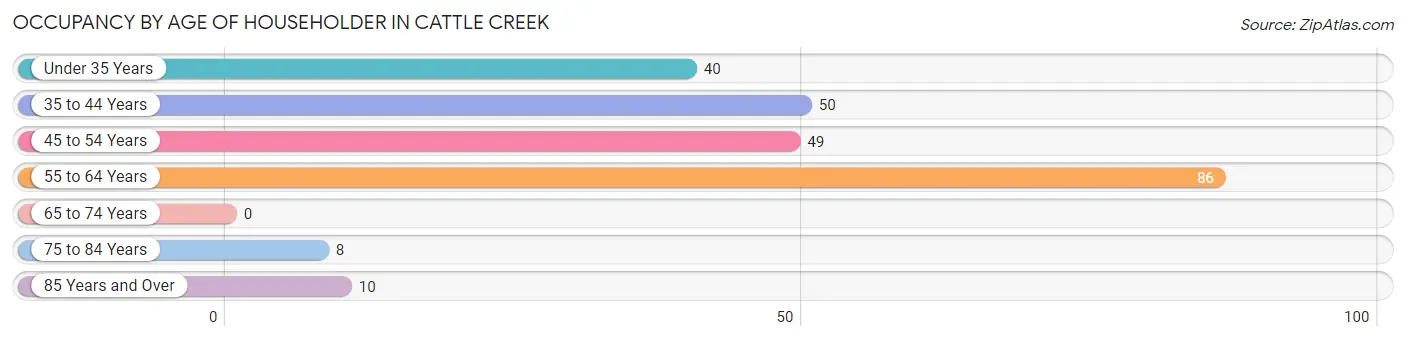
| Age Bracket | # Households | % Households |
| Under 35 Years | 40 | 16.5% |
| 35 to 44 Years | 50 | 20.6% |
| 45 to 54 Years | 49 | 20.2% |
| 55 to 64 Years | 86 | 35.4% |
| 65 to 74 Years | 0 | 0.0% |
| 75 to 84 Years | 8 | 3.3% |
| 85 Years and Over | 10 | 4.1% |
| Total | 243 | 100.0% |
Housing Finances in Cattle Creek
Median Income by Occupancy in Cattle Creek
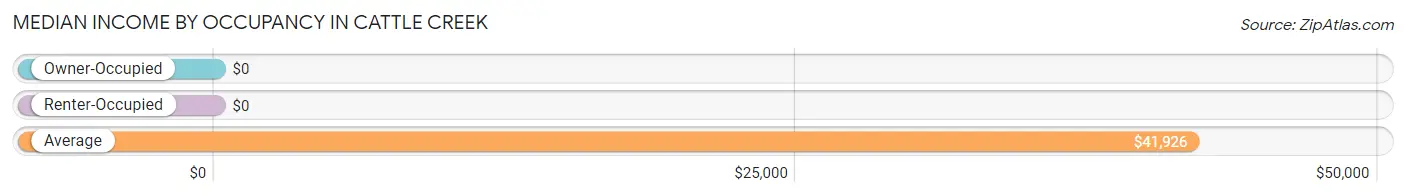
| Occupancy Type | # Households | Median Income |
| Owner-Occupied | 188 (77.4%) | $0 |
| Renter-Occupied | 55 (22.6%) | $0 |
| Average | 243 (100.0%) | $41,926 |
Occupancy by Householder Income Bracket in Cattle Creek
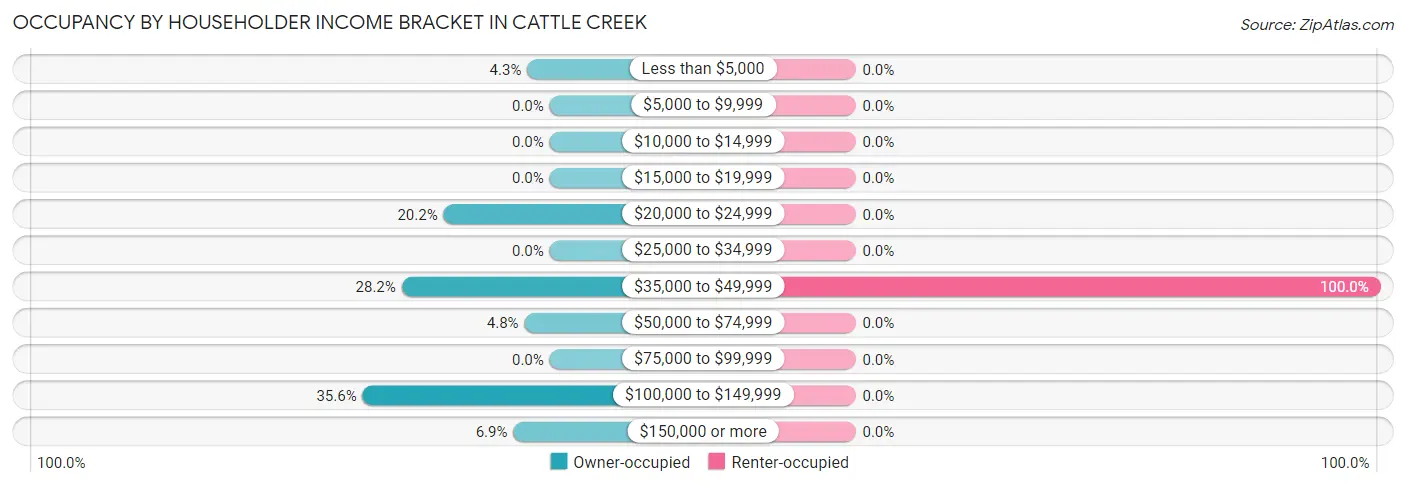
| Income Bracket | Owner-occupied | Renter-occupied |
| Less than $5,000 | 8 (4.3%) | 0 (0.0%) |
| $5,000 to $9,999 | 0 (0.0%) | 0 (0.0%) |
| $10,000 to $14,999 | 0 (0.0%) | 0 (0.0%) |
| $15,000 to $19,999 | 0 (0.0%) | 0 (0.0%) |
| $20,000 to $24,999 | 38 (20.2%) | 0 (0.0%) |
| $25,000 to $34,999 | 0 (0.0%) | 0 (0.0%) |
| $35,000 to $49,999 | 53 (28.2%) | 55 (100.0%) |
| $50,000 to $74,999 | 9 (4.8%) | 0 (0.0%) |
| $75,000 to $99,999 | 0 (0.0%) | 0 (0.0%) |
| $100,000 to $149,999 | 67 (35.6%) | 0 (0.0%) |
| $150,000 or more | 13 (6.9%) | 0 (0.0%) |
| Total | 188 (100.0%) | 55 (100.0%) |
Monthly Housing Cost Tiers in Cattle Creek
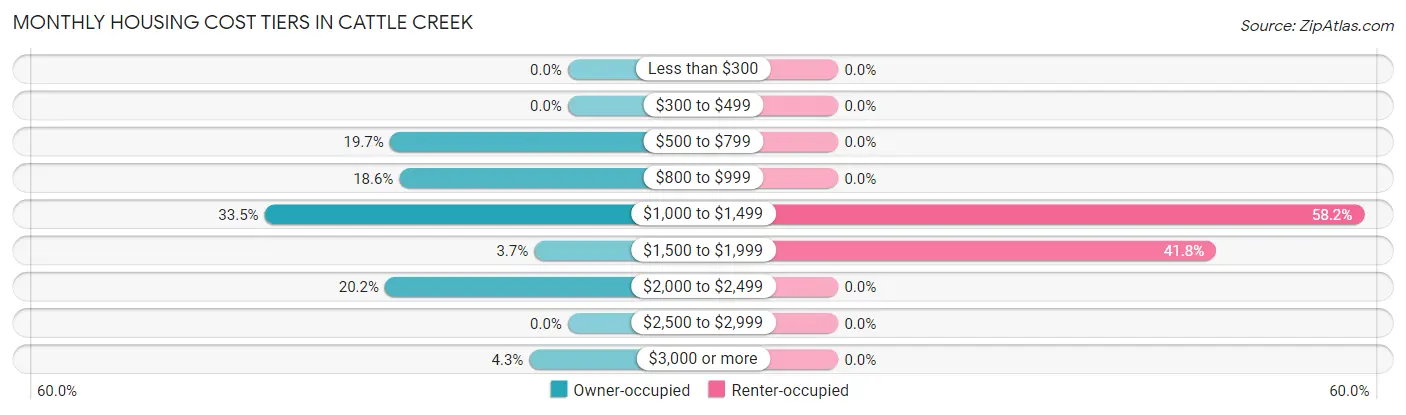
| Monthly Cost | Owner-occupied | Renter-occupied |
| Less than $300 | 0 (0.0%) | 0 (0.0%) |
| $300 to $499 | 0 (0.0%) | 0 (0.0%) |
| $500 to $799 | 37 (19.7%) | 0 (0.0%) |
| $800 to $999 | 35 (18.6%) | 0 (0.0%) |
| $1,000 to $1,499 | 63 (33.5%) | 32 (58.2%) |
| $1,500 to $1,999 | 7 (3.7%) | 23 (41.8%) |
| $2,000 to $2,499 | 38 (20.2%) | 0 (0.0%) |
| $2,500 to $2,999 | 0 (0.0%) | 0 (0.0%) |
| $3,000 or more | 8 (4.3%) | 0 (0.0%) |
| Total | 188 (100.0%) | 55 (100.0%) |
Physical Housing Characteristics in Cattle Creek
Housing Structures in Cattle Creek
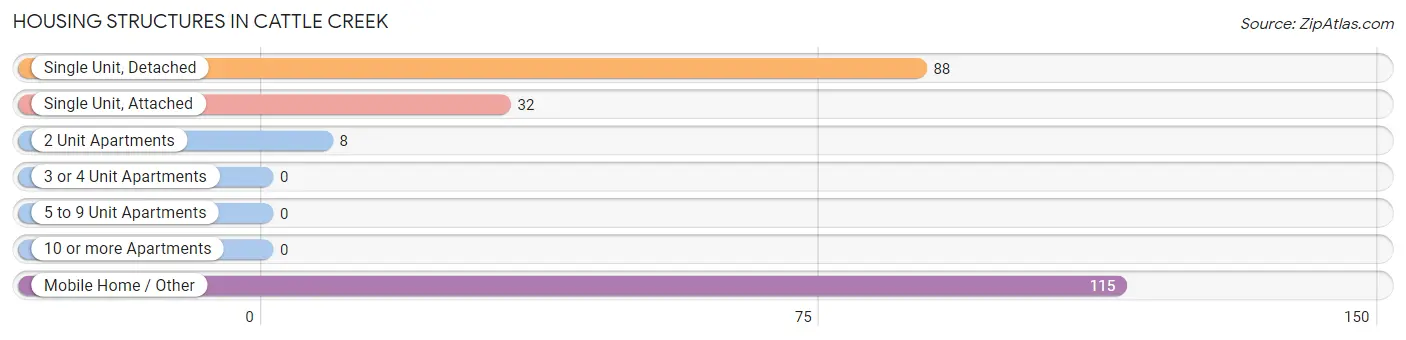
| Structure Type | # Housing Units | % Housing Units |
| Single Unit, Detached | 88 | 36.2% |
| Single Unit, Attached | 32 | 13.2% |
| 2 Unit Apartments | 8 | 3.3% |
| 3 or 4 Unit Apartments | 0 | 0.0% |
| 5 to 9 Unit Apartments | 0 | 0.0% |
| 10 or more Apartments | 0 | 0.0% |
| Mobile Home / Other | 115 | 47.3% |
| Total | 243 | 100.0% |
Housing Structures by Occupancy in Cattle Creek
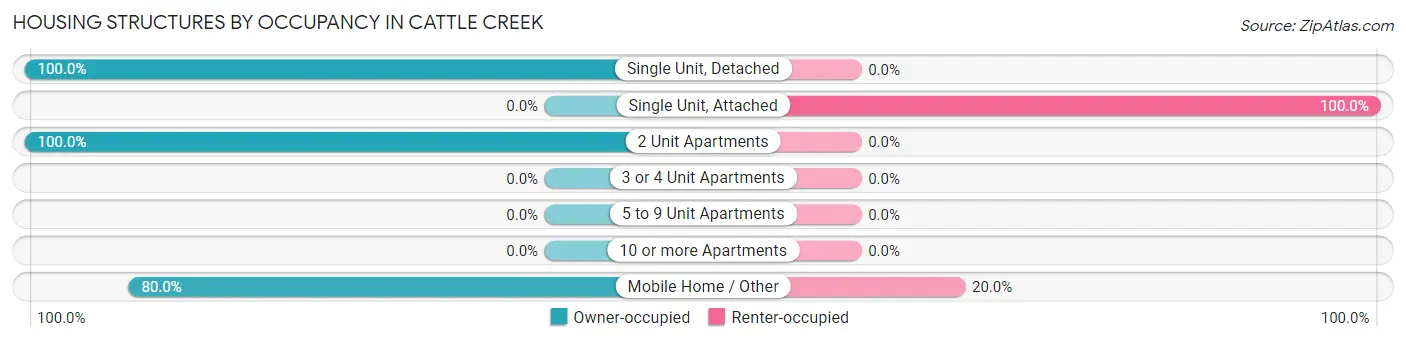
| Structure Type | Owner-occupied | Renter-occupied |
| Single Unit, Detached | 88 (100.0%) | 0 (0.0%) |
| Single Unit, Attached | 0 (0.0%) | 32 (100.0%) |
| 2 Unit Apartments | 8 (100.0%) | 0 (0.0%) |
| 3 or 4 Unit Apartments | 0 (0.0%) | 0 (0.0%) |
| 5 to 9 Unit Apartments | 0 (0.0%) | 0 (0.0%) |
| 10 or more Apartments | 0 (0.0%) | 0 (0.0%) |
| Mobile Home / Other | 92 (80.0%) | 23 (20.0%) |
| Total | 188 (77.4%) | 55 (22.6%) |
Housing Structures by Number of Rooms in Cattle Creek
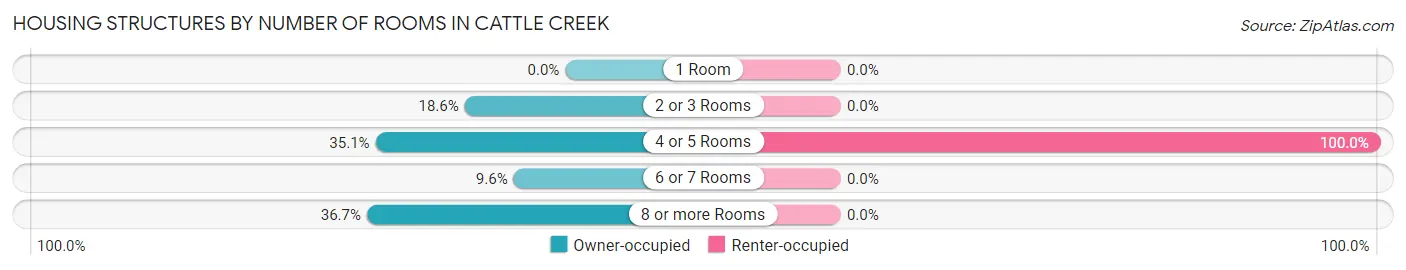
| Number of Rooms | Owner-occupied | Renter-occupied |
| 1 Room | 0 (0.0%) | 0 (0.0%) |
| 2 or 3 Rooms | 35 (18.6%) | 0 (0.0%) |
| 4 or 5 Rooms | 66 (35.1%) | 55 (100.0%) |
| 6 or 7 Rooms | 18 (9.6%) | 0 (0.0%) |
| 8 or more Rooms | 69 (36.7%) | 0 (0.0%) |
| Total | 188 (100.0%) | 55 (100.0%) |
Housing Structure by Heating Type in Cattle Creek
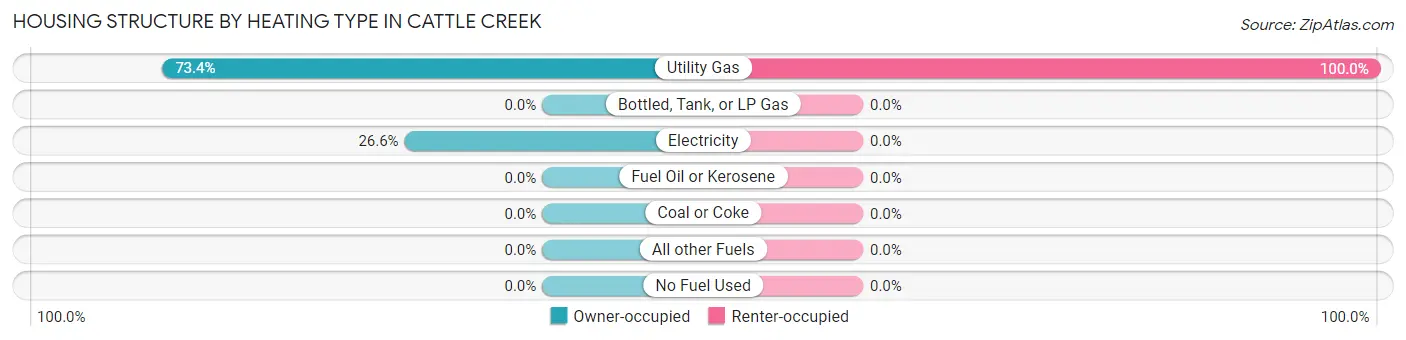
| Heating Type | Owner-occupied | Renter-occupied |
| Utility Gas | 138 (73.4%) | 55 (100.0%) |
| Bottled, Tank, or LP Gas | 0 (0.0%) | 0 (0.0%) |
| Electricity | 50 (26.6%) | 0 (0.0%) |
| Fuel Oil or Kerosene | 0 (0.0%) | 0 (0.0%) |
| Coal or Coke | 0 (0.0%) | 0 (0.0%) |
| All other Fuels | 0 (0.0%) | 0 (0.0%) |
| No Fuel Used | 0 (0.0%) | 0 (0.0%) |
| Total | 188 (100.0%) | 55 (100.0%) |
Household Vehicle Usage in Cattle Creek
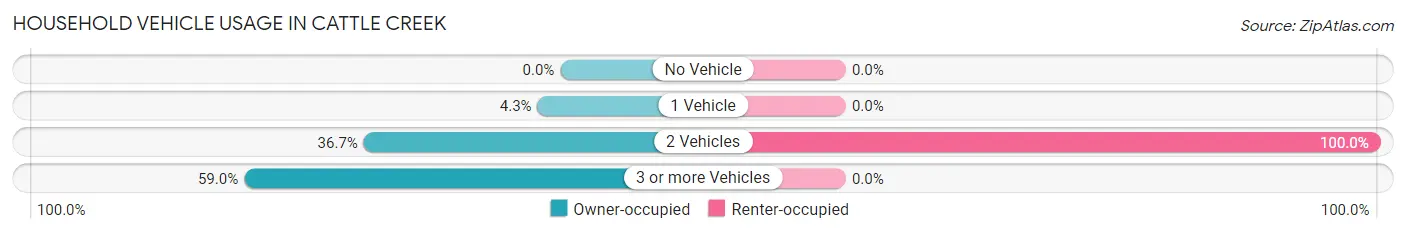
| Vehicles per Household | Owner-occupied | Renter-occupied |
| No Vehicle | 0 (0.0%) | 0 (0.0%) |
| 1 Vehicle | 8 (4.3%) | 0 (0.0%) |
| 2 Vehicles | 69 (36.7%) | 55 (100.0%) |
| 3 or more Vehicles | 111 (59.0%) | 0 (0.0%) |
| Total | 188 (100.0%) | 55 (100.0%) |
Real Estate & Mortgages in Cattle Creek
Real Estate and Mortgage Overview in Cattle Creek
| Characteristic | Without Mortgage | With Mortgage |
| Housing Units | 107 | 81 |
| Median Property Value | - | - |
| Median Household Income | $110,784 | $0 |
| Monthly Housing Costs | $1,034 | $8 |
| Real Estate Taxes | $3,200 | $0 |
Property Value by Mortgage Status in Cattle Creek
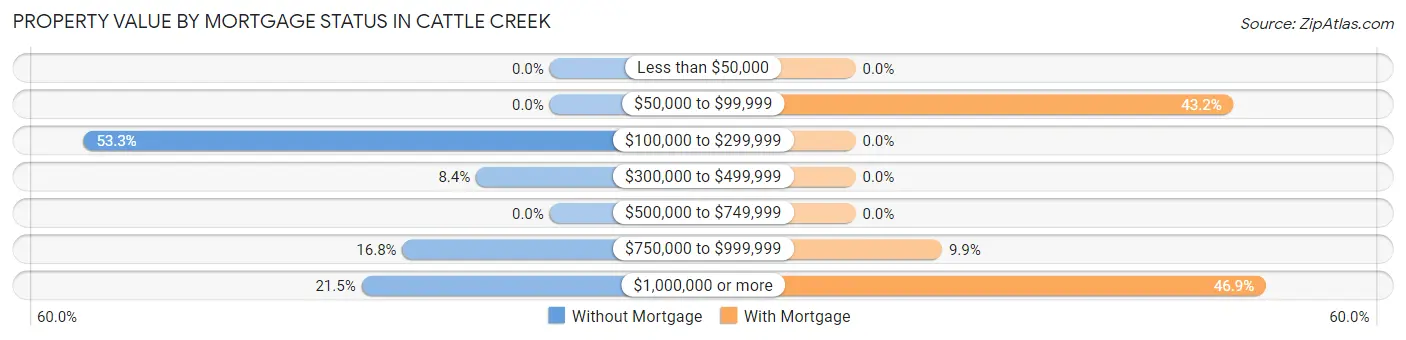
| Property Value | Without Mortgage | With Mortgage |
| Less than $50,000 | 0 (0.0%) | 0 (0.0%) |
| $50,000 to $99,999 | 0 (0.0%) | 35 (43.2%) |
| $100,000 to $299,999 | 57 (53.3%) | 0 (0.0%) |
| $300,000 to $499,999 | 9 (8.4%) | 0 (0.0%) |
| $500,000 to $749,999 | 0 (0.0%) | 0 (0.0%) |
| $750,000 to $999,999 | 18 (16.8%) | 8 (9.9%) |
| $1,000,000 or more | 23 (21.5%) | 38 (46.9%) |
| Total | 107 (100.0%) | 81 (100.0%) |
Household Income by Mortgage Status in Cattle Creek
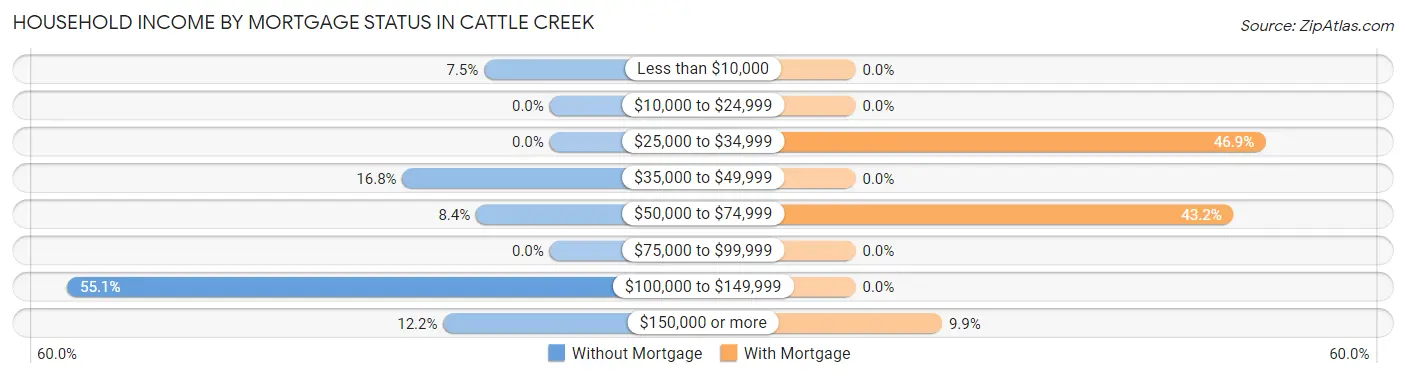
| Household Income | Without Mortgage | With Mortgage |
| Less than $10,000 | 8 (7.5%) | 0 (0.0%) |
| $10,000 to $24,999 | 0 (0.0%) | 0 (0.0%) |
| $25,000 to $34,999 | 0 (0.0%) | 38 (46.9%) |
| $35,000 to $49,999 | 18 (16.8%) | 0 (0.0%) |
| $50,000 to $74,999 | 9 (8.4%) | 35 (43.2%) |
| $75,000 to $99,999 | 0 (0.0%) | 0 (0.0%) |
| $100,000 to $149,999 | 59 (55.1%) | 0 (0.0%) |
| $150,000 or more | 13 (12.1%) | 8 (9.9%) |
| Total | 107 (100.0%) | 81 (100.0%) |
Property Value to Household Income Ratio in Cattle Creek
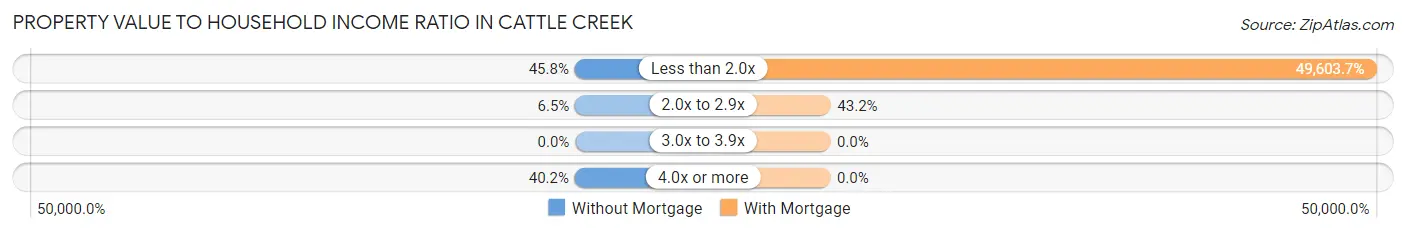
| Value-to-Income Ratio | Without Mortgage | With Mortgage |
| Less than 2.0x | 49 (45.8%) | 40,179 (49,603.7%) |
| 2.0x to 2.9x | 7 (6.5%) | 35 (43.2%) |
| 3.0x to 3.9x | 0 (0.0%) | 0 (0.0%) |
| 4.0x or more | 43 (40.2%) | 0 (0.0%) |
| Total | 107 (100.0%) | 81 (100.0%) |
Real Estate Taxes by Mortgage Status in Cattle Creek
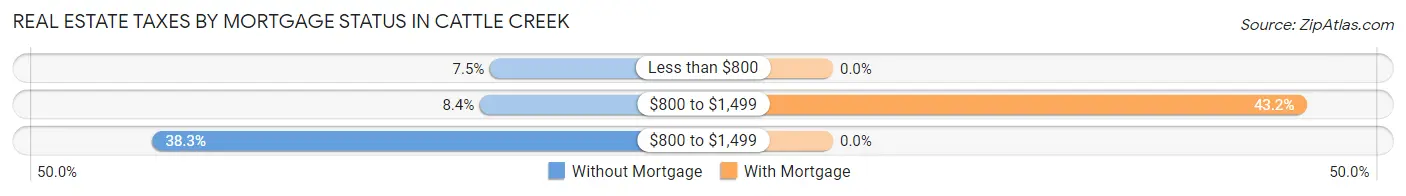
| Property Taxes | Without Mortgage | With Mortgage |
| Less than $800 | 8 (7.5%) | 0 (0.0%) |
| $800 to $1,499 | 9 (8.4%) | 35 (43.2%) |
| $800 to $1,499 | 41 (38.3%) | 0 (0.0%) |
| Total | 107 (100.0%) | 81 (100.0%) |
Health & Disability in Cattle Creek
Health Insurance Coverage by Age in Cattle Creek
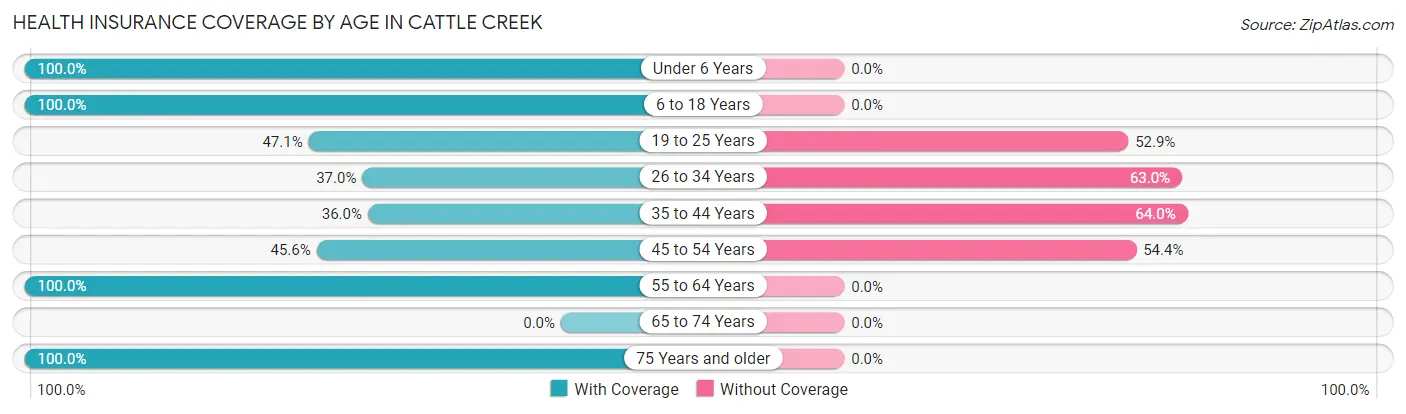
| Age Bracket | With Coverage | Without Coverage |
| Under 6 Years | 65 (100.0%) | 0 (0.0%) |
| 6 to 18 Years | 24 (100.0%) | 0 (0.0%) |
| 19 to 25 Years | 32 (47.1%) | 36 (52.9%) |
| 26 to 34 Years | 30 (37.0%) | 51 (63.0%) |
| 35 to 44 Years | 18 (36.0%) | 32 (64.0%) |
| 45 to 54 Years | 41 (45.6%) | 49 (54.4%) |
| 55 to 64 Years | 142 (100.0%) | 0 (0.0%) |
| 65 to 74 Years | 0 (0.0%) | 0 (0.0%) |
| 75 Years and older | 18 (100.0%) | 0 (0.0%) |
| Total | 370 (68.8%) | 168 (31.2%) |
Health Insurance Coverage by Citizenship Status in Cattle Creek
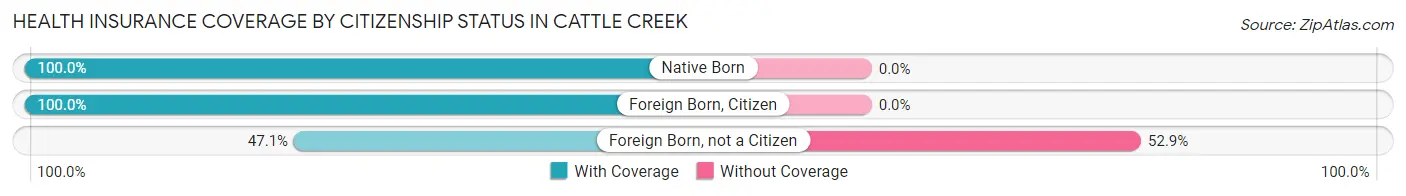
| Citizenship Status | With Coverage | Without Coverage |
| Native Born | 65 (100.0%) | 0 (0.0%) |
| Foreign Born, Citizen | 24 (100.0%) | 0 (0.0%) |
| Foreign Born, not a Citizen | 32 (47.1%) | 36 (52.9%) |
Health Insurance Coverage by Household Income in Cattle Creek
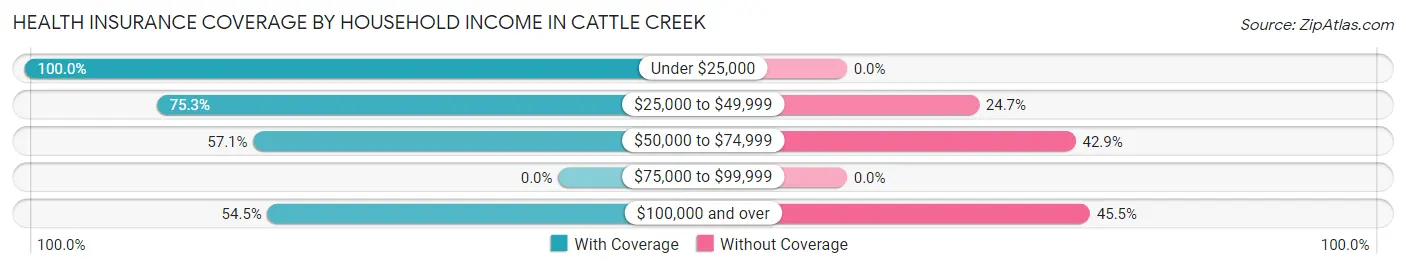
| Household Income | With Coverage | Without Coverage |
| Under $25,000 | 78 (100.0%) | 0 (0.0%) |
| $25,000 to $49,999 | 146 (75.3%) | 48 (24.7%) |
| $50,000 to $74,999 | 24 (57.1%) | 18 (42.9%) |
| $75,000 to $99,999 | 0 (0.0%) | 0 (0.0%) |
| $100,000 and over | 122 (54.5%) | 102 (45.5%) |
Public vs Private Health Insurance Coverage by Age in Cattle Creek
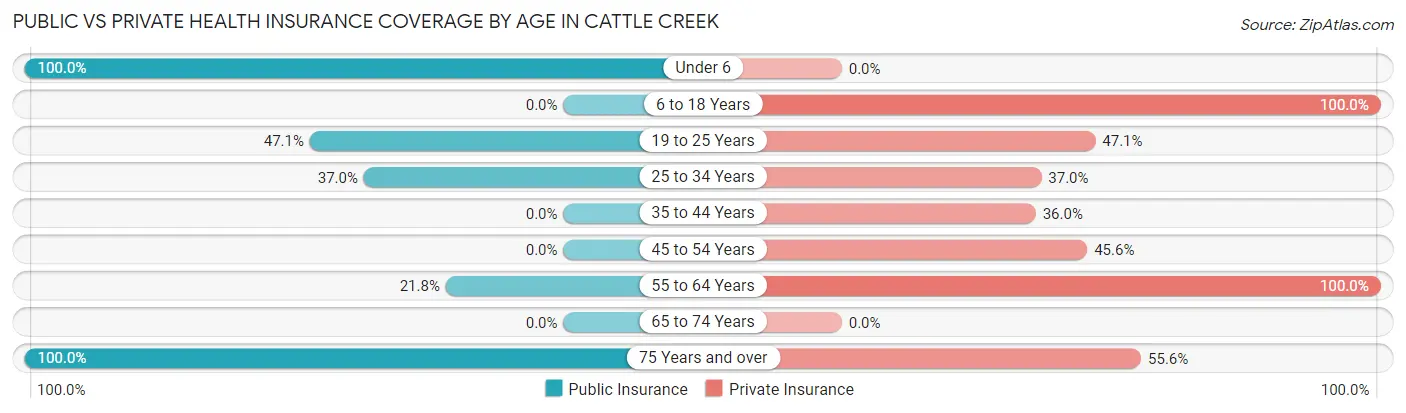
| Age Bracket | Public Insurance | Private Insurance |
| Under 6 | 65 (100.0%) | 0 (0.0%) |
| 6 to 18 Years | 0 (0.0%) | 24 (100.0%) |
| 19 to 25 Years | 32 (47.1%) | 32 (47.1%) |
| 25 to 34 Years | 30 (37.0%) | 30 (37.0%) |
| 35 to 44 Years | 0 (0.0%) | 18 (36.0%) |
| 45 to 54 Years | 0 (0.0%) | 41 (45.6%) |
| 55 to 64 Years | 31 (21.8%) | 142 (100.0%) |
| 65 to 74 Years | 0 (0.0%) | 0 (0.0%) |
| 75 Years and over | 18 (100.0%) | 10 (55.6%) |
| Total | 176 (32.7%) | 297 (55.2%) |
Disability Status by Sex by Age in Cattle Creek
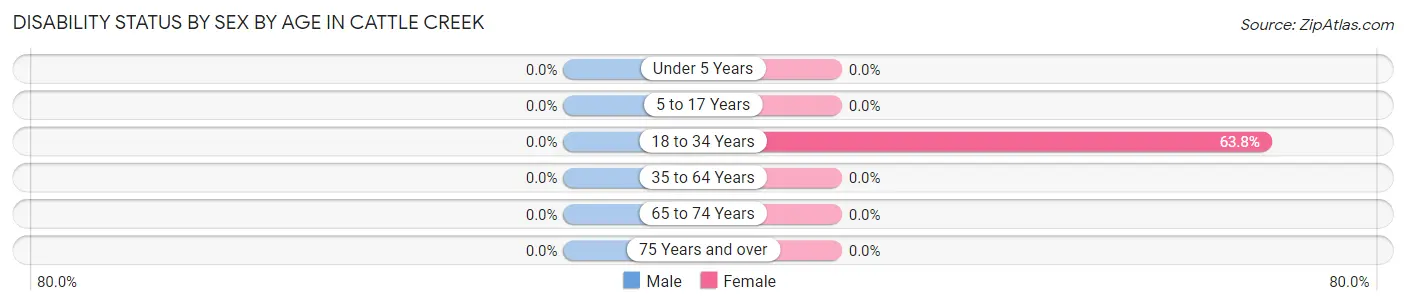
| Age Bracket | Male | Female |
| Under 5 Years | 0 (0.0%) | 0 (0.0%) |
| 5 to 17 Years | 0 (0.0%) | 0 (0.0%) |
| 18 to 34 Years | 0 (0.0%) | 30 (63.8%) |
| 35 to 64 Years | 0 (0.0%) | 0 (0.0%) |
| 65 to 74 Years | 0 (0.0%) | 0 (0.0%) |
| 75 Years and over | 0 (0.0%) | 0 (0.0%) |
Disability Class by Sex by Age in Cattle Creek
Disability Class: Hearing Difficulty
| Age Bracket | Male | Female |
| Under 5 Years | 0 (0.0%) | 0 (0.0%) |
| 5 to 17 Years | 0 (0.0%) | 0 (0.0%) |
| 18 to 34 Years | 0 (0.0%) | 0 (0.0%) |
| 35 to 64 Years | 0 (0.0%) | 0 (0.0%) |
| 65 to 74 Years | 0 (0.0%) | 0 (0.0%) |
| 75 Years and over | 0 (0.0%) | 0 (0.0%) |
Disability Class: Vision Difficulty
| Age Bracket | Male | Female |
| Under 5 Years | 0 (0.0%) | 0 (0.0%) |
| 5 to 17 Years | 0 (0.0%) | 0 (0.0%) |
| 18 to 34 Years | 0 (0.0%) | 0 (0.0%) |
| 35 to 64 Years | 0 (0.0%) | 0 (0.0%) |
| 65 to 74 Years | 0 (0.0%) | 0 (0.0%) |
| 75 Years and over | 0 (0.0%) | 0 (0.0%) |
Disability Class: Cognitive Difficulty
| Age Bracket | Male | Female |
| 5 to 17 Years | 0 (0.0%) | 0 (0.0%) |
| 18 to 34 Years | 0 (0.0%) | 0 (0.0%) |
| 35 to 64 Years | 0 (0.0%) | 0 (0.0%) |
| 65 to 74 Years | 0 (0.0%) | 0 (0.0%) |
| 75 Years and over | 0 (0.0%) | 0 (0.0%) |
Disability Class: Ambulatory Difficulty
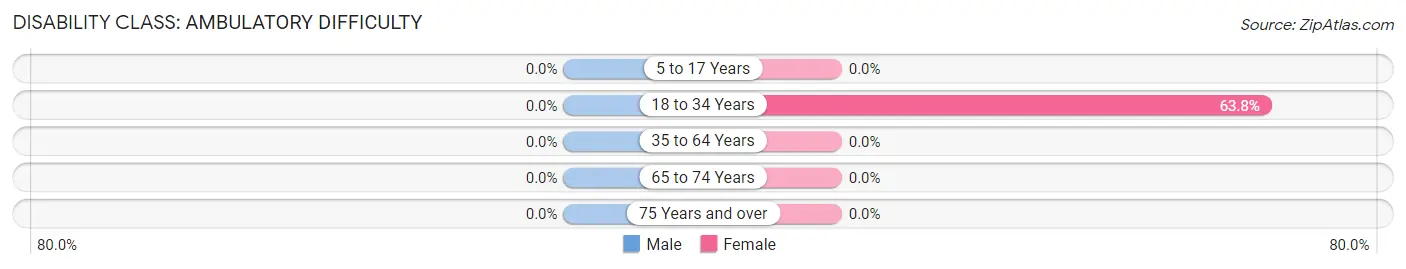
| Age Bracket | Male | Female |
| 5 to 17 Years | 0 (0.0%) | 0 (0.0%) |
| 18 to 34 Years | 0 (0.0%) | 30 (63.8%) |
| 35 to 64 Years | 0 (0.0%) | 0 (0.0%) |
| 65 to 74 Years | 0 (0.0%) | 0 (0.0%) |
| 75 Years and over | 0 (0.0%) | 0 (0.0%) |
Disability Class: Self-Care Difficulty
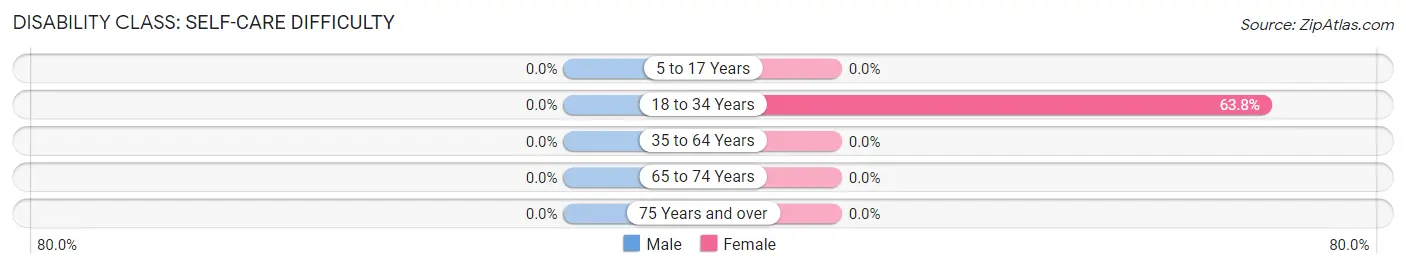
| Age Bracket | Male | Female |
| 5 to 17 Years | 0 (0.0%) | 0 (0.0%) |
| 18 to 34 Years | 0 (0.0%) | 30 (63.8%) |
| 35 to 64 Years | 0 (0.0%) | 0 (0.0%) |
| 65 to 74 Years | 0 (0.0%) | 0 (0.0%) |
| 75 Years and over | 0 (0.0%) | 0 (0.0%) |
Technology Access in Cattle Creek
Computing Device Access in Cattle Creek
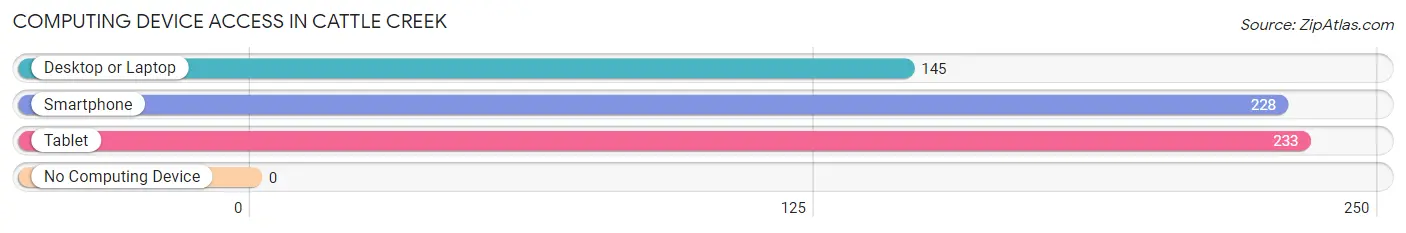
| Device Type | # Households | % Households |
| Desktop or Laptop | 145 | 59.7% |
| Smartphone | 228 | 93.8% |
| Tablet | 233 | 95.9% |
| No Computing Device | 0 | 0.0% |
| Total | 243 | 100.0% |
Internet Access in Cattle Creek
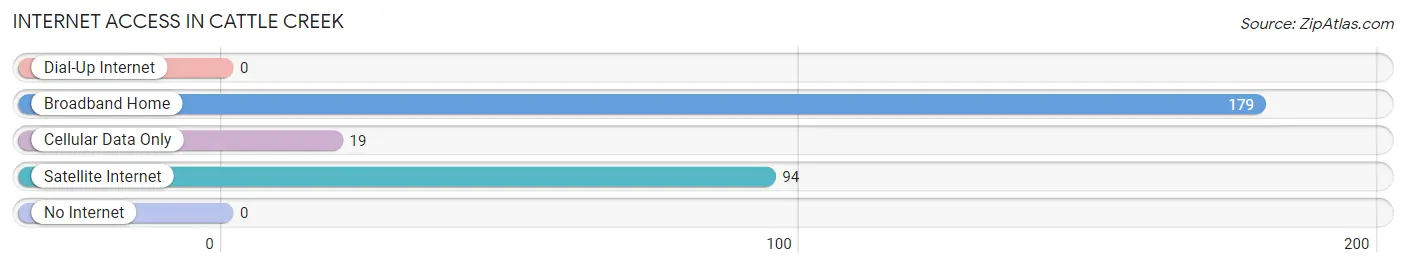
| Internet Type | # Households | % Households |
| Dial-Up Internet | 0 | 0.0% |
| Broadband Home | 179 | 73.7% |
| Cellular Data Only | 19 | 7.8% |
| Satellite Internet | 94 | 38.7% |
| No Internet | 0 | 0.0% |
| Total | 243 | 100.0% |
Cattle Creek Summary
Cattle Creek is a small unincorporated community located in Garfield County, Colorado. It is situated in the Roaring Fork Valley, approximately 10 miles south of Glenwood Springs and 15 miles north of Carbondale. The town is located along the banks of the Roaring Fork River and is surrounded by the White River National Forest.
History
The area around Cattle Creek has been inhabited for thousands of years. The Ute Indians were the first to settle in the area, followed by the Ute Mountain Ute Tribe. The first settlers in the area were miners who arrived in the late 1800s. They were attracted to the area by the abundance of coal and other minerals. The town was officially established in 1883 and was named after the nearby Cattle Creek.
Geography
Cattle Creek is located in the Roaring Fork Valley, at an elevation of 6,400 feet. The town is surrounded by the White River National Forest and is situated along the banks of the Roaring Fork River. The area is known for its rugged beauty and is home to a variety of wildlife, including elk, deer, and black bear.
Economy
The economy of Cattle Creek is largely based on tourism and recreation. The town is a popular destination for outdoor enthusiasts, who come to enjoy the area’s hiking, fishing, and camping opportunities. The town is also home to several small businesses, including a general store, a gas station, and a restaurant.
Demographics
As of the 2010 census, the population of Cattle Creek was 545. The racial makeup of the town was 95.2% White, 0.7% African American, 0.7% Native American, 0.7% Asian, 0.4% from other races, and 2.4% from two or more races. The median household income was $45,000, and the median family income was $50,000.
Conclusion
Cattle Creek is a small unincorporated community located in Garfield County, Colorado. It is situated in the Roaring Fork Valley, surrounded by the White River National Forest and the Roaring Fork River. The town has a long history, dating back to the 1800s when miners first arrived in the area. Today, the economy of Cattle Creek is largely based on tourism and recreation, and the town is a popular destination for outdoor enthusiasts. The population of Cattle Creek is 545, and the median household income is $45,000.
Common Questions
What is Per Capita Income in Cattle Creek?
Per Capita income in Cattle Creek is $30,650.
What is the Median Household income in Cattle Creek?
Median Household Income in Cattle Creek is $41,926.
What is Inequality or Gini Index in Cattle Creek?
Inequality or Gini Index in Cattle Creek is 0.45.
What is the Total Population of Cattle Creek?
Total Population of Cattle Creek is 538.
What is the Total Male Population of Cattle Creek?
Total Male Population of Cattle Creek is 247.
What is the Total Female Population of Cattle Creek?
Total Female Population of Cattle Creek is 291.
What is the Ratio of Males per 100 Females in Cattle Creek?
There are 84.88 Males per 100 Females in Cattle Creek.
What is the Ratio of Females per 100 Males in Cattle Creek?
There are 117.81 Females per 100 Males in Cattle Creek.
What is the Median Population Age in Cattle Creek?
Median Population Age in Cattle Creek is 42.4 Years.
What is the Average Family Size in Cattle Creek
Average Family Size in Cattle Creek is 2.8 People.
What is the Average Household Size in Cattle Creek
Average Household Size in Cattle Creek is 2.2 People.
How Large is the Labor Force in Cattle Creek?
There are 302 People in the Labor Forcein in Cattle Creek.
What is the Percentage of People in the Labor Force in Cattle Creek?
65.9% of People are in the Labor Force in Cattle Creek.
What is the Unemployment Rate in Cattle Creek?
Unemployment Rate in Cattle Creek is 3.3%.