Sterling, CO Map & Demographics
Sterling Map
Sterling Overview
$24,917
PER CAPITA INCOME
$68,036
AVG FAMILY INCOME
$44,556
AVG HOUSEHOLD INCOME
25.2%
WAGE / INCOME GAP [ % ]
74.8¢/ $1
WAGE / INCOME GAP [ $ ]
$11,140
FAMILY INCOME DEFICIT
0.41
INEQUALITY / GINI INDEX
13,466
TOTAL POPULATION
7,349
MALE POPULATION
6,117
FEMALE POPULATION
120.14
MALES / 100 FEMALES
83.24
FEMALES / 100 MALES
37.7
MEDIAN AGE
3.4
AVG FAMILY SIZE
2.4
AVG HOUSEHOLD SIZE
6,511
LABOR FORCE [ PEOPLE ]
57.8%
PERCENT IN LABOR FORCE
3.3%
UNEMPLOYMENT RATE
Sterling Zip Codes
Sterling Area Codes
Income in Sterling
Income Overview in Sterling
Per Capita Income in Sterling is $24,917, while median incomes of families and households are $68,036 and $44,556 respectively.
| Characteristic | Number | Measure |
| Per Capita Income | 13,466 | $24,917 |
| Median Family Income | 2,648 | $68,036 |
| Mean Family Income | 2,648 | $77,326 |
| Median Household Income | 5,041 | $44,556 |
| Mean Household Income | 5,041 | $60,230 |
| Income Deficit | 2,648 | $11,140 |
| Wage / Income Gap (%) | 13,466 | 25.19% |
| Wage / Income Gap ($) | 13,466 | 74.81¢ per $1 |
| Gini / Inequality Index | 13,466 | 0.41 |
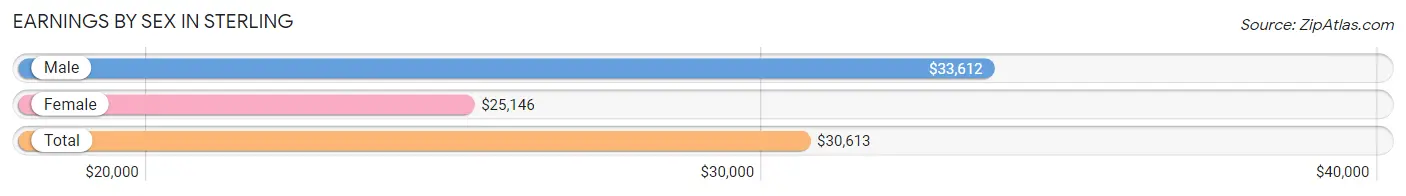
Earnings by Sex in Sterling
Average Earnings in Sterling are $30,613, $33,612 for men and $25,146 for women, a difference of 25.2%.
| Sex | Number | Average Earnings |
| Male | 3,879 (53.5%) | $33,612 |
| Female | 3,375 (46.5%) | $25,146 |
| Total | 7,254 (100.0%) | $30,613 |
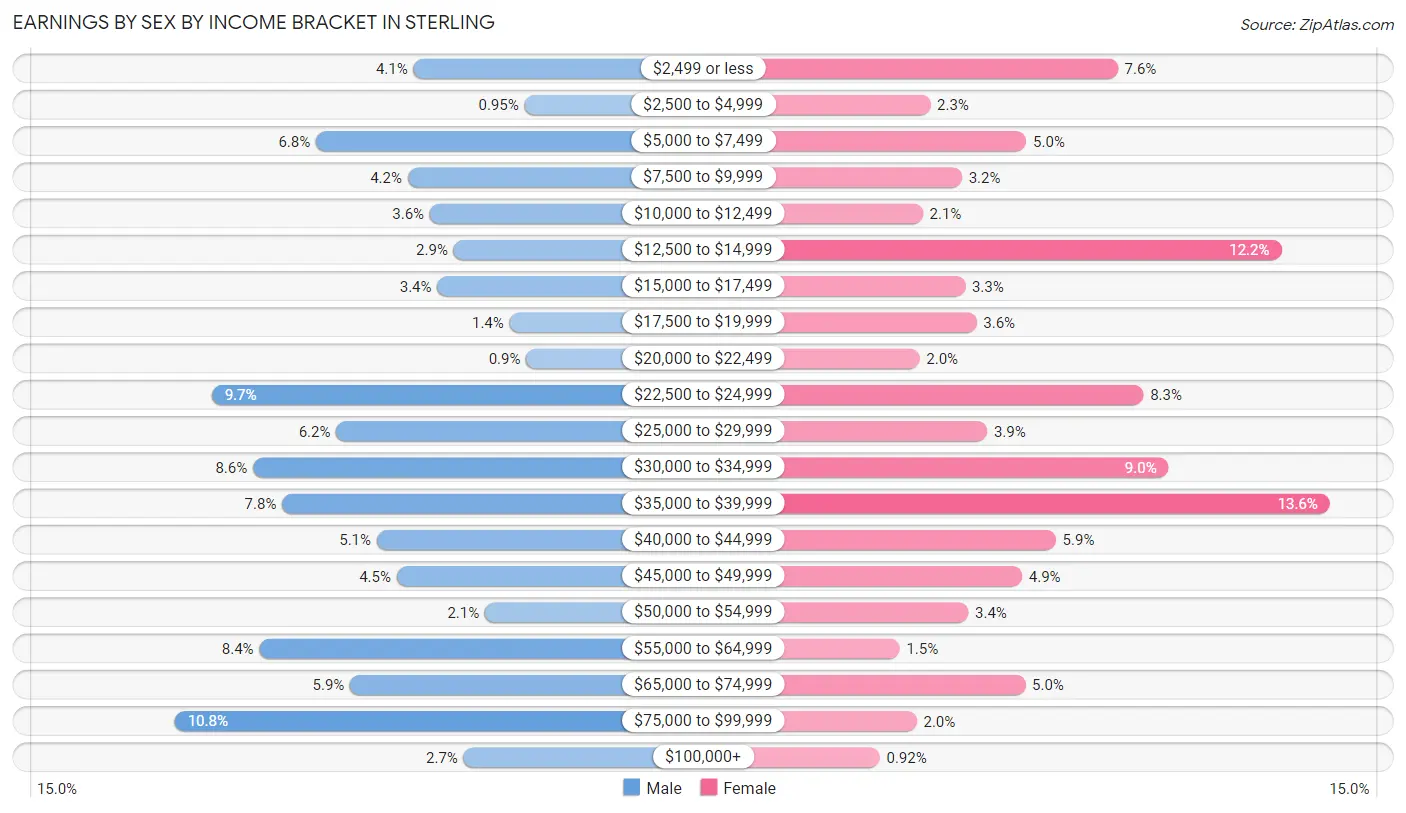
Earnings by Sex by Income Bracket in Sterling
The most common earnings brackets in Sterling are $75,000 to $99,999 for men (418 | 10.8%) and $35,000 to $39,999 for women (458 | 13.6%).
| Income | Male | Female |
| $2,499 or less | 158 (4.1%) | 257 (7.6%) |
| $2,500 to $4,999 | 37 (0.9%) | 79 (2.3%) |
| $5,000 to $7,499 | 264 (6.8%) | 170 (5.0%) |
| $7,500 to $9,999 | 164 (4.2%) | 109 (3.2%) |
| $10,000 to $12,499 | 140 (3.6%) | 72 (2.1%) |
| $12,500 to $14,999 | 114 (2.9%) | 412 (12.2%) |
| $15,000 to $17,499 | 132 (3.4%) | 112 (3.3%) |
| $17,500 to $19,999 | 53 (1.4%) | 123 (3.6%) |
| $20,000 to $22,499 | 35 (0.9%) | 69 (2.0%) |
| $22,500 to $24,999 | 378 (9.7%) | 281 (8.3%) |
| $25,000 to $29,999 | 242 (6.2%) | 133 (3.9%) |
| $30,000 to $34,999 | 333 (8.6%) | 305 (9.0%) |
| $35,000 to $39,999 | 301 (7.8%) | 458 (13.6%) |
| $40,000 to $44,999 | 198 (5.1%) | 198 (5.9%) |
| $45,000 to $49,999 | 176 (4.5%) | 166 (4.9%) |
| $50,000 to $54,999 | 80 (2.1%) | 115 (3.4%) |
| $55,000 to $64,999 | 326 (8.4%) | 50 (1.5%) |
| $65,000 to $74,999 | 227 (5.9%) | 169 (5.0%) |
| $75,000 to $99,999 | 418 (10.8%) | 66 (2.0%) |
| $100,000+ | 103 (2.7%) | 31 (0.9%) |
| Total | 3,879 (100.0%) | 3,375 (100.0%) |
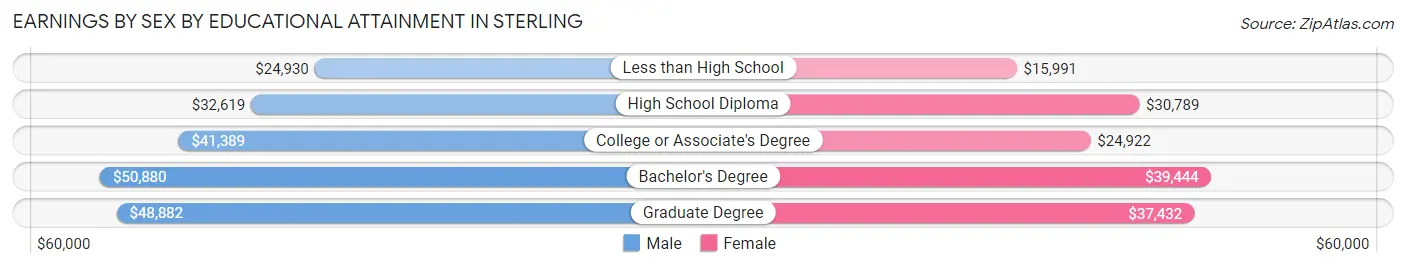
Earnings by Sex by Educational Attainment in Sterling
Average earnings in Sterling are $35,283 for men and $30,501 for women, a difference of 13.6%. Men with an educational attainment of bachelor's degree enjoy the highest average annual earnings of $50,880, while those with less than high school education earn the least with $24,930. Women with an educational attainment of bachelor's degree earn the most with the average annual earnings of $39,444, while those with less than high school education have the smallest earnings of $15,991.
| Educational Attainment | Male Income | Female Income |
| Less than High School | $24,930 | $15,991 |
| High School Diploma | $32,619 | $30,789 |
| College or Associate's Degree | $41,389 | $24,922 |
| Bachelor's Degree | $50,880 | $39,444 |
| Graduate Degree | $48,882 | $37,432 |
| Total | $35,283 | $30,501 |
Family Income in Sterling
Family Income Brackets in Sterling
According to the Sterling family income data, there are 524 families falling into the $75,000 to $99,999 income range, which is the most common income bracket and makes up 19.8% of all families. Conversely, the $10,000 to $14,999 income bracket is the least frequent group with only 13 families (0.5%) belonging to this category.
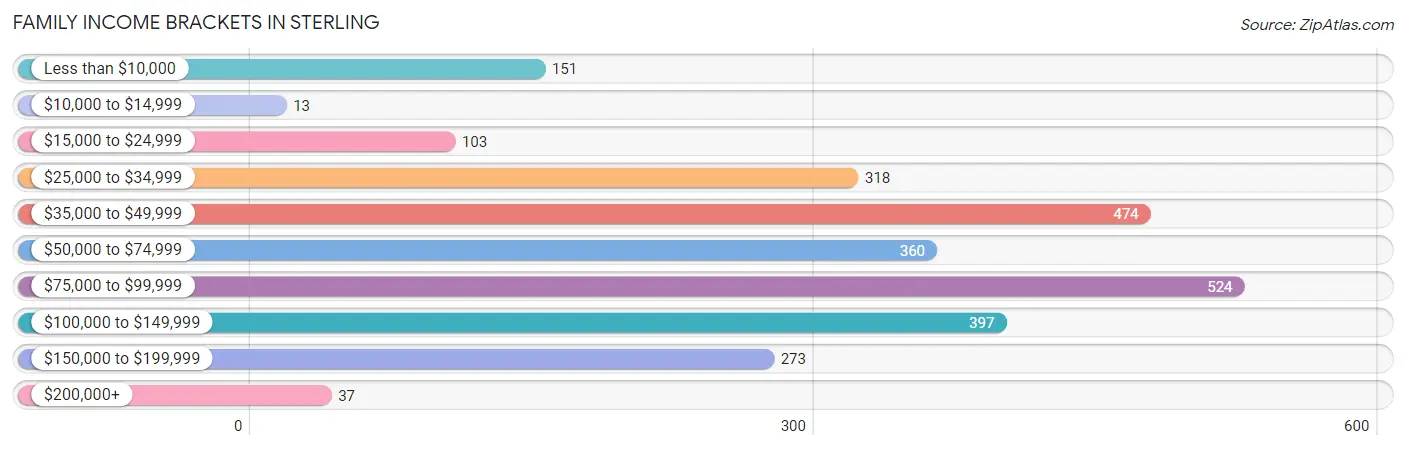
| Income Bracket | # Families | % Families |
| Less than $10,000 | 151 | 5.7% |
| $10,000 to $14,999 | 13 | 0.5% |
| $15,000 to $24,999 | 103 | 3.9% |
| $25,000 to $34,999 | 318 | 12.0% |
| $35,000 to $49,999 | 474 | 17.9% |
| $50,000 to $74,999 | 360 | 13.6% |
| $75,000 to $99,999 | 524 | 19.8% |
| $100,000 to $149,999 | 397 | 15.0% |
| $150,000 to $199,999 | 273 | 10.3% |
| $200,000+ | 37 | 1.4% |
Family Income by Famaliy Size in Sterling
5-person families (261 | 9.9%) account for the highest median family income in Sterling with $88,338 per family, while 3-person families (689 | 26.0%) have the highest median income of $27,197 per family member.
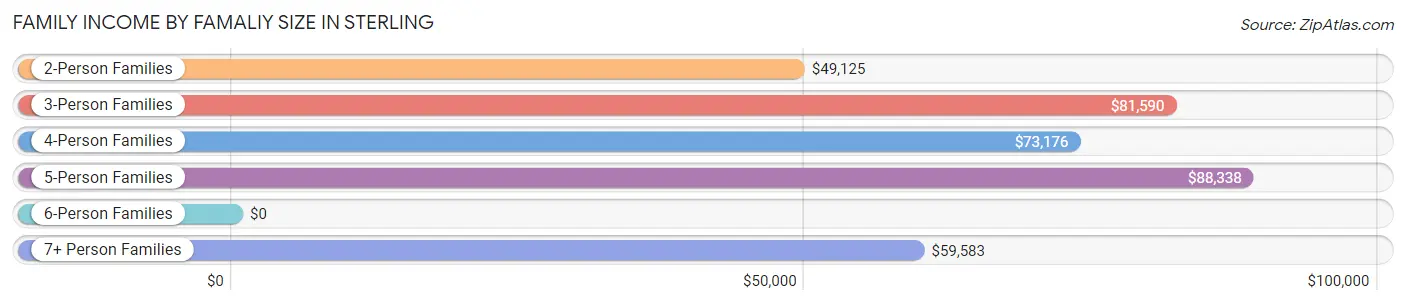
| Income Bracket | # Families | Median Income |
| 2-Person Families | 1,187 (44.8%) | $49,125 |
| 3-Person Families | 689 (26.0%) | $81,590 |
| 4-Person Families | 358 (13.5%) | $73,176 |
| 5-Person Families | 261 (9.9%) | $88,338 |
| 6-Person Families | 90 (3.4%) | $0 |
| 7+ Person Families | 63 (2.4%) | $59,583 |
| Total | 2,648 (100.0%) | $68,036 |
Family Income by Number of Earners in Sterling
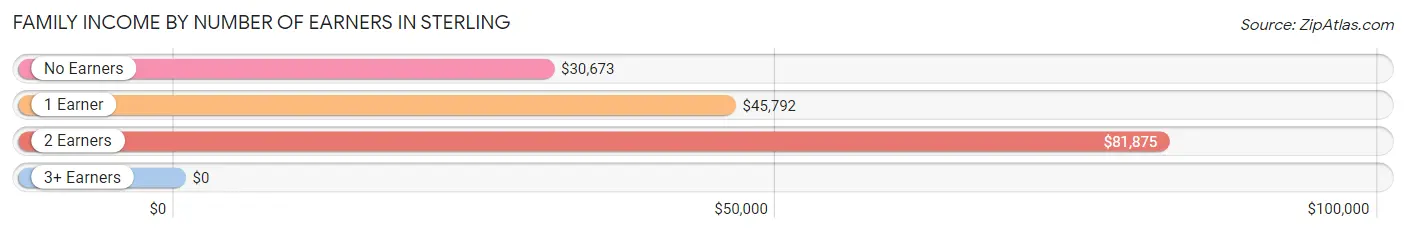
| Number of Earners | # Families | Median Income |
| No Earners | 371 (14.0%) | $30,673 |
| 1 Earner | 847 (32.0%) | $45,792 |
| 2 Earners | 1,034 (39.1%) | $81,875 |
| 3+ Earners | 396 (14.9%) | $0 |
| Total | 2,648 (100.0%) | $68,036 |
Household Income in Sterling
Household Income Brackets in Sterling
With 998 households falling in the category, the $35,000 to $49,999 income range is the most frequent in Sterling, accounting for 19.8% of all households. In contrast, only 45 households (0.9%) fall into the $200,000+ income bracket, making it the least populous group.
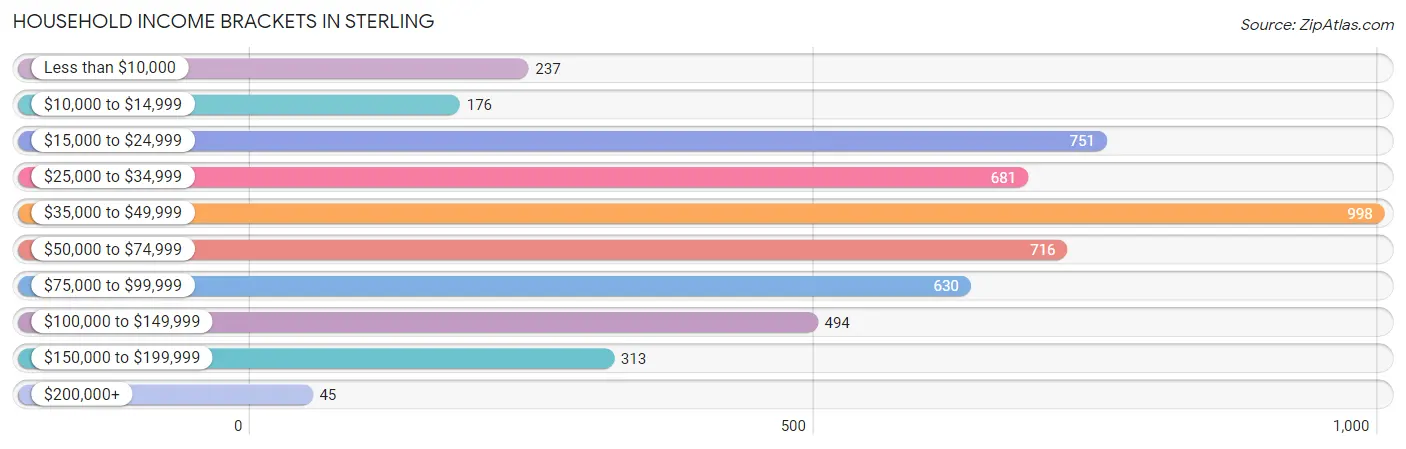
| Income Bracket | # Households | % Households |
| Less than $10,000 | 237 | 4.7% |
| $10,000 to $14,999 | 176 | 3.5% |
| $15,000 to $24,999 | 751 | 14.9% |
| $25,000 to $34,999 | 681 | 13.5% |
| $35,000 to $49,999 | 998 | 19.8% |
| $50,000 to $74,999 | 716 | 14.2% |
| $75,000 to $99,999 | 630 | 12.5% |
| $100,000 to $149,999 | 494 | 9.8% |
| $150,000 to $199,999 | 313 | 6.2% |
| $200,000+ | 45 | 0.9% |
Household Income by Householder Age in Sterling
The median household income in Sterling is $44,556, with the highest median household income of $55,383 found in the 25 to 44 years age bracket for the primary householder. A total of 1,805 households (35.8%) fall into this category. Meanwhile, the 65+ years age bracket for the primary householder has the lowest median household income of $39,308, with 1,689 households (33.5%) in this group.
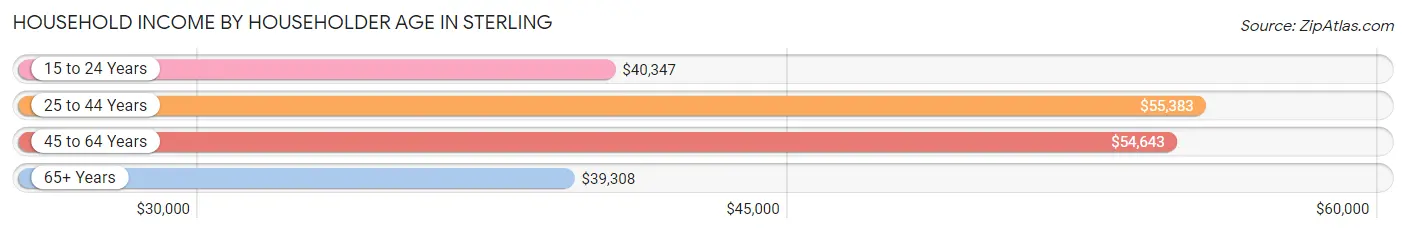
| Income Bracket | # Households | Median Income |
| 15 to 24 Years | 283 (5.6%) | $40,347 |
| 25 to 44 Years | 1,805 (35.8%) | $55,383 |
| 45 to 64 Years | 1,264 (25.1%) | $54,643 |
| 65+ Years | 1,689 (33.5%) | $39,308 |
| Total | 5,041 (100.0%) | $44,556 |
Poverty in Sterling
Income Below Poverty by Sex and Age in Sterling
With 14.1% poverty level for males and 12.1% for females among the residents of Sterling, 16 and 17 year old males and 25 to 34 year old females are the most vulnerable to poverty, with 26 males (46.4%) and 159 females (24.0%) in their respective age groups living below the poverty level.
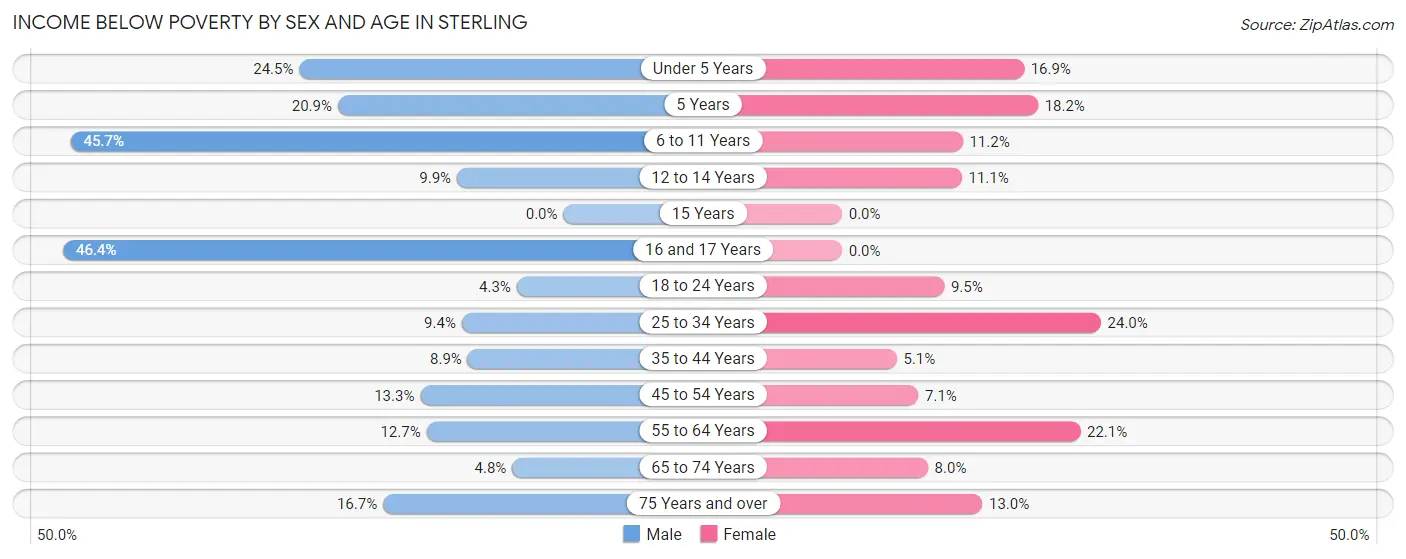
| Age Bracket | Male | Female |
| Under 5 Years | 88 (24.5%) | 52 (16.9%) |
| 5 Years | 27 (20.9%) | 14 (18.2%) |
| 6 to 11 Years | 214 (45.7%) | 27 (11.2%) |
| 12 to 14 Years | 17 (9.9%) | 28 (11.1%) |
| 15 Years | 0 (0.0%) | 0 (0.0%) |
| 16 and 17 Years | 26 (46.4%) | 0 (0.0%) |
| 18 to 24 Years | 10 (4.3%) | 62 (9.5%) |
| 25 to 34 Years | 132 (9.4%) | 159 (24.0%) |
| 35 to 44 Years | 74 (8.9%) | 45 (5.1%) |
| 45 to 54 Years | 102 (13.3%) | 40 (7.1%) |
| 55 to 64 Years | 78 (12.7%) | 153 (22.1%) |
| 65 to 74 Years | 32 (4.8%) | 57 (8.0%) |
| 75 Years and over | 74 (16.7%) | 78 (13.0%) |
| Total | 874 (14.1%) | 715 (12.1%) |
Income Above Poverty by Sex and Age in Sterling
According to the poverty statistics in Sterling, males aged 15 years and females aged 15 years are the age groups that are most secure financially, with 100.0% of males and 100.0% of females in these age groups living above the poverty line.
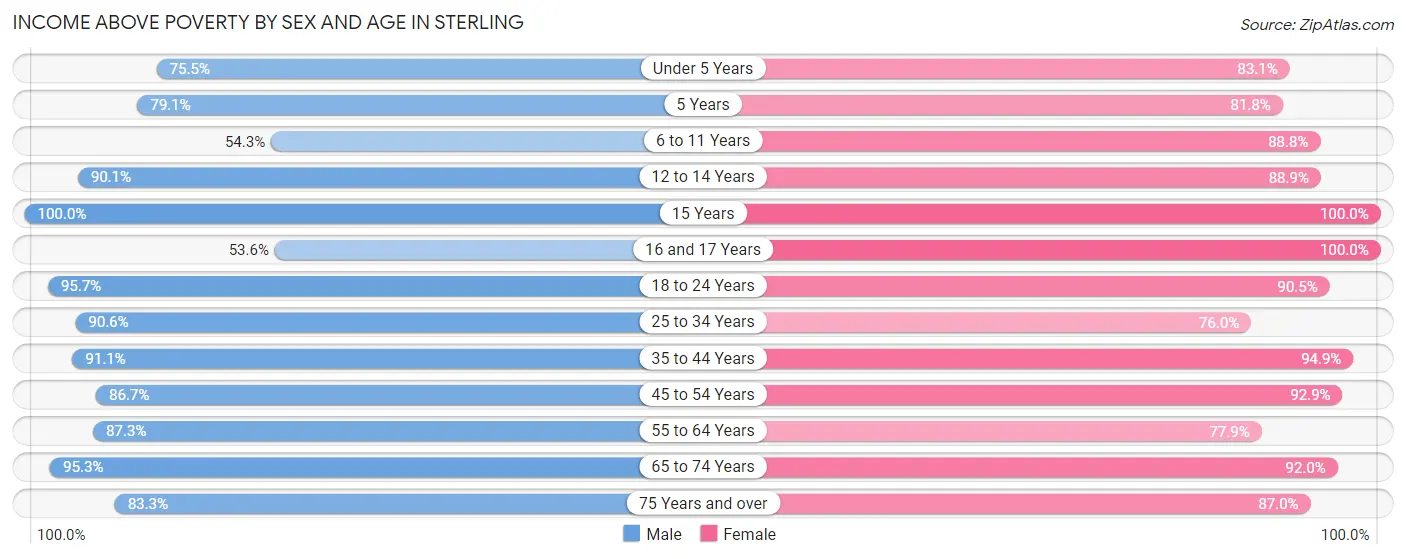
| Age Bracket | Male | Female |
| Under 5 Years | 271 (75.5%) | 256 (83.1%) |
| 5 Years | 102 (79.1%) | 63 (81.8%) |
| 6 to 11 Years | 254 (54.3%) | 214 (88.8%) |
| 12 to 14 Years | 155 (90.1%) | 224 (88.9%) |
| 15 Years | 71 (100.0%) | 110 (100.0%) |
| 16 and 17 Years | 30 (53.6%) | 141 (100.0%) |
| 18 to 24 Years | 221 (95.7%) | 592 (90.5%) |
| 25 to 34 Years | 1,268 (90.6%) | 503 (76.0%) |
| 35 to 44 Years | 759 (91.1%) | 840 (94.9%) |
| 45 to 54 Years | 666 (86.7%) | 525 (92.9%) |
| 55 to 64 Years | 536 (87.3%) | 539 (77.9%) |
| 65 to 74 Years | 641 (95.3%) | 658 (92.0%) |
| 75 Years and over | 368 (83.3%) | 521 (87.0%) |
| Total | 5,342 (85.9%) | 5,186 (87.9%) |
Income Below Poverty Among Married-Couple Families in Sterling
The poverty statistics for married-couple families in Sterling show that 8.1% or 149 of the total 1,830 families live below the poverty line. Families with 3 or 4 children have the highest poverty rate of 37.7%, comprising of 93 families. On the other hand, families with 1 or 2 children have the lowest poverty rate of 0.0%, which includes 0 families.
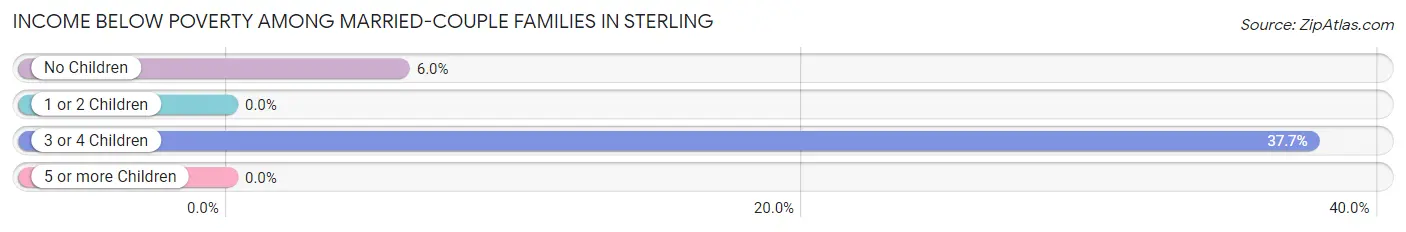
| Children | Above Poverty | Below Poverty |
| No Children | 880 (94.0%) | 56 (6.0%) |
| 1 or 2 Children | 625 (100.0%) | 0 (0.0%) |
| 3 or 4 Children | 154 (62.4%) | 93 (37.7%) |
| 5 or more Children | 22 (100.0%) | 0 (0.0%) |
| Total | 1,681 (91.9%) | 149 (8.1%) |
Income Below Poverty Among Single-Parent Households in Sterling
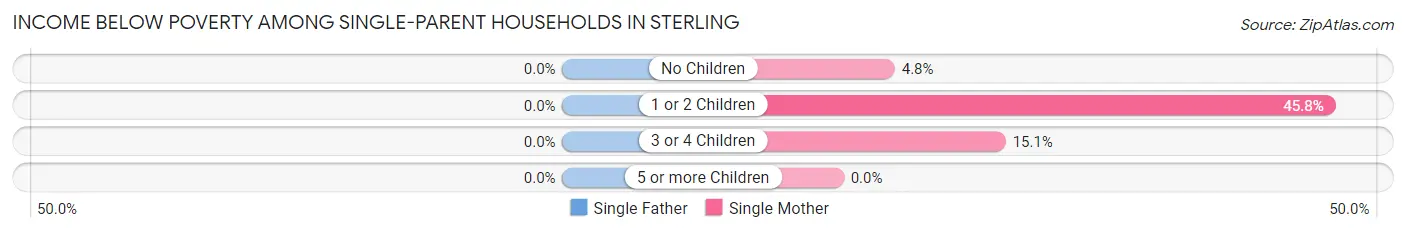
| Children | Single Father | Single Mother |
| No Children | 0 (0.0%) | 11 (4.8%) |
| 1 or 2 Children | 0 (0.0%) | 109 (45.8%) |
| 3 or 4 Children | 0 (0.0%) | 16 (15.1%) |
| 5 or more Children | 0 (0.0%) | 0 (0.0%) |
| Total | 0 (0.0%) | 136 (23.6%) |
Income Below Poverty Among Married-Couple vs Single-Parent Households in Sterling
The poverty data for Sterling shows that 149 of the married-couple family households (8.1%) and 136 of the single-parent households (16.6%) are living below the poverty level. Within the married-couple family households, those with 3 or 4 children have the highest poverty rate, with 93 households (37.7%) falling below the poverty line. Among the single-parent households, those with 1 or 2 children have the highest poverty rate, with 109 household (29.7%) living below poverty.
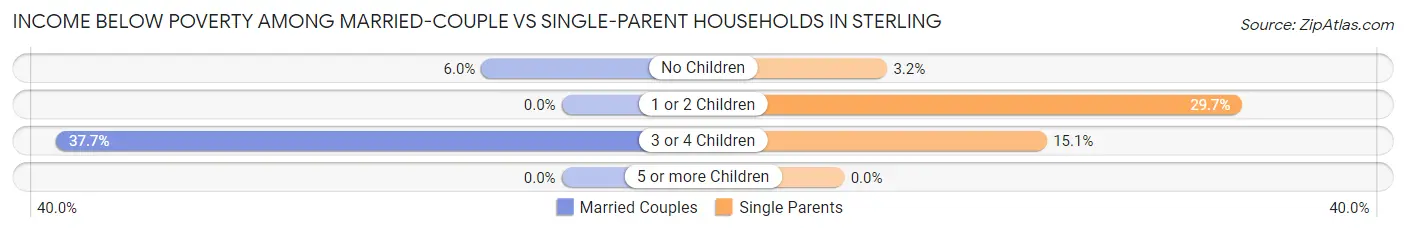
| Children | Married-Couple Families | Single-Parent Households |
| No Children | 56 (6.0%) | 11 (3.2%) |
| 1 or 2 Children | 0 (0.0%) | 109 (29.7%) |
| 3 or 4 Children | 93 (37.7%) | 16 (15.1%) |
| 5 or more Children | 0 (0.0%) | 0 (0.0%) |
| Total | 149 (8.1%) | 136 (16.6%) |
Race in Sterling
The most populous races in Sterling are White / Caucasian (10,492 | 77.9%), Hispanic or Latino (2,652 | 19.7%), and Two or more Races (1,776 | 13.2%).
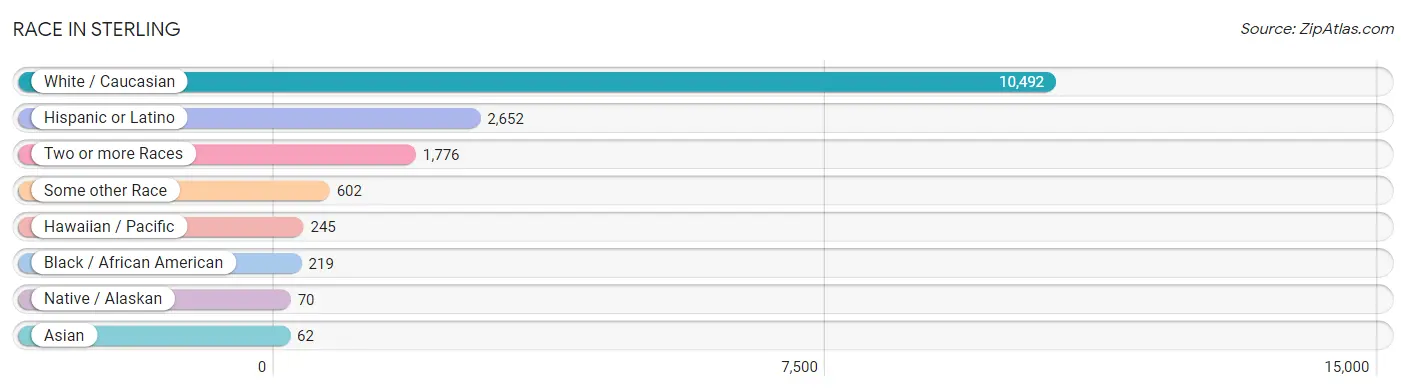
| Race | # Population | % Population |
| Asian | 62 | 0.5% |
| Black / African American | 219 | 1.6% |
| Hawaiian / Pacific | 245 | 1.8% |
| Hispanic or Latino | 2,652 | 19.7% |
| Native / Alaskan | 70 | 0.5% |
| White / Caucasian | 10,492 | 77.9% |
| Two or more Races | 1,776 | 13.2% |
| Some other Race | 602 | 4.5% |
| Total | 13,466 | 100.0% |
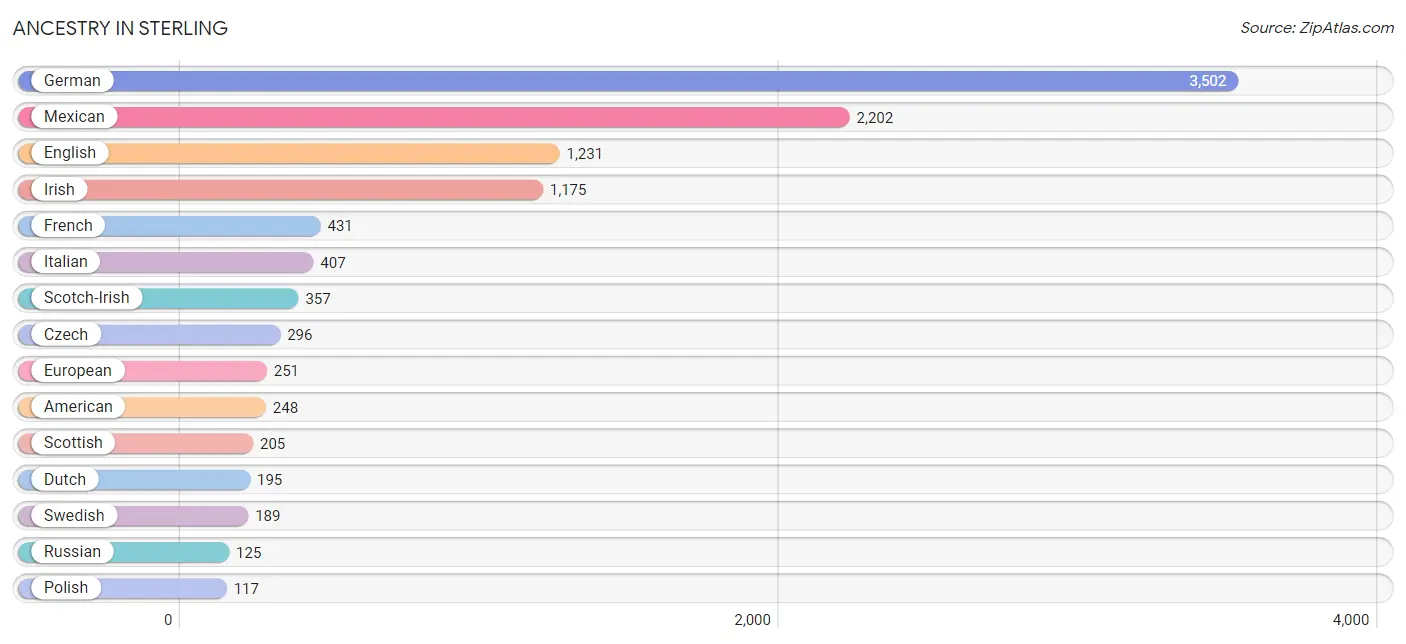
Ancestry in Sterling
The most populous ancestries reported in Sterling are German (3,502 | 26.0%), Mexican (2,202 | 16.4%), English (1,231 | 9.1%), Irish (1,175 | 8.7%), and French (431 | 3.2%), together accounting for 63.4% of all Sterling residents.
| Ancestry | # Population | % Population |
| Alaskan Athabascan | 11 | 0.1% |
| American | 248 | 1.8% |
| Arab | 12 | 0.1% |
| Australian | 9 | 0.1% |
| Austrian | 8 | 0.1% |
| Belgian | 12 | 0.1% |
| Belizean | 9 | 0.1% |
| Bhutanese | 98 | 0.7% |
| Brazilian | 9 | 0.1% |
| British | 10 | 0.1% |
| Bulgarian | 11 | 0.1% |
| Burmese | 29 | 0.2% |
| Canadian | 36 | 0.3% |
| Celtic | 13 | 0.1% |
| Central American | 2 | 0.0% |
| Cherokee | 106 | 0.8% |
| Czech | 296 | 2.2% |
| Czechoslovakian | 6 | 0.0% |
| Danish | 75 | 0.6% |
| Dutch | 195 | 1.5% |
| Dutch West Indian | 54 | 0.4% |
| Eastern European | 48 | 0.4% |
| Ecuadorian | 1 | 0.0% |
| English | 1,231 | 9.1% |
| European | 251 | 1.9% |
| Finnish | 15 | 0.1% |
| French | 431 | 3.2% |
| French Canadian | 21 | 0.2% |
| German | 3,502 | 26.0% |
| German Russian | 6 | 0.0% |
| Greek | 38 | 0.3% |
| Guatemalan | 2 | 0.0% |
| Hungarian | 45 | 0.3% |
| Indian (Asian) | 78 | 0.6% |
| Irish | 1,175 | 8.7% |
| Italian | 407 | 3.0% |
| Lebanese | 12 | 0.1% |
| Mexican | 2,202 | 16.4% |
| Navajo | 10 | 0.1% |
| Northern European | 24 | 0.2% |
| Norwegian | 38 | 0.3% |
| Polish | 117 | 0.9% |
| Portuguese | 9 | 0.1% |
| Puerto Rican | 69 | 0.5% |
| Russian | 125 | 0.9% |
| Scandinavian | 13 | 0.1% |
| Scotch-Irish | 357 | 2.6% |
| Scottish | 205 | 1.5% |
| South American | 1 | 0.0% |
| Spaniard | 4 | 0.0% |
| Subsaharan African | 55 | 0.4% |
| Sudanese | 55 | 0.4% |
| Swedish | 189 | 1.4% |
| Swiss | 37 | 0.3% |
| Ukrainian | 16 | 0.1% |
| Welsh | 52 | 0.4% | View All 56 Rows |
Immigrants in Sterling
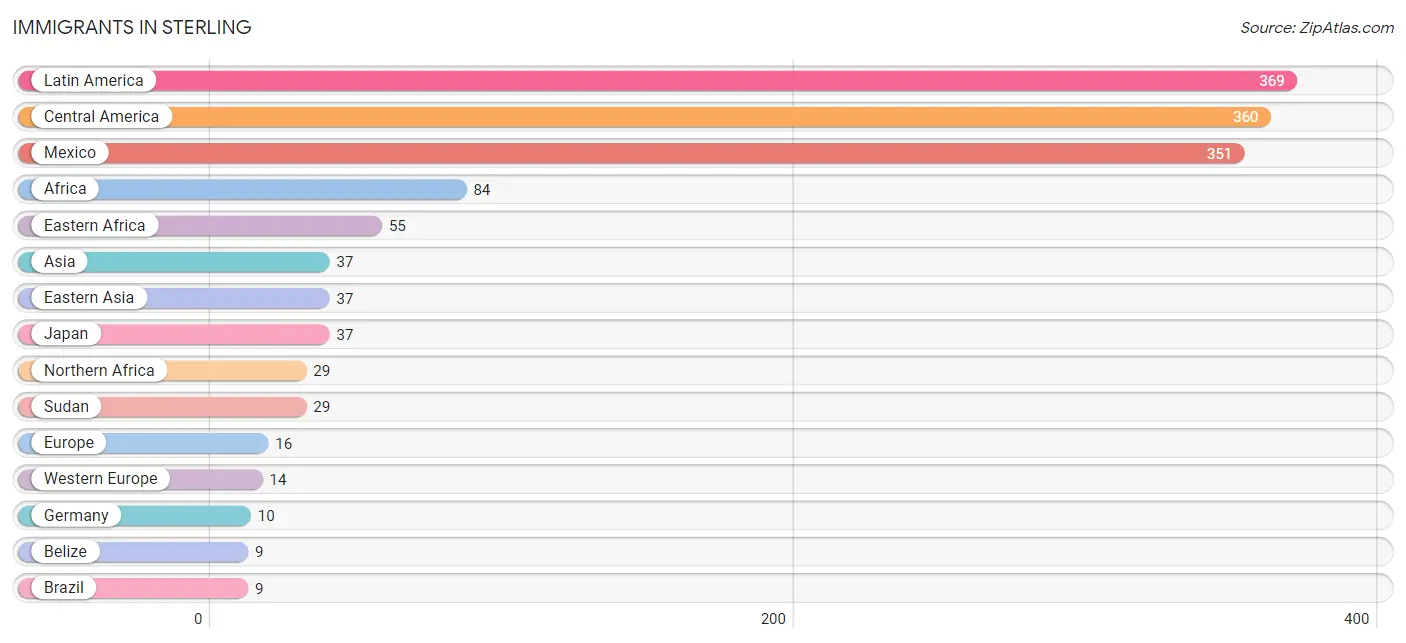
The most numerous immigrant groups reported in Sterling came from Latin America (369 | 2.7%), Central America (360 | 2.7%), Mexico (351 | 2.6%), Africa (84 | 0.6%), and Eastern Africa (55 | 0.4%), together accounting for 9.1% of all Sterling residents.
| Immigration Origin | # Population | % Population |
| Africa | 84 | 0.6% |
| Asia | 37 | 0.3% |
| Belize | 9 | 0.1% |
| Brazil | 9 | 0.1% |
| Central America | 360 | 2.7% |
| Eastern Africa | 55 | 0.4% |
| Eastern Asia | 37 | 0.3% |
| Europe | 16 | 0.1% |
| Germany | 10 | 0.1% |
| Italy | 2 | 0.0% |
| Japan | 37 | 0.3% |
| Latin America | 369 | 2.7% |
| Mexico | 351 | 2.6% |
| Netherlands | 2 | 0.0% |
| Northern Africa | 29 | 0.2% |
| South America | 9 | 0.1% |
| Southern Europe | 2 | 0.0% |
| Sudan | 29 | 0.2% |
| Switzerland | 2 | 0.0% |
| Western Europe | 14 | 0.1% | View All 20 Rows |
Sex and Age in Sterling
Sex and Age in Sterling
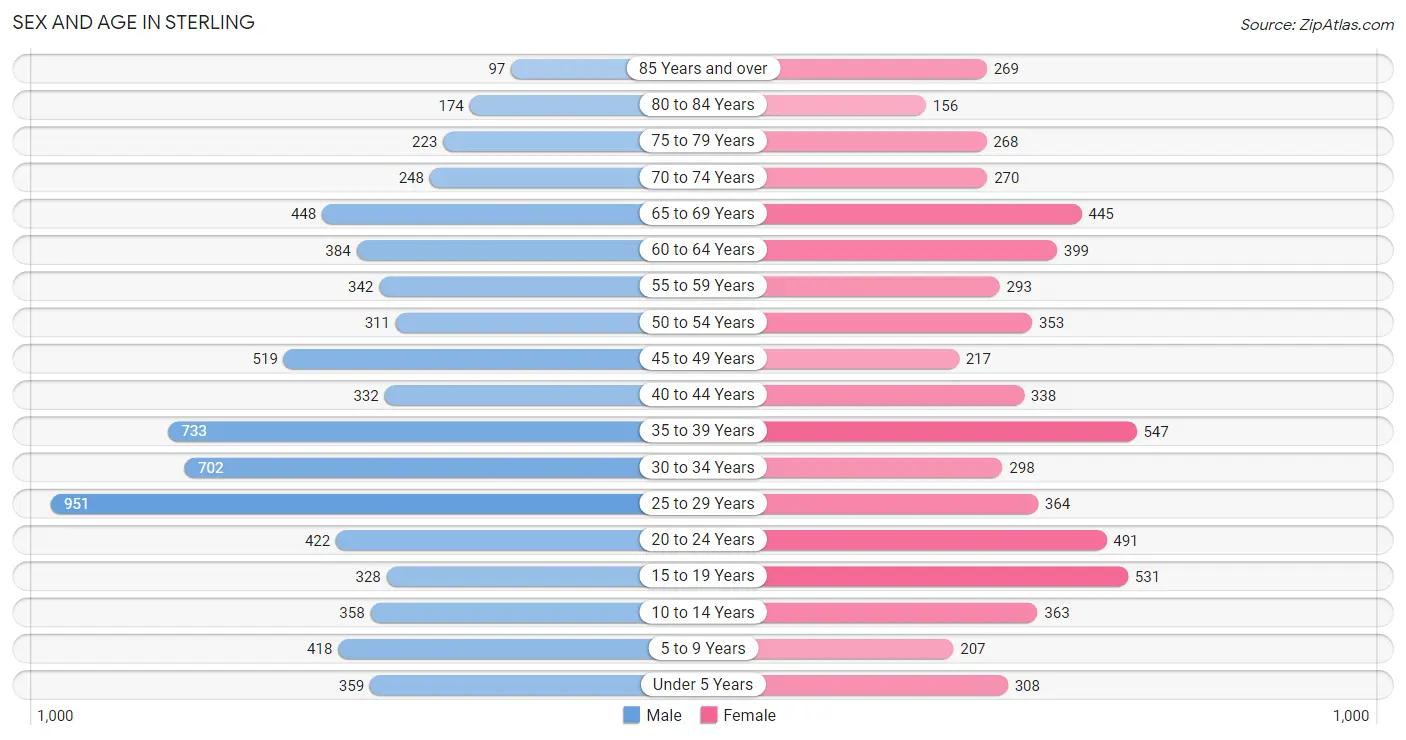
The most populous age groups in Sterling are 25 to 29 Years (951 | 12.9%) for men and 35 to 39 Years (547 | 8.9%) for women.
| Age Bracket | Male | Female |
| Under 5 Years | 359 (4.9%) | 308 (5.0%) |
| 5 to 9 Years | 418 (5.7%) | 207 (3.4%) |
| 10 to 14 Years | 358 (4.9%) | 363 (5.9%) |
| 15 to 19 Years | 328 (4.5%) | 531 (8.7%) |
| 20 to 24 Years | 422 (5.7%) | 491 (8.0%) |
| 25 to 29 Years | 951 (12.9%) | 364 (5.9%) |
| 30 to 34 Years | 702 (9.6%) | 298 (4.9%) |
| 35 to 39 Years | 733 (10.0%) | 547 (8.9%) |
| 40 to 44 Years | 332 (4.5%) | 338 (5.5%) |
| 45 to 49 Years | 519 (7.1%) | 217 (3.5%) |
| 50 to 54 Years | 311 (4.2%) | 353 (5.8%) |
| 55 to 59 Years | 342 (4.6%) | 293 (4.8%) |
| 60 to 64 Years | 384 (5.2%) | 399 (6.5%) |
| 65 to 69 Years | 448 (6.1%) | 445 (7.3%) |
| 70 to 74 Years | 248 (3.4%) | 270 (4.4%) |
| 75 to 79 Years | 223 (3.0%) | 268 (4.4%) |
| 80 to 84 Years | 174 (2.4%) | 156 (2.5%) |
| 85 Years and over | 97 (1.3%) | 269 (4.4%) |
| Total | 7,349 (100.0%) | 6,117 (100.0%) |
Families and Households in Sterling
Median Family Size in Sterling
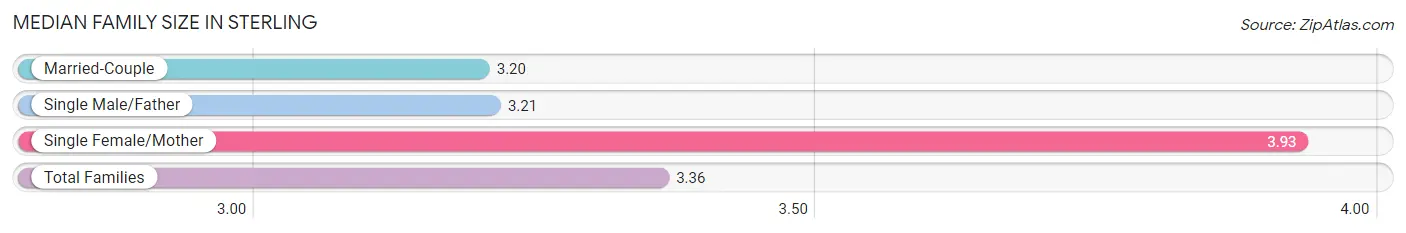
The median family size in Sterling is 3.36 persons per family, with single female/mother families (575 | 21.7%) accounting for the largest median family size of 3.93 persons per family. On the other hand, married-couple families (1,830 | 69.1%) represent the smallest median family size with 3.20 persons per family.
| Family Type | # Families | Family Size |
| Married-Couple | 1,830 (69.1%) | 3.20 |
| Single Male/Father | 243 (9.2%) | 3.21 |
| Single Female/Mother | 575 (21.7%) | 3.93 |
| Total Families | 2,648 (100.0%) | 3.36 |
Median Household Size in Sterling
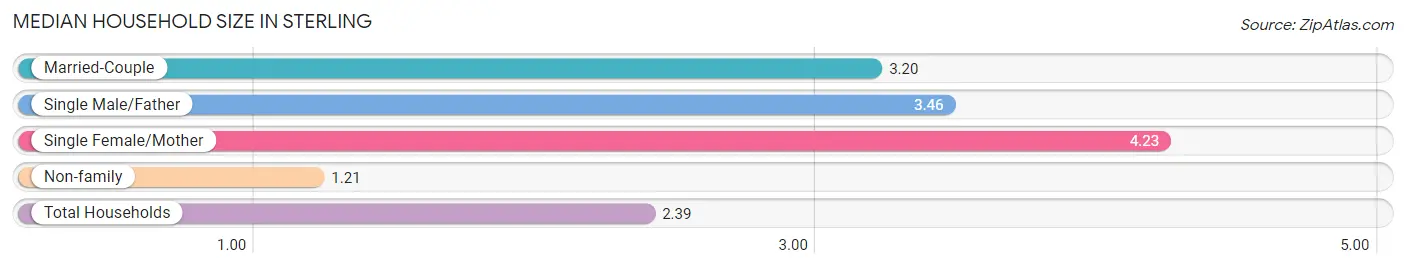
The median household size in Sterling is 2.39 persons per household, with single female/mother households (575 | 11.4%) accounting for the largest median household size of 4.23 persons per household. non-family households (2,393 | 47.5%) represent the smallest median household size with 1.21 persons per household.
| Household Type | # Households | Household Size |
| Married-Couple | 1,830 (36.3%) | 3.20 |
| Single Male/Father | 243 (4.8%) | 3.46 |
| Single Female/Mother | 575 (11.4%) | 4.23 |
| Non-family | 2,393 (47.5%) | 1.21 |
| Total Households | 5,041 (100.0%) | 2.39 |
Household Size by Marriage Status in Sterling
Out of a total of 5,041 households in Sterling, 2,648 (52.5%) are family households, while 2,393 (47.5%) are nonfamily households. The most numerous type of family households are 2-person households, comprising 1,145, and the most common type of nonfamily households are 1-person households, comprising 2,119.
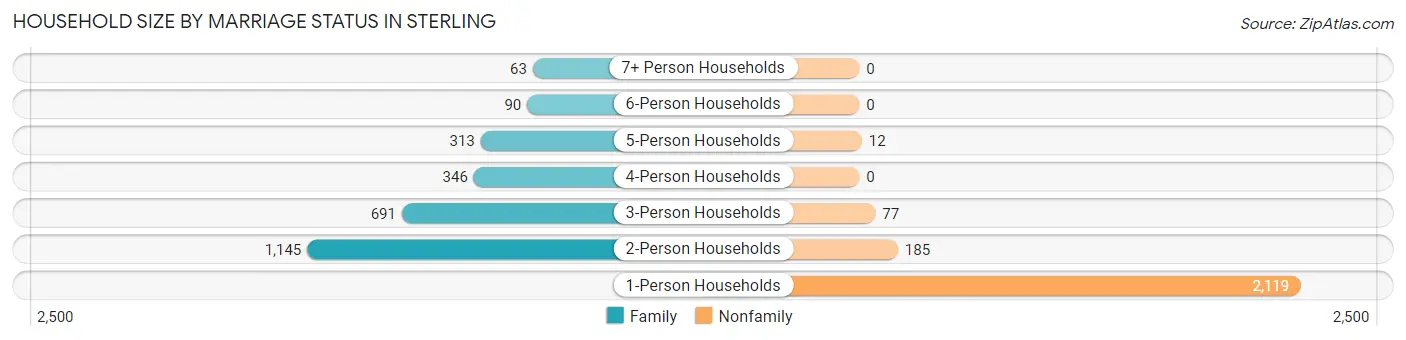
| Household Size | Family Households | Nonfamily Households |
| 1-Person Households | - | 2,119 (42.0%) |
| 2-Person Households | 1,145 (22.7%) | 185 (3.7%) |
| 3-Person Households | 691 (13.7%) | 77 (1.5%) |
| 4-Person Households | 346 (6.9%) | 0 (0.0%) |
| 5-Person Households | 313 (6.2%) | 12 (0.2%) |
| 6-Person Households | 90 (1.8%) | 0 (0.0%) |
| 7+ Person Households | 63 (1.3%) | 0 (0.0%) |
| Total | 2,648 (52.5%) | 2,393 (47.5%) |
Female Fertility in Sterling
Fertility by Age in Sterling
Average fertility rate in Sterling is 41.0 births per 1,000 women. Women in the age bracket of 20 to 34 years have the highest fertility rate with 98.0 births per 1,000 women. Women in the age bracket of 20 to 34 years acount for 97.4% of all women with births.
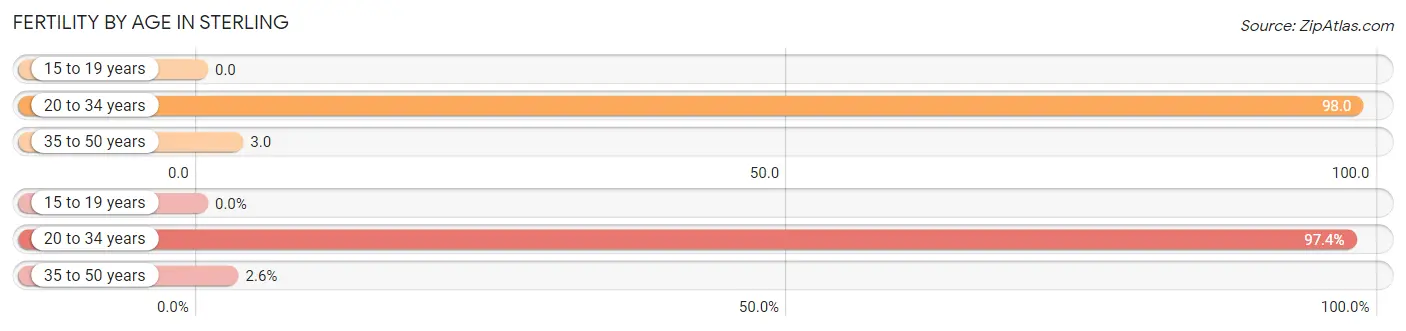
| Age Bracket | Women with Births | Births / 1,000 Women |
| 15 to 19 years | 0 (0.0%) | 0.0 |
| 20 to 34 years | 113 (97.4%) | 98.0 |
| 35 to 50 years | 3 (2.6%) | 3.0 |
| Total | 116 (100.0%) | 41.0 |
Fertility by Age by Marriage Status in Sterling
94.0% of women with births (116) in Sterling are married. The highest percentage of unmarried women with births falls into 35 to 50 years age bracket with 100.0% of them unmarried at the time of birth, while the lowest percentage of unmarried women with births belong to 20 to 34 years age bracket with 3.5% of them unmarried.
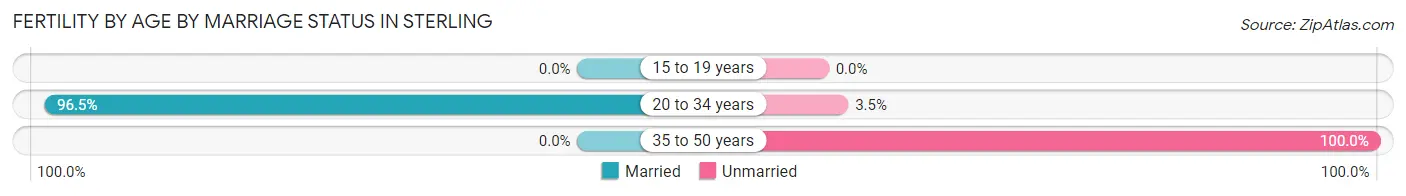
| Age Bracket | Married | Unmarried |
| 15 to 19 years | 0 (0.0%) | 0 (0.0%) |
| 20 to 34 years | 109 (96.5%) | 4 (3.5%) |
| 35 to 50 years | 0 (0.0%) | 3 (100.0%) |
| Total | 109 (94.0%) | 7 (6.0%) |
Fertility by Education in Sterling
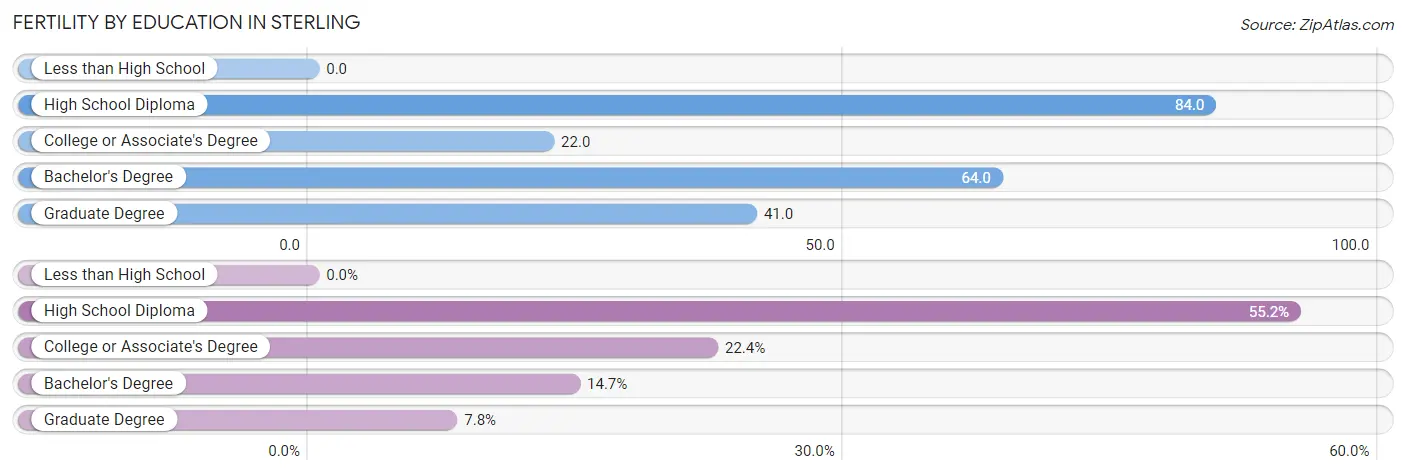
| Educational Attainment | Women with Births | Births / 1,000 Women |
| Less than High School | 0 (0.0%) | 0.0 |
| High School Diploma | 64 (55.2%) | 84.0 |
| College or Associate's Degree | 26 (22.4%) | 22.0 |
| Bachelor's Degree | 17 (14.7%) | 64.0 |
| Graduate Degree | 9 (7.8%) | 41.0 |
| Total | 116 (100.0%) | 41.0 |
Fertility by Education by Marriage Status in Sterling
6.0% of women with births in Sterling are unmarried. Women with the educational attainment of bachelor's degree are most likely to be married with 100.0% of them married at childbirth, while women with the educational attainment of college or associate's degree are least likely to be married with 11.5% of them unmarried at childbirth.
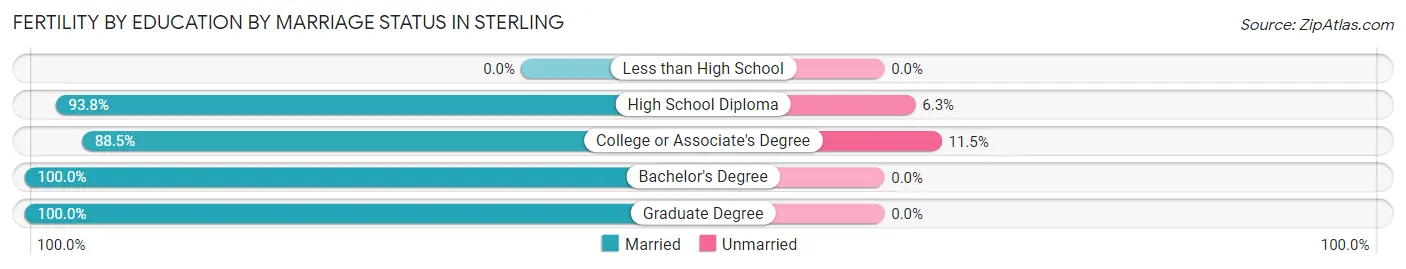
| Educational Attainment | Married | Unmarried |
| Less than High School | 0 (0.0%) | 0 (0.0%) |
| High School Diploma | 60 (93.8%) | 4 (6.2%) |
| College or Associate's Degree | 23 (88.5%) | 3 (11.5%) |
| Bachelor's Degree | 17 (100.0%) | 0 (0.0%) |
| Graduate Degree | 9 (100.0%) | 0 (0.0%) |
| Total | 109 (94.0%) | 7 (6.0%) |
Employment Characteristics in Sterling
Employment by Class of Employer in Sterling
Among the 6,157 employed individuals in Sterling, private company employees (3,981 | 64.7%), state government employees (771 | 12.5%), and local government employees (683 | 11.1%) make up the most common classes of employment.
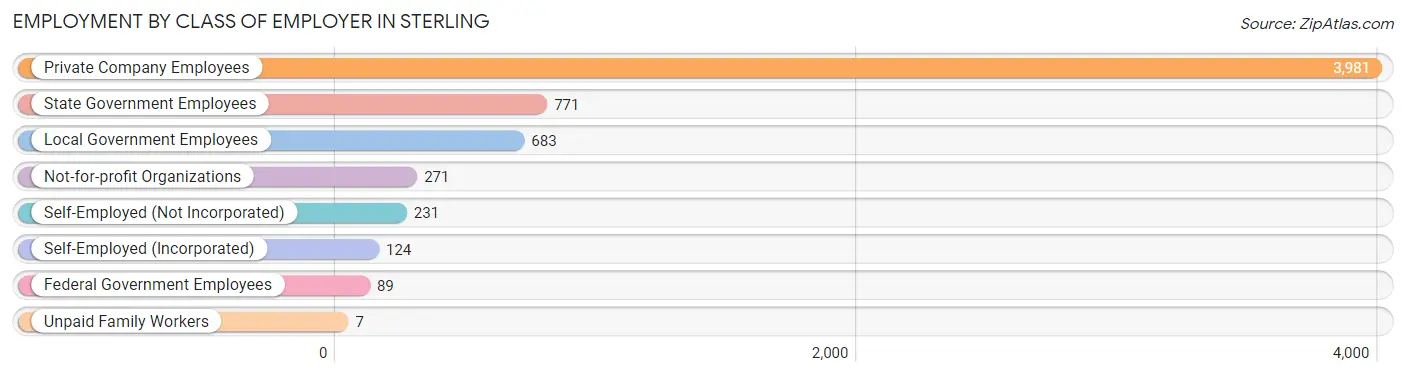
| Employer Class | # Employees | % Employees |
| Private Company Employees | 3,981 | 64.7% |
| Self-Employed (Incorporated) | 124 | 2.0% |
| Self-Employed (Not Incorporated) | 231 | 3.7% |
| Not-for-profit Organizations | 271 | 4.4% |
| Local Government Employees | 683 | 11.1% |
| State Government Employees | 771 | 12.5% |
| Federal Government Employees | 89 | 1.5% |
| Unpaid Family Workers | 7 | 0.1% |
| Total | 6,157 | 100.0% |
Employment Status by Age in Sterling
According to the labor force statistics for Sterling, out of the total population over 16 years of age (11,265), 57.8% or 6,511 individuals are in the labor force, with 3.3% or 215 of them unemployed. The age group with the highest labor force participation rate is 20 to 24 years, with 76.9% or 702 individuals in the labor force. Within the labor force, the 75 years and over age range has the highest percentage of unemployed individuals, with 10.0% or 14 of them being unemployed.
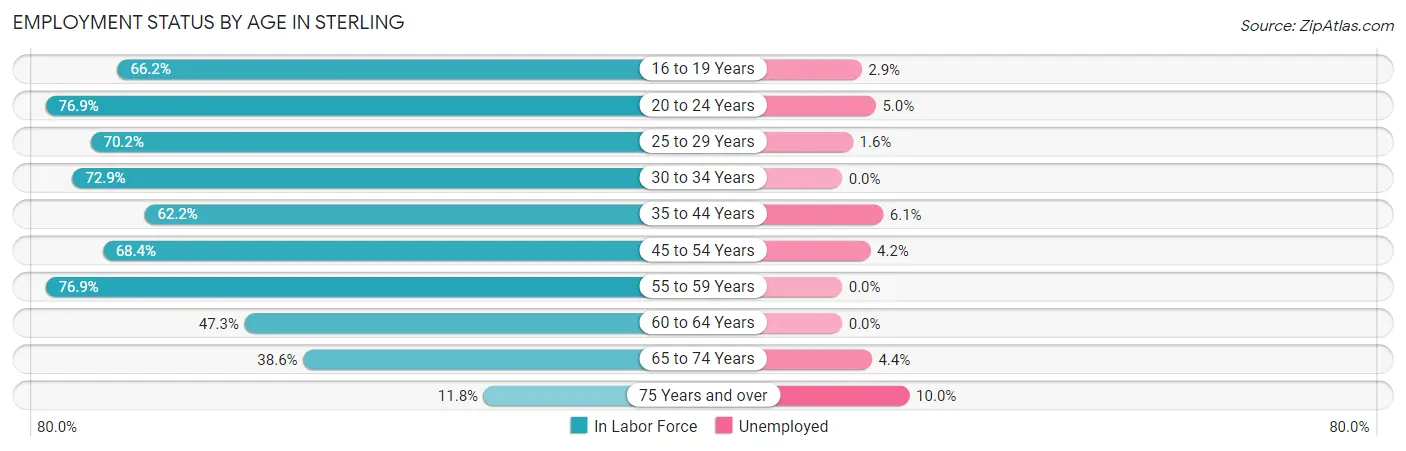
| Age Bracket | In Labor Force | Unemployed |
| 16 to 19 Years | 444 (66.2%) | 13 (2.9%) |
| 20 to 24 Years | 702 (76.9%) | 35 (5.0%) |
| 25 to 29 Years | 923 (70.2%) | 15 (1.6%) |
| 30 to 34 Years | 729 (72.9%) | 0 (0.0%) |
| 35 to 44 Years | 1,213 (62.2%) | 74 (6.1%) |
| 45 to 54 Years | 958 (68.4%) | 40 (4.2%) |
| 55 to 59 Years | 488 (76.9%) | 0 (0.0%) |
| 60 to 64 Years | 370 (47.3%) | 0 (0.0%) |
| 65 to 74 Years | 545 (38.6%) | 24 (4.4%) |
| 75 Years and over | 140 (11.8%) | 14 (10.0%) |
| Total | 6,511 (57.8%) | 215 (3.3%) |
Employment Status by Educational Attainment in Sterling
According to labor force statistics for Sterling, 66.1% of individuals (4,682) out of the total population between 25 and 64 years of age (7,083) are in the labor force, with 2.8% or 131 of them being unemployed. The group with the highest labor force participation rate are those with the educational attainment of bachelor's degree or higher, with 90.9% or 897 individuals in the labor force. Within the labor force, individuals with bachelor's degree or higher education have the highest percentage of unemployment, with 6.7% or 60 of them being unemployed.
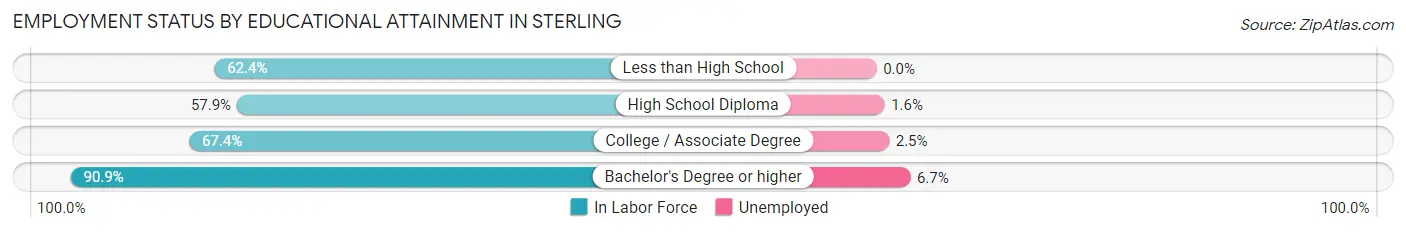
| Educational Attainment | In Labor Force | Unemployed |
| Less than High School | 451 (62.4%) | 0 (0.0%) |
| High School Diploma | 1,761 (57.9%) | 49 (1.6%) |
| College / Associate Degree | 1,572 (67.4%) | 58 (2.5%) |
| Bachelor's Degree or higher | 897 (90.9%) | 66 (6.7%) |
| Total | 4,682 (66.1%) | 198 (2.8%) |
Employment Occupations by Sex in Sterling
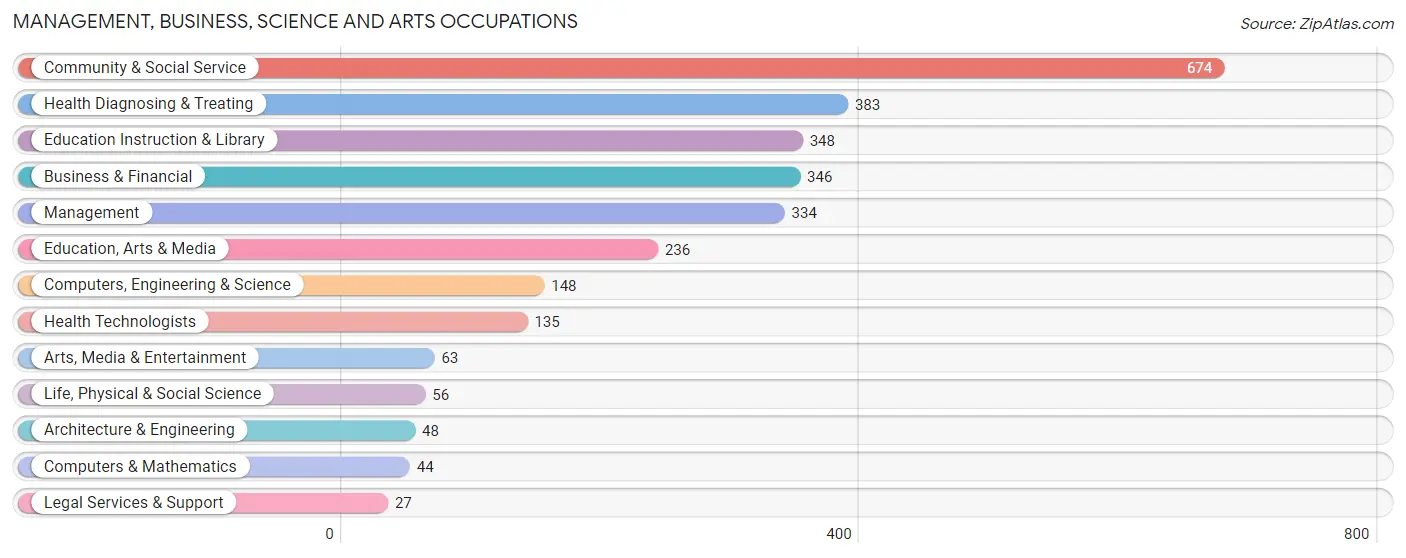
Management, Business, Science and Arts Occupations
The most common Management, Business, Science and Arts occupations in Sterling are Community & Social Service (674 | 10.7%), Health Diagnosing & Treating (383 | 6.1%), Education Instruction & Library (348 | 5.5%), Business & Financial (346 | 5.5%), and Management (334 | 5.3%).
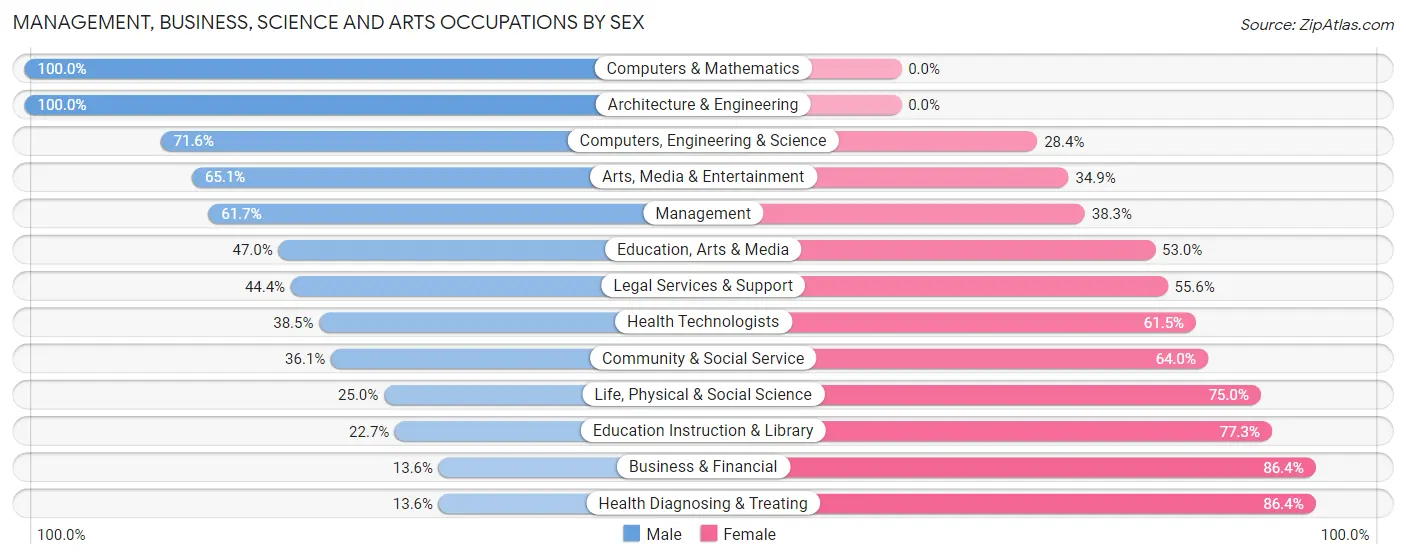
Management, Business, Science and Arts Occupations by Sex
Within the Management, Business, Science and Arts occupations in Sterling, the most male-oriented occupations are Computers & Mathematics (100.0%), Architecture & Engineering (100.0%), and Computers, Engineering & Science (71.6%), while the most female-oriented occupations are Business & Financial (86.4%), Health Diagnosing & Treating (86.4%), and Education Instruction & Library (77.3%).
| Occupation | Male | Female |
| Management | 206 (61.7%) | 128 (38.3%) |
| Business & Financial | 47 (13.6%) | 299 (86.4%) |
| Computers, Engineering & Science | 106 (71.6%) | 42 (28.4%) |
| Computers & Mathematics | 44 (100.0%) | 0 (0.0%) |
| Architecture & Engineering | 48 (100.0%) | 0 (0.0%) |
| Life, Physical & Social Science | 14 (25.0%) | 42 (75.0%) |
| Community & Social Service | 243 (36.0%) | 431 (63.9%) |
| Education, Arts & Media | 111 (47.0%) | 125 (53.0%) |
| Legal Services & Support | 12 (44.4%) | 15 (55.6%) |
| Education Instruction & Library | 79 (22.7%) | 269 (77.3%) |
| Arts, Media & Entertainment | 41 (65.1%) | 22 (34.9%) |
| Health Diagnosing & Treating | 52 (13.6%) | 331 (86.4%) |
| Health Technologists | 52 (38.5%) | 83 (61.5%) |
| Total (Category) | 654 (34.7%) | 1,231 (65.3%) |
| Total (Overall) | 3,309 (52.6%) | 2,987 (47.4%) |
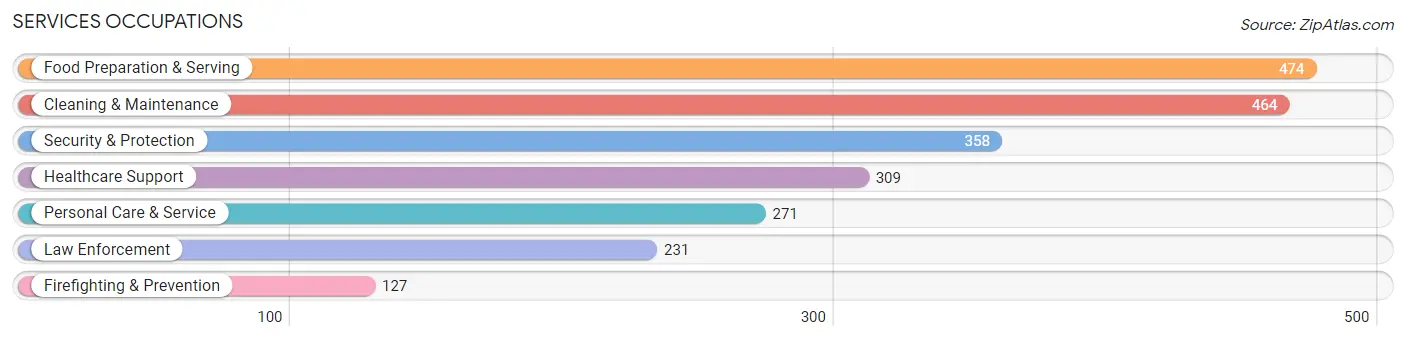
Services Occupations
The most common Services occupations in Sterling are Food Preparation & Serving (474 | 7.5%), Cleaning & Maintenance (464 | 7.4%), Security & Protection (358 | 5.7%), Healthcare Support (309 | 4.9%), and Personal Care & Service (271 | 4.3%).
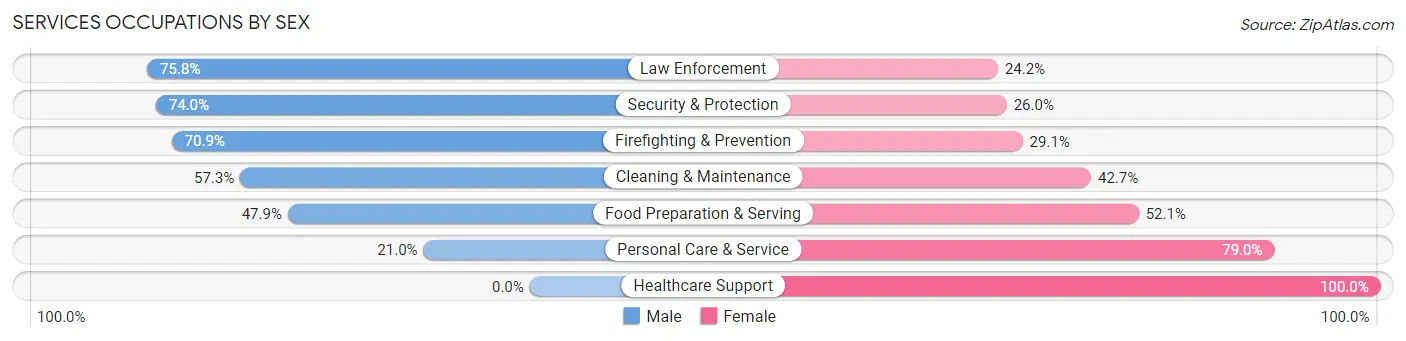
Services Occupations by Sex
Within the Services occupations in Sterling, the most male-oriented occupations are Law Enforcement (75.8%), Security & Protection (74.0%), and Firefighting & Prevention (70.9%), while the most female-oriented occupations are Healthcare Support (100.0%), Personal Care & Service (79.0%), and Food Preparation & Serving (52.1%).
| Occupation | Male | Female |
| Healthcare Support | 0 (0.0%) | 309 (100.0%) |
| Security & Protection | 265 (74.0%) | 93 (26.0%) |
| Firefighting & Prevention | 90 (70.9%) | 37 (29.1%) |
| Law Enforcement | 175 (75.8%) | 56 (24.2%) |
| Food Preparation & Serving | 227 (47.9%) | 247 (52.1%) |
| Cleaning & Maintenance | 266 (57.3%) | 198 (42.7%) |
| Personal Care & Service | 57 (21.0%) | 214 (79.0%) |
| Total (Category) | 815 (43.4%) | 1,061 (56.6%) |
| Total (Overall) | 3,309 (52.6%) | 2,987 (47.4%) |
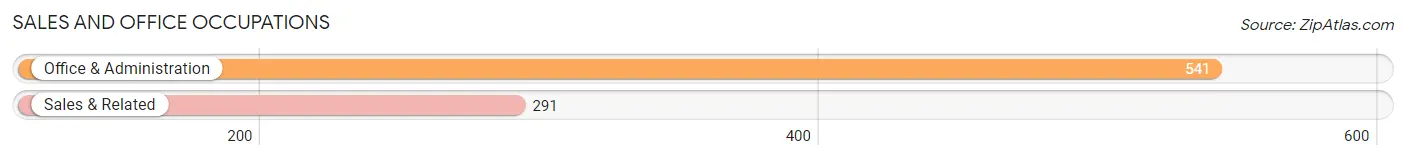
Sales and Office Occupations
The most common Sales and Office occupations in Sterling are Office & Administration (541 | 8.6%), and Sales & Related (291 | 4.6%).
Sales and Office Occupations by Sex
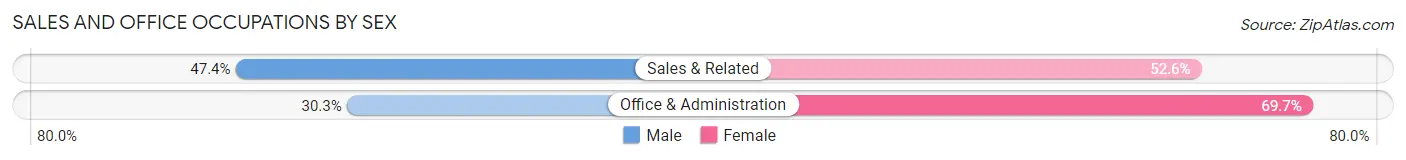
| Occupation | Male | Female |
| Sales & Related | 138 (47.4%) | 153 (52.6%) |
| Office & Administration | 164 (30.3%) | 377 (69.7%) |
| Total (Category) | 302 (36.3%) | 530 (63.7%) |
| Total (Overall) | 3,309 (52.6%) | 2,987 (47.4%) |
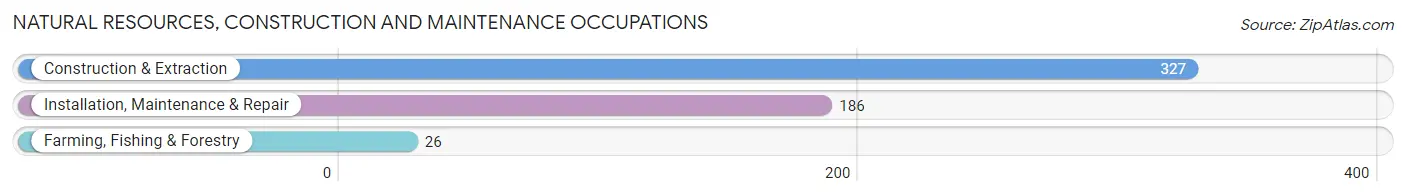
Natural Resources, Construction and Maintenance Occupations
The most common Natural Resources, Construction and Maintenance occupations in Sterling are Construction & Extraction (327 | 5.2%), Installation, Maintenance & Repair (186 | 2.9%), and Farming, Fishing & Forestry (26 | 0.4%).
Natural Resources, Construction and Maintenance Occupations by Sex
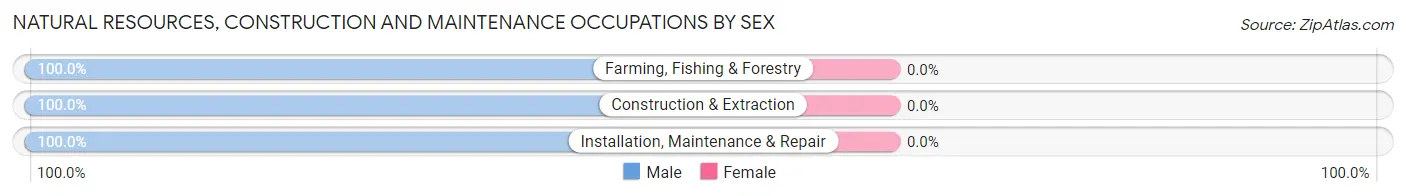
| Occupation | Male | Female |
| Farming, Fishing & Forestry | 26 (100.0%) | 0 (0.0%) |
| Construction & Extraction | 327 (100.0%) | 0 (0.0%) |
| Installation, Maintenance & Repair | 186 (100.0%) | 0 (0.0%) |
| Total (Category) | 539 (100.0%) | 0 (0.0%) |
| Total (Overall) | 3,309 (52.6%) | 2,987 (47.4%) |
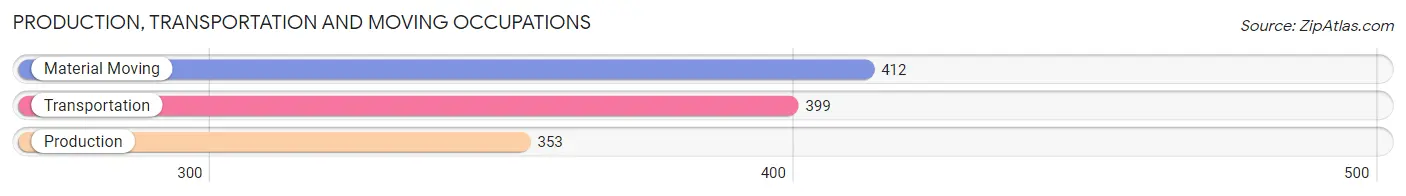
Production, Transportation and Moving Occupations
The most common Production, Transportation and Moving occupations in Sterling are Material Moving (412 | 6.5%), Transportation (399 | 6.3%), and Production (353 | 5.6%).
Production, Transportation and Moving Occupations by Sex
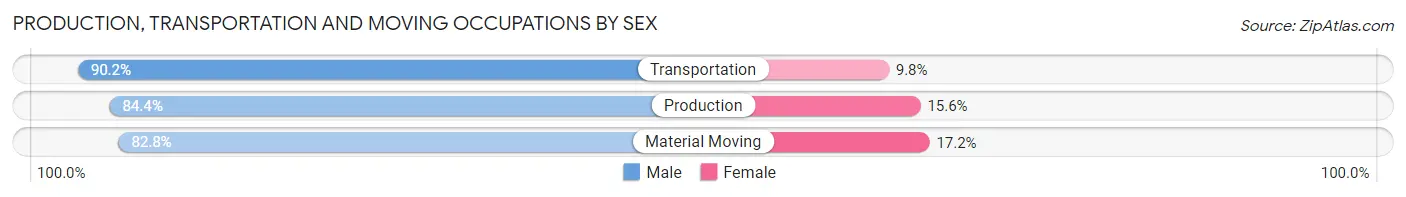
| Occupation | Male | Female |
| Production | 298 (84.4%) | 55 (15.6%) |
| Transportation | 360 (90.2%) | 39 (9.8%) |
| Material Moving | 341 (82.8%) | 71 (17.2%) |
| Total (Category) | 999 (85.8%) | 165 (14.2%) |
| Total (Overall) | 3,309 (52.6%) | 2,987 (47.4%) |
Employment Industries by Sex in Sterling
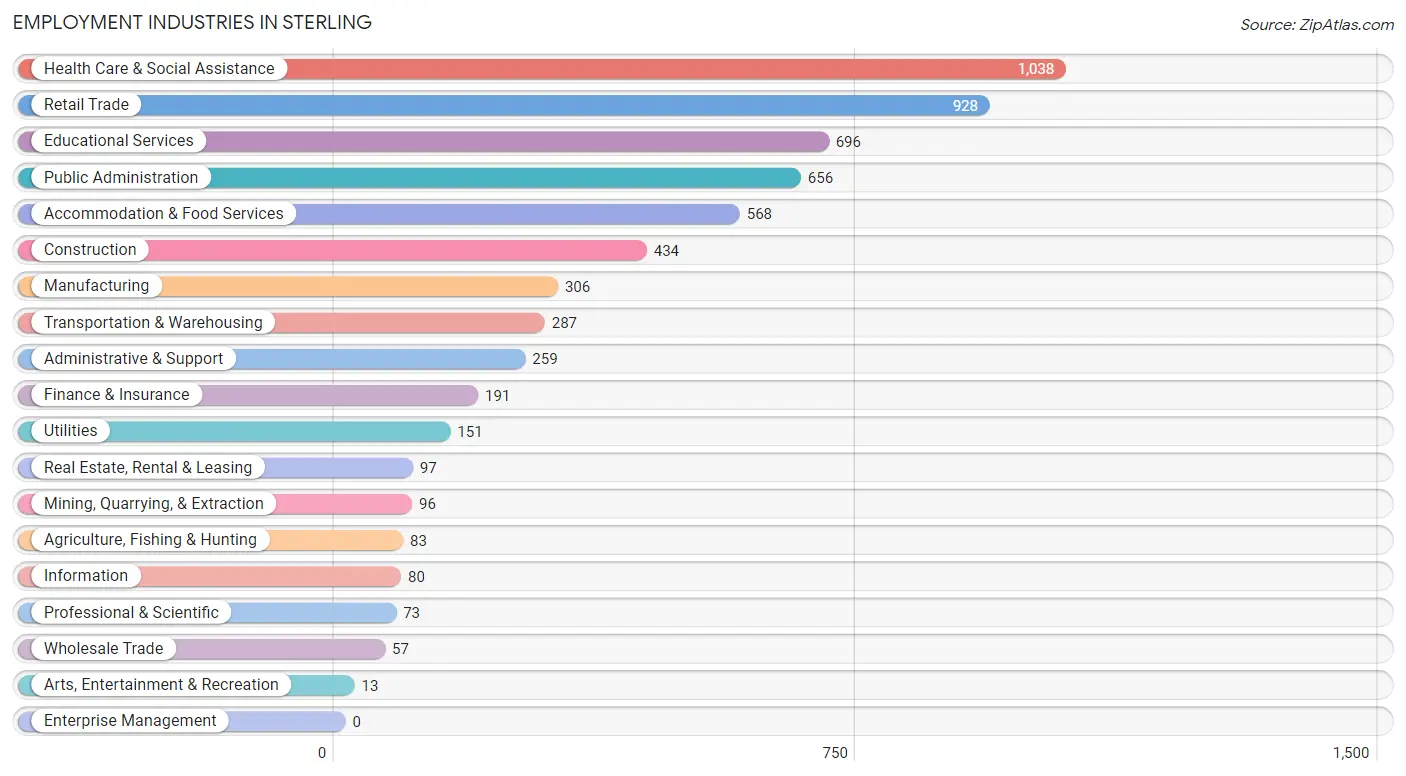
Employment Industries in Sterling
The major employment industries in Sterling include Health Care & Social Assistance (1,038 | 16.5%), Retail Trade (928 | 14.7%), Educational Services (696 | 11.1%), Public Administration (656 | 10.4%), and Accommodation & Food Services (568 | 9.0%).
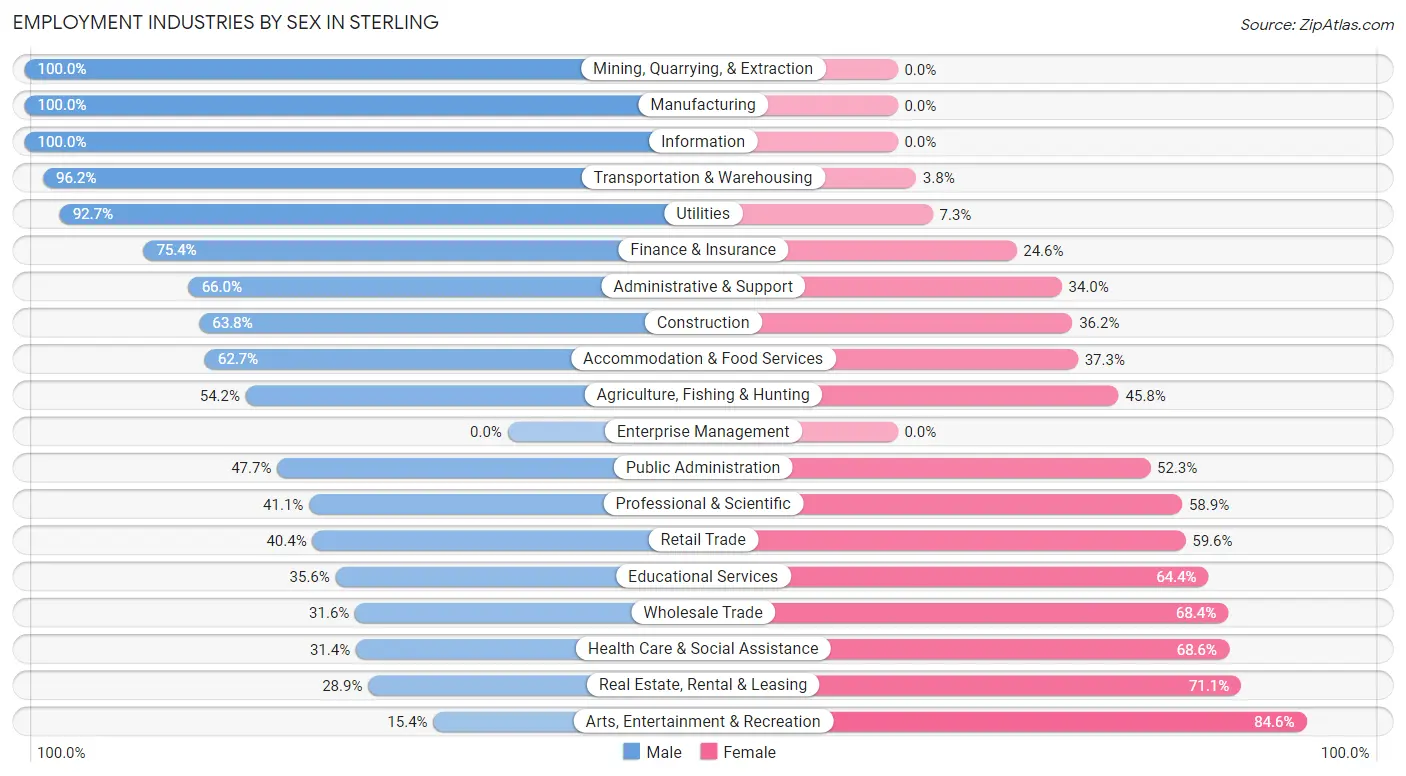
Employment Industries by Sex in Sterling
The Sterling industries that see more men than women are Mining, Quarrying, & Extraction (100.0%), Manufacturing (100.0%), and Information (100.0%), whereas the industries that tend to have a higher number of women are Arts, Entertainment & Recreation (84.6%), Real Estate, Rental & Leasing (71.1%), and Health Care & Social Assistance (68.6%).
| Industry | Male | Female |
| Agriculture, Fishing & Hunting | 45 (54.2%) | 38 (45.8%) |
| Mining, Quarrying, & Extraction | 96 (100.0%) | 0 (0.0%) |
| Construction | 277 (63.8%) | 157 (36.2%) |
| Manufacturing | 306 (100.0%) | 0 (0.0%) |
| Wholesale Trade | 18 (31.6%) | 39 (68.4%) |
| Retail Trade | 375 (40.4%) | 553 (59.6%) |
| Transportation & Warehousing | 276 (96.2%) | 11 (3.8%) |
| Utilities | 140 (92.7%) | 11 (7.3%) |
| Information | 80 (100.0%) | 0 (0.0%) |
| Finance & Insurance | 144 (75.4%) | 47 (24.6%) |
| Real Estate, Rental & Leasing | 28 (28.9%) | 69 (71.1%) |
| Professional & Scientific | 30 (41.1%) | 43 (58.9%) |
| Enterprise Management | 0 (0.0%) | 0 (0.0%) |
| Administrative & Support | 171 (66.0%) | 88 (34.0%) |
| Educational Services | 248 (35.6%) | 448 (64.4%) |
| Health Care & Social Assistance | 326 (31.4%) | 712 (68.6%) |
| Arts, Entertainment & Recreation | 2 (15.4%) | 11 (84.6%) |
| Accommodation & Food Services | 356 (62.7%) | 212 (37.3%) |
| Public Administration | 313 (47.7%) | 343 (52.3%) |
| Total | 3,309 (52.6%) | 2,987 (47.4%) |
Education in Sterling
School Enrollment in Sterling
The most common levels of schooling among the 2,374 students in Sterling are college / undergraduate (708 | 29.8%), middle school (524 | 22.1%), and high school (426 | 17.9%).
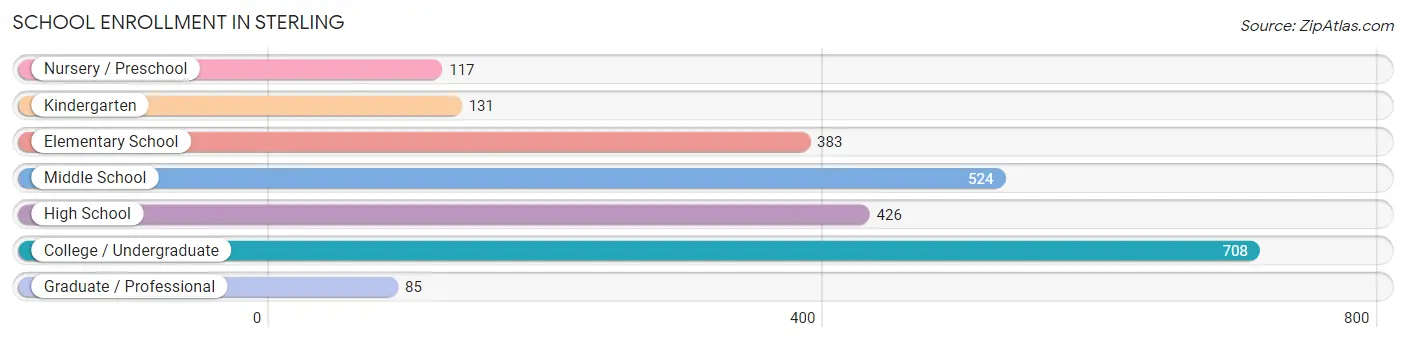
| School Level | # Students | % Students |
| Nursery / Preschool | 117 | 4.9% |
| Kindergarten | 131 | 5.5% |
| Elementary School | 383 | 16.1% |
| Middle School | 524 | 22.1% |
| High School | 426 | 17.9% |
| College / Undergraduate | 708 | 29.8% |
| Graduate / Professional | 85 | 3.6% |
| Total | 2,374 | 100.0% |
School Enrollment by Age by Funding Source in Sterling
Out of a total of 2,374 students who are enrolled in schools in Sterling, 150 (6.3%) attend a private institution, while the remaining 2,224 (93.7%) are enrolled in public schools. The age group of 3 to 4 year olds has the highest likelihood of being enrolled in private schools, with 25 (69.4% in the age bracket) enrolled. Conversely, the age group of 20 to 24 year olds has the lowest likelihood of being enrolled in a private school, with 289 (100.0% in the age bracket) attending a public institution.
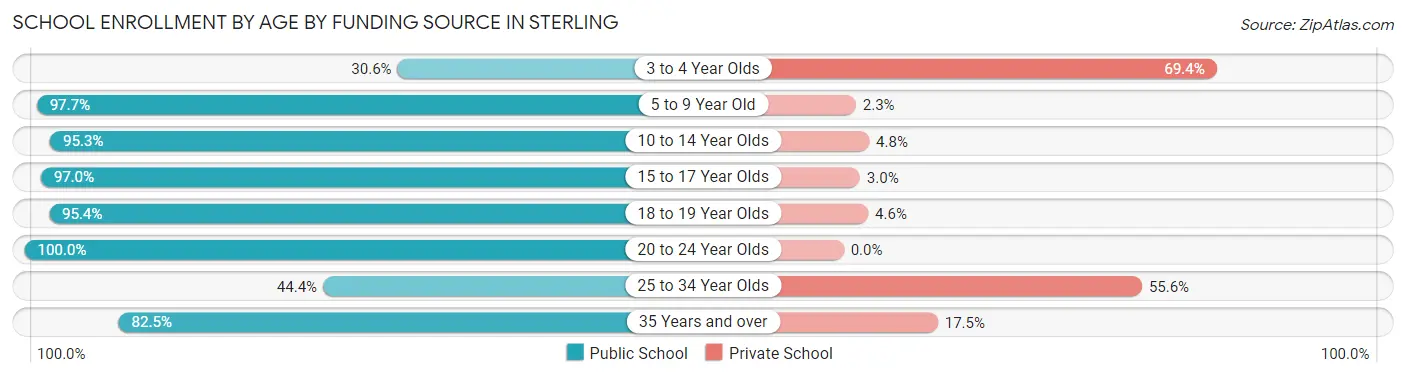
| Age Bracket | Public School | Private School |
| 3 to 4 Year Olds | 11 (30.6%) | 25 (69.4%) |
| 5 to 9 Year Old | 473 (97.7%) | 11 (2.3%) |
| 10 to 14 Year Olds | 601 (95.3%) | 30 (4.8%) |
| 15 to 17 Year Olds | 385 (97.0%) | 12 (3.0%) |
| 18 to 19 Year Olds | 314 (95.4%) | 15 (4.6%) |
| 20 to 24 Year Olds | 289 (100.0%) | 0 (0.0%) |
| 25 to 34 Year Olds | 24 (44.4%) | 30 (55.6%) |
| 35 Years and over | 127 (82.5%) | 27 (17.5%) |
| Total | 2,224 (93.7%) | 150 (6.3%) |
Educational Attainment by Field of Study in Sterling
Education (294 | 18.3%), business (267 | 16.6%), bio, nature & agricultural (194 | 12.1%), science & technology (152 | 9.5%), and social sciences (151 | 9.4%) are the most common fields of study among 1,605 individuals in Sterling who have obtained a bachelor's degree or higher.
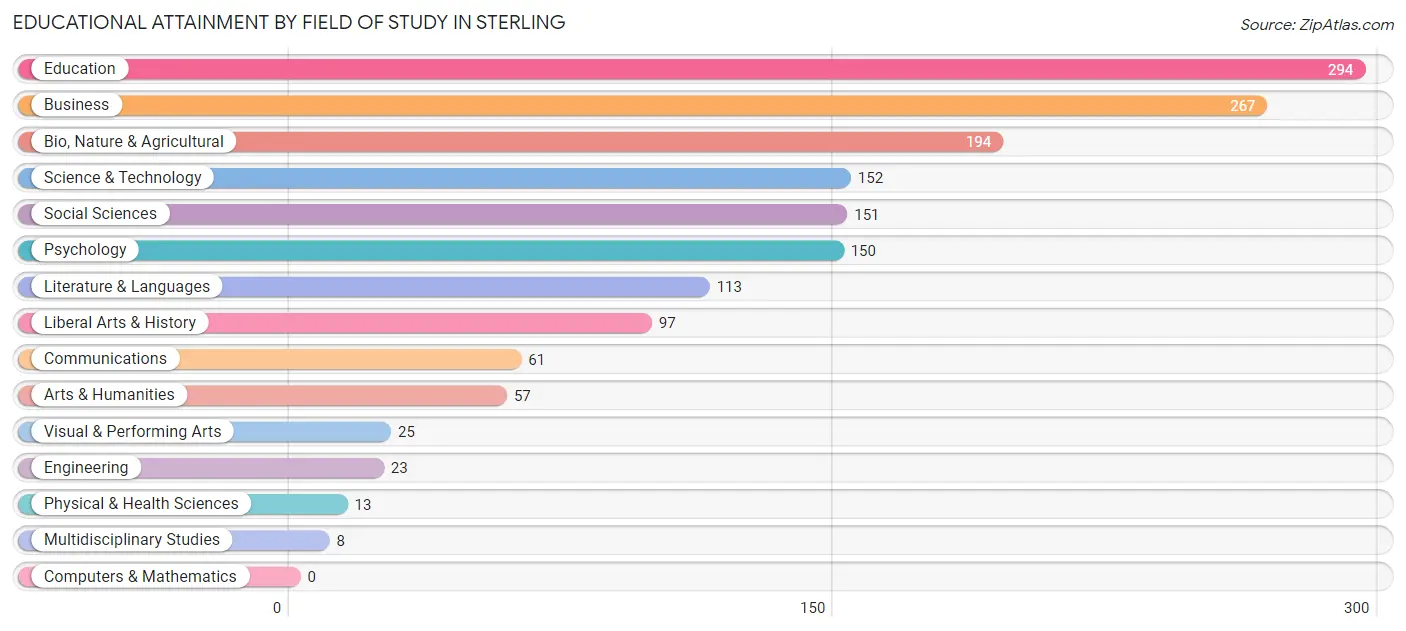
| Field of Study | # Graduates | % Graduates |
| Computers & Mathematics | 0 | 0.0% |
| Bio, Nature & Agricultural | 194 | 12.1% |
| Physical & Health Sciences | 13 | 0.8% |
| Psychology | 150 | 9.3% |
| Social Sciences | 151 | 9.4% |
| Engineering | 23 | 1.4% |
| Multidisciplinary Studies | 8 | 0.5% |
| Science & Technology | 152 | 9.5% |
| Business | 267 | 16.6% |
| Education | 294 | 18.3% |
| Literature & Languages | 113 | 7.0% |
| Liberal Arts & History | 97 | 6.0% |
| Visual & Performing Arts | 25 | 1.6% |
| Communications | 61 | 3.8% |
| Arts & Humanities | 57 | 3.5% |
| Total | 1,605 | 100.0% |
Transportation & Commute in Sterling
Vehicle Availability by Sex in Sterling
The most prevalent vehicle ownership categories in Sterling are males with 2 vehicles (1,314, accounting for 41.9%) and females with 2 vehicles (706, making up 47.2%).
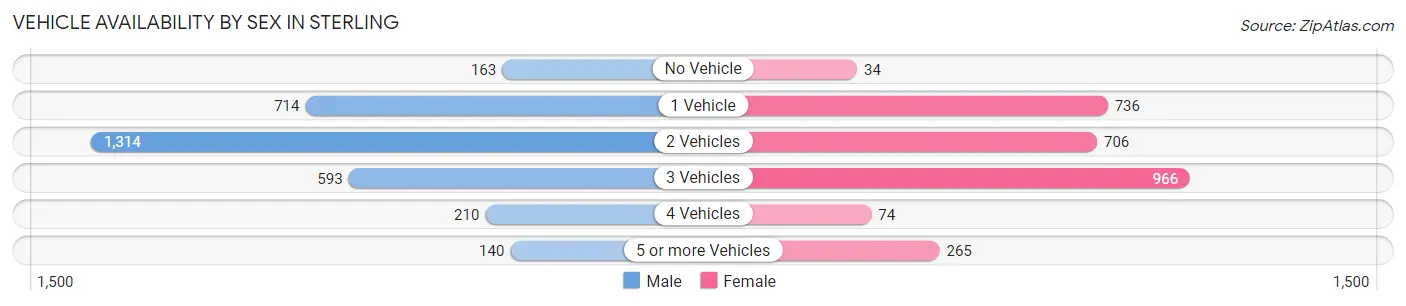
| Vehicles Available | Male | Female |
| No Vehicle | 163 (5.2%) | 34 (1.2%) |
| 1 Vehicle | 714 (22.8%) | 736 (26.5%) |
| 2 Vehicles | 1,314 (41.9%) | 706 (25.4%) |
| 3 Vehicles | 593 (18.9%) | 966 (34.7%) |
| 4 Vehicles | 210 (6.7%) | 74 (2.7%) |
| 5 or more Vehicles | 140 (4.5%) | 265 (9.5%) |
| Total | 3,134 (100.0%) | 2,781 (100.0%) |
Commute Time in Sterling
The most frequently occuring commute durations in Sterling are 5 to 9 minutes (2,320 commuters, 40.4%), 10 to 14 minutes (1,385 commuters, 24.1%), and 15 to 19 minutes (661 commuters, 11.5%).
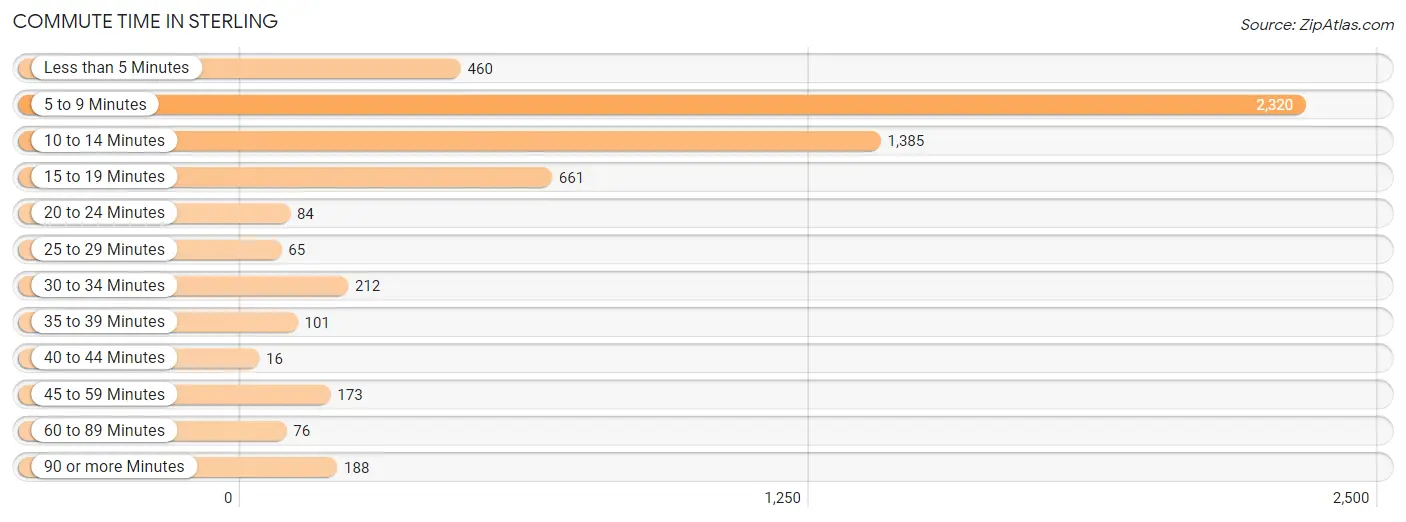
| Commute Time | # Commuters | % Commuters |
| Less than 5 Minutes | 460 | 8.0% |
| 5 to 9 Minutes | 2,320 | 40.4% |
| 10 to 14 Minutes | 1,385 | 24.1% |
| 15 to 19 Minutes | 661 | 11.5% |
| 20 to 24 Minutes | 84 | 1.5% |
| 25 to 29 Minutes | 65 | 1.1% |
| 30 to 34 Minutes | 212 | 3.7% |
| 35 to 39 Minutes | 101 | 1.8% |
| 40 to 44 Minutes | 16 | 0.3% |
| 45 to 59 Minutes | 173 | 3.0% |
| 60 to 89 Minutes | 76 | 1.3% |
| 90 or more Minutes | 188 | 3.3% |
Commute Time by Sex in Sterling
The most common commute times in Sterling are 5 to 9 minutes (1,211 commuters, 38.3%) for males and 5 to 9 minutes (1,109 commuters, 43.0%) for females.
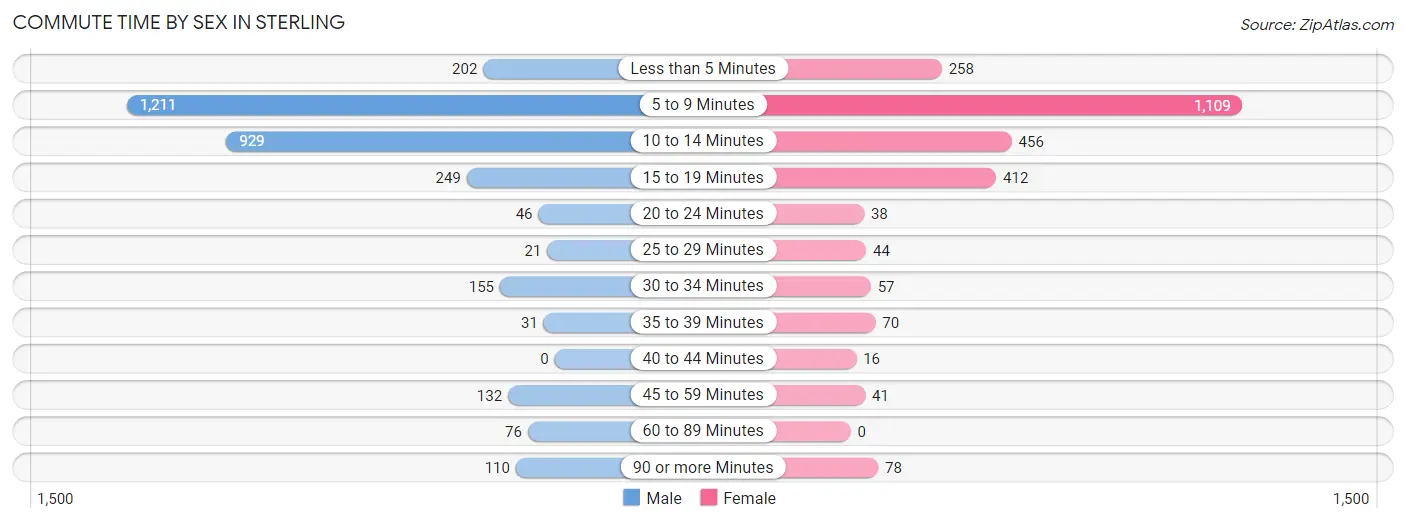
| Commute Time | Male | Female |
| Less than 5 Minutes | 202 (6.4%) | 258 (10.0%) |
| 5 to 9 Minutes | 1,211 (38.3%) | 1,109 (43.0%) |
| 10 to 14 Minutes | 929 (29.4%) | 456 (17.7%) |
| 15 to 19 Minutes | 249 (7.9%) | 412 (16.0%) |
| 20 to 24 Minutes | 46 (1.5%) | 38 (1.5%) |
| 25 to 29 Minutes | 21 (0.7%) | 44 (1.7%) |
| 30 to 34 Minutes | 155 (4.9%) | 57 (2.2%) |
| 35 to 39 Minutes | 31 (1.0%) | 70 (2.7%) |
| 40 to 44 Minutes | 0 (0.0%) | 16 (0.6%) |
| 45 to 59 Minutes | 132 (4.2%) | 41 (1.6%) |
| 60 to 89 Minutes | 76 (2.4%) | 0 (0.0%) |
| 90 or more Minutes | 110 (3.5%) | 78 (3.0%) |
Time of Departure to Work by Sex in Sterling
The most frequent times of departure to work in Sterling are 6:30 AM to 6:59 AM (670, 21.2%) for males and 7:30 AM to 7:59 AM (379, 14.7%) for females.
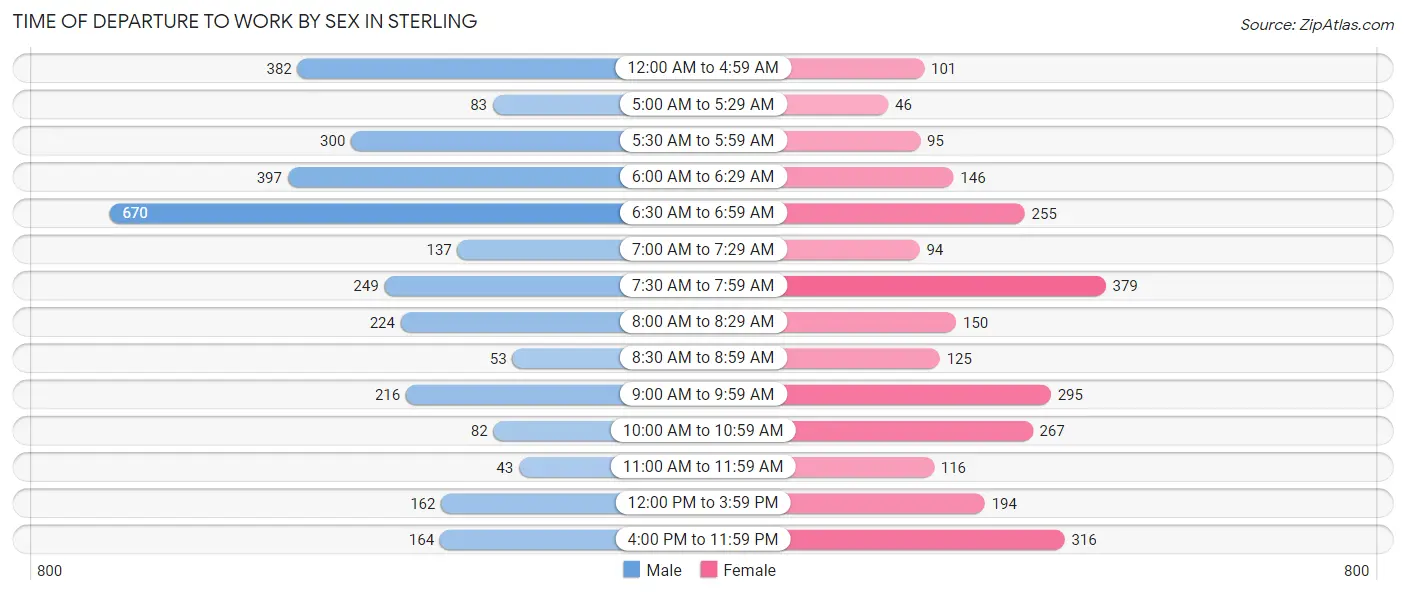
| Time of Departure | Male | Female |
| 12:00 AM to 4:59 AM | 382 (12.1%) | 101 (3.9%) |
| 5:00 AM to 5:29 AM | 83 (2.6%) | 46 (1.8%) |
| 5:30 AM to 5:59 AM | 300 (9.5%) | 95 (3.7%) |
| 6:00 AM to 6:29 AM | 397 (12.6%) | 146 (5.7%) |
| 6:30 AM to 6:59 AM | 670 (21.2%) | 255 (9.9%) |
| 7:00 AM to 7:29 AM | 137 (4.3%) | 94 (3.6%) |
| 7:30 AM to 7:59 AM | 249 (7.9%) | 379 (14.7%) |
| 8:00 AM to 8:29 AM | 224 (7.1%) | 150 (5.8%) |
| 8:30 AM to 8:59 AM | 53 (1.7%) | 125 (4.9%) |
| 9:00 AM to 9:59 AM | 216 (6.8%) | 295 (11.4%) |
| 10:00 AM to 10:59 AM | 82 (2.6%) | 267 (10.3%) |
| 11:00 AM to 11:59 AM | 43 (1.4%) | 116 (4.5%) |
| 12:00 PM to 3:59 PM | 162 (5.1%) | 194 (7.5%) |
| 4:00 PM to 11:59 PM | 164 (5.2%) | 316 (12.2%) |
| Total | 3,162 (100.0%) | 2,579 (100.0%) |
Housing Occupancy in Sterling
Occupancy by Ownership in Sterling
Of the total 5,041 dwellings in Sterling, owner-occupied units account for 3,221 (63.9%), while renter-occupied units make up 1,820 (36.1%).
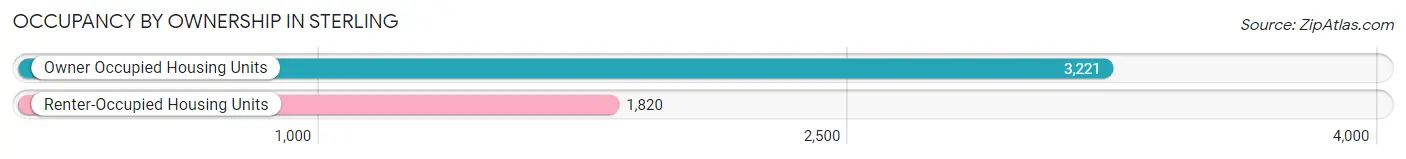
| Occupancy | # Housing Units | % Housing Units |
| Owner Occupied Housing Units | 3,221 | 63.9% |
| Renter-Occupied Housing Units | 1,820 | 36.1% |
| Total Occupied Housing Units | 5,041 | 100.0% |
Occupancy by Household Size in Sterling
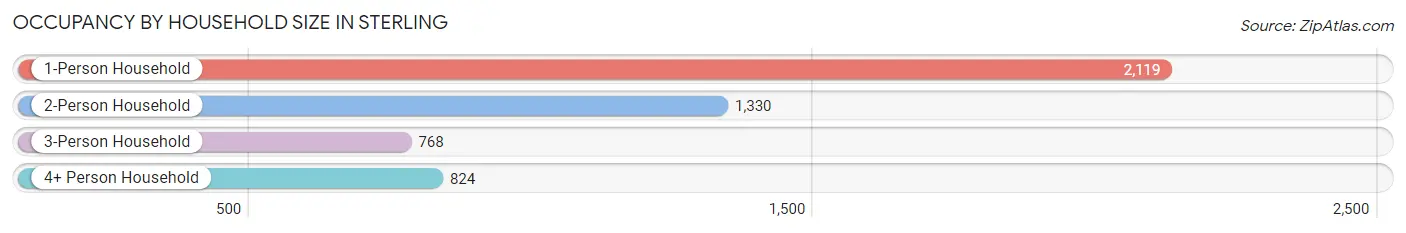
| Household Size | # Housing Units | % Housing Units |
| 1-Person Household | 2,119 | 42.0% |
| 2-Person Household | 1,330 | 26.4% |
| 3-Person Household | 768 | 15.2% |
| 4+ Person Household | 824 | 16.4% |
| Total Housing Units | 5,041 | 100.0% |
Occupancy by Ownership by Household Size in Sterling
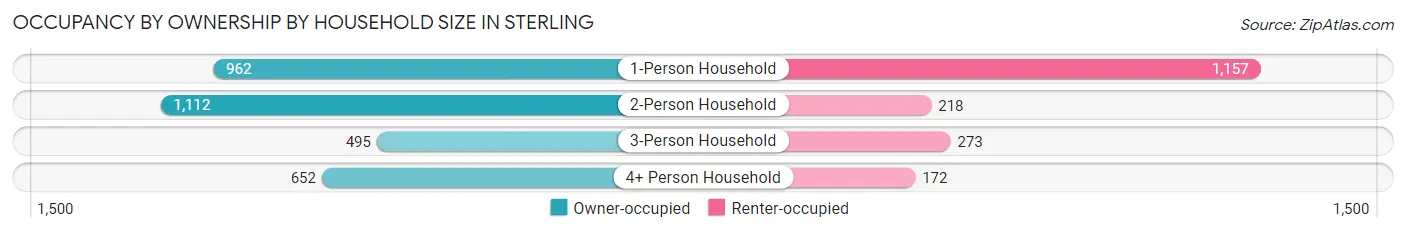
| Household Size | Owner-occupied | Renter-occupied |
| 1-Person Household | 962 (45.4%) | 1,157 (54.6%) |
| 2-Person Household | 1,112 (83.6%) | 218 (16.4%) |
| 3-Person Household | 495 (64.4%) | 273 (35.5%) |
| 4+ Person Household | 652 (79.1%) | 172 (20.9%) |
| Total Housing Units | 3,221 (63.9%) | 1,820 (36.1%) |
Occupancy by Educational Attainment in Sterling
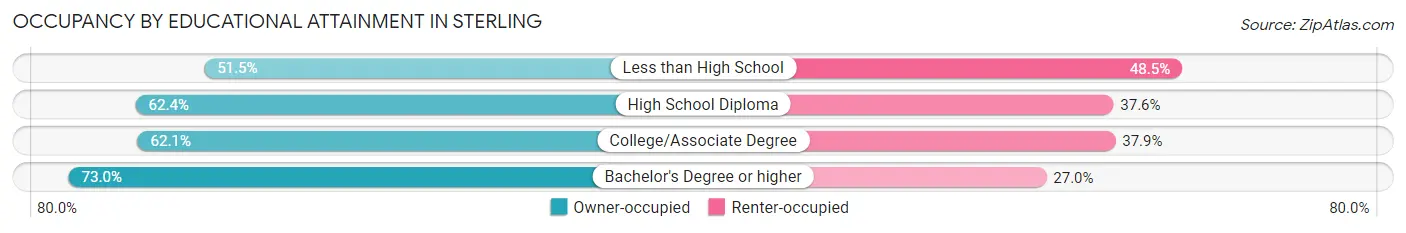
| Household Size | Owner-occupied | Renter-occupied |
| Less than High School | 137 (51.5%) | 129 (48.5%) |
| High School Diploma | 1,257 (62.4%) | 758 (37.6%) |
| College/Associate Degree | 1,067 (62.1%) | 652 (37.9%) |
| Bachelor's Degree or higher | 760 (73.0%) | 281 (27.0%) |
Occupancy by Age of Householder in Sterling
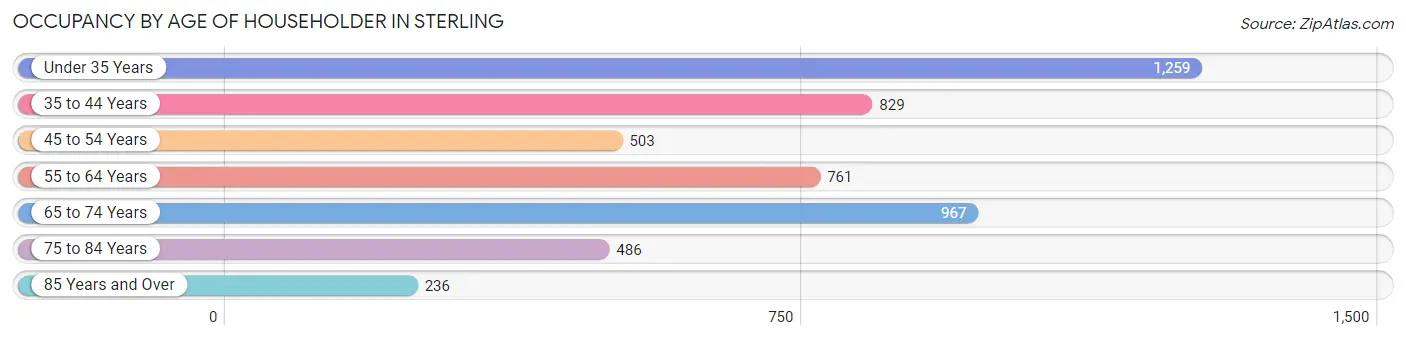
| Age Bracket | # Households | % Households |
| Under 35 Years | 1,259 | 25.0% |
| 35 to 44 Years | 829 | 16.5% |
| 45 to 54 Years | 503 | 10.0% |
| 55 to 64 Years | 761 | 15.1% |
| 65 to 74 Years | 967 | 19.2% |
| 75 to 84 Years | 486 | 9.6% |
| 85 Years and Over | 236 | 4.7% |
| Total | 5,041 | 100.0% |
Housing Finances in Sterling
Median Income by Occupancy in Sterling
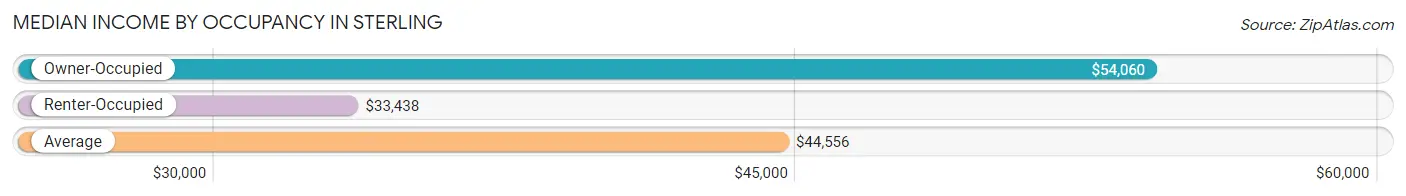
| Occupancy Type | # Households | Median Income |
| Owner-Occupied | 3,221 (63.9%) | $54,060 |
| Renter-Occupied | 1,820 (36.1%) | $33,438 |
| Average | 5,041 (100.0%) | $44,556 |
Occupancy by Householder Income Bracket in Sterling
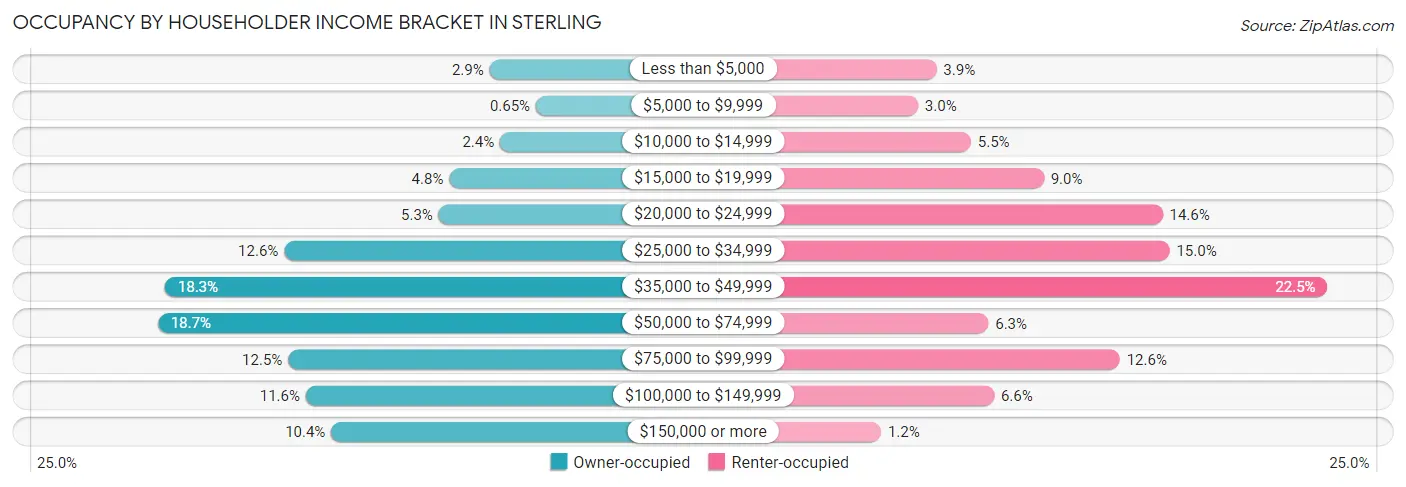
| Income Bracket | Owner-occupied | Renter-occupied |
| Less than $5,000 | 92 (2.9%) | 70 (3.8%) |
| $5,000 to $9,999 | 21 (0.6%) | 54 (3.0%) |
| $10,000 to $14,999 | 76 (2.4%) | 100 (5.5%) |
| $15,000 to $19,999 | 154 (4.8%) | 163 (9.0%) |
| $20,000 to $24,999 | 170 (5.3%) | 266 (14.6%) |
| $25,000 to $34,999 | 407 (12.6%) | 272 (14.9%) |
| $35,000 to $49,999 | 590 (18.3%) | 409 (22.5%) |
| $50,000 to $74,999 | 601 (18.7%) | 115 (6.3%) |
| $75,000 to $99,999 | 401 (12.4%) | 229 (12.6%) |
| $100,000 to $149,999 | 374 (11.6%) | 120 (6.6%) |
| $150,000 or more | 335 (10.4%) | 22 (1.2%) |
| Total | 3,221 (100.0%) | 1,820 (100.0%) |
Monthly Housing Cost Tiers in Sterling
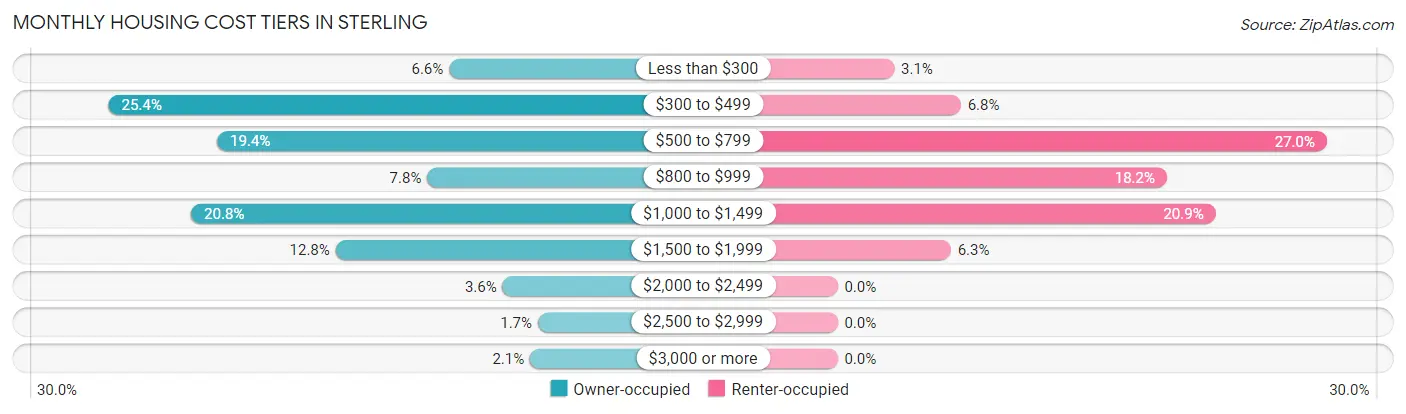
| Monthly Cost | Owner-occupied | Renter-occupied |
| Less than $300 | 211 (6.6%) | 57 (3.1%) |
| $300 to $499 | 817 (25.4%) | 124 (6.8%) |
| $500 to $799 | 624 (19.4%) | 492 (27.0%) |
| $800 to $999 | 250 (7.8%) | 331 (18.2%) |
| $1,000 to $1,499 | 670 (20.8%) | 380 (20.9%) |
| $1,500 to $1,999 | 413 (12.8%) | 114 (6.3%) |
| $2,000 to $2,499 | 116 (3.6%) | 0 (0.0%) |
| $2,500 to $2,999 | 53 (1.7%) | 0 (0.0%) |
| $3,000 or more | 67 (2.1%) | 0 (0.0%) |
| Total | 3,221 (100.0%) | 1,820 (100.0%) |
Physical Housing Characteristics in Sterling
Housing Structures in Sterling
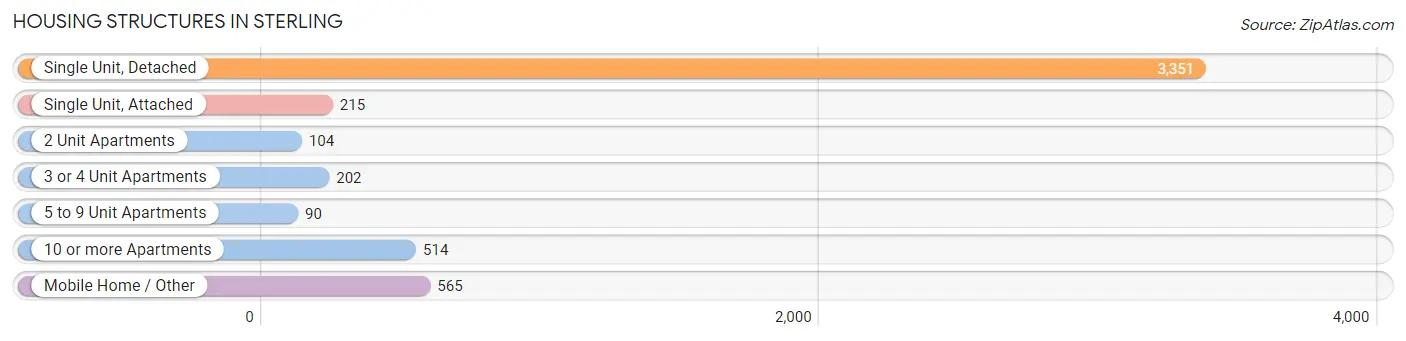
| Structure Type | # Housing Units | % Housing Units |
| Single Unit, Detached | 3,351 | 66.5% |
| Single Unit, Attached | 215 | 4.3% |
| 2 Unit Apartments | 104 | 2.1% |
| 3 or 4 Unit Apartments | 202 | 4.0% |
| 5 to 9 Unit Apartments | 90 | 1.8% |
| 10 or more Apartments | 514 | 10.2% |
| Mobile Home / Other | 565 | 11.2% |
| Total | 5,041 | 100.0% |
Housing Structures by Occupancy in Sterling
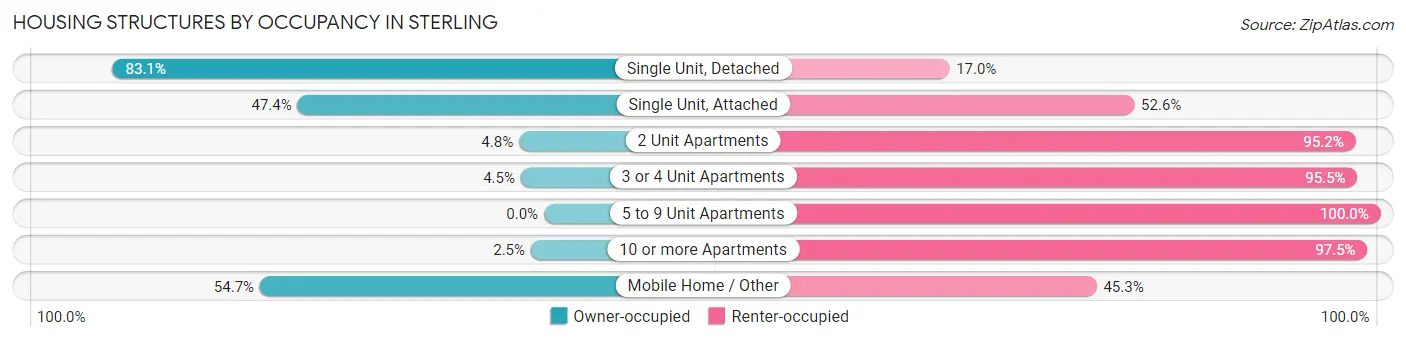
| Structure Type | Owner-occupied | Renter-occupied |
| Single Unit, Detached | 2,783 (83.1%) | 568 (17.0%) |
| Single Unit, Attached | 102 (47.4%) | 113 (52.6%) |
| 2 Unit Apartments | 5 (4.8%) | 99 (95.2%) |
| 3 or 4 Unit Apartments | 9 (4.5%) | 193 (95.5%) |
| 5 to 9 Unit Apartments | 0 (0.0%) | 90 (100.0%) |
| 10 or more Apartments | 13 (2.5%) | 501 (97.5%) |
| Mobile Home / Other | 309 (54.7%) | 256 (45.3%) |
| Total | 3,221 (63.9%) | 1,820 (36.1%) |
Housing Structures by Number of Rooms in Sterling
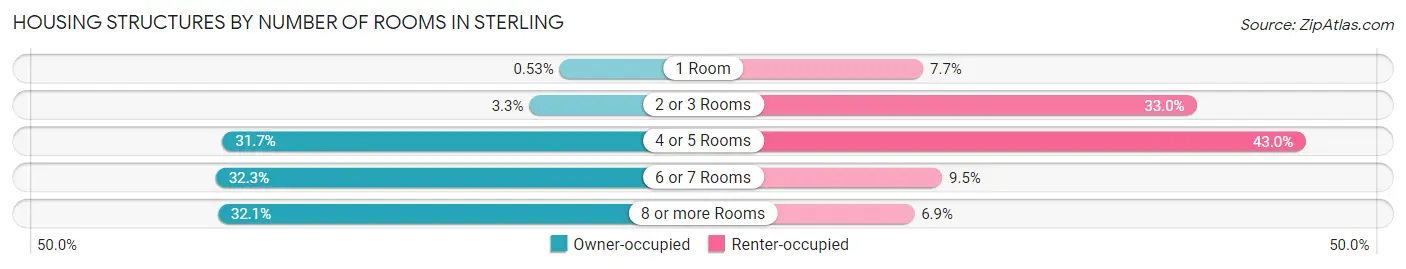
| Number of Rooms | Owner-occupied | Renter-occupied |
| 1 Room | 17 (0.5%) | 140 (7.7%) |
| 2 or 3 Rooms | 107 (3.3%) | 600 (33.0%) |
| 4 or 5 Rooms | 1,021 (31.7%) | 783 (43.0%) |
| 6 or 7 Rooms | 1,041 (32.3%) | 172 (9.5%) |
| 8 or more Rooms | 1,035 (32.1%) | 125 (6.9%) |
| Total | 3,221 (100.0%) | 1,820 (100.0%) |
Housing Structure by Heating Type in Sterling
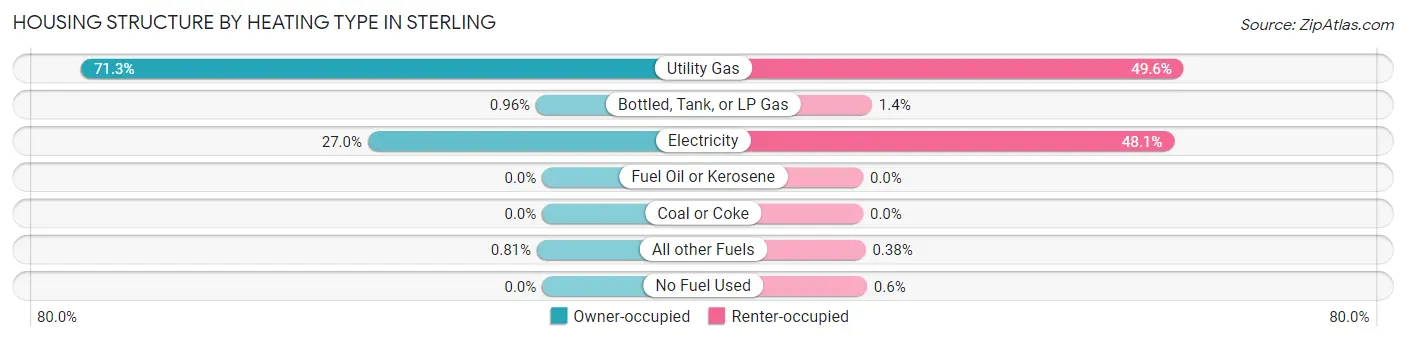
| Heating Type | Owner-occupied | Renter-occupied |
| Utility Gas | 2,296 (71.3%) | 902 (49.6%) |
| Bottled, Tank, or LP Gas | 31 (1.0%) | 25 (1.4%) |
| Electricity | 868 (27.0%) | 875 (48.1%) |
| Fuel Oil or Kerosene | 0 (0.0%) | 0 (0.0%) |
| Coal or Coke | 0 (0.0%) | 0 (0.0%) |
| All other Fuels | 26 (0.8%) | 7 (0.4%) |
| No Fuel Used | 0 (0.0%) | 11 (0.6%) |
| Total | 3,221 (100.0%) | 1,820 (100.0%) |
Household Vehicle Usage in Sterling
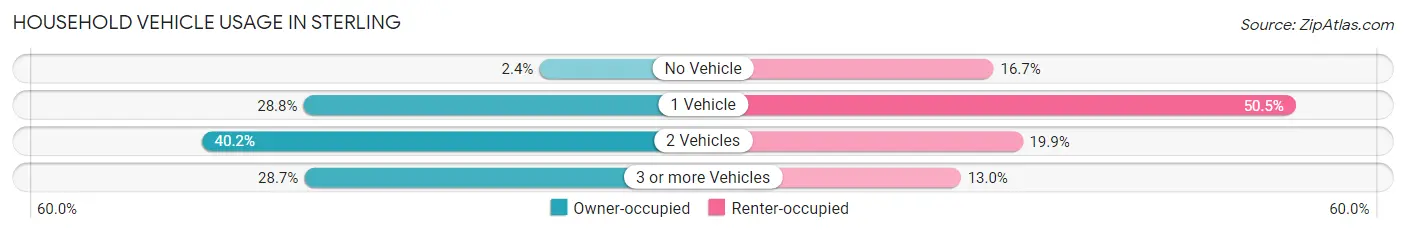
| Vehicles per Household | Owner-occupied | Renter-occupied |
| No Vehicle | 76 (2.4%) | 303 (16.7%) |
| 1 Vehicle | 927 (28.8%) | 919 (50.5%) |
| 2 Vehicles | 1,294 (40.2%) | 362 (19.9%) |
| 3 or more Vehicles | 924 (28.7%) | 236 (13.0%) |
| Total | 3,221 (100.0%) | 1,820 (100.0%) |
Real Estate & Mortgages in Sterling
Real Estate and Mortgage Overview in Sterling
| Characteristic | Without Mortgage | With Mortgage |
| Housing Units | 1,560 | 1,661 |
| Median Property Value | $163,000 | $203,800 |
| Median Household Income | $44,069 | $285 |
| Monthly Housing Costs | $440 | $67 |
| Real Estate Taxes | $718 | $41 |
Property Value by Mortgage Status in Sterling
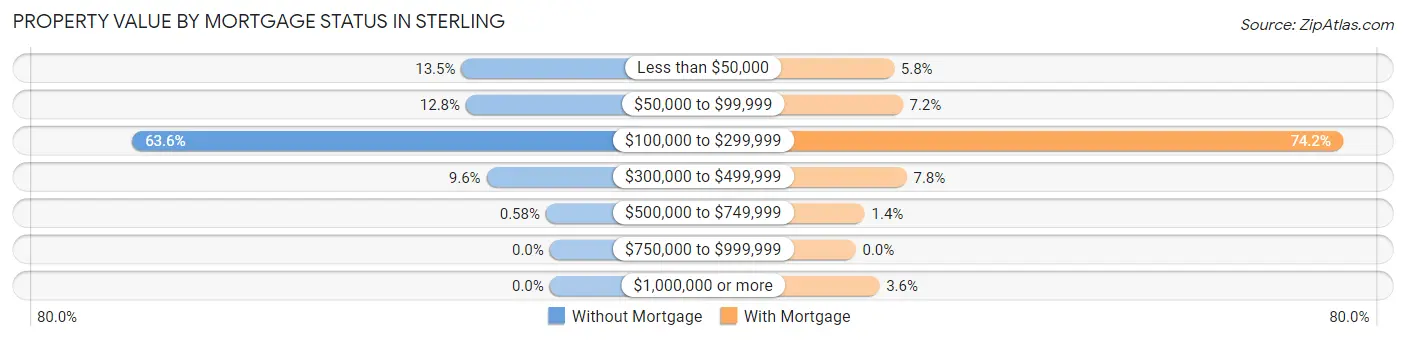
| Property Value | Without Mortgage | With Mortgage |
| Less than $50,000 | 210 (13.5%) | 97 (5.8%) |
| $50,000 to $99,999 | 199 (12.8%) | 119 (7.2%) |
| $100,000 to $299,999 | 992 (63.6%) | 1,233 (74.2%) |
| $300,000 to $499,999 | 150 (9.6%) | 129 (7.8%) |
| $500,000 to $749,999 | 9 (0.6%) | 23 (1.4%) |
| $750,000 to $999,999 | 0 (0.0%) | 0 (0.0%) |
| $1,000,000 or more | 0 (0.0%) | 60 (3.6%) |
| Total | 1,560 (100.0%) | 1,661 (100.0%) |
Household Income by Mortgage Status in Sterling
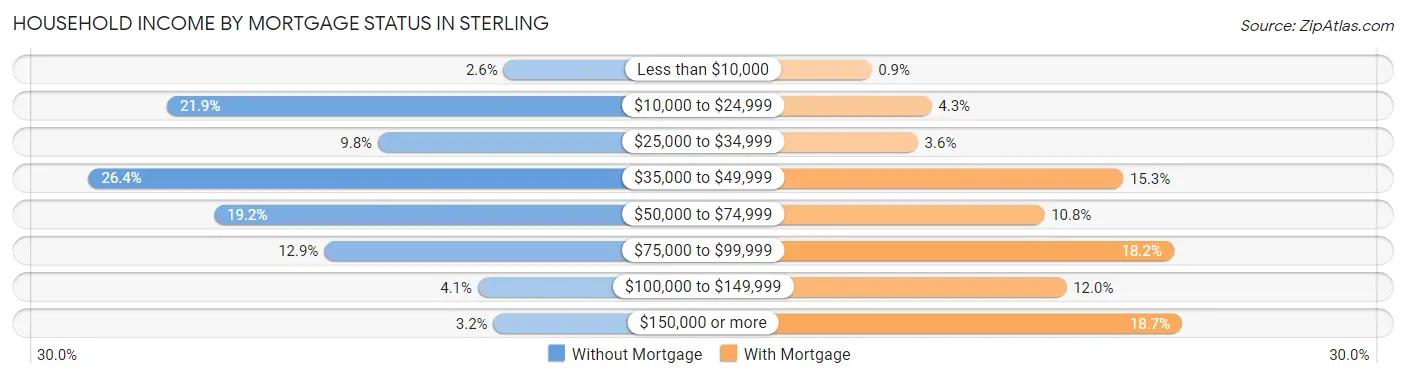
| Household Income | Without Mortgage | With Mortgage |
| Less than $10,000 | 41 (2.6%) | 15 (0.9%) |
| $10,000 to $24,999 | 341 (21.9%) | 72 (4.3%) |
| $25,000 to $34,999 | 153 (9.8%) | 59 (3.5%) |
| $35,000 to $49,999 | 411 (26.4%) | 254 (15.3%) |
| $50,000 to $74,999 | 299 (19.2%) | 179 (10.8%) |
| $75,000 to $99,999 | 201 (12.9%) | 302 (18.2%) |
| $100,000 to $149,999 | 64 (4.1%) | 200 (12.0%) |
| $150,000 or more | 50 (3.2%) | 310 (18.7%) |
| Total | 1,560 (100.0%) | 1,661 (100.0%) |
Property Value to Household Income Ratio in Sterling
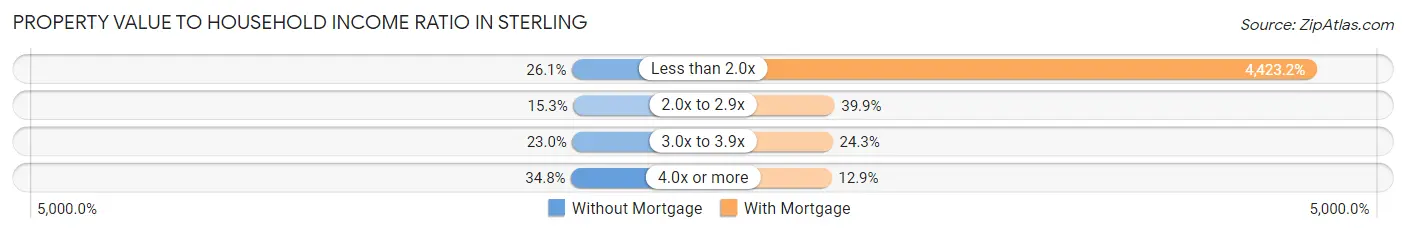
| Value-to-Income Ratio | Without Mortgage | With Mortgage |
| Less than 2.0x | 407 (26.1%) | 73,470 (4,423.2%) |
| 2.0x to 2.9x | 238 (15.3%) | 662 (39.9%) |
| 3.0x to 3.9x | 359 (23.0%) | 404 (24.3%) |
| 4.0x or more | 543 (34.8%) | 214 (12.9%) |
| Total | 1,560 (100.0%) | 1,661 (100.0%) |
Real Estate Taxes by Mortgage Status in Sterling
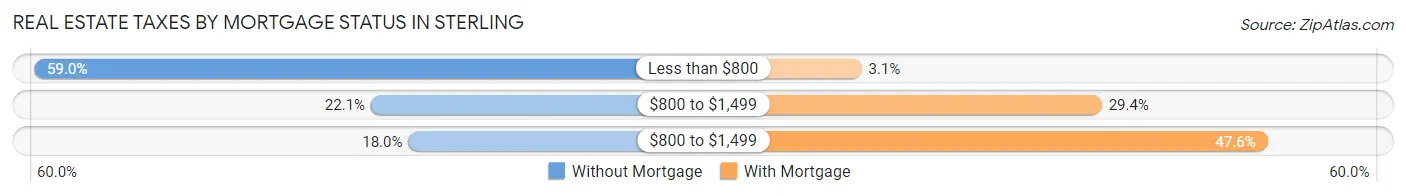
| Property Taxes | Without Mortgage | With Mortgage |
| Less than $800 | 920 (59.0%) | 52 (3.1%) |
| $800 to $1,499 | 344 (22.1%) | 489 (29.4%) |
| $800 to $1,499 | 280 (17.9%) | 791 (47.6%) |
| Total | 1,560 (100.0%) | 1,661 (100.0%) |
Health & Disability in Sterling
Health Insurance Coverage by Age in Sterling
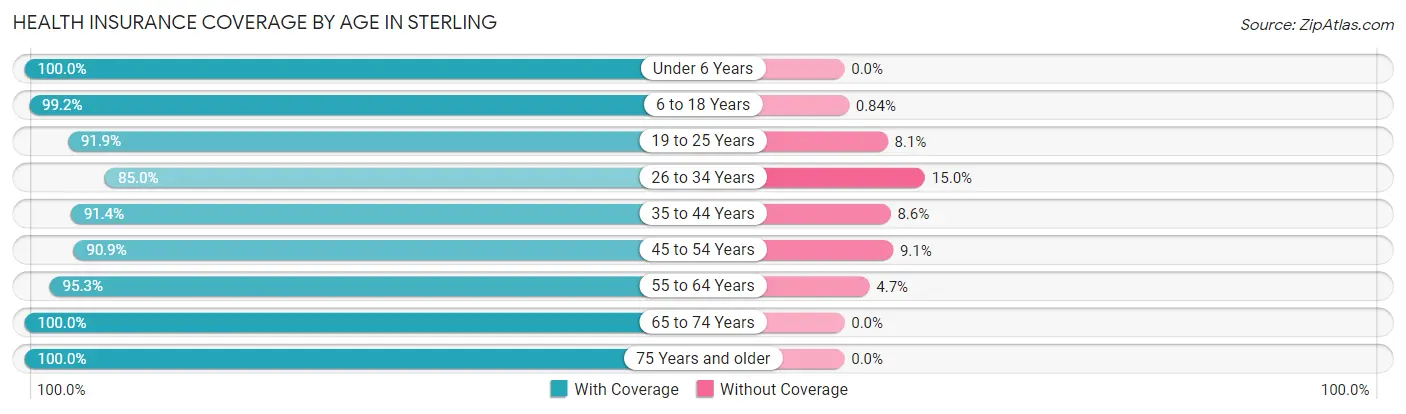
| Age Bracket | With Coverage | Without Coverage |
| Under 6 Years | 873 (100.0%) | 0 (0.0%) |
| 6 to 18 Years | 1,657 (99.2%) | 14 (0.8%) |
| 19 to 25 Years | 1,162 (91.9%) | 102 (8.1%) |
| 26 to 34 Years | 1,634 (85.0%) | 289 (15.0%) |
| 35 to 44 Years | 1,570 (91.4%) | 148 (8.6%) |
| 45 to 54 Years | 1,212 (90.9%) | 121 (9.1%) |
| 55 to 64 Years | 1,245 (95.3%) | 61 (4.7%) |
| 65 to 74 Years | 1,388 (100.0%) | 0 (0.0%) |
| 75 Years and older | 1,041 (100.0%) | 0 (0.0%) |
| Total | 11,782 (94.1%) | 735 (5.9%) |
Health Insurance Coverage by Citizenship Status in Sterling
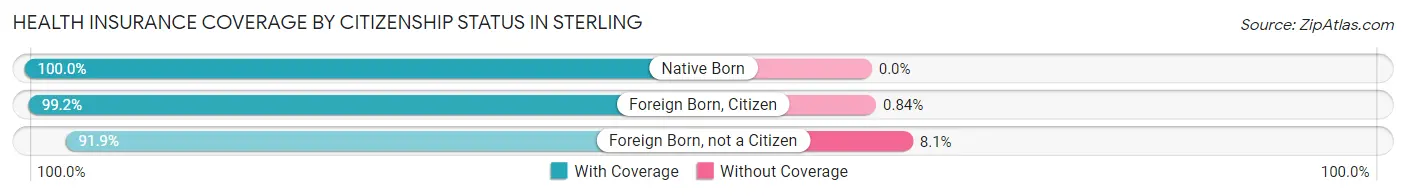
| Citizenship Status | With Coverage | Without Coverage |
| Native Born | 873 (100.0%) | 0 (0.0%) |
| Foreign Born, Citizen | 1,657 (99.2%) | 14 (0.8%) |
| Foreign Born, not a Citizen | 1,162 (91.9%) | 102 (8.1%) |
Health Insurance Coverage by Household Income in Sterling
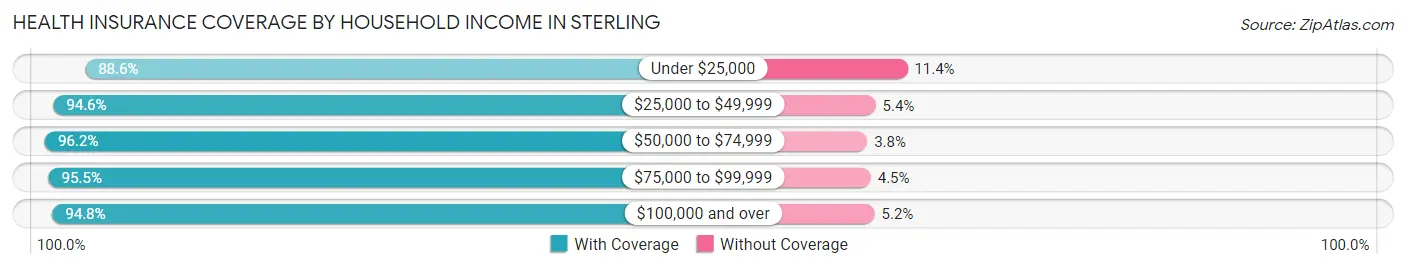
| Household Income | With Coverage | Without Coverage |
| Under $25,000 | 1,397 (88.6%) | 179 (11.4%) |
| $25,000 to $49,999 | 3,537 (94.6%) | 202 (5.4%) |
| $50,000 to $74,999 | 1,933 (96.2%) | 77 (3.8%) |
| $75,000 to $99,999 | 2,078 (95.5%) | 98 (4.5%) |
| $100,000 and over | 2,403 (94.8%) | 132 (5.2%) |
Public vs Private Health Insurance Coverage by Age in Sterling
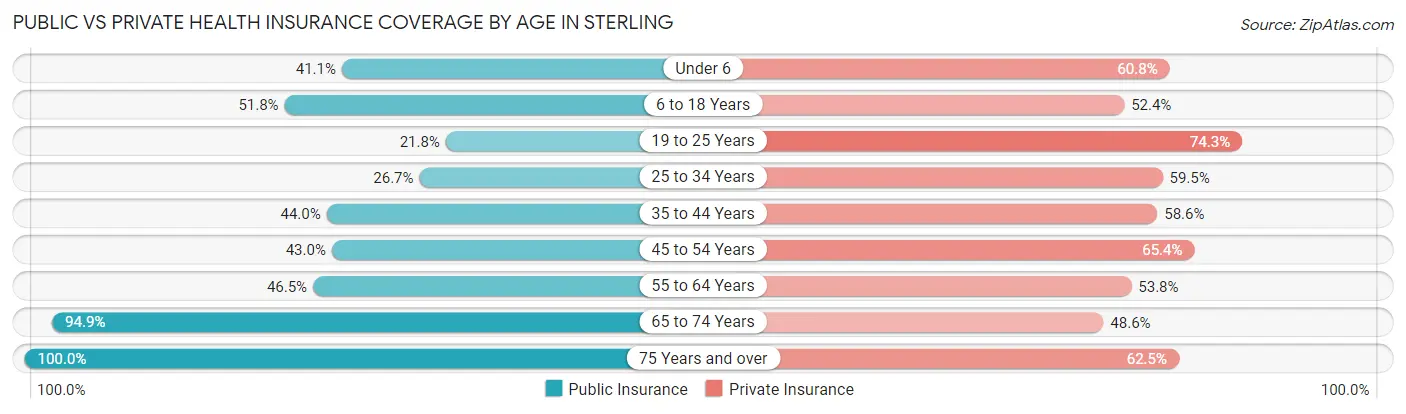
| Age Bracket | Public Insurance | Private Insurance |
| Under 6 | 359 (41.1%) | 531 (60.8%) |
| 6 to 18 Years | 865 (51.8%) | 876 (52.4%) |
| 19 to 25 Years | 276 (21.8%) | 939 (74.3%) |
| 25 to 34 Years | 514 (26.7%) | 1,145 (59.5%) |
| 35 to 44 Years | 755 (44.0%) | 1,006 (58.6%) |
| 45 to 54 Years | 573 (43.0%) | 872 (65.4%) |
| 55 to 64 Years | 607 (46.5%) | 702 (53.7%) |
| 65 to 74 Years | 1,317 (94.9%) | 674 (48.6%) |
| 75 Years and over | 1,041 (100.0%) | 651 (62.5%) |
| Total | 6,307 (50.4%) | 7,396 (59.1%) |
Disability Status by Sex by Age in Sterling
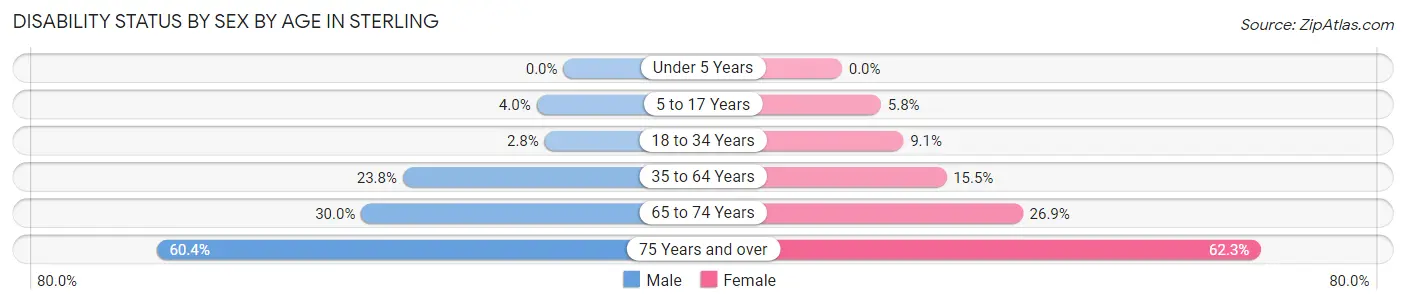
| Age Bracket | Male | Female |
| Under 5 Years | 0 (0.0%) | 0 (0.0%) |
| 5 to 17 Years | 36 (4.0%) | 48 (5.8%) |
| 18 to 34 Years | 53 (2.8%) | 130 (9.1%) |
| 35 to 64 Years | 528 (23.8%) | 332 (15.5%) |
| 65 to 74 Years | 202 (30.0%) | 192 (26.9%) |
| 75 Years and over | 267 (60.4%) | 373 (62.3%) |
Disability Class by Sex by Age in Sterling
Disability Class: Hearing Difficulty
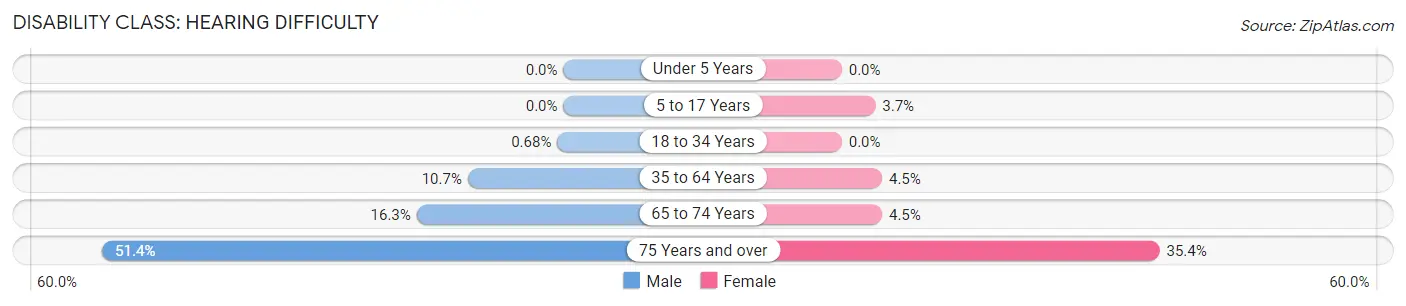
| Age Bracket | Male | Female |
| Under 5 Years | 0 (0.0%) | 0 (0.0%) |
| 5 to 17 Years | 0 (0.0%) | 31 (3.7%) |
| 18 to 34 Years | 13 (0.7%) | 0 (0.0%) |
| 35 to 64 Years | 236 (10.6%) | 96 (4.5%) |
| 65 to 74 Years | 110 (16.3%) | 32 (4.5%) |
| 75 Years and over | 227 (51.4%) | 212 (35.4%) |
Disability Class: Vision Difficulty
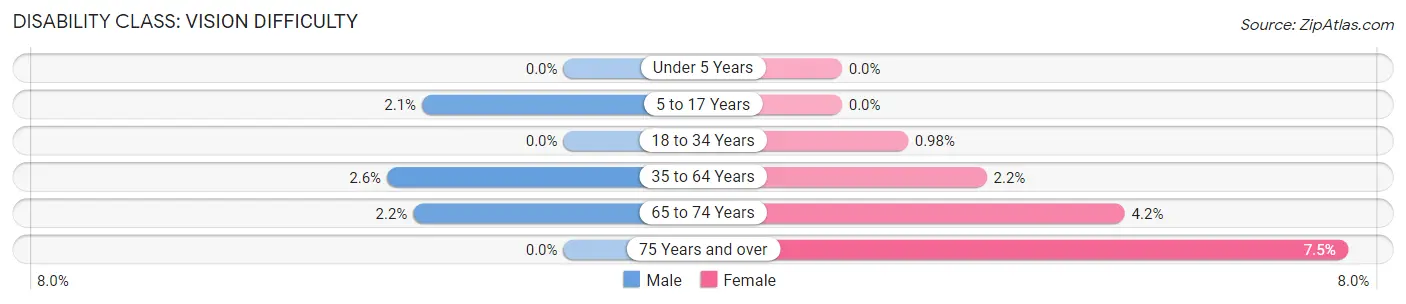
| Age Bracket | Male | Female |
| Under 5 Years | 0 (0.0%) | 0 (0.0%) |
| 5 to 17 Years | 19 (2.1%) | 0 (0.0%) |
| 18 to 34 Years | 0 (0.0%) | 14 (1.0%) |
| 35 to 64 Years | 58 (2.6%) | 46 (2.1%) |
| 65 to 74 Years | 15 (2.2%) | 30 (4.2%) |
| 75 Years and over | 0 (0.0%) | 45 (7.5%) |
Disability Class: Cognitive Difficulty
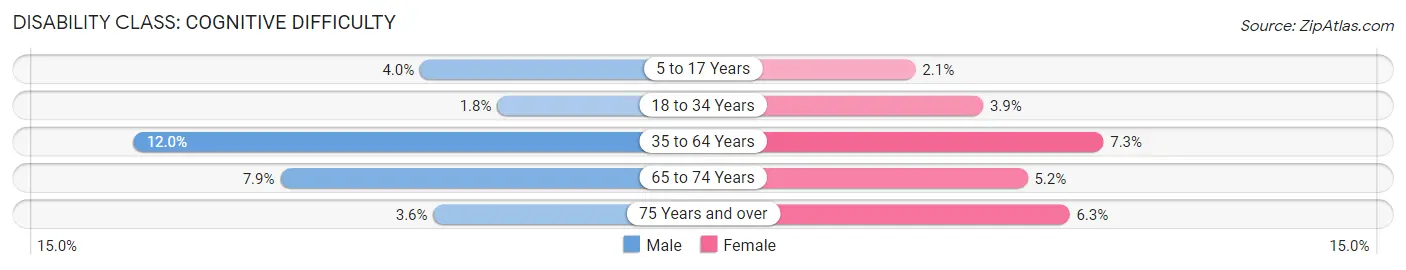
| Age Bracket | Male | Female |
| 5 to 17 Years | 36 (4.0%) | 17 (2.1%) |
| 18 to 34 Years | 35 (1.8%) | 56 (3.9%) |
| 35 to 64 Years | 265 (12.0%) | 156 (7.3%) |
| 65 to 74 Years | 53 (7.9%) | 37 (5.2%) |
| 75 Years and over | 16 (3.6%) | 38 (6.3%) |
Disability Class: Ambulatory Difficulty
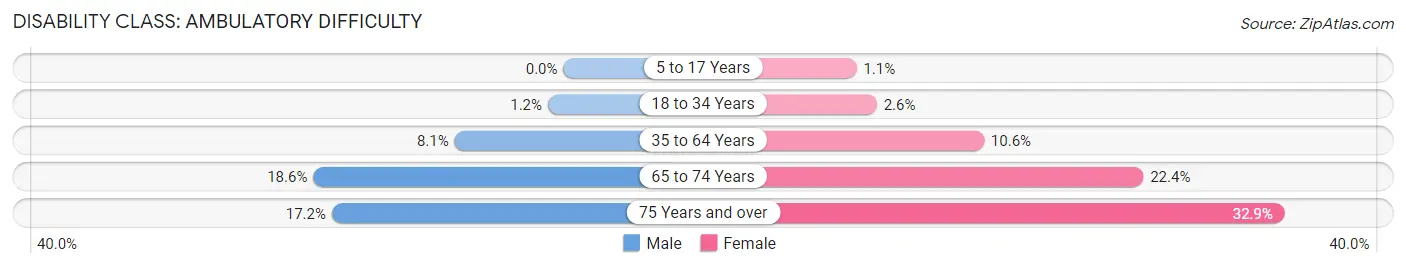
| Age Bracket | Male | Female |
| 5 to 17 Years | 0 (0.0%) | 9 (1.1%) |
| 18 to 34 Years | 22 (1.1%) | 37 (2.6%) |
| 35 to 64 Years | 179 (8.1%) | 226 (10.5%) |
| 65 to 74 Years | 125 (18.6%) | 160 (22.4%) |
| 75 Years and over | 76 (17.2%) | 197 (32.9%) |
Disability Class: Self-Care Difficulty
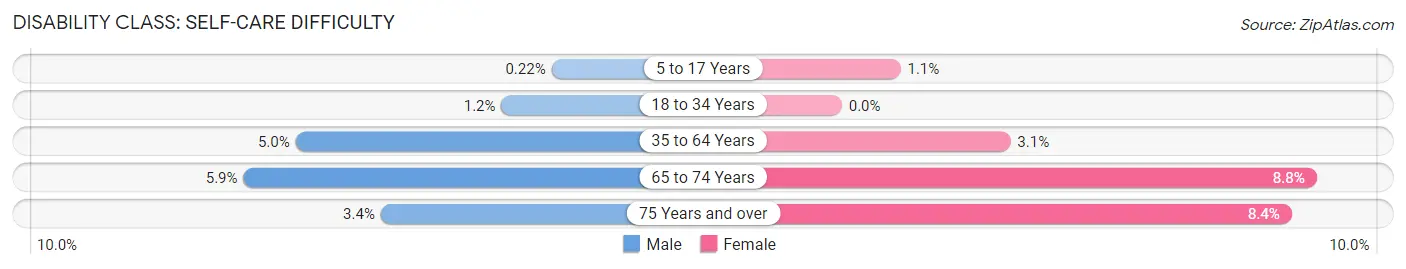
| Age Bracket | Male | Female |
| 5 to 17 Years | 2 (0.2%) | 9 (1.1%) |
| 18 to 34 Years | 22 (1.1%) | 0 (0.0%) |
| 35 to 64 Years | 110 (5.0%) | 67 (3.1%) |
| 65 to 74 Years | 40 (5.9%) | 63 (8.8%) |
| 75 Years and over | 15 (3.4%) | 50 (8.4%) |
Technology Access in Sterling
Computing Device Access in Sterling
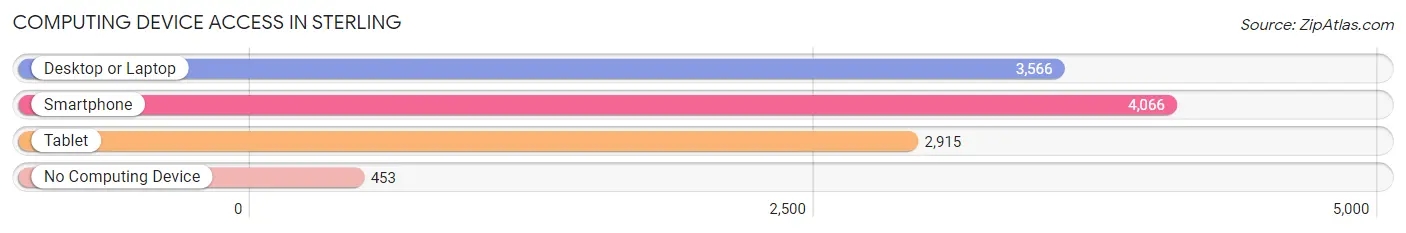
| Device Type | # Households | % Households |
| Desktop or Laptop | 3,566 | 70.7% |
| Smartphone | 4,066 | 80.7% |
| Tablet | 2,915 | 57.8% |
| No Computing Device | 453 | 9.0% |
| Total | 5,041 | 100.0% |
Internet Access in Sterling
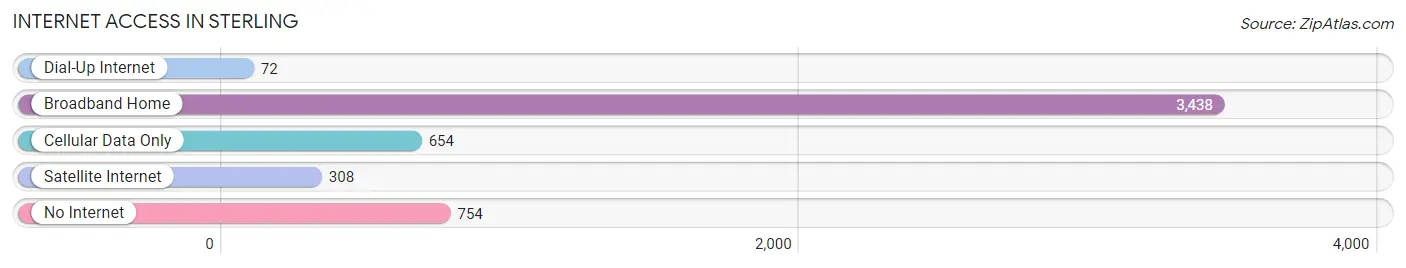
| Internet Type | # Households | % Households |
| Dial-Up Internet | 72 | 1.4% |
| Broadband Home | 3,438 | 68.2% |
| Cellular Data Only | 654 | 13.0% |
| Satellite Internet | 308 | 6.1% |
| No Internet | 754 | 15.0% |
| Total | 5,041 | 100.0% |
Sterling Summary
Sterling, Colorado is a city located in Logan County in the northeastern part of the state. It is the county seat and the largest city in the county. The city is located along the South Platte River and is part of the Denver-Aurora-Lakewood Metropolitan Statistical Area. As of the 2010 census, the population of Sterling was 14,777.
History
Sterling was founded in 1881 by a group of settlers from Sterling, Illinois. The city was named after the original settlement in Illinois. The settlers were attracted to the area by the abundance of water from the South Platte River and the fertile soil. The city was incorporated in 1885 and quickly became an important agricultural center in the region.
The city was also an important stop on the Union Pacific Railroad, which connected Denver to the west. The railroad brought new settlers to the area and helped to spur economic growth. The city was also home to a number of businesses, including a flour mill, a brewery, and a brickyard.
In the early 20th century, the city experienced a period of growth and prosperity. The population increased from 1,500 in 1900 to over 5,000 by 1920. The city was also home to a number of manufacturing businesses, including a sugar beet processing plant, a canning factory, and a creamery.
Geography
Sterling is located in northeastern Colorado, in Logan County. The city is situated along the South Platte River, at an elevation of 4,719 feet. The city covers an area of 8.3 square miles, of which 8.2 square miles is land and 0.1 square miles is water.
The city is located in the High Plains region of Colorado, which is characterized by flat terrain and dry, windy conditions. The climate is semi-arid, with hot summers and cold winters. The average annual temperature is 52.3 degrees Fahrenheit, and the average annual precipitation is 16.3 inches.
Economy
Sterling’s economy is largely based on agriculture and manufacturing. The city is home to a number of agricultural businesses, including a sugar beet processing plant, a canning factory, and a creamery. The city is also home to a number of manufacturing businesses, including a flour mill, a brewery, and a brickyard.
The city is also home to a number of retail businesses, including a Walmart Supercenter, a Lowe’s Home Improvement store, and a number of restaurants and other retail stores. The city is also home to a number of medical facilities, including a hospital and a number of clinics.
Demographics
As of the 2010 census, the population of Sterling was 14,777. The racial makeup of the city was 87.3% White, 0.7% African American, 0.9% Native American, 0.7% Asian, 0.1% Pacific Islander, 8.7% from other races, and 2.5% from two or more races. Hispanic or Latino of any race were 20.2% of the population.
The median income for a household in the city was $37,945, and the median income for a family was $45,945. The per capita income for the city was $19,845. About 13.2% of families and 16.3% of the population were below the poverty line, including 22.2% of those under age 18 and 8.2% of those age 65 or over.
Common Questions
What is Per Capita Income in Sterling?
Per Capita income in Sterling is $24,917.
What is the Median Family Income in Sterling?
Median Family Income in Sterling is $68,036.
What is the Median Household income in Sterling?
Median Household Income in Sterling is $44,556.
What is Income or Wage Gap in Sterling?
Income or Wage Gap in Sterling is 25.2%.
Women in Sterling earn 74.8 cents for every dollar earned by a man.
What is Family Income Deficit in Sterling?
Family Income Deficit in Sterling is $11,140.
Families that are below poverty line in Sterling earn $11,140 less on average than the poverty threshold level.
What is Inequality or Gini Index in Sterling?
Inequality or Gini Index in Sterling is 0.41.
What is the Total Population of Sterling?
Total Population of Sterling is 13,466.
What is the Total Male Population of Sterling?
Total Male Population of Sterling is 7,349.
What is the Total Female Population of Sterling?
Total Female Population of Sterling is 6,117.
What is the Ratio of Males per 100 Females in Sterling?
There are 120.14 Males per 100 Females in Sterling.
What is the Ratio of Females per 100 Males in Sterling?
There are 83.24 Females per 100 Males in Sterling.
What is the Median Population Age in Sterling?
Median Population Age in Sterling is 37.7 Years.
What is the Average Family Size in Sterling
Average Family Size in Sterling is 3.4 People.
What is the Average Household Size in Sterling
Average Household Size in Sterling is 2.4 People.
How Large is the Labor Force in Sterling?
There are 6,511 People in the Labor Forcein in Sterling.
What is the Percentage of People in the Labor Force in Sterling?
57.8% of People are in the Labor Force in Sterling.
What is the Unemployment Rate in Sterling?
Unemployment Rate in Sterling is 3.3%.