Rico, CO Map & Demographics
Rico Map
Rico Overview
$37,318
PER CAPITA INCOME
$140,750
AVG FAMILY INCOME
$83,281
AVG HOUSEHOLD INCOME
8.5%
WAGE / INCOME GAP [ % ]
91.5¢/ $1
WAGE / INCOME GAP [ $ ]
0.38
INEQUALITY / GINI INDEX
382
TOTAL POPULATION
171
MALE POPULATION
211
FEMALE POPULATION
81.04
MALES / 100 FEMALES
123.39
FEMALES / 100 MALES
42.8
MEDIAN AGE
2.3
AVG FAMILY SIZE
1.9
AVG HOUSEHOLD SIZE
271
LABOR FORCE [ PEOPLE ]
78.1%
PERCENT IN LABOR FORCE
Rico Zip Codes
Rico Area Codes
Income in Rico
Income Overview in Rico
Per Capita Income in Rico is $37,318, while median incomes of families and households are $140,750 and $83,281 respectively.
| Characteristic | Number | Measure |
| Per Capita Income | 382 | $37,318 |
| Median Family Income | 114 | $140,750 |
| Mean Family Income | 114 | $122,618 |
| Median Household Income | 205 | $83,281 |
| Mean Household Income | 205 | $92,976 |
| Income Deficit | 114 | $0 |
| Wage / Income Gap (%) | 382 | 8.48% |
| Wage / Income Gap ($) | 382 | 91.52¢ per $1 |
| Gini / Inequality Index | 382 | 0.38 |
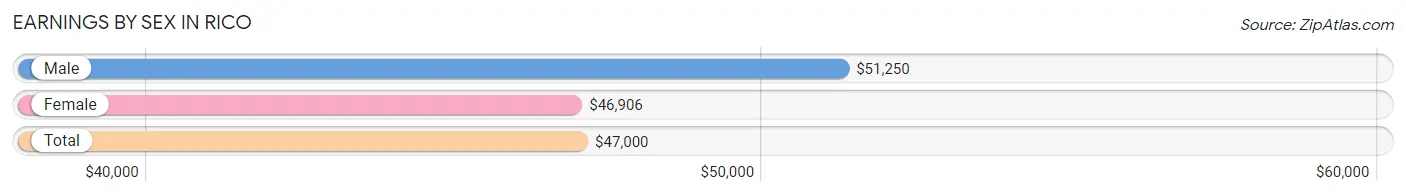
Earnings by Sex in Rico
Average Earnings in Rico are $47,000, $51,250 for men and $46,906 for women, a difference of 8.5%.
| Sex | Number | Average Earnings |
| Male | 123 (44.6%) | $51,250 |
| Female | 153 (55.4%) | $46,906 |
| Total | 276 (100.0%) | $47,000 |
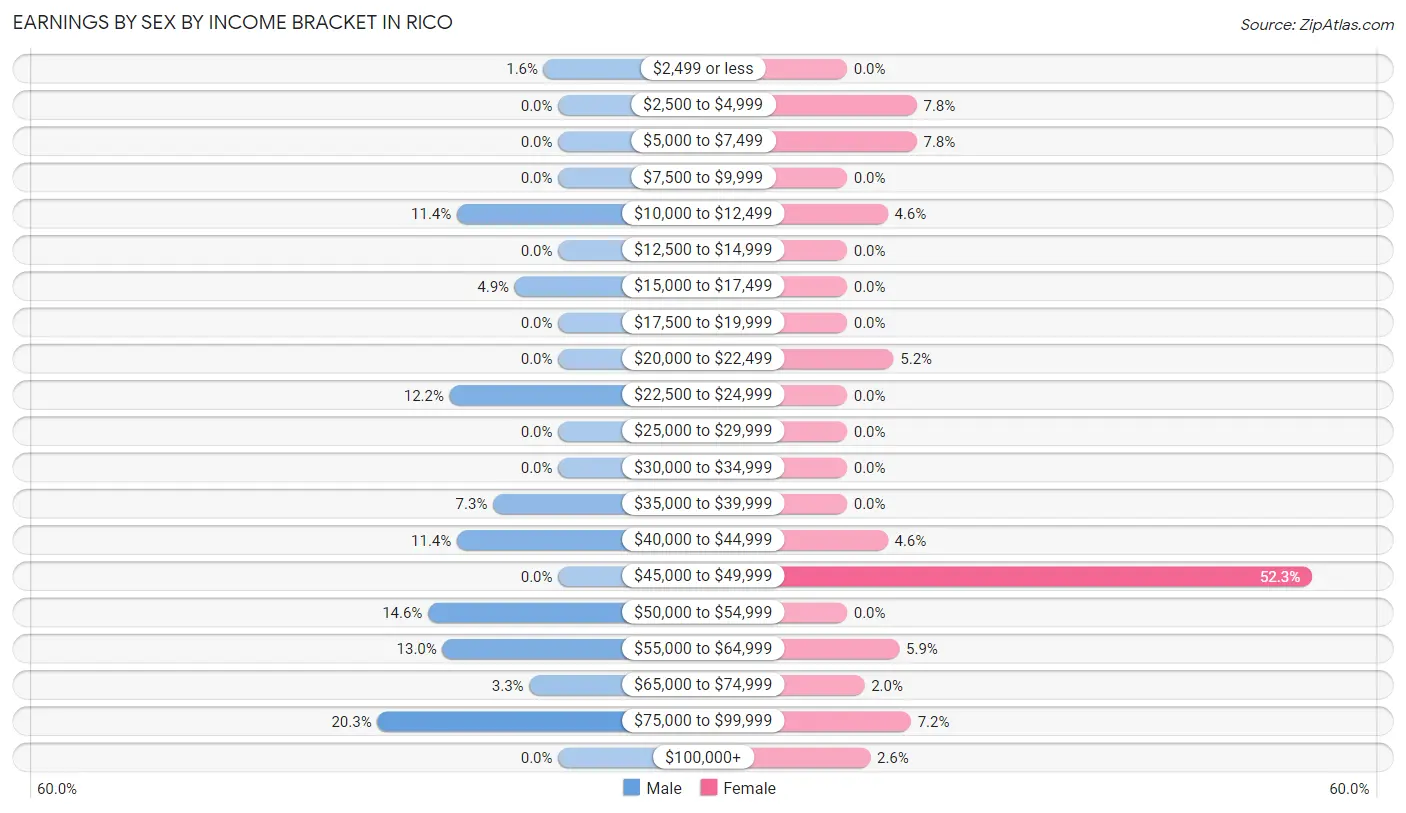
Earnings by Sex by Income Bracket in Rico
The most common earnings brackets in Rico are $75,000 to $99,999 for men (25 | 20.3%) and $45,000 to $49,999 for women (80 | 52.3%).
| Income | Male | Female |
| $2,499 or less | 2 (1.6%) | 0 (0.0%) |
| $2,500 to $4,999 | 0 (0.0%) | 12 (7.8%) |
| $5,000 to $7,499 | 0 (0.0%) | 12 (7.8%) |
| $7,500 to $9,999 | 0 (0.0%) | 0 (0.0%) |
| $10,000 to $12,499 | 14 (11.4%) | 7 (4.6%) |
| $12,500 to $14,999 | 0 (0.0%) | 0 (0.0%) |
| $15,000 to $17,499 | 6 (4.9%) | 0 (0.0%) |
| $17,500 to $19,999 | 0 (0.0%) | 0 (0.0%) |
| $20,000 to $22,499 | 0 (0.0%) | 8 (5.2%) |
| $22,500 to $24,999 | 15 (12.2%) | 0 (0.0%) |
| $25,000 to $29,999 | 0 (0.0%) | 0 (0.0%) |
| $30,000 to $34,999 | 0 (0.0%) | 0 (0.0%) |
| $35,000 to $39,999 | 9 (7.3%) | 0 (0.0%) |
| $40,000 to $44,999 | 14 (11.4%) | 7 (4.6%) |
| $45,000 to $49,999 | 0 (0.0%) | 80 (52.3%) |
| $50,000 to $54,999 | 18 (14.6%) | 0 (0.0%) |
| $55,000 to $64,999 | 16 (13.0%) | 9 (5.9%) |
| $65,000 to $74,999 | 4 (3.3%) | 3 (2.0%) |
| $75,000 to $99,999 | 25 (20.3%) | 11 (7.2%) |
| $100,000+ | 0 (0.0%) | 4 (2.6%) |
| Total | 123 (100.0%) | 153 (100.0%) |
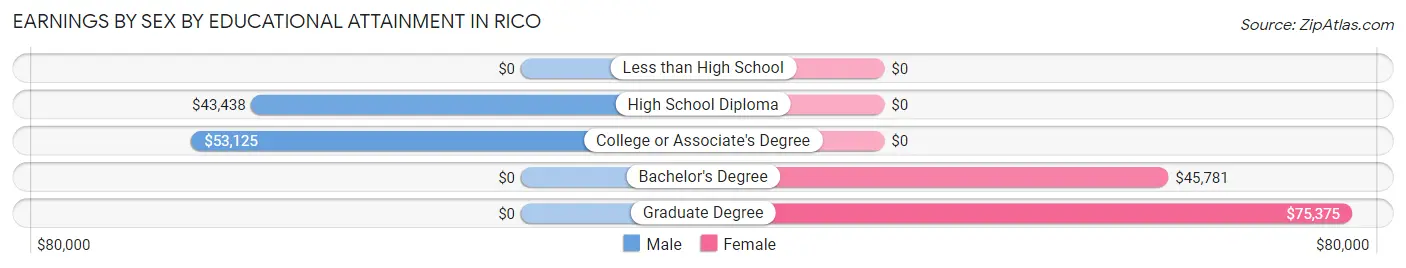
Earnings by Sex by Educational Attainment in Rico
Average earnings in Rico are $52,917 for men and $47,656 for women, a difference of 9.9%. Men with an educational attainment of college or associate's degree enjoy the highest average annual earnings of $53,125, while those with high school diploma education earn the least with $43,438. Women with an educational attainment of graduate degree earn the most with the average annual earnings of $75,375, while those with bachelor's degree education have the smallest earnings of $45,781.
| Educational Attainment | Male Income | Female Income |
| Less than High School | - | - |
| High School Diploma | $43,438 | $0 |
| College or Associate's Degree | $53,125 | $0 |
| Bachelor's Degree | - | - |
| Graduate Degree | - | - |
| Total | $52,917 | $47,656 |
Family Income in Rico
Family Income Brackets in Rico
According to the Rico family income data, there are 47 families falling into the $150,000 to $199,999 income range, which is the most common income bracket and makes up 41.2% of all families.
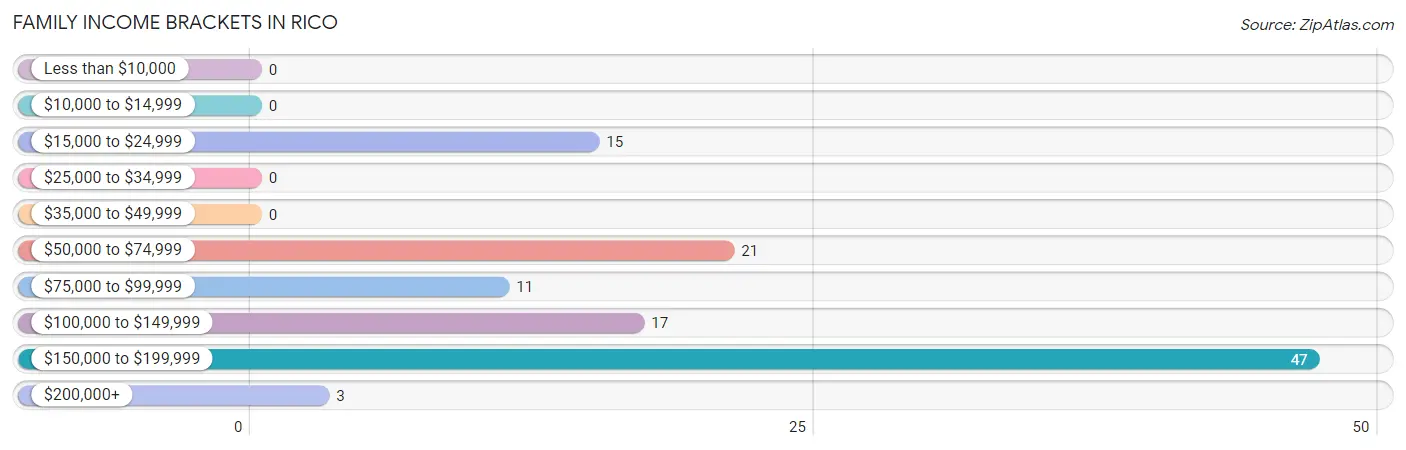
| Income Bracket | # Families | % Families |
| Less than $10,000 | 0 | 0.0% |
| $10,000 to $14,999 | 0 | 0.0% |
| $15,000 to $24,999 | 15 | 13.2% |
| $25,000 to $34,999 | 0 | 0.0% |
| $35,000 to $49,999 | 0 | 0.0% |
| $50,000 to $74,999 | 21 | 18.4% |
| $75,000 to $99,999 | 11 | 9.6% |
| $100,000 to $149,999 | 17 | 14.9% |
| $150,000 to $199,999 | 47 | 41.2% |
| $200,000+ | 3 | 2.6% |
Family Income by Famaliy Size in Rico
3-person families (59 | 51.7%) account for the highest median family income in Rico with $173,344 per family, while 3-person families (59 | 51.7%) have the highest median income of $57,781 per family member.
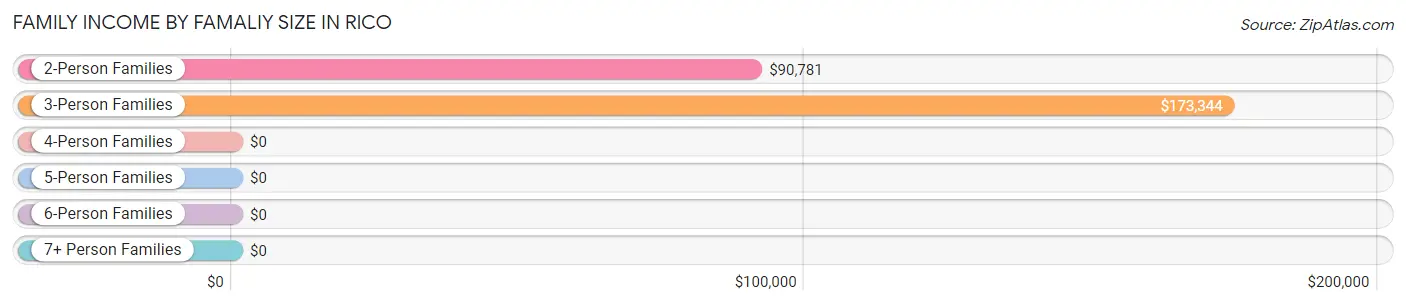
| Income Bracket | # Families | Median Income |
| 2-Person Families | 19 (16.7%) | $90,781 |
| 3-Person Families | 59 (51.7%) | $173,344 |
| 4-Person Families | 36 (31.6%) | $0 |
| 5-Person Families | 0 (0.0%) | $0 |
| 6-Person Families | 0 (0.0%) | $0 |
| 7+ Person Families | 0 (0.0%) | $0 |
| Total | 114 (100.0%) | $140,750 |
Family Income by Number of Earners in Rico
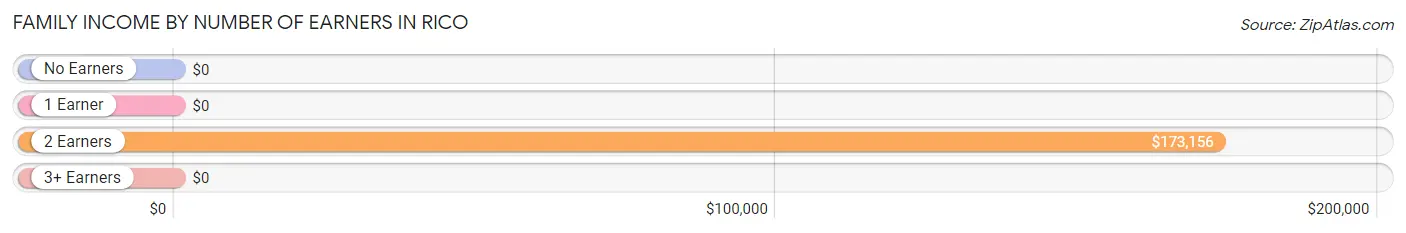
| Number of Earners | # Families | Median Income |
| No Earners | 0 (0.0%) | $0 |
| 1 Earner | 23 (20.2%) | $0 |
| 2 Earners | 67 (58.8%) | $173,156 |
| 3+ Earners | 24 (21.0%) | $0 |
| Total | 114 (100.0%) | $140,750 |
Household Income in Rico
Household Income Brackets in Rico
With 46 households falling in the category, the $150,000 to $199,999 income range is the most frequent in Rico, accounting for 22.4% of all households.
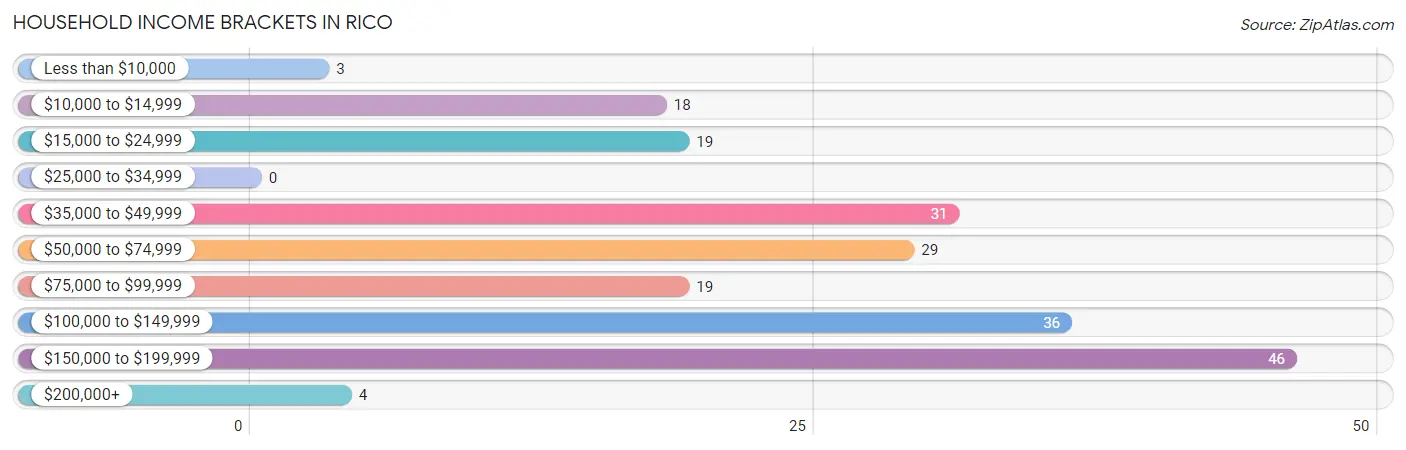
| Income Bracket | # Households | % Households |
| Less than $10,000 | 3 | 1.5% |
| $10,000 to $14,999 | 18 | 8.8% |
| $15,000 to $24,999 | 19 | 9.3% |
| $25,000 to $34,999 | 0 | 0.0% |
| $35,000 to $49,999 | 31 | 15.1% |
| $50,000 to $74,999 | 29 | 14.1% |
| $75,000 to $99,999 | 19 | 9.3% |
| $100,000 to $149,999 | 36 | 17.6% |
| $150,000 to $199,999 | 46 | 22.4% |
| $200,000+ | 4 | 2.0% |
Household Income by Householder Age in Rico
The median household income in Rico is $83,281, with the highest median household income of $173,156 found in the 65+ years age bracket for the primary householder. A total of 59 households (28.8%) fall into this category.
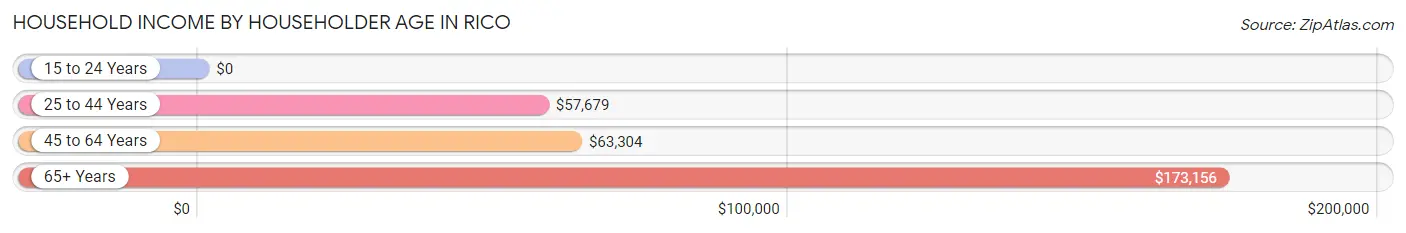
| Income Bracket | # Households | Median Income |
| 15 to 24 Years | 0 (0.0%) | $0 |
| 25 to 44 Years | 81 (39.5%) | $57,679 |
| 45 to 64 Years | 65 (31.7%) | $63,304 |
| 65+ Years | 59 (28.8%) | $173,156 |
| Total | 205 (100.0%) | $83,281 |
Poverty in Rico
Income Below Poverty by Sex and Age in Rico
With 20.5% poverty level for males and 12.8% for females among the residents of Rico, 16 and 17 year old males and 12 to 14 year old females are the most vulnerable to poverty, with 10 males (83.3%) and 9 females (45.0%) in their respective age groups living below the poverty level.
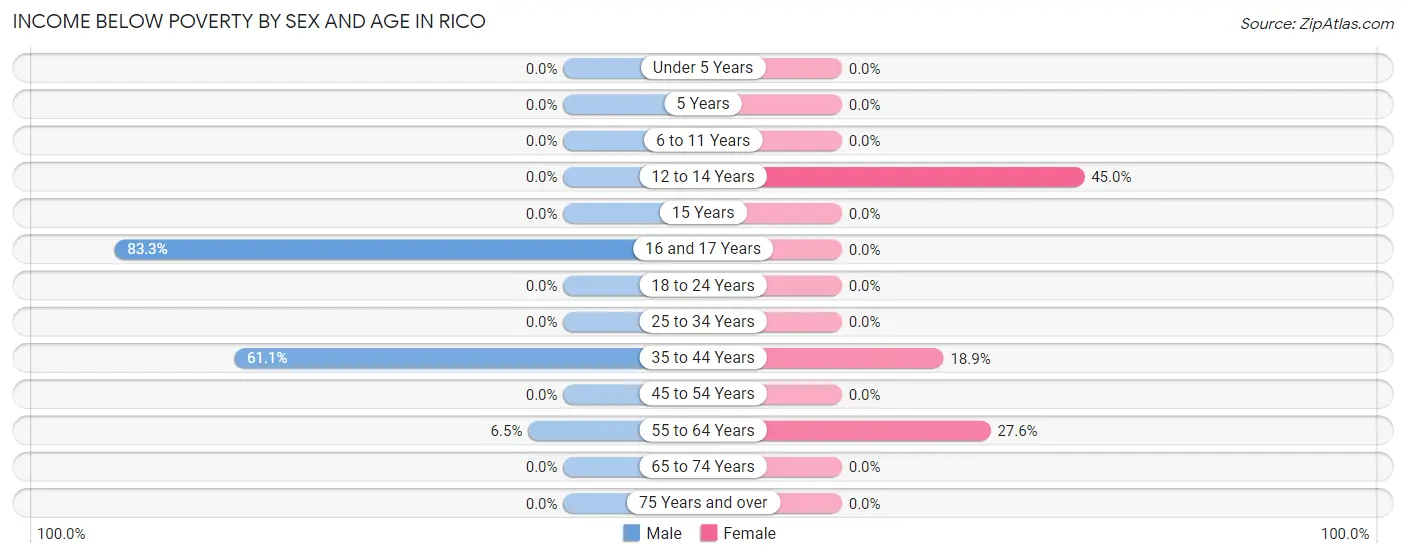
| Age Bracket | Male | Female |
| Under 5 Years | 0 (0.0%) | 0 (0.0%) |
| 5 Years | 0 (0.0%) | 0 (0.0%) |
| 6 to 11 Years | 0 (0.0%) | 0 (0.0%) |
| 12 to 14 Years | 0 (0.0%) | 9 (45.0%) |
| 15 Years | 0 (0.0%) | 0 (0.0%) |
| 16 and 17 Years | 10 (83.3%) | 0 (0.0%) |
| 18 to 24 Years | 0 (0.0%) | 0 (0.0%) |
| 25 to 34 Years | 0 (0.0%) | 0 (0.0%) |
| 35 to 44 Years | 22 (61.1%) | 10 (18.9%) |
| 45 to 54 Years | 0 (0.0%) | 0 (0.0%) |
| 55 to 64 Years | 3 (6.5%) | 8 (27.6%) |
| 65 to 74 Years | 0 (0.0%) | 0 (0.0%) |
| 75 Years and over | 0 (0.0%) | 0 (0.0%) |
| Total | 35 (20.5%) | 27 (12.8%) |
Income Above Poverty by Sex and Age in Rico
According to the poverty statistics in Rico, males aged 12 to 14 years and females aged 6 to 11 years are the age groups that are most secure financially, with 100.0% of males and 100.0% of females in these age groups living above the poverty line.
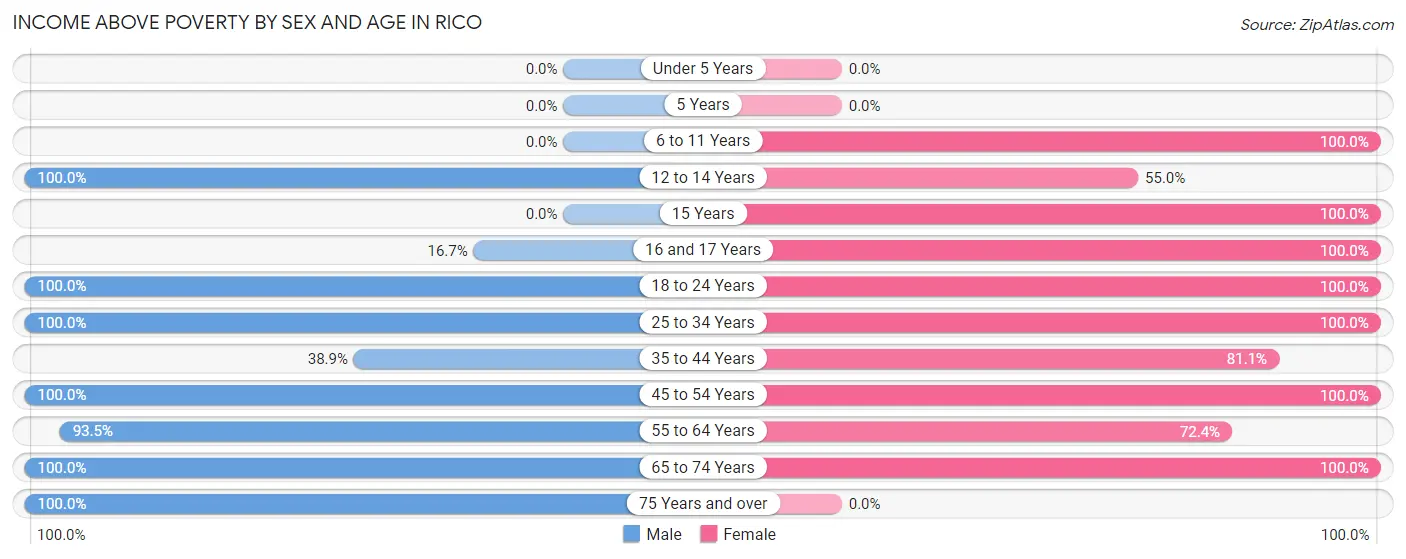
| Age Bracket | Male | Female |
| Under 5 Years | 0 (0.0%) | 0 (0.0%) |
| 5 Years | 0 (0.0%) | 0 (0.0%) |
| 6 to 11 Years | 0 (0.0%) | 2 (100.0%) |
| 12 to 14 Years | 6 (100.0%) | 11 (55.0%) |
| 15 Years | 0 (0.0%) | 7 (100.0%) |
| 16 and 17 Years | 2 (16.7%) | 12 (100.0%) |
| 18 to 24 Years | 6 (100.0%) | 12 (100.0%) |
| 25 to 34 Years | 36 (100.0%) | 9 (100.0%) |
| 35 to 44 Years | 14 (38.9%) | 43 (81.1%) |
| 45 to 54 Years | 10 (100.0%) | 20 (100.0%) |
| 55 to 64 Years | 43 (93.5%) | 21 (72.4%) |
| 65 to 74 Years | 4 (100.0%) | 47 (100.0%) |
| 75 Years and over | 15 (100.0%) | 0 (0.0%) |
| Total | 136 (79.5%) | 184 (87.2%) |
Income Below Poverty Among Married-Couple Families in Rico
The poverty statistics for married-couple families in Rico show that 22.7% or 15 of the total 66 families live below the poverty line. Families with 1 or 2 children have the highest poverty rate of 33.3%, comprising of 15 families. On the other hand, families with no children have the lowest poverty rate of 0.0%, which includes 0 families.
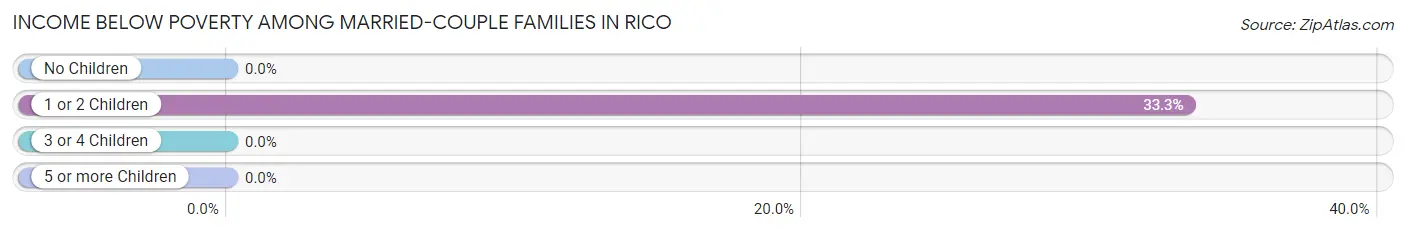
| Children | Above Poverty | Below Poverty |
| No Children | 21 (100.0%) | 0 (0.0%) |
| 1 or 2 Children | 30 (66.7%) | 15 (33.3%) |
| 3 or 4 Children | 0 (0.0%) | 0 (0.0%) |
| 5 or more Children | 0 (0.0%) | 0 (0.0%) |
| Total | 51 (77.3%) | 15 (22.7%) |
Income Below Poverty Among Single-Parent Households in Rico
| Children | Single Father | Single Mother |
| No Children | 0 (0.0%) | 0 (0.0%) |
| 1 or 2 Children | 0 (0.0%) | 0 (0.0%) |
| 3 or 4 Children | 0 (0.0%) | 0 (0.0%) |
| 5 or more Children | 0 (0.0%) | 0 (0.0%) |
| Total | 0 (0.0%) | 0 (0.0%) |
Income Below Poverty Among Married-Couple vs Single-Parent Households in Rico
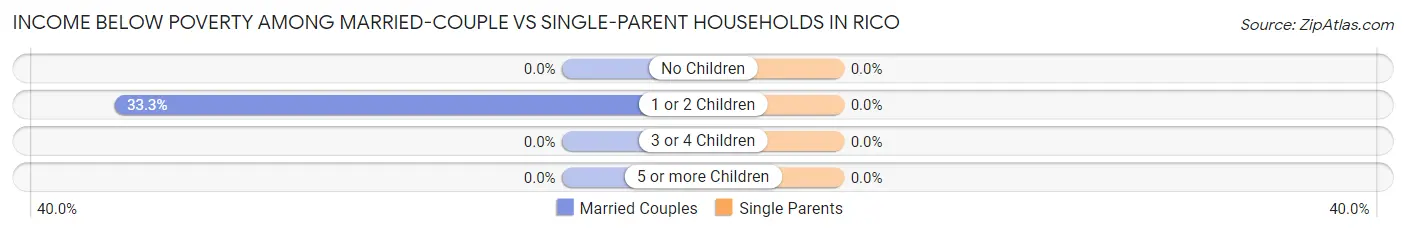
| Children | Married-Couple Families | Single-Parent Households |
| No Children | 0 (0.0%) | 0 (0.0%) |
| 1 or 2 Children | 15 (33.3%) | 0 (0.0%) |
| 3 or 4 Children | 0 (0.0%) | 0 (0.0%) |
| 5 or more Children | 0 (0.0%) | 0 (0.0%) |
| Total | 15 (22.7%) | 0 (0.0%) |
Race in Rico
The most populous races in Rico are White / Caucasian (284 | 74.4%), Native / Alaskan (48 | 12.6%), and Two or more Races (42 | 11.0%).
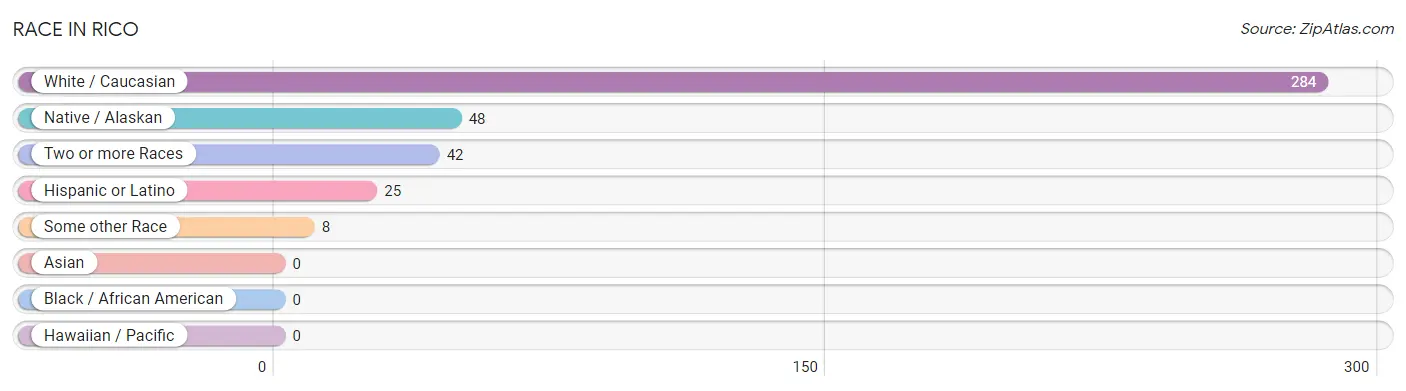
| Race | # Population | % Population |
| Asian | 0 | 0.0% |
| Black / African American | 0 | 0.0% |
| Hawaiian / Pacific | 0 | 0.0% |
| Hispanic or Latino | 25 | 6.5% |
| Native / Alaskan | 48 | 12.6% |
| White / Caucasian | 284 | 74.4% |
| Two or more Races | 42 | 11.0% |
| Some other Race | 8 | 2.1% |
| Total | 382 | 100.0% |
Ancestry in Rico
The most populous ancestries reported in Rico are German (94 | 24.6%), Irish (82 | 21.5%), Italian (74 | 19.4%), English (66 | 17.3%), and Navajo (48 | 12.6%), together accounting for 95.3% of all Rico residents.
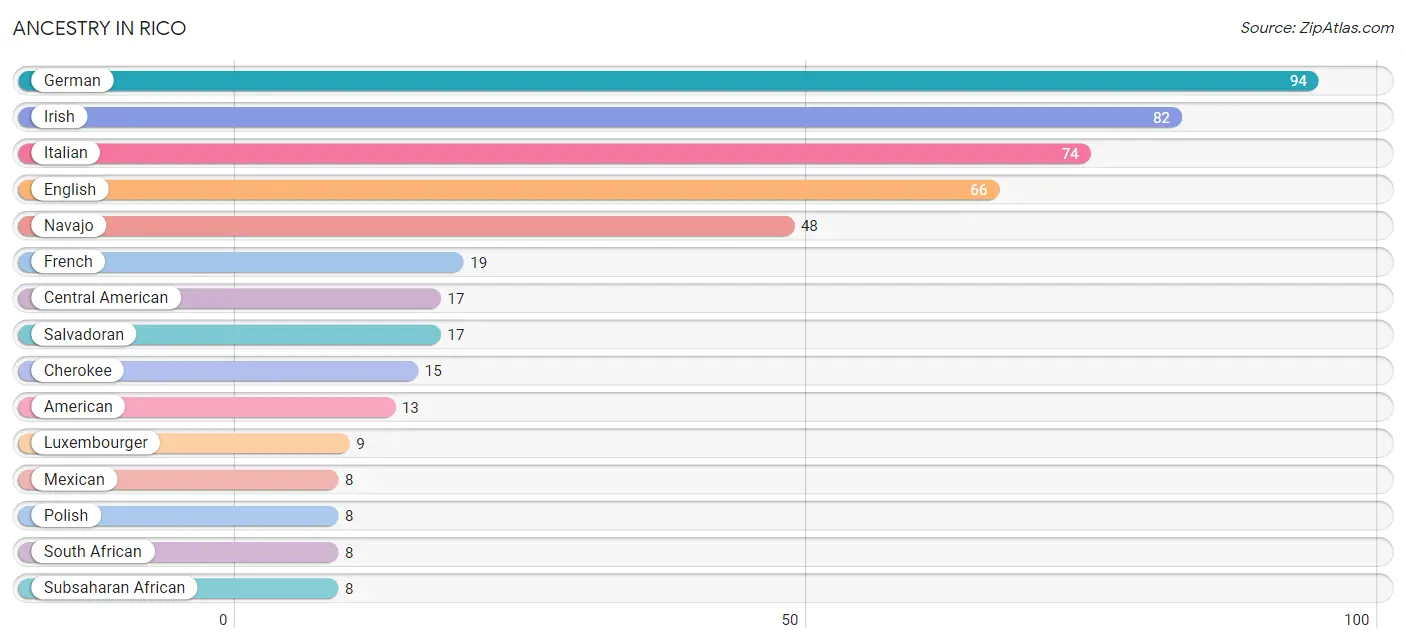
| Ancestry | # Population | % Population |
| American | 13 | 3.4% |
| Central American | 17 | 4.4% |
| Cherokee | 15 | 3.9% |
| Croatian | 3 | 0.8% |
| Czech | 4 | 1.1% |
| Eastern European | 3 | 0.8% |
| English | 66 | 17.3% |
| French | 19 | 5.0% |
| German | 94 | 24.6% |
| Greek | 3 | 0.8% |
| Hungarian | 1 | 0.3% |
| Irish | 82 | 21.5% |
| Italian | 74 | 19.4% |
| Luxembourger | 9 | 2.4% |
| Mexican | 8 | 2.1% |
| Navajo | 48 | 12.6% |
| Norwegian | 7 | 1.8% |
| Polish | 8 | 2.1% |
| Salvadoran | 17 | 4.4% |
| Scandinavian | 7 | 1.8% |
| South African | 8 | 2.1% |
| Subsaharan African | 8 | 2.1% | View All 22 Rows |
Immigrants in Rico
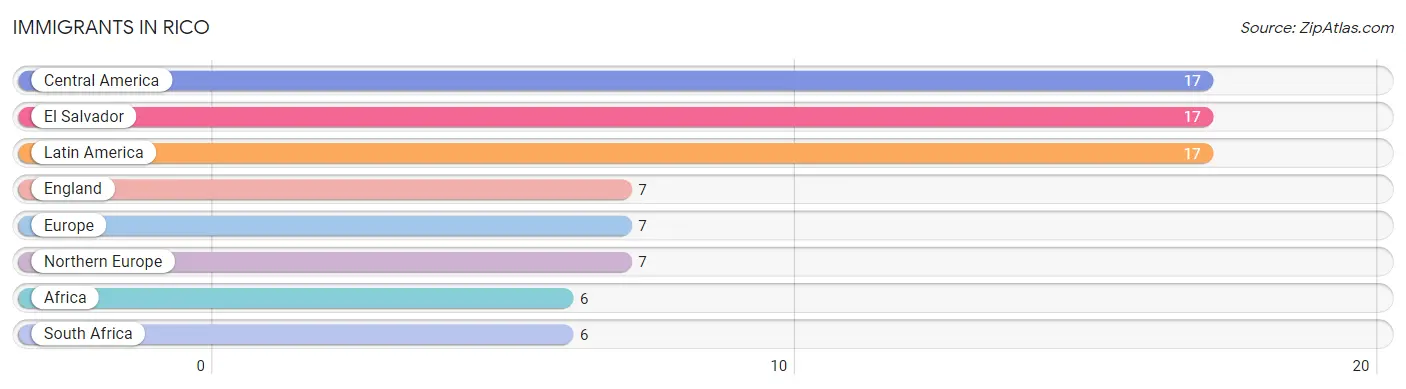
The most numerous immigrant groups reported in Rico came from Central America (17 | 4.4%), El Salvador (17 | 4.4%), Latin America (17 | 4.4%), England (7 | 1.8%), and Europe (7 | 1.8%), together accounting for 17.0% of all Rico residents.
| Immigration Origin | # Population | % Population |
| Africa | 6 | 1.6% |
| Central America | 17 | 4.4% |
| El Salvador | 17 | 4.4% |
| England | 7 | 1.8% |
| Europe | 7 | 1.8% |
| Latin America | 17 | 4.4% |
| Northern Europe | 7 | 1.8% |
| South Africa | 6 | 1.6% | View All 8 Rows |
Sex and Age in Rico
Sex and Age in Rico
The most populous age groups in Rico are 55 to 59 Years (29 | 17.0%) for men and 65 to 69 Years (47 | 22.3%) for women.
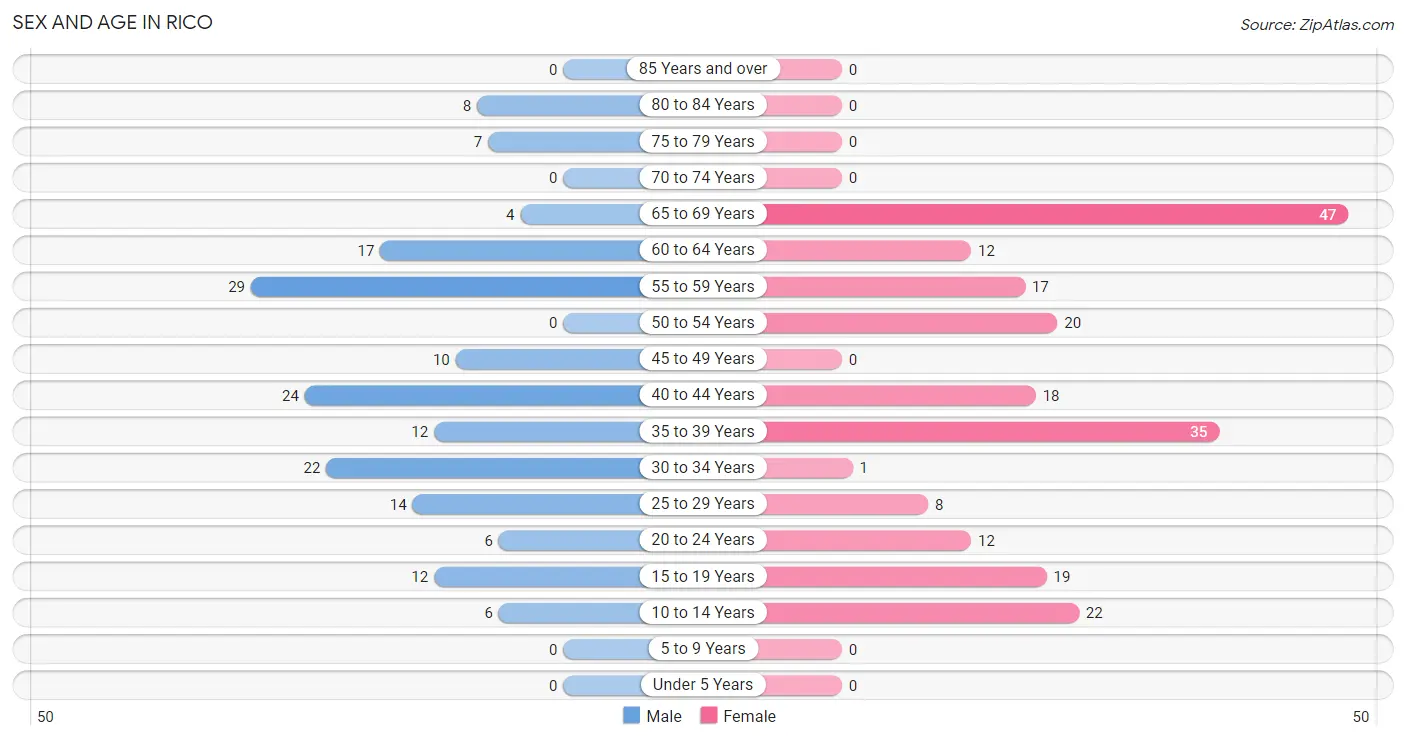
| Age Bracket | Male | Female |
| Under 5 Years | 0 (0.0%) | 0 (0.0%) |
| 5 to 9 Years | 0 (0.0%) | 0 (0.0%) |
| 10 to 14 Years | 6 (3.5%) | 22 (10.4%) |
| 15 to 19 Years | 12 (7.0%) | 19 (9.0%) |
| 20 to 24 Years | 6 (3.5%) | 12 (5.7%) |
| 25 to 29 Years | 14 (8.2%) | 8 (3.8%) |
| 30 to 34 Years | 22 (12.9%) | 1 (0.5%) |
| 35 to 39 Years | 12 (7.0%) | 35 (16.6%) |
| 40 to 44 Years | 24 (14.0%) | 18 (8.5%) |
| 45 to 49 Years | 10 (5.9%) | 0 (0.0%) |
| 50 to 54 Years | 0 (0.0%) | 20 (9.5%) |
| 55 to 59 Years | 29 (17.0%) | 17 (8.1%) |
| 60 to 64 Years | 17 (9.9%) | 12 (5.7%) |
| 65 to 69 Years | 4 (2.3%) | 47 (22.3%) |
| 70 to 74 Years | 0 (0.0%) | 0 (0.0%) |
| 75 to 79 Years | 7 (4.1%) | 0 (0.0%) |
| 80 to 84 Years | 8 (4.7%) | 0 (0.0%) |
| 85 Years and over | 0 (0.0%) | 0 (0.0%) |
| Total | 171 (100.0%) | 211 (100.0%) |
Families and Households in Rico
Median Family Size in Rico
The median family size in Rico is 2.32 persons per family, with married-couple families (66 | 57.9%) accounting for the largest median family size of 3.06 persons per family. On the other hand, single female/mother families (40 | 35.1%) represent the smallest median family size with 1.20 persons per family.
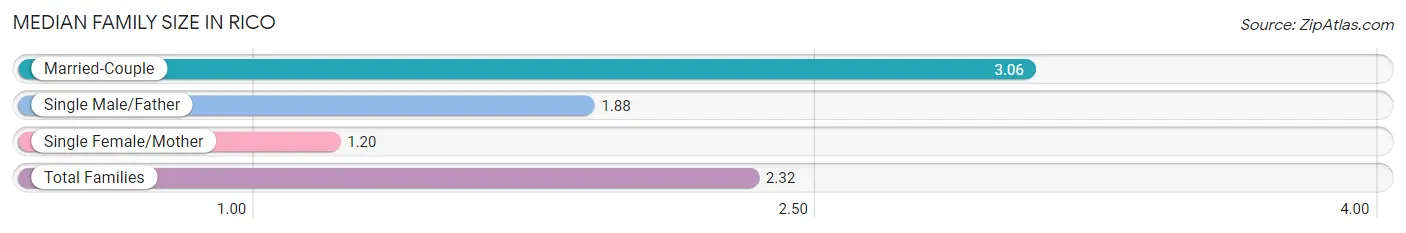
| Family Type | # Families | Family Size |
| Married-Couple | 66 (57.9%) | 3.06 |
| Single Male/Father | 8 (7.0%) | 1.88 |
| Single Female/Mother | 40 (35.1%) | 1.20 |
| Total Families | 114 (100.0%) | 2.32 |
Median Household Size in Rico
The median household size in Rico is 1.86 persons per household, with married-couple households (66 | 32.2%) accounting for the largest median household size of 3.09 persons per household. single female/mother households (40 | 19.5%) represent the smallest median household size with 1.20 persons per household.
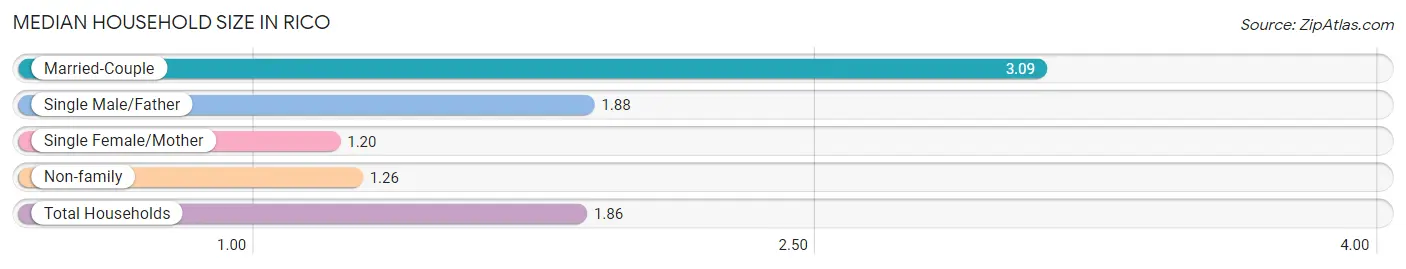
| Household Type | # Households | Household Size |
| Married-Couple | 66 (32.2%) | 3.09 |
| Single Male/Father | 8 (3.9%) | 1.88 |
| Single Female/Mother | 40 (19.5%) | 1.20 |
| Non-family | 91 (44.4%) | 1.26 |
| Total Households | 205 (100.0%) | 1.86 |
Household Size by Marriage Status in Rico
Out of a total of 205 households in Rico, 114 (55.6%) are family households, while 91 (44.4%) are nonfamily households. The most numerous type of family households are 3-person households, comprising 60, and the most common type of nonfamily households are 1-person households, comprising 72.
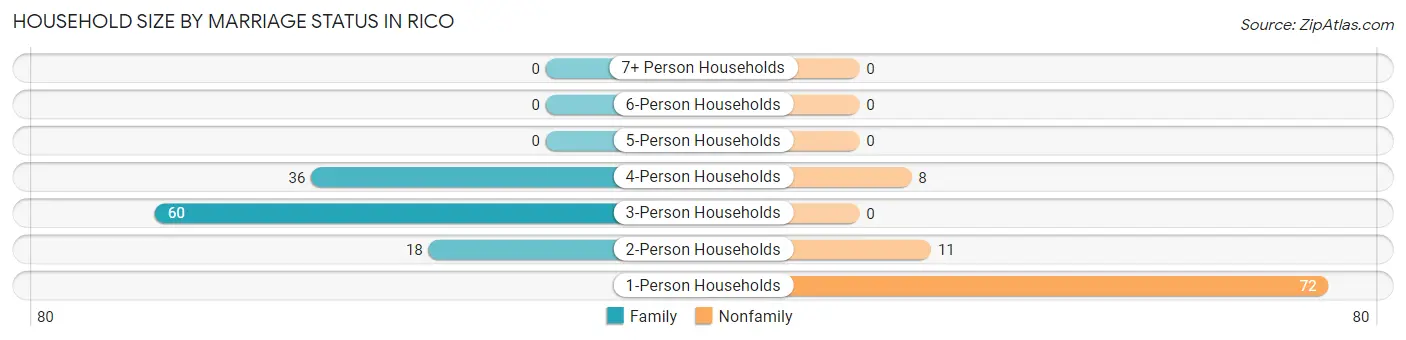
| Household Size | Family Households | Nonfamily Households |
| 1-Person Households | - | 72 (35.1%) |
| 2-Person Households | 18 (8.8%) | 11 (5.4%) |
| 3-Person Households | 60 (29.3%) | 0 (0.0%) |
| 4-Person Households | 36 (17.6%) | 8 (3.9%) |
| 5-Person Households | 0 (0.0%) | 0 (0.0%) |
| 6-Person Households | 0 (0.0%) | 0 (0.0%) |
| 7+ Person Households | 0 (0.0%) | 0 (0.0%) |
| Total | 114 (55.6%) | 91 (44.4%) |
Female Fertility in Rico
Fertility by Age in Rico
| Age Bracket | Women with Births | Births / 1,000 Women |
| 15 to 19 years | 0 (0.0%) | 0.0 |
| 20 to 34 years | 0 (0.0%) | 0.0 |
| 35 to 50 years | 0 (0.0%) | 0.0 |
| Total | 0 (0.0%) | 0.0 |
Fertility by Age by Marriage Status in Rico
| Age Bracket | Married | Unmarried |
| 15 to 19 years | 0 (0.0%) | 0 (0.0%) |
| 20 to 34 years | 0 (0.0%) | 0 (0.0%) |
| 35 to 50 years | 0 (0.0%) | 0 (0.0%) |
| Total | 0 (0.0%) | 0 (0.0%) |
Fertility by Education in Rico
| Educational Attainment | Women with Births | Births / 1,000 Women |
| Less than High School | 0 (0.0%) | 0.0 |
| High School Diploma | 0 (0.0%) | 0.0 |
| College or Associate's Degree | 0 (0.0%) | 0.0 |
| Bachelor's Degree | 0 (0.0%) | 0.0 |
| Graduate Degree | 0 (0.0%) | 0.0 |
| Total | 0 (0.0%) | 0.0 |
Fertility by Education by Marriage Status in Rico
| Educational Attainment | Married | Unmarried |
| Less than High School | 0 (0.0%) | 0 (0.0%) |
| High School Diploma | 0 (0.0%) | 0 (0.0%) |
| College or Associate's Degree | 0 (0.0%) | 0 (0.0%) |
| Bachelor's Degree | 0 (0.0%) | 0 (0.0%) |
| Graduate Degree | 0 (0.0%) | 0 (0.0%) |
| Total | 0 (0.0%) | 0 (0.0%) |
Employment Characteristics in Rico
Employment by Class of Employer in Rico
Among the 250 employed individuals in Rico, local government employees (119 | 47.6%), private company employees (74 | 29.6%), and state government employees (18 | 7.2%) make up the most common classes of employment.
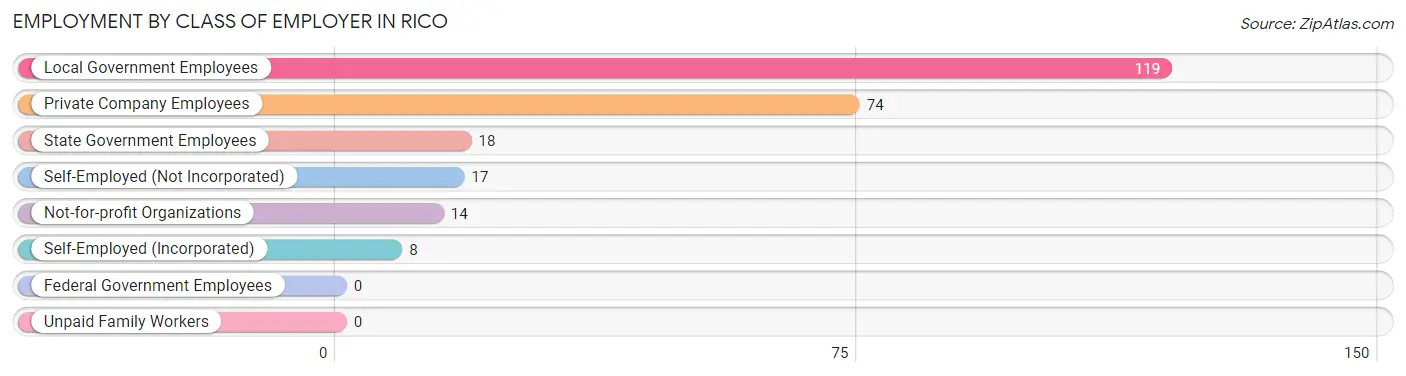
| Employer Class | # Employees | % Employees |
| Private Company Employees | 74 | 29.6% |
| Self-Employed (Incorporated) | 8 | 3.2% |
| Self-Employed (Not Incorporated) | 17 | 6.8% |
| Not-for-profit Organizations | 14 | 5.6% |
| Local Government Employees | 119 | 47.6% |
| State Government Employees | 18 | 7.2% |
| Federal Government Employees | 0 | 0.0% |
| Unpaid Family Workers | 0 | 0.0% |
| Total | 250 | 100.0% |
Employment Status by Age in Rico
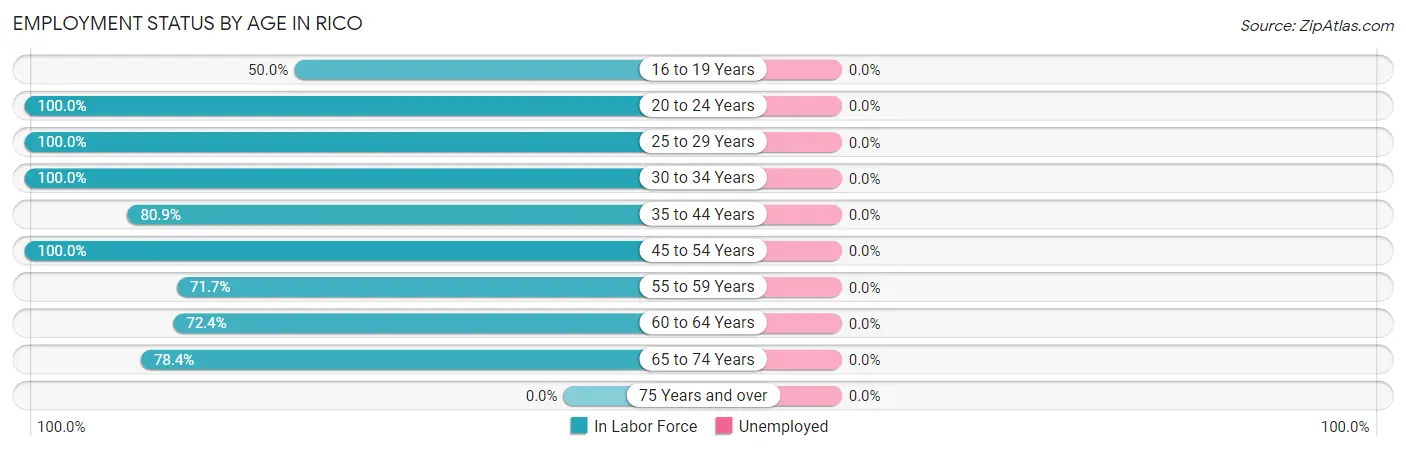
| Age Bracket | In Labor Force | Unemployed |
| 16 to 19 Years | 12 (50.0%) | 0 (0.0%) |
| 20 to 24 Years | 18 (100.0%) | 0 (0.0%) |
| 25 to 29 Years | 22 (100.0%) | 0 (0.0%) |
| 30 to 34 Years | 23 (100.0%) | 0 (0.0%) |
| 35 to 44 Years | 72 (80.9%) | 0 (0.0%) |
| 45 to 54 Years | 30 (100.0%) | 0 (0.0%) |
| 55 to 59 Years | 33 (71.7%) | 0 (0.0%) |
| 60 to 64 Years | 21 (72.4%) | 0 (0.0%) |
| 65 to 74 Years | 40 (78.4%) | 0 (0.0%) |
| 75 Years and over | 0 (0.0%) | 0 (0.0%) |
| Total | 271 (78.1%) | 0 (0.0%) |
Employment Status by Educational Attainment in Rico
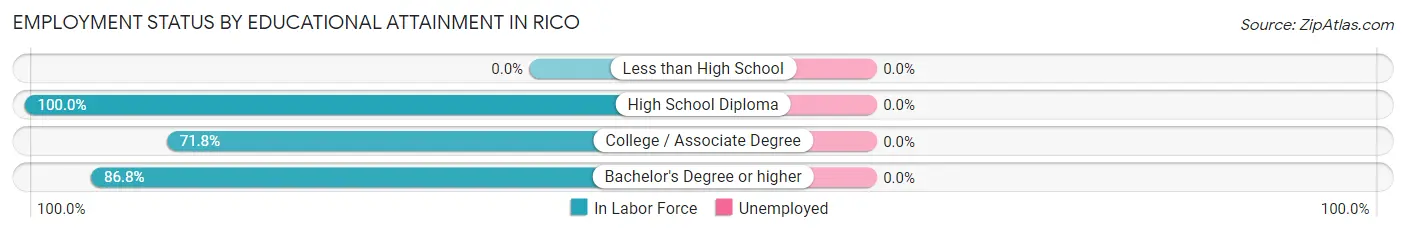
| Educational Attainment | In Labor Force | Unemployed |
| Less than High School | 0 (0.0%) | 0 (0.0%) |
| High School Diploma | 40 (100.0%) | 0 (0.0%) |
| College / Associate Degree | 56 (71.8%) | 0 (0.0%) |
| Bachelor's Degree or higher | 105 (86.8%) | 0 (0.0%) |
| Total | 201 (84.1%) | 0 (0.0%) |
Employment Occupations by Sex in Rico
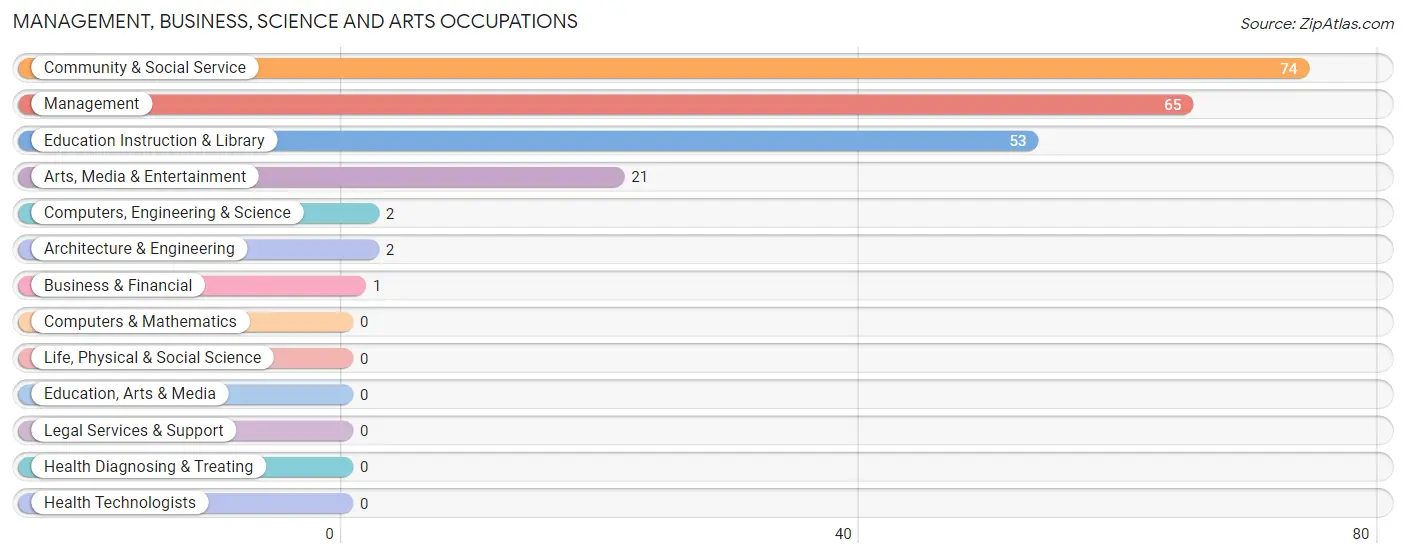
Management, Business, Science and Arts Occupations
The most common Management, Business, Science and Arts occupations in Rico are Community & Social Service (74 | 27.3%), Management (65 | 24.0%), Education Instruction & Library (53 | 19.6%), Arts, Media & Entertainment (21 | 7.7%), and Computers, Engineering & Science (2 | 0.7%).
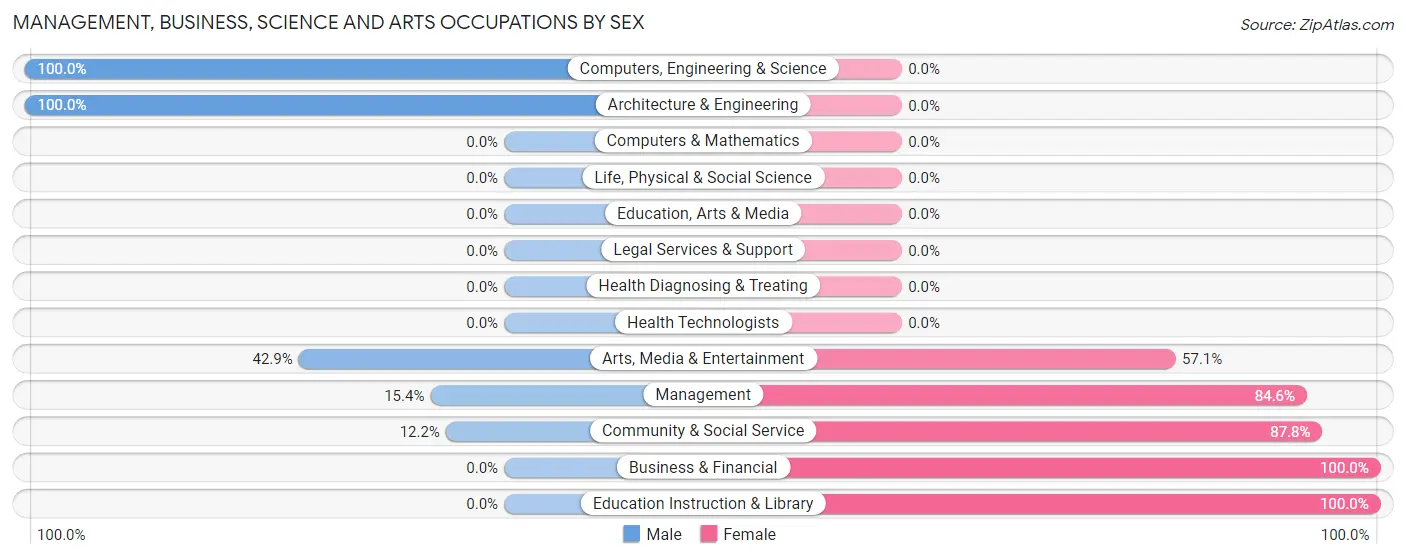
Management, Business, Science and Arts Occupations by Sex
Within the Management, Business, Science and Arts occupations in Rico, the most male-oriented occupations are Computers, Engineering & Science (100.0%), Architecture & Engineering (100.0%), and Arts, Media & Entertainment (42.9%), while the most female-oriented occupations are Business & Financial (100.0%), Education Instruction & Library (100.0%), and Community & Social Service (87.8%).
| Occupation | Male | Female |
| Management | 10 (15.4%) | 55 (84.6%) |
| Business & Financial | 0 (0.0%) | 1 (100.0%) |
| Computers, Engineering & Science | 2 (100.0%) | 0 (0.0%) |
| Computers & Mathematics | 0 (0.0%) | 0 (0.0%) |
| Architecture & Engineering | 2 (100.0%) | 0 (0.0%) |
| Life, Physical & Social Science | 0 (0.0%) | 0 (0.0%) |
| Community & Social Service | 9 (12.2%) | 65 (87.8%) |
| Education, Arts & Media | 0 (0.0%) | 0 (0.0%) |
| Legal Services & Support | 0 (0.0%) | 0 (0.0%) |
| Education Instruction & Library | 0 (0.0%) | 53 (100.0%) |
| Arts, Media & Entertainment | 9 (42.9%) | 12 (57.1%) |
| Health Diagnosing & Treating | 0 (0.0%) | 0 (0.0%) |
| Health Technologists | 0 (0.0%) | 0 (0.0%) |
| Total (Category) | 21 (14.8%) | 121 (85.2%) |
| Total (Overall) | 121 (44.7%) | 150 (55.3%) |
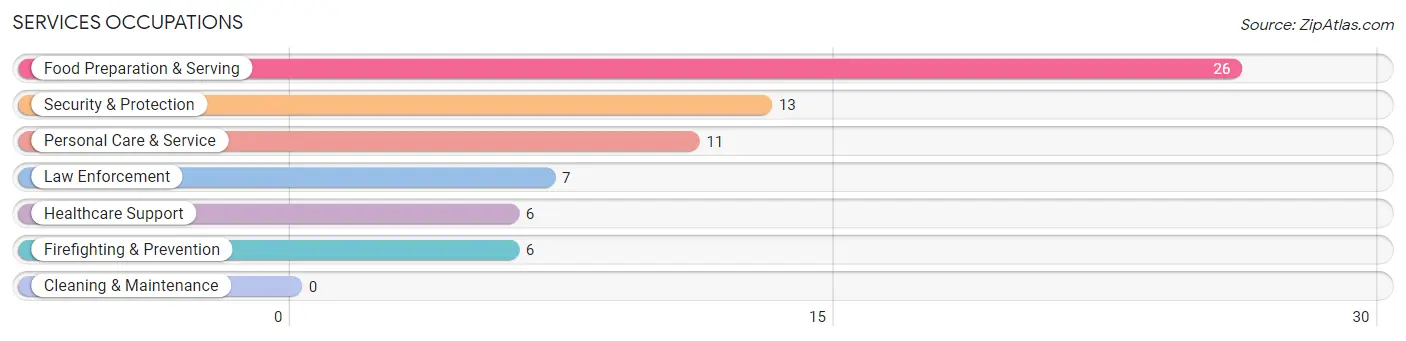
Services Occupations
The most common Services occupations in Rico are Food Preparation & Serving (26 | 9.6%), Security & Protection (13 | 4.8%), Personal Care & Service (11 | 4.1%), Law Enforcement (7 | 2.6%), and Healthcare Support (6 | 2.2%).
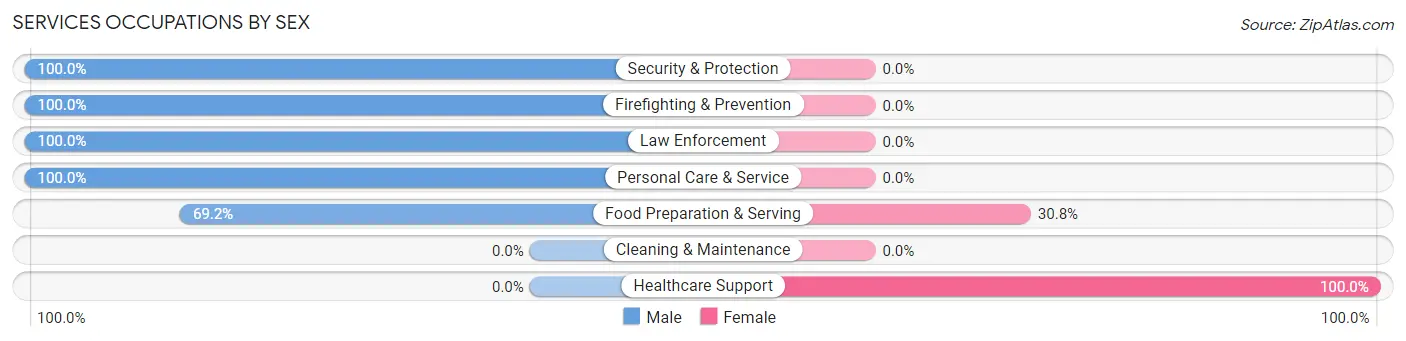
Services Occupations by Sex
Within the Services occupations in Rico, the most male-oriented occupations are Security & Protection (100.0%), Firefighting & Prevention (100.0%), and Law Enforcement (100.0%), while the most female-oriented occupations are Healthcare Support (100.0%), and Food Preparation & Serving (30.8%).
| Occupation | Male | Female |
| Healthcare Support | 0 (0.0%) | 6 (100.0%) |
| Security & Protection | 13 (100.0%) | 0 (0.0%) |
| Firefighting & Prevention | 6 (100.0%) | 0 (0.0%) |
| Law Enforcement | 7 (100.0%) | 0 (0.0%) |
| Food Preparation & Serving | 18 (69.2%) | 8 (30.8%) |
| Cleaning & Maintenance | 0 (0.0%) | 0 (0.0%) |
| Personal Care & Service | 11 (100.0%) | 0 (0.0%) |
| Total (Category) | 42 (75.0%) | 14 (25.0%) |
| Total (Overall) | 121 (44.7%) | 150 (55.3%) |
Sales and Office Occupations
The most common Sales and Office occupations in Rico are Sales & Related (23 | 8.5%), and Office & Administration (16 | 5.9%).

Sales and Office Occupations by Sex

| Occupation | Male | Female |
| Sales & Related | 8 (34.8%) | 15 (65.2%) |
| Office & Administration | 16 (100.0%) | 0 (0.0%) |
| Total (Category) | 24 (61.5%) | 15 (38.5%) |
| Total (Overall) | 121 (44.7%) | 150 (55.3%) |
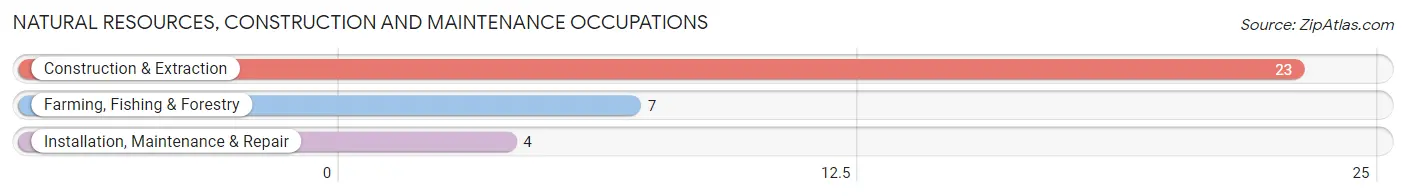
Natural Resources, Construction and Maintenance Occupations
The most common Natural Resources, Construction and Maintenance occupations in Rico are Construction & Extraction (23 | 8.5%), Farming, Fishing & Forestry (7 | 2.6%), and Installation, Maintenance & Repair (4 | 1.5%).
Natural Resources, Construction and Maintenance Occupations by Sex
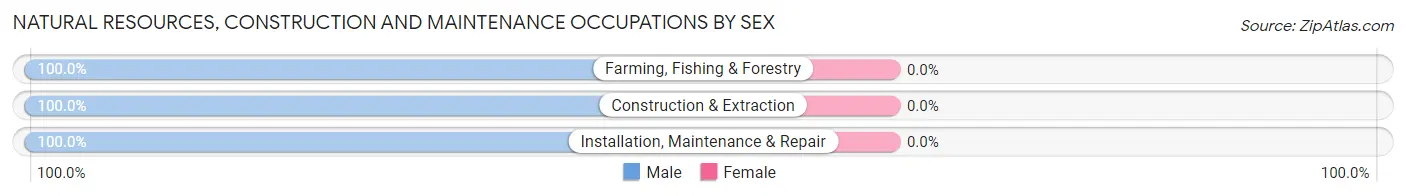
| Occupation | Male | Female |
| Farming, Fishing & Forestry | 7 (100.0%) | 0 (0.0%) |
| Construction & Extraction | 23 (100.0%) | 0 (0.0%) |
| Installation, Maintenance & Repair | 4 (100.0%) | 0 (0.0%) |
| Total (Category) | 34 (100.0%) | 0 (0.0%) |
| Total (Overall) | 121 (44.7%) | 150 (55.3%) |
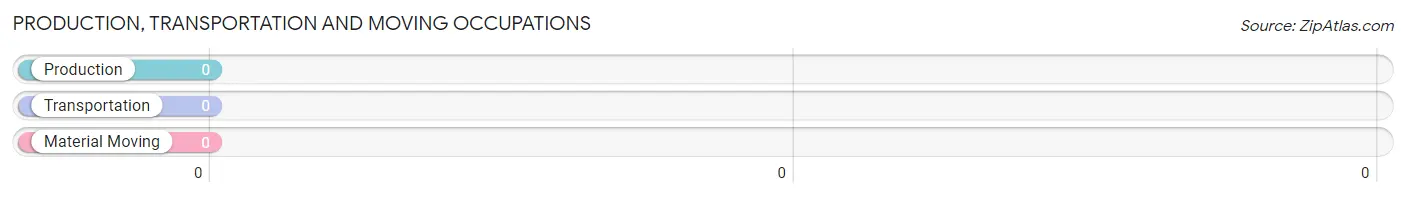
Production, Transportation and Moving Occupations
Production, Transportation and Moving Occupations by Sex
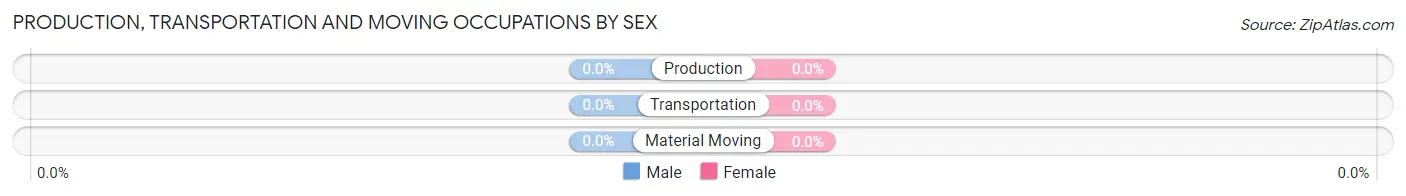
| Occupation | Male | Female |
| Production | 0 (0.0%) | 0 (0.0%) |
| Transportation | 0 (0.0%) | 0 (0.0%) |
| Material Moving | 0 (0.0%) | 0 (0.0%) |
| Total (Category) | 0 (0.0%) | 0 (0.0%) |
| Total (Overall) | 121 (44.7%) | 150 (55.3%) |
Employment Industries by Sex in Rico
Employment Industries in Rico
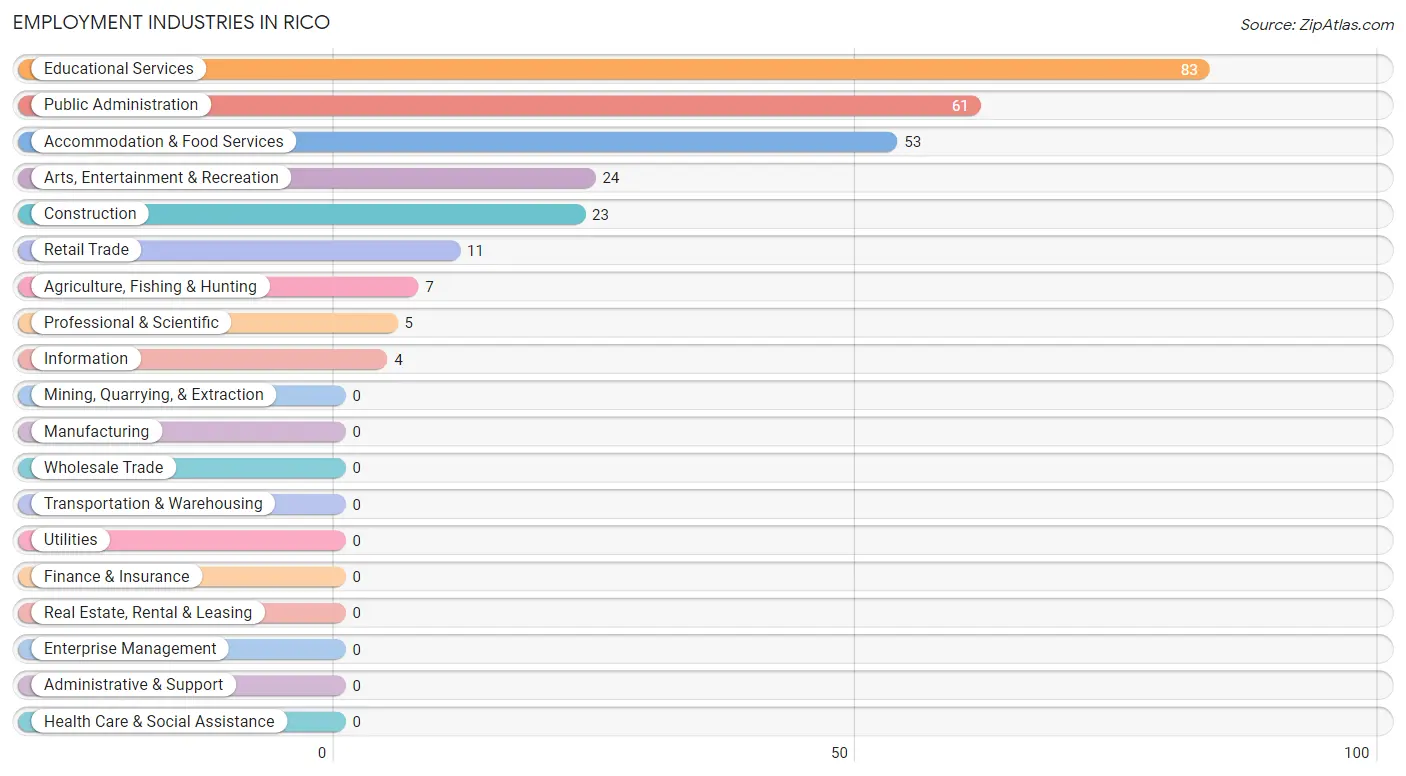
The major employment industries in Rico include Educational Services (83 | 30.6%), Public Administration (61 | 22.5%), Accommodation & Food Services (53 | 19.6%), Arts, Entertainment & Recreation (24 | 8.9%), and Construction (23 | 8.5%).
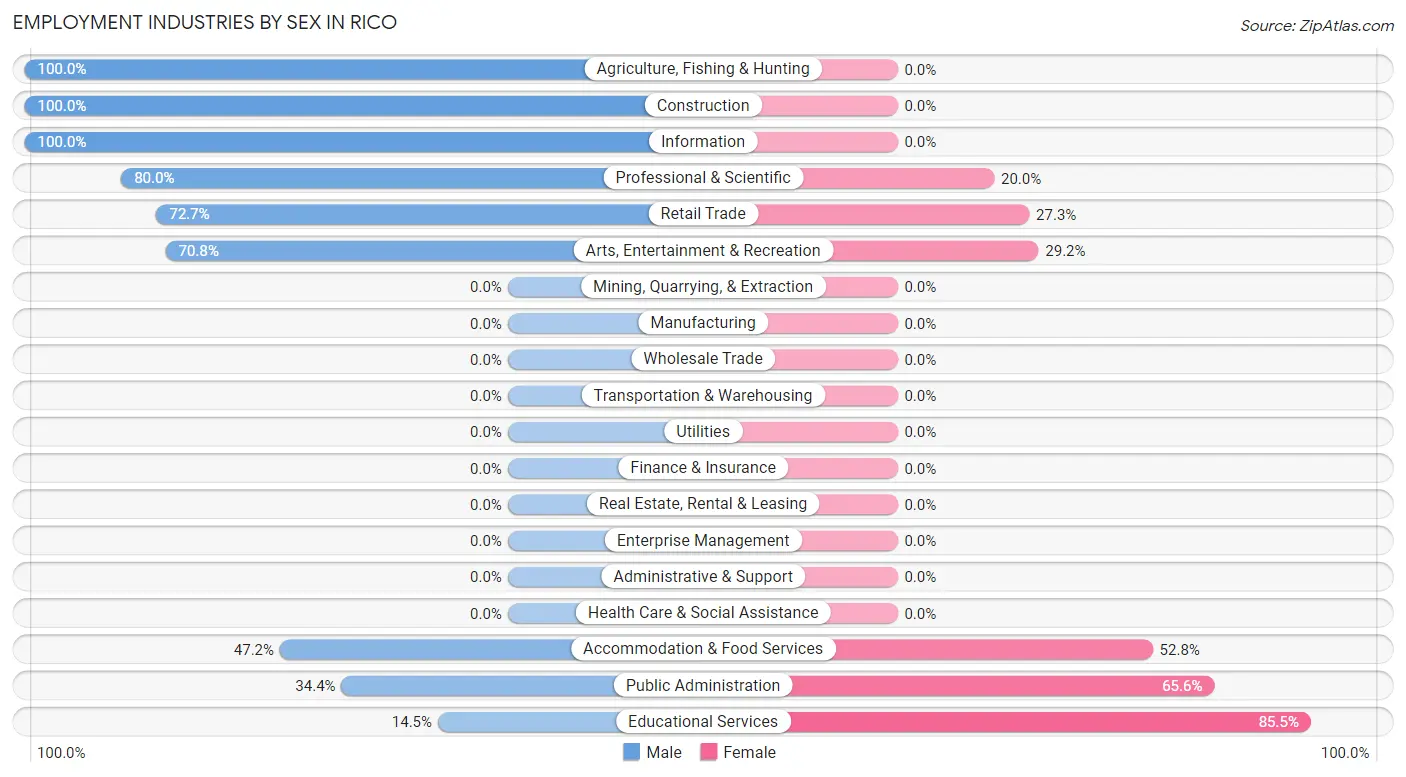
Employment Industries by Sex in Rico
The Rico industries that see more men than women are Agriculture, Fishing & Hunting (100.0%), Construction (100.0%), and Information (100.0%), whereas the industries that tend to have a higher number of women are Educational Services (85.5%), Public Administration (65.6%), and Accommodation & Food Services (52.8%).
| Industry | Male | Female |
| Agriculture, Fishing & Hunting | 7 (100.0%) | 0 (0.0%) |
| Mining, Quarrying, & Extraction | 0 (0.0%) | 0 (0.0%) |
| Construction | 23 (100.0%) | 0 (0.0%) |
| Manufacturing | 0 (0.0%) | 0 (0.0%) |
| Wholesale Trade | 0 (0.0%) | 0 (0.0%) |
| Retail Trade | 8 (72.7%) | 3 (27.3%) |
| Transportation & Warehousing | 0 (0.0%) | 0 (0.0%) |
| Utilities | 0 (0.0%) | 0 (0.0%) |
| Information | 4 (100.0%) | 0 (0.0%) |
| Finance & Insurance | 0 (0.0%) | 0 (0.0%) |
| Real Estate, Rental & Leasing | 0 (0.0%) | 0 (0.0%) |
| Professional & Scientific | 4 (80.0%) | 1 (20.0%) |
| Enterprise Management | 0 (0.0%) | 0 (0.0%) |
| Administrative & Support | 0 (0.0%) | 0 (0.0%) |
| Educational Services | 12 (14.5%) | 71 (85.5%) |
| Health Care & Social Assistance | 0 (0.0%) | 0 (0.0%) |
| Arts, Entertainment & Recreation | 17 (70.8%) | 7 (29.2%) |
| Accommodation & Food Services | 25 (47.2%) | 28 (52.8%) |
| Public Administration | 21 (34.4%) | 40 (65.6%) |
| Total | 121 (44.7%) | 150 (55.3%) |
Education in Rico
School Enrollment in Rico
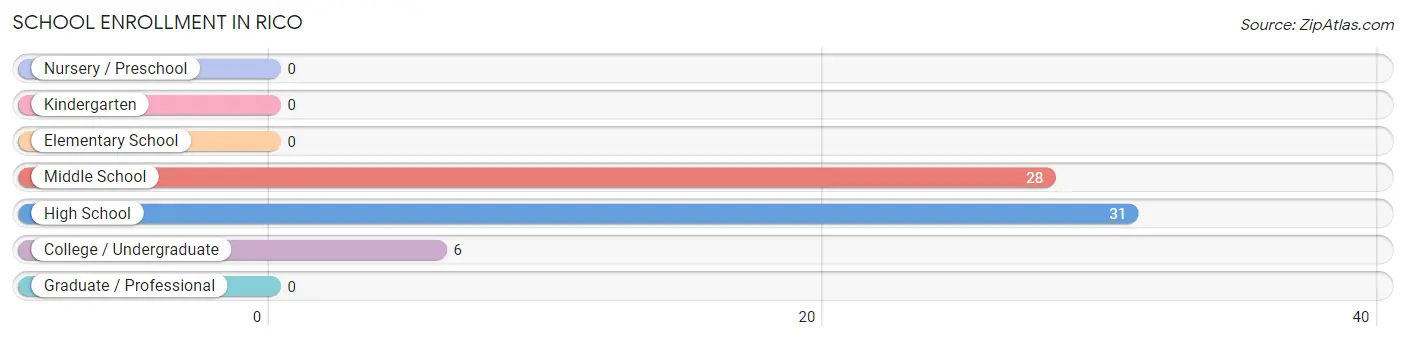
The most common levels of schooling among the 65 students in Rico are high school (31 | 47.7%), middle school (28 | 43.1%), and college / undergraduate (6 | 9.2%).
| School Level | # Students | % Students |
| Nursery / Preschool | 0 | 0.0% |
| Kindergarten | 0 | 0.0% |
| Elementary School | 0 | 0.0% |
| Middle School | 28 | 43.1% |
| High School | 31 | 47.7% |
| College / Undergraduate | 6 | 9.2% |
| Graduate / Professional | 0 | 0.0% |
| Total | 65 | 100.0% |
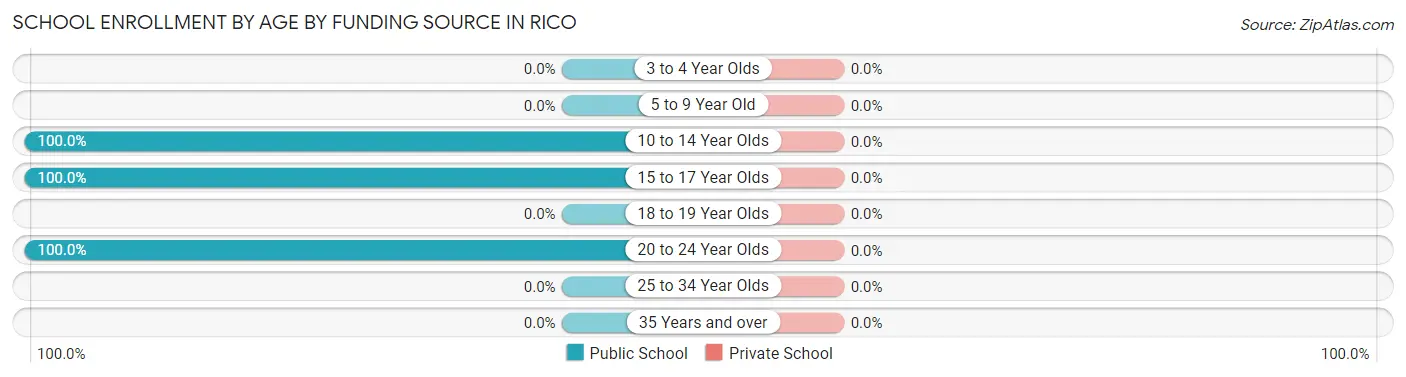
School Enrollment by Age by Funding Source in Rico
| Age Bracket | Public School | Private School |
| 3 to 4 Year Olds | 0 (0.0%) | 0 (0.0%) |
| 5 to 9 Year Old | 0 (0.0%) | 0 (0.0%) |
| 10 to 14 Year Olds | 28 (100.0%) | 0 (0.0%) |
| 15 to 17 Year Olds | 31 (100.0%) | 0 (0.0%) |
| 18 to 19 Year Olds | 0 (0.0%) | 0 (0.0%) |
| 20 to 24 Year Olds | 6 (100.0%) | 0 (0.0%) |
| 25 to 34 Year Olds | 0 (0.0%) | 0 (0.0%) |
| 35 Years and over | 0 (0.0%) | 0 (0.0%) |
| Total | 65 (100.0%) | 0 (0.0%) |
Educational Attainment by Field of Study in Rico
Education (30 | 19.5%), business (26 | 16.9%), literature & languages (24 | 15.6%), liberal arts & history (21 | 13.6%), and bio, nature & agricultural (20 | 13.0%) are the most common fields of study among 154 individuals in Rico who have obtained a bachelor's degree or higher.
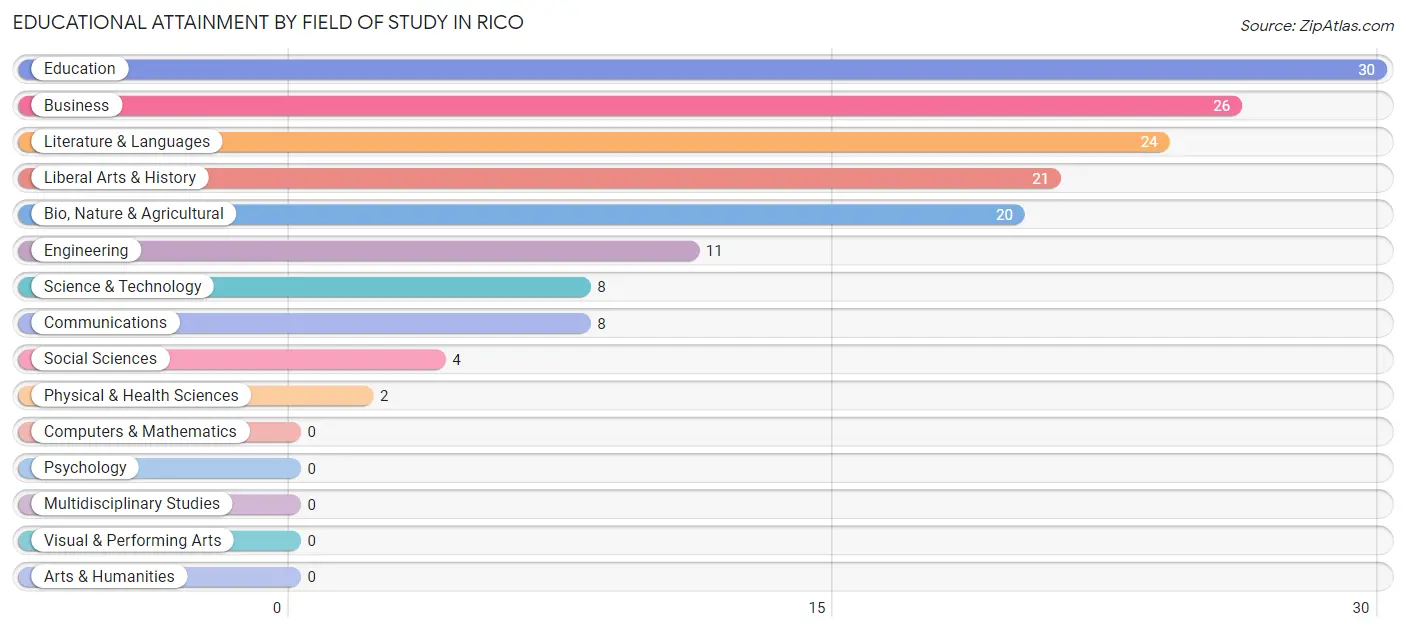
| Field of Study | # Graduates | % Graduates |
| Computers & Mathematics | 0 | 0.0% |
| Bio, Nature & Agricultural | 20 | 13.0% |
| Physical & Health Sciences | 2 | 1.3% |
| Psychology | 0 | 0.0% |
| Social Sciences | 4 | 2.6% |
| Engineering | 11 | 7.1% |
| Multidisciplinary Studies | 0 | 0.0% |
| Science & Technology | 8 | 5.2% |
| Business | 26 | 16.9% |
| Education | 30 | 19.5% |
| Literature & Languages | 24 | 15.6% |
| Liberal Arts & History | 21 | 13.6% |
| Visual & Performing Arts | 0 | 0.0% |
| Communications | 8 | 5.2% |
| Arts & Humanities | 0 | 0.0% |
| Total | 154 | 100.0% |
Transportation & Commute in Rico
Vehicle Availability by Sex in Rico
The most prevalent vehicle ownership categories in Rico are males with 2 vehicles (38, accounting for 33.9%) and females with 2 vehicles (68, making up 27.5%).
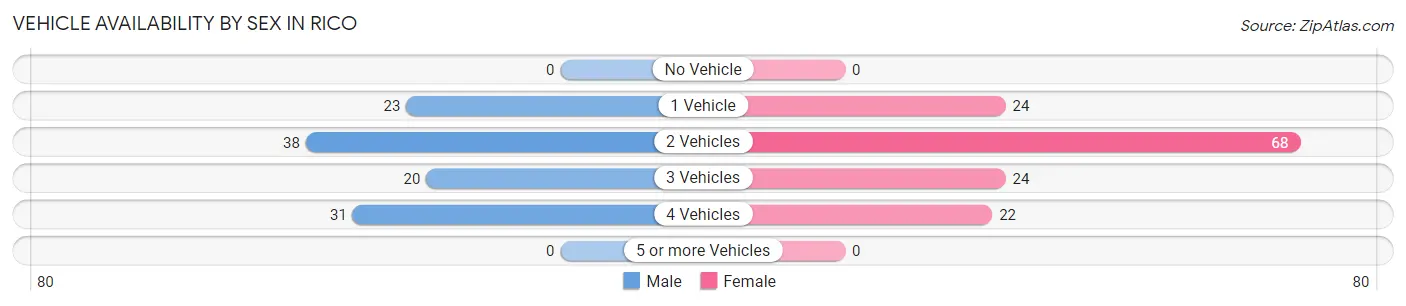
| Vehicles Available | Male | Female |
| No Vehicle | 0 (0.0%) | 0 (0.0%) |
| 1 Vehicle | 23 (20.5%) | 24 (17.4%) |
| 2 Vehicles | 38 (33.9%) | 68 (49.3%) |
| 3 Vehicles | 20 (17.9%) | 24 (17.4%) |
| 4 Vehicles | 31 (27.7%) | 22 (15.9%) |
| 5 or more Vehicles | 0 (0.0%) | 0 (0.0%) |
| Total | 112 (100.0%) | 138 (100.0%) |
Commute Time in Rico
The most frequently occuring commute durations in Rico are 30 to 34 minutes (45 commuters, 19.6%), 10 to 14 minutes (44 commuters, 19.1%), and 45 to 59 minutes (42 commuters, 18.3%).
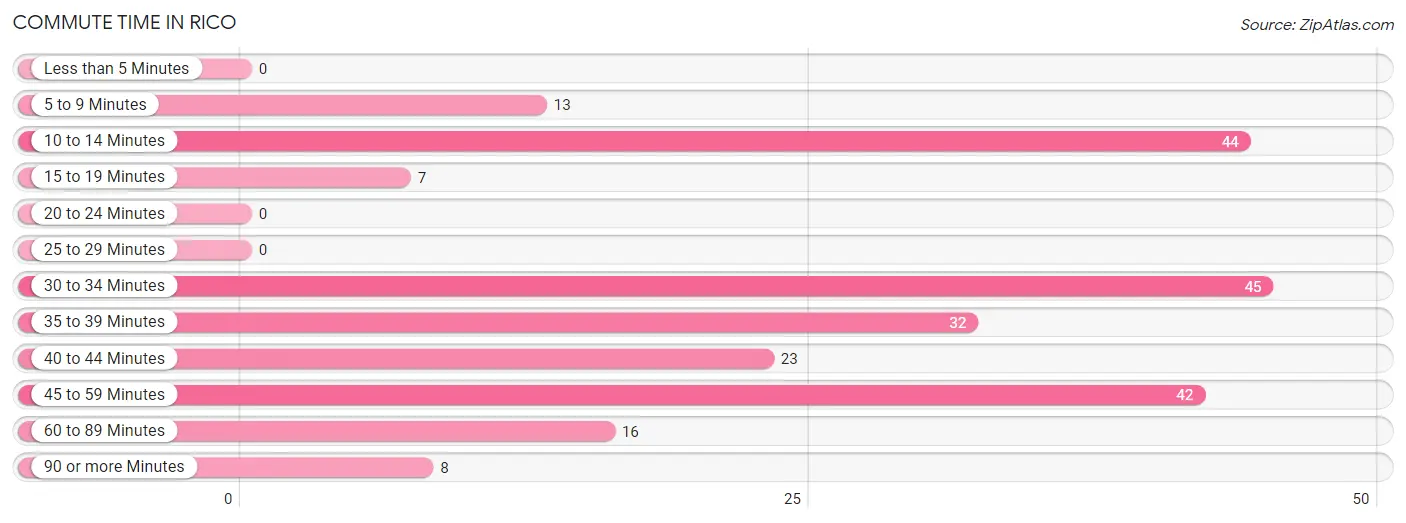
| Commute Time | # Commuters | % Commuters |
| Less than 5 Minutes | 0 | 0.0% |
| 5 to 9 Minutes | 13 | 5.7% |
| 10 to 14 Minutes | 44 | 19.1% |
| 15 to 19 Minutes | 7 | 3.0% |
| 20 to 24 Minutes | 0 | 0.0% |
| 25 to 29 Minutes | 0 | 0.0% |
| 30 to 34 Minutes | 45 | 19.6% |
| 35 to 39 Minutes | 32 | 13.9% |
| 40 to 44 Minutes | 23 | 10.0% |
| 45 to 59 Minutes | 42 | 18.3% |
| 60 to 89 Minutes | 16 | 7.0% |
| 90 or more Minutes | 8 | 3.5% |
Commute Time by Sex in Rico
The most common commute times in Rico are 45 to 59 minutes (28 commuters, 30.4%) for males and 10 to 14 minutes (44 commuters, 31.9%) for females.
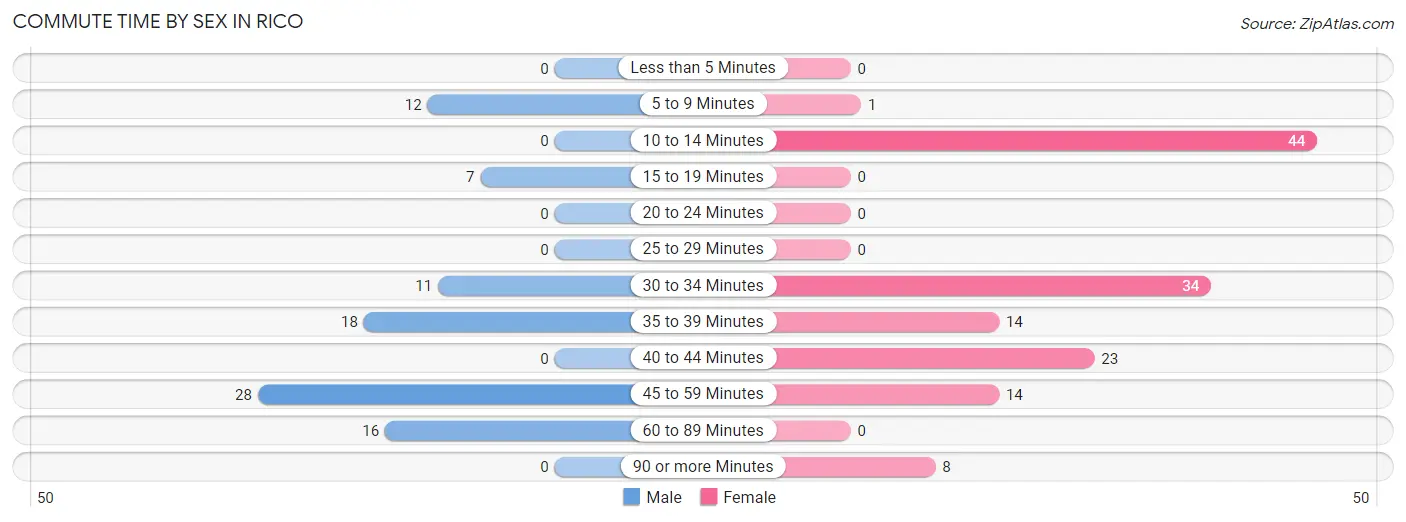
| Commute Time | Male | Female |
| Less than 5 Minutes | 0 (0.0%) | 0 (0.0%) |
| 5 to 9 Minutes | 12 (13.0%) | 1 (0.7%) |
| 10 to 14 Minutes | 0 (0.0%) | 44 (31.9%) |
| 15 to 19 Minutes | 7 (7.6%) | 0 (0.0%) |
| 20 to 24 Minutes | 0 (0.0%) | 0 (0.0%) |
| 25 to 29 Minutes | 0 (0.0%) | 0 (0.0%) |
| 30 to 34 Minutes | 11 (12.0%) | 34 (24.6%) |
| 35 to 39 Minutes | 18 (19.6%) | 14 (10.1%) |
| 40 to 44 Minutes | 0 (0.0%) | 23 (16.7%) |
| 45 to 59 Minutes | 28 (30.4%) | 14 (10.1%) |
| 60 to 89 Minutes | 16 (17.4%) | 0 (0.0%) |
| 90 or more Minutes | 0 (0.0%) | 8 (5.8%) |
Time of Departure to Work by Sex in Rico
The most frequent times of departure to work in Rico are 7:00 AM to 7:29 AM (33, 35.9%) for males and 8:00 AM to 8:29 AM (64, 46.4%) for females.
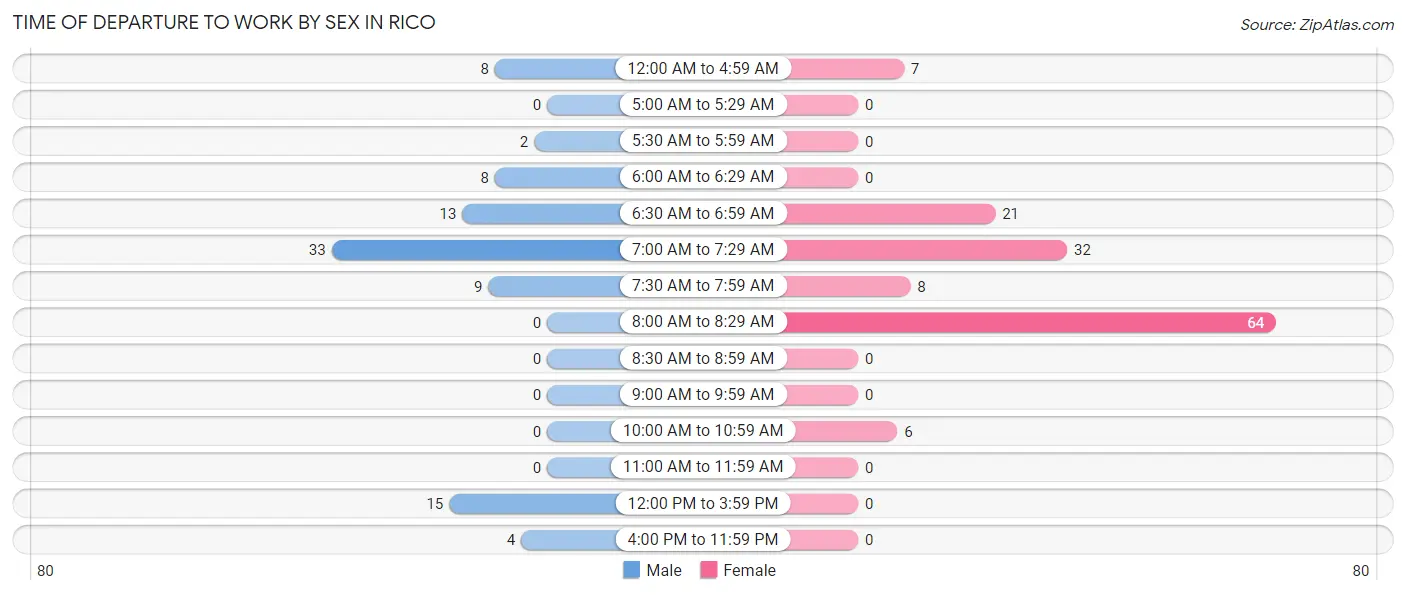
| Time of Departure | Male | Female |
| 12:00 AM to 4:59 AM | 8 (8.7%) | 7 (5.1%) |
| 5:00 AM to 5:29 AM | 0 (0.0%) | 0 (0.0%) |
| 5:30 AM to 5:59 AM | 2 (2.2%) | 0 (0.0%) |
| 6:00 AM to 6:29 AM | 8 (8.7%) | 0 (0.0%) |
| 6:30 AM to 6:59 AM | 13 (14.1%) | 21 (15.2%) |
| 7:00 AM to 7:29 AM | 33 (35.9%) | 32 (23.2%) |
| 7:30 AM to 7:59 AM | 9 (9.8%) | 8 (5.8%) |
| 8:00 AM to 8:29 AM | 0 (0.0%) | 64 (46.4%) |
| 8:30 AM to 8:59 AM | 0 (0.0%) | 0 (0.0%) |
| 9:00 AM to 9:59 AM | 0 (0.0%) | 0 (0.0%) |
| 10:00 AM to 10:59 AM | 0 (0.0%) | 6 (4.3%) |
| 11:00 AM to 11:59 AM | 0 (0.0%) | 0 (0.0%) |
| 12:00 PM to 3:59 PM | 15 (16.3%) | 0 (0.0%) |
| 4:00 PM to 11:59 PM | 4 (4.3%) | 0 (0.0%) |
| Total | 92 (100.0%) | 138 (100.0%) |
Housing Occupancy in Rico
Occupancy by Ownership in Rico
Of the total 205 dwellings in Rico, owner-occupied units account for 159 (77.6%), while renter-occupied units make up 46 (22.4%).
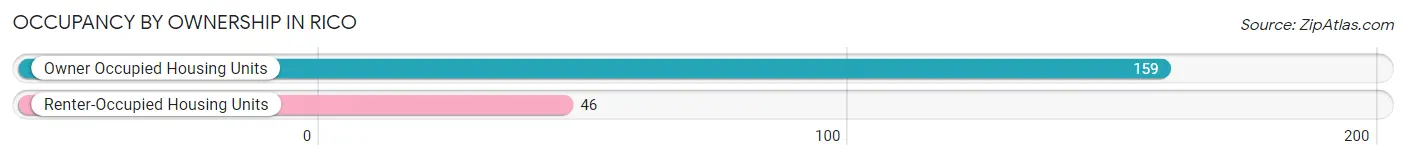
| Occupancy | # Housing Units | % Housing Units |
| Owner Occupied Housing Units | 159 | 77.6% |
| Renter-Occupied Housing Units | 46 | 22.4% |
| Total Occupied Housing Units | 205 | 100.0% |
Occupancy by Household Size in Rico
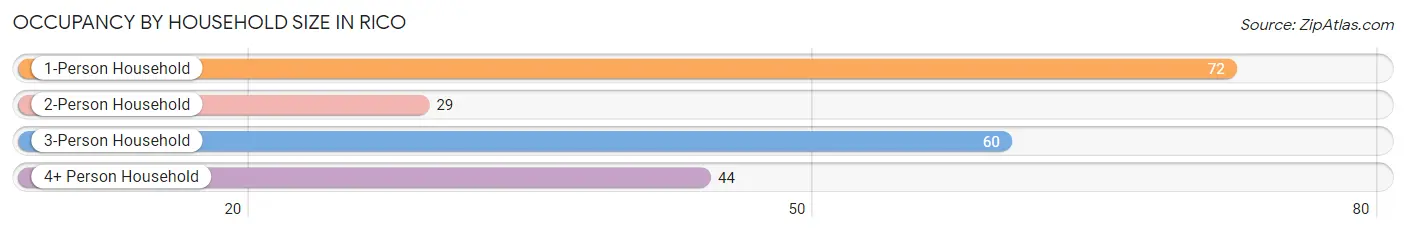
| Household Size | # Housing Units | % Housing Units |
| 1-Person Household | 72 | 35.1% |
| 2-Person Household | 29 | 14.1% |
| 3-Person Household | 60 | 29.3% |
| 4+ Person Household | 44 | 21.5% |
| Total Housing Units | 205 | 100.0% |
Occupancy by Ownership by Household Size in Rico
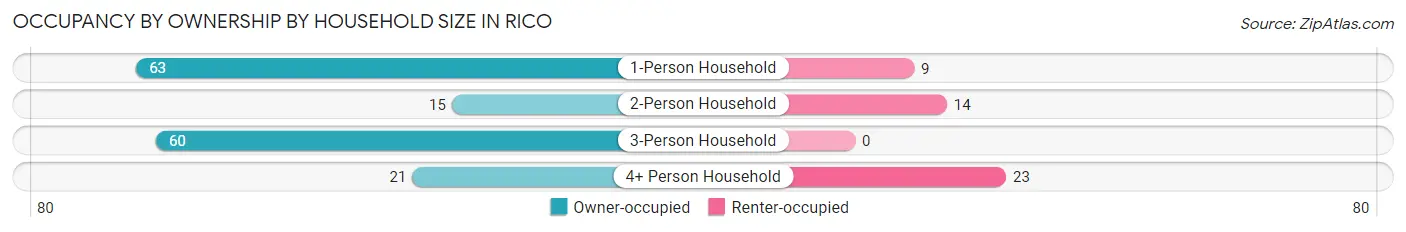
| Household Size | Owner-occupied | Renter-occupied |
| 1-Person Household | 63 (87.5%) | 9 (12.5%) |
| 2-Person Household | 15 (51.7%) | 14 (48.3%) |
| 3-Person Household | 60 (100.0%) | 0 (0.0%) |
| 4+ Person Household | 21 (47.7%) | 23 (52.3%) |
| Total Housing Units | 159 (77.6%) | 46 (22.4%) |
Occupancy by Educational Attainment in Rico
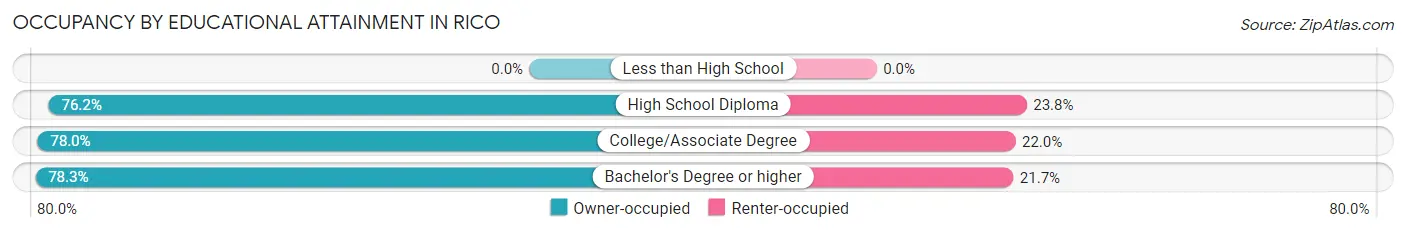
| Household Size | Owner-occupied | Renter-occupied |
| Less than High School | 0 (0.0%) | 0 (0.0%) |
| High School Diploma | 48 (76.2%) | 15 (23.8%) |
| College/Associate Degree | 46 (78.0%) | 13 (22.0%) |
| Bachelor's Degree or higher | 65 (78.3%) | 18 (21.7%) |
Occupancy by Age of Householder in Rico
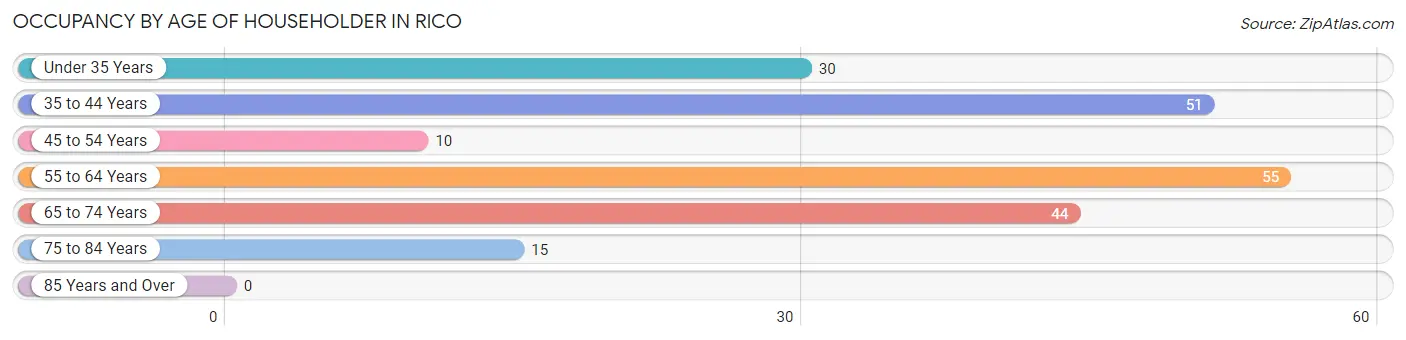
| Age Bracket | # Households | % Households |
| Under 35 Years | 30 | 14.6% |
| 35 to 44 Years | 51 | 24.9% |
| 45 to 54 Years | 10 | 4.9% |
| 55 to 64 Years | 55 | 26.8% |
| 65 to 74 Years | 44 | 21.5% |
| 75 to 84 Years | 15 | 7.3% |
| 85 Years and Over | 0 | 0.0% |
| Total | 205 | 100.0% |
Housing Finances in Rico
Median Income by Occupancy in Rico
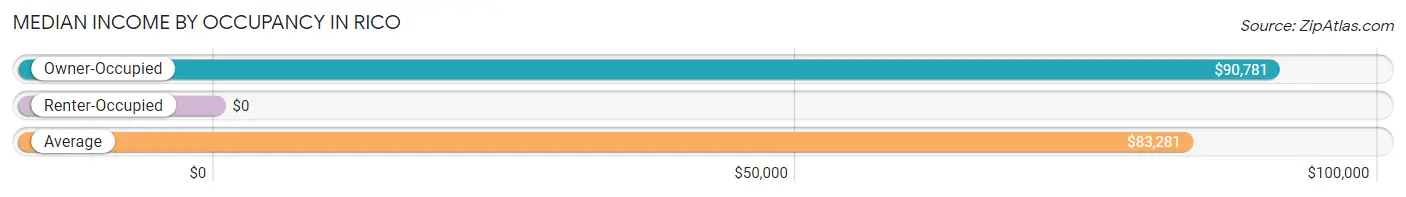
| Occupancy Type | # Households | Median Income |
| Owner-Occupied | 159 (77.6%) | $90,781 |
| Renter-Occupied | 46 (22.4%) | $0 |
| Average | 205 (100.0%) | $83,281 |
Occupancy by Householder Income Bracket in Rico
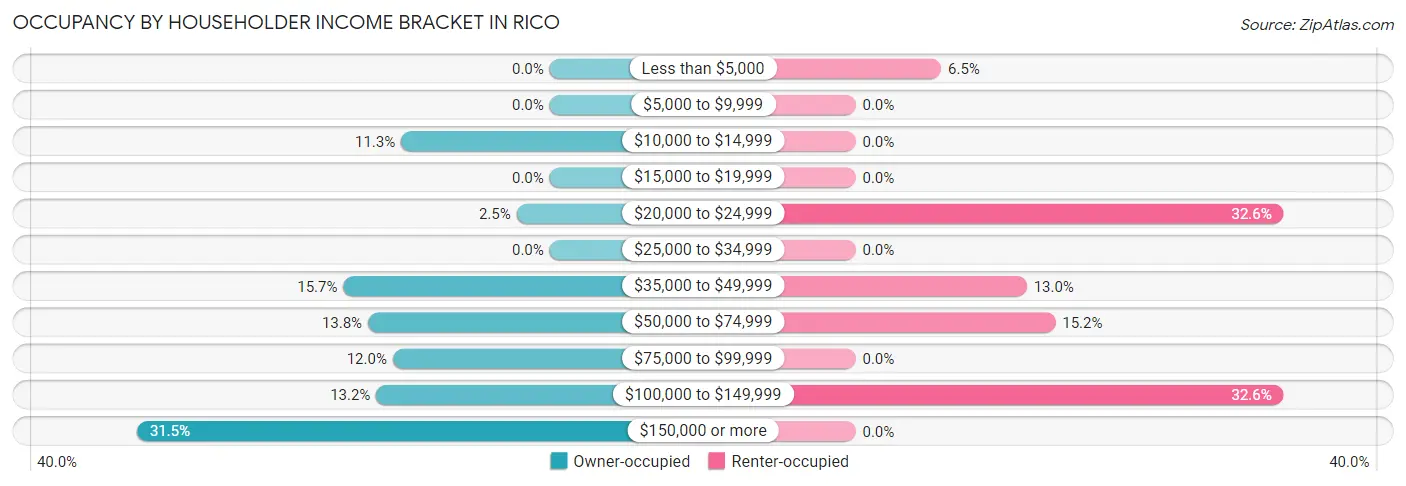
| Income Bracket | Owner-occupied | Renter-occupied |
| Less than $5,000 | 0 (0.0%) | 3 (6.5%) |
| $5,000 to $9,999 | 0 (0.0%) | 0 (0.0%) |
| $10,000 to $14,999 | 18 (11.3%) | 0 (0.0%) |
| $15,000 to $19,999 | 0 (0.0%) | 0 (0.0%) |
| $20,000 to $24,999 | 4 (2.5%) | 15 (32.6%) |
| $25,000 to $34,999 | 0 (0.0%) | 0 (0.0%) |
| $35,000 to $49,999 | 25 (15.7%) | 6 (13.0%) |
| $50,000 to $74,999 | 22 (13.8%) | 7 (15.2%) |
| $75,000 to $99,999 | 19 (11.9%) | 0 (0.0%) |
| $100,000 to $149,999 | 21 (13.2%) | 15 (32.6%) |
| $150,000 or more | 50 (31.5%) | 0 (0.0%) |
| Total | 159 (100.0%) | 46 (100.0%) |
Monthly Housing Cost Tiers in Rico
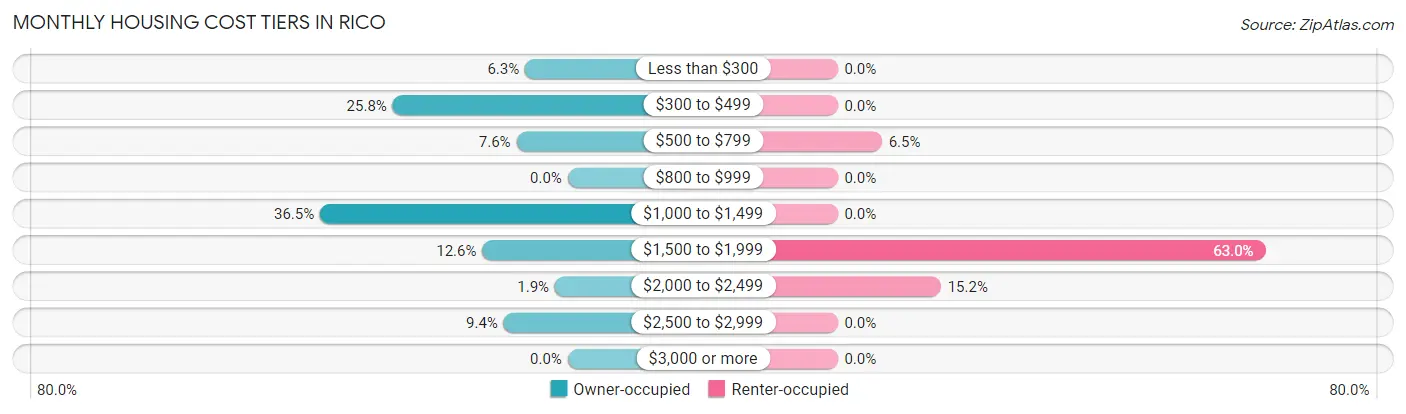
| Monthly Cost | Owner-occupied | Renter-occupied |
| Less than $300 | 10 (6.3%) | 0 (0.0%) |
| $300 to $499 | 41 (25.8%) | 0 (0.0%) |
| $500 to $799 | 12 (7.5%) | 3 (6.5%) |
| $800 to $999 | 0 (0.0%) | 0 (0.0%) |
| $1,000 to $1,499 | 58 (36.5%) | 0 (0.0%) |
| $1,500 to $1,999 | 20 (12.6%) | 29 (63.0%) |
| $2,000 to $2,499 | 3 (1.9%) | 7 (15.2%) |
| $2,500 to $2,999 | 15 (9.4%) | 0 (0.0%) |
| $3,000 or more | 0 (0.0%) | 0 (0.0%) |
| Total | 159 (100.0%) | 46 (100.0%) |
Physical Housing Characteristics in Rico
Housing Structures in Rico
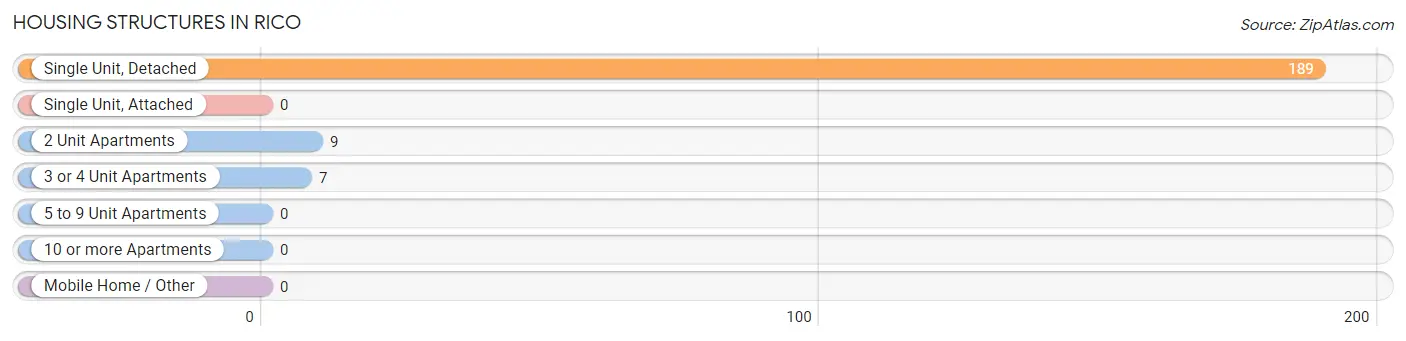
| Structure Type | # Housing Units | % Housing Units |
| Single Unit, Detached | 189 | 92.2% |
| Single Unit, Attached | 0 | 0.0% |
| 2 Unit Apartments | 9 | 4.4% |
| 3 or 4 Unit Apartments | 7 | 3.4% |
| 5 to 9 Unit Apartments | 0 | 0.0% |
| 10 or more Apartments | 0 | 0.0% |
| Mobile Home / Other | 0 | 0.0% |
| Total | 205 | 100.0% |
Housing Structures by Occupancy in Rico
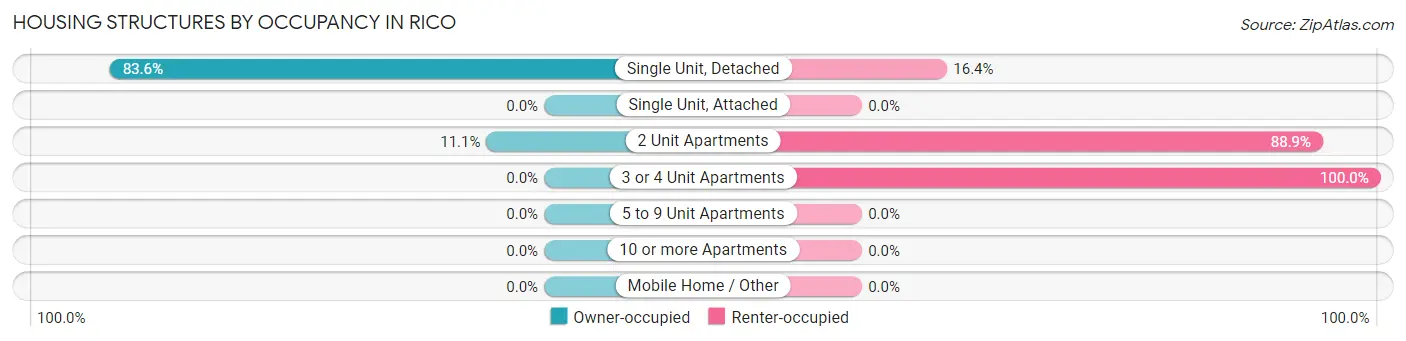
| Structure Type | Owner-occupied | Renter-occupied |
| Single Unit, Detached | 158 (83.6%) | 31 (16.4%) |
| Single Unit, Attached | 0 (0.0%) | 0 (0.0%) |
| 2 Unit Apartments | 1 (11.1%) | 8 (88.9%) |
| 3 or 4 Unit Apartments | 0 (0.0%) | 7 (100.0%) |
| 5 to 9 Unit Apartments | 0 (0.0%) | 0 (0.0%) |
| 10 or more Apartments | 0 (0.0%) | 0 (0.0%) |
| Mobile Home / Other | 0 (0.0%) | 0 (0.0%) |
| Total | 159 (77.6%) | 46 (22.4%) |
Housing Structures by Number of Rooms in Rico
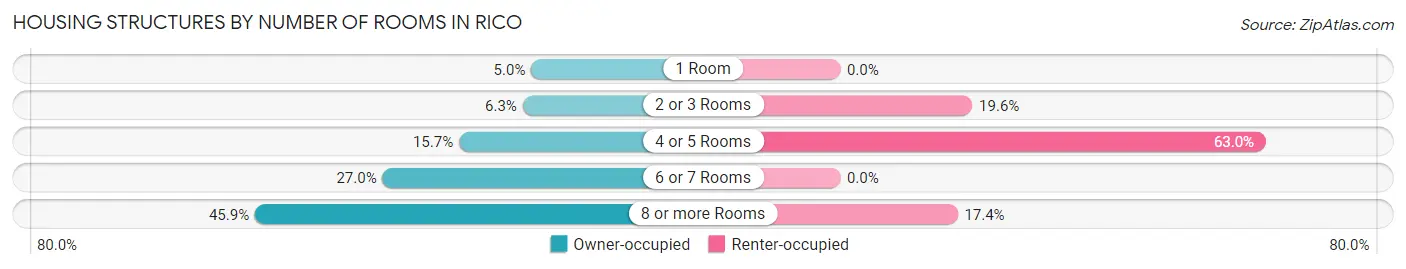
| Number of Rooms | Owner-occupied | Renter-occupied |
| 1 Room | 8 (5.0%) | 0 (0.0%) |
| 2 or 3 Rooms | 10 (6.3%) | 9 (19.6%) |
| 4 or 5 Rooms | 25 (15.7%) | 29 (63.0%) |
| 6 or 7 Rooms | 43 (27.0%) | 0 (0.0%) |
| 8 or more Rooms | 73 (45.9%) | 8 (17.4%) |
| Total | 159 (100.0%) | 46 (100.0%) |
Housing Structure by Heating Type in Rico
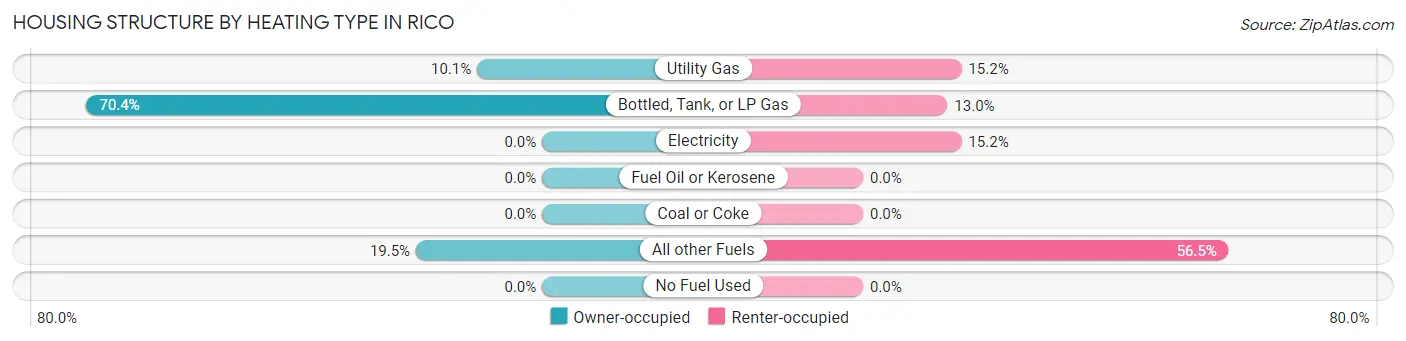
| Heating Type | Owner-occupied | Renter-occupied |
| Utility Gas | 16 (10.1%) | 7 (15.2%) |
| Bottled, Tank, or LP Gas | 112 (70.4%) | 6 (13.0%) |
| Electricity | 0 (0.0%) | 7 (15.2%) |
| Fuel Oil or Kerosene | 0 (0.0%) | 0 (0.0%) |
| Coal or Coke | 0 (0.0%) | 0 (0.0%) |
| All other Fuels | 31 (19.5%) | 26 (56.5%) |
| No Fuel Used | 0 (0.0%) | 0 (0.0%) |
| Total | 159 (100.0%) | 46 (100.0%) |
Household Vehicle Usage in Rico
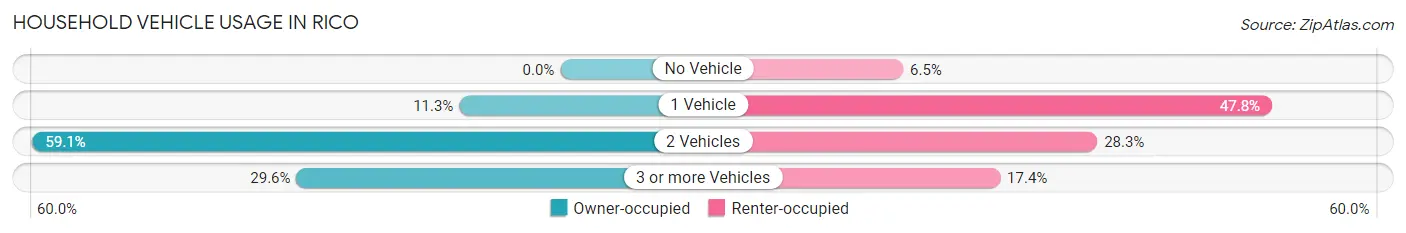
| Vehicles per Household | Owner-occupied | Renter-occupied |
| No Vehicle | 0 (0.0%) | 3 (6.5%) |
| 1 Vehicle | 18 (11.3%) | 22 (47.8%) |
| 2 Vehicles | 94 (59.1%) | 13 (28.3%) |
| 3 or more Vehicles | 47 (29.6%) | 8 (17.4%) |
| Total | 159 (100.0%) | 46 (100.0%) |
Real Estate & Mortgages in Rico
Real Estate and Mortgage Overview in Rico
| Characteristic | Without Mortgage | With Mortgage |
| Housing Units | 71 | 88 |
| Median Property Value | $458,000 | $446,200 |
| Median Household Income | $43,906 | $47 |
| Monthly Housing Costs | $440 | $0 |
| Real Estate Taxes | $1,672 | $0 |
Property Value by Mortgage Status in Rico
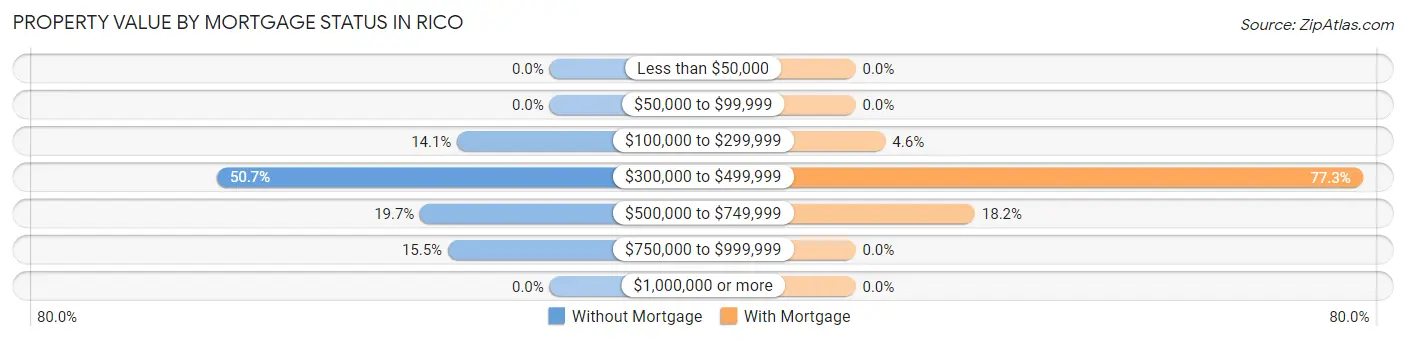
| Property Value | Without Mortgage | With Mortgage |
| Less than $50,000 | 0 (0.0%) | 0 (0.0%) |
| $50,000 to $99,999 | 0 (0.0%) | 0 (0.0%) |
| $100,000 to $299,999 | 10 (14.1%) | 4 (4.5%) |
| $300,000 to $499,999 | 36 (50.7%) | 68 (77.3%) |
| $500,000 to $749,999 | 14 (19.7%) | 16 (18.2%) |
| $750,000 to $999,999 | 11 (15.5%) | 0 (0.0%) |
| $1,000,000 or more | 0 (0.0%) | 0 (0.0%) |
| Total | 71 (100.0%) | 88 (100.0%) |
Household Income by Mortgage Status in Rico
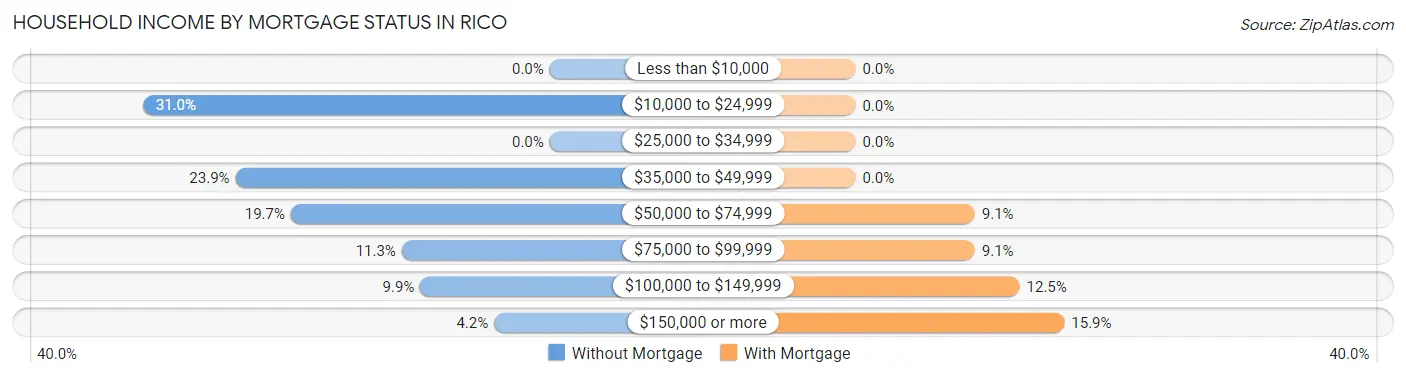
| Household Income | Without Mortgage | With Mortgage |
| Less than $10,000 | 0 (0.0%) | 0 (0.0%) |
| $10,000 to $24,999 | 22 (31.0%) | 0 (0.0%) |
| $25,000 to $34,999 | 0 (0.0%) | 0 (0.0%) |
| $35,000 to $49,999 | 17 (23.9%) | 0 (0.0%) |
| $50,000 to $74,999 | 14 (19.7%) | 8 (9.1%) |
| $75,000 to $99,999 | 8 (11.3%) | 8 (9.1%) |
| $100,000 to $149,999 | 7 (9.9%) | 11 (12.5%) |
| $150,000 or more | 3 (4.2%) | 14 (15.9%) |
| Total | 71 (100.0%) | 88 (100.0%) |
Property Value to Household Income Ratio in Rico
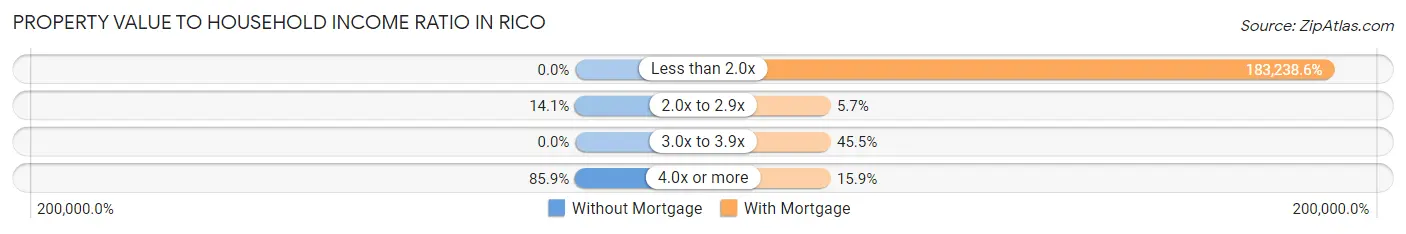
| Value-to-Income Ratio | Without Mortgage | With Mortgage |
| Less than 2.0x | 0 (0.0%) | 161,250 (183,238.6%) |
| 2.0x to 2.9x | 10 (14.1%) | 5 (5.7%) |
| 3.0x to 3.9x | 0 (0.0%) | 40 (45.5%) |
| 4.0x or more | 61 (85.9%) | 14 (15.9%) |
| Total | 71 (100.0%) | 88 (100.0%) |
Real Estate Taxes by Mortgage Status in Rico
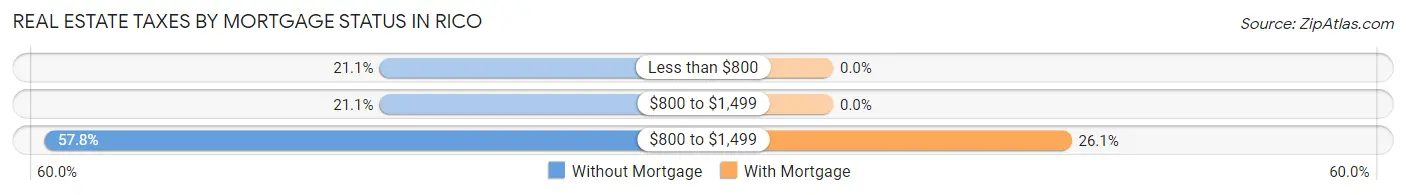
| Property Taxes | Without Mortgage | With Mortgage |
| Less than $800 | 15 (21.1%) | 0 (0.0%) |
| $800 to $1,499 | 15 (21.1%) | 0 (0.0%) |
| $800 to $1,499 | 41 (57.8%) | 23 (26.1%) |
| Total | 71 (100.0%) | 88 (100.0%) |
Health & Disability in Rico
Health Insurance Coverage by Age in Rico
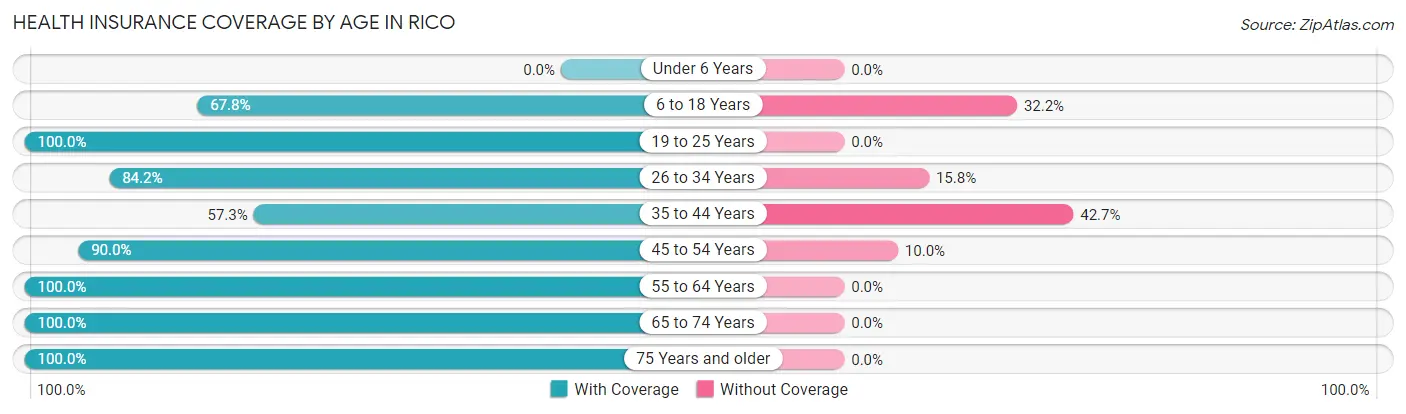
| Age Bracket | With Coverage | Without Coverage |
| Under 6 Years | 0 (0.0%) | 0 (0.0%) |
| 6 to 18 Years | 40 (67.8%) | 19 (32.2%) |
| 19 to 25 Years | 25 (100.0%) | 0 (0.0%) |
| 26 to 34 Years | 32 (84.2%) | 6 (15.8%) |
| 35 to 44 Years | 51 (57.3%) | 38 (42.7%) |
| 45 to 54 Years | 27 (90.0%) | 3 (10.0%) |
| 55 to 64 Years | 75 (100.0%) | 0 (0.0%) |
| 65 to 74 Years | 51 (100.0%) | 0 (0.0%) |
| 75 Years and older | 15 (100.0%) | 0 (0.0%) |
| Total | 316 (82.7%) | 66 (17.3%) |
Health Insurance Coverage by Citizenship Status in Rico
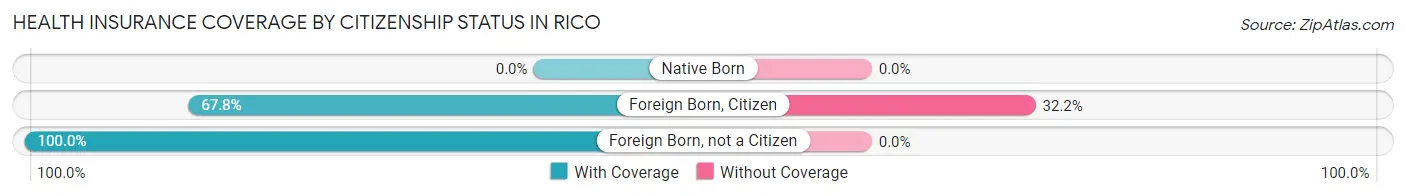
| Citizenship Status | With Coverage | Without Coverage |
| Native Born | 0 (0.0%) | 0 (0.0%) |
| Foreign Born, Citizen | 40 (67.8%) | 19 (32.2%) |
| Foreign Born, not a Citizen | 25 (100.0%) | 0 (0.0%) |
Health Insurance Coverage by Household Income in Rico
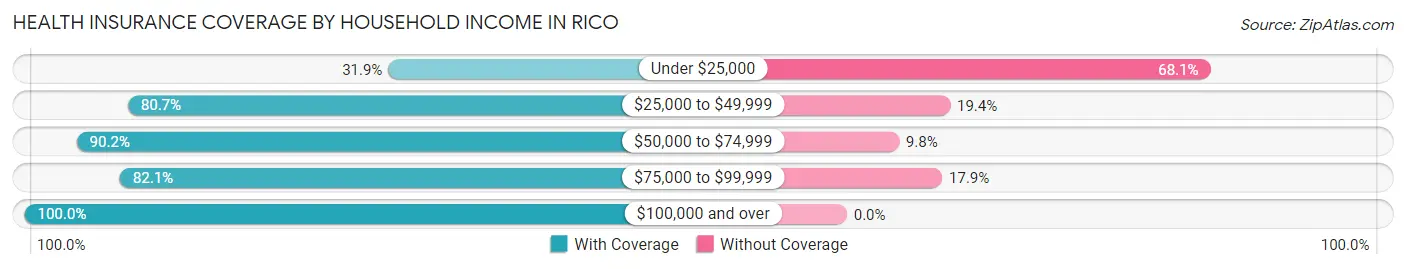
| Household Income | With Coverage | Without Coverage |
| Under $25,000 | 22 (31.9%) | 47 (68.1%) |
| $25,000 to $49,999 | 25 (80.6%) | 6 (19.4%) |
| $50,000 to $74,999 | 74 (90.2%) | 8 (9.8%) |
| $75,000 to $99,999 | 23 (82.1%) | 5 (17.9%) |
| $100,000 and over | 172 (100.0%) | 0 (0.0%) |
Public vs Private Health Insurance Coverage by Age in Rico
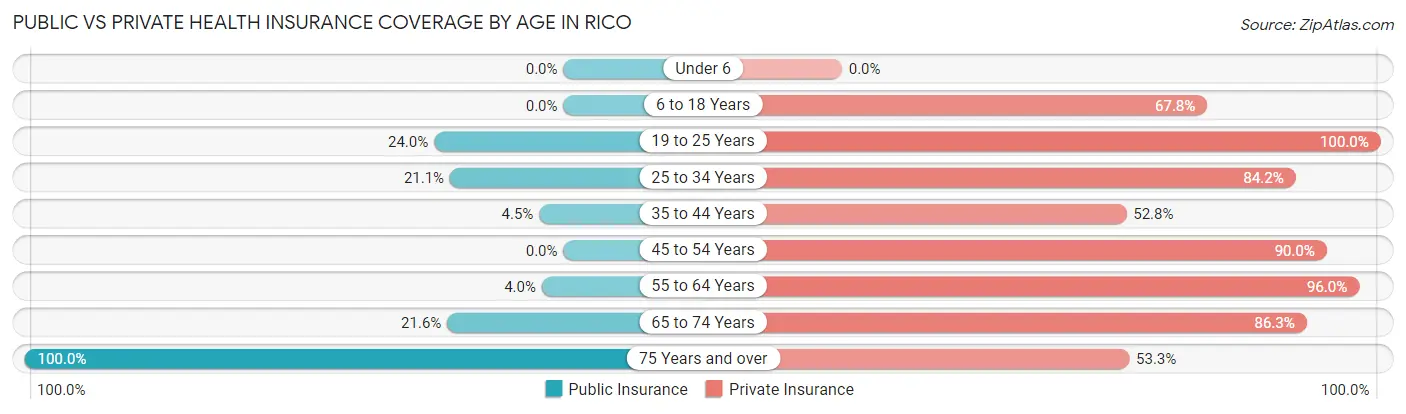
| Age Bracket | Public Insurance | Private Insurance |
| Under 6 | 0 (0.0%) | 0 (0.0%) |
| 6 to 18 Years | 0 (0.0%) | 40 (67.8%) |
| 19 to 25 Years | 6 (24.0%) | 25 (100.0%) |
| 25 to 34 Years | 8 (21.0%) | 32 (84.2%) |
| 35 to 44 Years | 4 (4.5%) | 47 (52.8%) |
| 45 to 54 Years | 0 (0.0%) | 27 (90.0%) |
| 55 to 64 Years | 3 (4.0%) | 72 (96.0%) |
| 65 to 74 Years | 11 (21.6%) | 44 (86.3%) |
| 75 Years and over | 15 (100.0%) | 8 (53.3%) |
| Total | 47 (12.3%) | 295 (77.2%) |
Disability Status by Sex by Age in Rico
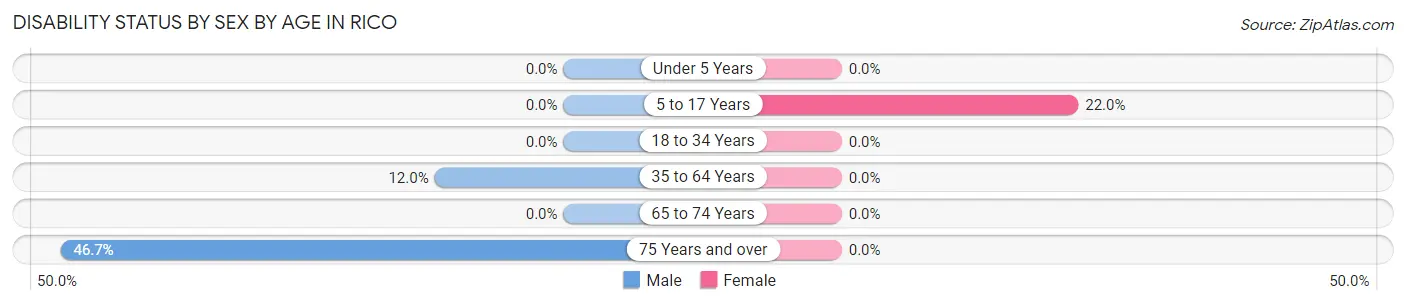
| Age Bracket | Male | Female |
| Under 5 Years | 0 (0.0%) | 0 (0.0%) |
| 5 to 17 Years | 0 (0.0%) | 9 (22.0%) |
| 18 to 34 Years | 0 (0.0%) | 0 (0.0%) |
| 35 to 64 Years | 11 (12.0%) | 0 (0.0%) |
| 65 to 74 Years | 0 (0.0%) | 0 (0.0%) |
| 75 Years and over | 7 (46.7%) | 0 (0.0%) |
Disability Class by Sex by Age in Rico
Disability Class: Hearing Difficulty
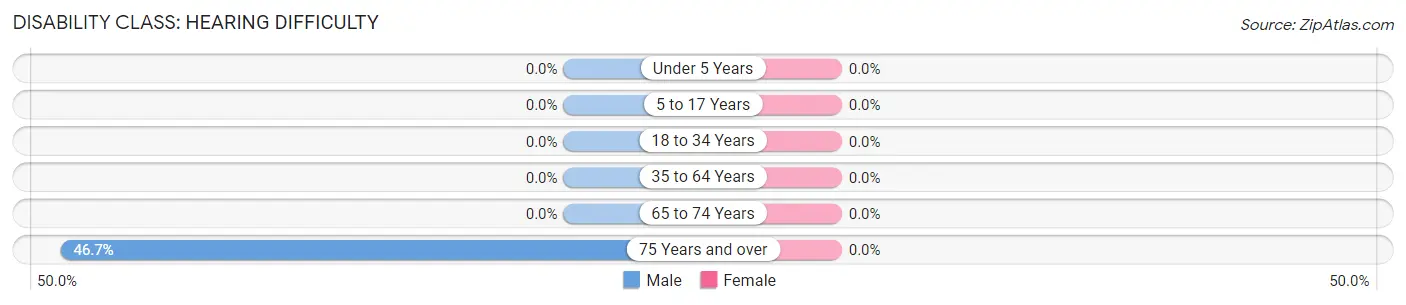
| Age Bracket | Male | Female |
| Under 5 Years | 0 (0.0%) | 0 (0.0%) |
| 5 to 17 Years | 0 (0.0%) | 0 (0.0%) |
| 18 to 34 Years | 0 (0.0%) | 0 (0.0%) |
| 35 to 64 Years | 0 (0.0%) | 0 (0.0%) |
| 65 to 74 Years | 0 (0.0%) | 0 (0.0%) |
| 75 Years and over | 7 (46.7%) | 0 (0.0%) |
Disability Class: Vision Difficulty
| Age Bracket | Male | Female |
| Under 5 Years | 0 (0.0%) | 0 (0.0%) |
| 5 to 17 Years | 0 (0.0%) | 0 (0.0%) |
| 18 to 34 Years | 0 (0.0%) | 0 (0.0%) |
| 35 to 64 Years | 0 (0.0%) | 0 (0.0%) |
| 65 to 74 Years | 0 (0.0%) | 0 (0.0%) |
| 75 Years and over | 0 (0.0%) | 0 (0.0%) |
Disability Class: Cognitive Difficulty
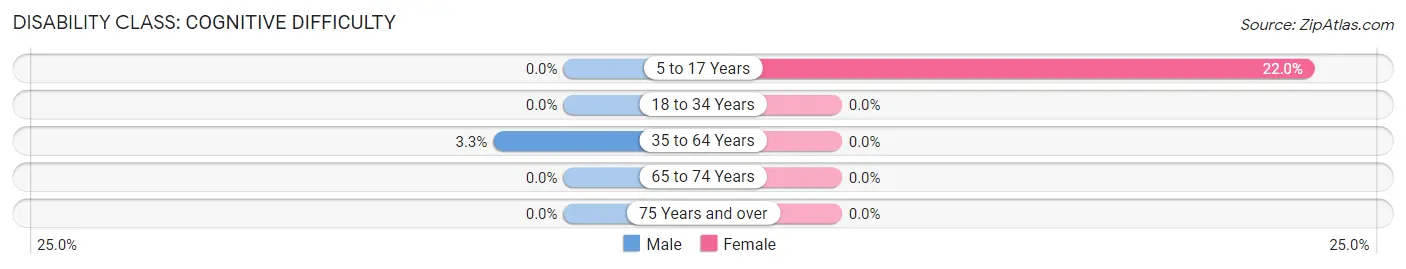
| Age Bracket | Male | Female |
| 5 to 17 Years | 0 (0.0%) | 9 (22.0%) |
| 18 to 34 Years | 0 (0.0%) | 0 (0.0%) |
| 35 to 64 Years | 3 (3.3%) | 0 (0.0%) |
| 65 to 74 Years | 0 (0.0%) | 0 (0.0%) |
| 75 Years and over | 0 (0.0%) | 0 (0.0%) |
Disability Class: Ambulatory Difficulty
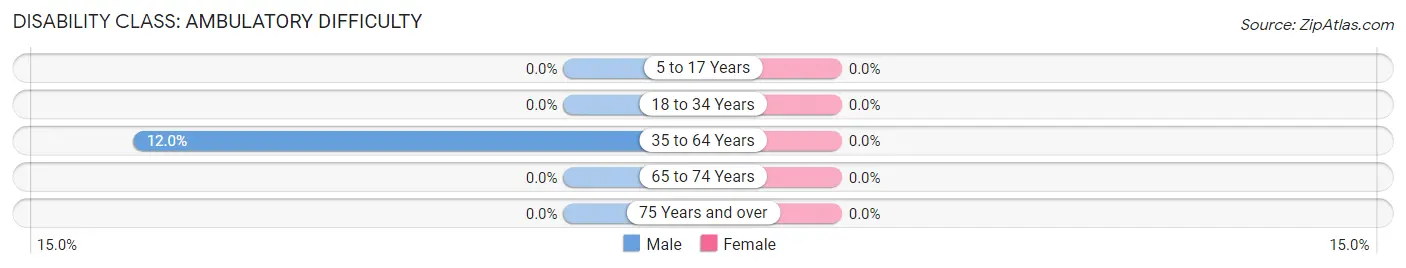
| Age Bracket | Male | Female |
| 5 to 17 Years | 0 (0.0%) | 0 (0.0%) |
| 18 to 34 Years | 0 (0.0%) | 0 (0.0%) |
| 35 to 64 Years | 11 (12.0%) | 0 (0.0%) |
| 65 to 74 Years | 0 (0.0%) | 0 (0.0%) |
| 75 Years and over | 0 (0.0%) | 0 (0.0%) |
Disability Class: Self-Care Difficulty
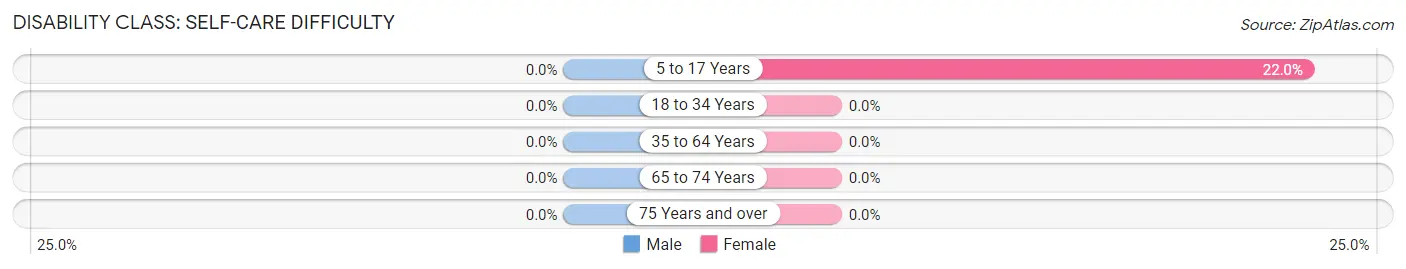
| Age Bracket | Male | Female |
| 5 to 17 Years | 0 (0.0%) | 9 (22.0%) |
| 18 to 34 Years | 0 (0.0%) | 0 (0.0%) |
| 35 to 64 Years | 0 (0.0%) | 0 (0.0%) |
| 65 to 74 Years | 0 (0.0%) | 0 (0.0%) |
| 75 Years and over | 0 (0.0%) | 0 (0.0%) |
Technology Access in Rico
Computing Device Access in Rico
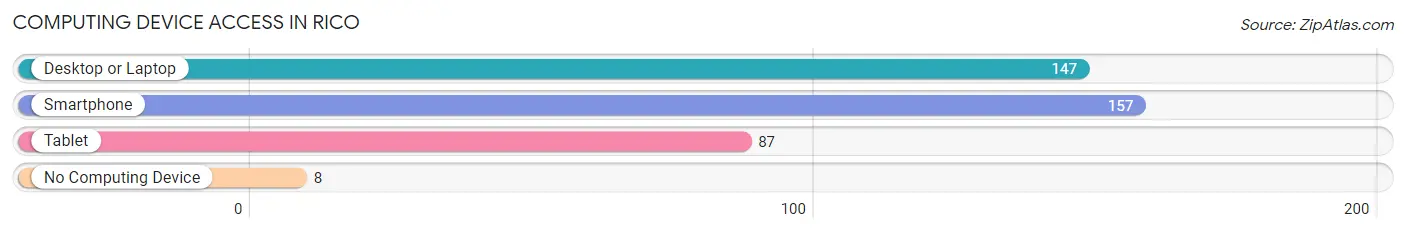
| Device Type | # Households | % Households |
| Desktop or Laptop | 147 | 71.7% |
| Smartphone | 157 | 76.6% |
| Tablet | 87 | 42.4% |
| No Computing Device | 8 | 3.9% |
| Total | 205 | 100.0% |
Internet Access in Rico
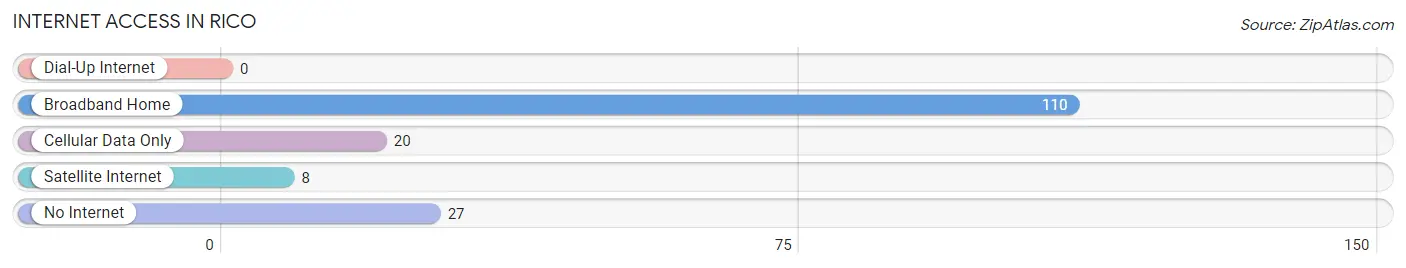
| Internet Type | # Households | % Households |
| Dial-Up Internet | 0 | 0.0% |
| Broadband Home | 110 | 53.7% |
| Cellular Data Only | 20 | 9.8% |
| Satellite Internet | 8 | 3.9% |
| No Internet | 27 | 13.2% |
| Total | 205 | 100.0% |
Rico Summary
Rico, Colorado is a small town located in the San Miguel County of the southwestern part of the state. It is situated in the San Juan Mountains at an elevation of 8,859 feet. The town was founded in 1879 by miners who were searching for gold and silver. The town was named after a local prospector, Rico, who discovered a rich vein of ore in the area.
Geography
Rico is located in the San Juan Mountains of southwestern Colorado. The town is situated at an elevation of 8,859 feet and is surrounded by the Uncompahgre National Forest. The town is located in a valley surrounded by mountains, with the Dolores River running through it. The town is located approximately 30 miles from Telluride and is accessible by a two-lane highway.
Climate
Rico has a semi-arid climate with hot summers and cold winters. The average high temperature in the summer is around 80 degrees Fahrenheit, while the average low temperature in the winter is around 10 degrees Fahrenheit. The town receives an average of 18 inches of precipitation per year, with most of it falling in the form of snow.
Economy
Rico’s economy is largely based on tourism and outdoor recreation. The town is home to several ski resorts, including Telluride Ski Resort, which is located just 30 miles away. The town also has several restaurants, bars, and shops that cater to tourists. In addition, the town is home to several mining operations, which provide jobs for many of the town’s residents.
Demographics
As of the 2010 census, Rico had a population of 545 people. The town is predominantly white, with 95.2% of the population identifying as such. The town also has a small Hispanic population, with 4.8% of the population identifying as Hispanic or Latino. The median household income in Rico is $41,250, and the median home value is $220,000.
Conclusion
Rico, Colorado is a small town located in the San Juan Mountains of southwestern Colorado. The town was founded in 1879 by miners searching for gold and silver, and is now largely based on tourism and outdoor recreation. The town has a semi-arid climate with hot summers and cold winters, and has a population of 545 people, with 95.2% of the population identifying as white. The town’s economy is largely based on tourism and outdoor recreation, and the median household income is $41,250.
Common Questions
What is Per Capita Income in Rico?
Per Capita income in Rico is $37,318.
What is the Median Family Income in Rico?
Median Family Income in Rico is $140,750.
What is the Median Household income in Rico?
Median Household Income in Rico is $83,281.
What is Income or Wage Gap in Rico?
Income or Wage Gap in Rico is 8.5%.
Women in Rico earn 91.5 cents for every dollar earned by a man.
What is Inequality or Gini Index in Rico?
Inequality or Gini Index in Rico is 0.38.
What is the Total Population of Rico?
Total Population of Rico is 382.
What is the Total Male Population of Rico?
Total Male Population of Rico is 171.
What is the Total Female Population of Rico?
Total Female Population of Rico is 211.
What is the Ratio of Males per 100 Females in Rico?
There are 81.04 Males per 100 Females in Rico.
What is the Ratio of Females per 100 Males in Rico?
There are 123.39 Females per 100 Males in Rico.
What is the Median Population Age in Rico?
Median Population Age in Rico is 42.8 Years.
What is the Average Family Size in Rico
Average Family Size in Rico is 2.3 People.
What is the Average Household Size in Rico
Average Household Size in Rico is 1.9 People.
How Large is the Labor Force in Rico?
There are 271 People in the Labor Forcein in Rico.
What is the Percentage of People in the Labor Force in Rico?
78.1% of People are in the Labor Force in Rico.