Marble, CO Map & Demographics
Marble Map
Marble Overview
$66,747
PER CAPITA INCOME
$148,403
AVG FAMILY INCOME
$129,792
AVG HOUSEHOLD INCOME
0.9%
WAGE / INCOME GAP [ % ]
99.1¢/ $1
WAGE / INCOME GAP [ $ ]
0.35
INEQUALITY / GINI INDEX
191
TOTAL POPULATION
131
MALE POPULATION
60
FEMALE POPULATION
218.33
MALES / 100 FEMALES
45.80
FEMALES / 100 MALES
53.4
MEDIAN AGE
2.4
AVG FAMILY SIZE
2.2
AVG HOUSEHOLD SIZE
105
LABOR FORCE [ PEOPLE ]
69.5%
PERCENT IN LABOR FORCE
1.0%
UNEMPLOYMENT RATE
Marble Area Codes
Income in Marble
Income Overview in Marble
Per Capita Income in Marble is $66,747, while median incomes of families and households are $148,403 and $129,792 respectively.
| Characteristic | Number | Measure |
| Per Capita Income | 191 | $66,747 |
| Median Family Income | 63 | $148,403 |
| Mean Family Income | 63 | $143,140 |
| Median Household Income | 85 | $129,792 |
| Mean Household Income | 85 | $158,780 |
| Income Deficit | 63 | $0 |
| Wage / Income Gap (%) | 191 | 0.87% |
| Wage / Income Gap ($) | 191 | 99.13¢ per $1 |
| Gini / Inequality Index | 191 | 0.35 |
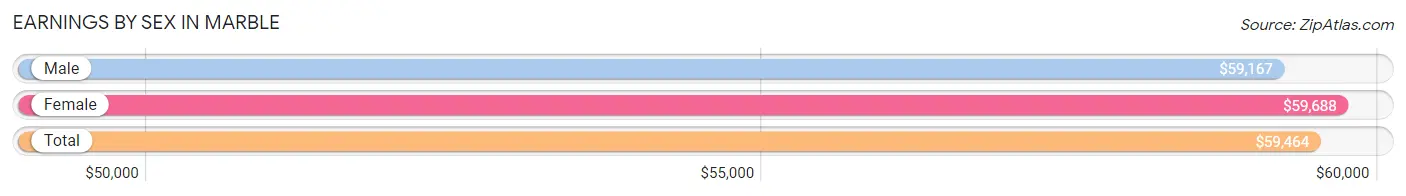
Earnings by Sex in Marble
Average Earnings in Marble are $59,464, $59,167 for men and $59,688 for women, a difference of 0.9%.
| Sex | Number | Average Earnings |
| Male | 78 (65.5%) | $59,167 |
| Female | 41 (34.4%) | $59,688 |
| Total | 119 (100.0%) | $59,464 |
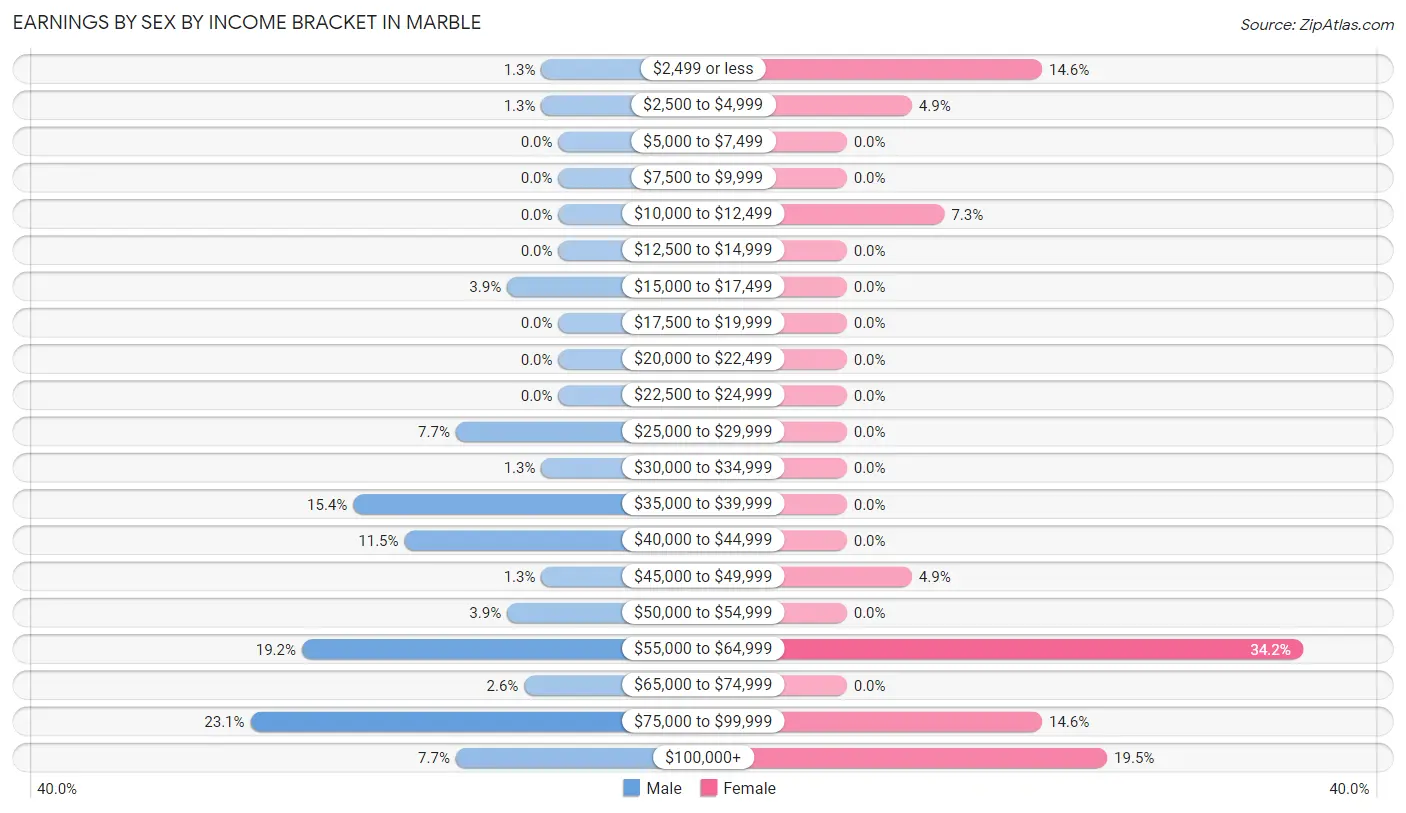
Earnings by Sex by Income Bracket in Marble
The most common earnings brackets in Marble are $75,000 to $99,999 for men (18 | 23.1%) and $55,000 to $64,999 for women (14 | 34.2%).
| Income | Male | Female |
| $2,499 or less | 1 (1.3%) | 6 (14.6%) |
| $2,500 to $4,999 | 1 (1.3%) | 2 (4.9%) |
| $5,000 to $7,499 | 0 (0.0%) | 0 (0.0%) |
| $7,500 to $9,999 | 0 (0.0%) | 0 (0.0%) |
| $10,000 to $12,499 | 0 (0.0%) | 3 (7.3%) |
| $12,500 to $14,999 | 0 (0.0%) | 0 (0.0%) |
| $15,000 to $17,499 | 3 (3.8%) | 0 (0.0%) |
| $17,500 to $19,999 | 0 (0.0%) | 0 (0.0%) |
| $20,000 to $22,499 | 0 (0.0%) | 0 (0.0%) |
| $22,500 to $24,999 | 0 (0.0%) | 0 (0.0%) |
| $25,000 to $29,999 | 6 (7.7%) | 0 (0.0%) |
| $30,000 to $34,999 | 1 (1.3%) | 0 (0.0%) |
| $35,000 to $39,999 | 12 (15.4%) | 0 (0.0%) |
| $40,000 to $44,999 | 9 (11.5%) | 0 (0.0%) |
| $45,000 to $49,999 | 1 (1.3%) | 2 (4.9%) |
| $50,000 to $54,999 | 3 (3.8%) | 0 (0.0%) |
| $55,000 to $64,999 | 15 (19.2%) | 14 (34.2%) |
| $65,000 to $74,999 | 2 (2.6%) | 0 (0.0%) |
| $75,000 to $99,999 | 18 (23.1%) | 6 (14.6%) |
| $100,000+ | 6 (7.7%) | 8 (19.5%) |
| Total | 78 (100.0%) | 41 (100.0%) |
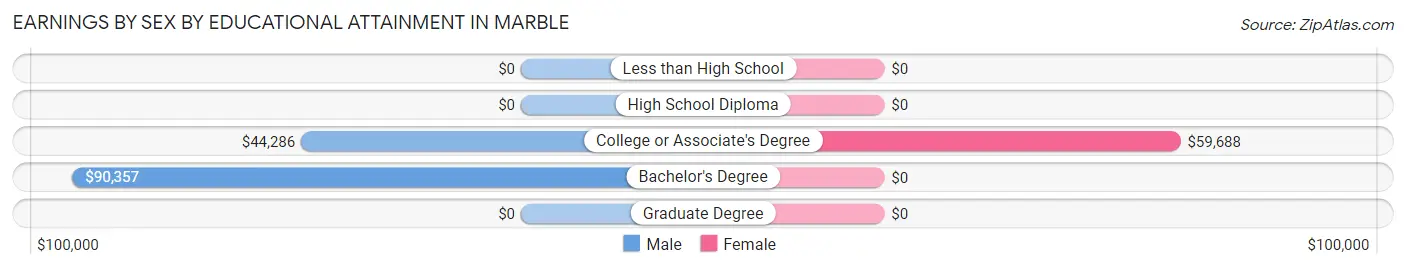
Earnings by Sex by Educational Attainment in Marble
Average earnings in Marble are $59,167 for men and $59,688 for women, a difference of 0.9%. Men with an educational attainment of bachelor's degree enjoy the highest average annual earnings of $90,357, while those with college or associate's degree education earn the least with $44,286. Women with an educational attainment of college or associate's degree earn the most with the average annual earnings of $59,688, while those with college or associate's degree education have the smallest earnings of $59,688.
| Educational Attainment | Male Income | Female Income |
| Less than High School | - | - |
| High School Diploma | - | - |
| College or Associate's Degree | $44,286 | $59,688 |
| Bachelor's Degree | $90,357 | $0 |
| Graduate Degree | - | - |
| Total | $59,167 | $59,688 |
Family Income in Marble
Family Income Brackets in Marble
According to the Marble family income data, there are 32 families falling into the $100,000 to $149,999 income range, which is the most common income bracket and makes up 50.8% of all families.
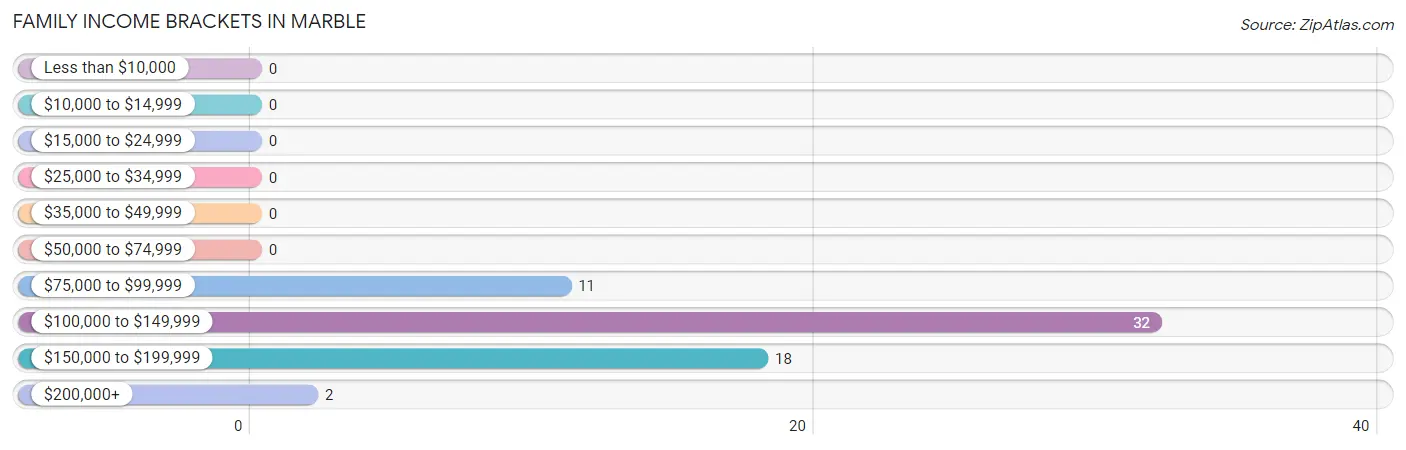
| Income Bracket | # Families | % Families |
| Less than $10,000 | 0 | 0.0% |
| $10,000 to $14,999 | 0 | 0.0% |
| $15,000 to $24,999 | 0 | 0.0% |
| $25,000 to $34,999 | 0 | 0.0% |
| $35,000 to $49,999 | 0 | 0.0% |
| $50,000 to $74,999 | 0 | 0.0% |
| $75,000 to $99,999 | 11 | 17.5% |
| $100,000 to $149,999 | 32 | 50.8% |
| $150,000 to $199,999 | 18 | 28.6% |
| $200,000+ | 2 | 3.2% |
Family Income by Famaliy Size in Marble
2-person families (54 | 85.7%) account for the highest median family income in Marble with $147,778 per family, while 2-person families (54 | 85.7%) have the highest median income of $73,889 per family member.
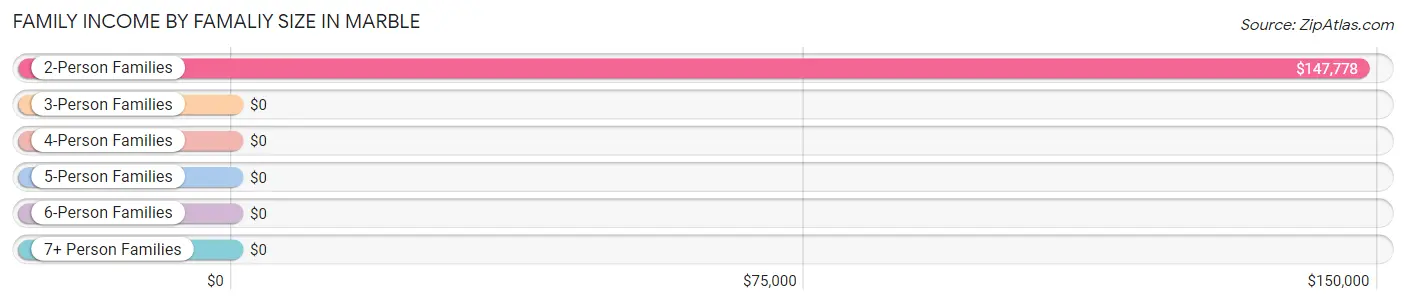
| Income Bracket | # Families | Median Income |
| 2-Person Families | 54 (85.7%) | $147,778 |
| 3-Person Families | 7 (11.1%) | $0 |
| 4-Person Families | 2 (3.2%) | $0 |
| 5-Person Families | 0 (0.0%) | $0 |
| 6-Person Families | 0 (0.0%) | $0 |
| 7+ Person Families | 0 (0.0%) | $0 |
| Total | 63 (100.0%) | $148,403 |
Family Income by Number of Earners in Marble
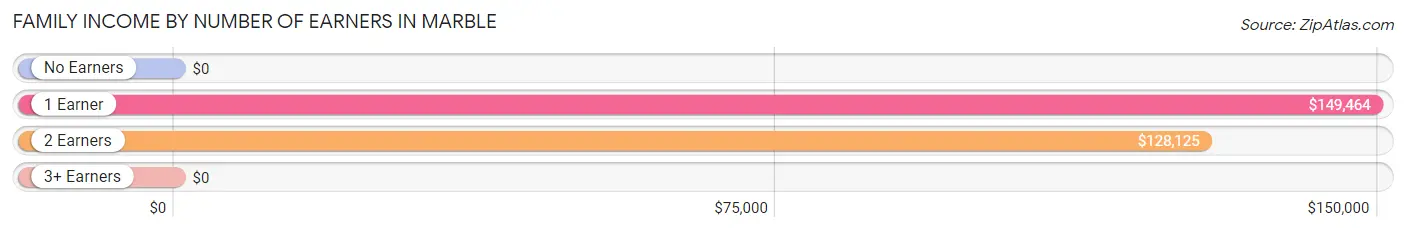
| Number of Earners | # Families | Median Income |
| No Earners | 0 (0.0%) | $0 |
| 1 Earner | 30 (47.6%) | $149,464 |
| 2 Earners | 33 (52.4%) | $128,125 |
| 3+ Earners | 0 (0.0%) | $0 |
| Total | 63 (100.0%) | $148,403 |
Household Income in Marble
Household Income Brackets in Marble
With 20 households falling in the category, the $200,000+ income range is the most frequent in Marble, accounting for 23.5% of all households.
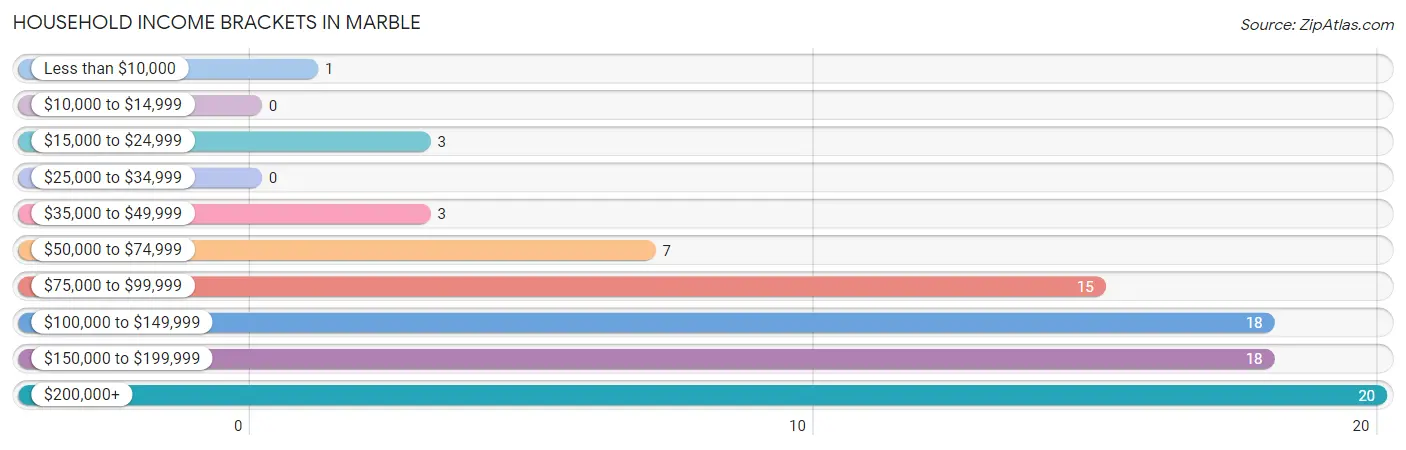
| Income Bracket | # Households | % Households |
| Less than $10,000 | 1 | 1.2% |
| $10,000 to $14,999 | 0 | 0.0% |
| $15,000 to $24,999 | 3 | 3.5% |
| $25,000 to $34,999 | 0 | 0.0% |
| $35,000 to $49,999 | 3 | 3.5% |
| $50,000 to $74,999 | 7 | 8.2% |
| $75,000 to $99,999 | 15 | 17.6% |
| $100,000 to $149,999 | 18 | 21.2% |
| $150,000 to $199,999 | 18 | 21.2% |
| $200,000+ | 20 | 23.5% |
Household Income by Householder Age in Marble
The median household income in Marble is $129,792, with the highest median household income of $205,446 found in the 25 to 44 years age bracket for the primary householder. A total of 27 households (31.8%) fall into this category.
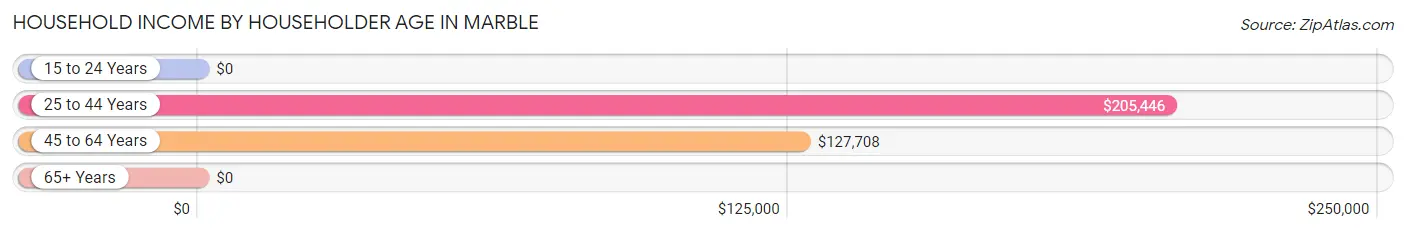
| Income Bracket | # Households | Median Income |
| 15 to 24 Years | 0 (0.0%) | $0 |
| 25 to 44 Years | 27 (31.8%) | $205,446 |
| 45 to 64 Years | 19 (22.4%) | $127,708 |
| 65+ Years | 39 (45.9%) | $0 |
| Total | 85 (100.0%) | $129,792 |
Poverty in Marble
Income Below Poverty by Sex and Age in Marble
With 0.8% poverty level for males and 3.3% for females among the residents of Marble, 55 to 64 year old males and 65 to 74 year old females are the most vulnerable to poverty, with 1 males (7.7%) and 2 females (14.3%) in their respective age groups living below the poverty level.
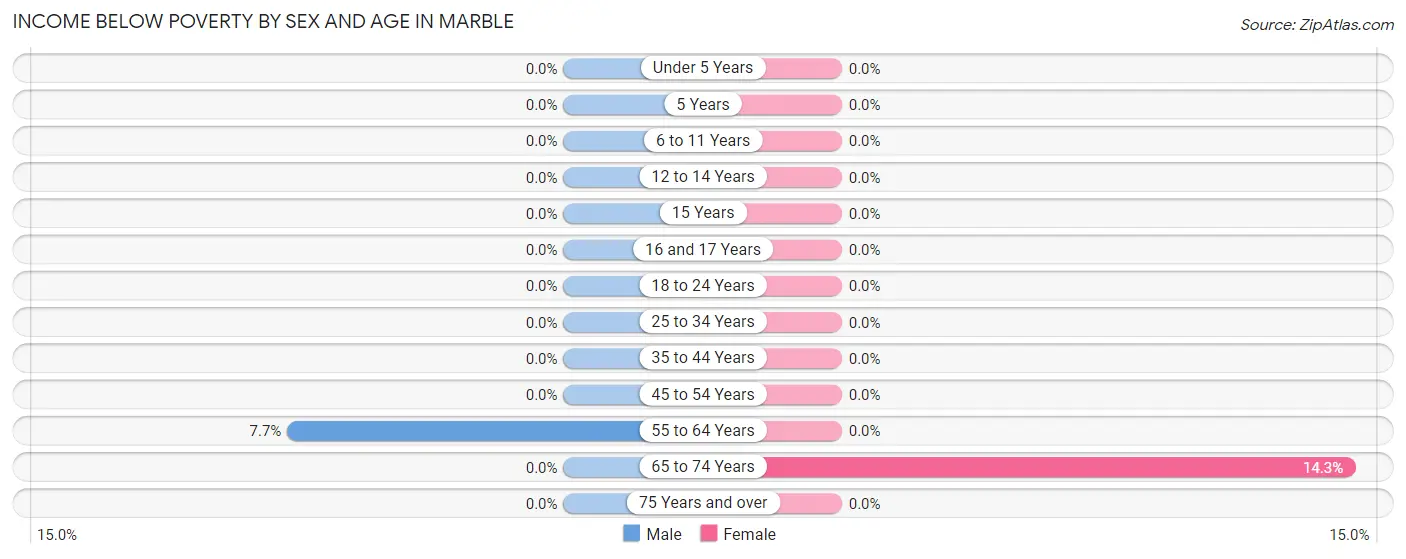
| Age Bracket | Male | Female |
| Under 5 Years | 0 (0.0%) | 0 (0.0%) |
| 5 Years | 0 (0.0%) | 0 (0.0%) |
| 6 to 11 Years | 0 (0.0%) | 0 (0.0%) |
| 12 to 14 Years | 0 (0.0%) | 0 (0.0%) |
| 15 Years | 0 (0.0%) | 0 (0.0%) |
| 16 and 17 Years | 0 (0.0%) | 0 (0.0%) |
| 18 to 24 Years | 0 (0.0%) | 0 (0.0%) |
| 25 to 34 Years | 0 (0.0%) | 0 (0.0%) |
| 35 to 44 Years | 0 (0.0%) | 0 (0.0%) |
| 45 to 54 Years | 0 (0.0%) | 0 (0.0%) |
| 55 to 64 Years | 1 (7.7%) | 0 (0.0%) |
| 65 to 74 Years | 0 (0.0%) | 2 (14.3%) |
| 75 Years and over | 0 (0.0%) | 0 (0.0%) |
| Total | 1 (0.8%) | 2 (3.3%) |
Income Above Poverty by Sex and Age in Marble
According to the poverty statistics in Marble, males aged under 5 years and females aged under 5 years are the age groups that are most secure financially, with 100.0% of males and 100.0% of females in these age groups living above the poverty line.
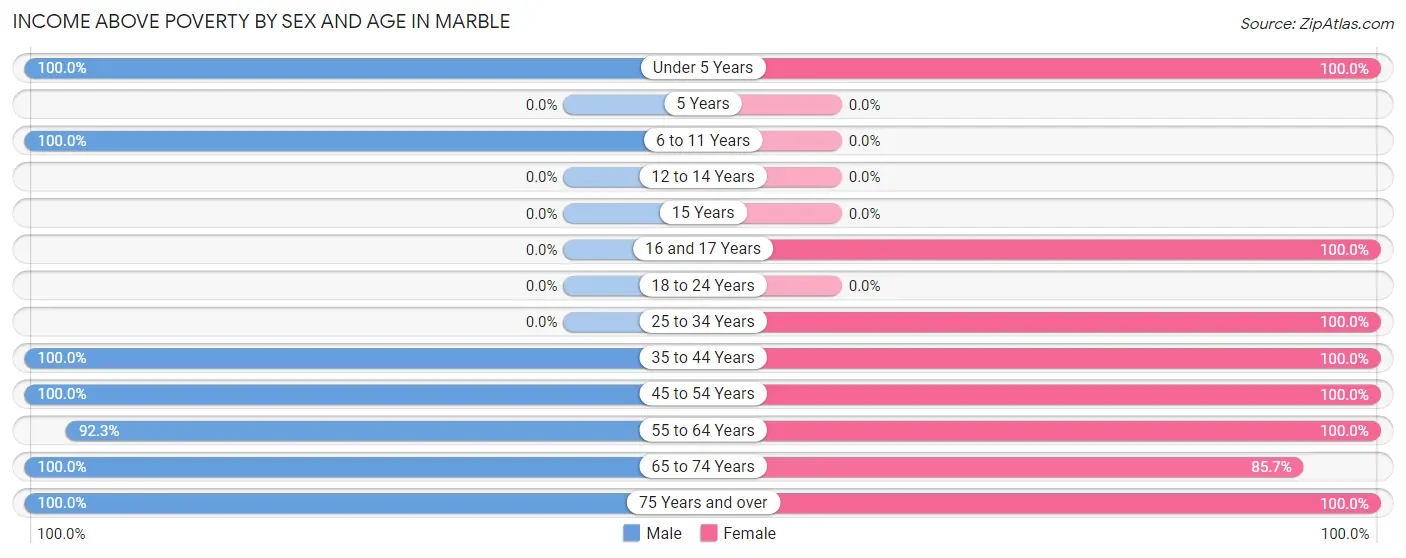
| Age Bracket | Male | Female |
| Under 5 Years | 1 (100.0%) | 1 (100.0%) |
| 5 Years | 0 (0.0%) | 0 (0.0%) |
| 6 to 11 Years | 38 (100.0%) | 0 (0.0%) |
| 12 to 14 Years | 0 (0.0%) | 0 (0.0%) |
| 15 Years | 0 (0.0%) | 0 (0.0%) |
| 16 and 17 Years | 0 (0.0%) | 2 (100.0%) |
| 18 to 24 Years | 0 (0.0%) | 0 (0.0%) |
| 25 to 34 Years | 0 (0.0%) | 4 (100.0%) |
| 35 to 44 Years | 19 (100.0%) | 12 (100.0%) |
| 45 to 54 Years | 21 (100.0%) | 11 (100.0%) |
| 55 to 64 Years | 12 (92.3%) | 8 (100.0%) |
| 65 to 74 Years | 34 (100.0%) | 12 (85.7%) |
| 75 Years and over | 5 (100.0%) | 8 (100.0%) |
| Total | 130 (99.2%) | 58 (96.7%) |
Income Below Poverty Among Married-Couple Families in Marble
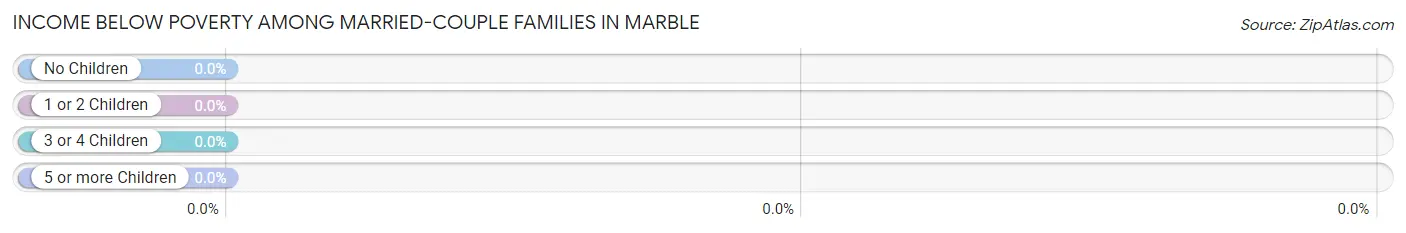
| Children | Above Poverty | Below Poverty |
| No Children | 44 (100.0%) | 0 (0.0%) |
| 1 or 2 Children | 2 (100.0%) | 0 (0.0%) |
| 3 or 4 Children | 0 (0.0%) | 0 (0.0%) |
| 5 or more Children | 0 (0.0%) | 0 (0.0%) |
| Total | 46 (100.0%) | 0 (0.0%) |
Income Below Poverty Among Single-Parent Households in Marble
| Children | Single Father | Single Mother |
| No Children | 0 (0.0%) | 0 (0.0%) |
| 1 or 2 Children | 0 (0.0%) | 0 (0.0%) |
| 3 or 4 Children | 0 (0.0%) | 0 (0.0%) |
| 5 or more Children | 0 (0.0%) | 0 (0.0%) |
| Total | 0 (0.0%) | 0 (0.0%) |
Income Below Poverty Among Married-Couple vs Single-Parent Households in Marble
| Children | Married-Couple Families | Single-Parent Households |
| No Children | 0 (0.0%) | 0 (0.0%) |
| 1 or 2 Children | 0 (0.0%) | 0 (0.0%) |
| 3 or 4 Children | 0 (0.0%) | 0 (0.0%) |
| 5 or more Children | 0 (0.0%) | 0 (0.0%) |
| Total | 0 (0.0%) | 0 (0.0%) |
Race in Marble
The most populous races in Marble are White / Caucasian (188 | 98.4%), Some other Race (2 | 1.1%), and Hispanic or Latino (1 | 0.5%).
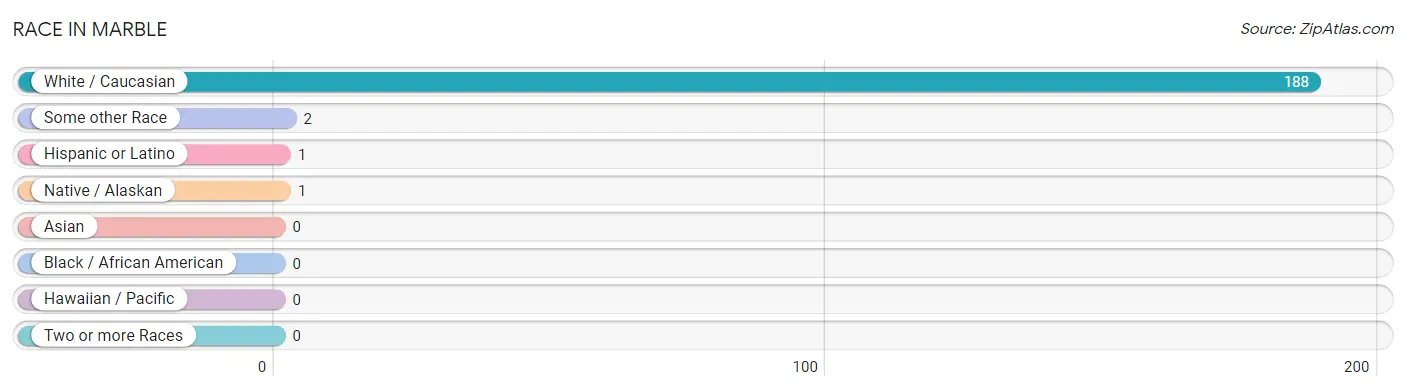
| Race | # Population | % Population |
| Asian | 0 | 0.0% |
| Black / African American | 0 | 0.0% |
| Hawaiian / Pacific | 0 | 0.0% |
| Hispanic or Latino | 1 | 0.5% |
| Native / Alaskan | 1 | 0.5% |
| White / Caucasian | 188 | 98.4% |
| Two or more Races | 0 | 0.0% |
| Some other Race | 2 | 1.1% |
| Total | 191 | 100.0% |
Ancestry in Marble
The most populous ancestries reported in Marble are German (53 | 27.8%), Italian (53 | 27.8%), Irish (35 | 18.3%), English (28 | 14.7%), and French (22 | 11.5%), together accounting for 100.0% of all Marble residents.
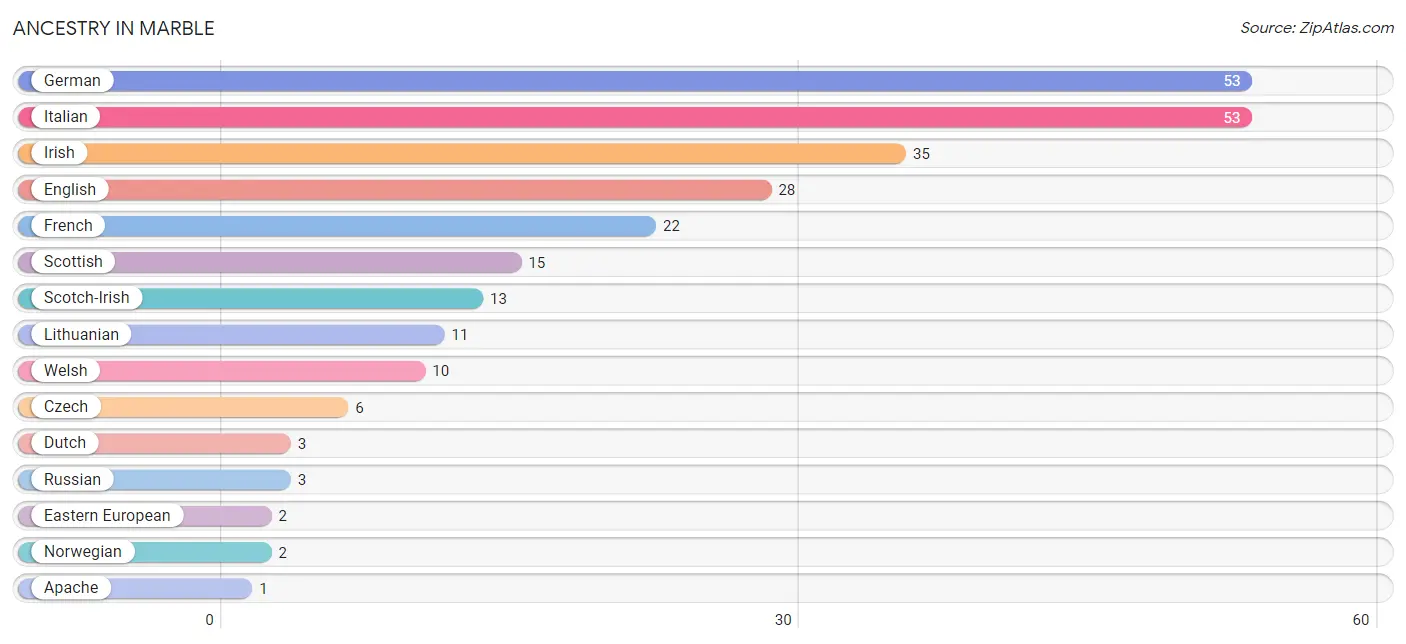
| Ancestry | # Population | % Population |
| Apache | 1 | 0.5% |
| Czech | 6 | 3.1% |
| Danish | 1 | 0.5% |
| Dutch | 3 | 1.6% |
| Eastern European | 2 | 1.1% |
| English | 28 | 14.7% |
| French | 22 | 11.5% |
| French Canadian | 1 | 0.5% |
| German | 53 | 27.8% |
| Irish | 35 | 18.3% |
| Italian | 53 | 27.8% |
| Lithuanian | 11 | 5.8% |
| Norwegian | 2 | 1.1% |
| Polish | 1 | 0.5% |
| Russian | 3 | 1.6% |
| Scotch-Irish | 13 | 6.8% |
| Scottish | 15 | 7.9% |
| Spaniard | 1 | 0.5% |
| Swedish | 1 | 0.5% |
| Welsh | 10 | 5.2% | View All 20 Rows |
Immigrants in Marble

| Immigration Origin | # Population | % Population | View All 0 Rows |
Sex and Age in Marble
Sex and Age in Marble
The most populous age groups in Marble are 10 to 14 Years (38 | 29.0%) for men and 40 to 44 Years (10 | 16.7%) for women.
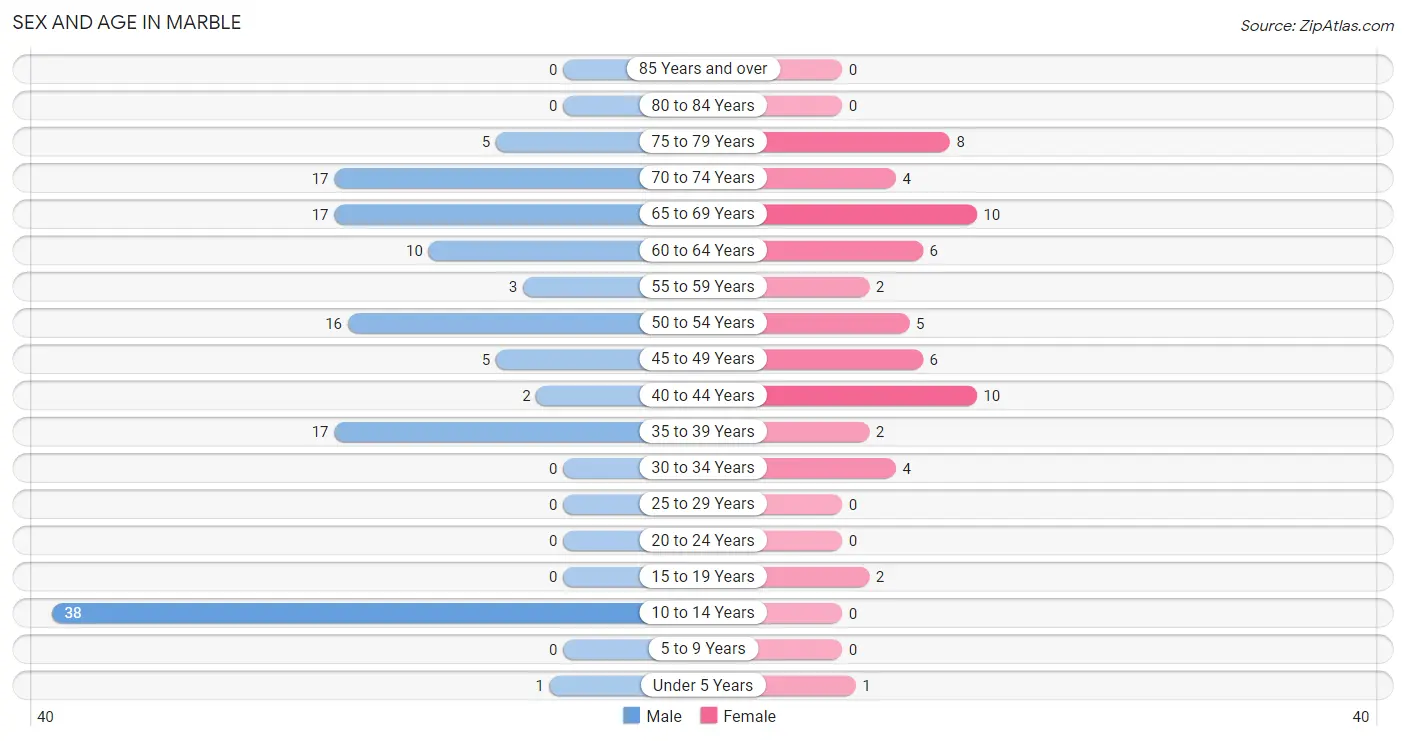
| Age Bracket | Male | Female |
| Under 5 Years | 1 (0.8%) | 1 (1.7%) |
| 5 to 9 Years | 0 (0.0%) | 0 (0.0%) |
| 10 to 14 Years | 38 (29.0%) | 0 (0.0%) |
| 15 to 19 Years | 0 (0.0%) | 2 (3.3%) |
| 20 to 24 Years | 0 (0.0%) | 0 (0.0%) |
| 25 to 29 Years | 0 (0.0%) | 0 (0.0%) |
| 30 to 34 Years | 0 (0.0%) | 4 (6.7%) |
| 35 to 39 Years | 17 (13.0%) | 2 (3.3%) |
| 40 to 44 Years | 2 (1.5%) | 10 (16.7%) |
| 45 to 49 Years | 5 (3.8%) | 6 (10.0%) |
| 50 to 54 Years | 16 (12.2%) | 5 (8.3%) |
| 55 to 59 Years | 3 (2.3%) | 2 (3.3%) |
| 60 to 64 Years | 10 (7.6%) | 6 (10.0%) |
| 65 to 69 Years | 17 (13.0%) | 10 (16.7%) |
| 70 to 74 Years | 17 (13.0%) | 4 (6.7%) |
| 75 to 79 Years | 5 (3.8%) | 8 (13.3%) |
| 80 to 84 Years | 0 (0.0%) | 0 (0.0%) |
| 85 Years and over | 0 (0.0%) | 0 (0.0%) |
| Total | 131 (100.0%) | 60 (100.0%) |
Families and Households in Marble
Median Family Size in Marble
The median family size in Marble is 2.44 persons per family, with single male/father families (15 | 23.8%) accounting for the largest median family size of 3.67 persons per family. On the other hand, single female/mother families (2 | 3.2%) represent the smallest median family size with 1.50 persons per family.
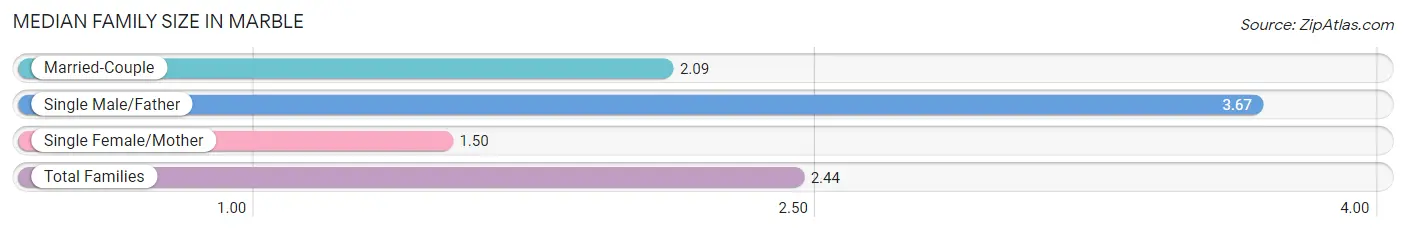
| Family Type | # Families | Family Size |
| Married-Couple | 46 (73.0%) | 2.09 |
| Single Male/Father | 15 (23.8%) | 3.67 |
| Single Female/Mother | 2 (3.2%) | 1.50 |
| Total Families | 63 (100.0%) | 2.44 |
Median Household Size in Marble
The median household size in Marble is 2.25 persons per household, with single male/father households (15 | 17.6%) accounting for the largest median household size of 3.93 persons per household. single female/mother households (2 | 2.4%) represent the smallest median household size with 1.50 persons per household.
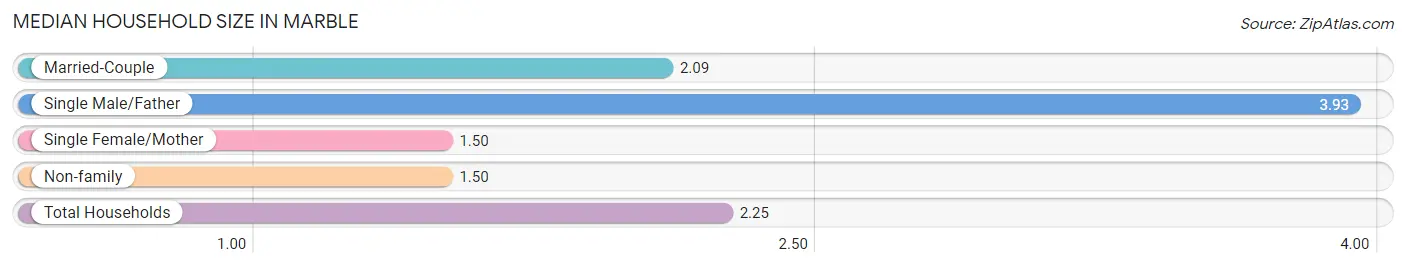
| Household Type | # Households | Household Size |
| Married-Couple | 46 (54.1%) | 2.09 |
| Single Male/Father | 15 (17.6%) | 3.93 |
| Single Female/Mother | 2 (2.4%) | 1.50 |
| Non-family | 22 (25.9%) | 1.50 |
| Total Households | 85 (100.0%) | 2.25 |
Household Size by Marriage Status in Marble
Out of a total of 85 households in Marble, 63 (74.1%) are family households, while 22 (25.9%) are nonfamily households. The most numerous type of family households are 2-person households, comprising 40, and the most common type of nonfamily households are 1-person households, comprising 11.
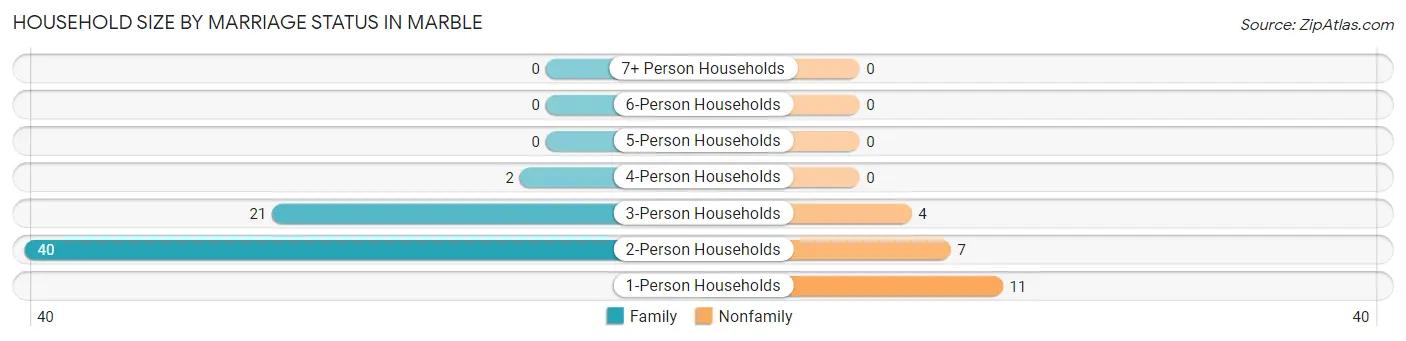
| Household Size | Family Households | Nonfamily Households |
| 1-Person Households | - | 11 (12.9%) |
| 2-Person Households | 40 (47.1%) | 7 (8.2%) |
| 3-Person Households | 21 (24.7%) | 4 (4.7%) |
| 4-Person Households | 2 (2.4%) | 0 (0.0%) |
| 5-Person Households | 0 (0.0%) | 0 (0.0%) |
| 6-Person Households | 0 (0.0%) | 0 (0.0%) |
| 7+ Person Households | 0 (0.0%) | 0 (0.0%) |
| Total | 63 (74.1%) | 22 (25.9%) |
Female Fertility in Marble
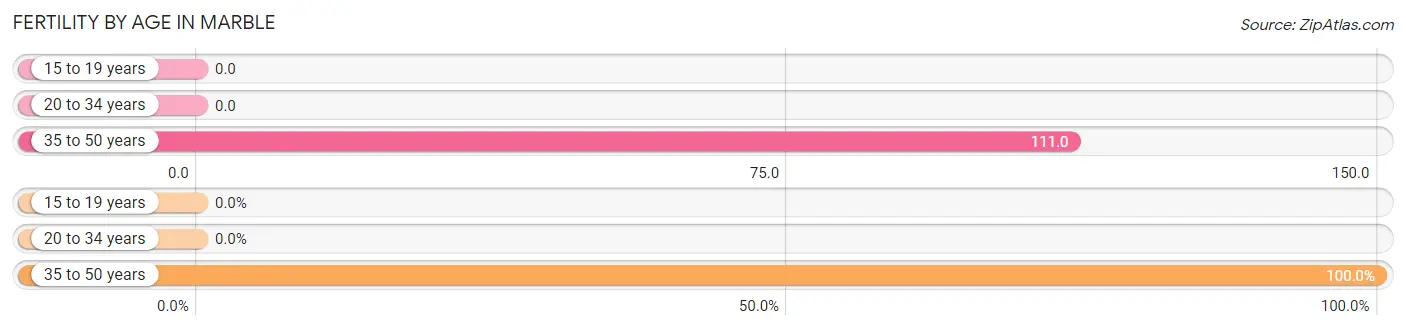
Fertility by Age in Marble
Average fertility rate in Marble is 83.0 births per 1,000 women. Women in the age bracket of 35 to 50 years have the highest fertility rate with 111.0 births per 1,000 women. Women in the age bracket of 35 to 50 years acount for 100.0% of all women with births.
| Age Bracket | Women with Births | Births / 1,000 Women |
| 15 to 19 years | 0 (0.0%) | 0.0 |
| 20 to 34 years | 0 (0.0%) | 0.0 |
| 35 to 50 years | 2 (100.0%) | 111.0 |
| Total | 2 (100.0%) | 83.0 |
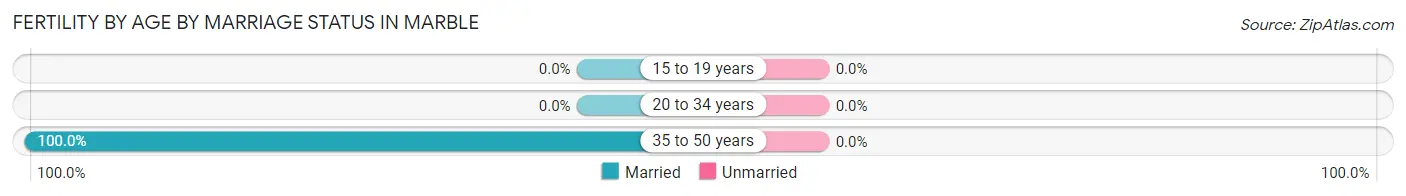
Fertility by Age by Marriage Status in Marble
| Age Bracket | Married | Unmarried |
| 15 to 19 years | 0 (0.0%) | 0 (0.0%) |
| 20 to 34 years | 0 (0.0%) | 0 (0.0%) |
| 35 to 50 years | 2 (100.0%) | 0 (0.0%) |
| Total | 2 (100.0%) | 0 (0.0%) |
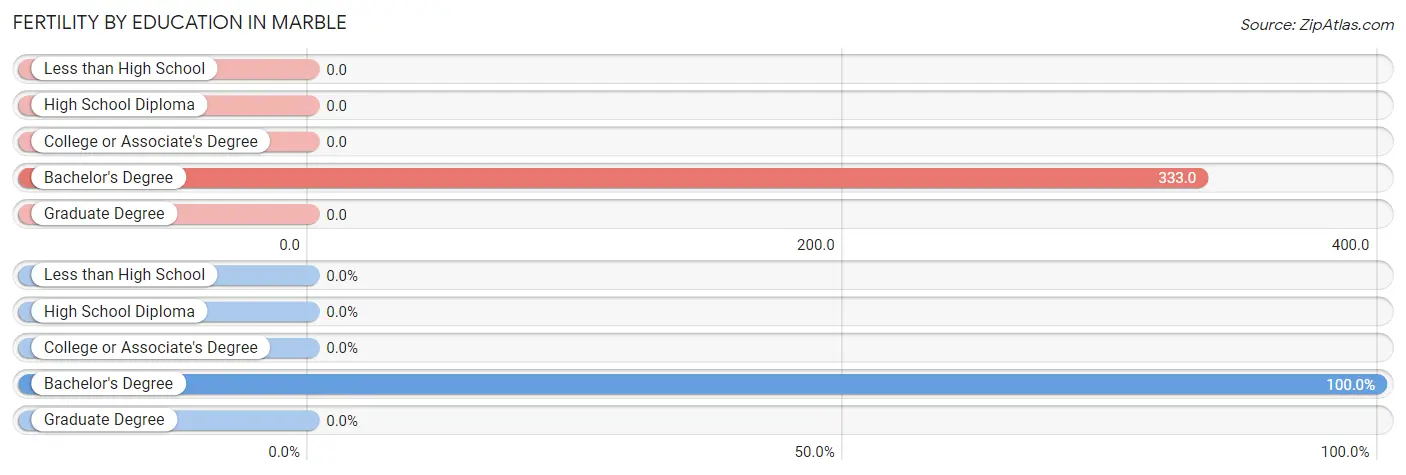
Fertility by Education in Marble
| Educational Attainment | Women with Births | Births / 1,000 Women |
| Less than High School | 0 (0.0%) | 0.0 |
| High School Diploma | 0 (0.0%) | 0.0 |
| College or Associate's Degree | 0 (0.0%) | 0.0 |
| Bachelor's Degree | 2 (100.0%) | 333.0 |
| Graduate Degree | 0 (0.0%) | 0.0 |
| Total | 2 (100.0%) | 83.0 |
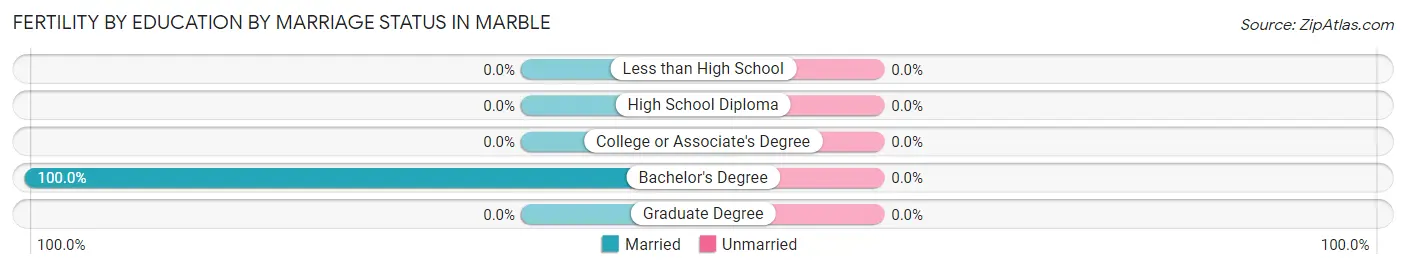
Fertility by Education by Marriage Status in Marble
| Educational Attainment | Married | Unmarried |
| Less than High School | 0 (0.0%) | 0 (0.0%) |
| High School Diploma | 0 (0.0%) | 0 (0.0%) |
| College or Associate's Degree | 0 (0.0%) | 0 (0.0%) |
| Bachelor's Degree | 2 (100.0%) | 0 (0.0%) |
| Graduate Degree | 0 (0.0%) | 0 (0.0%) |
| Total | 2 (100.0%) | 0 (0.0%) |
Employment Characteristics in Marble
Employment by Class of Employer in Marble
Among the 102 employed individuals in Marble, private company employees (49 | 48.0%), local government employees (18 | 17.6%), and not-for-profit organizations (17 | 16.7%) make up the most common classes of employment.
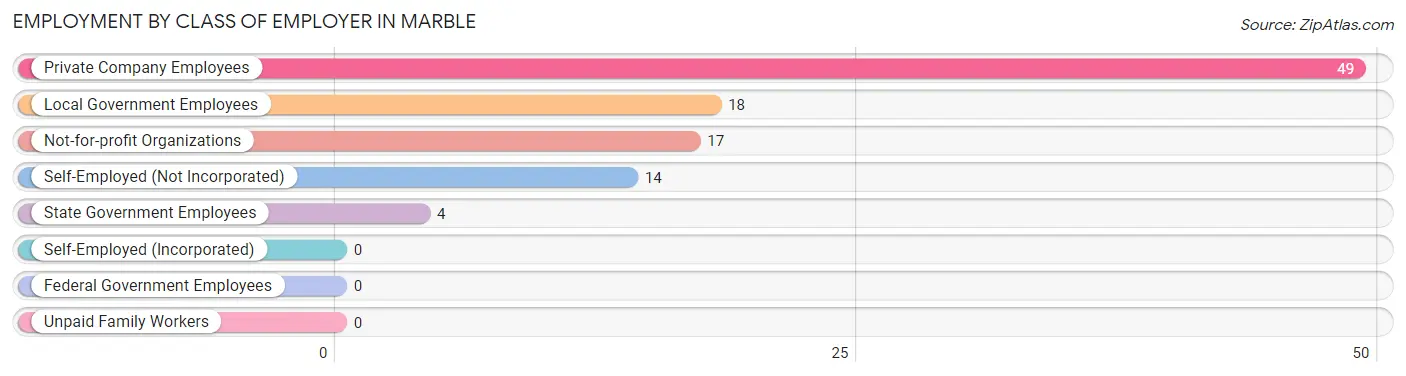
| Employer Class | # Employees | % Employees |
| Private Company Employees | 49 | 48.0% |
| Self-Employed (Incorporated) | 0 | 0.0% |
| Self-Employed (Not Incorporated) | 14 | 13.7% |
| Not-for-profit Organizations | 17 | 16.7% |
| Local Government Employees | 18 | 17.6% |
| State Government Employees | 4 | 3.9% |
| Federal Government Employees | 0 | 0.0% |
| Unpaid Family Workers | 0 | 0.0% |
| Total | 102 | 100.0% |
Employment Status by Age in Marble
According to the labor force statistics for Marble, out of the total population over 16 years of age (151), 69.5% or 105 individuals are in the labor force, with 1.0% or 1 of them unemployed. The age group with the highest labor force participation rate is 30 to 34 years, with 100.0% or 4 individuals in the labor force. Within the labor force, the 60 to 64 years age range has the highest percentage of unemployed individuals, with 12.5% or 1 of them being unemployed.
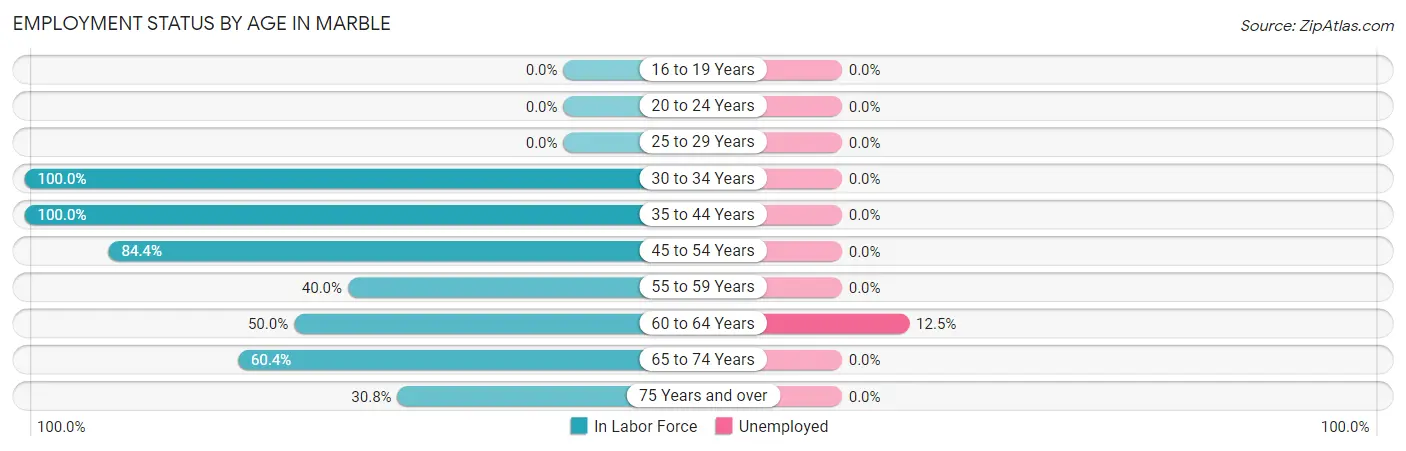
| Age Bracket | In Labor Force | Unemployed |
| 16 to 19 Years | 0 (0.0%) | 0 (0.0%) |
| 20 to 24 Years | 0 (0.0%) | 0 (0.0%) |
| 25 to 29 Years | 0 (0.0%) | 0 (0.0%) |
| 30 to 34 Years | 4 (100.0%) | 0 (0.0%) |
| 35 to 44 Years | 31 (100.0%) | 0 (0.0%) |
| 45 to 54 Years | 27 (84.4%) | 0 (0.0%) |
| 55 to 59 Years | 2 (40.0%) | 0 (0.0%) |
| 60 to 64 Years | 8 (50.0%) | 1 (12.5%) |
| 65 to 74 Years | 29 (60.4%) | 0 (0.0%) |
| 75 Years and over | 4 (30.8%) | 0 (0.0%) |
| Total | 105 (69.5%) | 1 (1.0%) |
Employment Status by Educational Attainment in Marble
According to labor force statistics for Marble, 81.8% of individuals (72) out of the total population between 25 and 64 years of age (88) are in the labor force, with 1.4% or 1 of them being unemployed. The group with the highest labor force participation rate are those with the educational attainment of less than high school, with 100.0% or 7 individuals in the labor force. Within the labor force, individuals with bachelor's degree or higher education have the highest percentage of unemployment, with 2.6% or 1 of them being unemployed.
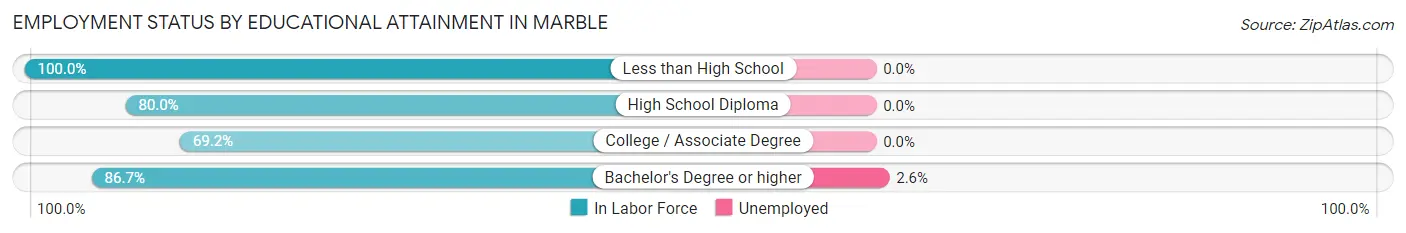
| Educational Attainment | In Labor Force | Unemployed |
| Less than High School | 7 (100.0%) | 0 (0.0%) |
| High School Diploma | 8 (80.0%) | 0 (0.0%) |
| College / Associate Degree | 18 (69.2%) | 0 (0.0%) |
| Bachelor's Degree or higher | 39 (86.7%) | 1 (2.6%) |
| Total | 72 (81.8%) | 1 (1.4%) |
Employment Occupations by Sex in Marble
Management, Business, Science and Arts Occupations
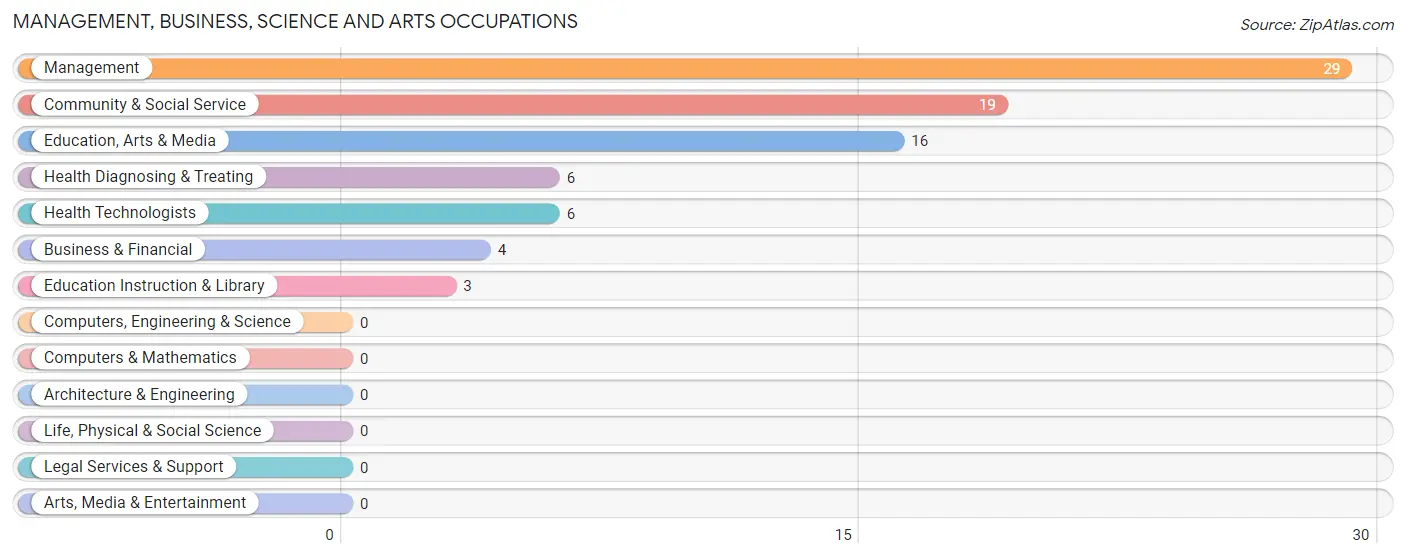
The most common Management, Business, Science and Arts occupations in Marble are Management (29 | 27.9%), Community & Social Service (19 | 18.3%), Education, Arts & Media (16 | 15.4%), Health Diagnosing & Treating (6 | 5.8%), and Health Technologists (6 | 5.8%).
Management, Business, Science and Arts Occupations by Sex
Within the Management, Business, Science and Arts occupations in Marble, the most male-oriented occupations are Business & Financial (100.0%), Education Instruction & Library (100.0%), and Management (79.3%), while the most female-oriented occupations are Health Diagnosing & Treating (100.0%), Health Technologists (100.0%), and Education, Arts & Media (37.5%).
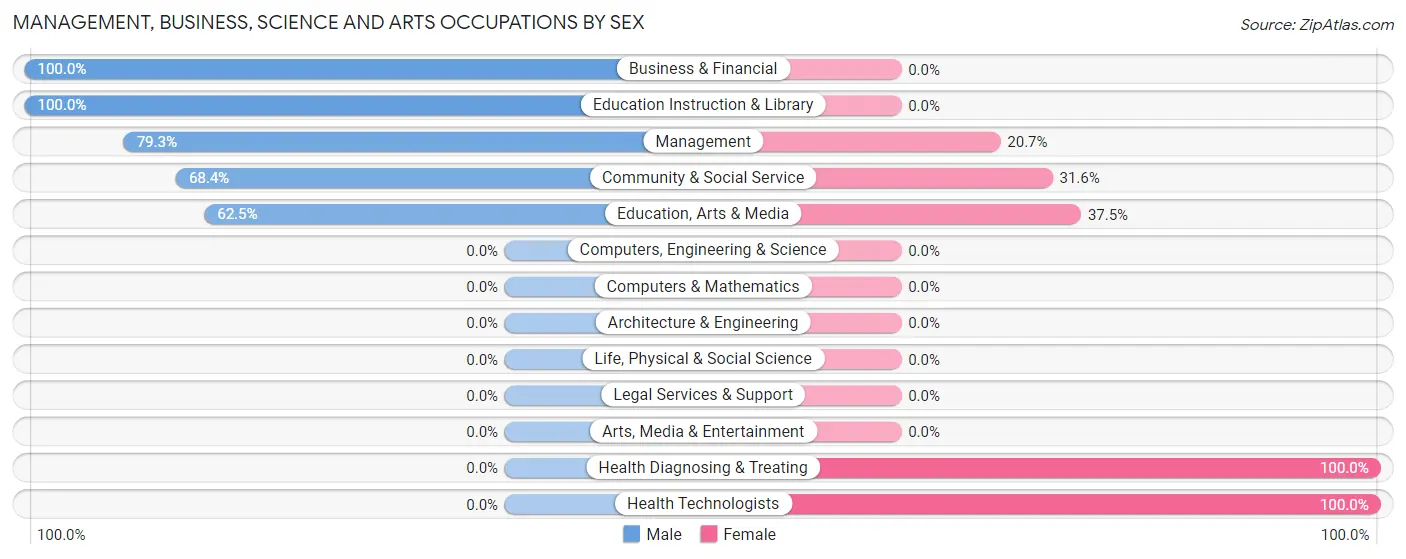
| Occupation | Male | Female |
| Management | 23 (79.3%) | 6 (20.7%) |
| Business & Financial | 4 (100.0%) | 0 (0.0%) |
| Computers, Engineering & Science | 0 (0.0%) | 0 (0.0%) |
| Computers & Mathematics | 0 (0.0%) | 0 (0.0%) |
| Architecture & Engineering | 0 (0.0%) | 0 (0.0%) |
| Life, Physical & Social Science | 0 (0.0%) | 0 (0.0%) |
| Community & Social Service | 13 (68.4%) | 6 (31.6%) |
| Education, Arts & Media | 10 (62.5%) | 6 (37.5%) |
| Legal Services & Support | 0 (0.0%) | 0 (0.0%) |
| Education Instruction & Library | 3 (100.0%) | 0 (0.0%) |
| Arts, Media & Entertainment | 0 (0.0%) | 0 (0.0%) |
| Health Diagnosing & Treating | 0 (0.0%) | 6 (100.0%) |
| Health Technologists | 0 (0.0%) | 6 (100.0%) |
| Total (Category) | 40 (69.0%) | 18 (31.0%) |
| Total (Overall) | 73 (70.2%) | 31 (29.8%) |
Services Occupations
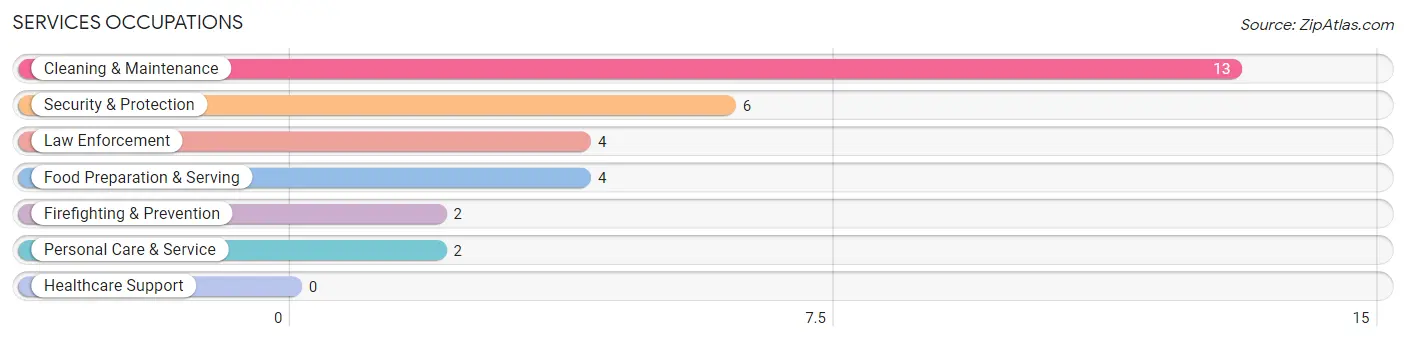
The most common Services occupations in Marble are Cleaning & Maintenance (13 | 12.5%), Security & Protection (6 | 5.8%), Law Enforcement (4 | 3.8%), Food Preparation & Serving (4 | 3.8%), and Firefighting & Prevention (2 | 1.9%).
Services Occupations by Sex
Within the Services occupations in Marble, the most male-oriented occupations are Firefighting & Prevention (100.0%), Cleaning & Maintenance (100.0%), and Personal Care & Service (100.0%), while the most female-oriented occupations are Food Preparation & Serving (100.0%), Law Enforcement (50.0%), and Security & Protection (33.3%).
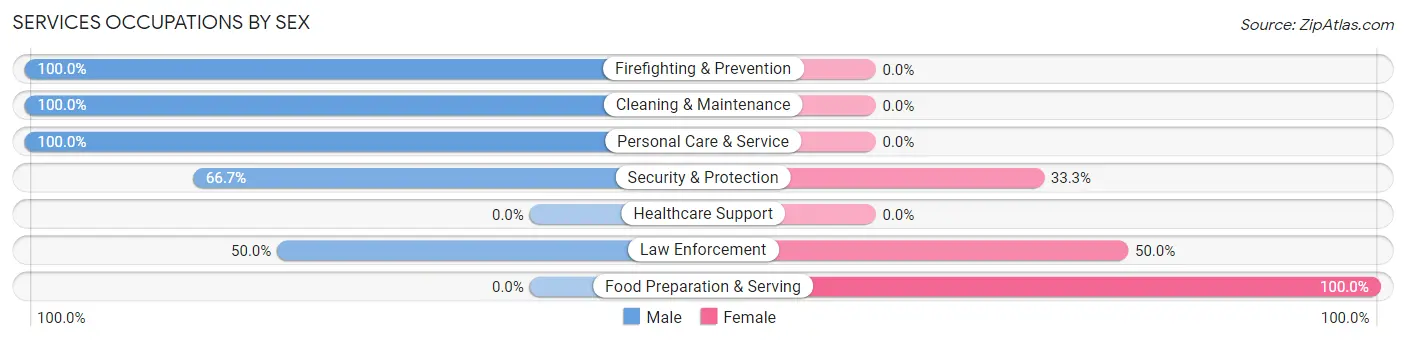
| Occupation | Male | Female |
| Healthcare Support | 0 (0.0%) | 0 (0.0%) |
| Security & Protection | 4 (66.7%) | 2 (33.3%) |
| Firefighting & Prevention | 2 (100.0%) | 0 (0.0%) |
| Law Enforcement | 2 (50.0%) | 2 (50.0%) |
| Food Preparation & Serving | 0 (0.0%) | 4 (100.0%) |
| Cleaning & Maintenance | 13 (100.0%) | 0 (0.0%) |
| Personal Care & Service | 2 (100.0%) | 0 (0.0%) |
| Total (Category) | 19 (76.0%) | 6 (24.0%) |
| Total (Overall) | 73 (70.2%) | 31 (29.8%) |
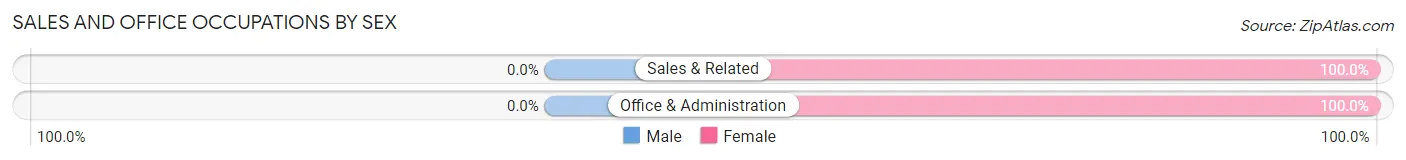
Sales and Office Occupations
The most common Sales and Office occupations in Marble are Sales & Related (3 | 2.9%), and Office & Administration (2 | 1.9%).
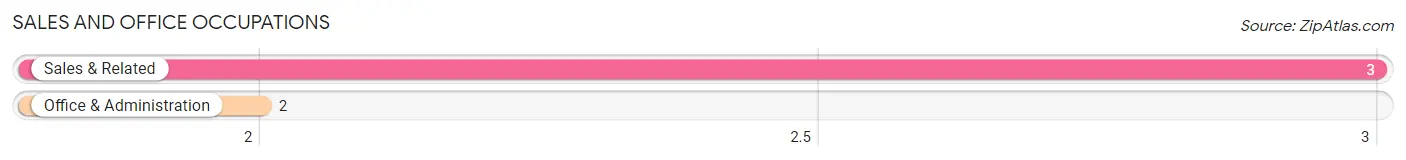
Sales and Office Occupations by Sex
| Occupation | Male | Female |
| Sales & Related | 0 (0.0%) | 3 (100.0%) |
| Office & Administration | 0 (0.0%) | 2 (100.0%) |
| Total (Category) | 0 (0.0%) | 5 (100.0%) |
| Total (Overall) | 73 (70.2%) | 31 (29.8%) |
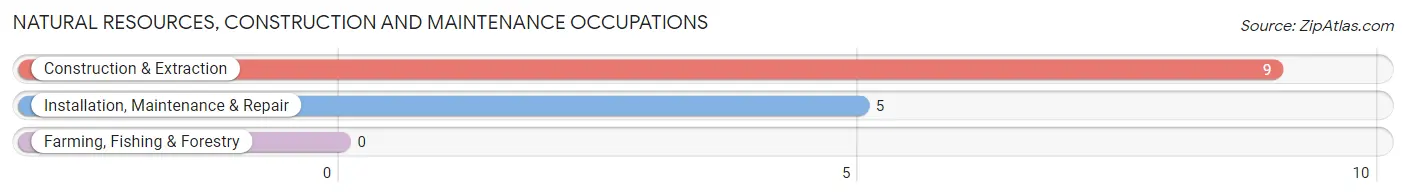
Natural Resources, Construction and Maintenance Occupations
The most common Natural Resources, Construction and Maintenance occupations in Marble are Construction & Extraction (9 | 8.6%), and Installation, Maintenance & Repair (5 | 4.8%).
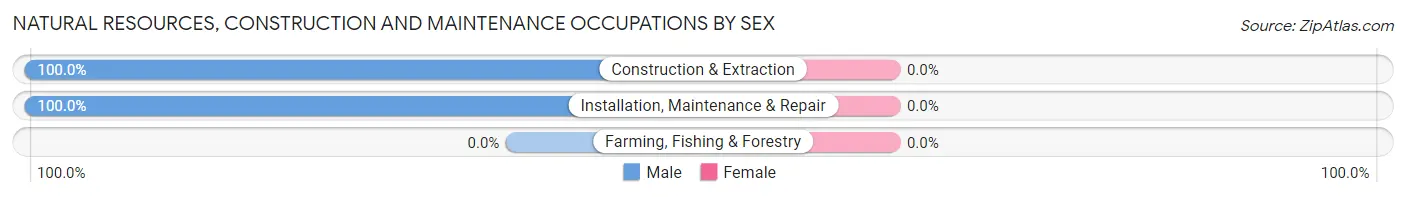
Natural Resources, Construction and Maintenance Occupations by Sex
| Occupation | Male | Female |
| Farming, Fishing & Forestry | 0 (0.0%) | 0 (0.0%) |
| Construction & Extraction | 9 (100.0%) | 0 (0.0%) |
| Installation, Maintenance & Repair | 5 (100.0%) | 0 (0.0%) |
| Total (Category) | 14 (100.0%) | 0 (0.0%) |
| Total (Overall) | 73 (70.2%) | 31 (29.8%) |
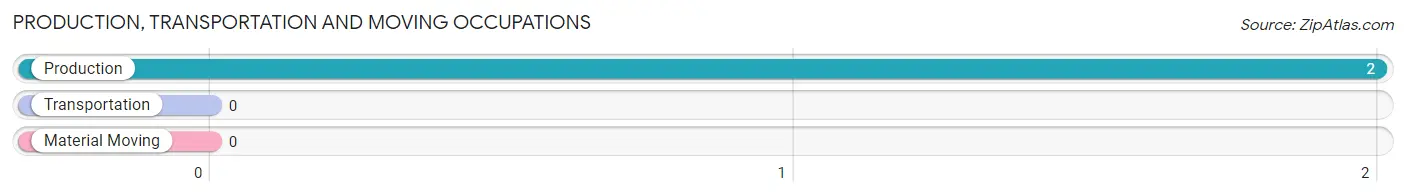
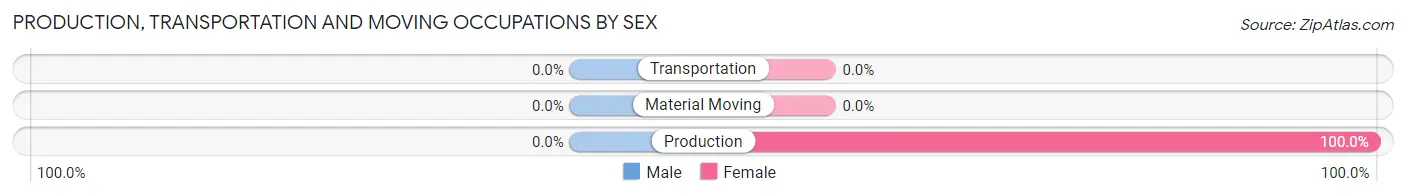
Production, Transportation and Moving Occupations
The most common Production, Transportation and Moving occupations in Marble are , and Production (2 | 1.9%).
Production, Transportation and Moving Occupations by Sex
| Occupation | Male | Female |
| Production | 0 (0.0%) | 2 (100.0%) |
| Transportation | 0 (0.0%) | 0 (0.0%) |
| Material Moving | 0 (0.0%) | 0 (0.0%) |
| Total (Category) | 0 (0.0%) | 2 (100.0%) |
| Total (Overall) | 73 (70.2%) | 31 (29.8%) |
Employment Industries by Sex in Marble
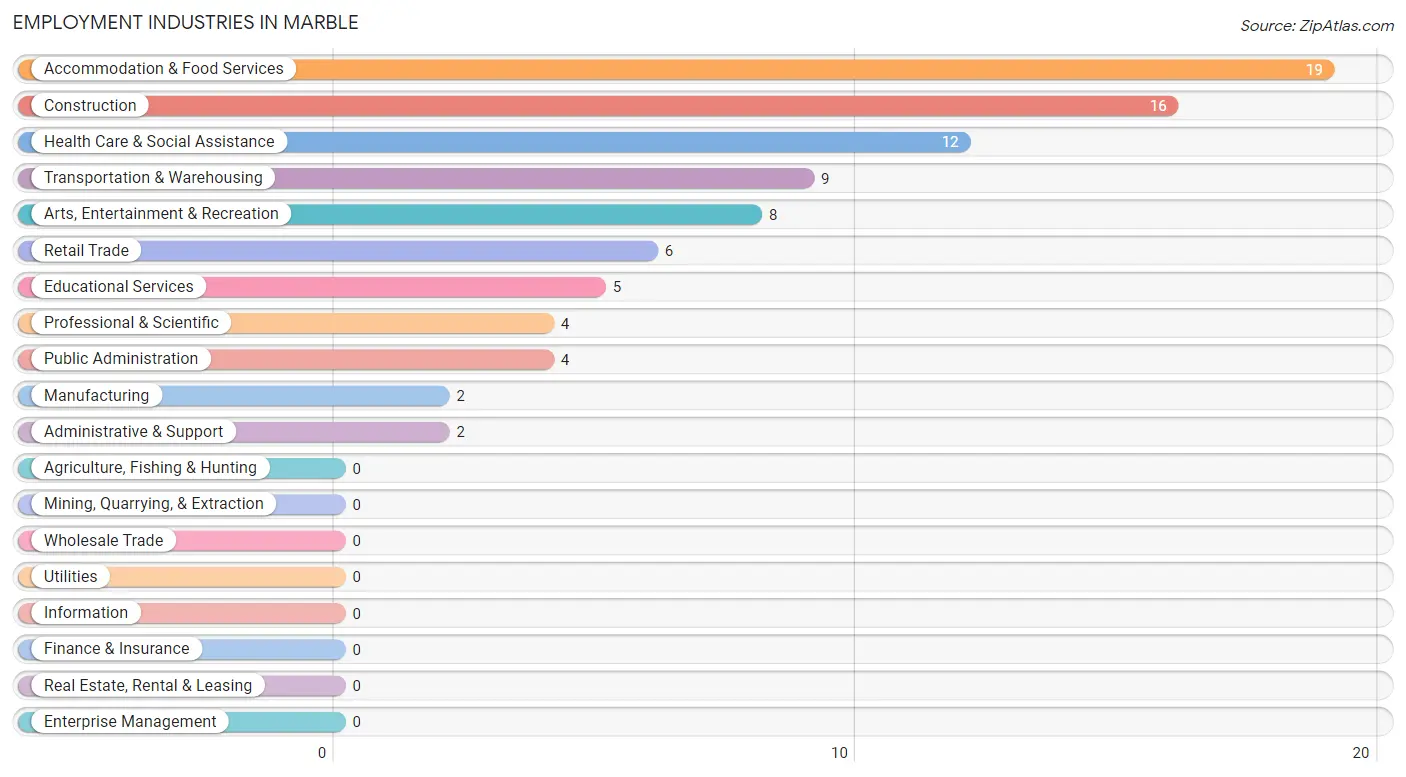
Employment Industries in Marble
The major employment industries in Marble include Accommodation & Food Services (19 | 18.3%), Construction (16 | 15.4%), Health Care & Social Assistance (12 | 11.5%), Transportation & Warehousing (9 | 8.6%), and Arts, Entertainment & Recreation (8 | 7.7%).
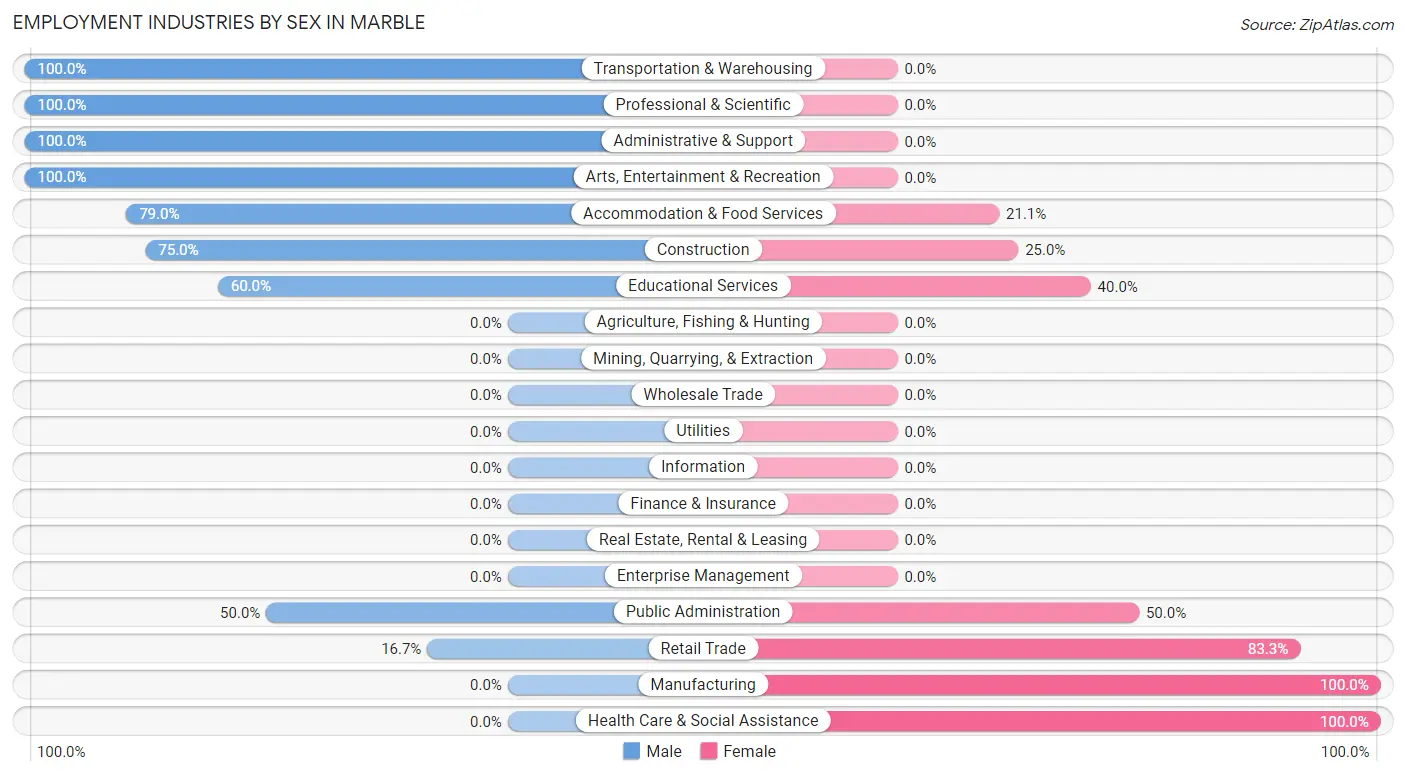
Employment Industries by Sex in Marble
The Marble industries that see more men than women are Transportation & Warehousing (100.0%), Professional & Scientific (100.0%), and Administrative & Support (100.0%), whereas the industries that tend to have a higher number of women are Manufacturing (100.0%), Health Care & Social Assistance (100.0%), and Retail Trade (83.3%).
| Industry | Male | Female |
| Agriculture, Fishing & Hunting | 0 (0.0%) | 0 (0.0%) |
| Mining, Quarrying, & Extraction | 0 (0.0%) | 0 (0.0%) |
| Construction | 12 (75.0%) | 4 (25.0%) |
| Manufacturing | 0 (0.0%) | 2 (100.0%) |
| Wholesale Trade | 0 (0.0%) | 0 (0.0%) |
| Retail Trade | 1 (16.7%) | 5 (83.3%) |
| Transportation & Warehousing | 9 (100.0%) | 0 (0.0%) |
| Utilities | 0 (0.0%) | 0 (0.0%) |
| Information | 0 (0.0%) | 0 (0.0%) |
| Finance & Insurance | 0 (0.0%) | 0 (0.0%) |
| Real Estate, Rental & Leasing | 0 (0.0%) | 0 (0.0%) |
| Professional & Scientific | 4 (100.0%) | 0 (0.0%) |
| Enterprise Management | 0 (0.0%) | 0 (0.0%) |
| Administrative & Support | 2 (100.0%) | 0 (0.0%) |
| Educational Services | 3 (60.0%) | 2 (40.0%) |
| Health Care & Social Assistance | 0 (0.0%) | 12 (100.0%) |
| Arts, Entertainment & Recreation | 8 (100.0%) | 0 (0.0%) |
| Accommodation & Food Services | 15 (78.9%) | 4 (21.0%) |
| Public Administration | 2 (50.0%) | 2 (50.0%) |
| Total | 73 (70.2%) | 31 (29.8%) |
Education in Marble
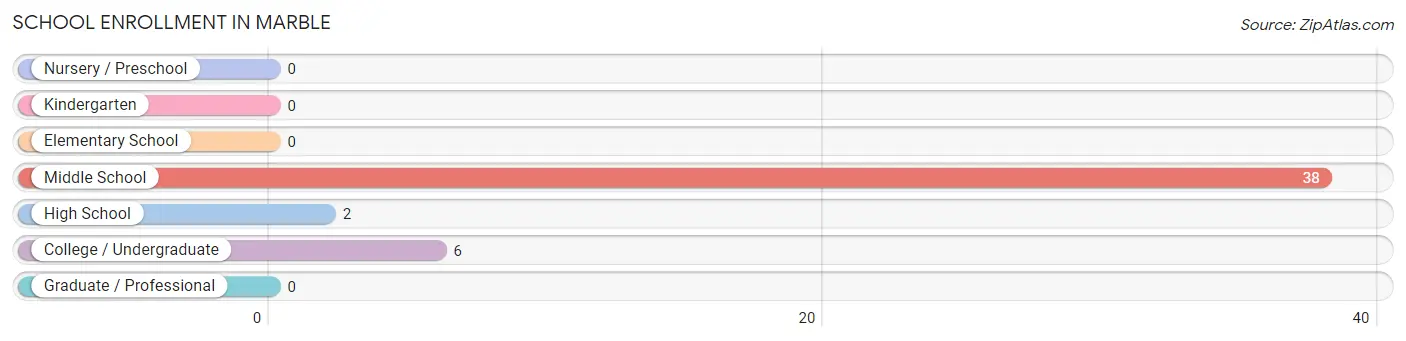
School Enrollment in Marble
The most common levels of schooling among the 46 students in Marble are middle school (38 | 82.6%), college / undergraduate (6 | 13.0%), and high school (2 | 4.3%).
| School Level | # Students | % Students |
| Nursery / Preschool | 0 | 0.0% |
| Kindergarten | 0 | 0.0% |
| Elementary School | 0 | 0.0% |
| Middle School | 38 | 82.6% |
| High School | 2 | 4.3% |
| College / Undergraduate | 6 | 13.0% |
| Graduate / Professional | 0 | 0.0% |
| Total | 46 | 100.0% |
School Enrollment by Age by Funding Source in Marble
Out of a total of 46 students who are enrolled in schools in Marble, 2 (4.3%) attend a private institution, while the remaining 44 (95.7%) are enrolled in public schools. The age group of 15 to 17 year olds has the highest likelihood of being enrolled in private schools, with 2 (100.0% in the age bracket) enrolled. Conversely, the age group of 10 to 14 year olds has the lowest likelihood of being enrolled in a private school, with 38 (100.0% in the age bracket) attending a public institution.
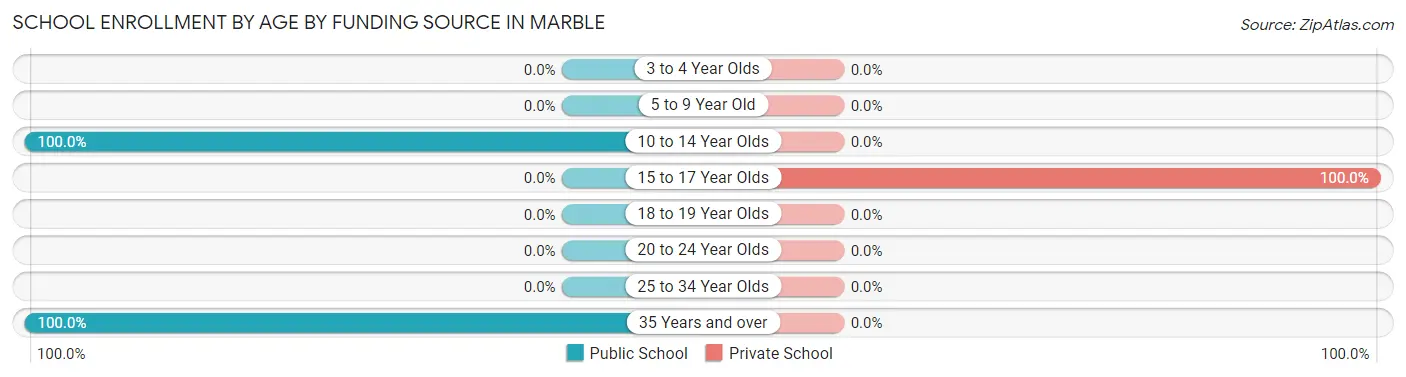
| Age Bracket | Public School | Private School |
| 3 to 4 Year Olds | 0 (0.0%) | 0 (0.0%) |
| 5 to 9 Year Old | 0 (0.0%) | 0 (0.0%) |
| 10 to 14 Year Olds | 38 (100.0%) | 0 (0.0%) |
| 15 to 17 Year Olds | 0 (0.0%) | 2 (100.0%) |
| 18 to 19 Year Olds | 0 (0.0%) | 0 (0.0%) |
| 20 to 24 Year Olds | 0 (0.0%) | 0 (0.0%) |
| 25 to 34 Year Olds | 0 (0.0%) | 0 (0.0%) |
| 35 Years and over | 6 (100.0%) | 0 (0.0%) |
| Total | 44 (95.7%) | 2 (4.3%) |
Educational Attainment by Field of Study in Marble
Business (19 | 22.1%), liberal arts & history (11 | 12.8%), psychology (10 | 11.6%), social sciences (9 | 10.5%), and science & technology (8 | 9.3%) are the most common fields of study among 86 individuals in Marble who have obtained a bachelor's degree or higher.
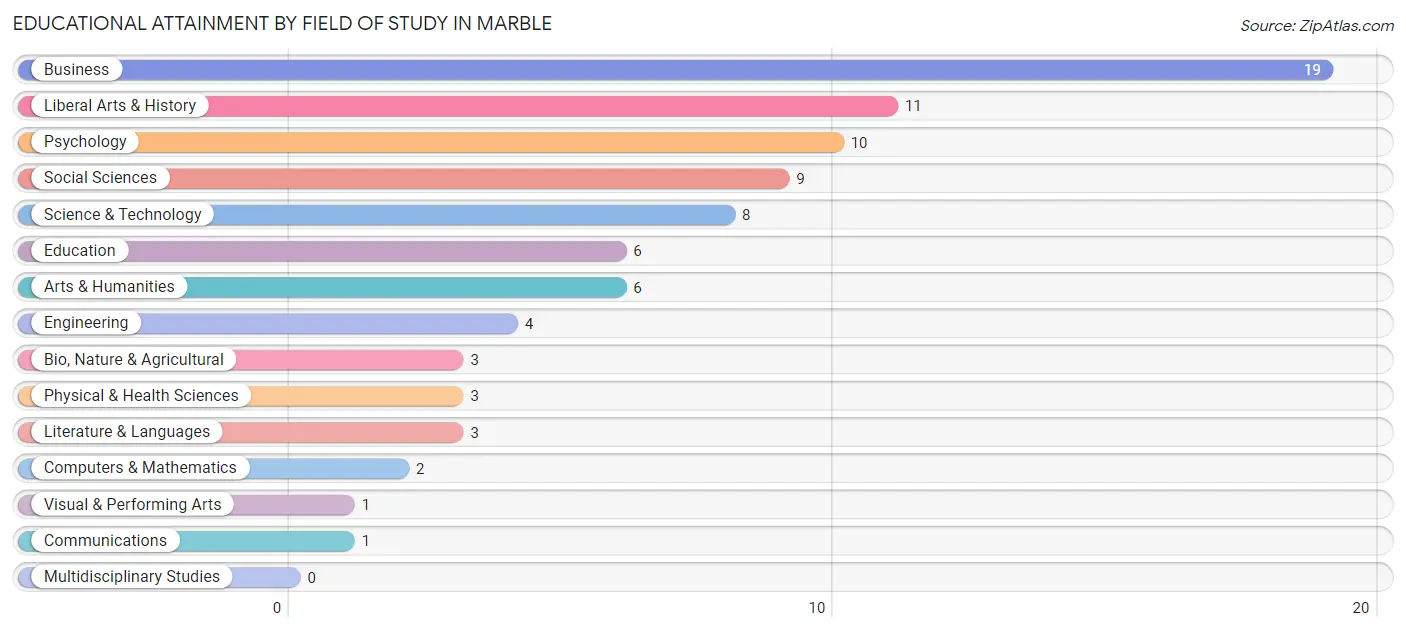
| Field of Study | # Graduates | % Graduates |
| Computers & Mathematics | 2 | 2.3% |
| Bio, Nature & Agricultural | 3 | 3.5% |
| Physical & Health Sciences | 3 | 3.5% |
| Psychology | 10 | 11.6% |
| Social Sciences | 9 | 10.5% |
| Engineering | 4 | 4.6% |
| Multidisciplinary Studies | 0 | 0.0% |
| Science & Technology | 8 | 9.3% |
| Business | 19 | 22.1% |
| Education | 6 | 7.0% |
| Literature & Languages | 3 | 3.5% |
| Liberal Arts & History | 11 | 12.8% |
| Visual & Performing Arts | 1 | 1.2% |
| Communications | 1 | 1.2% |
| Arts & Humanities | 6 | 7.0% |
| Total | 86 | 100.0% |
Transportation & Commute in Marble
Vehicle Availability by Sex in Marble
The most prevalent vehicle ownership categories in Marble are males with 2 vehicles (35, accounting for 49.3%) and females with 2 vehicles (15, making up 112.9%).
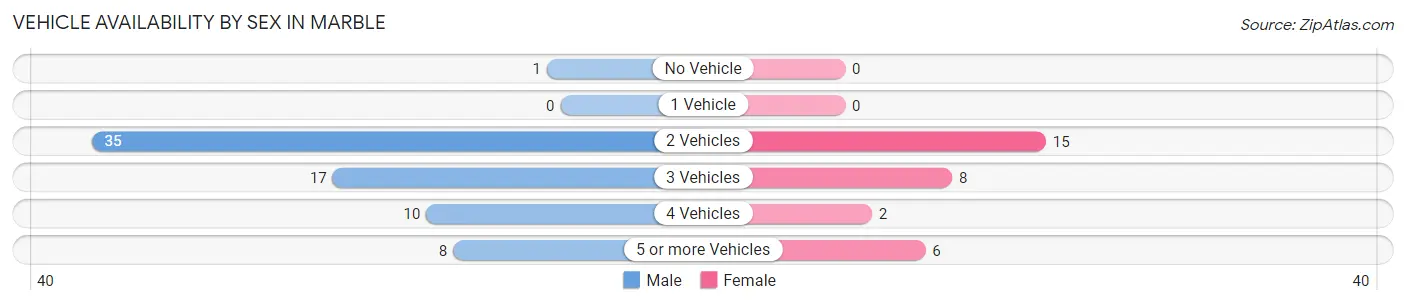
| Vehicles Available | Male | Female |
| No Vehicle | 1 (1.4%) | 0 (0.0%) |
| 1 Vehicle | 0 (0.0%) | 0 (0.0%) |
| 2 Vehicles | 35 (49.3%) | 15 (48.4%) |
| 3 Vehicles | 17 (23.9%) | 8 (25.8%) |
| 4 Vehicles | 10 (14.1%) | 2 (6.5%) |
| 5 or more Vehicles | 8 (11.3%) | 6 (19.4%) |
| Total | 71 (100.0%) | 31 (100.0%) |
Commute Time in Marble
The most frequently occuring commute durations in Marble are less than 5 minutes (26 commuters, 26.0%), 60 to 89 minutes (21 commuters, 21.0%), and 5 to 9 minutes (18 commuters, 18.0%).
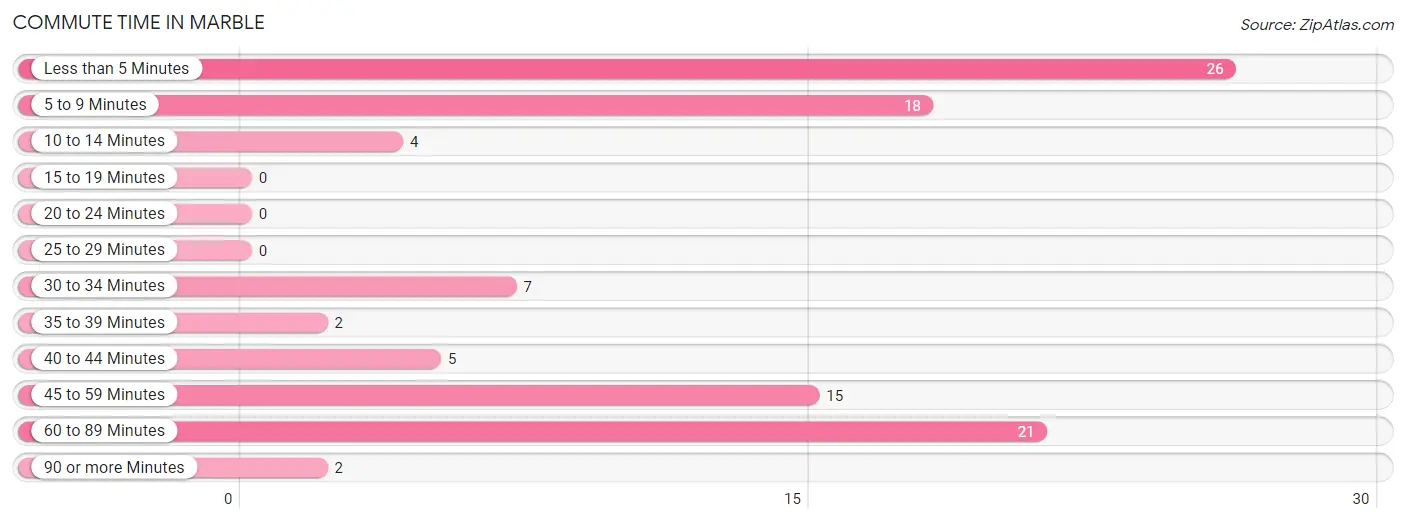
| Commute Time | # Commuters | % Commuters |
| Less than 5 Minutes | 26 | 26.0% |
| 5 to 9 Minutes | 18 | 18.0% |
| 10 to 14 Minutes | 4 | 4.0% |
| 15 to 19 Minutes | 0 | 0.0% |
| 20 to 24 Minutes | 0 | 0.0% |
| 25 to 29 Minutes | 0 | 0.0% |
| 30 to 34 Minutes | 7 | 7.0% |
| 35 to 39 Minutes | 2 | 2.0% |
| 40 to 44 Minutes | 5 | 5.0% |
| 45 to 59 Minutes | 15 | 15.0% |
| 60 to 89 Minutes | 21 | 21.0% |
| 90 or more Minutes | 2 | 2.0% |
Commute Time by Sex in Marble
The most common commute times in Marble are less than 5 minutes (23 commuters, 32.4%) for males and 60 to 89 minutes (14 commuters, 48.3%) for females.
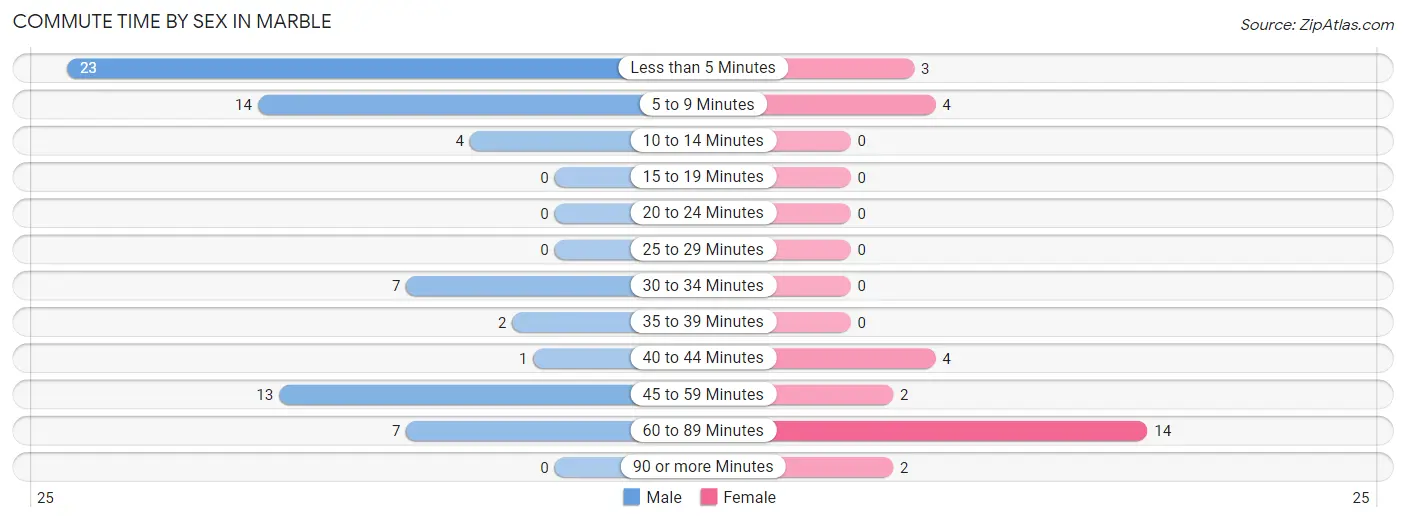
| Commute Time | Male | Female |
| Less than 5 Minutes | 23 (32.4%) | 3 (10.3%) |
| 5 to 9 Minutes | 14 (19.7%) | 4 (13.8%) |
| 10 to 14 Minutes | 4 (5.6%) | 0 (0.0%) |
| 15 to 19 Minutes | 0 (0.0%) | 0 (0.0%) |
| 20 to 24 Minutes | 0 (0.0%) | 0 (0.0%) |
| 25 to 29 Minutes | 0 (0.0%) | 0 (0.0%) |
| 30 to 34 Minutes | 7 (9.9%) | 0 (0.0%) |
| 35 to 39 Minutes | 2 (2.8%) | 0 (0.0%) |
| 40 to 44 Minutes | 1 (1.4%) | 4 (13.8%) |
| 45 to 59 Minutes | 13 (18.3%) | 2 (6.9%) |
| 60 to 89 Minutes | 7 (9.9%) | 14 (48.3%) |
| 90 or more Minutes | 0 (0.0%) | 2 (6.9%) |
Time of Departure to Work by Sex in Marble
The most frequent times of departure to work in Marble are 6:00 AM to 6:29 AM (41, 57.8%) for males and 10:00 AM to 10:59 AM (7, 24.1%) for females.
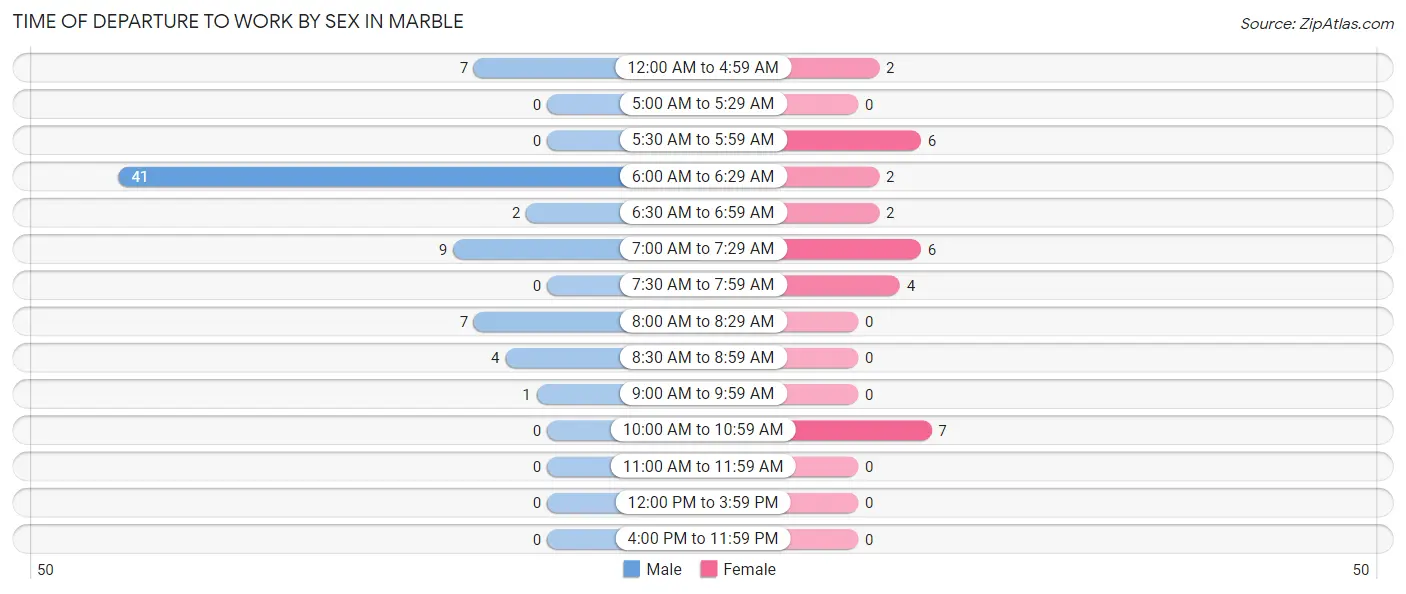
| Time of Departure | Male | Female |
| 12:00 AM to 4:59 AM | 7 (9.9%) | 2 (6.9%) |
| 5:00 AM to 5:29 AM | 0 (0.0%) | 0 (0.0%) |
| 5:30 AM to 5:59 AM | 0 (0.0%) | 6 (20.7%) |
| 6:00 AM to 6:29 AM | 41 (57.8%) | 2 (6.9%) |
| 6:30 AM to 6:59 AM | 2 (2.8%) | 2 (6.9%) |
| 7:00 AM to 7:29 AM | 9 (12.7%) | 6 (20.7%) |
| 7:30 AM to 7:59 AM | 0 (0.0%) | 4 (13.8%) |
| 8:00 AM to 8:29 AM | 7 (9.9%) | 0 (0.0%) |
| 8:30 AM to 8:59 AM | 4 (5.6%) | 0 (0.0%) |
| 9:00 AM to 9:59 AM | 1 (1.4%) | 0 (0.0%) |
| 10:00 AM to 10:59 AM | 0 (0.0%) | 7 (24.1%) |
| 11:00 AM to 11:59 AM | 0 (0.0%) | 0 (0.0%) |
| 12:00 PM to 3:59 PM | 0 (0.0%) | 0 (0.0%) |
| 4:00 PM to 11:59 PM | 0 (0.0%) | 0 (0.0%) |
| Total | 71 (100.0%) | 29 (100.0%) |
Housing Occupancy in Marble
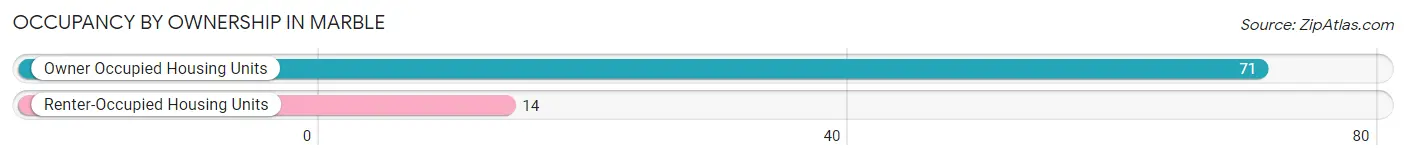
Occupancy by Ownership in Marble
Of the total 85 dwellings in Marble, owner-occupied units account for 71 (83.5%), while renter-occupied units make up 14 (16.5%).
| Occupancy | # Housing Units | % Housing Units |
| Owner Occupied Housing Units | 71 | 83.5% |
| Renter-Occupied Housing Units | 14 | 16.5% |
| Total Occupied Housing Units | 85 | 100.0% |
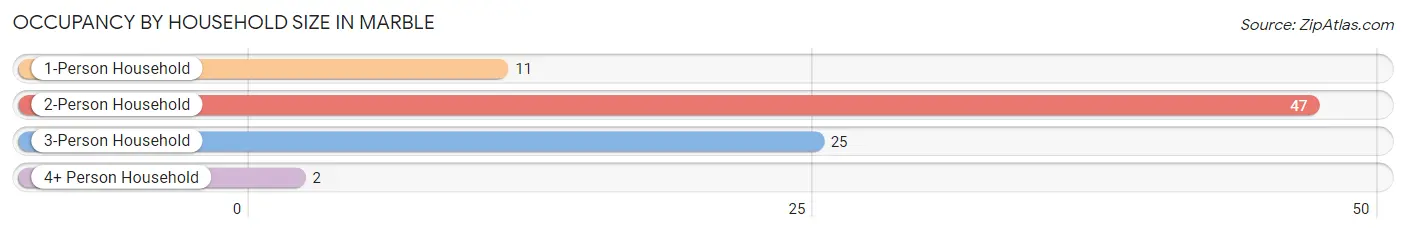
Occupancy by Household Size in Marble
| Household Size | # Housing Units | % Housing Units |
| 1-Person Household | 11 | 12.9% |
| 2-Person Household | 47 | 55.3% |
| 3-Person Household | 25 | 29.4% |
| 4+ Person Household | 2 | 2.4% |
| Total Housing Units | 85 | 100.0% |
Occupancy by Ownership by Household Size in Marble
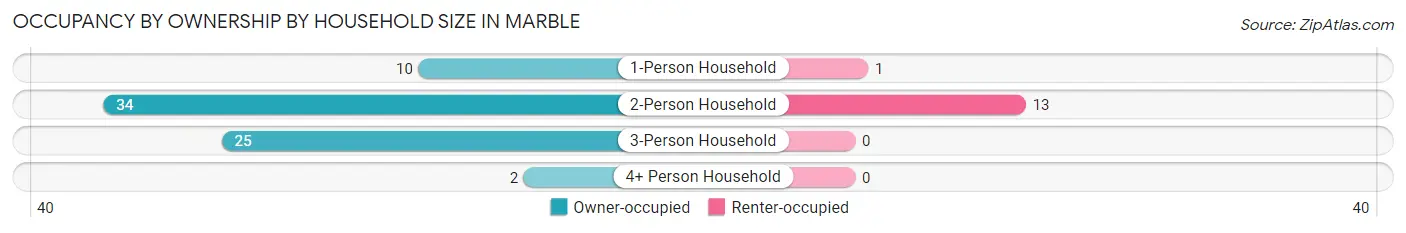
| Household Size | Owner-occupied | Renter-occupied |
| 1-Person Household | 10 (90.9%) | 1 (9.1%) |
| 2-Person Household | 34 (72.3%) | 13 (27.7%) |
| 3-Person Household | 25 (100.0%) | 0 (0.0%) |
| 4+ Person Household | 2 (100.0%) | 0 (0.0%) |
| Total Housing Units | 71 (83.5%) | 14 (16.5%) |
Occupancy by Educational Attainment in Marble
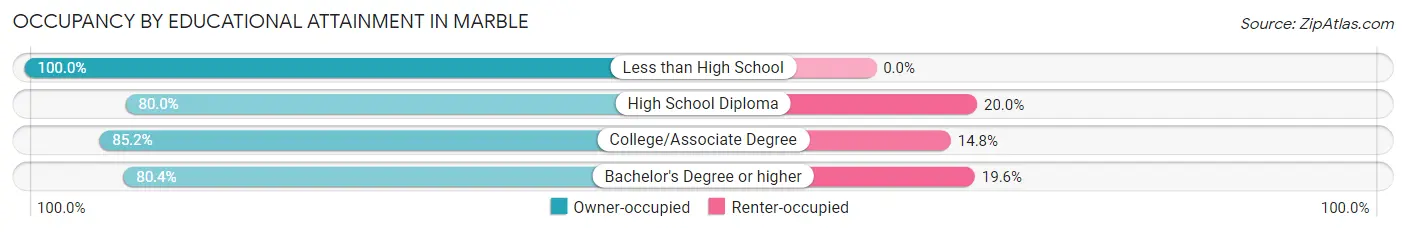
| Household Size | Owner-occupied | Renter-occupied |
| Less than High School | 7 (100.0%) | 0 (0.0%) |
| High School Diploma | 4 (80.0%) | 1 (20.0%) |
| College/Associate Degree | 23 (85.2%) | 4 (14.8%) |
| Bachelor's Degree or higher | 37 (80.4%) | 9 (19.6%) |
Occupancy by Age of Householder in Marble
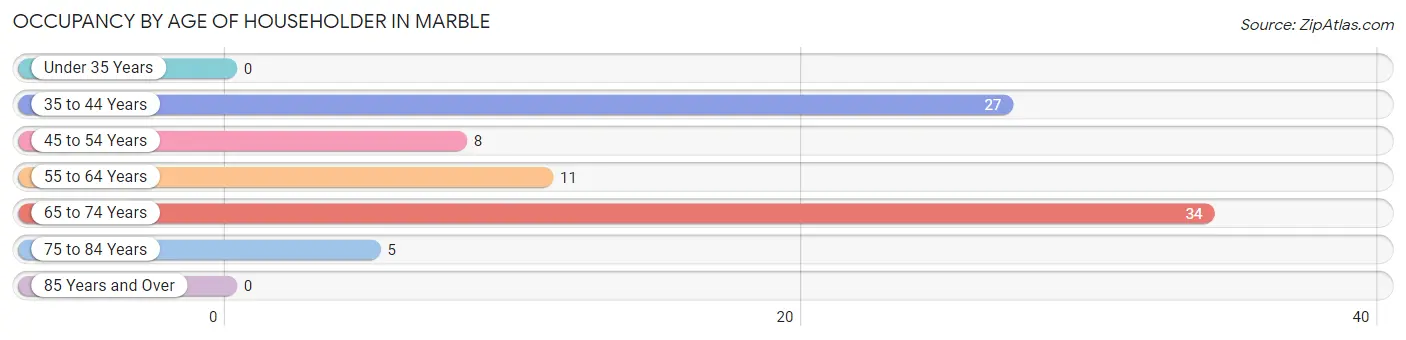
| Age Bracket | # Households | % Households |
| Under 35 Years | 0 | 0.0% |
| 35 to 44 Years | 27 | 31.8% |
| 45 to 54 Years | 8 | 9.4% |
| 55 to 64 Years | 11 | 12.9% |
| 65 to 74 Years | 34 | 40.0% |
| 75 to 84 Years | 5 | 5.9% |
| 85 Years and Over | 0 | 0.0% |
| Total | 85 | 100.0% |
Housing Finances in Marble
Median Income by Occupancy in Marble
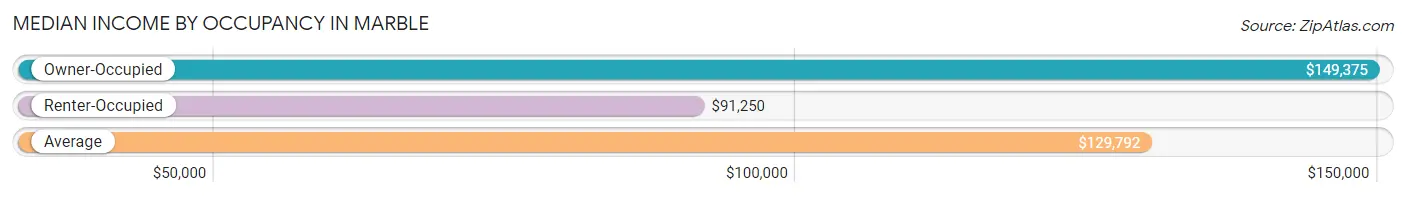
| Occupancy Type | # Households | Median Income |
| Owner-Occupied | 71 (83.5%) | $149,375 |
| Renter-Occupied | 14 (16.5%) | $91,250 |
| Average | 85 (100.0%) | $129,792 |
Occupancy by Householder Income Bracket in Marble
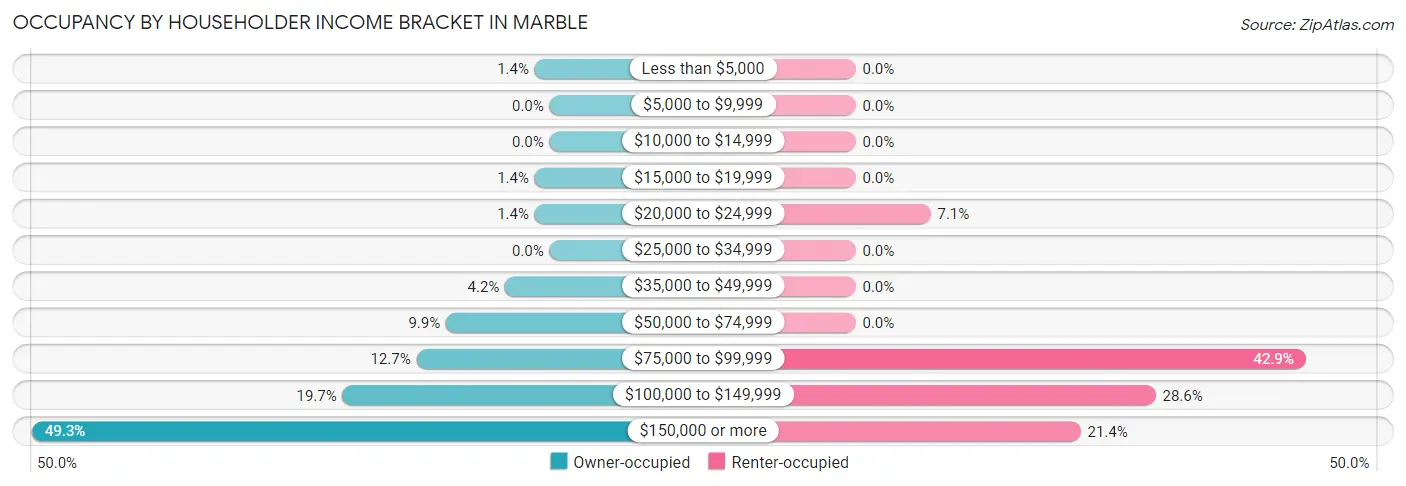
| Income Bracket | Owner-occupied | Renter-occupied |
| Less than $5,000 | 1 (1.4%) | 0 (0.0%) |
| $5,000 to $9,999 | 0 (0.0%) | 0 (0.0%) |
| $10,000 to $14,999 | 0 (0.0%) | 0 (0.0%) |
| $15,000 to $19,999 | 1 (1.4%) | 0 (0.0%) |
| $20,000 to $24,999 | 1 (1.4%) | 1 (7.1%) |
| $25,000 to $34,999 | 0 (0.0%) | 0 (0.0%) |
| $35,000 to $49,999 | 3 (4.2%) | 0 (0.0%) |
| $50,000 to $74,999 | 7 (9.9%) | 0 (0.0%) |
| $75,000 to $99,999 | 9 (12.7%) | 6 (42.9%) |
| $100,000 to $149,999 | 14 (19.7%) | 4 (28.6%) |
| $150,000 or more | 35 (49.3%) | 3 (21.4%) |
| Total | 71 (100.0%) | 14 (100.0%) |
Monthly Housing Cost Tiers in Marble
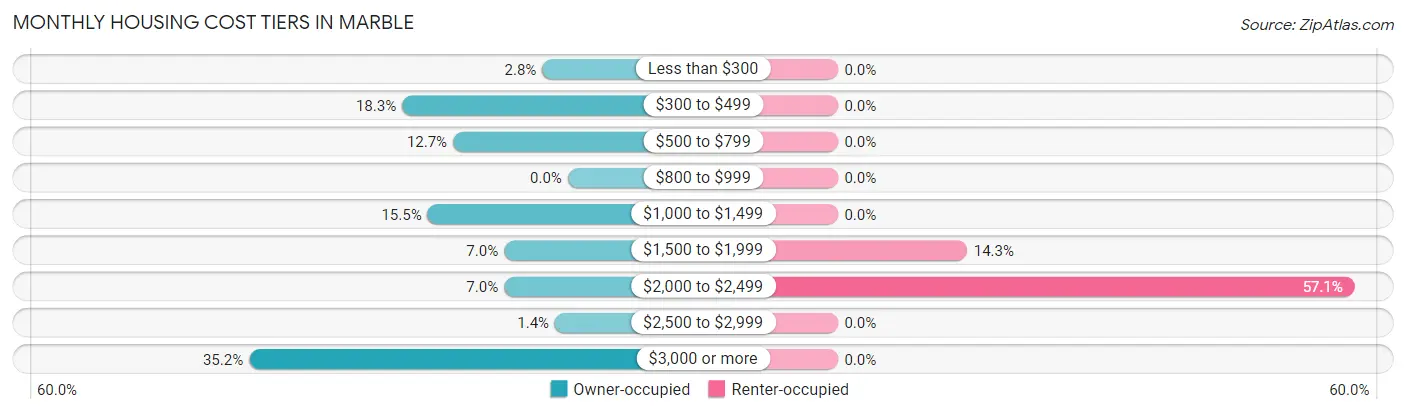
| Monthly Cost | Owner-occupied | Renter-occupied |
| Less than $300 | 2 (2.8%) | 0 (0.0%) |
| $300 to $499 | 13 (18.3%) | 0 (0.0%) |
| $500 to $799 | 9 (12.7%) | 0 (0.0%) |
| $800 to $999 | 0 (0.0%) | 0 (0.0%) |
| $1,000 to $1,499 | 11 (15.5%) | 0 (0.0%) |
| $1,500 to $1,999 | 5 (7.0%) | 2 (14.3%) |
| $2,000 to $2,499 | 5 (7.0%) | 8 (57.1%) |
| $2,500 to $2,999 | 1 (1.4%) | 0 (0.0%) |
| $3,000 or more | 25 (35.2%) | 0 (0.0%) |
| Total | 71 (100.0%) | 14 (100.0%) |
Physical Housing Characteristics in Marble
Housing Structures in Marble
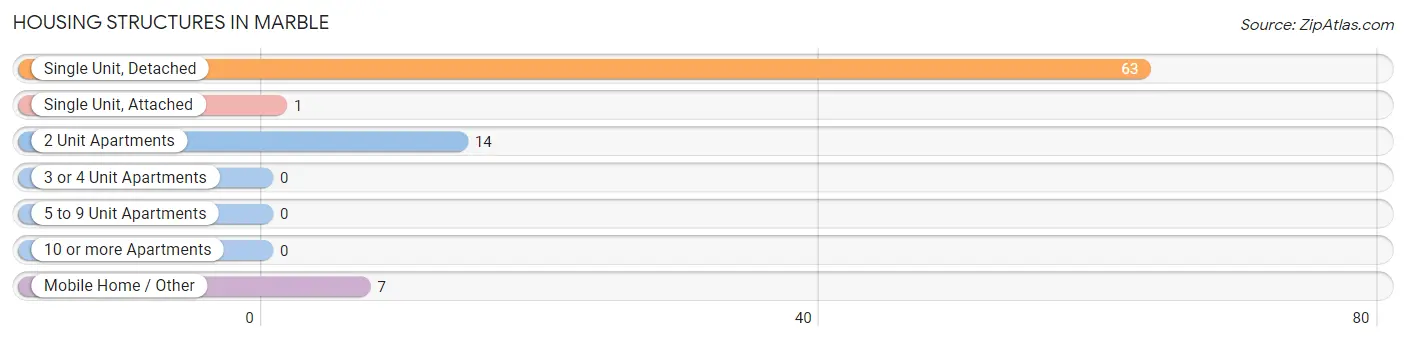
| Structure Type | # Housing Units | % Housing Units |
| Single Unit, Detached | 63 | 74.1% |
| Single Unit, Attached | 1 | 1.2% |
| 2 Unit Apartments | 14 | 16.5% |
| 3 or 4 Unit Apartments | 0 | 0.0% |
| 5 to 9 Unit Apartments | 0 | 0.0% |
| 10 or more Apartments | 0 | 0.0% |
| Mobile Home / Other | 7 | 8.2% |
| Total | 85 | 100.0% |
Housing Structures by Occupancy in Marble
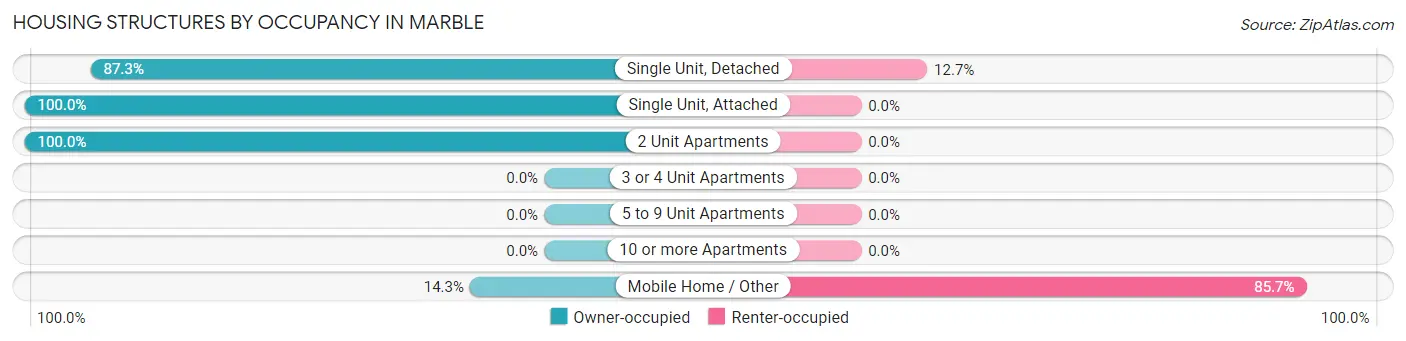
| Structure Type | Owner-occupied | Renter-occupied |
| Single Unit, Detached | 55 (87.3%) | 8 (12.7%) |
| Single Unit, Attached | 1 (100.0%) | 0 (0.0%) |
| 2 Unit Apartments | 14 (100.0%) | 0 (0.0%) |
| 3 or 4 Unit Apartments | 0 (0.0%) | 0 (0.0%) |
| 5 to 9 Unit Apartments | 0 (0.0%) | 0 (0.0%) |
| 10 or more Apartments | 0 (0.0%) | 0 (0.0%) |
| Mobile Home / Other | 1 (14.3%) | 6 (85.7%) |
| Total | 71 (83.5%) | 14 (16.5%) |
Housing Structures by Number of Rooms in Marble
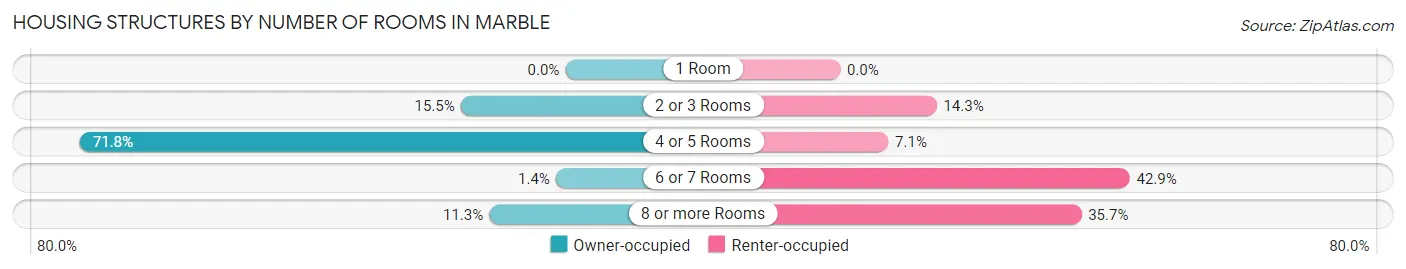
| Number of Rooms | Owner-occupied | Renter-occupied |
| 1 Room | 0 (0.0%) | 0 (0.0%) |
| 2 or 3 Rooms | 11 (15.5%) | 2 (14.3%) |
| 4 or 5 Rooms | 51 (71.8%) | 1 (7.1%) |
| 6 or 7 Rooms | 1 (1.4%) | 6 (42.9%) |
| 8 or more Rooms | 8 (11.3%) | 5 (35.7%) |
| Total | 71 (100.0%) | 14 (100.0%) |
Housing Structure by Heating Type in Marble
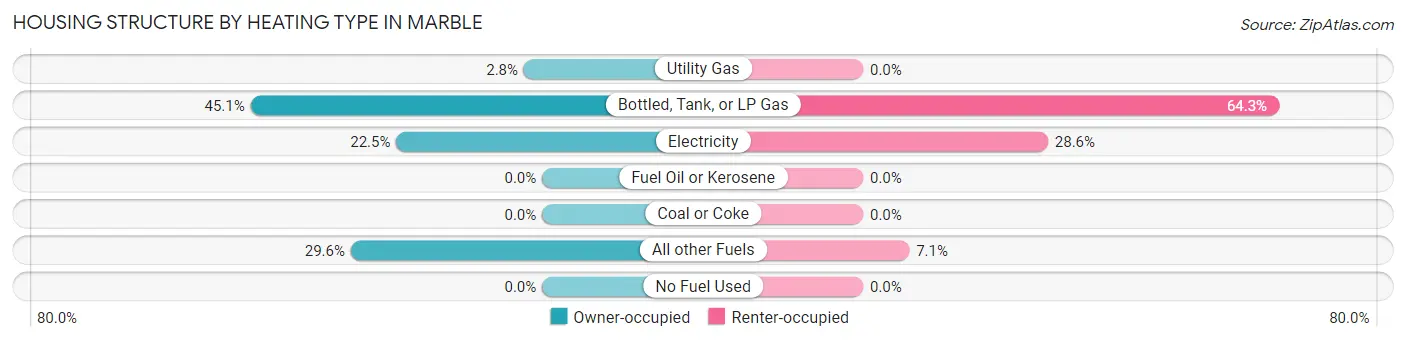
| Heating Type | Owner-occupied | Renter-occupied |
| Utility Gas | 2 (2.8%) | 0 (0.0%) |
| Bottled, Tank, or LP Gas | 32 (45.1%) | 9 (64.3%) |
| Electricity | 16 (22.5%) | 4 (28.6%) |
| Fuel Oil or Kerosene | 0 (0.0%) | 0 (0.0%) |
| Coal or Coke | 0 (0.0%) | 0 (0.0%) |
| All other Fuels | 21 (29.6%) | 1 (7.1%) |
| No Fuel Used | 0 (0.0%) | 0 (0.0%) |
| Total | 71 (100.0%) | 14 (100.0%) |
Household Vehicle Usage in Marble
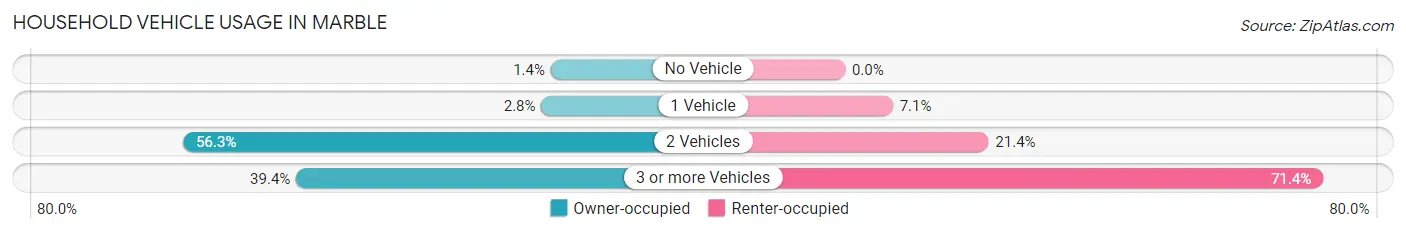
| Vehicles per Household | Owner-occupied | Renter-occupied |
| No Vehicle | 1 (1.4%) | 0 (0.0%) |
| 1 Vehicle | 2 (2.8%) | 1 (7.1%) |
| 2 Vehicles | 40 (56.3%) | 3 (21.4%) |
| 3 or more Vehicles | 28 (39.4%) | 10 (71.4%) |
| Total | 71 (100.0%) | 14 (100.0%) |
Real Estate & Mortgages in Marble
Real Estate and Mortgage Overview in Marble
| Characteristic | Without Mortgage | With Mortgage |
| Housing Units | 24 | 47 |
| Median Property Value | $275,000 | $837,100 |
| Median Household Income | $128,333 | $29 |
| Monthly Housing Costs | $450 | $25 |
| Real Estate Taxes | $725 | $1 |
Property Value by Mortgage Status in Marble
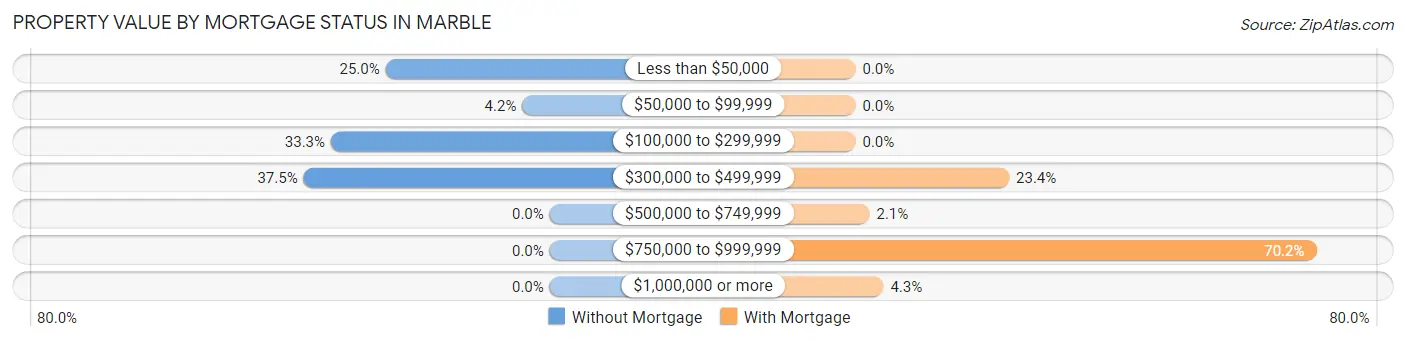
| Property Value | Without Mortgage | With Mortgage |
| Less than $50,000 | 6 (25.0%) | 0 (0.0%) |
| $50,000 to $99,999 | 1 (4.2%) | 0 (0.0%) |
| $100,000 to $299,999 | 8 (33.3%) | 0 (0.0%) |
| $300,000 to $499,999 | 9 (37.5%) | 11 (23.4%) |
| $500,000 to $749,999 | 0 (0.0%) | 1 (2.1%) |
| $750,000 to $999,999 | 0 (0.0%) | 33 (70.2%) |
| $1,000,000 or more | 0 (0.0%) | 2 (4.3%) |
| Total | 24 (100.0%) | 47 (100.0%) |
Household Income by Mortgage Status in Marble
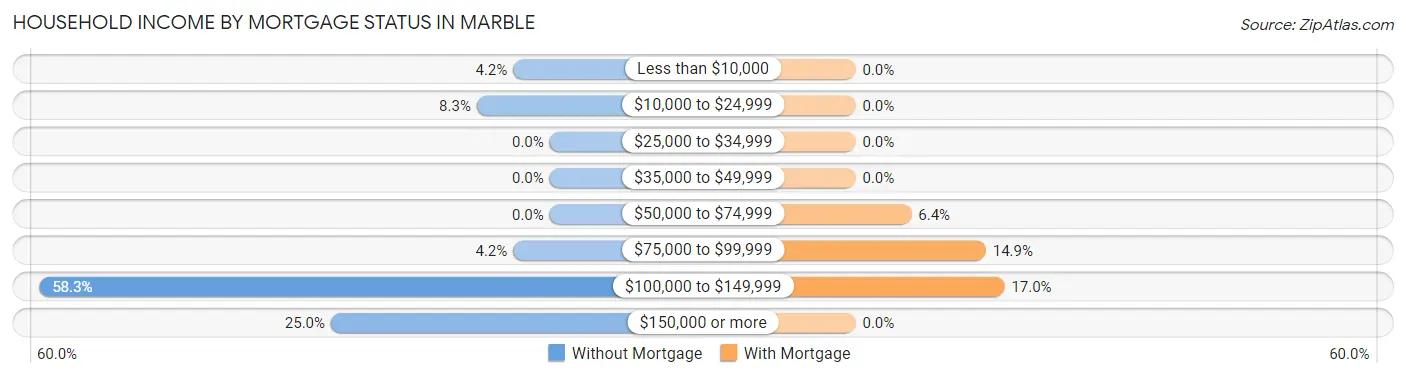
| Household Income | Without Mortgage | With Mortgage |
| Less than $10,000 | 1 (4.2%) | 0 (0.0%) |
| $10,000 to $24,999 | 2 (8.3%) | 0 (0.0%) |
| $25,000 to $34,999 | 0 (0.0%) | 0 (0.0%) |
| $35,000 to $49,999 | 0 (0.0%) | 0 (0.0%) |
| $50,000 to $74,999 | 0 (0.0%) | 3 (6.4%) |
| $75,000 to $99,999 | 1 (4.2%) | 7 (14.9%) |
| $100,000 to $149,999 | 14 (58.3%) | 8 (17.0%) |
| $150,000 or more | 6 (25.0%) | 0 (0.0%) |
| Total | 24 (100.0%) | 47 (100.0%) |
Property Value to Household Income Ratio in Marble
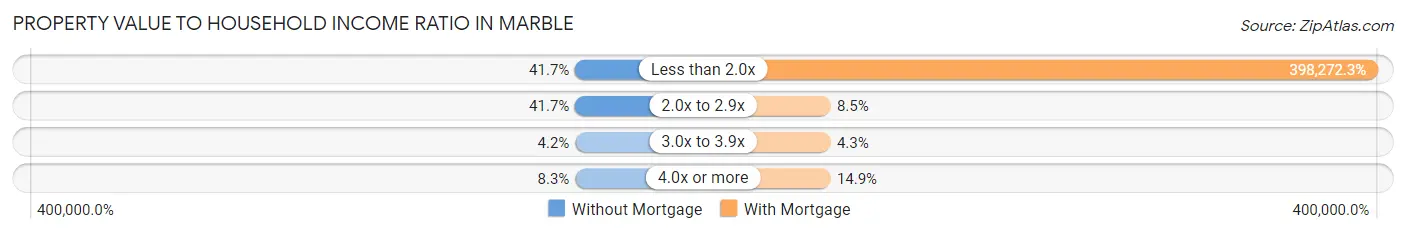
| Value-to-Income Ratio | Without Mortgage | With Mortgage |
| Less than 2.0x | 10 (41.7%) | 187,188 (398,272.3%) |
| 2.0x to 2.9x | 10 (41.7%) | 4 (8.5%) |
| 3.0x to 3.9x | 1 (4.2%) | 2 (4.3%) |
| 4.0x or more | 2 (8.3%) | 7 (14.9%) |
| Total | 24 (100.0%) | 47 (100.0%) |
Real Estate Taxes by Mortgage Status in Marble
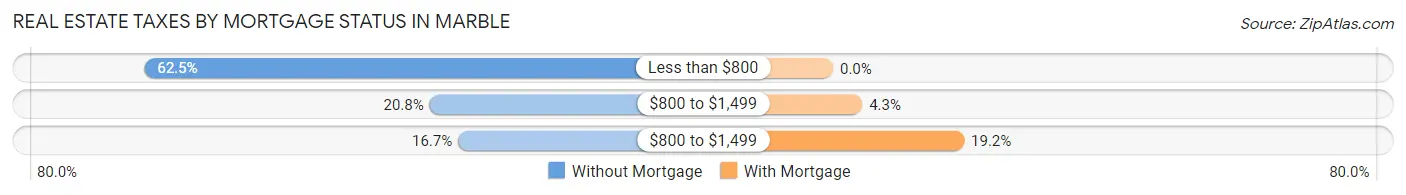
| Property Taxes | Without Mortgage | With Mortgage |
| Less than $800 | 15 (62.5%) | 0 (0.0%) |
| $800 to $1,499 | 5 (20.8%) | 2 (4.3%) |
| $800 to $1,499 | 4 (16.7%) | 9 (19.2%) |
| Total | 24 (100.0%) | 47 (100.0%) |
Health & Disability in Marble
Health Insurance Coverage by Age in Marble
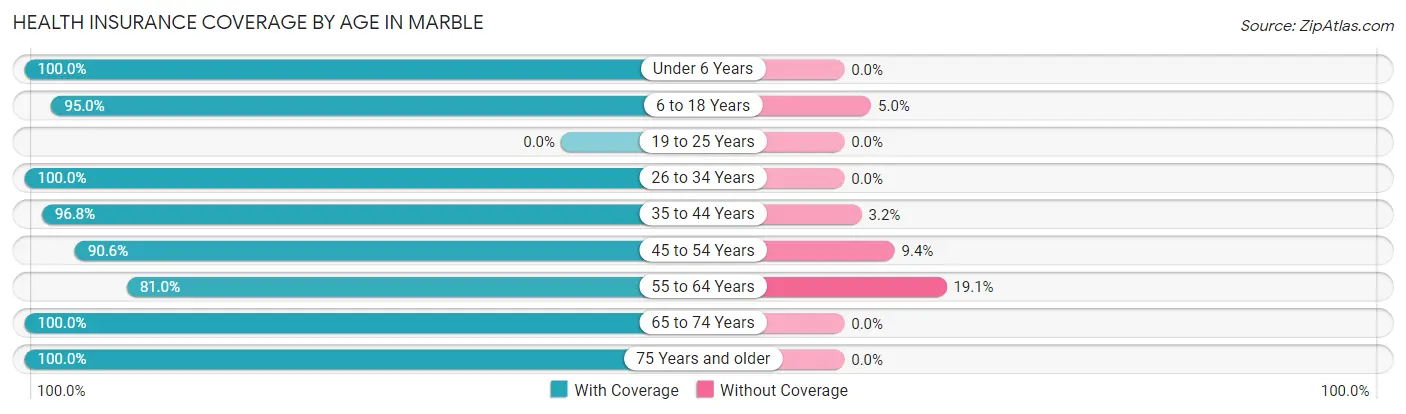
| Age Bracket | With Coverage | Without Coverage |
| Under 6 Years | 2 (100.0%) | 0 (0.0%) |
| 6 to 18 Years | 38 (95.0%) | 2 (5.0%) |
| 19 to 25 Years | 0 (0.0%) | 0 (0.0%) |
| 26 to 34 Years | 4 (100.0%) | 0 (0.0%) |
| 35 to 44 Years | 30 (96.8%) | 1 (3.2%) |
| 45 to 54 Years | 29 (90.6%) | 3 (9.4%) |
| 55 to 64 Years | 17 (80.9%) | 4 (19.1%) |
| 65 to 74 Years | 48 (100.0%) | 0 (0.0%) |
| 75 Years and older | 13 (100.0%) | 0 (0.0%) |
| Total | 181 (94.8%) | 10 (5.2%) |
Health Insurance Coverage by Citizenship Status in Marble
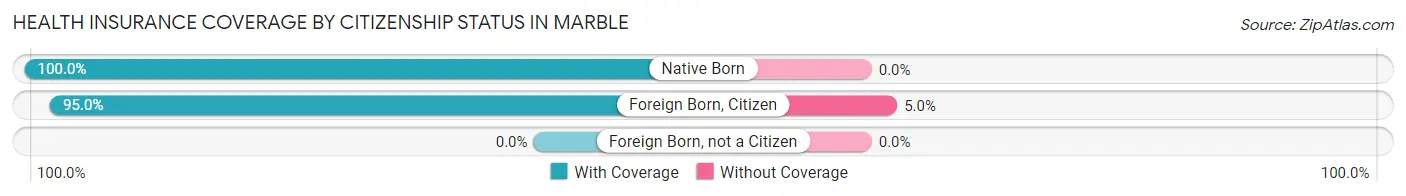
| Citizenship Status | With Coverage | Without Coverage |
| Native Born | 2 (100.0%) | 0 (0.0%) |
| Foreign Born, Citizen | 38 (95.0%) | 2 (5.0%) |
| Foreign Born, not a Citizen | 0 (0.0%) | 0 (0.0%) |
Health Insurance Coverage by Household Income in Marble
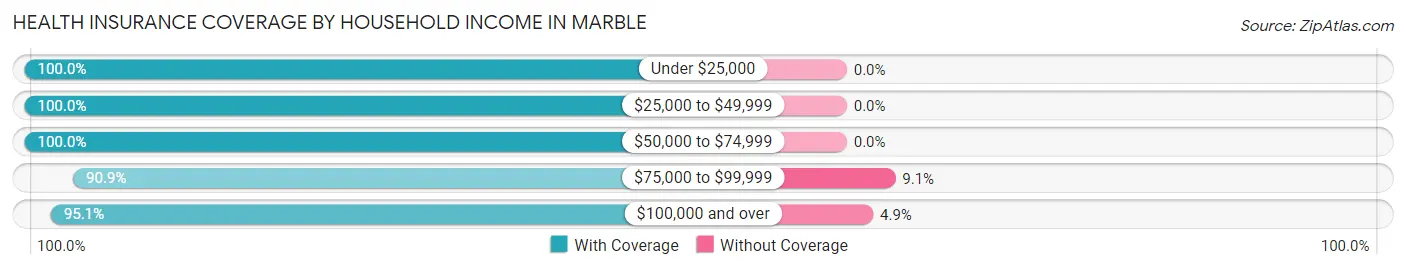
| Household Income | With Coverage | Without Coverage |
| Under $25,000 | 4 (100.0%) | 0 (0.0%) |
| $25,000 to $49,999 | 5 (100.0%) | 0 (0.0%) |
| $50,000 to $74,999 | 7 (100.0%) | 0 (0.0%) |
| $75,000 to $99,999 | 30 (90.9%) | 3 (9.1%) |
| $100,000 and over | 135 (95.1%) | 7 (4.9%) |
Public vs Private Health Insurance Coverage by Age in Marble
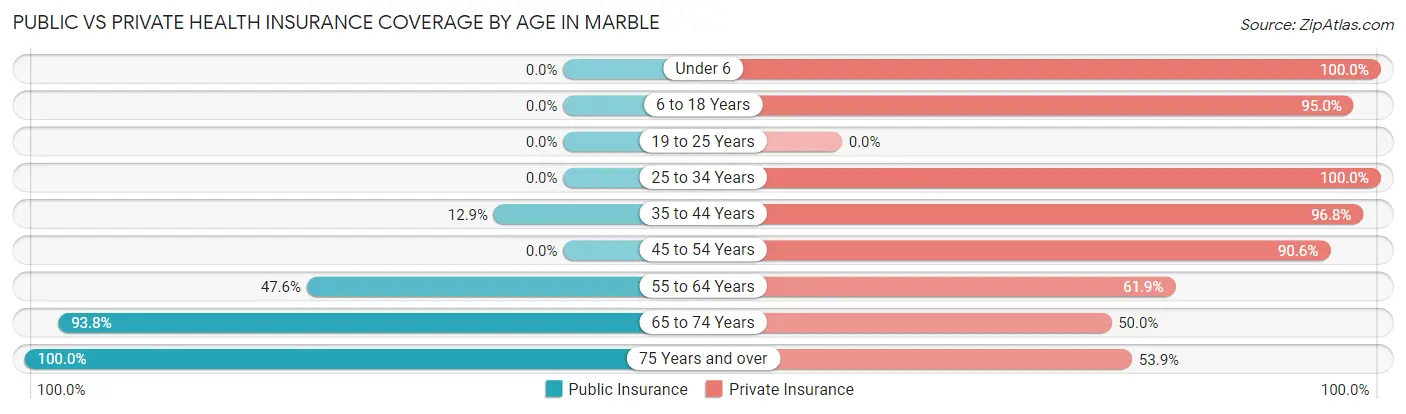
| Age Bracket | Public Insurance | Private Insurance |
| Under 6 | 0 (0.0%) | 2 (100.0%) |
| 6 to 18 Years | 0 (0.0%) | 38 (95.0%) |
| 19 to 25 Years | 0 (0.0%) | 0 (0.0%) |
| 25 to 34 Years | 0 (0.0%) | 4 (100.0%) |
| 35 to 44 Years | 4 (12.9%) | 30 (96.8%) |
| 45 to 54 Years | 0 (0.0%) | 29 (90.6%) |
| 55 to 64 Years | 10 (47.6%) | 13 (61.9%) |
| 65 to 74 Years | 45 (93.8%) | 24 (50.0%) |
| 75 Years and over | 13 (100.0%) | 7 (53.8%) |
| Total | 72 (37.7%) | 147 (77.0%) |
Disability Status by Sex by Age in Marble
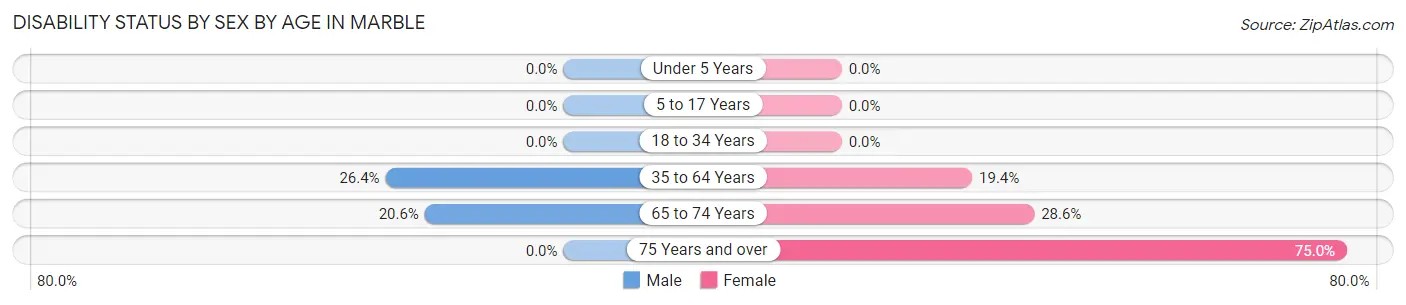
| Age Bracket | Male | Female |
| Under 5 Years | 0 (0.0%) | 0 (0.0%) |
| 5 to 17 Years | 0 (0.0%) | 0 (0.0%) |
| 18 to 34 Years | 0 (0.0%) | 0 (0.0%) |
| 35 to 64 Years | 14 (26.4%) | 6 (19.4%) |
| 65 to 74 Years | 7 (20.6%) | 4 (28.6%) |
| 75 Years and over | 0 (0.0%) | 6 (75.0%) |
Disability Class by Sex by Age in Marble
Disability Class: Hearing Difficulty
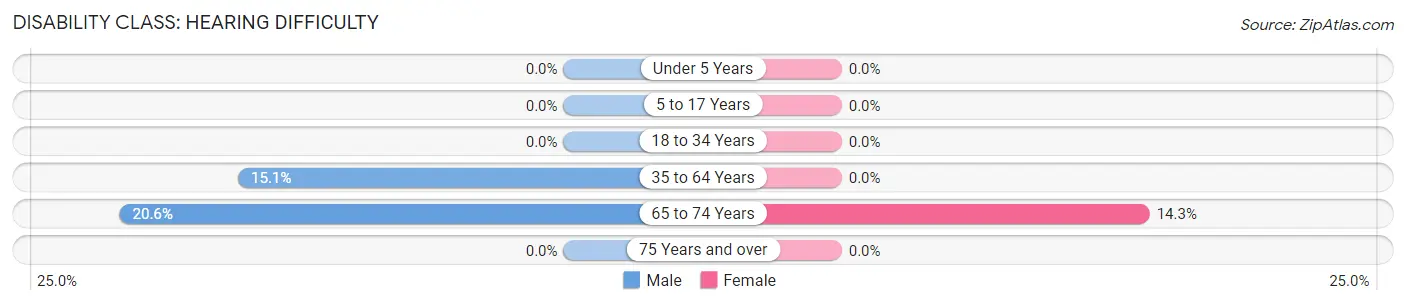
| Age Bracket | Male | Female |
| Under 5 Years | 0 (0.0%) | 0 (0.0%) |
| 5 to 17 Years | 0 (0.0%) | 0 (0.0%) |
| 18 to 34 Years | 0 (0.0%) | 0 (0.0%) |
| 35 to 64 Years | 8 (15.1%) | 0 (0.0%) |
| 65 to 74 Years | 7 (20.6%) | 2 (14.3%) |
| 75 Years and over | 0 (0.0%) | 0 (0.0%) |
Disability Class: Vision Difficulty
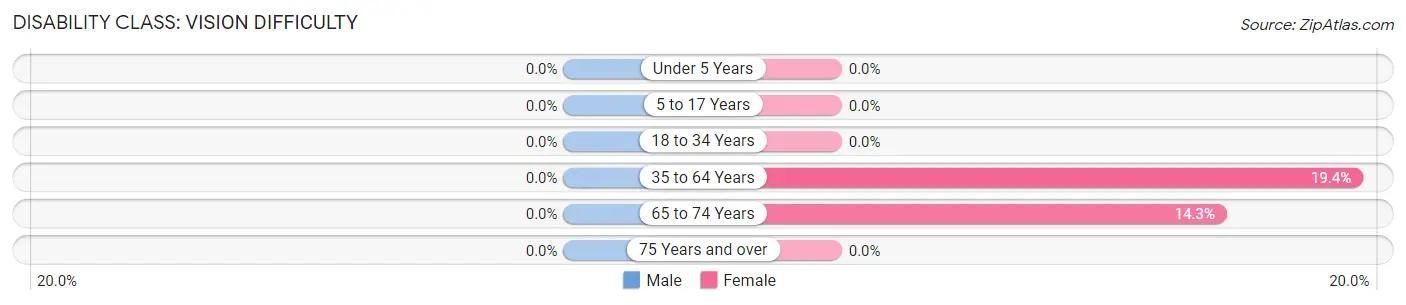
| Age Bracket | Male | Female |
| Under 5 Years | 0 (0.0%) | 0 (0.0%) |
| 5 to 17 Years | 0 (0.0%) | 0 (0.0%) |
| 18 to 34 Years | 0 (0.0%) | 0 (0.0%) |
| 35 to 64 Years | 0 (0.0%) | 6 (19.4%) |
| 65 to 74 Years | 0 (0.0%) | 2 (14.3%) |
| 75 Years and over | 0 (0.0%) | 0 (0.0%) |
Disability Class: Cognitive Difficulty
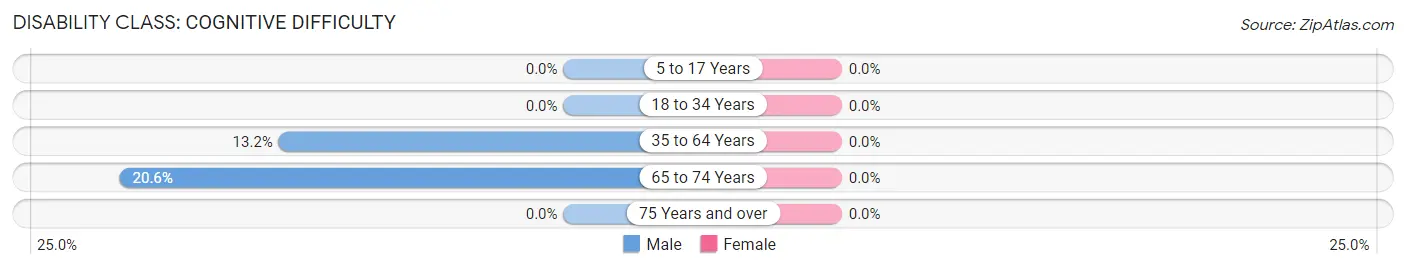
| Age Bracket | Male | Female |
| 5 to 17 Years | 0 (0.0%) | 0 (0.0%) |
| 18 to 34 Years | 0 (0.0%) | 0 (0.0%) |
| 35 to 64 Years | 7 (13.2%) | 0 (0.0%) |
| 65 to 74 Years | 7 (20.6%) | 0 (0.0%) |
| 75 Years and over | 0 (0.0%) | 0 (0.0%) |
Disability Class: Ambulatory Difficulty
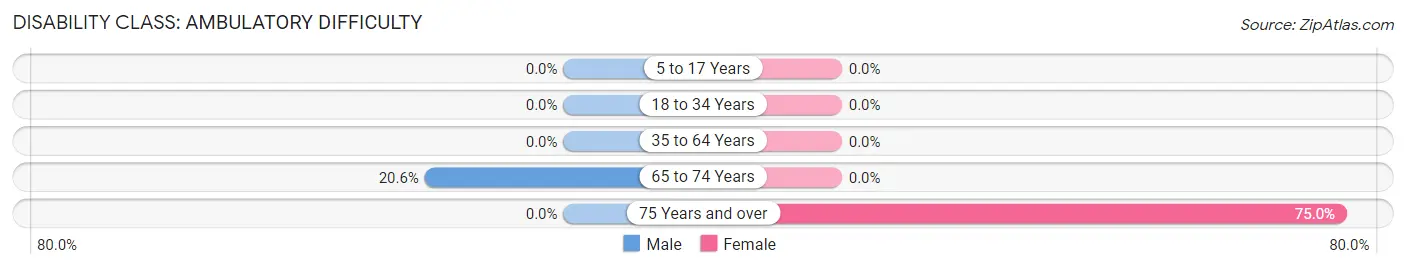
| Age Bracket | Male | Female |
| 5 to 17 Years | 0 (0.0%) | 0 (0.0%) |
| 18 to 34 Years | 0 (0.0%) | 0 (0.0%) |
| 35 to 64 Years | 0 (0.0%) | 0 (0.0%) |
| 65 to 74 Years | 7 (20.6%) | 0 (0.0%) |
| 75 Years and over | 0 (0.0%) | 6 (75.0%) |
Disability Class: Self-Care Difficulty
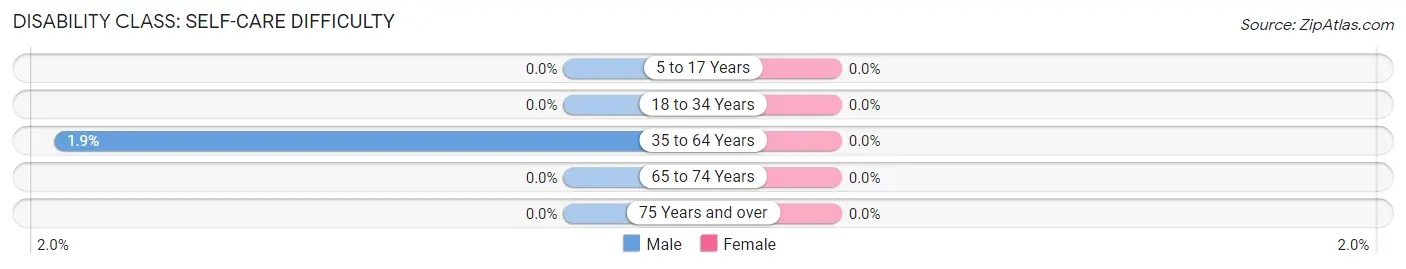
| Age Bracket | Male | Female |
| 5 to 17 Years | 0 (0.0%) | 0 (0.0%) |
| 18 to 34 Years | 0 (0.0%) | 0 (0.0%) |
| 35 to 64 Years | 1 (1.9%) | 0 (0.0%) |
| 65 to 74 Years | 0 (0.0%) | 0 (0.0%) |
| 75 Years and over | 0 (0.0%) | 0 (0.0%) |
Technology Access in Marble
Computing Device Access in Marble
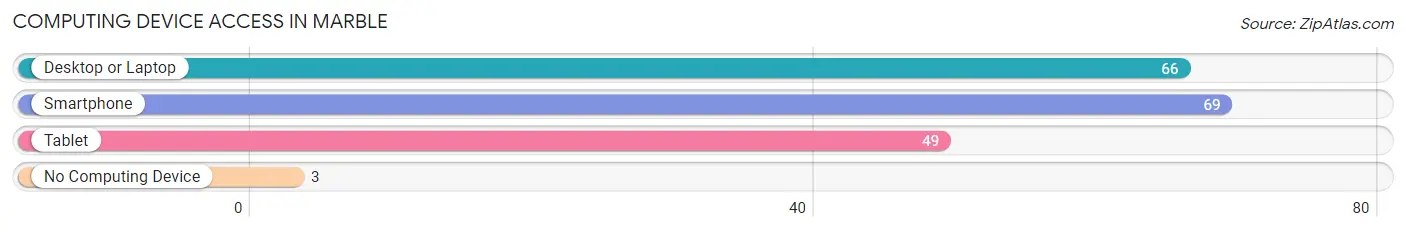
| Device Type | # Households | % Households |
| Desktop or Laptop | 66 | 77.6% |
| Smartphone | 69 | 81.2% |
| Tablet | 49 | 57.7% |
| No Computing Device | 3 | 3.5% |
| Total | 85 | 100.0% |
Internet Access in Marble
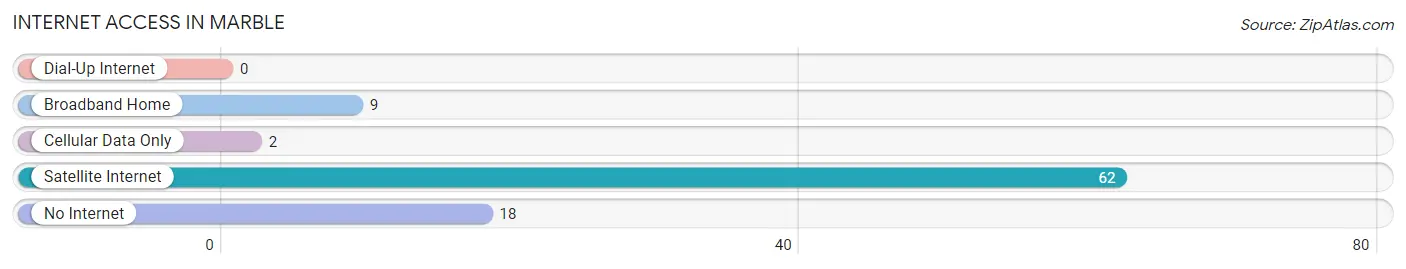
| Internet Type | # Households | % Households |
| Dial-Up Internet | 0 | 0.0% |
| Broadband Home | 9 | 10.6% |
| Cellular Data Only | 2 | 2.4% |
| Satellite Internet | 62 | 72.9% |
| No Internet | 18 | 21.2% |
| Total | 85 | 100.0% |
Marble Summary
Marble, Colorado is a small town located in Gunnison County in the western part of the state. It is situated in the Elk Mountains, at an elevation of 8,000 feet. The town was founded in 1881 by a group of prospectors who discovered a large deposit of marble in the area. The marble was used to construct many of the buildings in the town, including the courthouse, post office, and churches.
Geography
Marble is located in the Elk Mountains, which are part of the Rocky Mountains. The town is situated at an elevation of 8,000 feet, and is surrounded by mountains and forests. The town is located near the Crystal River, which is a popular destination for fishing and rafting. The town is also close to the Maroon Bells, two of the most photographed peaks in the United States.
Economy
Marble is a small town with a population of just over 200 people. The town’s economy is largely based on tourism, as it is a popular destination for outdoor activities such as fishing, hiking, and camping. The town is also home to a marble quarry, which is the source of the town’s namesake. The quarry is still in operation today, and produces a variety of marble products.
Demographics
As of the 2010 census, the population of Marble was 203 people. The racial makeup of the town was 97.5% White, 0.5% Native American, 0.5% Asian, and 1.5% from two or more races. The median household income was $37,500, and the median age was 44.
Conclusion
Marble, Colorado is a small town located in Gunnison County in the western part of the state. It is situated in the Elk Mountains, at an elevation of 8,000 feet. The town was founded in 1881 by a group of prospectors who discovered a large deposit of marble in the area. The town’s economy is largely based on tourism, as it is a popular destination for outdoor activities such as fishing, hiking, and camping. As of the 2010 census, the population of Marble was 203 people. The racial makeup of the town was 97.5% White, 0.5% Native American, 0.5% Asian, and 1.5% from two or more races. The median household income was $37,500, and the median age was 44. Marble is a small town with a unique history and culture, and is a great destination for outdoor enthusiasts.
Common Questions
What is Per Capita Income in Marble?
Per Capita income in Marble is $66,747.
What is the Median Family Income in Marble?
Median Family Income in Marble is $148,403.
What is the Median Household income in Marble?
Median Household Income in Marble is $129,792.
What is Income or Wage Gap in Marble?
Income or Wage Gap in Marble is 0.9%.
Women in Marble earn 99.1 cents for every dollar earned by a man.
What is Inequality or Gini Index in Marble?
Inequality or Gini Index in Marble is 0.35.
What is the Total Population of Marble?
Total Population of Marble is 191.
What is the Total Male Population of Marble?
Total Male Population of Marble is 131.
What is the Total Female Population of Marble?
Total Female Population of Marble is 60.
What is the Ratio of Males per 100 Females in Marble?
There are 218.33 Males per 100 Females in Marble.
What is the Ratio of Females per 100 Males in Marble?
There are 45.80 Females per 100 Males in Marble.
What is the Median Population Age in Marble?
Median Population Age in Marble is 53.4 Years.
What is the Average Family Size in Marble
Average Family Size in Marble is 2.4 People.
What is the Average Household Size in Marble
Average Household Size in Marble is 2.2 People.
How Large is the Labor Force in Marble?
There are 105 People in the Labor Forcein in Marble.
What is the Percentage of People in the Labor Force in Marble?
69.5% of People are in the Labor Force in Marble.
What is the Unemployment Rate in Marble?
Unemployment Rate in Marble is 1.0%.