Fairplay, CO Map & Demographics
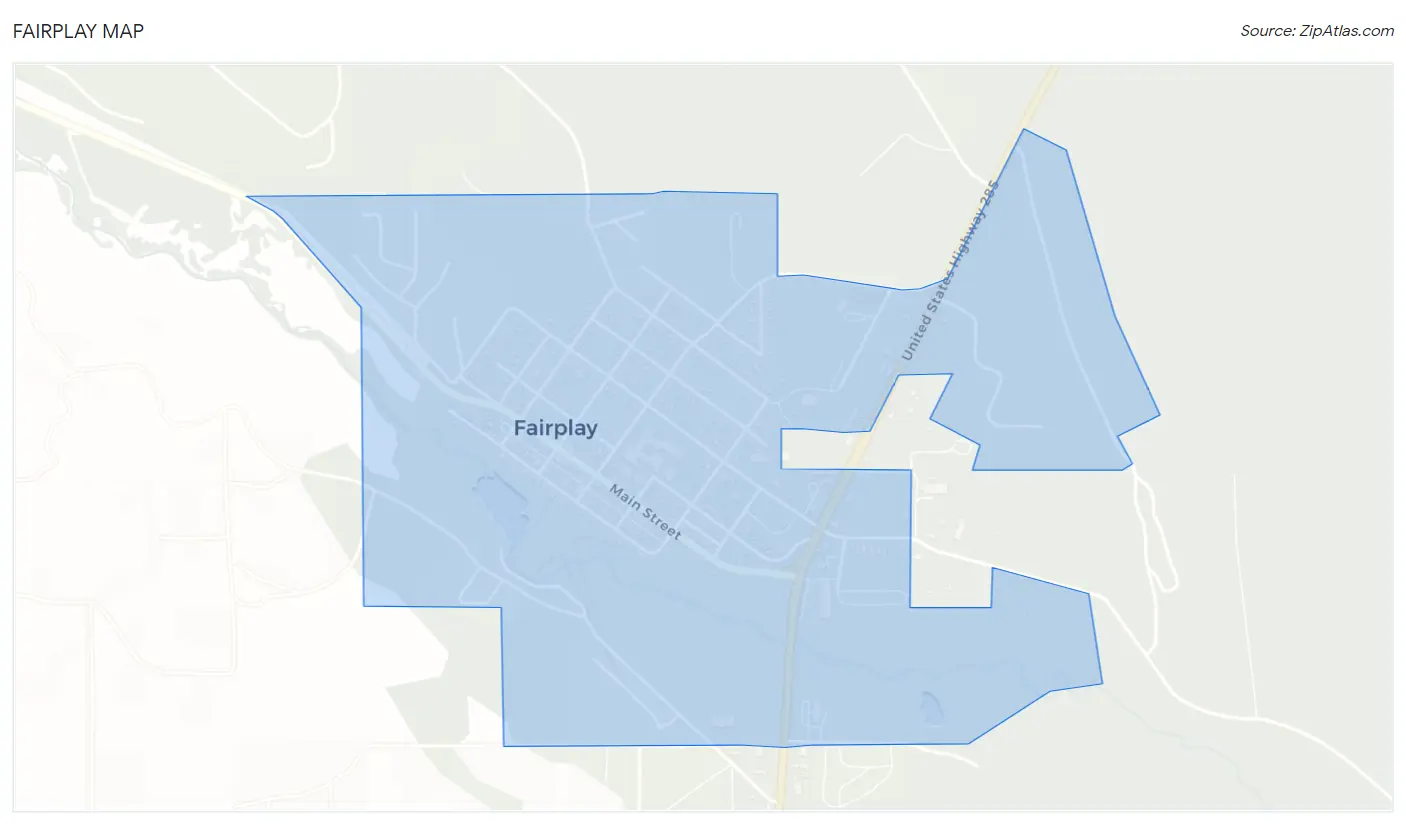
Fairplay Map
Fairplay Overview
$44,129
PER CAPITA INCOME
$96,071
AVG FAMILY INCOME
$80,179
AVG HOUSEHOLD INCOME
7.3%
WAGE / INCOME GAP [ % ]
92.7¢/ $1
WAGE / INCOME GAP [ $ ]
0.39
INEQUALITY / GINI INDEX
782
TOTAL POPULATION
435
MALE POPULATION
347
FEMALE POPULATION
125.36
MALES / 100 FEMALES
79.77
FEMALES / 100 MALES
37.4
MEDIAN AGE
2.8
AVG FAMILY SIZE
2.3
AVG HOUSEHOLD SIZE
555
LABOR FORCE [ PEOPLE ]
81.9%
PERCENT IN LABOR FORCE
1.1%
UNEMPLOYMENT RATE
Fairplay Zip Codes
Fairplay Area Codes
Income in Fairplay
Income Overview in Fairplay
Per Capita Income in Fairplay is $44,129, while median incomes of families and households are $96,071 and $80,179 respectively.
| Characteristic | Number | Measure |
| Per Capita Income | 782 | $44,129 |
| Median Family Income | 188 | $96,071 |
| Mean Family Income | 188 | $120,052 |
| Median Household Income | 342 | $80,179 |
| Mean Household Income | 342 | $102,385 |
| Income Deficit | 188 | $0 |
| Wage / Income Gap (%) | 782 | 7.32% |
| Wage / Income Gap ($) | 782 | 92.68¢ per $1 |
| Gini / Inequality Index | 782 | 0.39 |
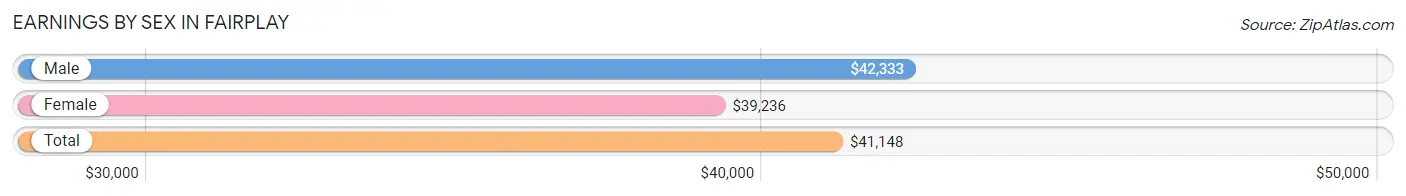
Earnings by Sex in Fairplay
Average Earnings in Fairplay are $41,148, $42,333 for men and $39,236 for women, a difference of 7.3%.
| Sex | Number | Average Earnings |
| Male | 294 (53.5%) | $42,333 |
| Female | 255 (46.5%) | $39,236 |
| Total | 549 (100.0%) | $41,148 |
Earnings by Sex by Income Bracket in Fairplay
The most common earnings brackets in Fairplay are $40,000 to $44,999 for men (56 | 19.1%) and $100,000+ for women (43 | 16.9%).
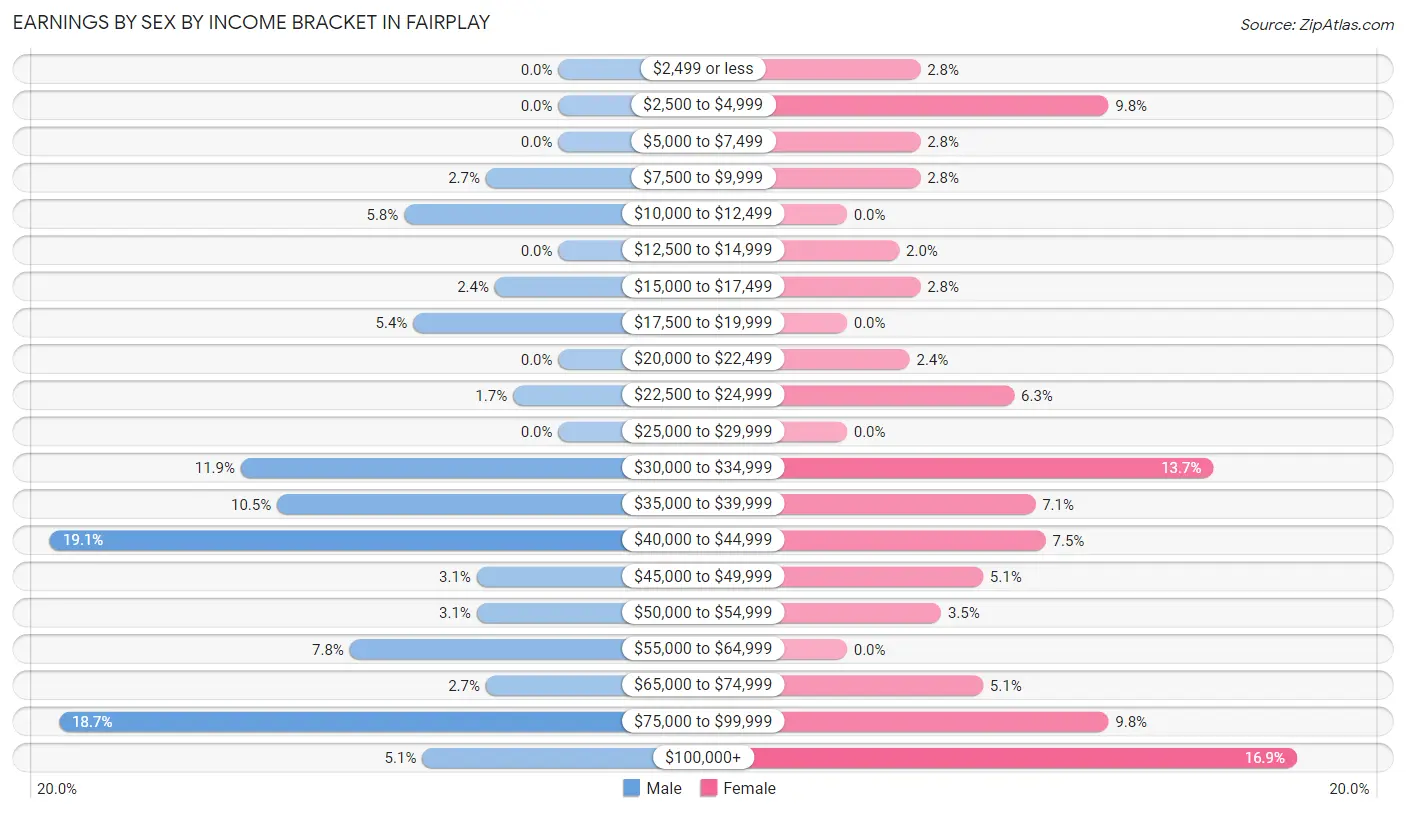
| Income | Male | Female |
| $2,499 or less | 0 (0.0%) | 7 (2.8%) |
| $2,500 to $4,999 | 0 (0.0%) | 25 (9.8%) |
| $5,000 to $7,499 | 0 (0.0%) | 7 (2.8%) |
| $7,500 to $9,999 | 8 (2.7%) | 7 (2.8%) |
| $10,000 to $12,499 | 17 (5.8%) | 0 (0.0%) |
| $12,500 to $14,999 | 0 (0.0%) | 5 (2.0%) |
| $15,000 to $17,499 | 7 (2.4%) | 7 (2.8%) |
| $17,500 to $19,999 | 16 (5.4%) | 0 (0.0%) |
| $20,000 to $22,499 | 0 (0.0%) | 6 (2.4%) |
| $22,500 to $24,999 | 5 (1.7%) | 16 (6.3%) |
| $25,000 to $29,999 | 0 (0.0%) | 0 (0.0%) |
| $30,000 to $34,999 | 35 (11.9%) | 35 (13.7%) |
| $35,000 to $39,999 | 31 (10.5%) | 18 (7.1%) |
| $40,000 to $44,999 | 56 (19.1%) | 19 (7.4%) |
| $45,000 to $49,999 | 9 (3.1%) | 13 (5.1%) |
| $50,000 to $54,999 | 9 (3.1%) | 9 (3.5%) |
| $55,000 to $64,999 | 23 (7.8%) | 0 (0.0%) |
| $65,000 to $74,999 | 8 (2.7%) | 13 (5.1%) |
| $75,000 to $99,999 | 55 (18.7%) | 25 (9.8%) |
| $100,000+ | 15 (5.1%) | 43 (16.9%) |
| Total | 294 (100.0%) | 255 (100.0%) |
Earnings by Sex by Educational Attainment in Fairplay
Average earnings in Fairplay are $43,894 for men and $48,393 for women, a difference of 9.3%. Men with an educational attainment of high school diploma enjoy the highest average annual earnings of $44,306, while those with college or associate's degree education earn the least with $41,389. Women with an educational attainment of graduate degree earn the most with the average annual earnings of $129,063, while those with bachelor's degree education have the smallest earnings of $42,321.
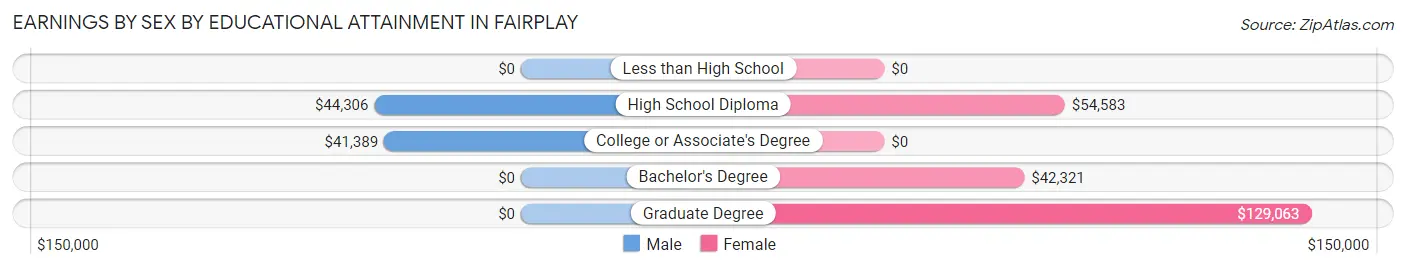
| Educational Attainment | Male Income | Female Income |
| Less than High School | - | - |
| High School Diploma | $44,306 | $54,583 |
| College or Associate's Degree | $41,389 | $0 |
| Bachelor's Degree | - | - |
| Graduate Degree | - | - |
| Total | $43,894 | $48,393 |
Family Income in Fairplay
Family Income Brackets in Fairplay
According to the Fairplay family income data, there are 41 families falling into the $50,000 to $74,999 income range, which is the most common income bracket and makes up 21.8% of all families.
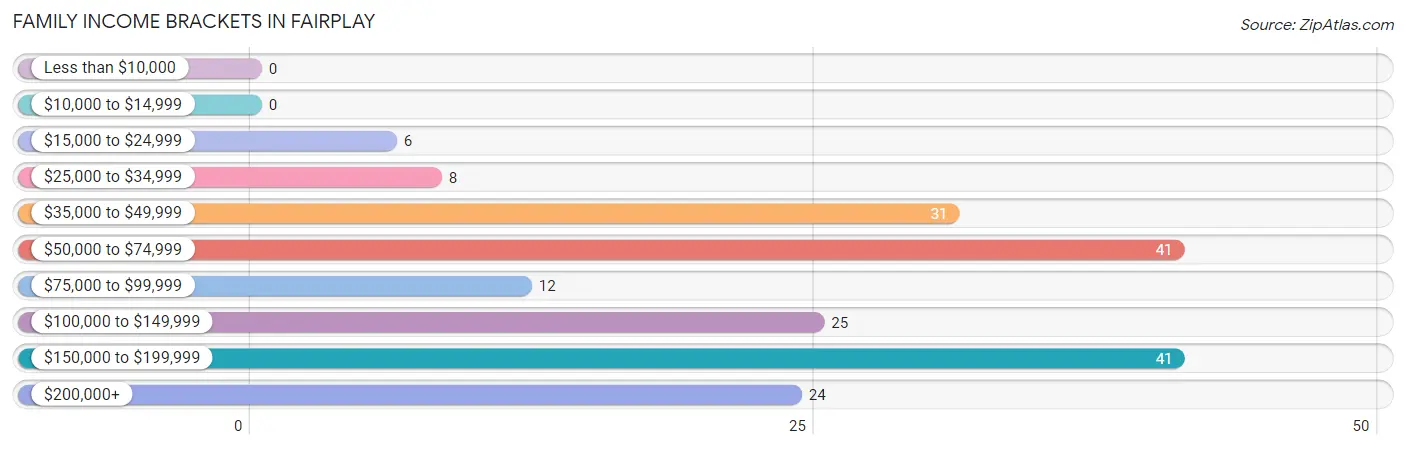
| Income Bracket | # Families | % Families |
| Less than $10,000 | 0 | 0.0% |
| $10,000 to $14,999 | 0 | 0.0% |
| $15,000 to $24,999 | 6 | 3.2% |
| $25,000 to $34,999 | 8 | 4.3% |
| $35,000 to $49,999 | 31 | 16.5% |
| $50,000 to $74,999 | 41 | 21.8% |
| $75,000 to $99,999 | 12 | 6.4% |
| $100,000 to $149,999 | 25 | 13.3% |
| $150,000 to $199,999 | 41 | 21.8% |
| $200,000+ | 24 | 12.8% |
Family Income by Famaliy Size in Fairplay
4-person families (40 | 21.3%) account for the highest median family income in Fairplay with $241,429 per family, while 4-person families (40 | 21.3%) have the highest median income of $60,357 per family member.
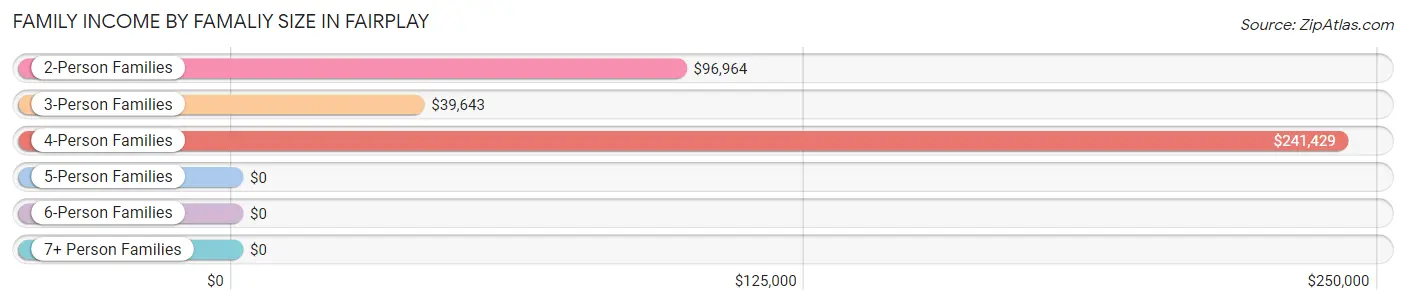
| Income Bracket | # Families | Median Income |
| 2-Person Families | 117 (62.2%) | $96,964 |
| 3-Person Families | 24 (12.8%) | $39,643 |
| 4-Person Families | 40 (21.3%) | $241,429 |
| 5-Person Families | 7 (3.7%) | $0 |
| 6-Person Families | 0 (0.0%) | $0 |
| 7+ Person Families | 0 (0.0%) | $0 |
| Total | 188 (100.0%) | $96,071 |
Family Income by Number of Earners in Fairplay
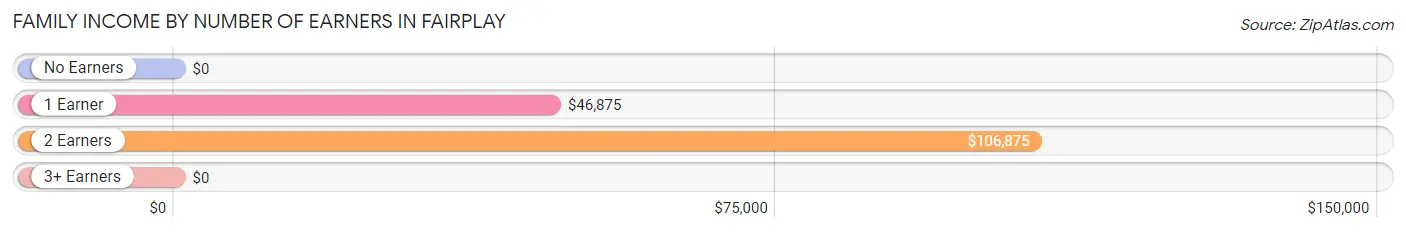
| Number of Earners | # Families | Median Income |
| No Earners | 10 (5.3%) | $0 |
| 1 Earner | 59 (31.4%) | $46,875 |
| 2 Earners | 104 (55.3%) | $106,875 |
| 3+ Earners | 15 (8.0%) | $0 |
| Total | 188 (100.0%) | $96,071 |
Household Income in Fairplay
Household Income Brackets in Fairplay
With 68 households falling in the category, the $50,000 to $74,999 income range is the most frequent in Fairplay, accounting for 19.9% of all households. In contrast, only 7 households (2.1%) fall into the less than $10,000 income bracket, making it the least populous group.
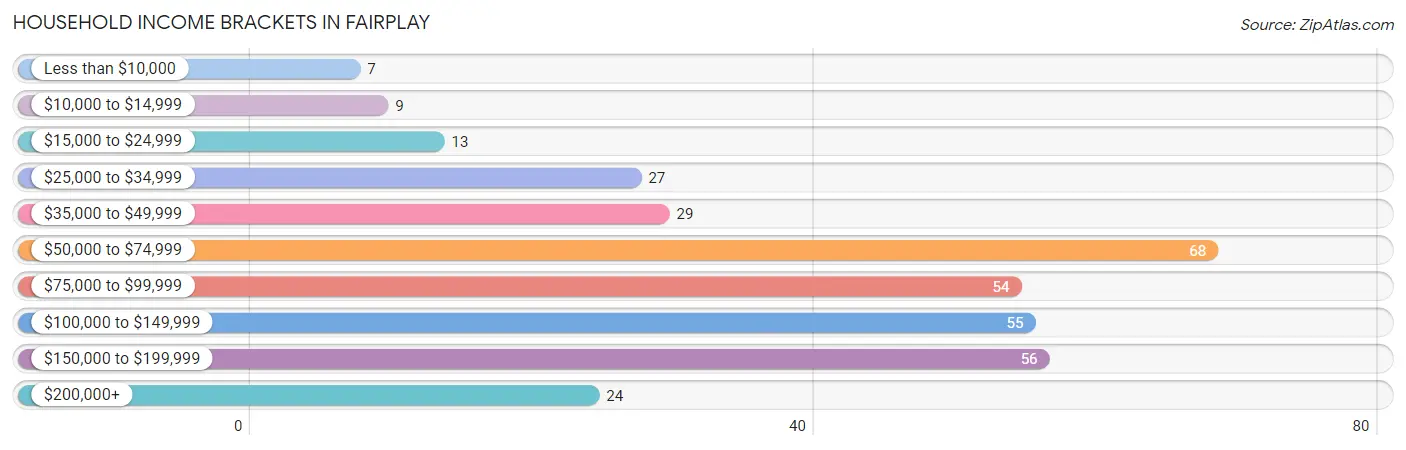
| Income Bracket | # Households | % Households |
| Less than $10,000 | 7 | 2.0% |
| $10,000 to $14,999 | 9 | 2.6% |
| $15,000 to $24,999 | 13 | 3.8% |
| $25,000 to $34,999 | 27 | 7.9% |
| $35,000 to $49,999 | 29 | 8.5% |
| $50,000 to $74,999 | 68 | 19.9% |
| $75,000 to $99,999 | 54 | 15.8% |
| $100,000 to $149,999 | 55 | 16.1% |
| $150,000 to $199,999 | 56 | 16.4% |
| $200,000+ | 24 | 7.0% |
Household Income by Householder Age in Fairplay
The median household income in Fairplay is $80,179, with the highest median household income of $116,719 found in the 45 to 64 years age bracket for the primary householder. A total of 83 households (24.3%) fall into this category. Meanwhile, the 15 to 24 years age bracket for the primary householder has the lowest median household income of $0, with 36 households (10.5%) in this group.
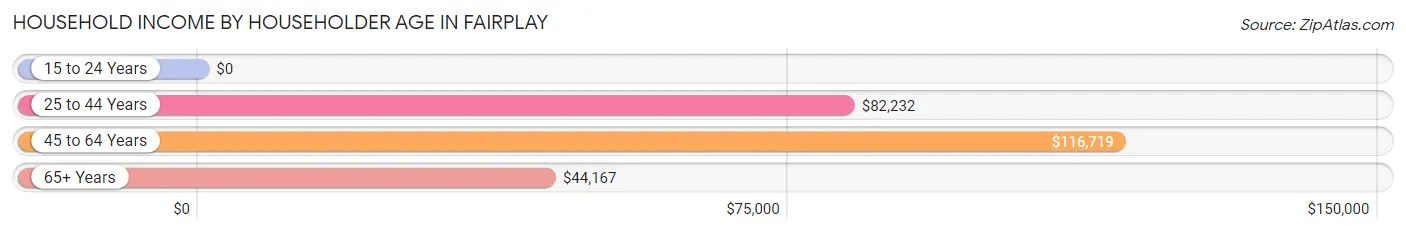
| Income Bracket | # Households | Median Income |
| 15 to 24 Years | 36 (10.5%) | $0 |
| 25 to 44 Years | 167 (48.8%) | $82,232 |
| 45 to 64 Years | 83 (24.3%) | $116,719 |
| 65+ Years | 56 (16.4%) | $44,167 |
| Total | 342 (100.0%) | $80,179 |
Poverty in Fairplay
Income Below Poverty by Sex and Age in Fairplay
With 7.1% poverty level for males and 8.1% for females among the residents of Fairplay, 75 year old and over males and 18 to 24 year old females are the most vulnerable to poverty, with 9 males (47.4%) and 15 females (20.8%) in their respective age groups living below the poverty level.
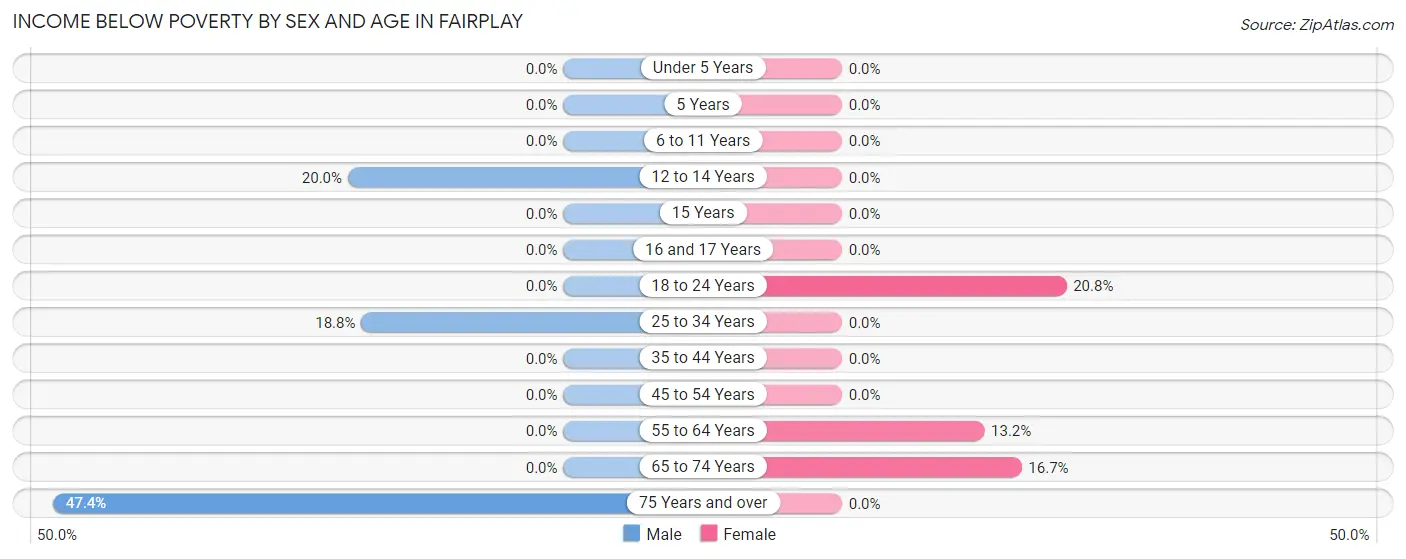
| Age Bracket | Male | Female |
| Under 5 Years | 0 (0.0%) | 0 (0.0%) |
| 5 Years | 0 (0.0%) | 0 (0.0%) |
| 6 to 11 Years | 0 (0.0%) | 0 (0.0%) |
| 12 to 14 Years | 7 (20.0%) | 0 (0.0%) |
| 15 Years | 0 (0.0%) | 0 (0.0%) |
| 16 and 17 Years | 0 (0.0%) | 0 (0.0%) |
| 18 to 24 Years | 0 (0.0%) | 15 (20.8%) |
| 25 to 34 Years | 15 (18.8%) | 0 (0.0%) |
| 35 to 44 Years | 0 (0.0%) | 0 (0.0%) |
| 45 to 54 Years | 0 (0.0%) | 0 (0.0%) |
| 55 to 64 Years | 0 (0.0%) | 7 (13.2%) |
| 65 to 74 Years | 0 (0.0%) | 6 (16.7%) |
| 75 Years and over | 9 (47.4%) | 0 (0.0%) |
| Total | 31 (7.1%) | 28 (8.1%) |
Income Above Poverty by Sex and Age in Fairplay
According to the poverty statistics in Fairplay, males aged under 5 years and females aged under 5 years are the age groups that are most secure financially, with 100.0% of males and 100.0% of females in these age groups living above the poverty line.
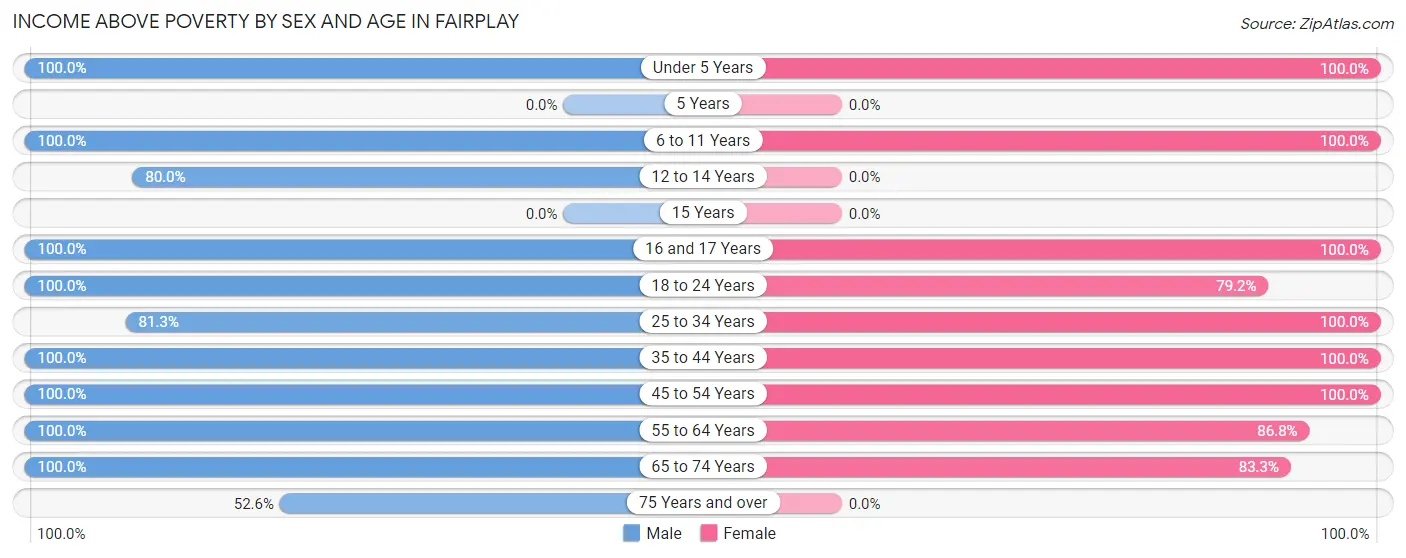
| Age Bracket | Male | Female |
| Under 5 Years | 8 (100.0%) | 5 (100.0%) |
| 5 Years | 0 (0.0%) | 0 (0.0%) |
| 6 to 11 Years | 7 (100.0%) | 49 (100.0%) |
| 12 to 14 Years | 28 (80.0%) | 0 (0.0%) |
| 15 Years | 0 (0.0%) | 0 (0.0%) |
| 16 and 17 Years | 29 (100.0%) | 10 (100.0%) |
| 18 to 24 Years | 39 (100.0%) | 57 (79.2%) |
| 25 to 34 Years | 65 (81.2%) | 44 (100.0%) |
| 35 to 44 Years | 98 (100.0%) | 54 (100.0%) |
| 45 to 54 Years | 57 (100.0%) | 24 (100.0%) |
| 55 to 64 Years | 41 (100.0%) | 46 (86.8%) |
| 65 to 74 Years | 22 (100.0%) | 30 (83.3%) |
| 75 Years and over | 10 (52.6%) | 0 (0.0%) |
| Total | 404 (92.9%) | 319 (91.9%) |
Income Below Poverty Among Married-Couple Families in Fairplay
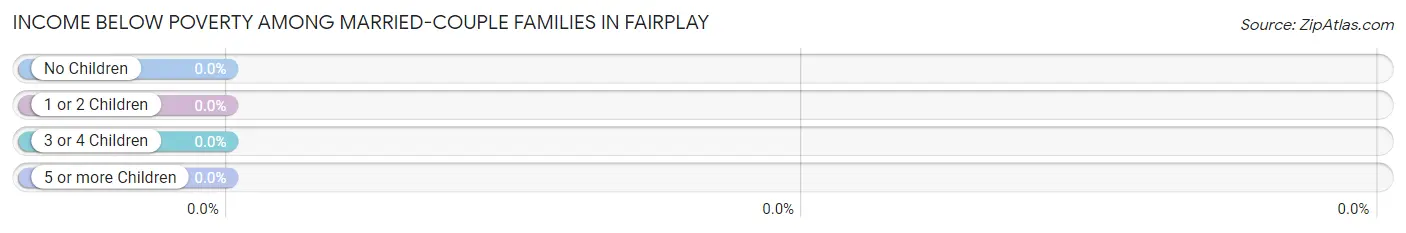
| Children | Above Poverty | Below Poverty |
| No Children | 106 (100.0%) | 0 (0.0%) |
| 1 or 2 Children | 40 (100.0%) | 0 (0.0%) |
| 3 or 4 Children | 7 (100.0%) | 0 (0.0%) |
| 5 or more Children | 0 (0.0%) | 0 (0.0%) |
| Total | 153 (100.0%) | 0 (0.0%) |
Income Below Poverty Among Single-Parent Households in Fairplay
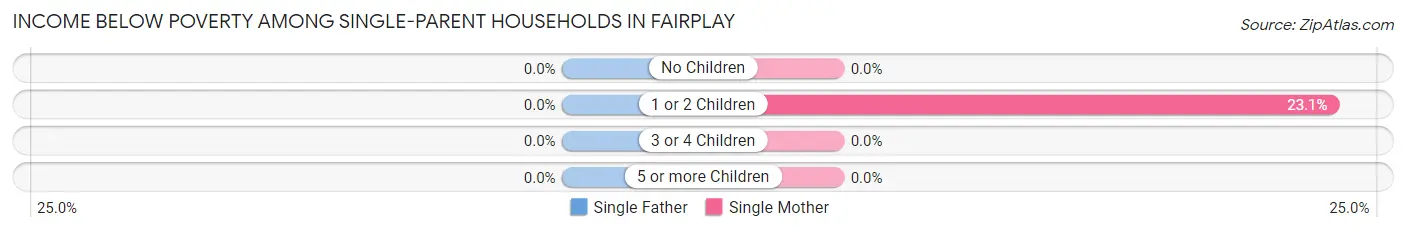
| Children | Single Father | Single Mother |
| No Children | 0 (0.0%) | 0 (0.0%) |
| 1 or 2 Children | 0 (0.0%) | 6 (23.1%) |
| 3 or 4 Children | 0 (0.0%) | 0 (0.0%) |
| 5 or more Children | 0 (0.0%) | 0 (0.0%) |
| Total | 0 (0.0%) | 6 (23.1%) |
Income Below Poverty Among Married-Couple vs Single-Parent Households in Fairplay
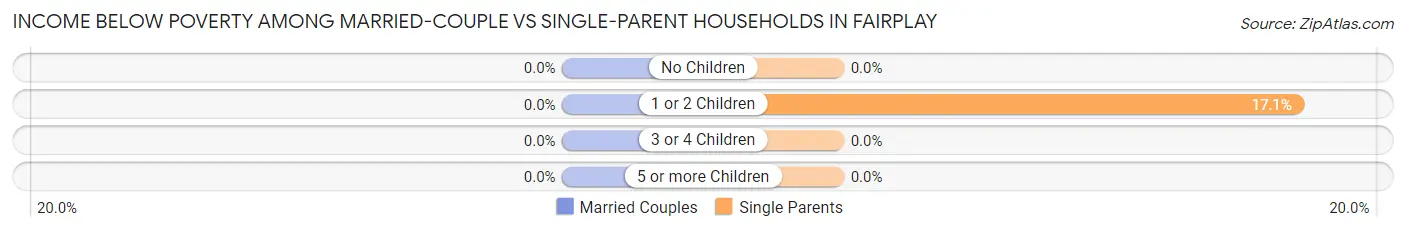
| Children | Married-Couple Families | Single-Parent Households |
| No Children | 0 (0.0%) | 0 (0.0%) |
| 1 or 2 Children | 0 (0.0%) | 6 (17.1%) |
| 3 or 4 Children | 0 (0.0%) | 0 (0.0%) |
| 5 or more Children | 0 (0.0%) | 0 (0.0%) |
| Total | 0 (0.0%) | 6 (17.1%) |
Race in Fairplay
The most populous races in Fairplay are White / Caucasian (741 | 94.8%), Hispanic or Latino (31 | 4.0%), and Two or more Races (21 | 2.7%).
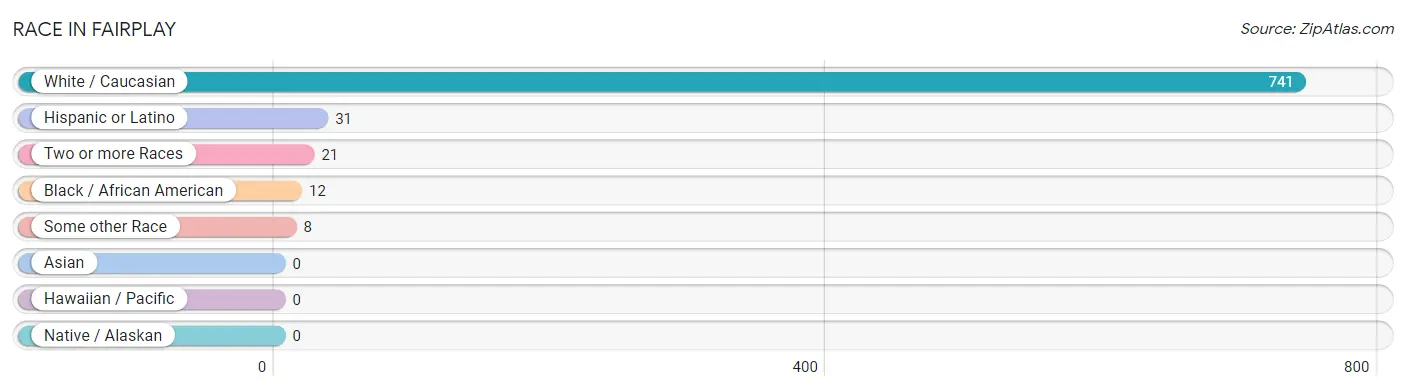
| Race | # Population | % Population |
| Asian | 0 | 0.0% |
| Black / African American | 12 | 1.5% |
| Hawaiian / Pacific | 0 | 0.0% |
| Hispanic or Latino | 31 | 4.0% |
| Native / Alaskan | 0 | 0.0% |
| White / Caucasian | 741 | 94.8% |
| Two or more Races | 21 | 2.7% |
| Some other Race | 8 | 1.0% |
| Total | 782 | 100.0% |
Ancestry in Fairplay
The most populous ancestries reported in Fairplay are German (172 | 22.0%), English (87 | 11.1%), Irish (67 | 8.6%), Norwegian (56 | 7.2%), and Polish (55 | 7.0%), together accounting for 55.9% of all Fairplay residents.
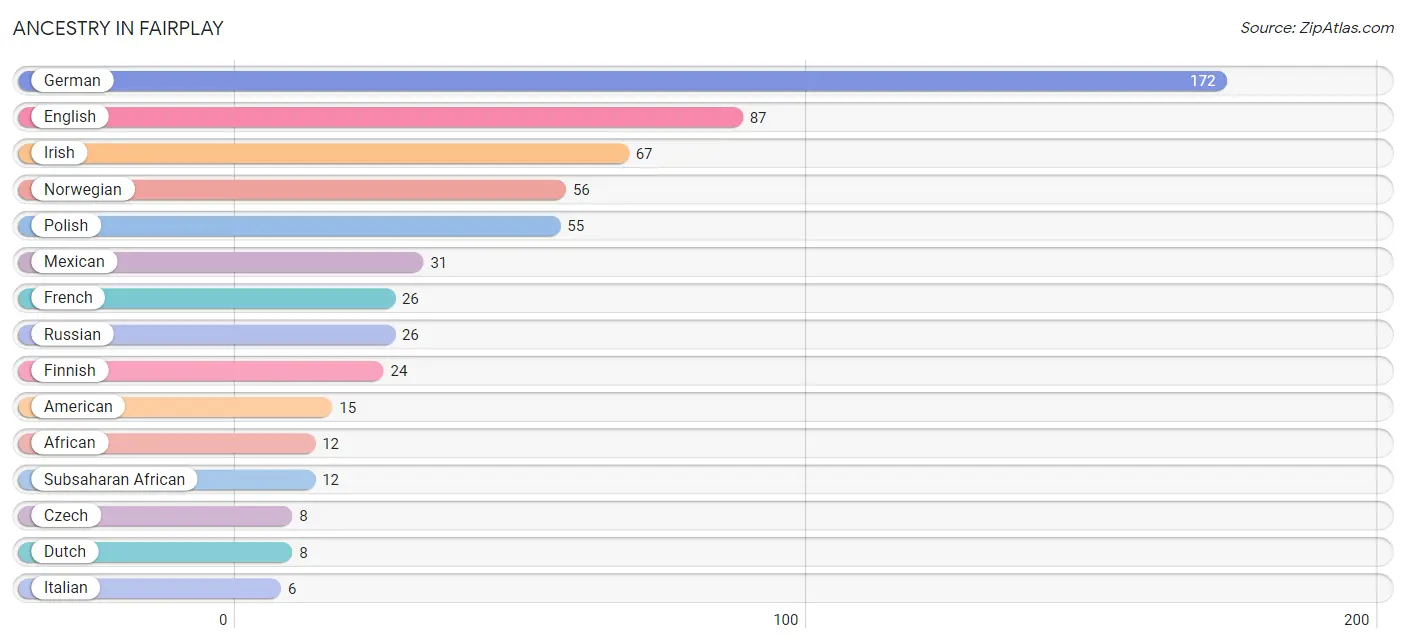
| Ancestry | # Population | % Population |
| African | 12 | 1.5% |
| American | 15 | 1.9% |
| Czech | 8 | 1.0% |
| Dutch | 8 | 1.0% |
| English | 87 | 11.1% |
| Finnish | 24 | 3.1% |
| French | 26 | 3.3% |
| German | 172 | 22.0% |
| Irish | 67 | 8.6% |
| Italian | 6 | 0.8% |
| Mexican | 31 | 4.0% |
| Norwegian | 56 | 7.2% |
| Polish | 55 | 7.0% |
| Russian | 26 | 3.3% |
| Subsaharan African | 12 | 1.5% |
| Swedish | 5 | 0.6% | View All 16 Rows |
Immigrants in Fairplay

| Immigration Origin | # Population | % Population | View All 0 Rows |
Sex and Age in Fairplay
Sex and Age in Fairplay
The most populous age groups in Fairplay are 40 to 44 Years (77 | 17.7%) for men and 15 to 19 Years (47 | 13.5%) for women.
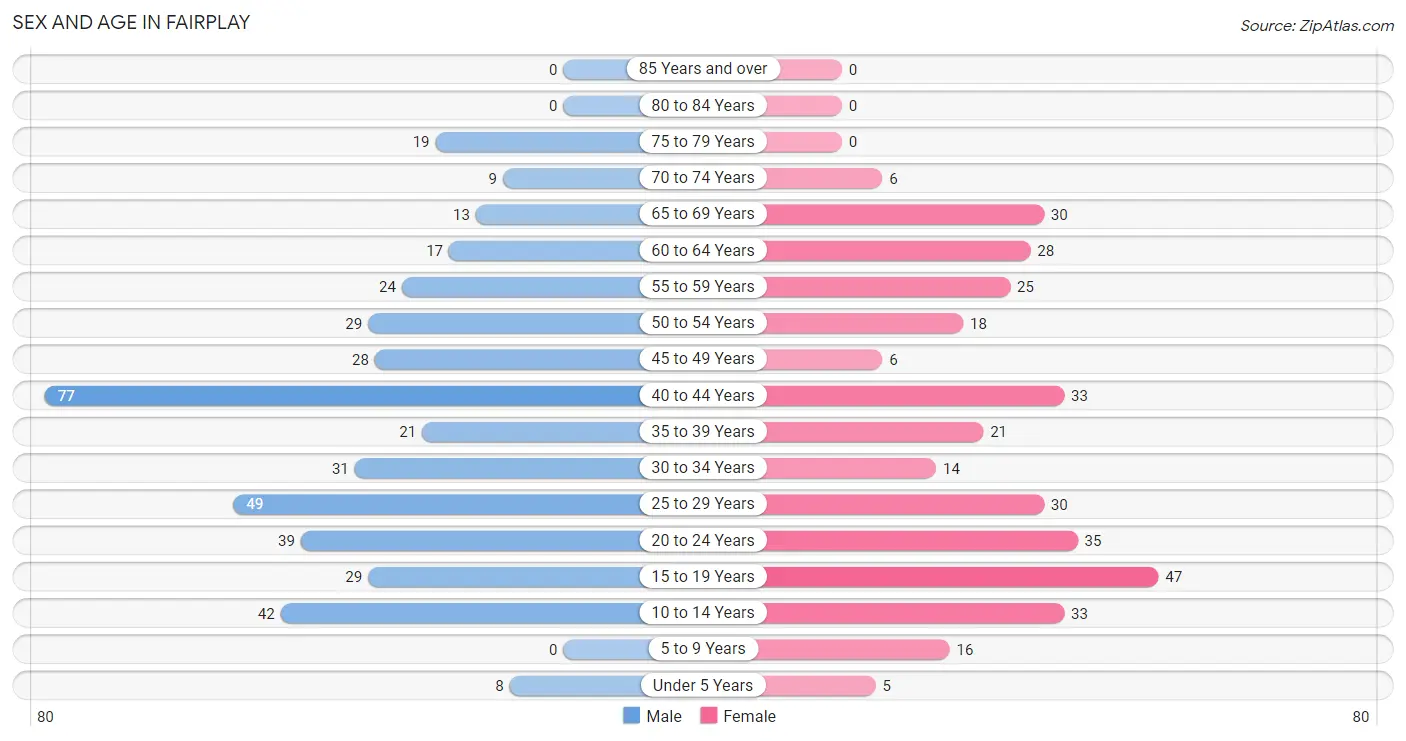
| Age Bracket | Male | Female |
| Under 5 Years | 8 (1.8%) | 5 (1.4%) |
| 5 to 9 Years | 0 (0.0%) | 16 (4.6%) |
| 10 to 14 Years | 42 (9.7%) | 33 (9.5%) |
| 15 to 19 Years | 29 (6.7%) | 47 (13.5%) |
| 20 to 24 Years | 39 (9.0%) | 35 (10.1%) |
| 25 to 29 Years | 49 (11.3%) | 30 (8.6%) |
| 30 to 34 Years | 31 (7.1%) | 14 (4.0%) |
| 35 to 39 Years | 21 (4.8%) | 21 (6.0%) |
| 40 to 44 Years | 77 (17.7%) | 33 (9.5%) |
| 45 to 49 Years | 28 (6.4%) | 6 (1.7%) |
| 50 to 54 Years | 29 (6.7%) | 18 (5.2%) |
| 55 to 59 Years | 24 (5.5%) | 25 (7.2%) |
| 60 to 64 Years | 17 (3.9%) | 28 (8.1%) |
| 65 to 69 Years | 13 (3.0%) | 30 (8.6%) |
| 70 to 74 Years | 9 (2.1%) | 6 (1.7%) |
| 75 to 79 Years | 19 (4.4%) | 0 (0.0%) |
| 80 to 84 Years | 0 (0.0%) | 0 (0.0%) |
| 85 Years and over | 0 (0.0%) | 0 (0.0%) |
| Total | 435 (100.0%) | 347 (100.0%) |
Families and Households in Fairplay
Median Family Size in Fairplay
The median family size in Fairplay is 2.81 persons per family, with single female/mother families (26 | 13.8%) accounting for the largest median family size of 3.31 persons per family. On the other hand, single male/father families (9 | 4.8%) represent the smallest median family size with 2.11 persons per family.
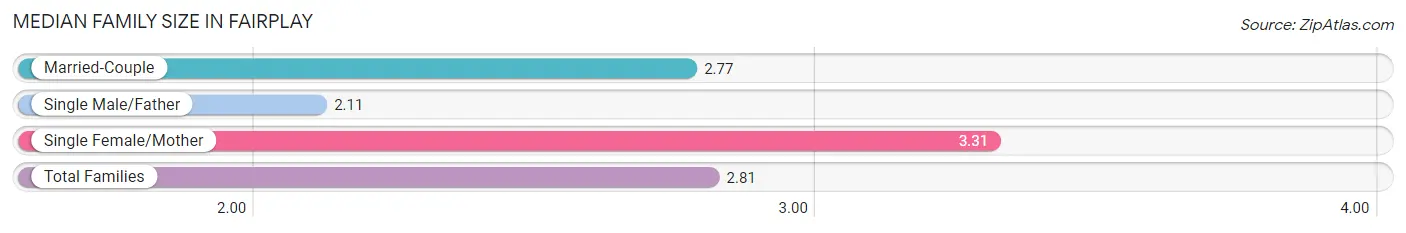
| Family Type | # Families | Family Size |
| Married-Couple | 153 (81.4%) | 2.77 |
| Single Male/Father | 9 (4.8%) | 2.11 |
| Single Female/Mother | 26 (13.8%) | 3.31 |
| Total Families | 188 (100.0%) | 2.81 |
Median Household Size in Fairplay
The median household size in Fairplay is 2.29 persons per household, with single female/mother households (26 | 7.6%) accounting for the largest median household size of 3.88 persons per household. non-family households (154 | 45.0%) represent the smallest median household size with 1.55 persons per household.
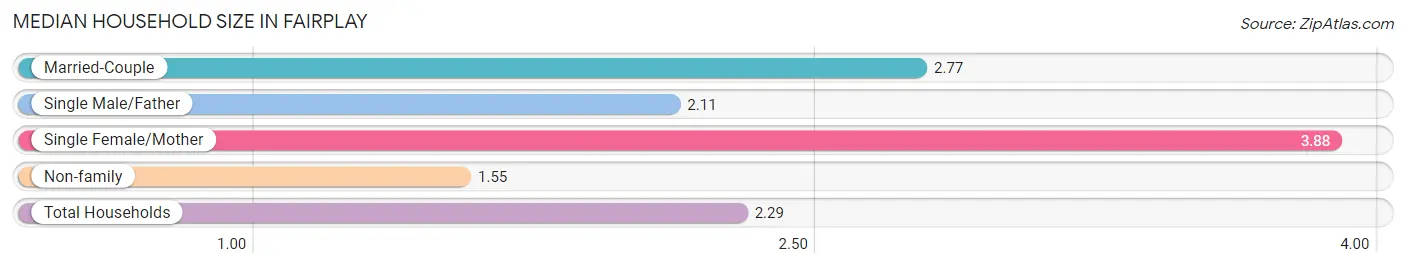
| Household Type | # Households | Household Size |
| Married-Couple | 153 (44.7%) | 2.77 |
| Single Male/Father | 9 (2.6%) | 2.11 |
| Single Female/Mother | 26 (7.6%) | 3.88 |
| Non-family | 154 (45.0%) | 1.55 |
| Total Households | 342 (100.0%) | 2.29 |
Household Size by Marriage Status in Fairplay
Out of a total of 342 households in Fairplay, 188 (55.0%) are family households, while 154 (45.0%) are nonfamily households. The most numerous type of family households are 2-person households, comprising 111, and the most common type of nonfamily households are 1-person households, comprising 94.
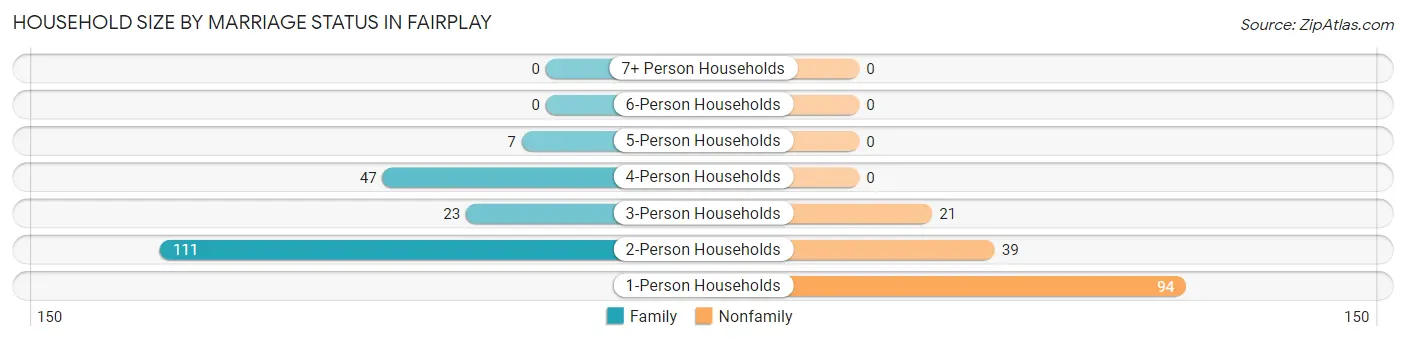
| Household Size | Family Households | Nonfamily Households |
| 1-Person Households | - | 94 (27.5%) |
| 2-Person Households | 111 (32.5%) | 39 (11.4%) |
| 3-Person Households | 23 (6.7%) | 21 (6.1%) |
| 4-Person Households | 47 (13.7%) | 0 (0.0%) |
| 5-Person Households | 7 (2.1%) | 0 (0.0%) |
| 6-Person Households | 0 (0.0%) | 0 (0.0%) |
| 7+ Person Households | 0 (0.0%) | 0 (0.0%) |
| Total | 188 (55.0%) | 154 (45.0%) |
Female Fertility in Fairplay
Fertility by Age in Fairplay
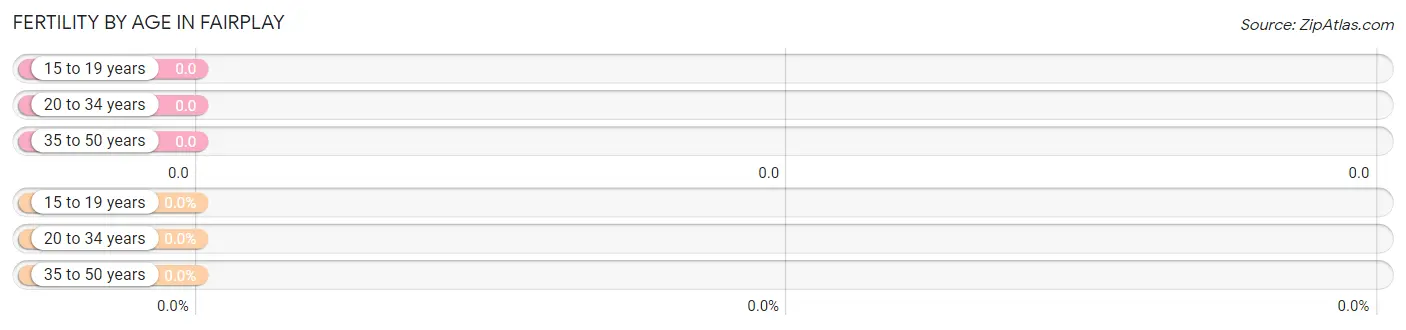
| Age Bracket | Women with Births | Births / 1,000 Women |
| 15 to 19 years | 0 (0.0%) | 0.0 |
| 20 to 34 years | 0 (0.0%) | 0.0 |
| 35 to 50 years | 0 (0.0%) | 0.0 |
| Total | 0 (0.0%) | 0.0 |
Fertility by Age by Marriage Status in Fairplay
| Age Bracket | Married | Unmarried |
| 15 to 19 years | 0 (0.0%) | 0 (0.0%) |
| 20 to 34 years | 0 (0.0%) | 0 (0.0%) |
| 35 to 50 years | 0 (0.0%) | 0 (0.0%) |
| Total | 0 (0.0%) | 0 (0.0%) |
Fertility by Education in Fairplay
| Educational Attainment | Women with Births | Births / 1,000 Women |
| Less than High School | 0 (0.0%) | 0.0 |
| High School Diploma | 0 (0.0%) | 0.0 |
| College or Associate's Degree | 0 (0.0%) | 0.0 |
| Bachelor's Degree | 0 (0.0%) | 0.0 |
| Graduate Degree | 0 (0.0%) | 0.0 |
| Total | 0 (0.0%) | 0.0 |
Fertility by Education by Marriage Status in Fairplay
| Educational Attainment | Married | Unmarried |
| Less than High School | 0 (0.0%) | 0 (0.0%) |
| High School Diploma | 0 (0.0%) | 0 (0.0%) |
| College or Associate's Degree | 0 (0.0%) | 0 (0.0%) |
| Bachelor's Degree | 0 (0.0%) | 0 (0.0%) |
| Graduate Degree | 0 (0.0%) | 0 (0.0%) |
| Total | 0 (0.0%) | 0 (0.0%) |
Employment Characteristics in Fairplay
Employment by Class of Employer in Fairplay
Among the 549 employed individuals in Fairplay, private company employees (294 | 53.5%), self-employed (incorporated) (78 | 14.2%), and local government employees (60 | 10.9%) make up the most common classes of employment.
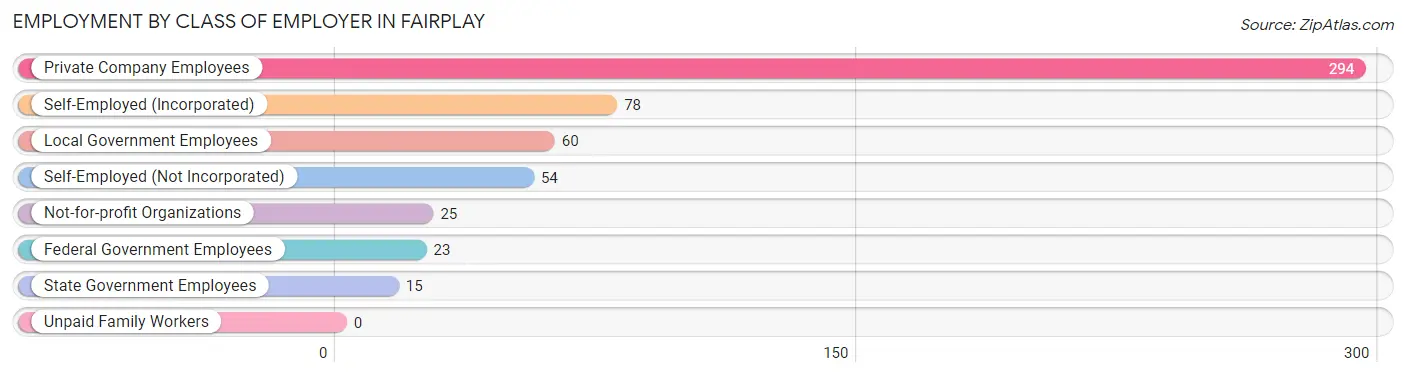
| Employer Class | # Employees | % Employees |
| Private Company Employees | 294 | 53.5% |
| Self-Employed (Incorporated) | 78 | 14.2% |
| Self-Employed (Not Incorporated) | 54 | 9.8% |
| Not-for-profit Organizations | 25 | 4.5% |
| Local Government Employees | 60 | 10.9% |
| State Government Employees | 15 | 2.7% |
| Federal Government Employees | 23 | 4.2% |
| Unpaid Family Workers | 0 | 0.0% |
| Total | 549 | 100.0% |
Employment Status by Age in Fairplay
According to the labor force statistics for Fairplay, out of the total population over 16 years of age (678), 81.9% or 555 individuals are in the labor force, with 1.1% or 6 of them unemployed. The age group with the highest labor force participation rate is 30 to 34 years, with 100.0% or 45 individuals in the labor force. Within the labor force, the 65 to 74 years age range has the highest percentage of unemployed individuals, with 23.1% or 6 of them being unemployed.
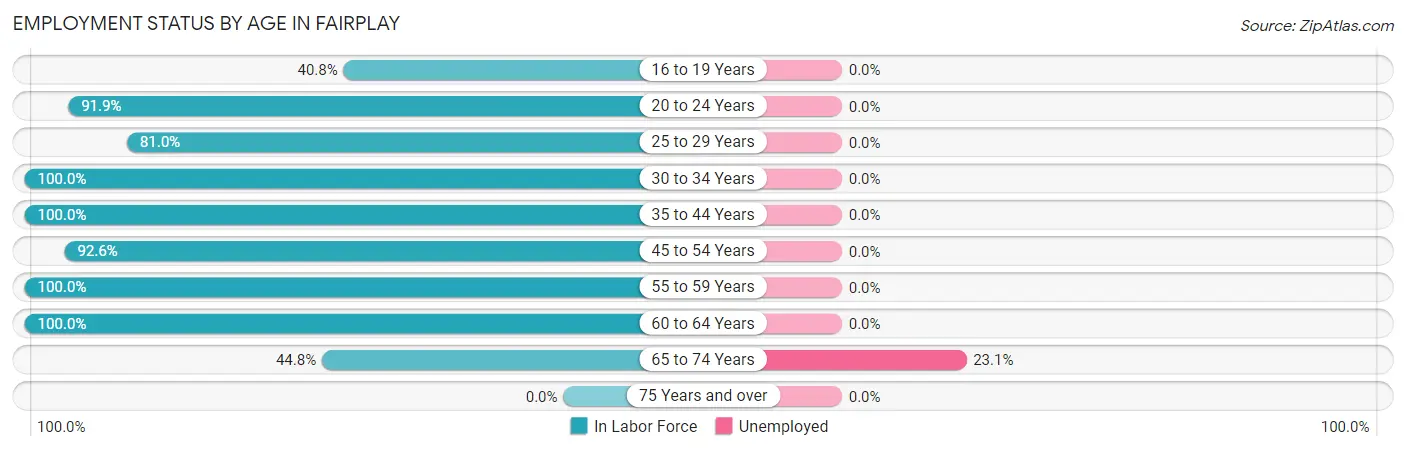
| Age Bracket | In Labor Force | Unemployed |
| 16 to 19 Years | 31 (40.8%) | 0 (0.0%) |
| 20 to 24 Years | 68 (91.9%) | 0 (0.0%) |
| 25 to 29 Years | 64 (81.0%) | 0 (0.0%) |
| 30 to 34 Years | 45 (100.0%) | 0 (0.0%) |
| 35 to 44 Years | 152 (100.0%) | 0 (0.0%) |
| 45 to 54 Years | 75 (92.6%) | 0 (0.0%) |
| 55 to 59 Years | 49 (100.0%) | 0 (0.0%) |
| 60 to 64 Years | 45 (100.0%) | 0 (0.0%) |
| 65 to 74 Years | 26 (44.8%) | 6 (23.1%) |
| 75 Years and over | 0 (0.0%) | 0 (0.0%) |
| Total | 555 (81.9%) | 6 (1.1%) |
Employment Status by Educational Attainment in Fairplay
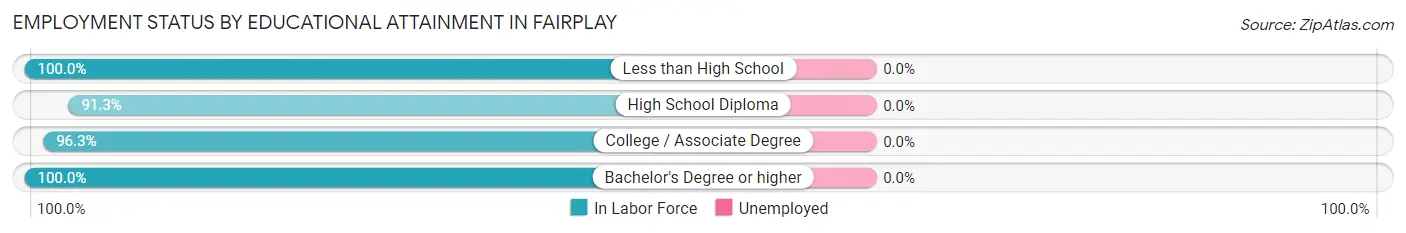
| Educational Attainment | In Labor Force | Unemployed |
| Less than High School | 5 (100.0%) | 0 (0.0%) |
| High School Diploma | 158 (91.3%) | 0 (0.0%) |
| College / Associate Degree | 154 (96.3%) | 0 (0.0%) |
| Bachelor's Degree or higher | 113 (100.0%) | 0 (0.0%) |
| Total | 430 (95.3%) | 0 (0.0%) |
Employment Occupations by Sex in Fairplay
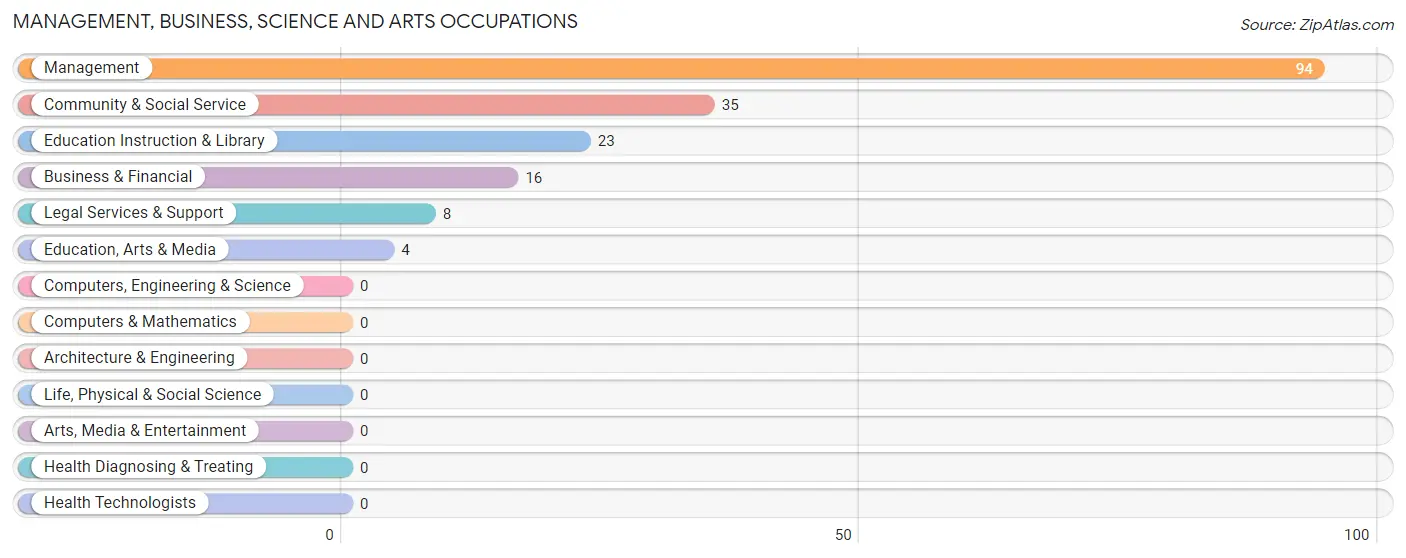
Management, Business, Science and Arts Occupations
The most common Management, Business, Science and Arts occupations in Fairplay are Management (94 | 17.1%), Community & Social Service (35 | 6.4%), Education Instruction & Library (23 | 4.2%), Business & Financial (16 | 2.9%), and Legal Services & Support (8 | 1.5%).
Management, Business, Science and Arts Occupations by Sex
Within the Management, Business, Science and Arts occupations in Fairplay, the most male-oriented occupations are Management (59.6%), Education Instruction & Library (34.8%), and Community & Social Service (22.9%), while the most female-oriented occupations are Business & Financial (100.0%), Education, Arts & Media (100.0%), and Legal Services & Support (100.0%).
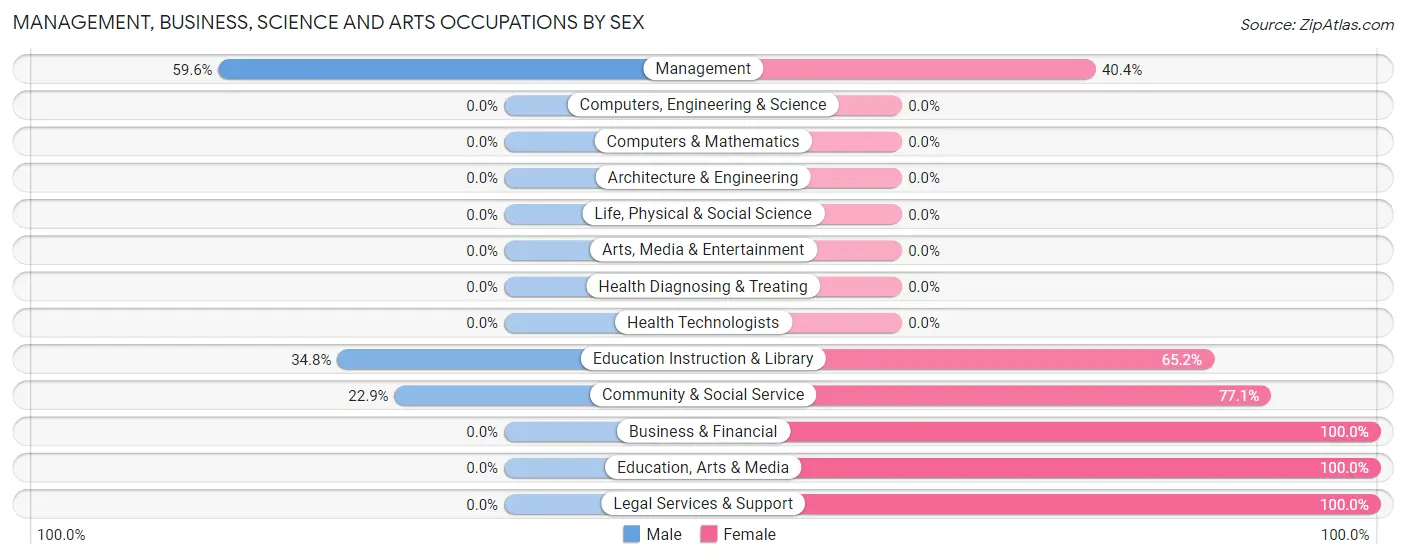
| Occupation | Male | Female |
| Management | 56 (59.6%) | 38 (40.4%) |
| Business & Financial | 0 (0.0%) | 16 (100.0%) |
| Computers, Engineering & Science | 0 (0.0%) | 0 (0.0%) |
| Computers & Mathematics | 0 (0.0%) | 0 (0.0%) |
| Architecture & Engineering | 0 (0.0%) | 0 (0.0%) |
| Life, Physical & Social Science | 0 (0.0%) | 0 (0.0%) |
| Community & Social Service | 8 (22.9%) | 27 (77.1%) |
| Education, Arts & Media | 0 (0.0%) | 4 (100.0%) |
| Legal Services & Support | 0 (0.0%) | 8 (100.0%) |
| Education Instruction & Library | 8 (34.8%) | 15 (65.2%) |
| Arts, Media & Entertainment | 0 (0.0%) | 0 (0.0%) |
| Health Diagnosing & Treating | 0 (0.0%) | 0 (0.0%) |
| Health Technologists | 0 (0.0%) | 0 (0.0%) |
| Total (Category) | 64 (44.1%) | 81 (55.9%) |
| Total (Overall) | 294 (53.5%) | 255 (46.5%) |
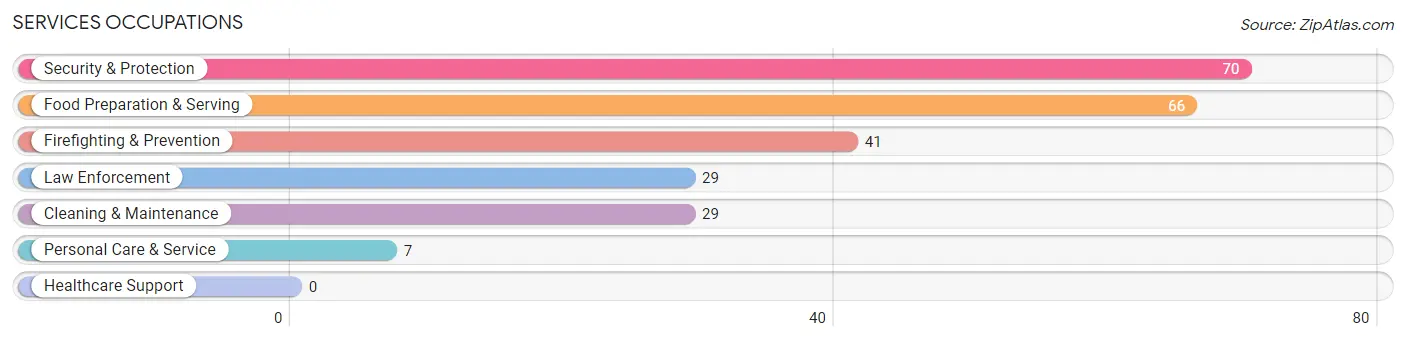
Services Occupations
The most common Services occupations in Fairplay are Security & Protection (70 | 12.8%), Food Preparation & Serving (66 | 12.0%), Firefighting & Prevention (41 | 7.5%), Law Enforcement (29 | 5.3%), and Cleaning & Maintenance (29 | 5.3%).
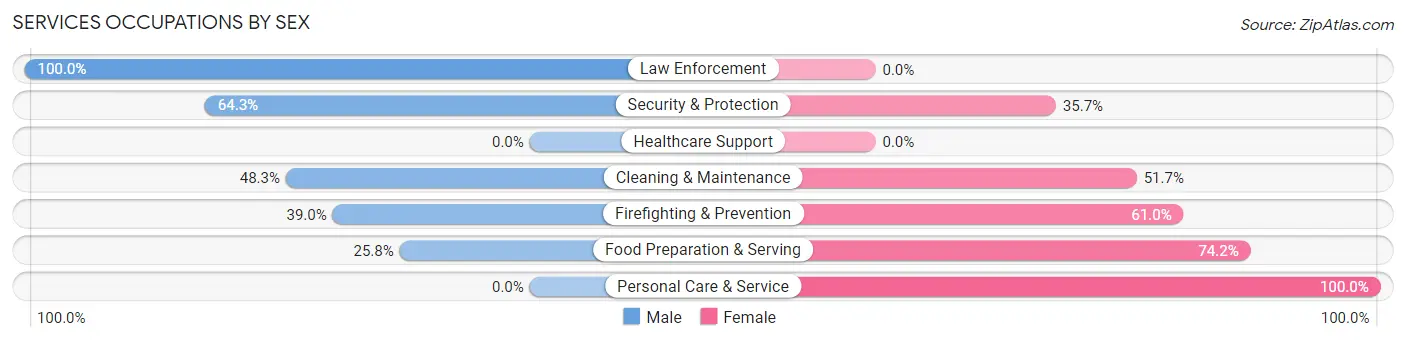
Services Occupations by Sex
Within the Services occupations in Fairplay, the most male-oriented occupations are Law Enforcement (100.0%), Security & Protection (64.3%), and Cleaning & Maintenance (48.3%), while the most female-oriented occupations are Personal Care & Service (100.0%), Food Preparation & Serving (74.2%), and Firefighting & Prevention (61.0%).
| Occupation | Male | Female |
| Healthcare Support | 0 (0.0%) | 0 (0.0%) |
| Security & Protection | 45 (64.3%) | 25 (35.7%) |
| Firefighting & Prevention | 16 (39.0%) | 25 (61.0%) |
| Law Enforcement | 29 (100.0%) | 0 (0.0%) |
| Food Preparation & Serving | 17 (25.8%) | 49 (74.2%) |
| Cleaning & Maintenance | 14 (48.3%) | 15 (51.7%) |
| Personal Care & Service | 0 (0.0%) | 7 (100.0%) |
| Total (Category) | 76 (44.2%) | 96 (55.8%) |
| Total (Overall) | 294 (53.5%) | 255 (46.5%) |
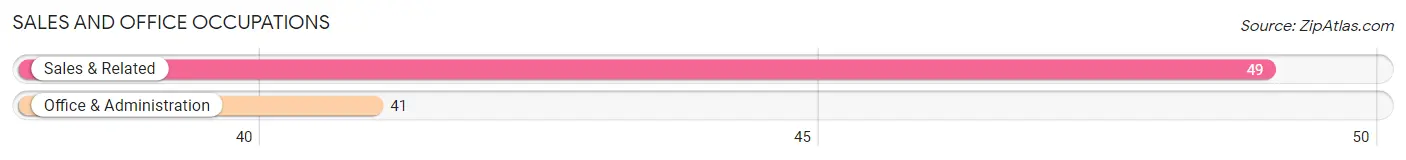
Sales and Office Occupations
The most common Sales and Office occupations in Fairplay are Sales & Related (49 | 8.9%), and Office & Administration (41 | 7.5%).
Sales and Office Occupations by Sex
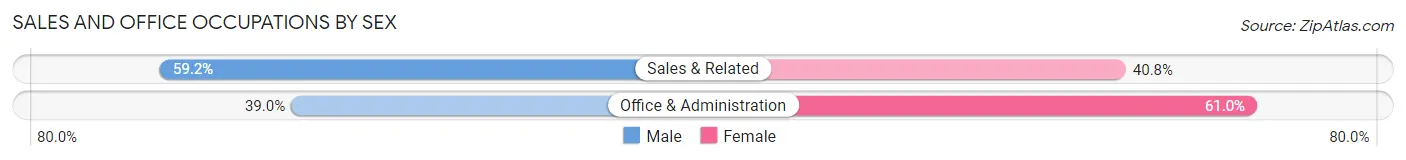
| Occupation | Male | Female |
| Sales & Related | 29 (59.2%) | 20 (40.8%) |
| Office & Administration | 16 (39.0%) | 25 (61.0%) |
| Total (Category) | 45 (50.0%) | 45 (50.0%) |
| Total (Overall) | 294 (53.5%) | 255 (46.5%) |
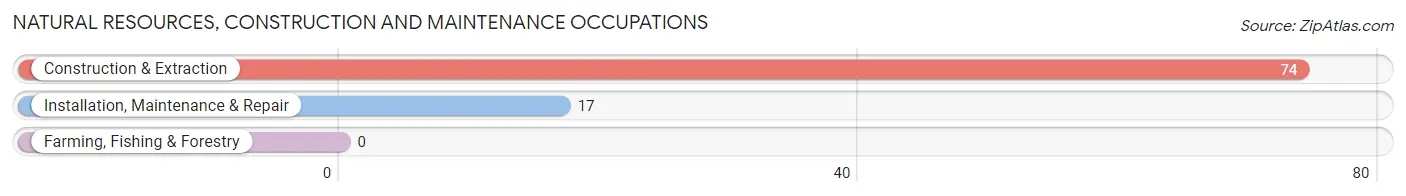
Natural Resources, Construction and Maintenance Occupations
The most common Natural Resources, Construction and Maintenance occupations in Fairplay are Construction & Extraction (74 | 13.5%), and Installation, Maintenance & Repair (17 | 3.1%).
Natural Resources, Construction and Maintenance Occupations by Sex
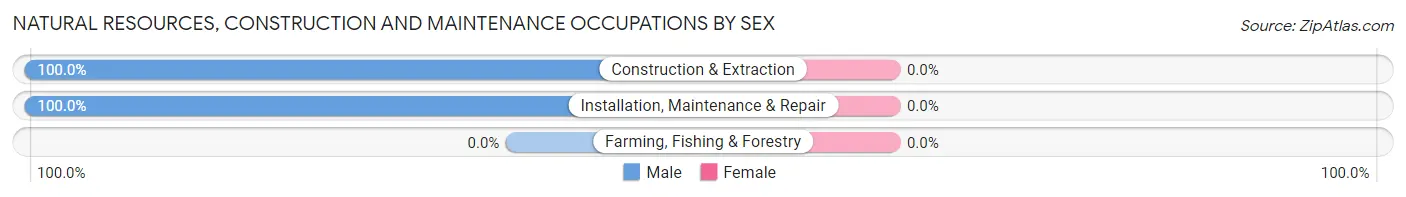
| Occupation | Male | Female |
| Farming, Fishing & Forestry | 0 (0.0%) | 0 (0.0%) |
| Construction & Extraction | 74 (100.0%) | 0 (0.0%) |
| Installation, Maintenance & Repair | 17 (100.0%) | 0 (0.0%) |
| Total (Category) | 91 (100.0%) | 0 (0.0%) |
| Total (Overall) | 294 (53.5%) | 255 (46.5%) |
Production, Transportation and Moving Occupations
The most common Production, Transportation and Moving occupations in Fairplay are Transportation (25 | 4.5%), Material Moving (16 | 2.9%), and Production (10 | 1.8%).
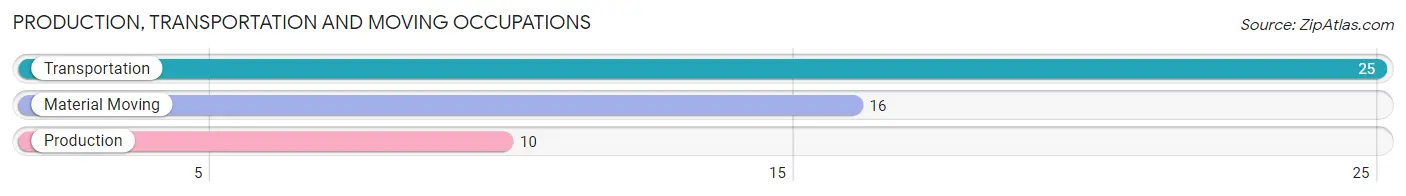
Production, Transportation and Moving Occupations by Sex
| Occupation | Male | Female |
| Production | 10 (100.0%) | 0 (0.0%) |
| Transportation | 8 (32.0%) | 17 (68.0%) |
| Material Moving | 0 (0.0%) | 16 (100.0%) |
| Total (Category) | 18 (35.3%) | 33 (64.7%) |
| Total (Overall) | 294 (53.5%) | 255 (46.5%) |
Employment Industries by Sex in Fairplay
Employment Industries in Fairplay
The major employment industries in Fairplay include Accommodation & Food Services (130 | 23.7%), Construction (96 | 17.5%), Public Administration (61 | 11.1%), Retail Trade (54 | 9.8%), and Manufacturing (33 | 6.0%).
Employment Industries by Sex in Fairplay
The Fairplay industries that see more men than women are Agriculture, Fishing & Hunting (100.0%), Real Estate, Rental & Leasing (100.0%), and Administrative & Support (100.0%), whereas the industries that tend to have a higher number of women are Information (100.0%), Finance & Insurance (100.0%), and Professional & Scientific (100.0%).
| Industry | Male | Female |
| Agriculture, Fishing & Hunting | 16 (100.0%) | 0 (0.0%) |
| Mining, Quarrying, & Extraction | 0 (0.0%) | 0 (0.0%) |
| Construction | 83 (86.5%) | 13 (13.5%) |
| Manufacturing | 10 (30.3%) | 23 (69.7%) |
| Wholesale Trade | 0 (0.0%) | 0 (0.0%) |
| Retail Trade | 29 (53.7%) | 25 (46.3%) |
| Transportation & Warehousing | 8 (29.6%) | 19 (70.4%) |
| Utilities | 0 (0.0%) | 0 (0.0%) |
| Information | 0 (0.0%) | 7 (100.0%) |
| Finance & Insurance | 0 (0.0%) | 17 (100.0%) |
| Real Estate, Rental & Leasing | 21 (100.0%) | 0 (0.0%) |
| Professional & Scientific | 0 (0.0%) | 15 (100.0%) |
| Enterprise Management | 0 (0.0%) | 0 (0.0%) |
| Administrative & Support | 22 (100.0%) | 0 (0.0%) |
| Educational Services | 9 (37.5%) | 15 (62.5%) |
| Health Care & Social Assistance | 0 (0.0%) | 4 (100.0%) |
| Arts, Entertainment & Recreation | 0 (0.0%) | 0 (0.0%) |
| Accommodation & Food Services | 67 (51.5%) | 63 (48.5%) |
| Public Administration | 29 (47.5%) | 32 (52.5%) |
| Total | 294 (53.5%) | 255 (46.5%) |
Education in Fairplay
School Enrollment in Fairplay
The most common levels of schooling among the 185 students in Fairplay are high school (46 | 24.9%), college / undergraduate (45 | 24.3%), and middle school (44 | 23.8%).
| School Level | # Students | % Students |
| Nursery / Preschool | 5 | 2.7% |
| Kindergarten | 8 | 4.3% |
| Elementary School | 32 | 17.3% |
| Middle School | 44 | 23.8% |
| High School | 46 | 24.9% |
| College / Undergraduate | 45 | 24.3% |
| Graduate / Professional | 5 | 2.7% |
| Total | 185 | 100.0% |
School Enrollment by Age by Funding Source in Fairplay
Out of a total of 185 students who are enrolled in schools in Fairplay, 40 (21.6%) attend a private institution, while the remaining 145 (78.4%) are enrolled in public schools. The age group of 18 to 19 year olds has the highest likelihood of being enrolled in private schools, with 16 (72.7% in the age bracket) enrolled. Conversely, the age group of 3 to 4 year olds has the lowest likelihood of being enrolled in a private school, with 5 (100.0% in the age bracket) attending a public institution.
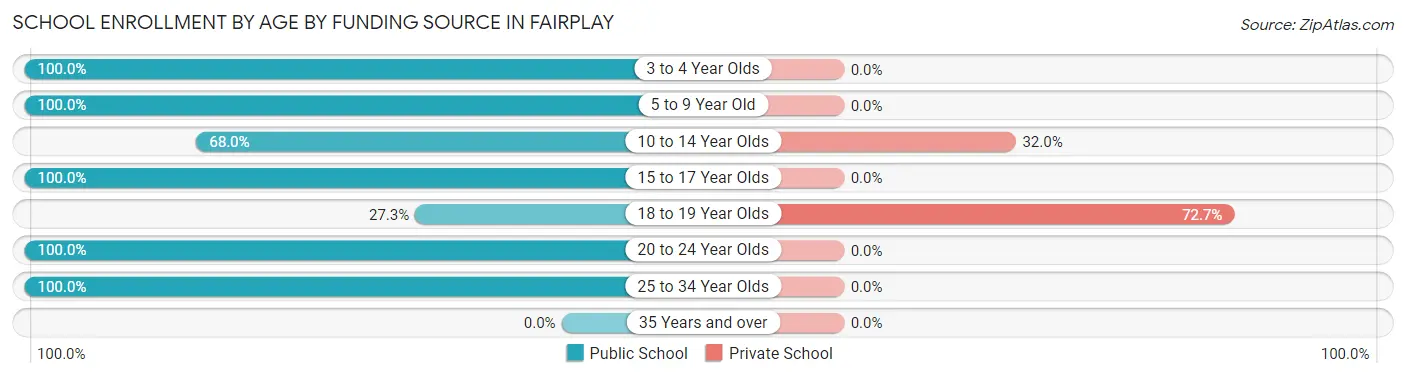
| Age Bracket | Public School | Private School |
| 3 to 4 Year Olds | 5 (100.0%) | 0 (0.0%) |
| 5 to 9 Year Old | 16 (100.0%) | 0 (0.0%) |
| 10 to 14 Year Olds | 51 (68.0%) | 24 (32.0%) |
| 15 to 17 Year Olds | 39 (100.0%) | 0 (0.0%) |
| 18 to 19 Year Olds | 6 (27.3%) | 16 (72.7%) |
| 20 to 24 Year Olds | 23 (100.0%) | 0 (0.0%) |
| 25 to 34 Year Olds | 5 (100.0%) | 0 (0.0%) |
| 35 Years and over | 0 (0.0%) | 0 (0.0%) |
| Total | 145 (78.4%) | 40 (21.6%) |
Educational Attainment by Field of Study in Fairplay
Business (29 | 22.7%), social sciences (25 | 19.5%), liberal arts & history (16 | 12.5%), visual & performing arts (11 | 8.6%), and education (9 | 7.0%) are the most common fields of study among 128 individuals in Fairplay who have obtained a bachelor's degree or higher.
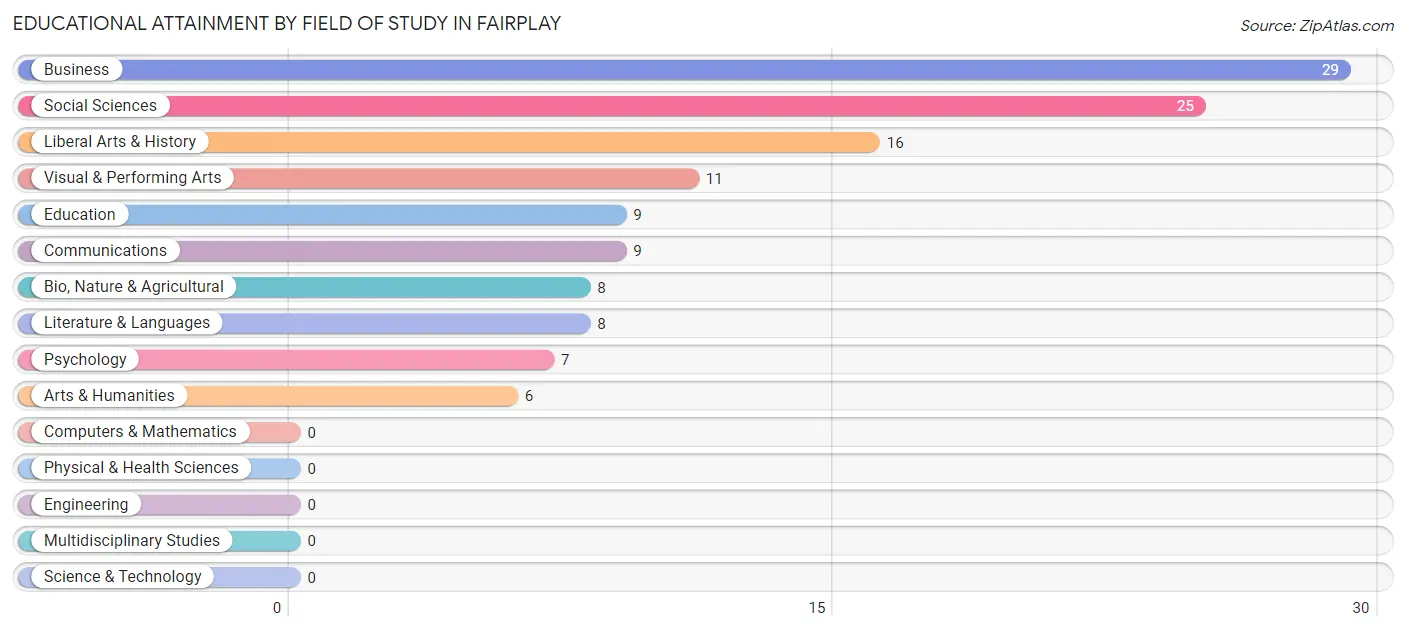
| Field of Study | # Graduates | % Graduates |
| Computers & Mathematics | 0 | 0.0% |
| Bio, Nature & Agricultural | 8 | 6.2% |
| Physical & Health Sciences | 0 | 0.0% |
| Psychology | 7 | 5.5% |
| Social Sciences | 25 | 19.5% |
| Engineering | 0 | 0.0% |
| Multidisciplinary Studies | 0 | 0.0% |
| Science & Technology | 0 | 0.0% |
| Business | 29 | 22.7% |
| Education | 9 | 7.0% |
| Literature & Languages | 8 | 6.2% |
| Liberal Arts & History | 16 | 12.5% |
| Visual & Performing Arts | 11 | 8.6% |
| Communications | 9 | 7.0% |
| Arts & Humanities | 6 | 4.7% |
| Total | 128 | 100.0% |
Transportation & Commute in Fairplay
Vehicle Availability by Sex in Fairplay
The most prevalent vehicle ownership categories in Fairplay are males with 2 vehicles (133, accounting for 45.2%) and females with 2 vehicles (87, making up 52.2%).
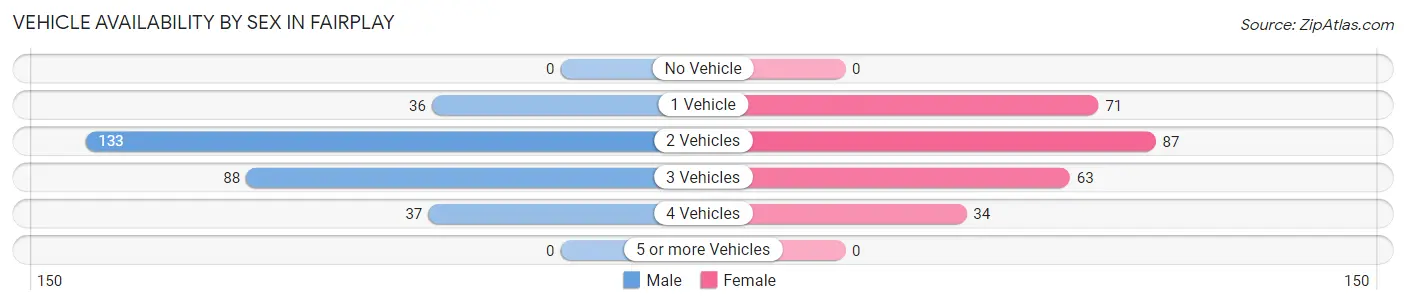
| Vehicles Available | Male | Female |
| No Vehicle | 0 (0.0%) | 0 (0.0%) |
| 1 Vehicle | 36 (12.2%) | 71 (27.8%) |
| 2 Vehicles | 133 (45.2%) | 87 (34.1%) |
| 3 Vehicles | 88 (29.9%) | 63 (24.7%) |
| 4 Vehicles | 37 (12.6%) | 34 (13.3%) |
| 5 or more Vehicles | 0 (0.0%) | 0 (0.0%) |
| Total | 294 (100.0%) | 255 (100.0%) |
Commute Time in Fairplay
The most frequently occuring commute durations in Fairplay are less than 5 minutes (143 commuters, 30.6%), 30 to 34 minutes (91 commuters, 19.4%), and 5 to 9 minutes (88 commuters, 18.8%).
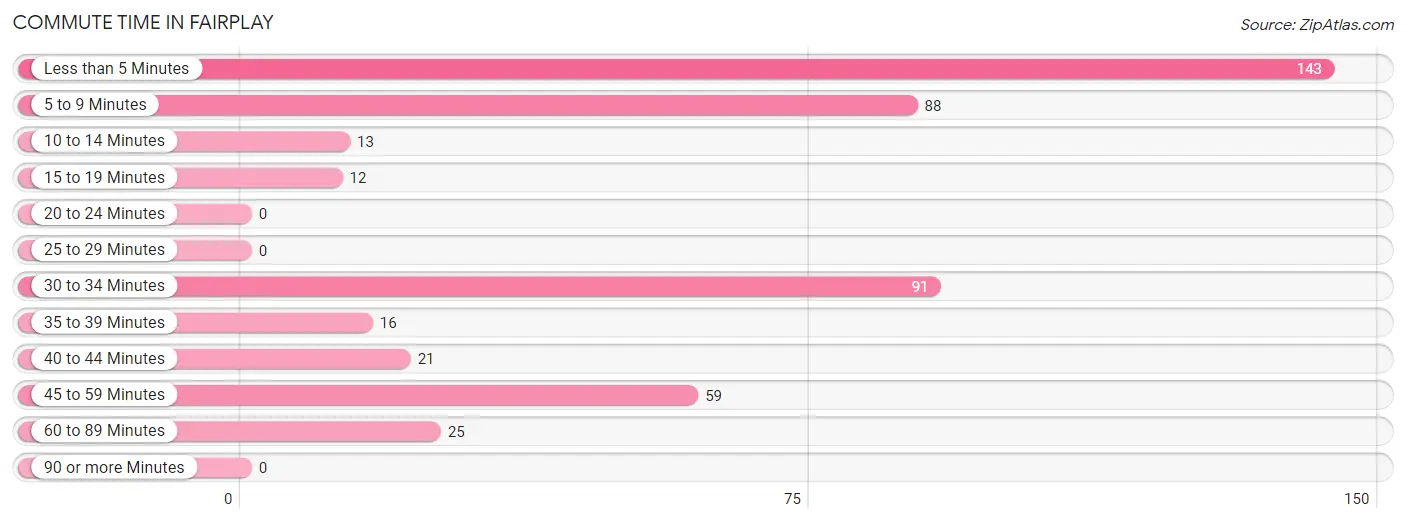
| Commute Time | # Commuters | % Commuters |
| Less than 5 Minutes | 143 | 30.6% |
| 5 to 9 Minutes | 88 | 18.8% |
| 10 to 14 Minutes | 13 | 2.8% |
| 15 to 19 Minutes | 12 | 2.6% |
| 20 to 24 Minutes | 0 | 0.0% |
| 25 to 29 Minutes | 0 | 0.0% |
| 30 to 34 Minutes | 91 | 19.4% |
| 35 to 39 Minutes | 16 | 3.4% |
| 40 to 44 Minutes | 21 | 4.5% |
| 45 to 59 Minutes | 59 | 12.6% |
| 60 to 89 Minutes | 25 | 5.3% |
| 90 or more Minutes | 0 | 0.0% |
Commute Time by Sex in Fairplay
The most common commute times in Fairplay are less than 5 minutes (85 commuters, 34.5%) for males and less than 5 minutes (58 commuters, 26.1%) for females.
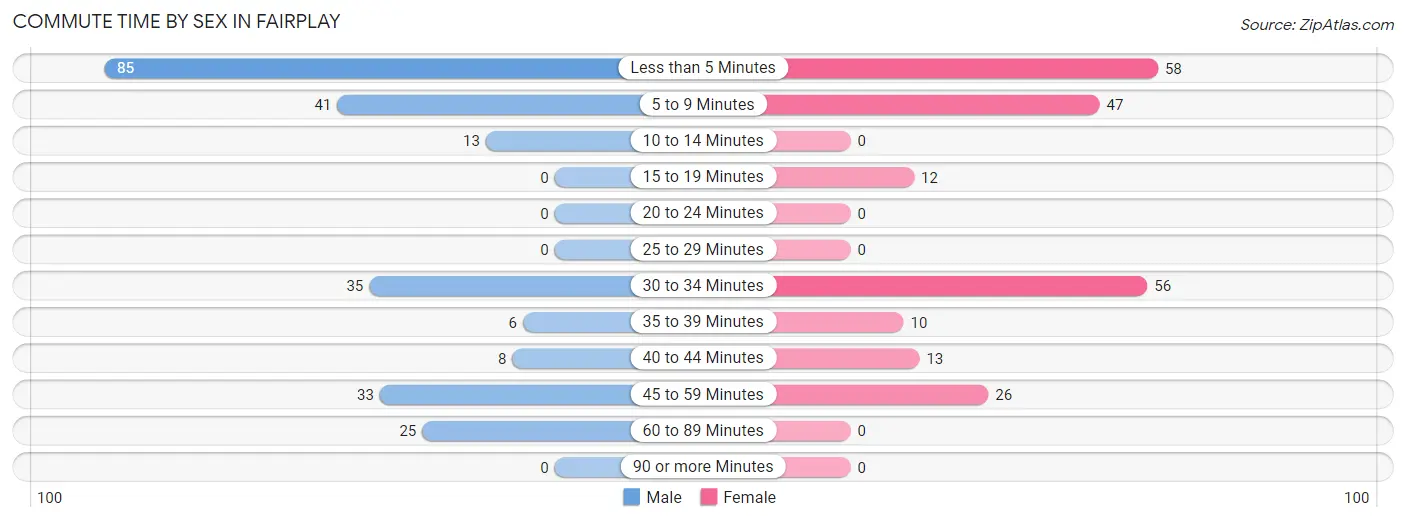
| Commute Time | Male | Female |
| Less than 5 Minutes | 85 (34.5%) | 58 (26.1%) |
| 5 to 9 Minutes | 41 (16.7%) | 47 (21.2%) |
| 10 to 14 Minutes | 13 (5.3%) | 0 (0.0%) |
| 15 to 19 Minutes | 0 (0.0%) | 12 (5.4%) |
| 20 to 24 Minutes | 0 (0.0%) | 0 (0.0%) |
| 25 to 29 Minutes | 0 (0.0%) | 0 (0.0%) |
| 30 to 34 Minutes | 35 (14.2%) | 56 (25.2%) |
| 35 to 39 Minutes | 6 (2.4%) | 10 (4.5%) |
| 40 to 44 Minutes | 8 (3.3%) | 13 (5.9%) |
| 45 to 59 Minutes | 33 (13.4%) | 26 (11.7%) |
| 60 to 89 Minutes | 25 (10.2%) | 0 (0.0%) |
| 90 or more Minutes | 0 (0.0%) | 0 (0.0%) |
Time of Departure to Work by Sex in Fairplay
The most frequent times of departure to work in Fairplay are 7:00 AM to 7:29 AM (46, 18.7%) for males and 9:00 AM to 9:59 AM (68, 30.6%) for females.
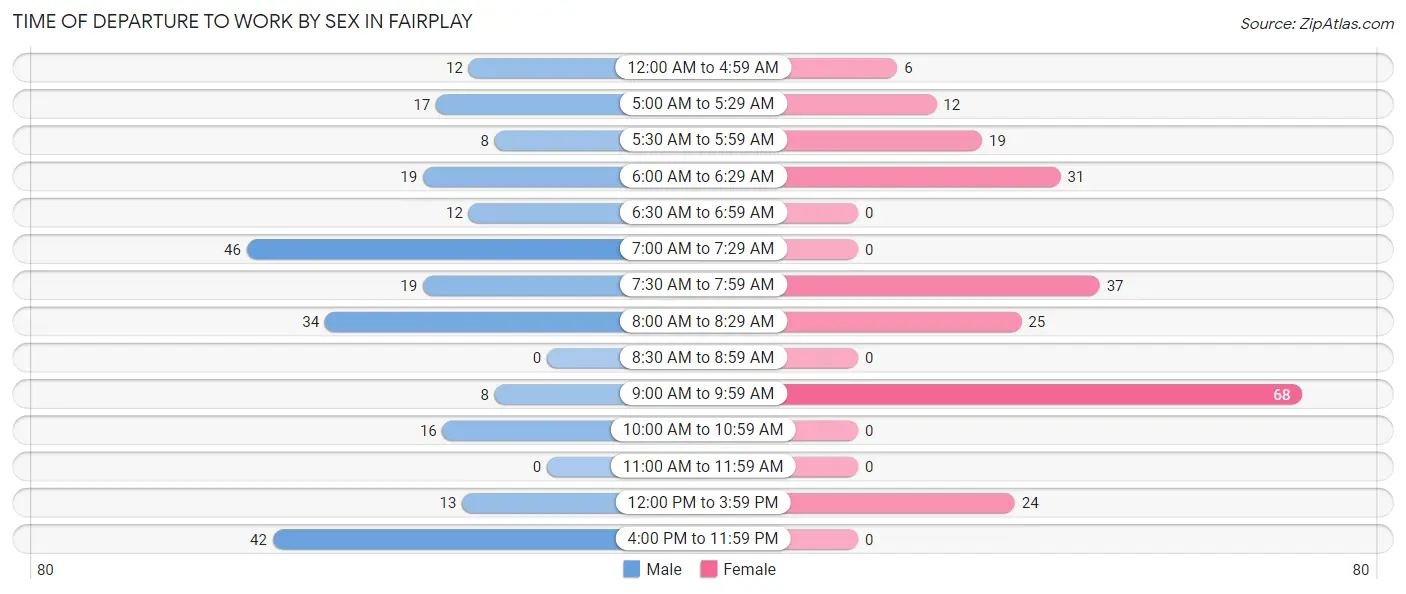
| Time of Departure | Male | Female |
| 12:00 AM to 4:59 AM | 12 (4.9%) | 6 (2.7%) |
| 5:00 AM to 5:29 AM | 17 (6.9%) | 12 (5.4%) |
| 5:30 AM to 5:59 AM | 8 (3.3%) | 19 (8.6%) |
| 6:00 AM to 6:29 AM | 19 (7.7%) | 31 (14.0%) |
| 6:30 AM to 6:59 AM | 12 (4.9%) | 0 (0.0%) |
| 7:00 AM to 7:29 AM | 46 (18.7%) | 0 (0.0%) |
| 7:30 AM to 7:59 AM | 19 (7.7%) | 37 (16.7%) |
| 8:00 AM to 8:29 AM | 34 (13.8%) | 25 (11.3%) |
| 8:30 AM to 8:59 AM | 0 (0.0%) | 0 (0.0%) |
| 9:00 AM to 9:59 AM | 8 (3.3%) | 68 (30.6%) |
| 10:00 AM to 10:59 AM | 16 (6.5%) | 0 (0.0%) |
| 11:00 AM to 11:59 AM | 0 (0.0%) | 0 (0.0%) |
| 12:00 PM to 3:59 PM | 13 (5.3%) | 24 (10.8%) |
| 4:00 PM to 11:59 PM | 42 (17.1%) | 0 (0.0%) |
| Total | 246 (100.0%) | 222 (100.0%) |
Housing Occupancy in Fairplay
Occupancy by Ownership in Fairplay
Of the total 342 dwellings in Fairplay, owner-occupied units account for 188 (55.0%), while renter-occupied units make up 154 (45.0%).
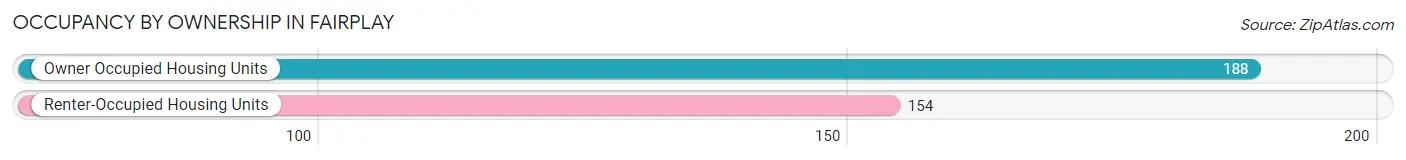
| Occupancy | # Housing Units | % Housing Units |
| Owner Occupied Housing Units | 188 | 55.0% |
| Renter-Occupied Housing Units | 154 | 45.0% |
| Total Occupied Housing Units | 342 | 100.0% |
Occupancy by Household Size in Fairplay
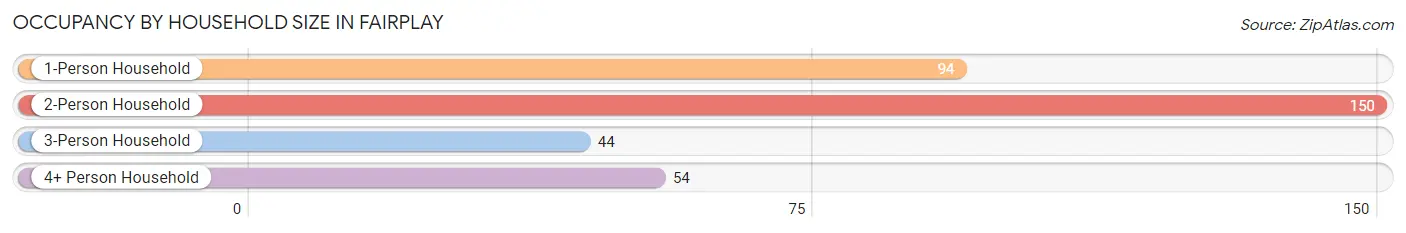
| Household Size | # Housing Units | % Housing Units |
| 1-Person Household | 94 | 27.5% |
| 2-Person Household | 150 | 43.9% |
| 3-Person Household | 44 | 12.9% |
| 4+ Person Household | 54 | 15.8% |
| Total Housing Units | 342 | 100.0% |
Occupancy by Ownership by Household Size in Fairplay
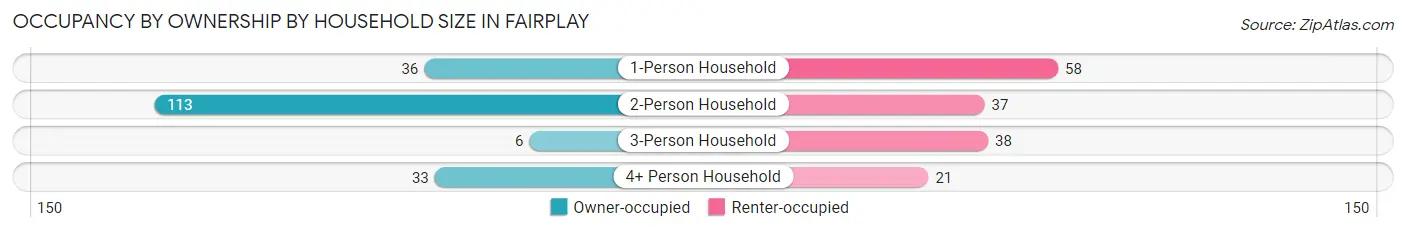
| Household Size | Owner-occupied | Renter-occupied |
| 1-Person Household | 36 (38.3%) | 58 (61.7%) |
| 2-Person Household | 113 (75.3%) | 37 (24.7%) |
| 3-Person Household | 6 (13.6%) | 38 (86.4%) |
| 4+ Person Household | 33 (61.1%) | 21 (38.9%) |
| Total Housing Units | 188 (55.0%) | 154 (45.0%) |
Occupancy by Educational Attainment in Fairplay
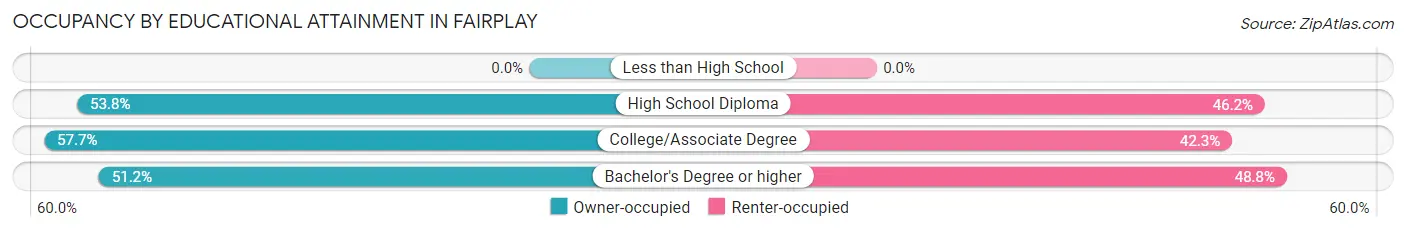
| Household Size | Owner-occupied | Renter-occupied |
| Less than High School | 0 (0.0%) | 0 (0.0%) |
| High School Diploma | 50 (53.8%) | 43 (46.2%) |
| College/Associate Degree | 94 (57.7%) | 69 (42.3%) |
| Bachelor's Degree or higher | 44 (51.2%) | 42 (48.8%) |
Occupancy by Age of Householder in Fairplay
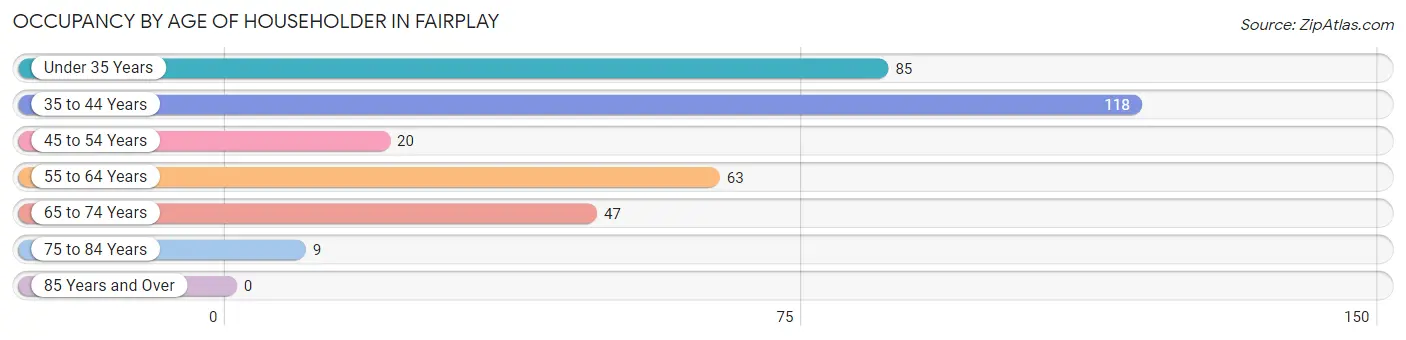
| Age Bracket | # Households | % Households |
| Under 35 Years | 85 | 24.8% |
| 35 to 44 Years | 118 | 34.5% |
| 45 to 54 Years | 20 | 5.9% |
| 55 to 64 Years | 63 | 18.4% |
| 65 to 74 Years | 47 | 13.7% |
| 75 to 84 Years | 9 | 2.6% |
| 85 Years and Over | 0 | 0.0% |
| Total | 342 | 100.0% |
Housing Finances in Fairplay
Median Income by Occupancy in Fairplay
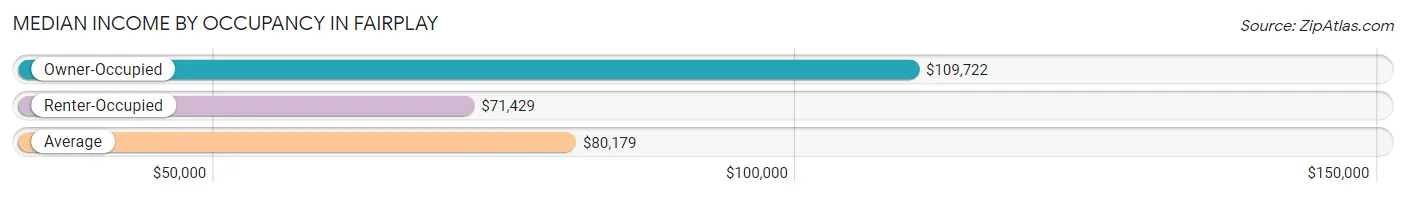
| Occupancy Type | # Households | Median Income |
| Owner-Occupied | 188 (55.0%) | $109,722 |
| Renter-Occupied | 154 (45.0%) | $71,429 |
| Average | 342 (100.0%) | $80,179 |
Occupancy by Householder Income Bracket in Fairplay
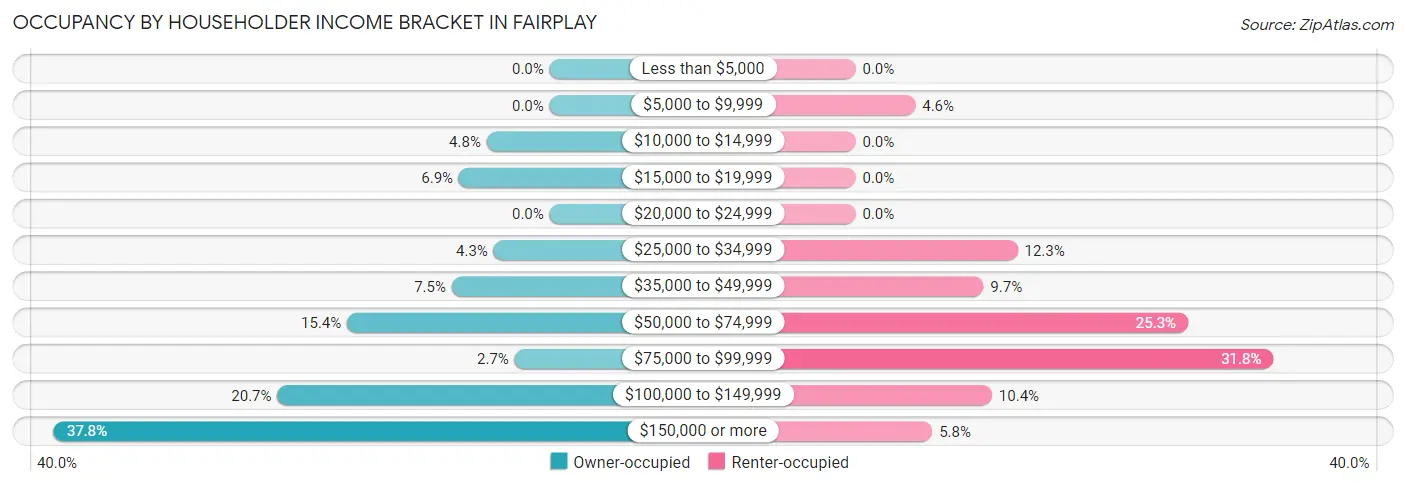
| Income Bracket | Owner-occupied | Renter-occupied |
| Less than $5,000 | 0 (0.0%) | 0 (0.0%) |
| $5,000 to $9,999 | 0 (0.0%) | 7 (4.5%) |
| $10,000 to $14,999 | 9 (4.8%) | 0 (0.0%) |
| $15,000 to $19,999 | 13 (6.9%) | 0 (0.0%) |
| $20,000 to $24,999 | 0 (0.0%) | 0 (0.0%) |
| $25,000 to $34,999 | 8 (4.3%) | 19 (12.3%) |
| $35,000 to $49,999 | 14 (7.4%) | 15 (9.7%) |
| $50,000 to $74,999 | 29 (15.4%) | 39 (25.3%) |
| $75,000 to $99,999 | 5 (2.7%) | 49 (31.8%) |
| $100,000 to $149,999 | 39 (20.7%) | 16 (10.4%) |
| $150,000 or more | 71 (37.8%) | 9 (5.8%) |
| Total | 188 (100.0%) | 154 (100.0%) |
Monthly Housing Cost Tiers in Fairplay
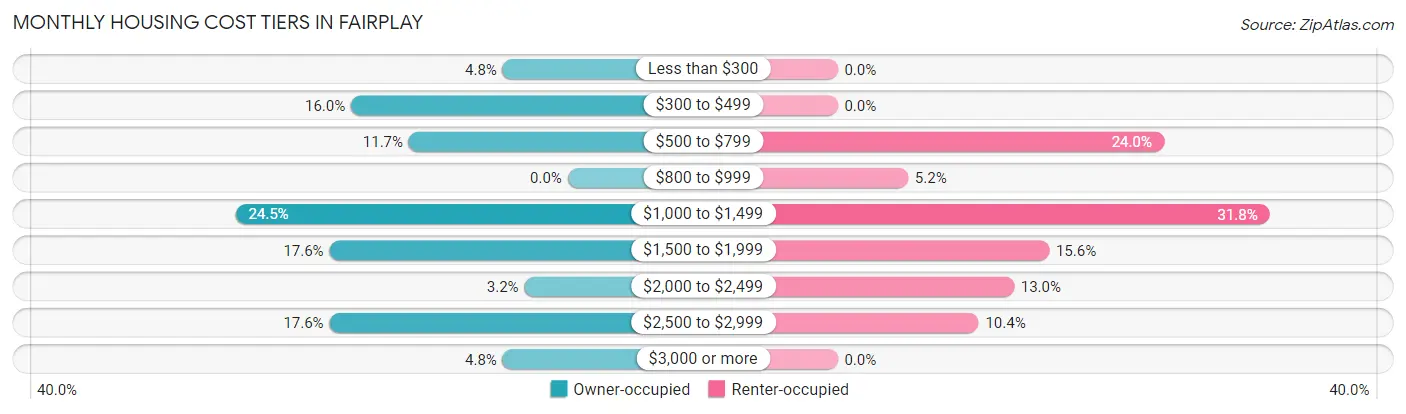
| Monthly Cost | Owner-occupied | Renter-occupied |
| Less than $300 | 9 (4.8%) | 0 (0.0%) |
| $300 to $499 | 30 (16.0%) | 0 (0.0%) |
| $500 to $799 | 22 (11.7%) | 37 (24.0%) |
| $800 to $999 | 0 (0.0%) | 8 (5.2%) |
| $1,000 to $1,499 | 46 (24.5%) | 49 (31.8%) |
| $1,500 to $1,999 | 33 (17.5%) | 24 (15.6%) |
| $2,000 to $2,499 | 6 (3.2%) | 20 (13.0%) |
| $2,500 to $2,999 | 33 (17.5%) | 16 (10.4%) |
| $3,000 or more | 9 (4.8%) | 0 (0.0%) |
| Total | 188 (100.0%) | 154 (100.0%) |
Physical Housing Characteristics in Fairplay
Housing Structures in Fairplay
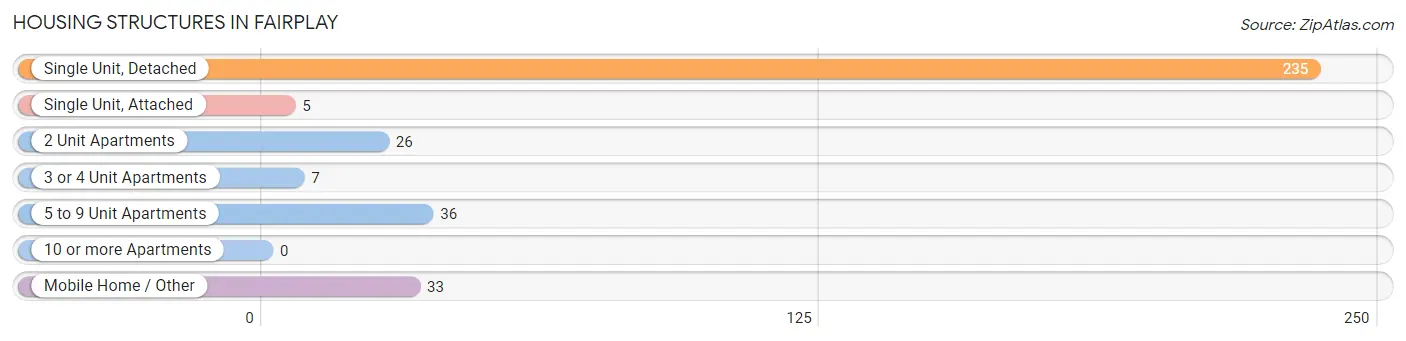
| Structure Type | # Housing Units | % Housing Units |
| Single Unit, Detached | 235 | 68.7% |
| Single Unit, Attached | 5 | 1.5% |
| 2 Unit Apartments | 26 | 7.6% |
| 3 or 4 Unit Apartments | 7 | 2.1% |
| 5 to 9 Unit Apartments | 36 | 10.5% |
| 10 or more Apartments | 0 | 0.0% |
| Mobile Home / Other | 33 | 9.7% |
| Total | 342 | 100.0% |
Housing Structures by Occupancy in Fairplay
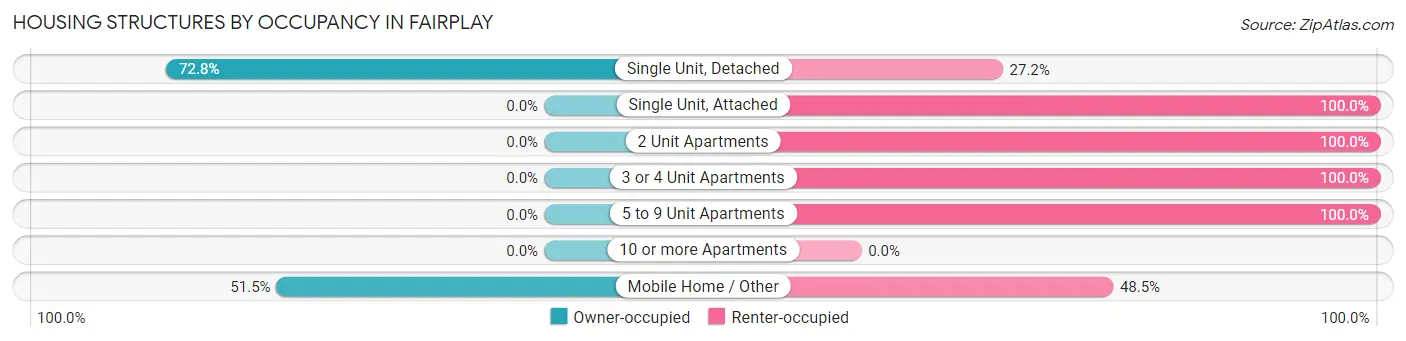
| Structure Type | Owner-occupied | Renter-occupied |
| Single Unit, Detached | 171 (72.8%) | 64 (27.2%) |
| Single Unit, Attached | 0 (0.0%) | 5 (100.0%) |
| 2 Unit Apartments | 0 (0.0%) | 26 (100.0%) |
| 3 or 4 Unit Apartments | 0 (0.0%) | 7 (100.0%) |
| 5 to 9 Unit Apartments | 0 (0.0%) | 36 (100.0%) |
| 10 or more Apartments | 0 (0.0%) | 0 (0.0%) |
| Mobile Home / Other | 17 (51.5%) | 16 (48.5%) |
| Total | 188 (55.0%) | 154 (45.0%) |
Housing Structures by Number of Rooms in Fairplay
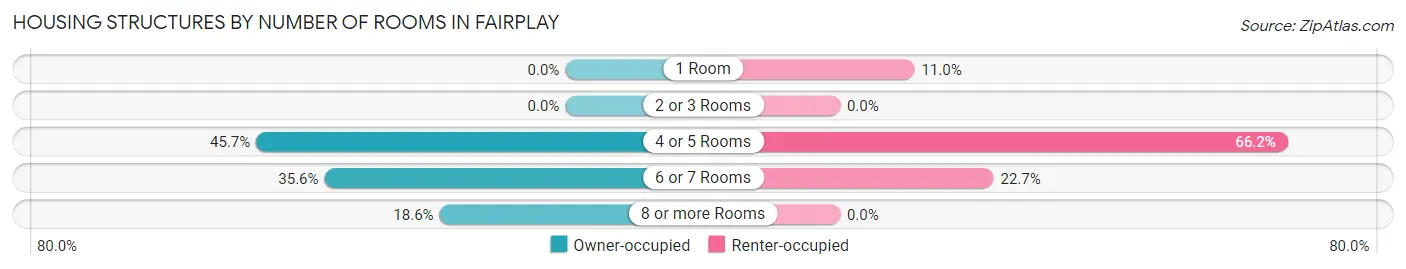
| Number of Rooms | Owner-occupied | Renter-occupied |
| 1 Room | 0 (0.0%) | 17 (11.0%) |
| 2 or 3 Rooms | 0 (0.0%) | 0 (0.0%) |
| 4 or 5 Rooms | 86 (45.7%) | 102 (66.2%) |
| 6 or 7 Rooms | 67 (35.6%) | 35 (22.7%) |
| 8 or more Rooms | 35 (18.6%) | 0 (0.0%) |
| Total | 188 (100.0%) | 154 (100.0%) |
Housing Structure by Heating Type in Fairplay
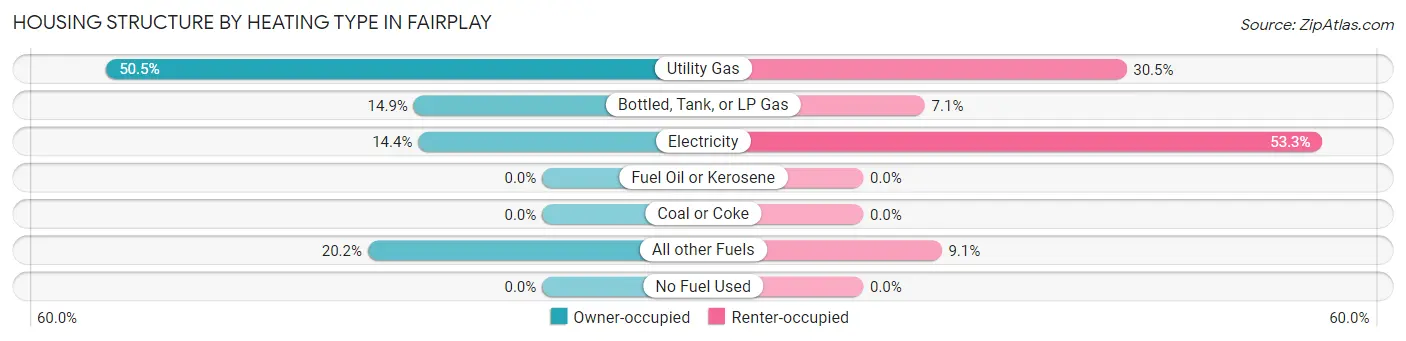
| Heating Type | Owner-occupied | Renter-occupied |
| Utility Gas | 95 (50.5%) | 47 (30.5%) |
| Bottled, Tank, or LP Gas | 28 (14.9%) | 11 (7.1%) |
| Electricity | 27 (14.4%) | 82 (53.2%) |
| Fuel Oil or Kerosene | 0 (0.0%) | 0 (0.0%) |
| Coal or Coke | 0 (0.0%) | 0 (0.0%) |
| All other Fuels | 38 (20.2%) | 14 (9.1%) |
| No Fuel Used | 0 (0.0%) | 0 (0.0%) |
| Total | 188 (100.0%) | 154 (100.0%) |
Household Vehicle Usage in Fairplay
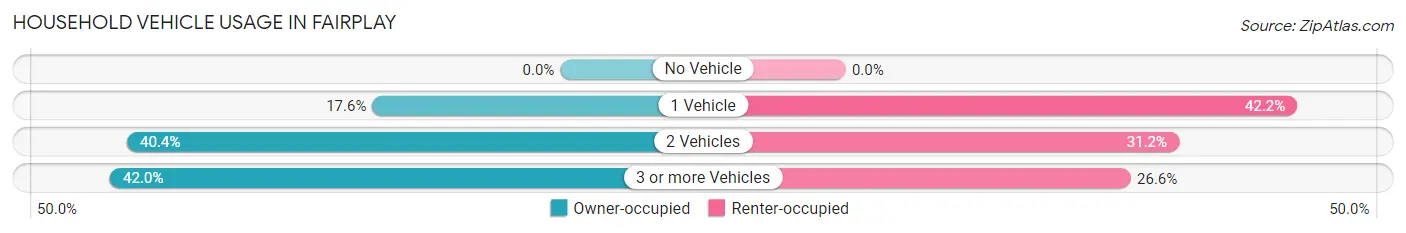
| Vehicles per Household | Owner-occupied | Renter-occupied |
| No Vehicle | 0 (0.0%) | 0 (0.0%) |
| 1 Vehicle | 33 (17.5%) | 65 (42.2%) |
| 2 Vehicles | 76 (40.4%) | 48 (31.2%) |
| 3 or more Vehicles | 79 (42.0%) | 41 (26.6%) |
| Total | 188 (100.0%) | 154 (100.0%) |
Real Estate & Mortgages in Fairplay
Real Estate and Mortgage Overview in Fairplay
| Characteristic | Without Mortgage | With Mortgage |
| Housing Units | 52 | 136 |
| Median Property Value | $266,700 | $363,800 |
| Median Household Income | $41,250 | $64 |
| Monthly Housing Costs | $487 | $9 |
| Real Estate Taxes | $1,224 | $0 |
Property Value by Mortgage Status in Fairplay
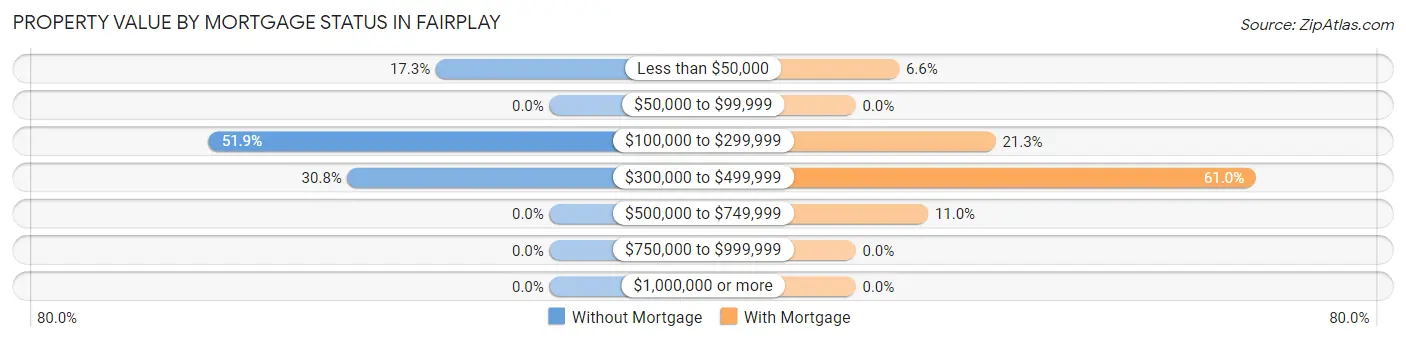
| Property Value | Without Mortgage | With Mortgage |
| Less than $50,000 | 9 (17.3%) | 9 (6.6%) |
| $50,000 to $99,999 | 0 (0.0%) | 0 (0.0%) |
| $100,000 to $299,999 | 27 (51.9%) | 29 (21.3%) |
| $300,000 to $499,999 | 16 (30.8%) | 83 (61.0%) |
| $500,000 to $749,999 | 0 (0.0%) | 15 (11.0%) |
| $750,000 to $999,999 | 0 (0.0%) | 0 (0.0%) |
| $1,000,000 or more | 0 (0.0%) | 0 (0.0%) |
| Total | 52 (100.0%) | 136 (100.0%) |
Household Income by Mortgage Status in Fairplay
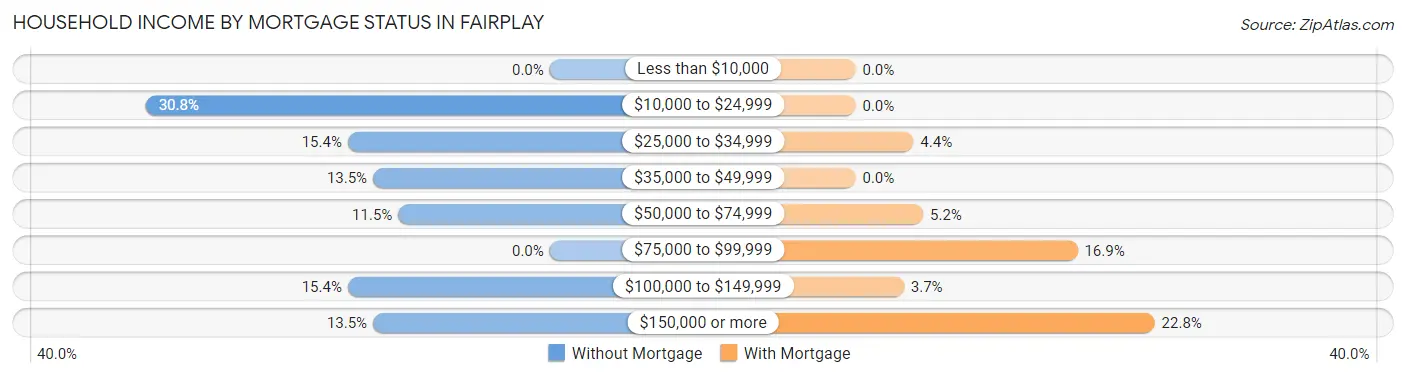
| Household Income | Without Mortgage | With Mortgage |
| Less than $10,000 | 0 (0.0%) | 0 (0.0%) |
| $10,000 to $24,999 | 16 (30.8%) | 0 (0.0%) |
| $25,000 to $34,999 | 8 (15.4%) | 6 (4.4%) |
| $35,000 to $49,999 | 7 (13.5%) | 0 (0.0%) |
| $50,000 to $74,999 | 6 (11.5%) | 7 (5.1%) |
| $75,000 to $99,999 | 0 (0.0%) | 23 (16.9%) |
| $100,000 to $149,999 | 8 (15.4%) | 5 (3.7%) |
| $150,000 or more | 7 (13.5%) | 31 (22.8%) |
| Total | 52 (100.0%) | 136 (100.0%) |
Property Value to Household Income Ratio in Fairplay
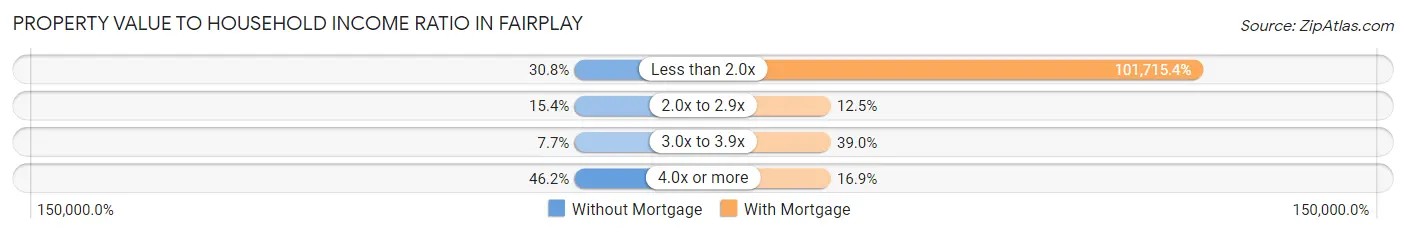
| Value-to-Income Ratio | Without Mortgage | With Mortgage |
| Less than 2.0x | 16 (30.8%) | 138,333 (101,715.4%) |
| 2.0x to 2.9x | 8 (15.4%) | 17 (12.5%) |
| 3.0x to 3.9x | 4 (7.7%) | 53 (39.0%) |
| 4.0x or more | 24 (46.2%) | 23 (16.9%) |
| Total | 52 (100.0%) | 136 (100.0%) |
Real Estate Taxes by Mortgage Status in Fairplay
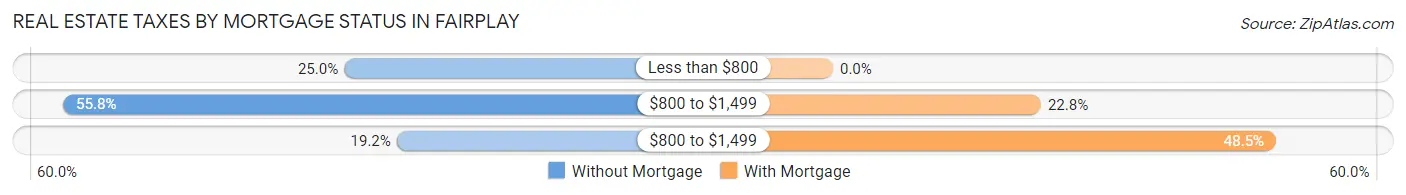
| Property Taxes | Without Mortgage | With Mortgage |
| Less than $800 | 13 (25.0%) | 0 (0.0%) |
| $800 to $1,499 | 29 (55.8%) | 31 (22.8%) |
| $800 to $1,499 | 10 (19.2%) | 66 (48.5%) |
| Total | 52 (100.0%) | 136 (100.0%) |
Health & Disability in Fairplay
Health Insurance Coverage by Age in Fairplay
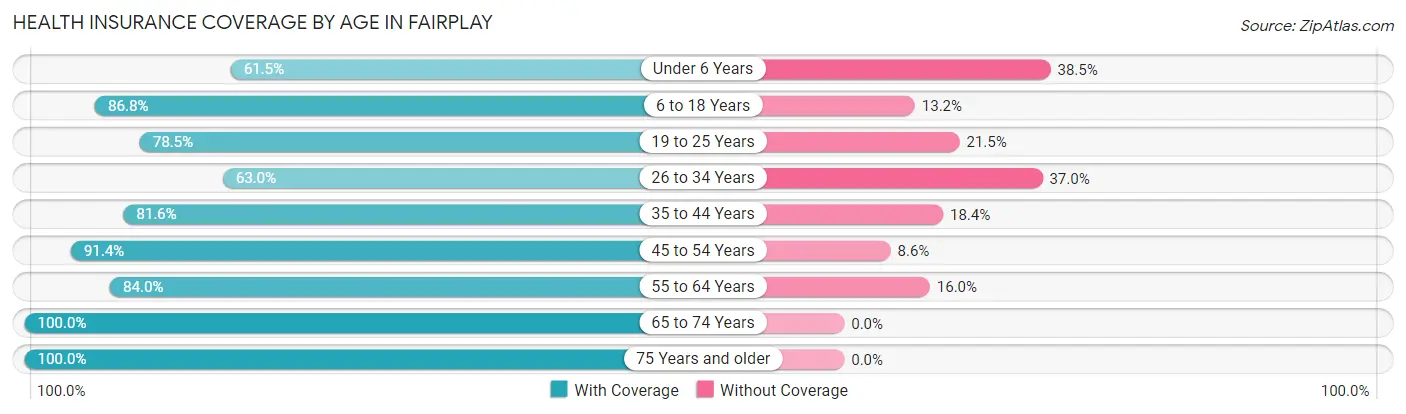
| Age Bracket | With Coverage | Without Coverage |
| Under 6 Years | 8 (61.5%) | 5 (38.5%) |
| 6 to 18 Years | 132 (86.8%) | 20 (13.2%) |
| 19 to 25 Years | 95 (78.5%) | 26 (21.5%) |
| 26 to 34 Years | 58 (63.0%) | 34 (37.0%) |
| 35 to 44 Years | 124 (81.6%) | 28 (18.4%) |
| 45 to 54 Years | 74 (91.4%) | 7 (8.6%) |
| 55 to 64 Years | 79 (84.0%) | 15 (16.0%) |
| 65 to 74 Years | 58 (100.0%) | 0 (0.0%) |
| 75 Years and older | 19 (100.0%) | 0 (0.0%) |
| Total | 647 (82.7%) | 135 (17.3%) |
Health Insurance Coverage by Citizenship Status in Fairplay
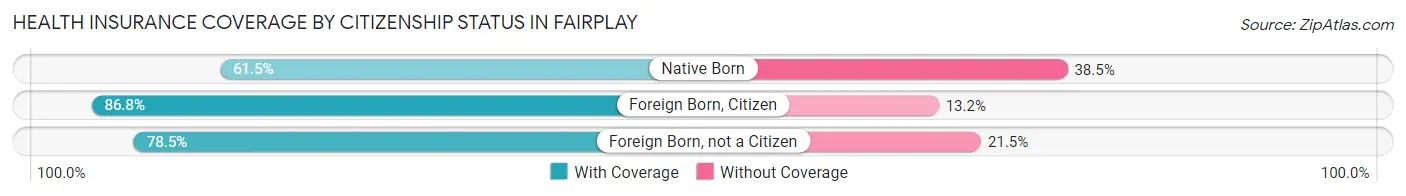
| Citizenship Status | With Coverage | Without Coverage |
| Native Born | 8 (61.5%) | 5 (38.5%) |
| Foreign Born, Citizen | 132 (86.8%) | 20 (13.2%) |
| Foreign Born, not a Citizen | 95 (78.5%) | 26 (21.5%) |
Health Insurance Coverage by Household Income in Fairplay
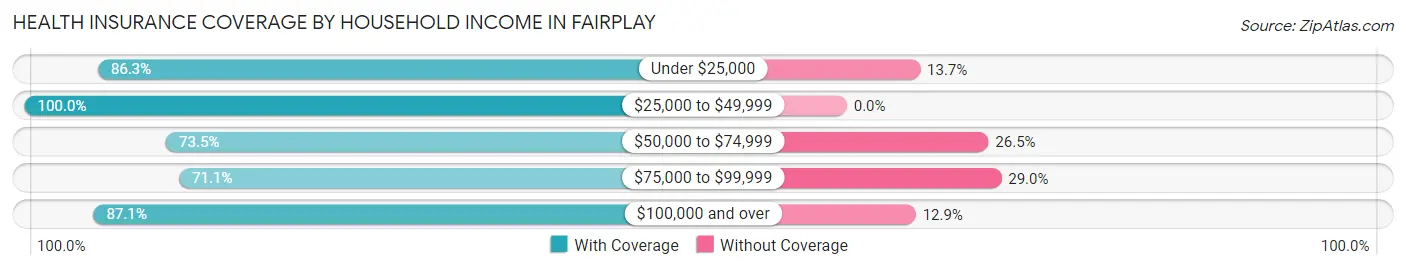
| Household Income | With Coverage | Without Coverage |
| Under $25,000 | 44 (86.3%) | 7 (13.7%) |
| $25,000 to $49,999 | 88 (100.0%) | 0 (0.0%) |
| $50,000 to $74,999 | 144 (73.5%) | 52 (26.5%) |
| $75,000 to $99,999 | 81 (71.1%) | 33 (28.9%) |
| $100,000 and over | 290 (87.1%) | 43 (12.9%) |
Public vs Private Health Insurance Coverage by Age in Fairplay
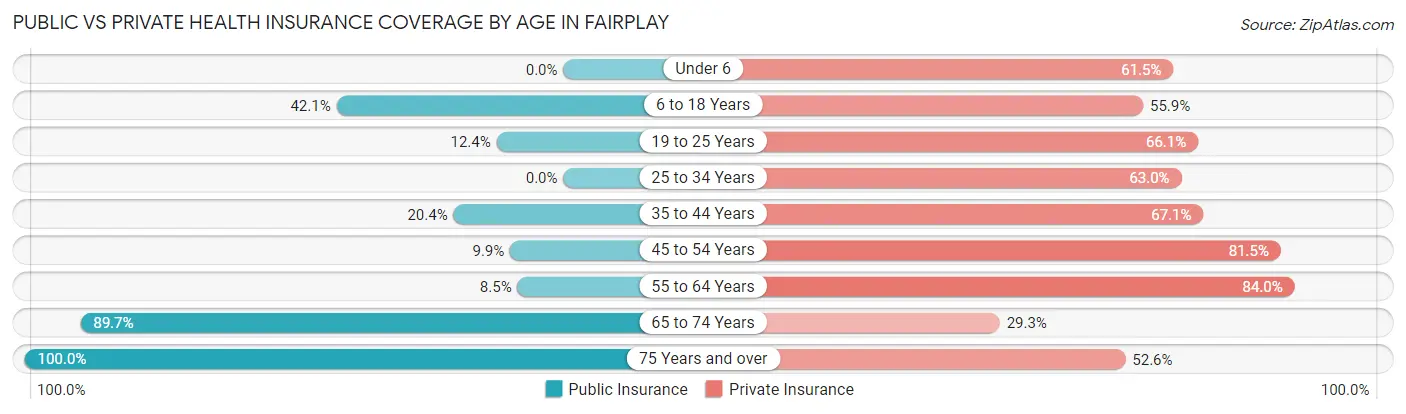
| Age Bracket | Public Insurance | Private Insurance |
| Under 6 | 0 (0.0%) | 8 (61.5%) |
| 6 to 18 Years | 64 (42.1%) | 85 (55.9%) |
| 19 to 25 Years | 15 (12.4%) | 80 (66.1%) |
| 25 to 34 Years | 0 (0.0%) | 58 (63.0%) |
| 35 to 44 Years | 31 (20.4%) | 102 (67.1%) |
| 45 to 54 Years | 8 (9.9%) | 66 (81.5%) |
| 55 to 64 Years | 8 (8.5%) | 79 (84.0%) |
| 65 to 74 Years | 52 (89.7%) | 17 (29.3%) |
| 75 Years and over | 19 (100.0%) | 10 (52.6%) |
| Total | 197 (25.2%) | 505 (64.6%) |
Disability Status by Sex by Age in Fairplay
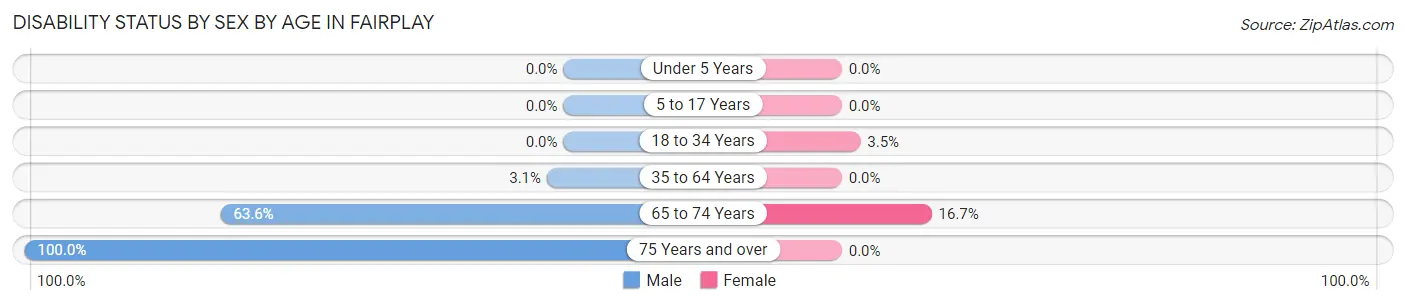
| Age Bracket | Male | Female |
| Under 5 Years | 0 (0.0%) | 0 (0.0%) |
| 5 to 17 Years | 0 (0.0%) | 0 (0.0%) |
| 18 to 34 Years | 0 (0.0%) | 4 (3.5%) |
| 35 to 64 Years | 6 (3.1%) | 0 (0.0%) |
| 65 to 74 Years | 14 (63.6%) | 6 (16.7%) |
| 75 Years and over | 19 (100.0%) | 0 (0.0%) |
Disability Class by Sex by Age in Fairplay
Disability Class: Hearing Difficulty
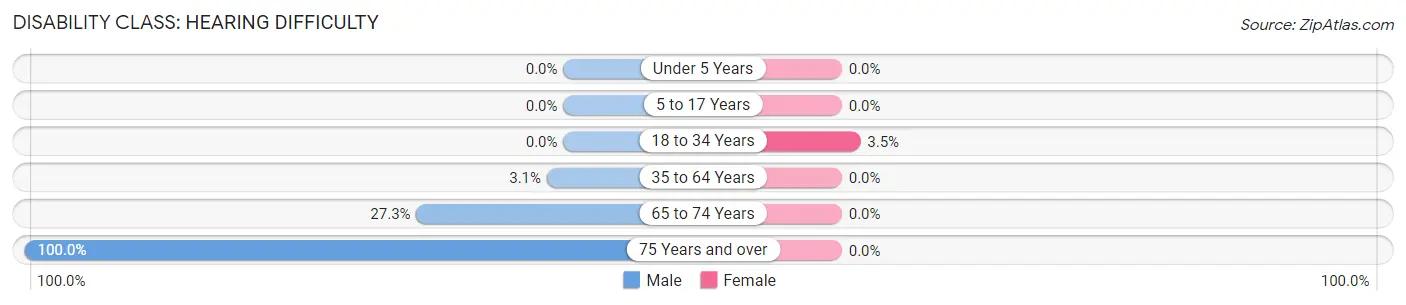
| Age Bracket | Male | Female |
| Under 5 Years | 0 (0.0%) | 0 (0.0%) |
| 5 to 17 Years | 0 (0.0%) | 0 (0.0%) |
| 18 to 34 Years | 0 (0.0%) | 4 (3.5%) |
| 35 to 64 Years | 6 (3.1%) | 0 (0.0%) |
| 65 to 74 Years | 6 (27.3%) | 0 (0.0%) |
| 75 Years and over | 19 (100.0%) | 0 (0.0%) |
Disability Class: Vision Difficulty
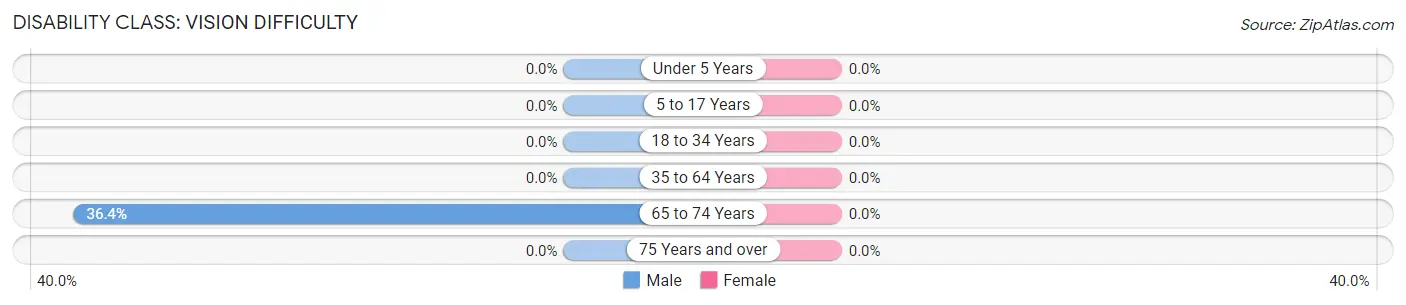
| Age Bracket | Male | Female |
| Under 5 Years | 0 (0.0%) | 0 (0.0%) |
| 5 to 17 Years | 0 (0.0%) | 0 (0.0%) |
| 18 to 34 Years | 0 (0.0%) | 0 (0.0%) |
| 35 to 64 Years | 0 (0.0%) | 0 (0.0%) |
| 65 to 74 Years | 8 (36.4%) | 0 (0.0%) |
| 75 Years and over | 0 (0.0%) | 0 (0.0%) |
Disability Class: Cognitive Difficulty
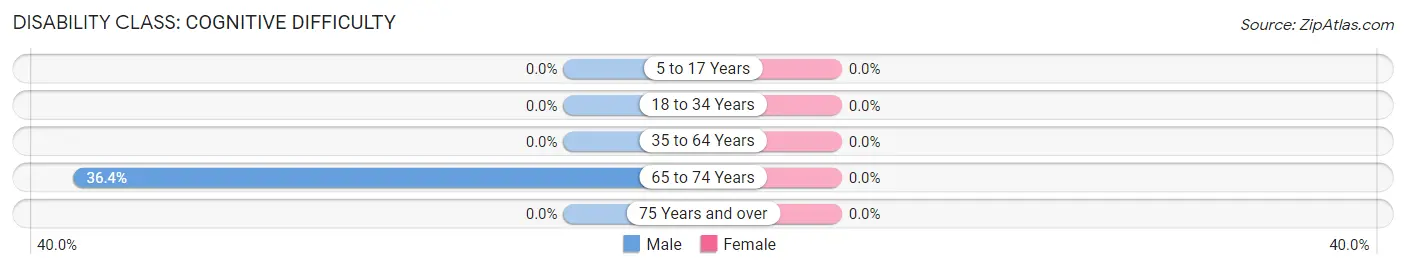
| Age Bracket | Male | Female |
| 5 to 17 Years | 0 (0.0%) | 0 (0.0%) |
| 18 to 34 Years | 0 (0.0%) | 0 (0.0%) |
| 35 to 64 Years | 0 (0.0%) | 0 (0.0%) |
| 65 to 74 Years | 8 (36.4%) | 0 (0.0%) |
| 75 Years and over | 0 (0.0%) | 0 (0.0%) |
Disability Class: Ambulatory Difficulty
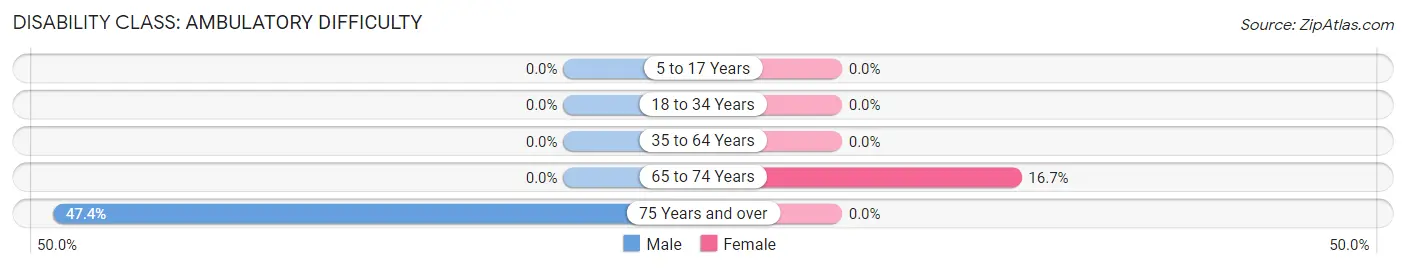
| Age Bracket | Male | Female |
| 5 to 17 Years | 0 (0.0%) | 0 (0.0%) |
| 18 to 34 Years | 0 (0.0%) | 0 (0.0%) |
| 35 to 64 Years | 0 (0.0%) | 0 (0.0%) |
| 65 to 74 Years | 0 (0.0%) | 6 (16.7%) |
| 75 Years and over | 9 (47.4%) | 0 (0.0%) |
Disability Class: Self-Care Difficulty
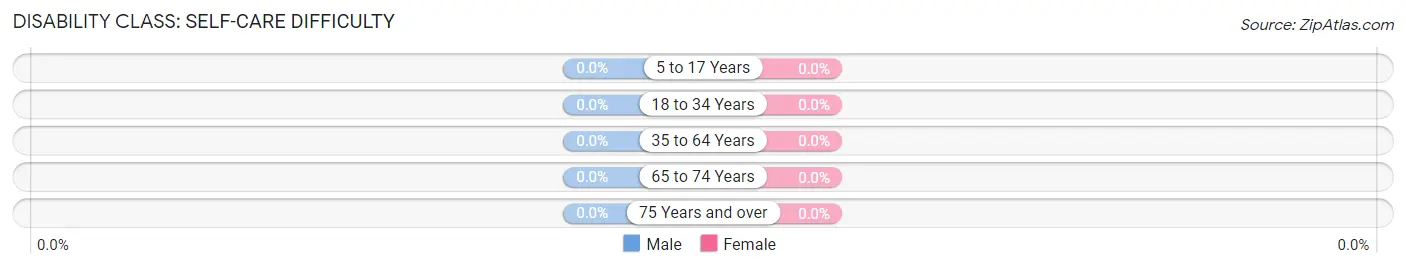
| Age Bracket | Male | Female |
| 5 to 17 Years | 0 (0.0%) | 0 (0.0%) |
| 18 to 34 Years | 0 (0.0%) | 0 (0.0%) |
| 35 to 64 Years | 0 (0.0%) | 0 (0.0%) |
| 65 to 74 Years | 0 (0.0%) | 0 (0.0%) |
| 75 Years and over | 0 (0.0%) | 0 (0.0%) |
Technology Access in Fairplay
Computing Device Access in Fairplay
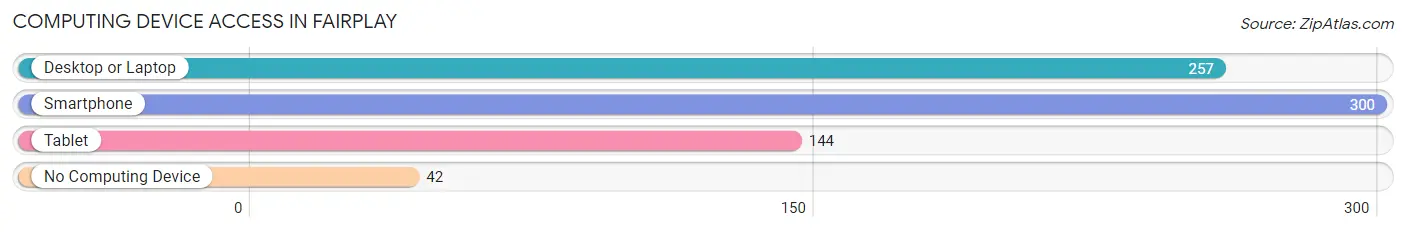
| Device Type | # Households | % Households |
| Desktop or Laptop | 257 | 75.1% |
| Smartphone | 300 | 87.7% |
| Tablet | 144 | 42.1% |
| No Computing Device | 42 | 12.3% |
| Total | 342 | 100.0% |
Internet Access in Fairplay
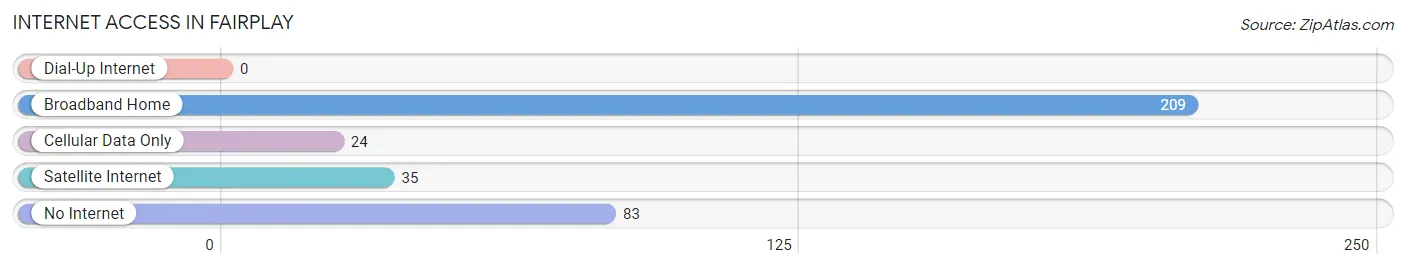
| Internet Type | # Households | % Households |
| Dial-Up Internet | 0 | 0.0% |
| Broadband Home | 209 | 61.1% |
| Cellular Data Only | 24 | 7.0% |
| Satellite Internet | 35 | 10.2% |
| No Internet | 83 | 24.3% |
| Total | 342 | 100.0% |
Fairplay Summary
History
The town of Fairplay, Colorado is located in Park County, in the heart of the Rocky Mountains. It is the county seat of Park County and is located at an elevation of 9,953 feet. The town was founded in 1859 during the Pike’s Peak Gold Rush and was originally known as South Park City. The town was renamed Fairplay in 1861, after the miners in the area agreed to abide by the rules of fair play.
The town of Fairplay was an important stop on the stagecoach route between Denver and Leadville. It was also a major supply center for the miners in the area. The town was home to several saloons, hotels, and stores. The town also had a newspaper, the South Park Times, which was published from 1859 to 1868.
In the late 1800s, the town of Fairplay began to decline as the gold rush ended and the population decreased. The town was nearly abandoned by the early 1900s. However, in the 1920s, the town began to experience a resurgence as tourists began to visit the area. The town was incorporated in 1929 and the population began to grow again.
Geography
Fairplay is located in the South Park Basin, which is surrounded by the Mosquito Range to the east, the Front Range to the west, and the Tenmile Range to the south. The town is located at an elevation of 9,953 feet and is the highest incorporated town in the United States.
The town is located in a semi-arid climate, with hot summers and cold winters. The average annual precipitation is only 12.5 inches, with most of the precipitation occurring in the form of snow. The average annual snowfall is over 100 inches.
Economy
The economy of Fairplay is largely based on tourism. The town is a popular destination for outdoor recreation, such as skiing, snowmobiling, and hiking. The town is also home to several restaurants, shops, and lodging establishments.
The town is also home to several mining operations, including gold, silver, and molybdenum. The town is also home to several cattle ranches and farms.
Demographics
As of the 2010 census, the town of Fairplay had a population of 668. The population is predominantly white (96.2%), with a small Hispanic population (2.7%). The median household income is $41,250, and the median home value is $220,000. The town has a poverty rate of 11.3%.
The town is served by the Park County School District, which includes one elementary school, one middle school, and one high school. The town is also home to several churches, including the Fairplay Community Church, the Fairplay United Methodist Church, and the Fairplay Baptist Church.
Common Questions
What is Per Capita Income in Fairplay?
Per Capita income in Fairplay is $44,129.
What is the Median Family Income in Fairplay?
Median Family Income in Fairplay is $96,071.
What is the Median Household income in Fairplay?
Median Household Income in Fairplay is $80,179.
What is Income or Wage Gap in Fairplay?
Income or Wage Gap in Fairplay is 7.3%.
Women in Fairplay earn 92.7 cents for every dollar earned by a man.
What is Inequality or Gini Index in Fairplay?
Inequality or Gini Index in Fairplay is 0.39.
What is the Total Population of Fairplay?
Total Population of Fairplay is 782.
What is the Total Male Population of Fairplay?
Total Male Population of Fairplay is 435.
What is the Total Female Population of Fairplay?
Total Female Population of Fairplay is 347.
What is the Ratio of Males per 100 Females in Fairplay?
There are 125.36 Males per 100 Females in Fairplay.
What is the Ratio of Females per 100 Males in Fairplay?
There are 79.77 Females per 100 Males in Fairplay.
What is the Median Population Age in Fairplay?
Median Population Age in Fairplay is 37.4 Years.
What is the Average Family Size in Fairplay
Average Family Size in Fairplay is 2.8 People.
What is the Average Household Size in Fairplay
Average Household Size in Fairplay is 2.3 People.
How Large is the Labor Force in Fairplay?
There are 555 People in the Labor Forcein in Fairplay.
What is the Percentage of People in the Labor Force in Fairplay?
81.9% of People are in the Labor Force in Fairplay.
What is the Unemployment Rate in Fairplay?
Unemployment Rate in Fairplay is 1.1%.