Zip Codes with the Highest Percentage of Population Employed in Food Preparation & Serving in Greeley, CO
RELATED REPORTS & OPTIONS
Food Preparation & Serving
Greeley
Compare Zip Codes
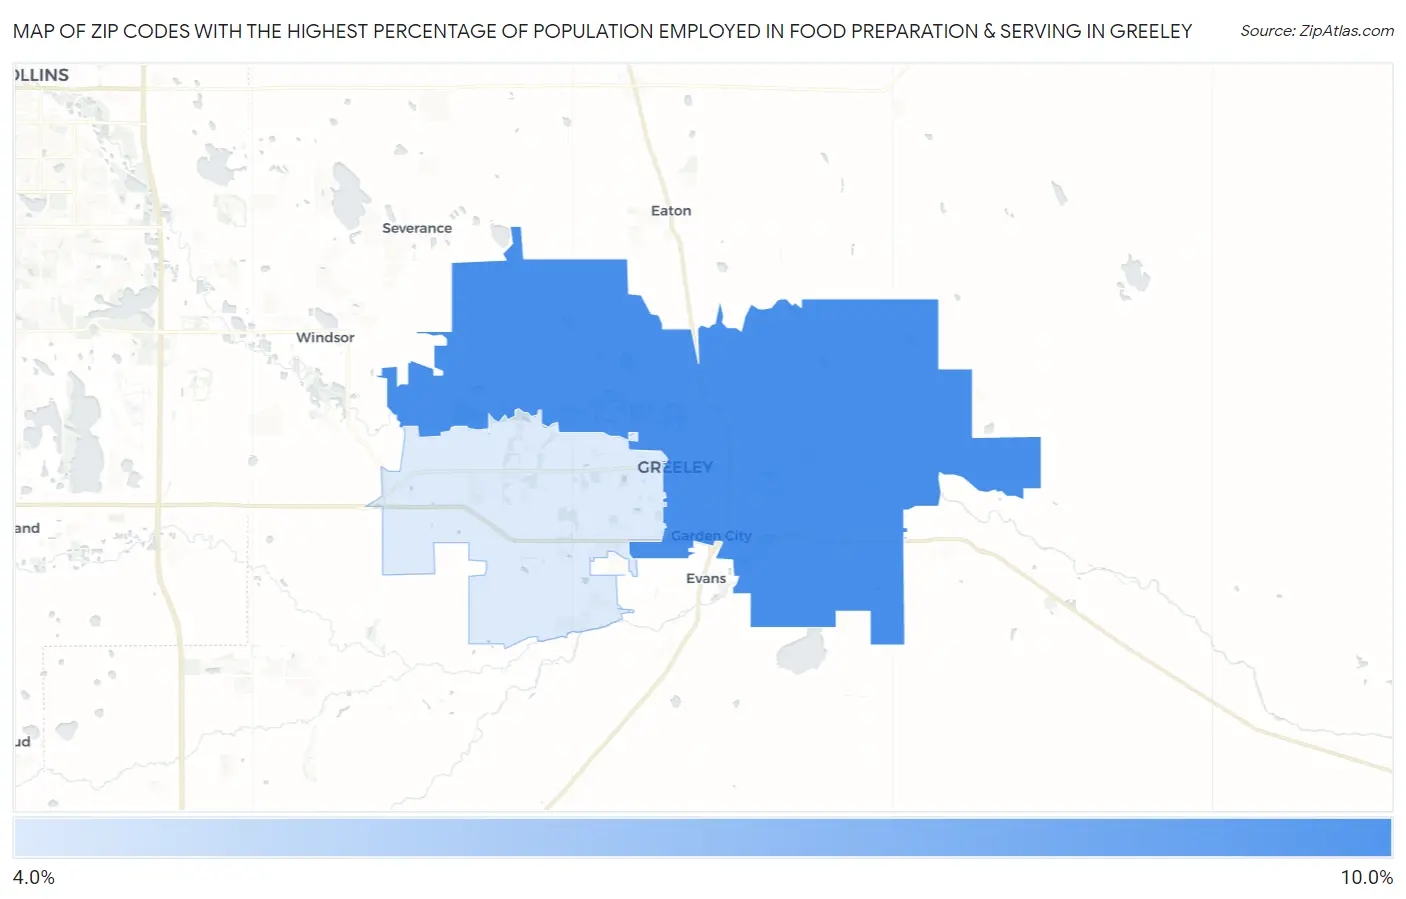
Map of Zip Codes with the Highest Percentage of Population Employed in Food Preparation & Serving in Greeley
4.9%
9.2%
Zip Codes with the Highest Percentage of Population Employed in Food Preparation & Serving in Greeley, CO
| Zip Code | % Employed | vs State | vs National | |
| 1. | 80631 | 9.2% | 5.2%(+3.99)#47 | 5.3%(+3.88)#3,355 |
| 2. | 80634 | 4.9% | 5.2%(-0.329)#207 | 5.3%(-0.433)#13,548 |
1
Common Questions
What are the Top Zip Codes with the Highest Percentage of Population Employed in Food Preparation & Serving in Greeley, CO?
Top Zip Codes with the Highest Percentage of Population Employed in Food Preparation & Serving in Greeley, CO are:
What zip code has the Highest Percentage of Population Employed in Food Preparation & Serving in Greeley, CO?
80631 has the Highest Percentage of Population Employed in Food Preparation & Serving in Greeley, CO with 9.2%.
What is the Percentage of Population Employed in Food Preparation & Serving in Greeley, CO?
Percentage of Population Employed in Food Preparation & Serving in Greeley is 7.0%.
What is the Percentage of Population Employed in Food Preparation & Serving in Colorado?
Percentage of Population Employed in Food Preparation & Serving in Colorado is 5.2%.
What is the Percentage of Population Employed in Food Preparation & Serving in the United States?
Percentage of Population Employed in Food Preparation & Serving in the United States is 5.3%.