Hartman, CO Map & Demographics
Hartman Map
Hartman Overview
$17,973
PER CAPITA INCOME
$48,750
AVG FAMILY INCOME
63.4%
WAGE / INCOME GAP [ % ]
36.6¢/ $1
WAGE / INCOME GAP [ $ ]
0.44
INEQUALITY / GINI INDEX
51
TOTAL POPULATION
32
MALE POPULATION
19
FEMALE POPULATION
168.42
MALES / 100 FEMALES
59.38
FEMALES / 100 MALES
44.1
MEDIAN AGE
3.4
AVG FAMILY SIZE
2.4
AVG HOUSEHOLD SIZE
24
LABOR FORCE [ PEOPLE ]
58.5%
PERCENT IN LABOR FORCE
Hartman Zip Codes
Hartman Area Codes
Income in Hartman
Income Overview in Hartman
| Characteristic | Number | Measure |
| Per Capita Income | 51 | $17,973 |
| Median Family Income | 12 | $48,750 |
| Mean Family Income | 12 | $42,975 |
| Median Household Income | 21 | $0 |
| Mean Household Income | 21 | $29,910 |
| Income Deficit | 12 | $0 |
| Wage / Income Gap (%) | 51 | 63.41% |
| Wage / Income Gap ($) | 51 | 36.59¢ per $1 |
| Gini / Inequality Index | 51 | 0.44 |
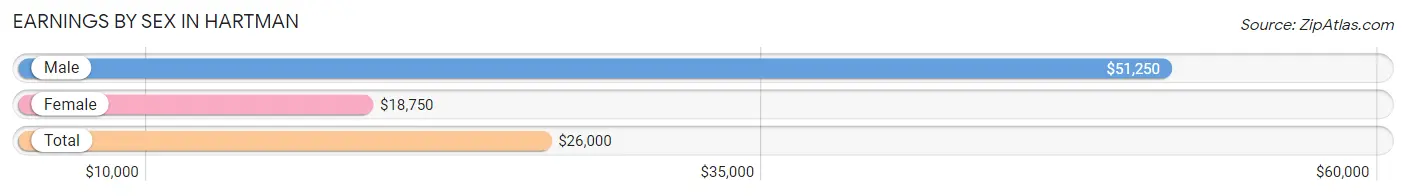
Earnings by Sex in Hartman
Average Earnings in Hartman are $26,000, $51,250 for men and $18,750 for women, a difference of 63.4%.
| Sex | Number | Average Earnings |
| Male | 13 (54.2%) | $51,250 |
| Female | 11 (45.8%) | $18,750 |
| Total | 24 (100.0%) | $26,000 |
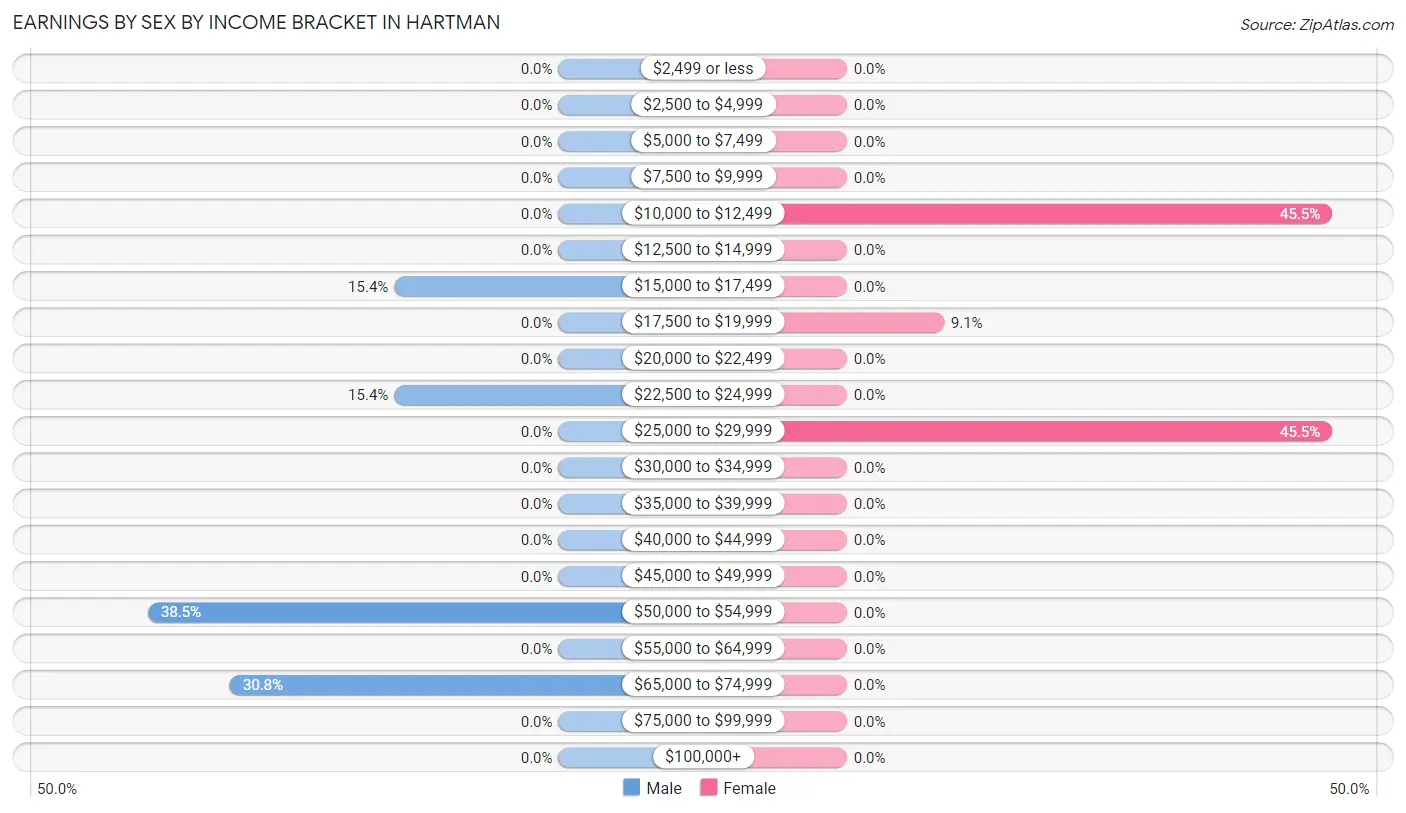
Earnings by Sex by Income Bracket in Hartman
The most common earnings brackets in Hartman are $50,000 to $54,999 for men (5 | 38.5%) and $10,000 to $12,499 for women (5 | 45.5%).
| Income | Male | Female |
| $2,499 or less | 0 (0.0%) | 0 (0.0%) |
| $2,500 to $4,999 | 0 (0.0%) | 0 (0.0%) |
| $5,000 to $7,499 | 0 (0.0%) | 0 (0.0%) |
| $7,500 to $9,999 | 0 (0.0%) | 0 (0.0%) |
| $10,000 to $12,499 | 0 (0.0%) | 5 (45.5%) |
| $12,500 to $14,999 | 0 (0.0%) | 0 (0.0%) |
| $15,000 to $17,499 | 2 (15.4%) | 0 (0.0%) |
| $17,500 to $19,999 | 0 (0.0%) | 1 (9.1%) |
| $20,000 to $22,499 | 0 (0.0%) | 0 (0.0%) |
| $22,500 to $24,999 | 2 (15.4%) | 0 (0.0%) |
| $25,000 to $29,999 | 0 (0.0%) | 5 (45.5%) |
| $30,000 to $34,999 | 0 (0.0%) | 0 (0.0%) |
| $35,000 to $39,999 | 0 (0.0%) | 0 (0.0%) |
| $40,000 to $44,999 | 0 (0.0%) | 0 (0.0%) |
| $45,000 to $49,999 | 0 (0.0%) | 0 (0.0%) |
| $50,000 to $54,999 | 5 (38.5%) | 0 (0.0%) |
| $55,000 to $64,999 | 0 (0.0%) | 0 (0.0%) |
| $65,000 to $74,999 | 4 (30.8%) | 0 (0.0%) |
| $75,000 to $99,999 | 0 (0.0%) | 0 (0.0%) |
| $100,000+ | 0 (0.0%) | 0 (0.0%) |
| Total | 13 (100.0%) | 11 (100.0%) |
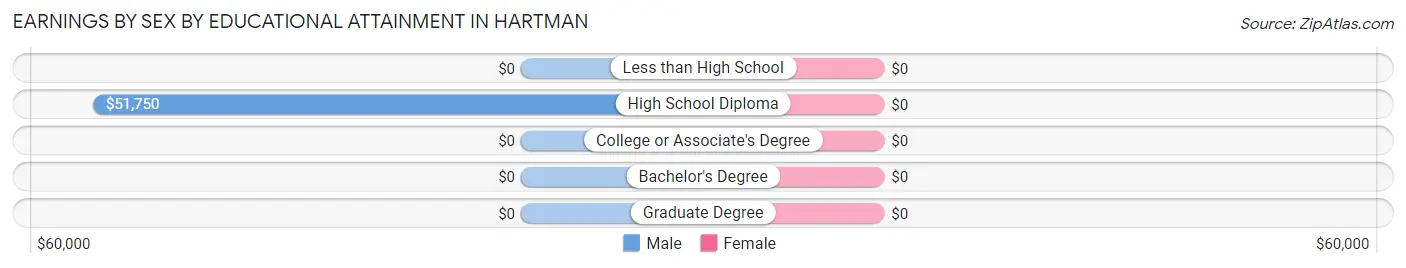
Earnings by Sex by Educational Attainment in Hartman
| Educational Attainment | Male Income | Female Income |
| Less than High School | - | - |
| High School Diploma | $51,750 | $0 |
| College or Associate's Degree | - | - |
| Bachelor's Degree | - | - |
| Graduate Degree | - | - |
| Total | $51,250 | $18,750 |
Family Income in Hartman
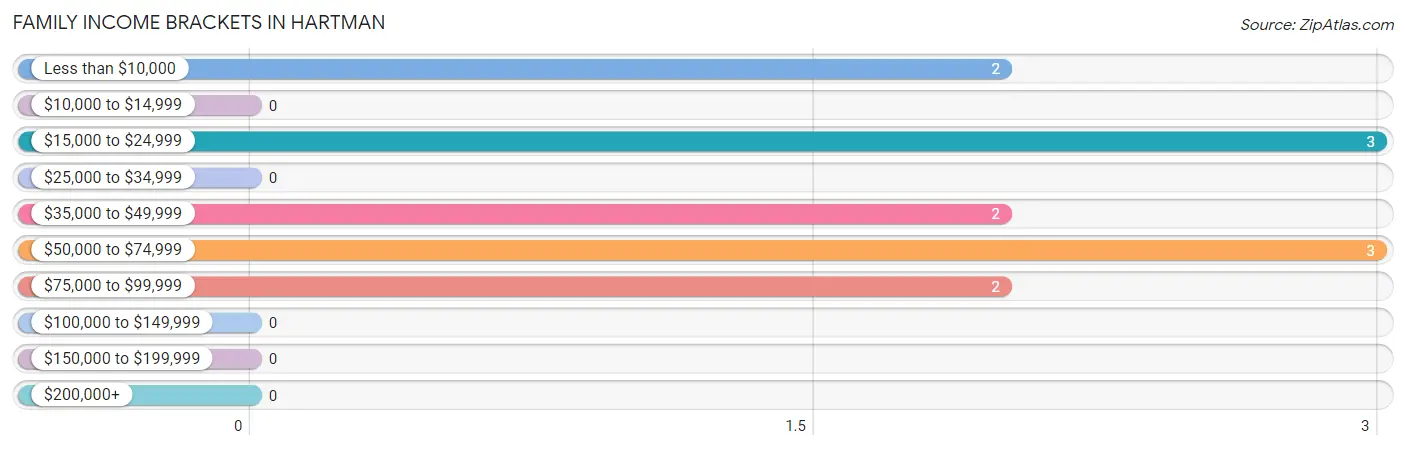
Family Income Brackets in Hartman
According to the Hartman family income data, there are 3 families falling into the $15,000 to $24,999 income range, which is the most common income bracket and makes up 25.0% of all families.
| Income Bracket | # Families | % Families |
| Less than $10,000 | 2 | 16.7% |
| $10,000 to $14,999 | 0 | 0.0% |
| $15,000 to $24,999 | 3 | 25.0% |
| $25,000 to $34,999 | 0 | 0.0% |
| $35,000 to $49,999 | 2 | 16.7% |
| $50,000 to $74,999 | 3 | 25.0% |
| $75,000 to $99,999 | 2 | 16.7% |
| $100,000 to $149,999 | 0 | 0.0% |
| $150,000 to $199,999 | 0 | 0.0% |
| $200,000+ | 0 | 0.0% |
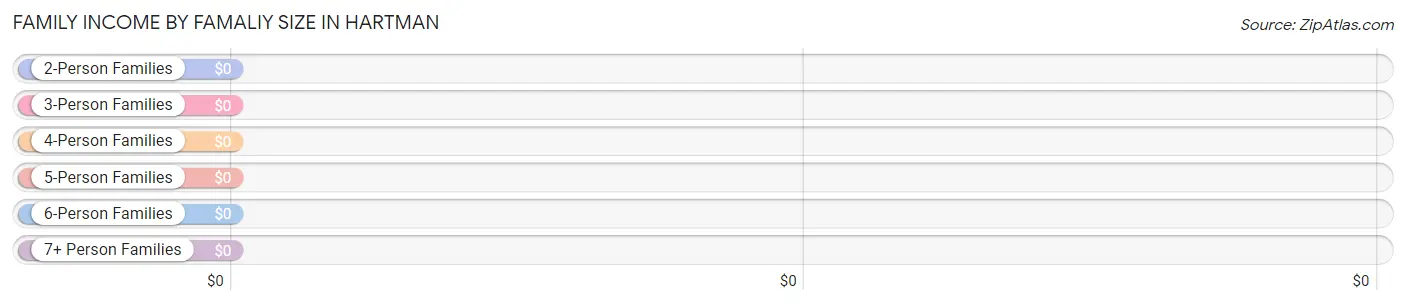
Family Income by Famaliy Size in Hartman
| Income Bracket | # Families | Median Income |
| 2-Person Families | 4 (33.3%) | $0 |
| 3-Person Families | 3 (25.0%) | $0 |
| 4-Person Families | 3 (25.0%) | $0 |
| 5-Person Families | 2 (16.7%) | $0 |
| 6-Person Families | 0 (0.0%) | $0 |
| 7+ Person Families | 0 (0.0%) | $0 |
| Total | 12 (100.0%) | $48,750 |
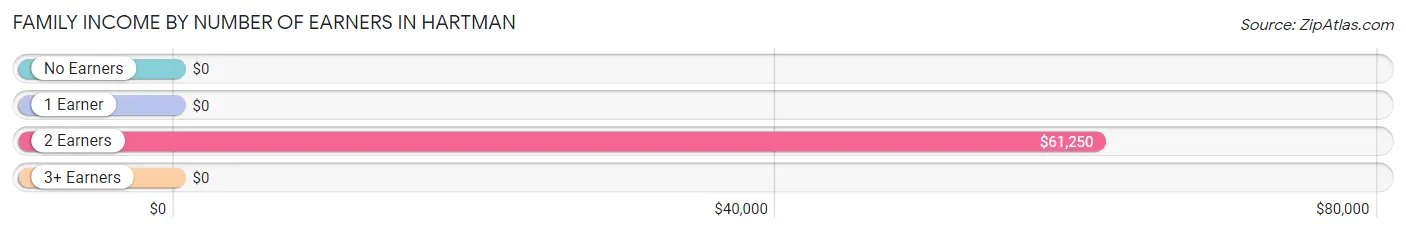
Family Income by Number of Earners in Hartman
| Number of Earners | # Families | Median Income |
| No Earners | 2 (16.7%) | $0 |
| 1 Earner | 3 (25.0%) | $0 |
| 2 Earners | 7 (58.3%) | $61,250 |
| 3+ Earners | 0 (0.0%) | $0 |
| Total | 12 (100.0%) | $48,750 |
Household Income in Hartman
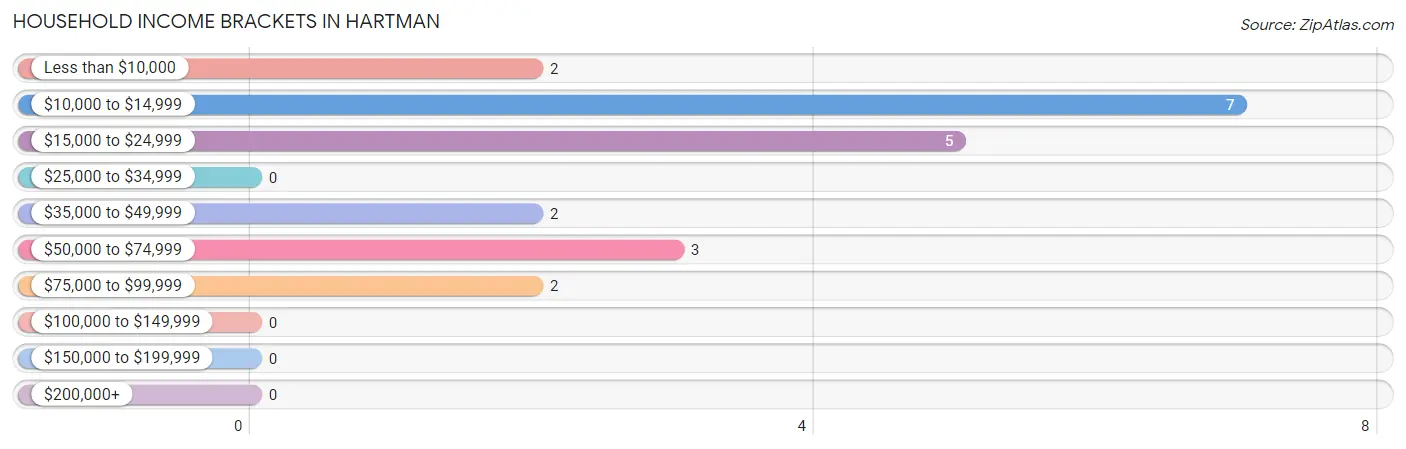
Household Income Brackets in Hartman
With 7 households falling in the category, the $10,000 to $14,999 income range is the most frequent in Hartman, accounting for 33.3% of all households.
| Income Bracket | # Households | % Households |
| Less than $10,000 | 2 | 9.5% |
| $10,000 to $14,999 | 7 | 33.3% |
| $15,000 to $24,999 | 5 | 23.8% |
| $25,000 to $34,999 | 0 | 0.0% |
| $35,000 to $49,999 | 2 | 9.5% |
| $50,000 to $74,999 | 3 | 14.3% |
| $75,000 to $99,999 | 2 | 9.5% |
| $100,000 to $149,999 | 0 | 0.0% |
| $150,000 to $199,999 | 0 | 0.0% |
| $200,000+ | 0 | 0.0% |
Household Income by Householder Age in Hartman
| Income Bracket | # Households | Median Income |
| 15 to 24 Years | 0 (0.0%) | $0 |
| 25 to 44 Years | 5 (23.8%) | $0 |
| 45 to 64 Years | 16 (76.2%) | $0 |
| 65+ Years | 0 (0.0%) | $0 |
| Total | 21 (100.0%) | $0 |
Poverty in Hartman
Income Below Poverty by Sex and Age in Hartman
With 31.2% poverty level for males and 36.8% for females among the residents of Hartman, 55 to 64 year old males and 18 to 24 year old females are the most vulnerable to poverty, with 8 males (66.7%) and 1 females (100.0%) in their respective age groups living below the poverty level.
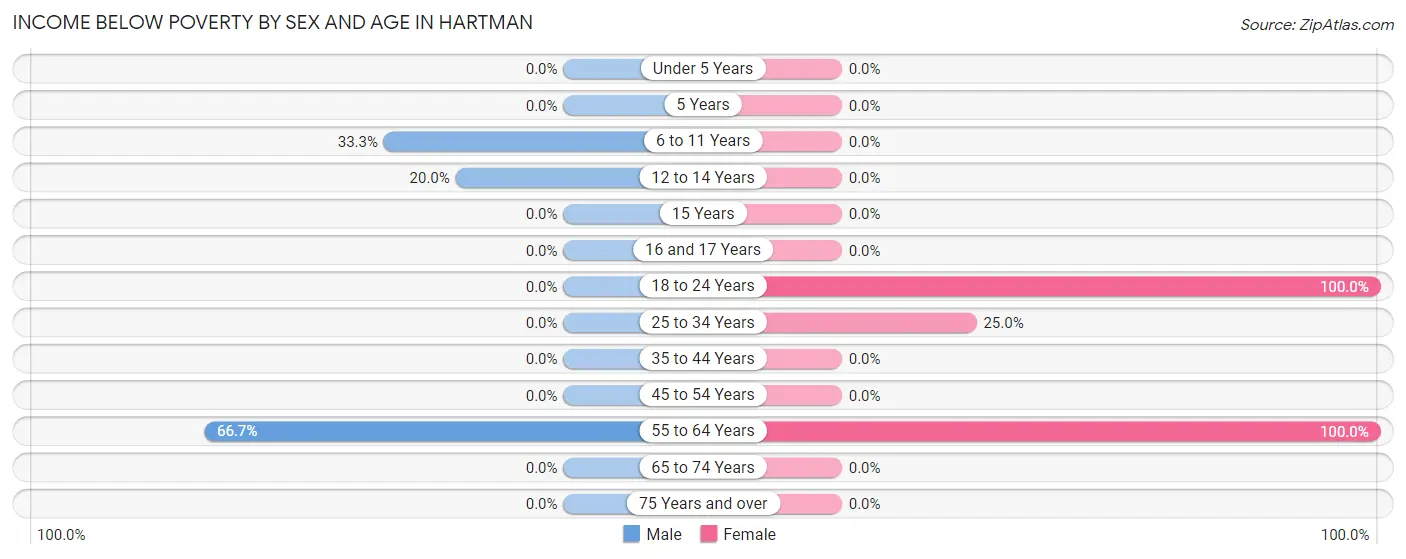
| Age Bracket | Male | Female |
| Under 5 Years | 0 (0.0%) | 0 (0.0%) |
| 5 Years | 0 (0.0%) | 0 (0.0%) |
| 6 to 11 Years | 1 (33.3%) | 0 (0.0%) |
| 12 to 14 Years | 1 (20.0%) | 0 (0.0%) |
| 15 Years | 0 (0.0%) | 0 (0.0%) |
| 16 and 17 Years | 0 (0.0%) | 0 (0.0%) |
| 18 to 24 Years | 0 (0.0%) | 1 (100.0%) |
| 25 to 34 Years | 0 (0.0%) | 1 (25.0%) |
| 35 to 44 Years | 0 (0.0%) | 0 (0.0%) |
| 45 to 54 Years | 0 (0.0%) | 0 (0.0%) |
| 55 to 64 Years | 8 (66.7%) | 5 (100.0%) |
| 65 to 74 Years | 0 (0.0%) | 0 (0.0%) |
| 75 Years and over | 0 (0.0%) | 0 (0.0%) |
| Total | 10 (31.2%) | 7 (36.8%) |
Income Above Poverty by Sex and Age in Hartman
According to the poverty statistics in Hartman, males aged 18 to 24 years and females aged 12 to 14 years are the age groups that are most secure financially, with 100.0% of males and 100.0% of females in these age groups living above the poverty line.
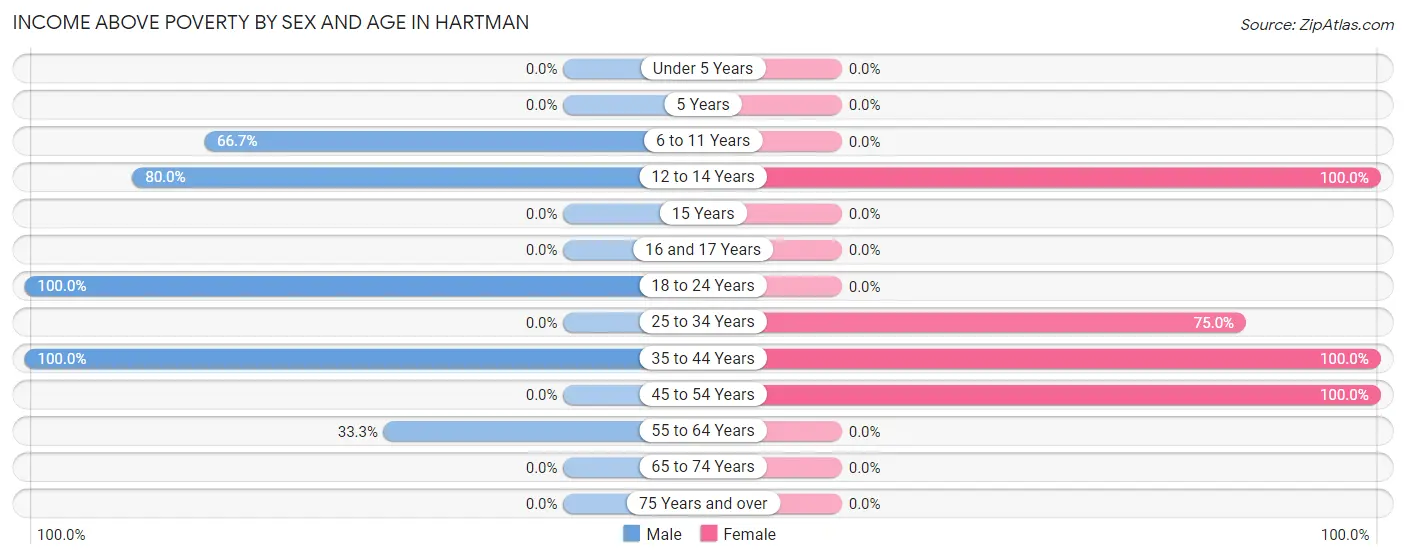
| Age Bracket | Male | Female |
| Under 5 Years | 0 (0.0%) | 0 (0.0%) |
| 5 Years | 0 (0.0%) | 0 (0.0%) |
| 6 to 11 Years | 2 (66.7%) | 0 (0.0%) |
| 12 to 14 Years | 4 (80.0%) | 2 (100.0%) |
| 15 Years | 0 (0.0%) | 0 (0.0%) |
| 16 and 17 Years | 0 (0.0%) | 0 (0.0%) |
| 18 to 24 Years | 3 (100.0%) | 0 (0.0%) |
| 25 to 34 Years | 0 (0.0%) | 3 (75.0%) |
| 35 to 44 Years | 9 (100.0%) | 2 (100.0%) |
| 45 to 54 Years | 0 (0.0%) | 5 (100.0%) |
| 55 to 64 Years | 4 (33.3%) | 0 (0.0%) |
| 65 to 74 Years | 0 (0.0%) | 0 (0.0%) |
| 75 Years and over | 0 (0.0%) | 0 (0.0%) |
| Total | 22 (68.8%) | 12 (63.2%) |
Income Below Poverty Among Married-Couple Families in Hartman
The poverty statistics for married-couple families in Hartman show that 22.2% or 2 of the total 9 families live below the poverty line. Families with no children have the highest poverty rate of 50.0%, comprising of 2 families. On the other hand, families with 1 or 2 children have the lowest poverty rate of 0.0%, which includes 0 families.
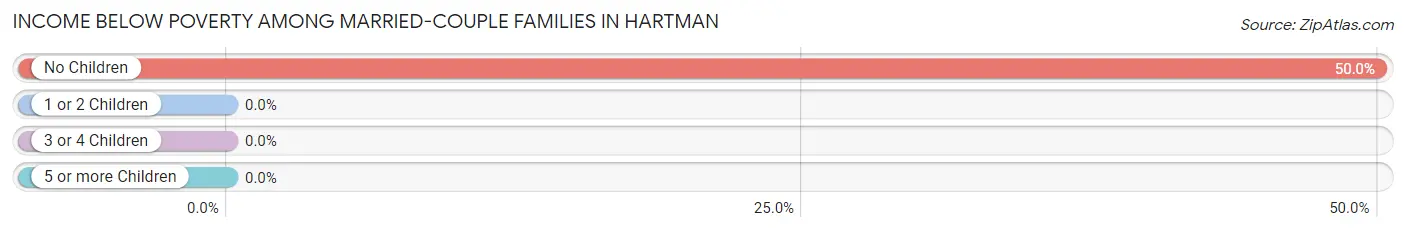
| Children | Above Poverty | Below Poverty |
| No Children | 2 (50.0%) | 2 (50.0%) |
| 1 or 2 Children | 5 (100.0%) | 0 (0.0%) |
| 3 or 4 Children | 0 (0.0%) | 0 (0.0%) |
| 5 or more Children | 0 (0.0%) | 0 (0.0%) |
| Total | 7 (77.8%) | 2 (22.2%) |
Income Below Poverty Among Single-Parent Households in Hartman
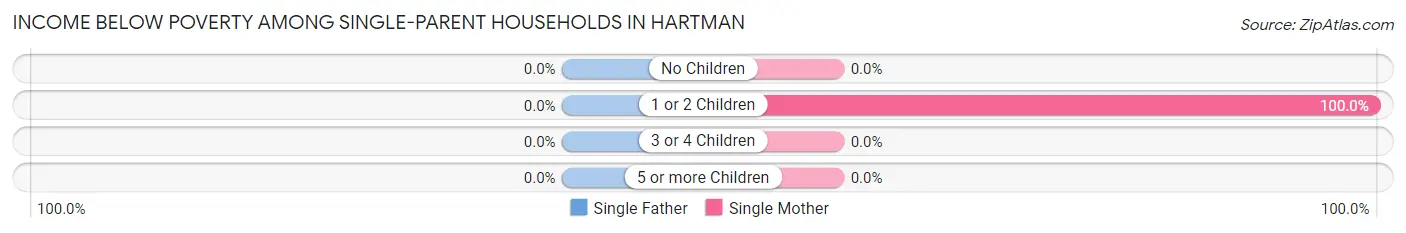
| Children | Single Father | Single Mother |
| No Children | 0 (0.0%) | 0 (0.0%) |
| 1 or 2 Children | 0 (0.0%) | 3 (100.0%) |
| 3 or 4 Children | 0 (0.0%) | 0 (0.0%) |
| 5 or more Children | 0 (0.0%) | 0 (0.0%) |
| Total | 0 (0.0%) | 3 (100.0%) |
Income Below Poverty Among Married-Couple vs Single-Parent Households in Hartman
The poverty data for Hartman shows that 2 of the married-couple family households (22.2%) and 3 of the single-parent households (100.0%) are living below the poverty level. Within the married-couple family households, those with no children have the highest poverty rate, with 2 households (50.0%) falling below the poverty line. Among the single-parent households, those with 1 or 2 children have the highest poverty rate, with 3 household (100.0%) living below poverty.
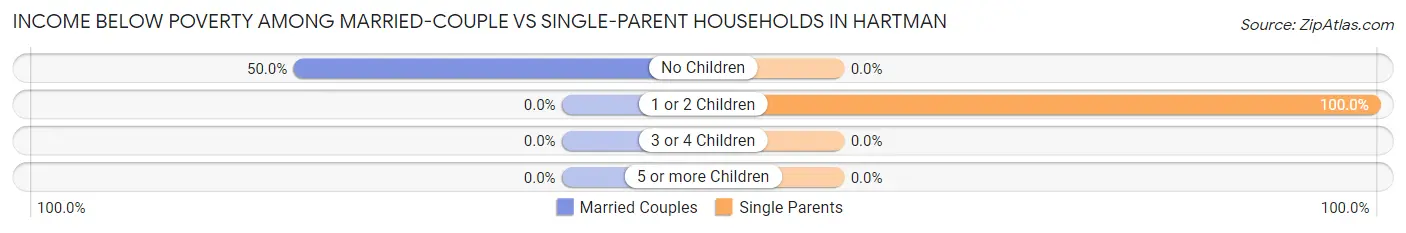
| Children | Married-Couple Families | Single-Parent Households |
| No Children | 2 (50.0%) | 0 (0.0%) |
| 1 or 2 Children | 0 (0.0%) | 3 (100.0%) |
| 3 or 4 Children | 0 (0.0%) | 0 (0.0%) |
| 5 or more Children | 0 (0.0%) | 0 (0.0%) |
| Total | 2 (22.2%) | 3 (100.0%) |
Race in Hartman
The most populous races in Hartman are White / Caucasian (48 | 94.1%), Hispanic or Latino (10 | 19.6%), and Two or more Races (3 | 5.9%).
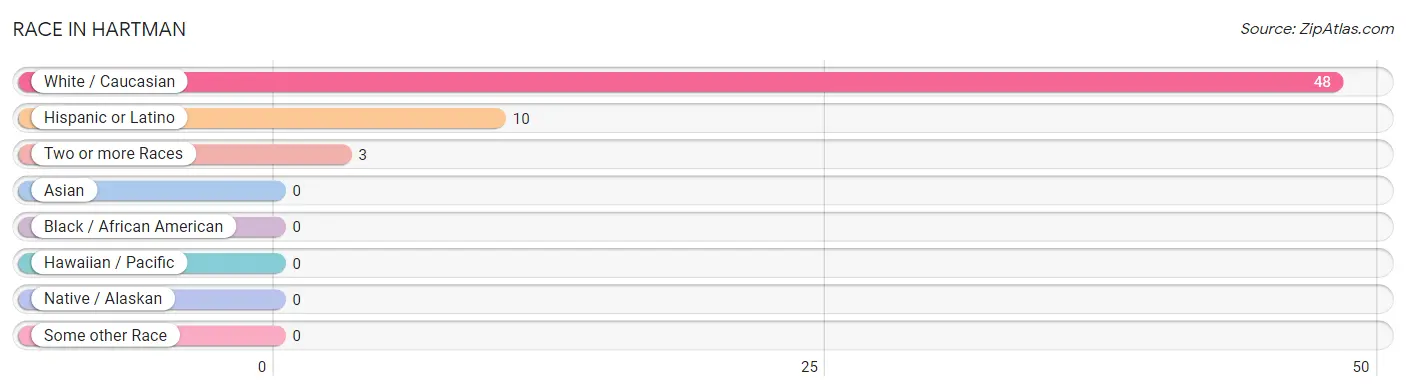
| Race | # Population | % Population |
| Asian | 0 | 0.0% |
| Black / African American | 0 | 0.0% |
| Hawaiian / Pacific | 0 | 0.0% |
| Hispanic or Latino | 10 | 19.6% |
| Native / Alaskan | 0 | 0.0% |
| White / Caucasian | 48 | 94.1% |
| Two or more Races | 3 | 5.9% |
| Some other Race | 0 | 0.0% |
| Total | 51 | 100.0% |
Ancestry in Hartman
The most populous ancestries reported in Hartman are Mexican (10 | 19.6%), European (6 | 11.8%), American (3 | 5.9%), Potawatomi (3 | 5.9%), and German (2 | 3.9%), together accounting for 47.1% of all Hartman residents.
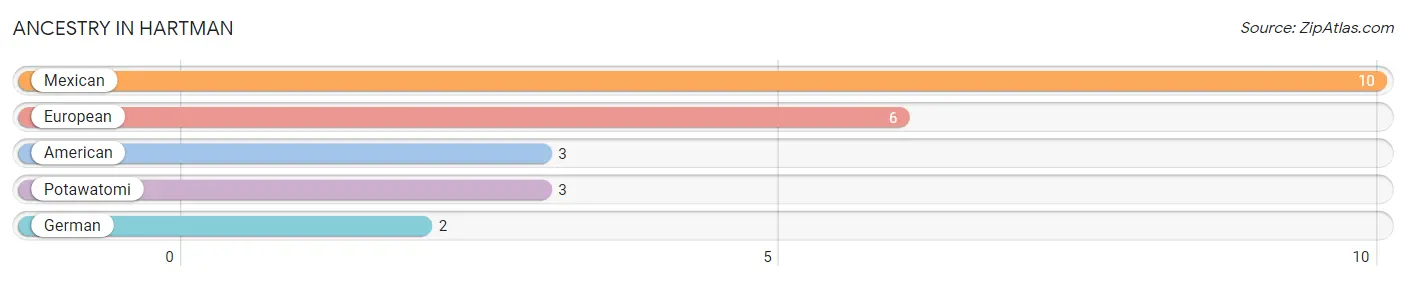
| Ancestry | # Population | % Population |
| American | 3 | 5.9% |
| European | 6 | 11.8% |
| German | 2 | 3.9% |
| Mexican | 10 | 19.6% |
| Potawatomi | 3 | 5.9% | View All 5 Rows |
Immigrants in Hartman

| Immigration Origin | # Population | % Population | View All 0 Rows |
Sex and Age in Hartman
Sex and Age in Hartman
The most populous age groups in Hartman are 55 to 59 Years (12 | 37.5%) for men and 50 to 54 Years (5 | 26.3%) for women.
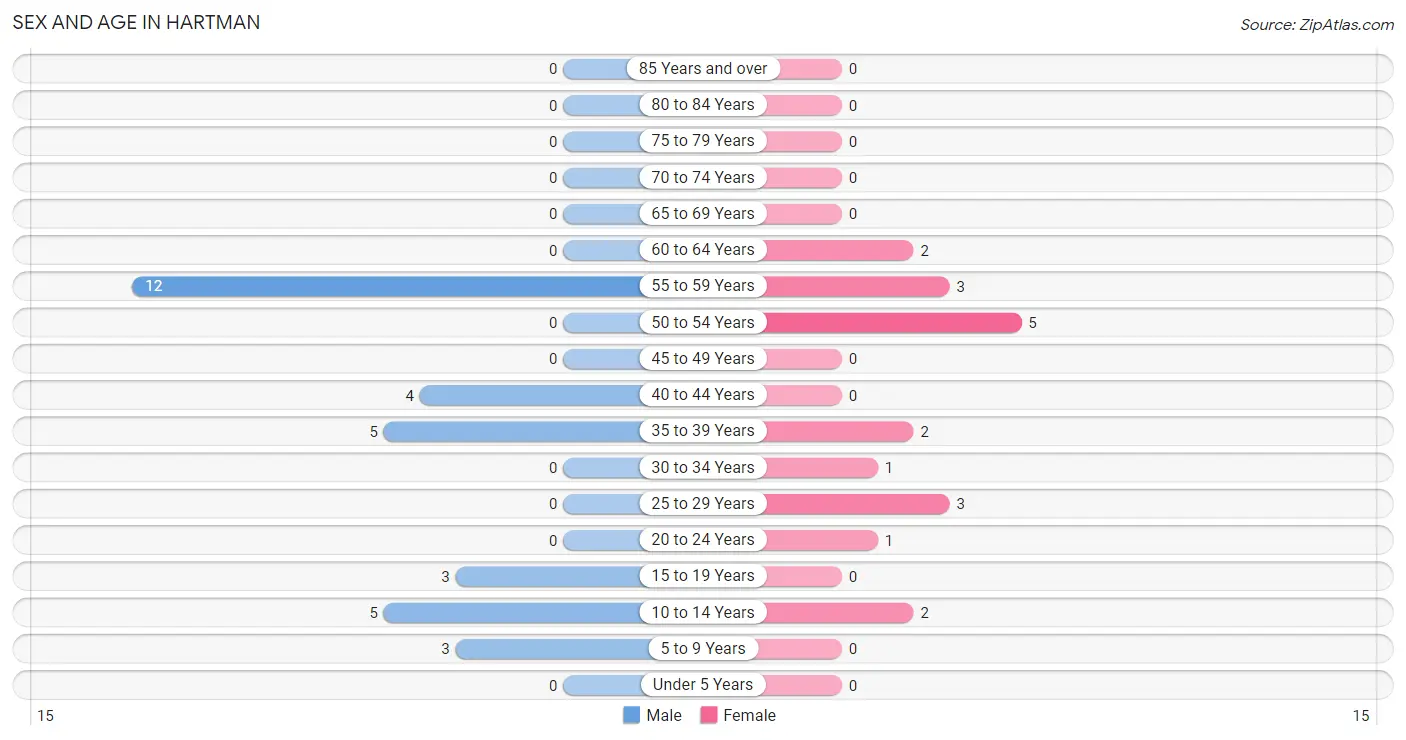
| Age Bracket | Male | Female |
| Under 5 Years | 0 (0.0%) | 0 (0.0%) |
| 5 to 9 Years | 3 (9.4%) | 0 (0.0%) |
| 10 to 14 Years | 5 (15.6%) | 2 (10.5%) |
| 15 to 19 Years | 3 (9.4%) | 0 (0.0%) |
| 20 to 24 Years | 0 (0.0%) | 1 (5.3%) |
| 25 to 29 Years | 0 (0.0%) | 3 (15.8%) |
| 30 to 34 Years | 0 (0.0%) | 1 (5.3%) |
| 35 to 39 Years | 5 (15.6%) | 2 (10.5%) |
| 40 to 44 Years | 4 (12.5%) | 0 (0.0%) |
| 45 to 49 Years | 0 (0.0%) | 0 (0.0%) |
| 50 to 54 Years | 0 (0.0%) | 5 (26.3%) |
| 55 to 59 Years | 12 (37.5%) | 3 (15.8%) |
| 60 to 64 Years | 0 (0.0%) | 2 (10.5%) |
| 65 to 69 Years | 0 (0.0%) | 0 (0.0%) |
| 70 to 74 Years | 0 (0.0%) | 0 (0.0%) |
| 75 to 79 Years | 0 (0.0%) | 0 (0.0%) |
| 80 to 84 Years | 0 (0.0%) | 0 (0.0%) |
| 85 Years and over | 0 (0.0%) | 0 (0.0%) |
| Total | 32 (100.0%) | 19 (100.0%) |
Families and Households in Hartman
Median Family Size in Hartman
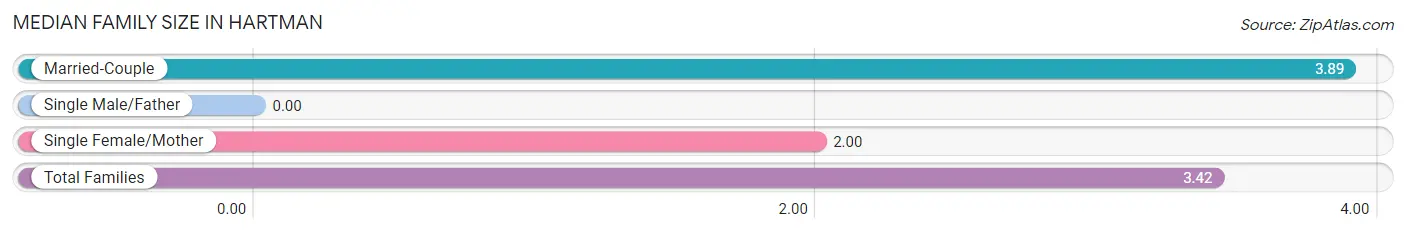
| Family Type | # Families | Family Size |
| Married-Couple | 9 (75.0%) | 3.89 |
| Single Male/Father | 0 (0.0%) | - |
| Single Female/Mother | 3 (25.0%) | 2.00 |
| Total Families | 12 (100.0%) | 3.42 |
Median Household Size in Hartman
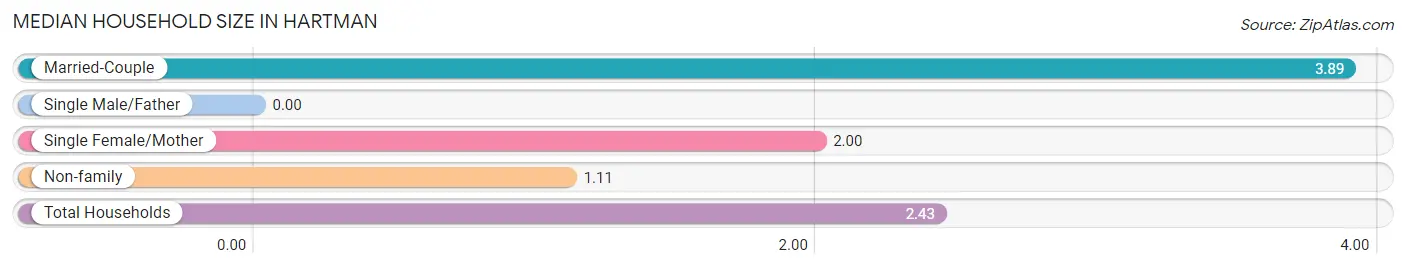
| Household Type | # Households | Household Size |
| Married-Couple | 9 (42.9%) | 3.89 |
| Single Male/Father | 0 (0.0%) | - |
| Single Female/Mother | 3 (14.3%) | 2.00 |
| Non-family | 9 (42.9%) | 1.11 |
| Total Households | 21 (100.0%) | 2.43 |
Household Size by Marriage Status in Hartman
Out of a total of 21 households in Hartman, 12 (57.1%) are family households, while 9 (42.9%) are nonfamily households. The most numerous type of family households are 2-person households, comprising 4, and the most common type of nonfamily households are 1-person households, comprising 7.
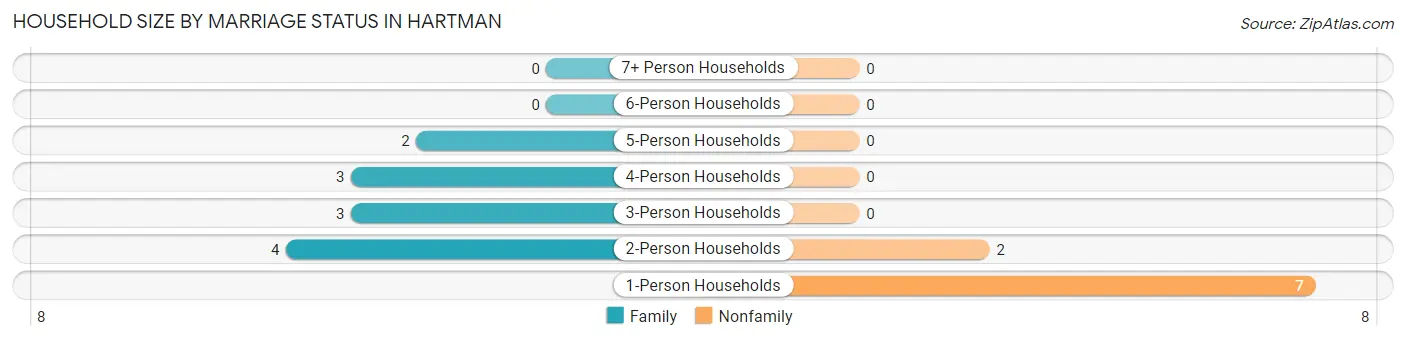
| Household Size | Family Households | Nonfamily Households |
| 1-Person Households | - | 7 (33.3%) |
| 2-Person Households | 4 (19.1%) | 2 (9.5%) |
| 3-Person Households | 3 (14.3%) | 0 (0.0%) |
| 4-Person Households | 3 (14.3%) | 0 (0.0%) |
| 5-Person Households | 2 (9.5%) | 0 (0.0%) |
| 6-Person Households | 0 (0.0%) | 0 (0.0%) |
| 7+ Person Households | 0 (0.0%) | 0 (0.0%) |
| Total | 12 (57.1%) | 9 (42.9%) |
Female Fertility in Hartman
Fertility by Age in Hartman
| Age Bracket | Women with Births | Births / 1,000 Women |
| 15 to 19 years | 0 (0.0%) | 0.0 |
| 20 to 34 years | 0 (0.0%) | 0.0 |
| 35 to 50 years | 0 (0.0%) | 0.0 |
| Total | 0 (0.0%) | 0.0 |
Fertility by Age by Marriage Status in Hartman
| Age Bracket | Married | Unmarried |
| 15 to 19 years | 0 (0.0%) | 0 (0.0%) |
| 20 to 34 years | 0 (0.0%) | 0 (0.0%) |
| 35 to 50 years | 0 (0.0%) | 0 (0.0%) |
| Total | 0 (0.0%) | 0 (0.0%) |
Fertility by Education in Hartman
| Educational Attainment | Women with Births | Births / 1,000 Women |
| Less than High School | 0 (0.0%) | 0.0 |
| High School Diploma | 0 (0.0%) | 0.0 |
| College or Associate's Degree | 0 (0.0%) | 0.0 |
| Bachelor's Degree | 0 (0.0%) | 0.0 |
| Graduate Degree | 0 (0.0%) | 0.0 |
| Total | 0 (0.0%) | 0.0 |
Fertility by Education by Marriage Status in Hartman
| Educational Attainment | Married | Unmarried |
| Less than High School | 0 (0.0%) | 0 (0.0%) |
| High School Diploma | 0 (0.0%) | 0 (0.0%) |
| College or Associate's Degree | 0 (0.0%) | 0 (0.0%) |
| Bachelor's Degree | 0 (0.0%) | 0 (0.0%) |
| Graduate Degree | 0 (0.0%) | 0 (0.0%) |
| Total | 0 (0.0%) | 0 (0.0%) |
Employment Characteristics in Hartman
Employment by Class of Employer in Hartman
Among the 24 employed individuals in Hartman, private company employees (12 | 50.0%), local government employees (5 | 20.8%), and self-employed (not incorporated) (4 | 16.7%) make up the most common classes of employment.
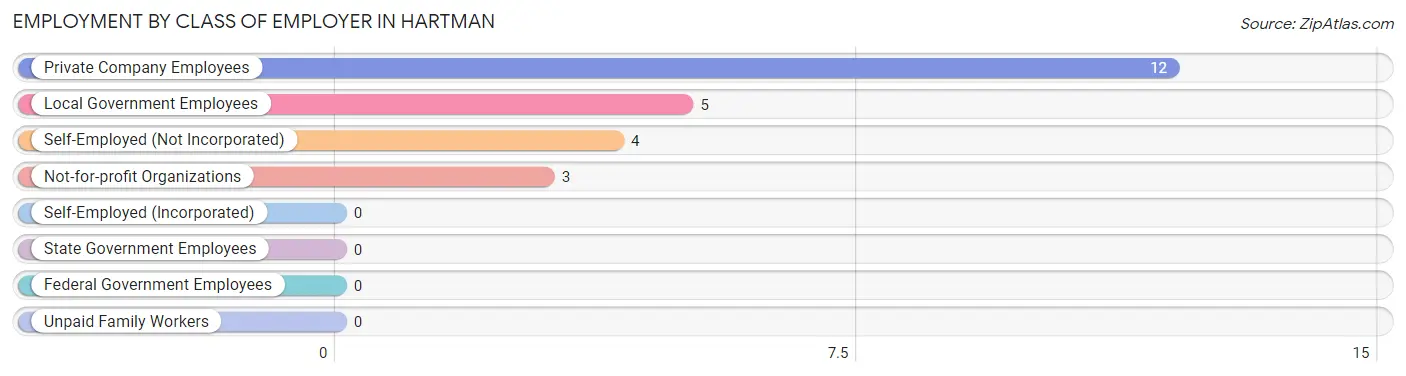
| Employer Class | # Employees | % Employees |
| Private Company Employees | 12 | 50.0% |
| Self-Employed (Incorporated) | 0 | 0.0% |
| Self-Employed (Not Incorporated) | 4 | 16.7% |
| Not-for-profit Organizations | 3 | 12.5% |
| Local Government Employees | 5 | 20.8% |
| State Government Employees | 0 | 0.0% |
| Federal Government Employees | 0 | 0.0% |
| Unpaid Family Workers | 0 | 0.0% |
| Total | 24 | 100.0% |
Employment Status by Age in Hartman
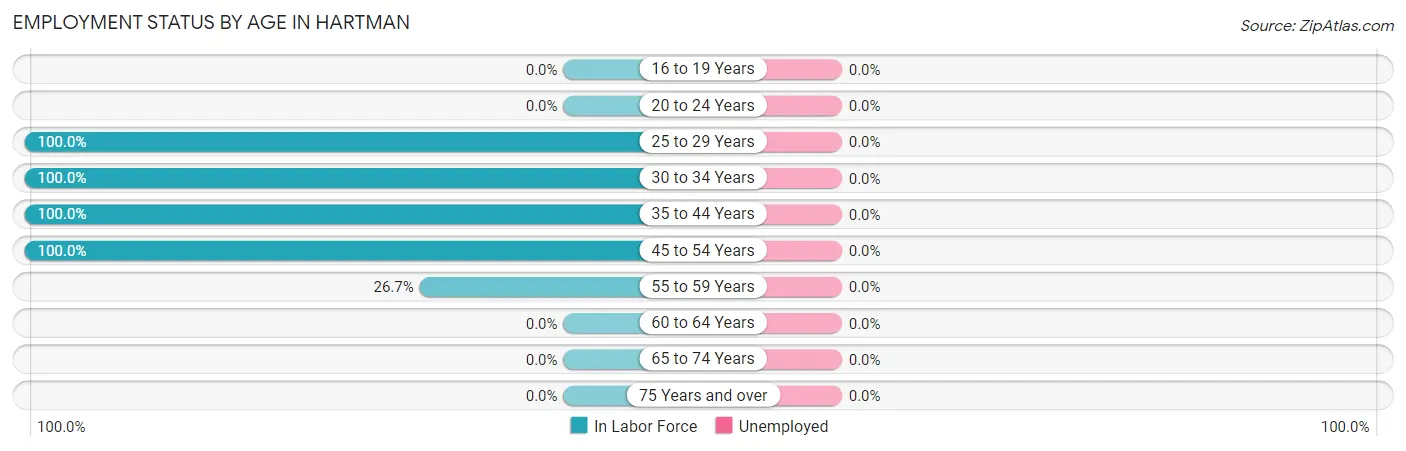
| Age Bracket | In Labor Force | Unemployed |
| 16 to 19 Years | 0 (0.0%) | 0 (0.0%) |
| 20 to 24 Years | 0 (0.0%) | 0 (0.0%) |
| 25 to 29 Years | 3 (100.0%) | 0 (0.0%) |
| 30 to 34 Years | 1 (100.0%) | 0 (0.0%) |
| 35 to 44 Years | 11 (100.0%) | 0 (0.0%) |
| 45 to 54 Years | 5 (100.0%) | 0 (0.0%) |
| 55 to 59 Years | 4 (26.7%) | 0 (0.0%) |
| 60 to 64 Years | 0 (0.0%) | 0 (0.0%) |
| 65 to 74 Years | 0 (0.0%) | 0 (0.0%) |
| 75 Years and over | 0 (0.0%) | 0 (0.0%) |
| Total | 24 (58.5%) | 0 (0.0%) |
Employment Status by Educational Attainment in Hartman
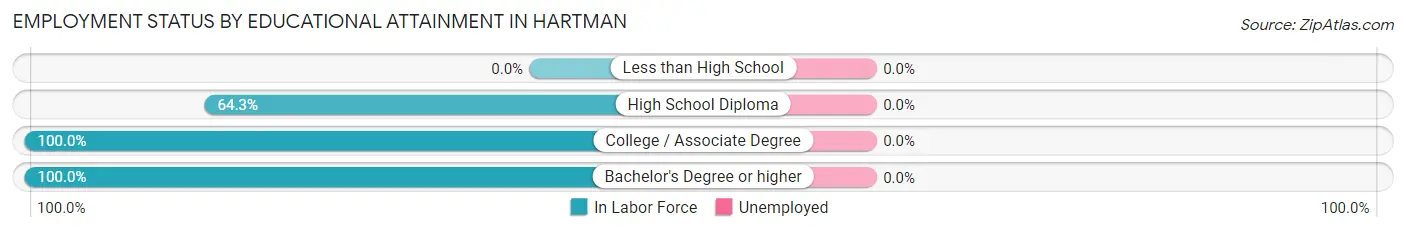
| Educational Attainment | In Labor Force | Unemployed |
| Less than High School | 0 (0.0%) | 0 (0.0%) |
| High School Diploma | 18 (64.3%) | 0 (0.0%) |
| College / Associate Degree | 3 (100.0%) | 0 (0.0%) |
| Bachelor's Degree or higher | 3 (100.0%) | 0 (0.0%) |
| Total | 24 (64.9%) | 0 (0.0%) |
Employment Occupations by Sex in Hartman
Management, Business, Science and Arts Occupations
The most common Management, Business, Science and Arts occupations in Hartman are Health Diagnosing & Treating (3 | 12.5%), and Management (2 | 8.3%).
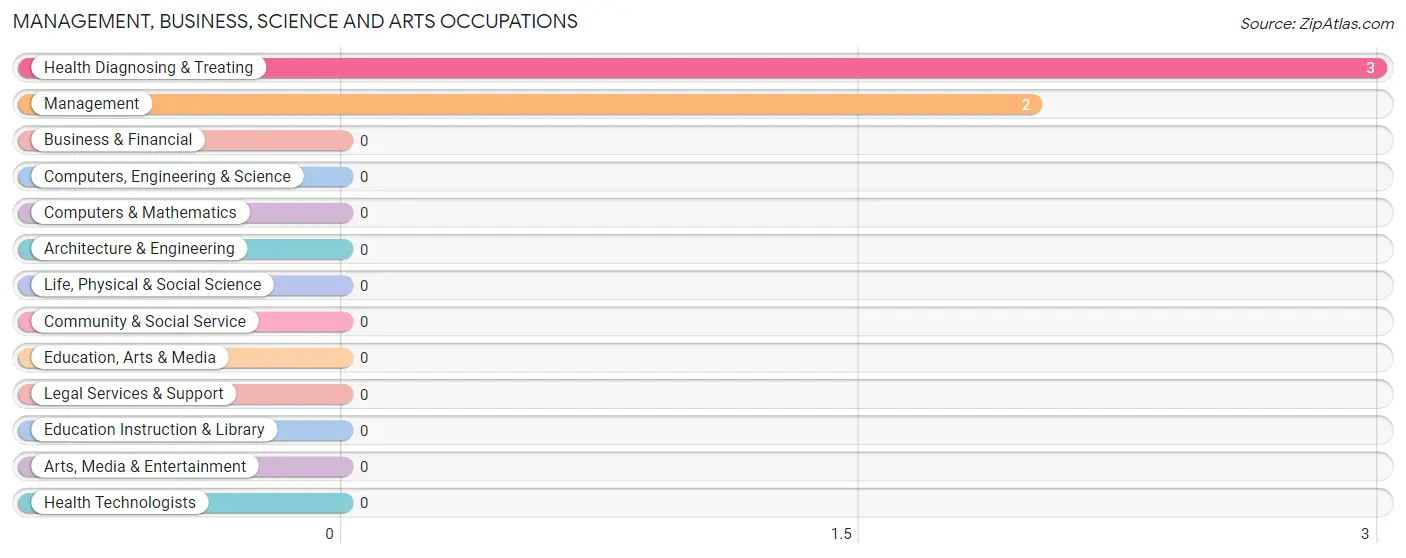
Management, Business, Science and Arts Occupations by Sex
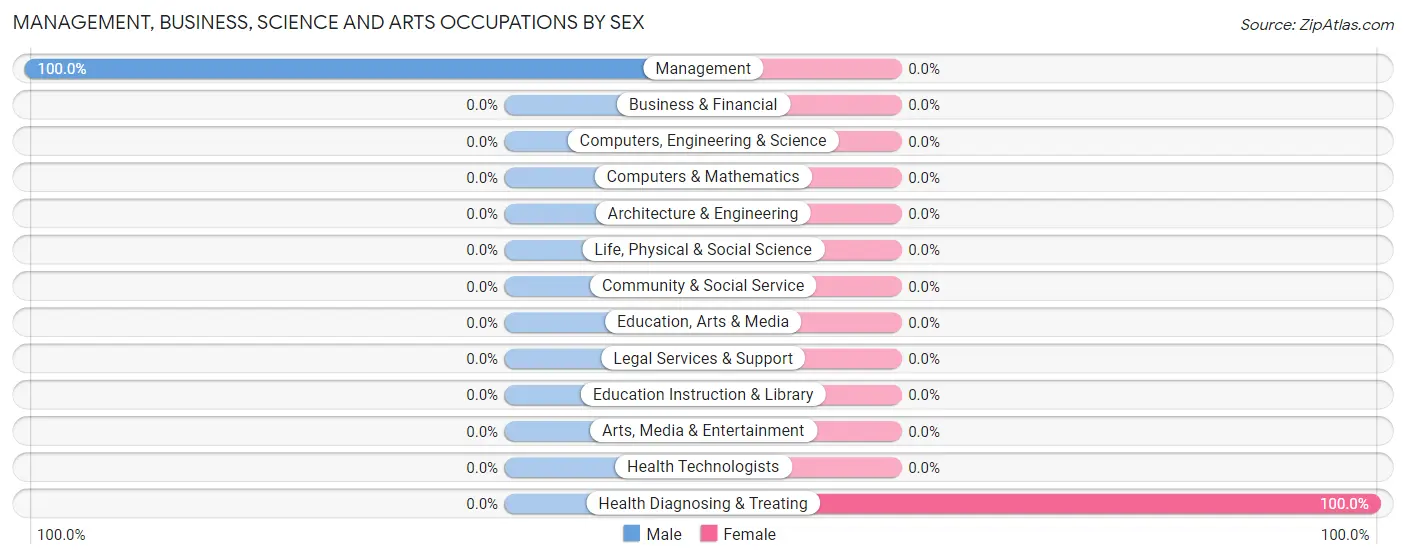
| Occupation | Male | Female |
| Management | 2 (100.0%) | 0 (0.0%) |
| Business & Financial | 0 (0.0%) | 0 (0.0%) |
| Computers, Engineering & Science | 0 (0.0%) | 0 (0.0%) |
| Computers & Mathematics | 0 (0.0%) | 0 (0.0%) |
| Architecture & Engineering | 0 (0.0%) | 0 (0.0%) |
| Life, Physical & Social Science | 0 (0.0%) | 0 (0.0%) |
| Community & Social Service | 0 (0.0%) | 0 (0.0%) |
| Education, Arts & Media | 0 (0.0%) | 0 (0.0%) |
| Legal Services & Support | 0 (0.0%) | 0 (0.0%) |
| Education Instruction & Library | 0 (0.0%) | 0 (0.0%) |
| Arts, Media & Entertainment | 0 (0.0%) | 0 (0.0%) |
| Health Diagnosing & Treating | 0 (0.0%) | 3 (100.0%) |
| Health Technologists | 0 (0.0%) | 0 (0.0%) |
| Total (Category) | 2 (40.0%) | 3 (60.0%) |
| Total (Overall) | 13 (54.2%) | 11 (45.8%) |
Services Occupations
The most common Services occupations in Hartman are , and Food Preparation & Serving (5 | 20.8%).
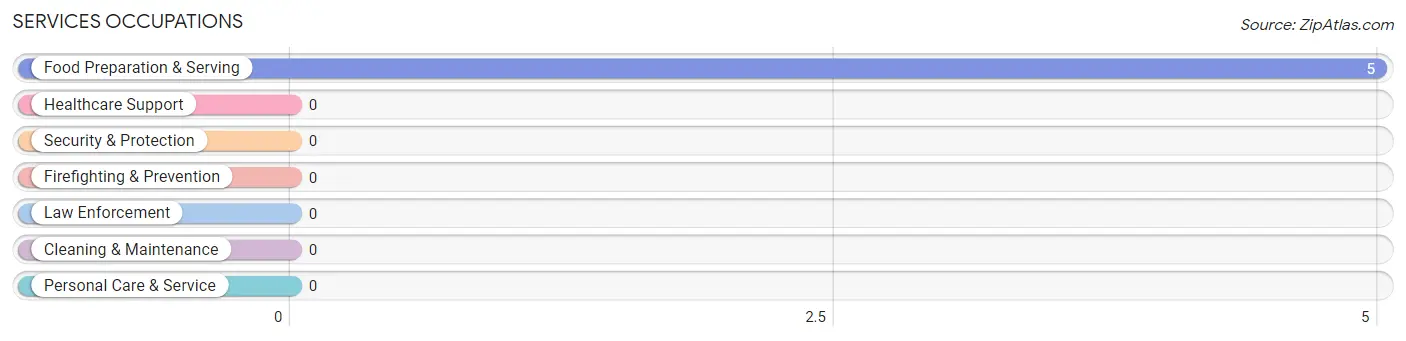
Services Occupations by Sex
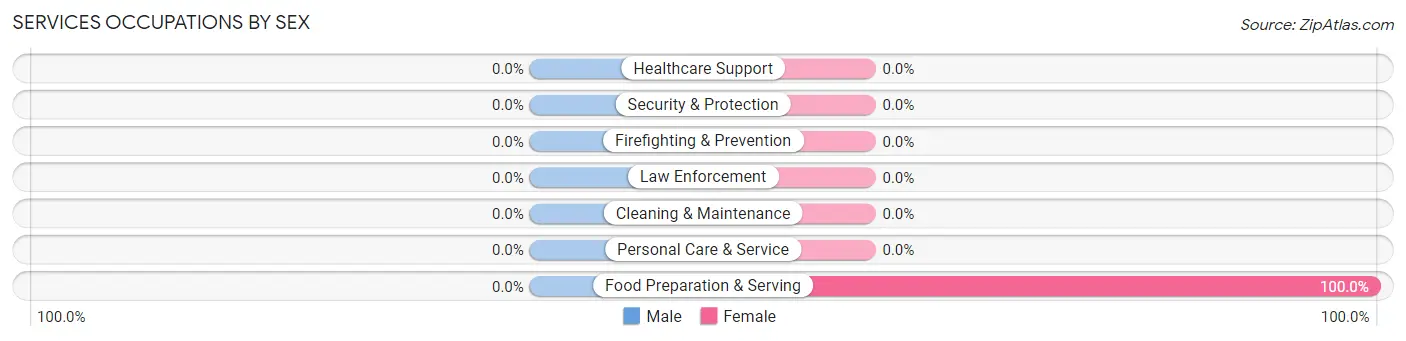
| Occupation | Male | Female |
| Healthcare Support | 0 (0.0%) | 0 (0.0%) |
| Security & Protection | 0 (0.0%) | 0 (0.0%) |
| Firefighting & Prevention | 0 (0.0%) | 0 (0.0%) |
| Law Enforcement | 0 (0.0%) | 0 (0.0%) |
| Food Preparation & Serving | 0 (0.0%) | 5 (100.0%) |
| Cleaning & Maintenance | 0 (0.0%) | 0 (0.0%) |
| Personal Care & Service | 0 (0.0%) | 0 (0.0%) |
| Total (Category) | 0 (0.0%) | 5 (100.0%) |
| Total (Overall) | 13 (54.2%) | 11 (45.8%) |
Sales and Office Occupations
The most common Sales and Office occupations in Hartman are , and Office & Administration (1 | 4.2%).
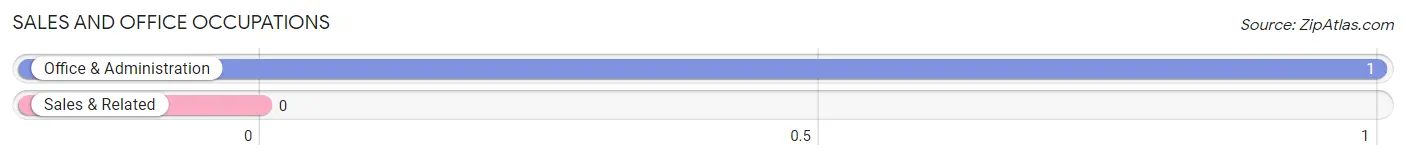
Sales and Office Occupations by Sex
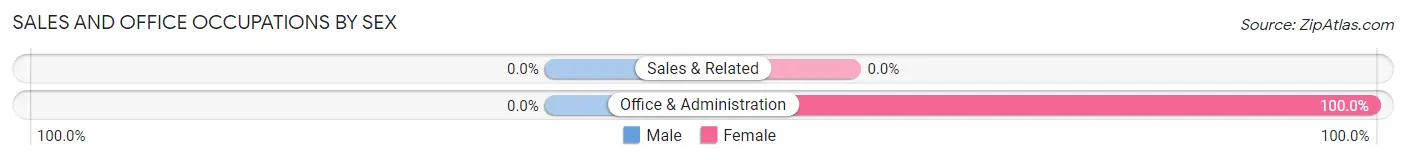
| Occupation | Male | Female |
| Sales & Related | 0 (0.0%) | 0 (0.0%) |
| Office & Administration | 0 (0.0%) | 1 (100.0%) |
| Total (Category) | 0 (0.0%) | 1 (100.0%) |
| Total (Overall) | 13 (54.2%) | 11 (45.8%) |
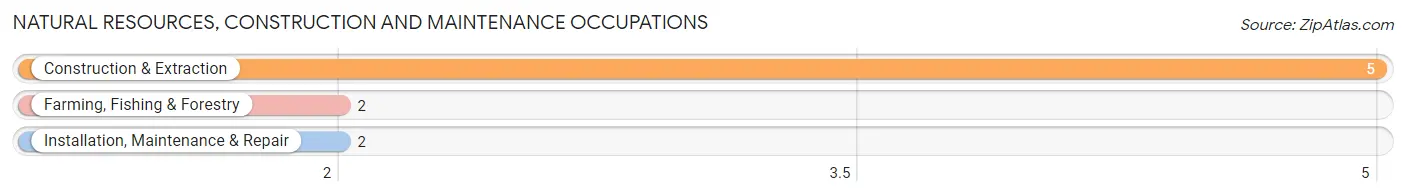
Natural Resources, Construction and Maintenance Occupations
The most common Natural Resources, Construction and Maintenance occupations in Hartman are Construction & Extraction (5 | 20.8%), Farming, Fishing & Forestry (2 | 8.3%), and Installation, Maintenance & Repair (2 | 8.3%).
Natural Resources, Construction and Maintenance Occupations by Sex
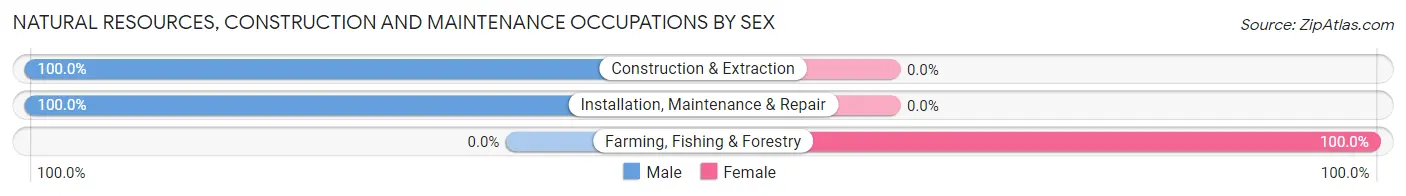
| Occupation | Male | Female |
| Farming, Fishing & Forestry | 0 (0.0%) | 2 (100.0%) |
| Construction & Extraction | 5 (100.0%) | 0 (0.0%) |
| Installation, Maintenance & Repair | 2 (100.0%) | 0 (0.0%) |
| Total (Category) | 7 (77.8%) | 2 (22.2%) |
| Total (Overall) | 13 (54.2%) | 11 (45.8%) |
Production, Transportation and Moving Occupations
The most common Production, Transportation and Moving occupations in Hartman are , and Transportation (4 | 16.7%).
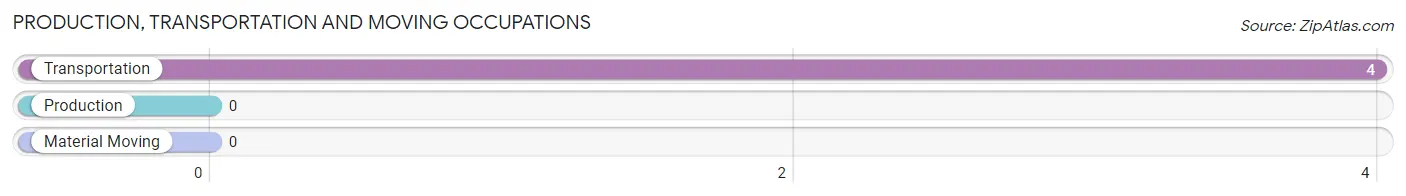
Production, Transportation and Moving Occupations by Sex
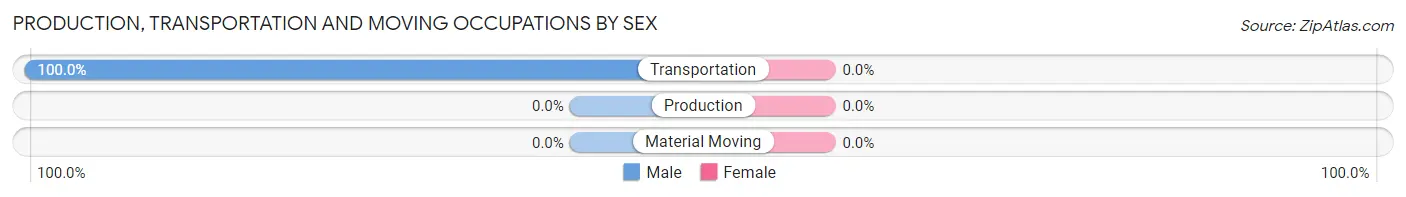
| Occupation | Male | Female |
| Production | 0 (0.0%) | 0 (0.0%) |
| Transportation | 4 (100.0%) | 0 (0.0%) |
| Material Moving | 0 (0.0%) | 0 (0.0%) |
| Total (Category) | 4 (100.0%) | 0 (0.0%) |
| Total (Overall) | 13 (54.2%) | 11 (45.8%) |
Employment Industries by Sex in Hartman
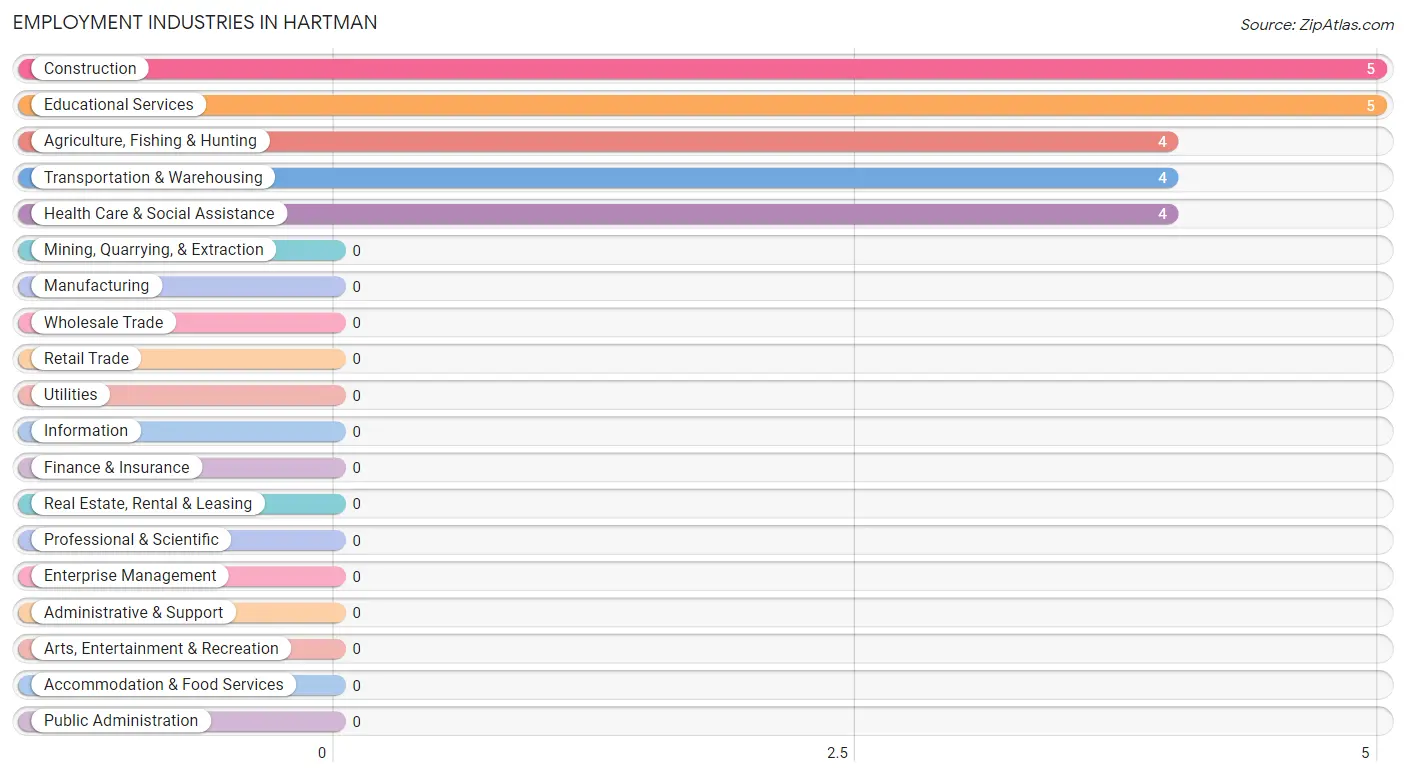
Employment Industries in Hartman
The major employment industries in Hartman include Construction (5 | 20.8%), Educational Services (5 | 20.8%), Agriculture, Fishing & Hunting (4 | 16.7%), Transportation & Warehousing (4 | 16.7%), and Health Care & Social Assistance (4 | 16.7%).
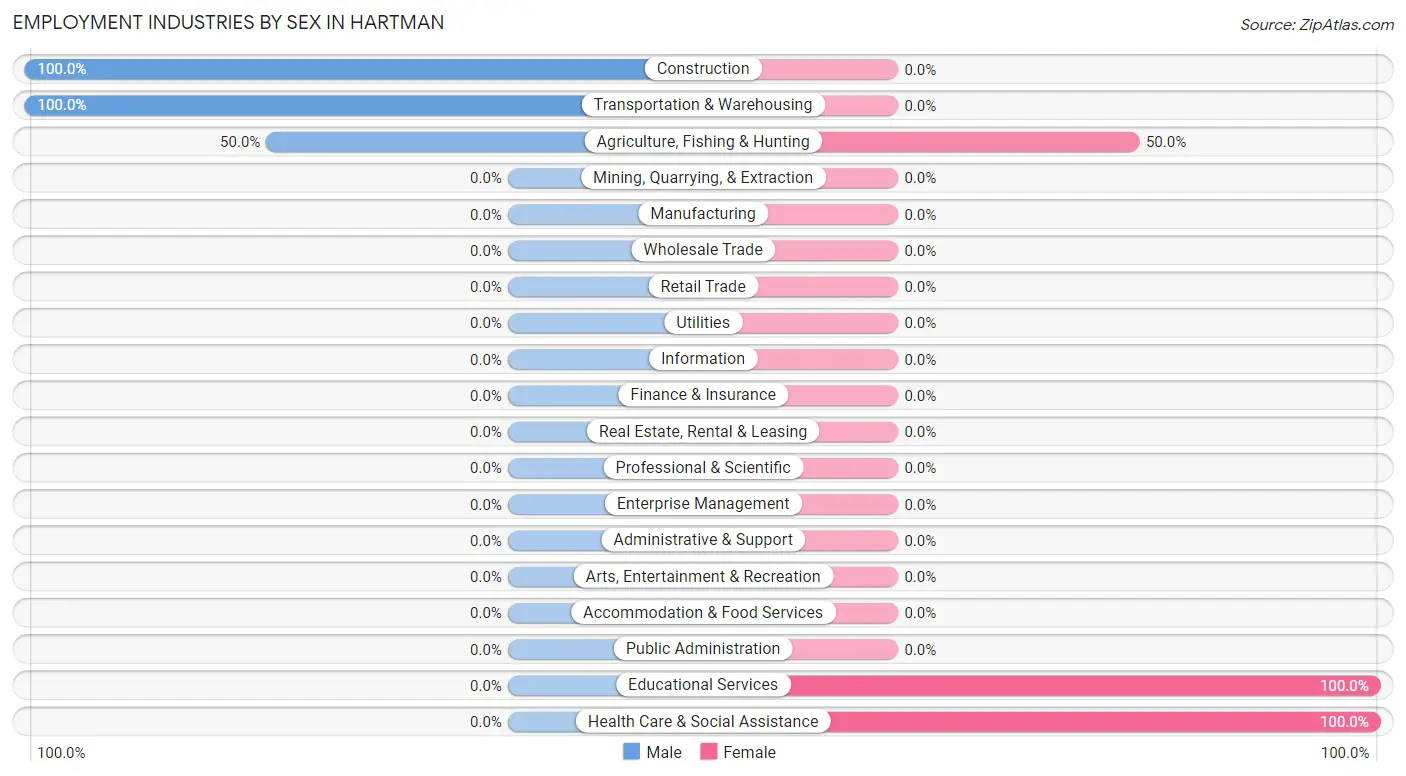
Employment Industries by Sex in Hartman
The Hartman industries that see more men than women are Construction (100.0%), Transportation & Warehousing (100.0%), and Agriculture, Fishing & Hunting (50.0%), whereas the industries that tend to have a higher number of women are Educational Services (100.0%), Health Care & Social Assistance (100.0%), and Agriculture, Fishing & Hunting (50.0%).
| Industry | Male | Female |
| Agriculture, Fishing & Hunting | 2 (50.0%) | 2 (50.0%) |
| Mining, Quarrying, & Extraction | 0 (0.0%) | 0 (0.0%) |
| Construction | 5 (100.0%) | 0 (0.0%) |
| Manufacturing | 0 (0.0%) | 0 (0.0%) |
| Wholesale Trade | 0 (0.0%) | 0 (0.0%) |
| Retail Trade | 0 (0.0%) | 0 (0.0%) |
| Transportation & Warehousing | 4 (100.0%) | 0 (0.0%) |
| Utilities | 0 (0.0%) | 0 (0.0%) |
| Information | 0 (0.0%) | 0 (0.0%) |
| Finance & Insurance | 0 (0.0%) | 0 (0.0%) |
| Real Estate, Rental & Leasing | 0 (0.0%) | 0 (0.0%) |
| Professional & Scientific | 0 (0.0%) | 0 (0.0%) |
| Enterprise Management | 0 (0.0%) | 0 (0.0%) |
| Administrative & Support | 0 (0.0%) | 0 (0.0%) |
| Educational Services | 0 (0.0%) | 5 (100.0%) |
| Health Care & Social Assistance | 0 (0.0%) | 4 (100.0%) |
| Arts, Entertainment & Recreation | 0 (0.0%) | 0 (0.0%) |
| Accommodation & Food Services | 0 (0.0%) | 0 (0.0%) |
| Public Administration | 0 (0.0%) | 0 (0.0%) |
| Total | 13 (54.2%) | 11 (45.8%) |
Education in Hartman
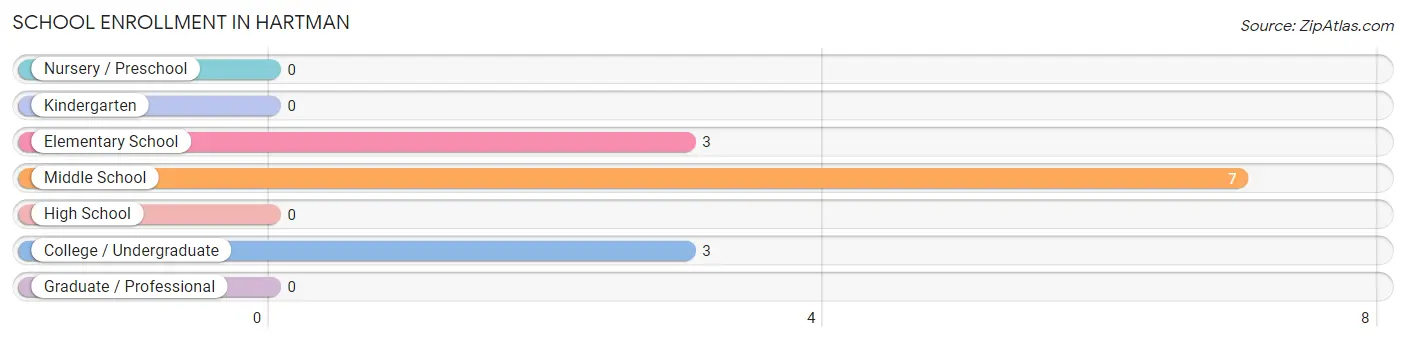
School Enrollment in Hartman
The most common levels of schooling among the 13 students in Hartman are middle school (7 | 53.8%), elementary school (3 | 23.1%), and college / undergraduate (3 | 23.1%).
| School Level | # Students | % Students |
| Nursery / Preschool | 0 | 0.0% |
| Kindergarten | 0 | 0.0% |
| Elementary School | 3 | 23.1% |
| Middle School | 7 | 53.8% |
| High School | 0 | 0.0% |
| College / Undergraduate | 3 | 23.1% |
| Graduate / Professional | 0 | 0.0% |
| Total | 13 | 100.0% |
School Enrollment by Age by Funding Source in Hartman
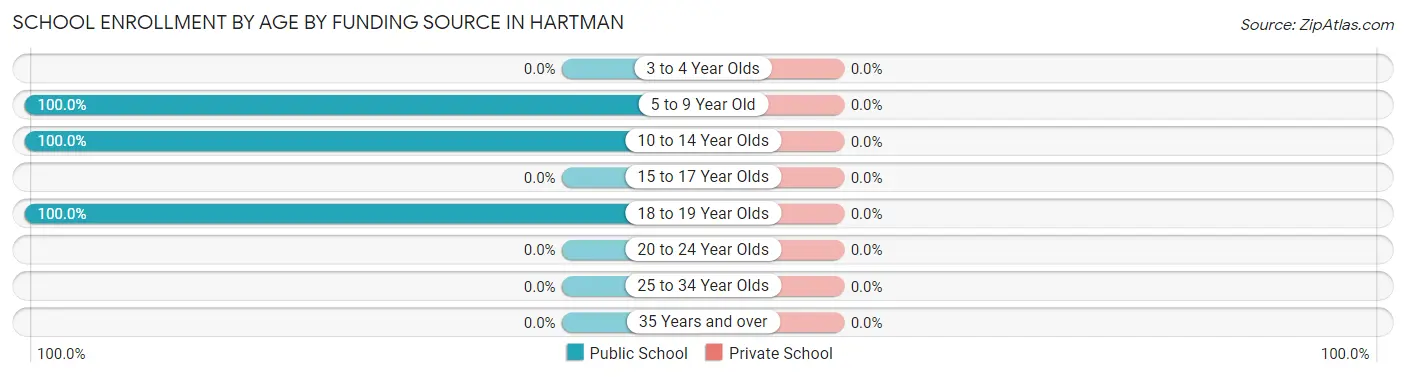
| Age Bracket | Public School | Private School |
| 3 to 4 Year Olds | 0 (0.0%) | 0 (0.0%) |
| 5 to 9 Year Old | 3 (100.0%) | 0 (0.0%) |
| 10 to 14 Year Olds | 7 (100.0%) | 0 (0.0%) |
| 15 to 17 Year Olds | 0 (0.0%) | 0 (0.0%) |
| 18 to 19 Year Olds | 3 (100.0%) | 0 (0.0%) |
| 20 to 24 Year Olds | 0 (0.0%) | 0 (0.0%) |
| 25 to 34 Year Olds | 0 (0.0%) | 0 (0.0%) |
| 35 Years and over | 0 (0.0%) | 0 (0.0%) |
| Total | 13 (100.0%) | 0 (0.0%) |
Educational Attainment by Field of Study in Hartman
, and bio, nature & agricultural (3 | 100.0%) are the most common fields of study among 3 individuals in Hartman who have obtained a bachelor's degree or higher.
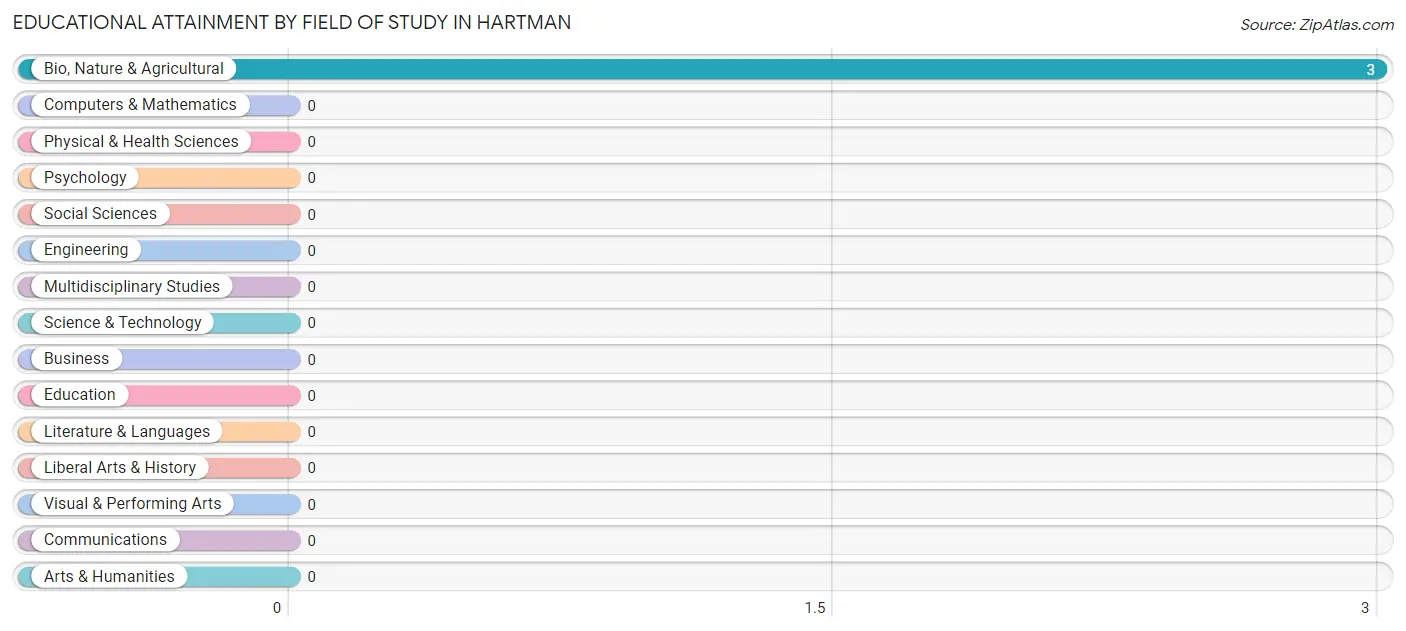
| Field of Study | # Graduates | % Graduates |
| Computers & Mathematics | 0 | 0.0% |
| Bio, Nature & Agricultural | 3 | 100.0% |
| Physical & Health Sciences | 0 | 0.0% |
| Psychology | 0 | 0.0% |
| Social Sciences | 0 | 0.0% |
| Engineering | 0 | 0.0% |
| Multidisciplinary Studies | 0 | 0.0% |
| Science & Technology | 0 | 0.0% |
| Business | 0 | 0.0% |
| Education | 0 | 0.0% |
| Literature & Languages | 0 | 0.0% |
| Liberal Arts & History | 0 | 0.0% |
| Visual & Performing Arts | 0 | 0.0% |
| Communications | 0 | 0.0% |
| Arts & Humanities | 0 | 0.0% |
| Total | 3 | 100.0% |
Transportation & Commute in Hartman
Vehicle Availability by Sex in Hartman
The most prevalent vehicle ownership categories in Hartman are males with 2 vehicles (9, accounting for 69.2%) and females with 2 vehicles (6, making up 81.8%).
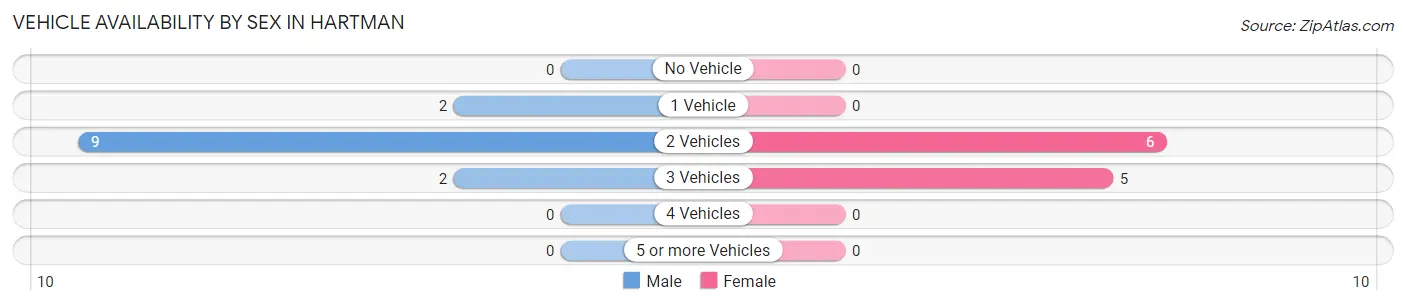
| Vehicles Available | Male | Female |
| No Vehicle | 0 (0.0%) | 0 (0.0%) |
| 1 Vehicle | 2 (15.4%) | 0 (0.0%) |
| 2 Vehicles | 9 (69.2%) | 6 (54.5%) |
| 3 Vehicles | 2 (15.4%) | 5 (45.5%) |
| 4 Vehicles | 0 (0.0%) | 0 (0.0%) |
| 5 or more Vehicles | 0 (0.0%) | 0 (0.0%) |
| Total | 13 (100.0%) | 11 (100.0%) |
Commute Time in Hartman
The most frequently occuring commute durations in Hartman are 5 to 9 minutes (10 commuters, 45.5%), 10 to 14 minutes (7 commuters, 31.8%), and less than 5 minutes (4 commuters, 18.2%).
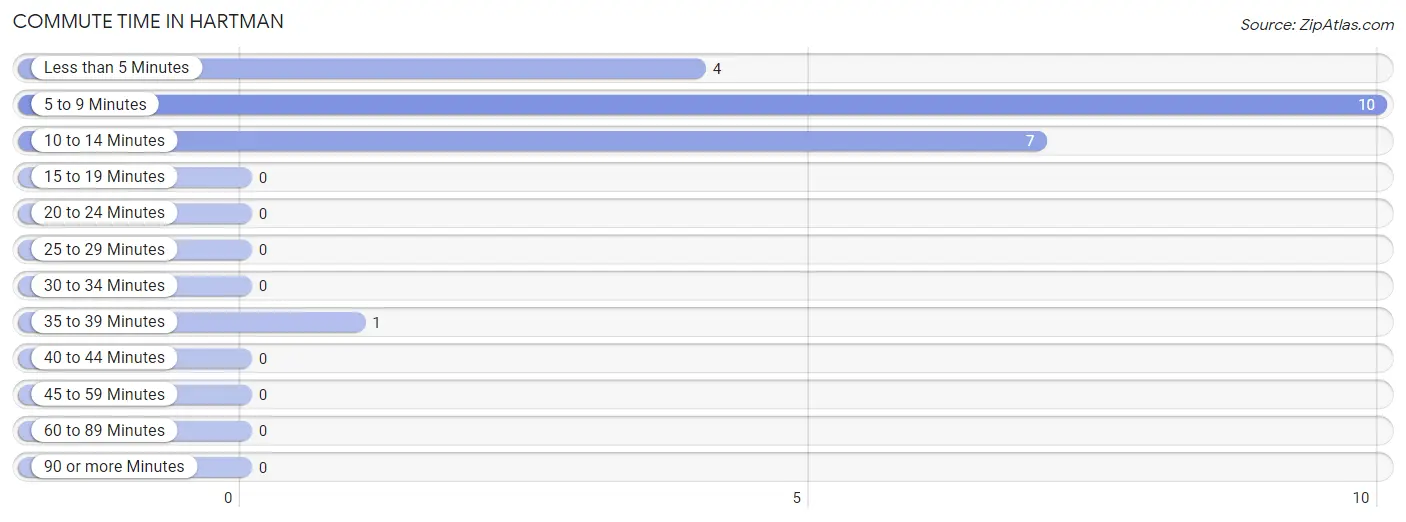
| Commute Time | # Commuters | % Commuters |
| Less than 5 Minutes | 4 | 18.2% |
| 5 to 9 Minutes | 10 | 45.5% |
| 10 to 14 Minutes | 7 | 31.8% |
| 15 to 19 Minutes | 0 | 0.0% |
| 20 to 24 Minutes | 0 | 0.0% |
| 25 to 29 Minutes | 0 | 0.0% |
| 30 to 34 Minutes | 0 | 0.0% |
| 35 to 39 Minutes | 1 | 4.5% |
| 40 to 44 Minutes | 0 | 0.0% |
| 45 to 59 Minutes | 0 | 0.0% |
| 60 to 89 Minutes | 0 | 0.0% |
| 90 or more Minutes | 0 | 0.0% |
Commute Time by Sex in Hartman
The most common commute times in Hartman are 5 to 9 minutes (7 commuters, 63.6%) for males and 10 to 14 minutes (7 commuters, 63.6%) for females.
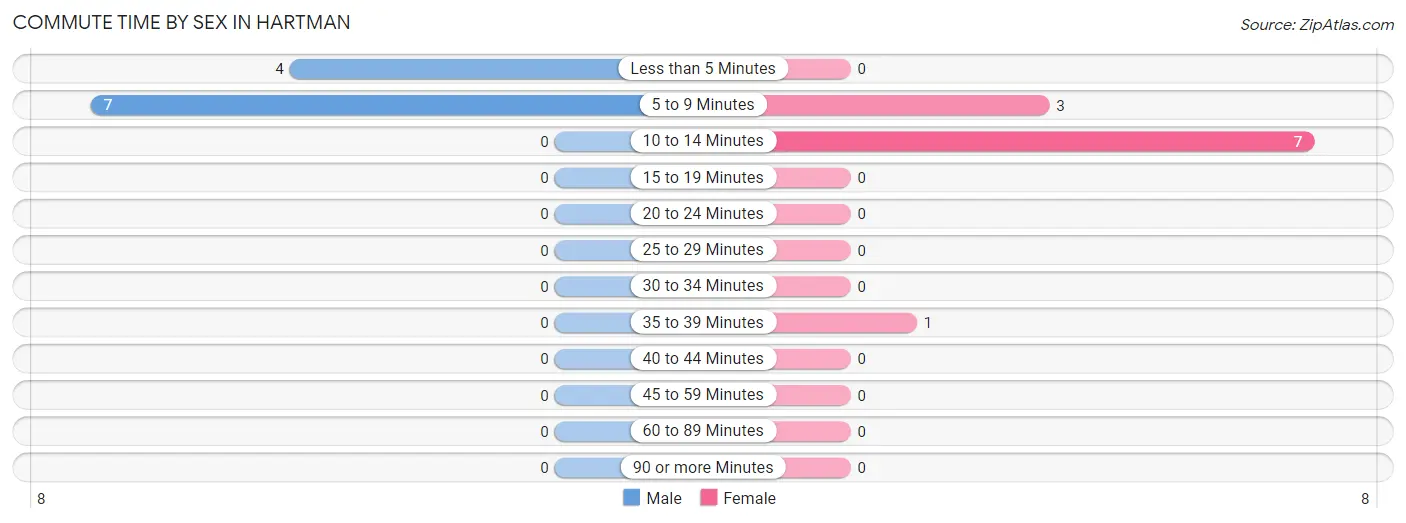
| Commute Time | Male | Female |
| Less than 5 Minutes | 4 (36.4%) | 0 (0.0%) |
| 5 to 9 Minutes | 7 (63.6%) | 3 (27.3%) |
| 10 to 14 Minutes | 0 (0.0%) | 7 (63.6%) |
| 15 to 19 Minutes | 0 (0.0%) | 0 (0.0%) |
| 20 to 24 Minutes | 0 (0.0%) | 0 (0.0%) |
| 25 to 29 Minutes | 0 (0.0%) | 0 (0.0%) |
| 30 to 34 Minutes | 0 (0.0%) | 0 (0.0%) |
| 35 to 39 Minutes | 0 (0.0%) | 1 (9.1%) |
| 40 to 44 Minutes | 0 (0.0%) | 0 (0.0%) |
| 45 to 59 Minutes | 0 (0.0%) | 0 (0.0%) |
| 60 to 89 Minutes | 0 (0.0%) | 0 (0.0%) |
| 90 or more Minutes | 0 (0.0%) | 0 (0.0%) |
Time of Departure to Work by Sex in Hartman
The most frequent times of departure to work in Hartman are 7:00 AM to 7:29 AM (5, 45.5%) for males and 6:00 AM to 6:29 AM (5, 45.5%) for females.
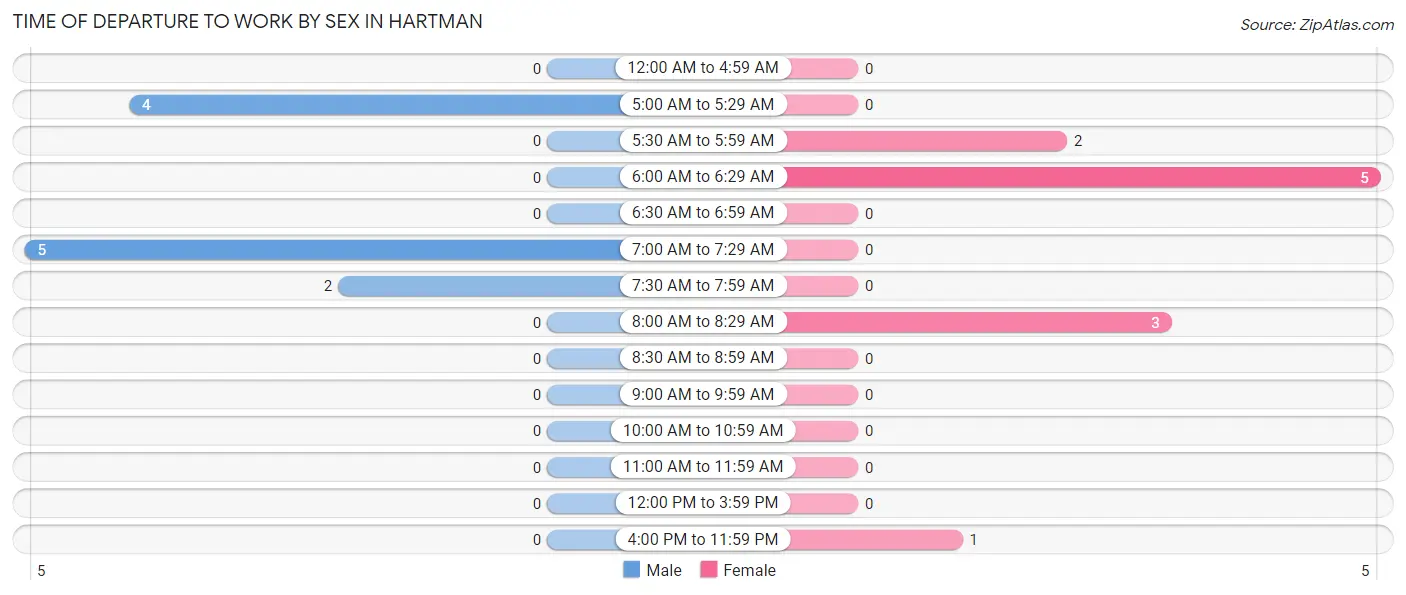
| Time of Departure | Male | Female |
| 12:00 AM to 4:59 AM | 0 (0.0%) | 0 (0.0%) |
| 5:00 AM to 5:29 AM | 4 (36.4%) | 0 (0.0%) |
| 5:30 AM to 5:59 AM | 0 (0.0%) | 2 (18.2%) |
| 6:00 AM to 6:29 AM | 0 (0.0%) | 5 (45.5%) |
| 6:30 AM to 6:59 AM | 0 (0.0%) | 0 (0.0%) |
| 7:00 AM to 7:29 AM | 5 (45.5%) | 0 (0.0%) |
| 7:30 AM to 7:59 AM | 2 (18.2%) | 0 (0.0%) |
| 8:00 AM to 8:29 AM | 0 (0.0%) | 3 (27.3%) |
| 8:30 AM to 8:59 AM | 0 (0.0%) | 0 (0.0%) |
| 9:00 AM to 9:59 AM | 0 (0.0%) | 0 (0.0%) |
| 10:00 AM to 10:59 AM | 0 (0.0%) | 0 (0.0%) |
| 11:00 AM to 11:59 AM | 0 (0.0%) | 0 (0.0%) |
| 12:00 PM to 3:59 PM | 0 (0.0%) | 0 (0.0%) |
| 4:00 PM to 11:59 PM | 0 (0.0%) | 1 (9.1%) |
| Total | 11 (100.0%) | 11 (100.0%) |
Housing Occupancy in Hartman
Occupancy by Ownership in Hartman
Of the total 21 dwellings in Hartman, owner-occupied units account for 19 (90.5%), while renter-occupied units make up 2 (9.5%).
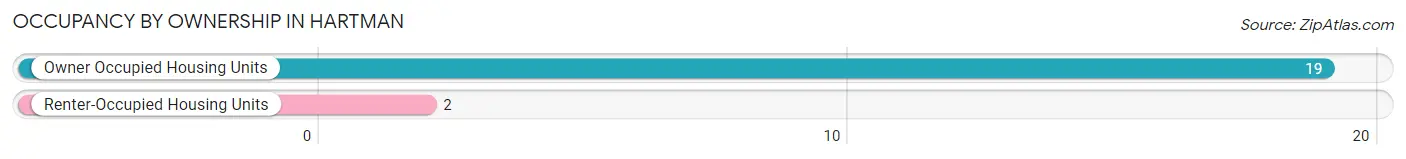
| Occupancy | # Housing Units | % Housing Units |
| Owner Occupied Housing Units | 19 | 90.5% |
| Renter-Occupied Housing Units | 2 | 9.5% |
| Total Occupied Housing Units | 21 | 100.0% |
Occupancy by Household Size in Hartman
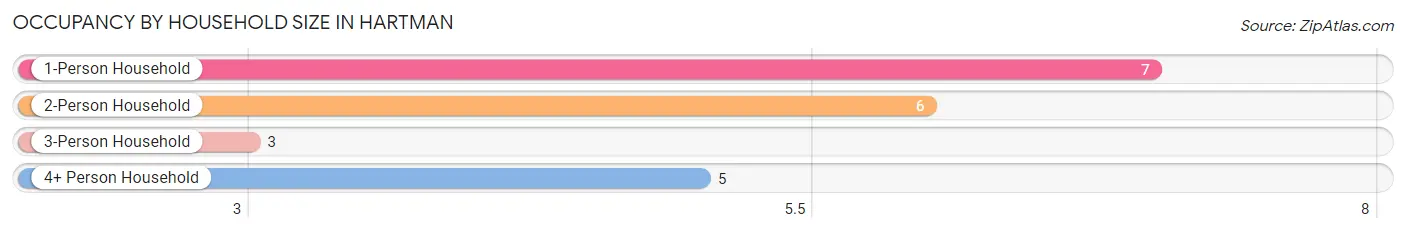
| Household Size | # Housing Units | % Housing Units |
| 1-Person Household | 7 | 33.3% |
| 2-Person Household | 6 | 28.6% |
| 3-Person Household | 3 | 14.3% |
| 4+ Person Household | 5 | 23.8% |
| Total Housing Units | 21 | 100.0% |
Occupancy by Ownership by Household Size in Hartman
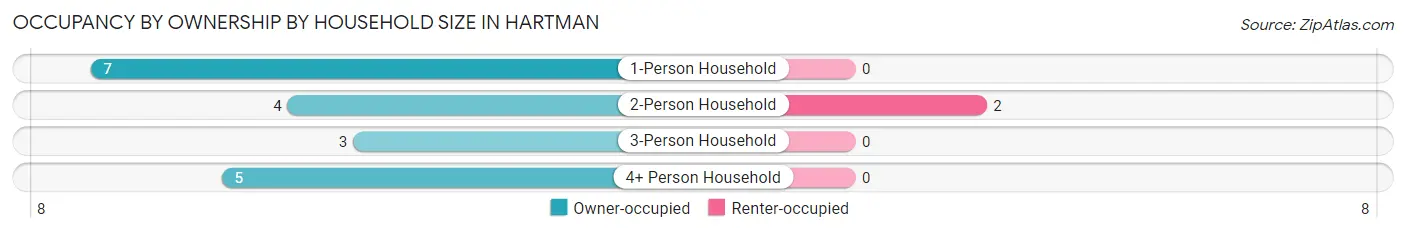
| Household Size | Owner-occupied | Renter-occupied |
| 1-Person Household | 7 (100.0%) | 0 (0.0%) |
| 2-Person Household | 4 (66.7%) | 2 (33.3%) |
| 3-Person Household | 3 (100.0%) | 0 (0.0%) |
| 4+ Person Household | 5 (100.0%) | 0 (0.0%) |
| Total Housing Units | 19 (90.5%) | 2 (9.5%) |
Occupancy by Educational Attainment in Hartman
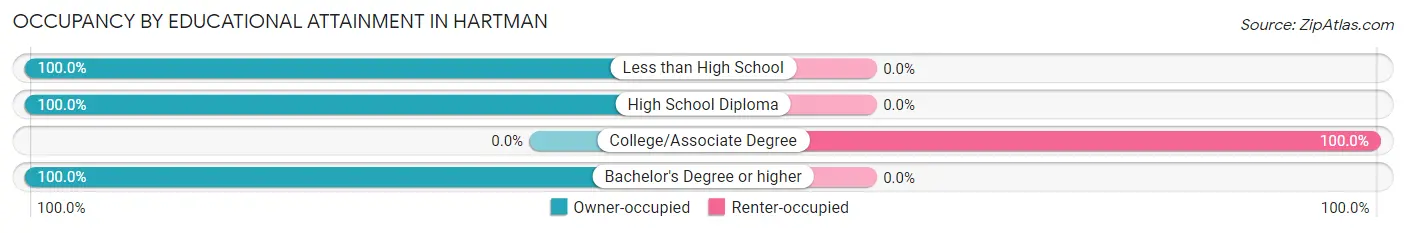
| Household Size | Owner-occupied | Renter-occupied |
| Less than High School | 3 (100.0%) | 0 (0.0%) |
| High School Diploma | 13 (100.0%) | 0 (0.0%) |
| College/Associate Degree | 0 (0.0%) | 2 (100.0%) |
| Bachelor's Degree or higher | 3 (100.0%) | 0 (0.0%) |
Occupancy by Age of Householder in Hartman
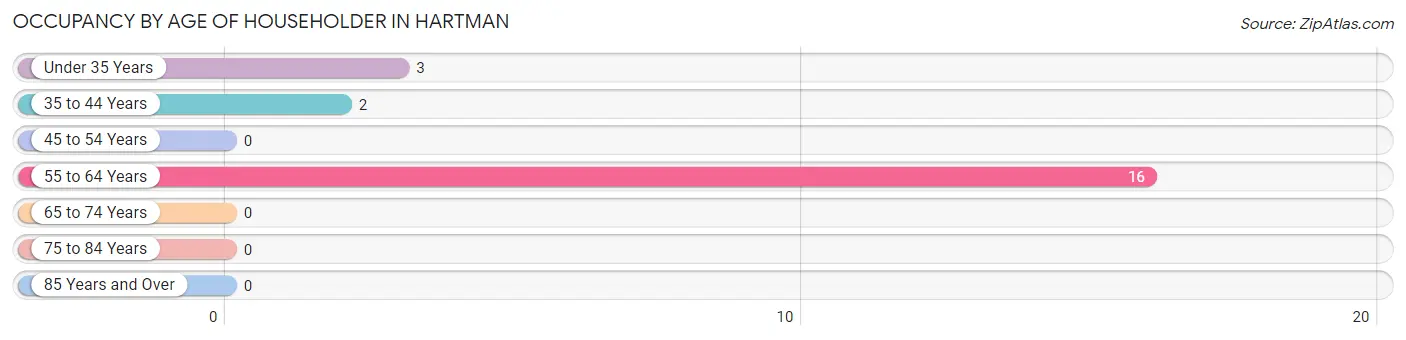
| Age Bracket | # Households | % Households |
| Under 35 Years | 3 | 14.3% |
| 35 to 44 Years | 2 | 9.5% |
| 45 to 54 Years | 0 | 0.0% |
| 55 to 64 Years | 16 | 76.2% |
| 65 to 74 Years | 0 | 0.0% |
| 75 to 84 Years | 0 | 0.0% |
| 85 Years and Over | 0 | 0.0% |
| Total | 21 | 100.0% |
Housing Finances in Hartman
Median Income by Occupancy in Hartman
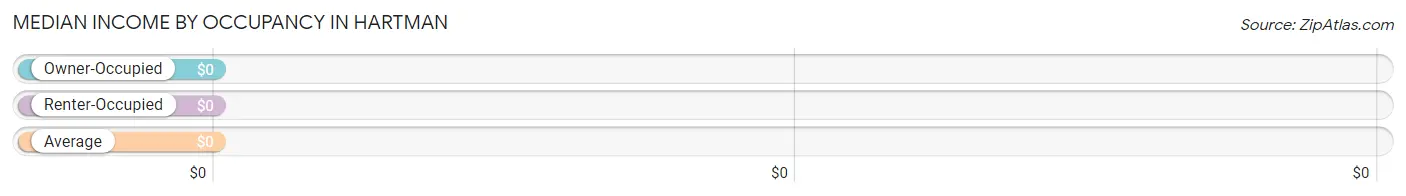
| Occupancy Type | # Households | Median Income |
| Owner-Occupied | 19 (90.5%) | $0 |
| Renter-Occupied | 2 (9.5%) | $0 |
| Average | 21 (100.0%) | $0 |
Occupancy by Householder Income Bracket in Hartman
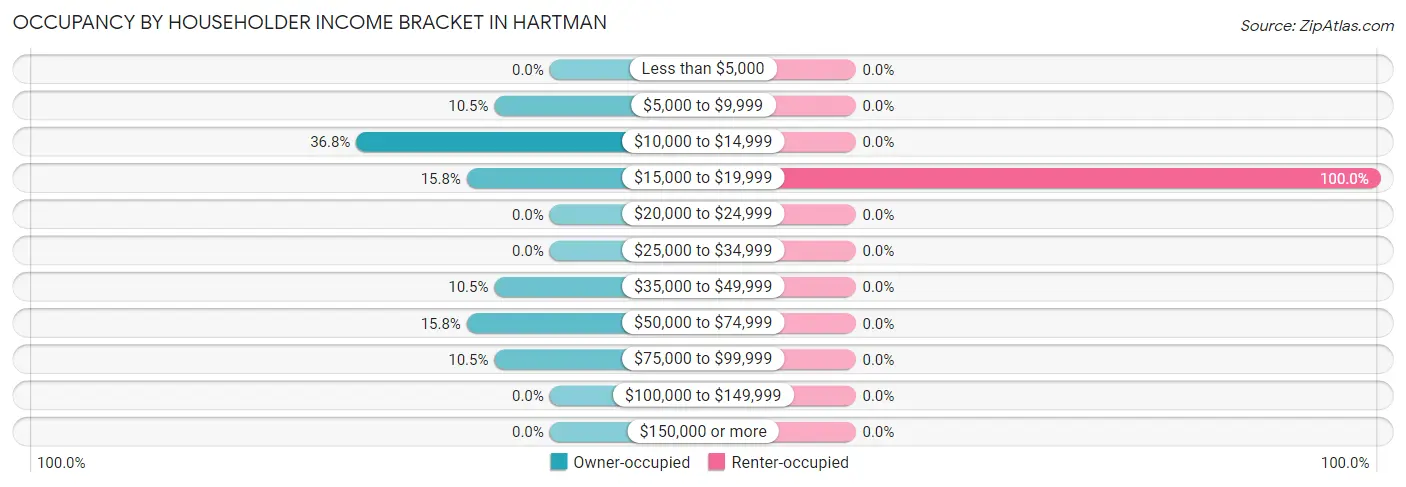
| Income Bracket | Owner-occupied | Renter-occupied |
| Less than $5,000 | 0 (0.0%) | 0 (0.0%) |
| $5,000 to $9,999 | 2 (10.5%) | 0 (0.0%) |
| $10,000 to $14,999 | 7 (36.8%) | 0 (0.0%) |
| $15,000 to $19,999 | 3 (15.8%) | 2 (100.0%) |
| $20,000 to $24,999 | 0 (0.0%) | 0 (0.0%) |
| $25,000 to $34,999 | 0 (0.0%) | 0 (0.0%) |
| $35,000 to $49,999 | 2 (10.5%) | 0 (0.0%) |
| $50,000 to $74,999 | 3 (15.8%) | 0 (0.0%) |
| $75,000 to $99,999 | 2 (10.5%) | 0 (0.0%) |
| $100,000 to $149,999 | 0 (0.0%) | 0 (0.0%) |
| $150,000 or more | 0 (0.0%) | 0 (0.0%) |
| Total | 19 (100.0%) | 2 (100.0%) |
Monthly Housing Cost Tiers in Hartman
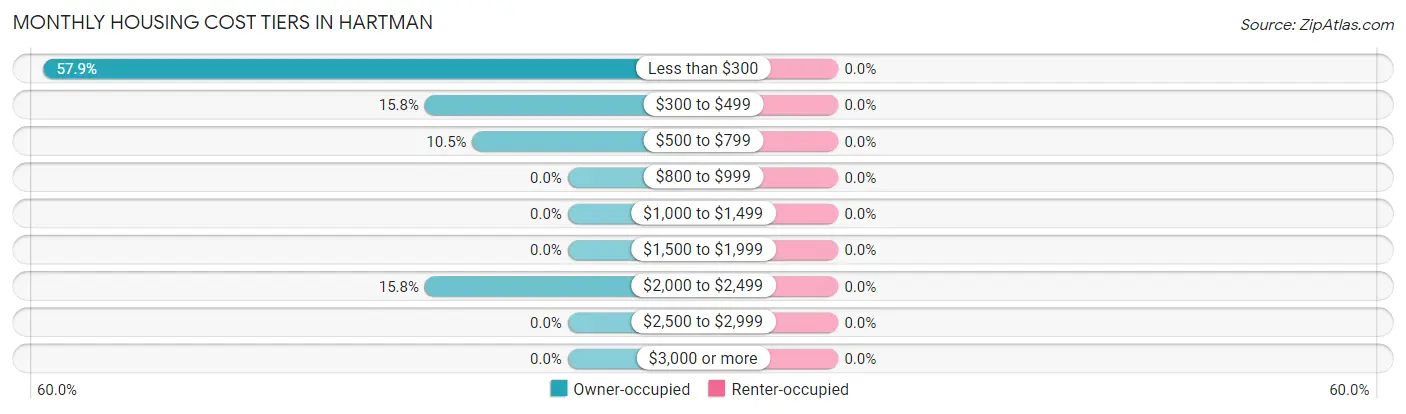
| Monthly Cost | Owner-occupied | Renter-occupied |
| Less than $300 | 11 (57.9%) | 0 (0.0%) |
| $300 to $499 | 3 (15.8%) | 0 (0.0%) |
| $500 to $799 | 2 (10.5%) | 0 (0.0%) |
| $800 to $999 | 0 (0.0%) | 0 (0.0%) |
| $1,000 to $1,499 | 0 (0.0%) | 0 (0.0%) |
| $1,500 to $1,999 | 0 (0.0%) | 0 (0.0%) |
| $2,000 to $2,499 | 3 (15.8%) | 0 (0.0%) |
| $2,500 to $2,999 | 0 (0.0%) | 0 (0.0%) |
| $3,000 or more | 0 (0.0%) | 0 (0.0%) |
| Total | 19 (100.0%) | 2 (100.0%) |
Physical Housing Characteristics in Hartman
Housing Structures in Hartman
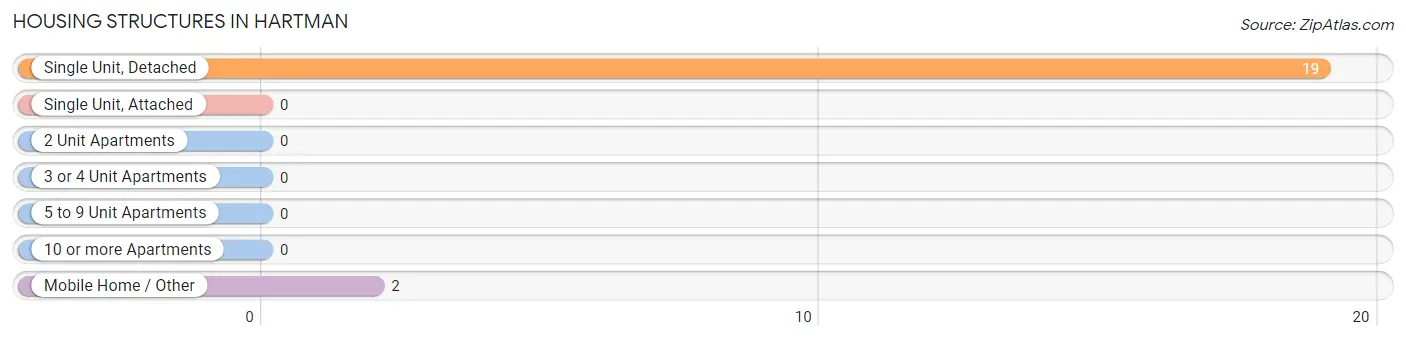
| Structure Type | # Housing Units | % Housing Units |
| Single Unit, Detached | 19 | 90.5% |
| Single Unit, Attached | 0 | 0.0% |
| 2 Unit Apartments | 0 | 0.0% |
| 3 or 4 Unit Apartments | 0 | 0.0% |
| 5 to 9 Unit Apartments | 0 | 0.0% |
| 10 or more Apartments | 0 | 0.0% |
| Mobile Home / Other | 2 | 9.5% |
| Total | 21 | 100.0% |
Housing Structures by Occupancy in Hartman
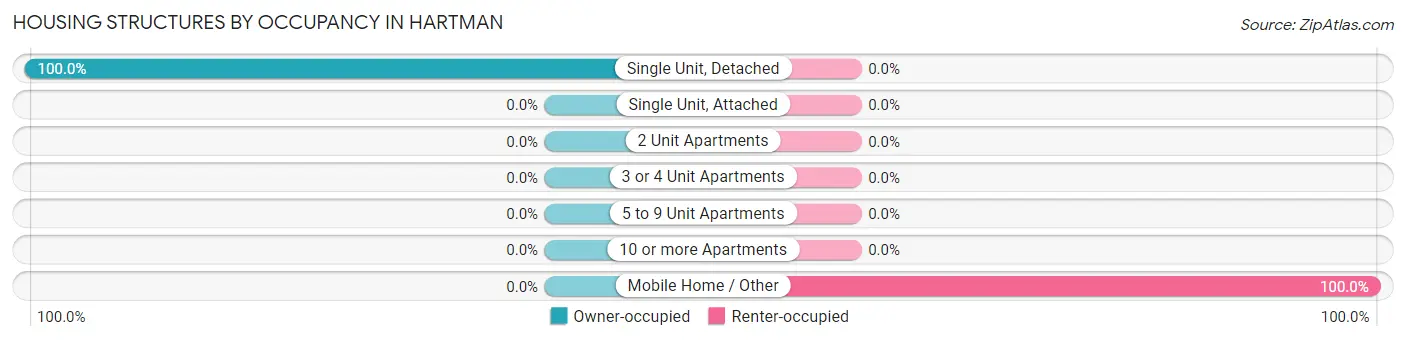
| Structure Type | Owner-occupied | Renter-occupied |
| Single Unit, Detached | 19 (100.0%) | 0 (0.0%) |
| Single Unit, Attached | 0 (0.0%) | 0 (0.0%) |
| 2 Unit Apartments | 0 (0.0%) | 0 (0.0%) |
| 3 or 4 Unit Apartments | 0 (0.0%) | 0 (0.0%) |
| 5 to 9 Unit Apartments | 0 (0.0%) | 0 (0.0%) |
| 10 or more Apartments | 0 (0.0%) | 0 (0.0%) |
| Mobile Home / Other | 0 (0.0%) | 2 (100.0%) |
| Total | 19 (90.5%) | 2 (9.5%) |
Housing Structures by Number of Rooms in Hartman
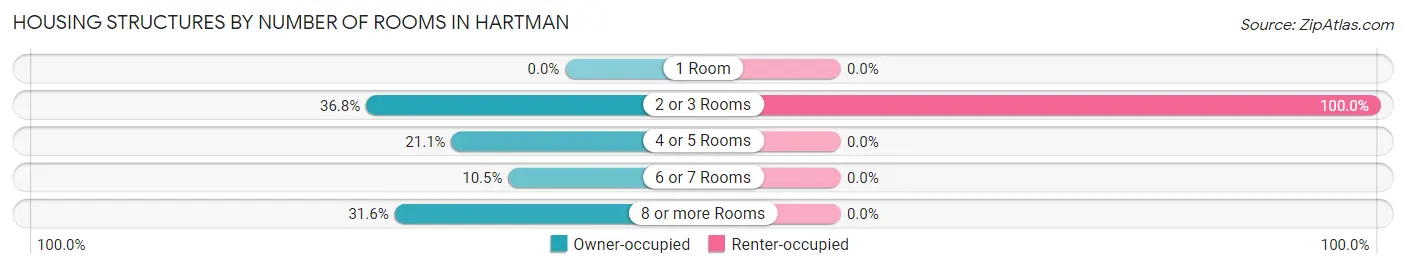
| Number of Rooms | Owner-occupied | Renter-occupied |
| 1 Room | 0 (0.0%) | 0 (0.0%) |
| 2 or 3 Rooms | 7 (36.8%) | 2 (100.0%) |
| 4 or 5 Rooms | 4 (21.0%) | 0 (0.0%) |
| 6 or 7 Rooms | 2 (10.5%) | 0 (0.0%) |
| 8 or more Rooms | 6 (31.6%) | 0 (0.0%) |
| Total | 19 (100.0%) | 2 (100.0%) |
Housing Structure by Heating Type in Hartman
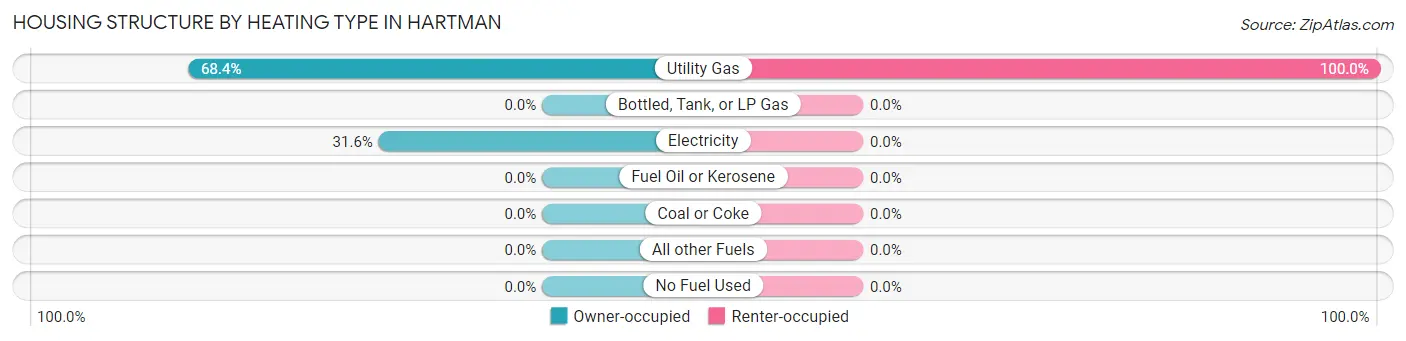
| Heating Type | Owner-occupied | Renter-occupied |
| Utility Gas | 13 (68.4%) | 2 (100.0%) |
| Bottled, Tank, or LP Gas | 0 (0.0%) | 0 (0.0%) |
| Electricity | 6 (31.6%) | 0 (0.0%) |
| Fuel Oil or Kerosene | 0 (0.0%) | 0 (0.0%) |
| Coal or Coke | 0 (0.0%) | 0 (0.0%) |
| All other Fuels | 0 (0.0%) | 0 (0.0%) |
| No Fuel Used | 0 (0.0%) | 0 (0.0%) |
| Total | 19 (100.0%) | 2 (100.0%) |
Household Vehicle Usage in Hartman
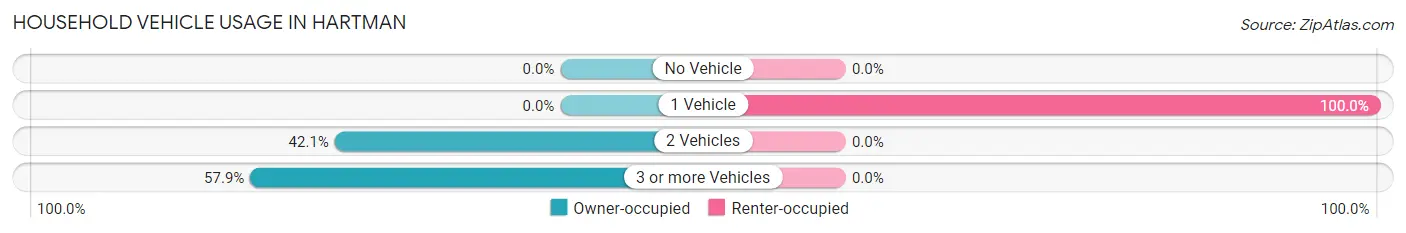
| Vehicles per Household | Owner-occupied | Renter-occupied |
| No Vehicle | 0 (0.0%) | 0 (0.0%) |
| 1 Vehicle | 0 (0.0%) | 2 (100.0%) |
| 2 Vehicles | 8 (42.1%) | 0 (0.0%) |
| 3 or more Vehicles | 11 (57.9%) | 0 (0.0%) |
| Total | 19 (100.0%) | 2 (100.0%) |
Real Estate & Mortgages in Hartman
Real Estate and Mortgage Overview in Hartman
| Characteristic | Without Mortgage | With Mortgage |
| Housing Units | 16 | 3 |
| Median Property Value | - | - |
| Median Household Income | - | - |
| Monthly Housing Costs | $263 | $0 |
| Real Estate Taxes | $214 | $0 |
Property Value by Mortgage Status in Hartman
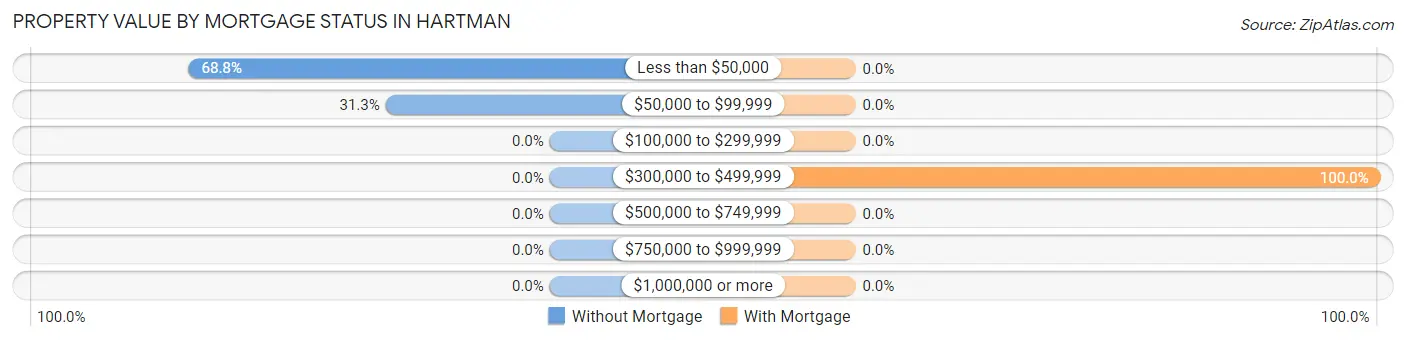
| Property Value | Without Mortgage | With Mortgage |
| Less than $50,000 | 11 (68.8%) | 0 (0.0%) |
| $50,000 to $99,999 | 5 (31.2%) | 0 (0.0%) |
| $100,000 to $299,999 | 0 (0.0%) | 0 (0.0%) |
| $300,000 to $499,999 | 0 (0.0%) | 3 (100.0%) |
| $500,000 to $749,999 | 0 (0.0%) | 0 (0.0%) |
| $750,000 to $999,999 | 0 (0.0%) | 0 (0.0%) |
| $1,000,000 or more | 0 (0.0%) | 0 (0.0%) |
| Total | 16 (100.0%) | 3 (100.0%) |
Household Income by Mortgage Status in Hartman
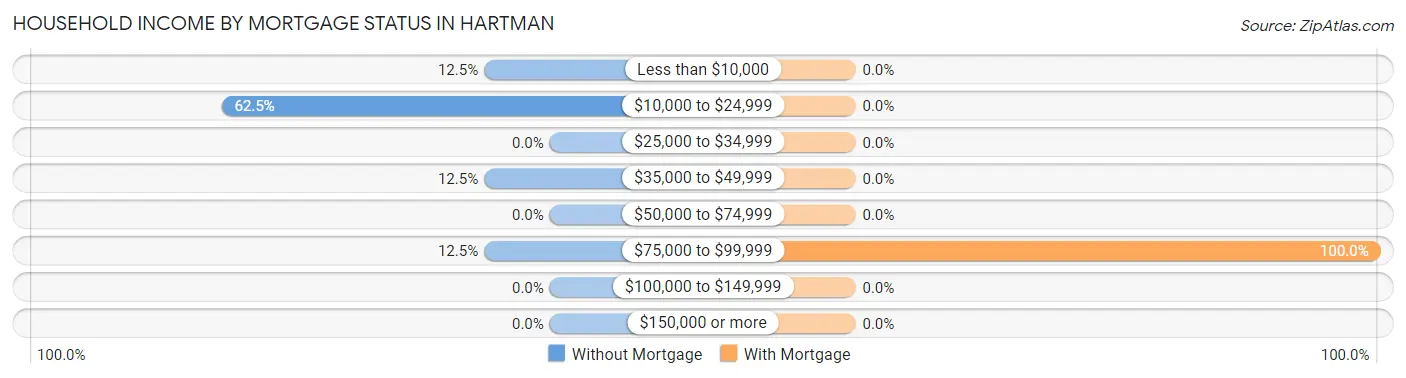
| Household Income | Without Mortgage | With Mortgage |
| Less than $10,000 | 2 (12.5%) | 0 (0.0%) |
| $10,000 to $24,999 | 10 (62.5%) | 0 (0.0%) |
| $25,000 to $34,999 | 0 (0.0%) | 0 (0.0%) |
| $35,000 to $49,999 | 2 (12.5%) | 0 (0.0%) |
| $50,000 to $74,999 | 0 (0.0%) | 0 (0.0%) |
| $75,000 to $99,999 | 2 (12.5%) | 3 (100.0%) |
| $100,000 to $149,999 | 0 (0.0%) | 0 (0.0%) |
| $150,000 or more | 0 (0.0%) | 0 (0.0%) |
| Total | 16 (100.0%) | 3 (100.0%) |
Property Value to Household Income Ratio in Hartman
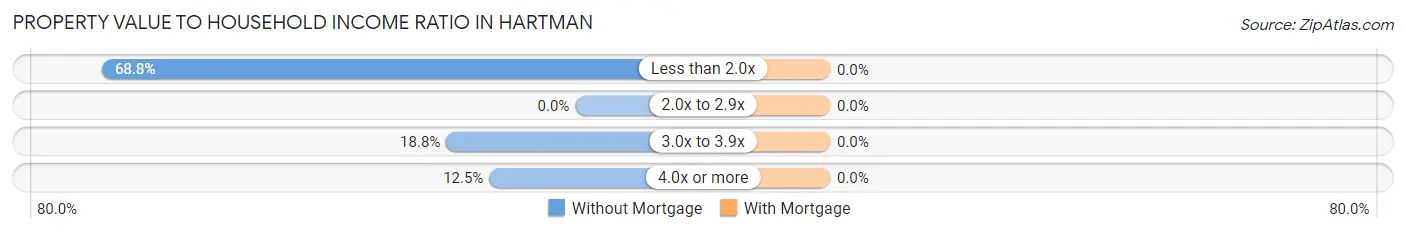
| Value-to-Income Ratio | Without Mortgage | With Mortgage |
| Less than 2.0x | 11 (68.8%) | 0 (0.0%) |
| 2.0x to 2.9x | 0 (0.0%) | 0 (0.0%) |
| 3.0x to 3.9x | 3 (18.8%) | 0 (0.0%) |
| 4.0x or more | 2 (12.5%) | 0 (0.0%) |
| Total | 16 (100.0%) | 3 (100.0%) |
Real Estate Taxes by Mortgage Status in Hartman
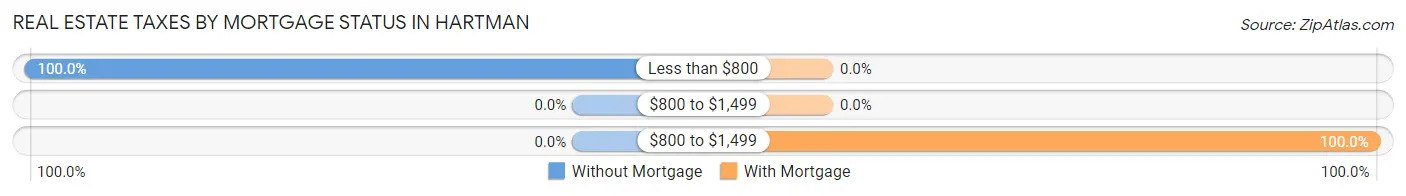
| Property Taxes | Without Mortgage | With Mortgage |
| Less than $800 | 16 (100.0%) | 0 (0.0%) |
| $800 to $1,499 | 0 (0.0%) | 0 (0.0%) |
| $800 to $1,499 | 0 (0.0%) | 3 (100.0%) |
| Total | 16 (100.0%) | 3 (100.0%) |
Health & Disability in Hartman
Health Insurance Coverage by Age in Hartman
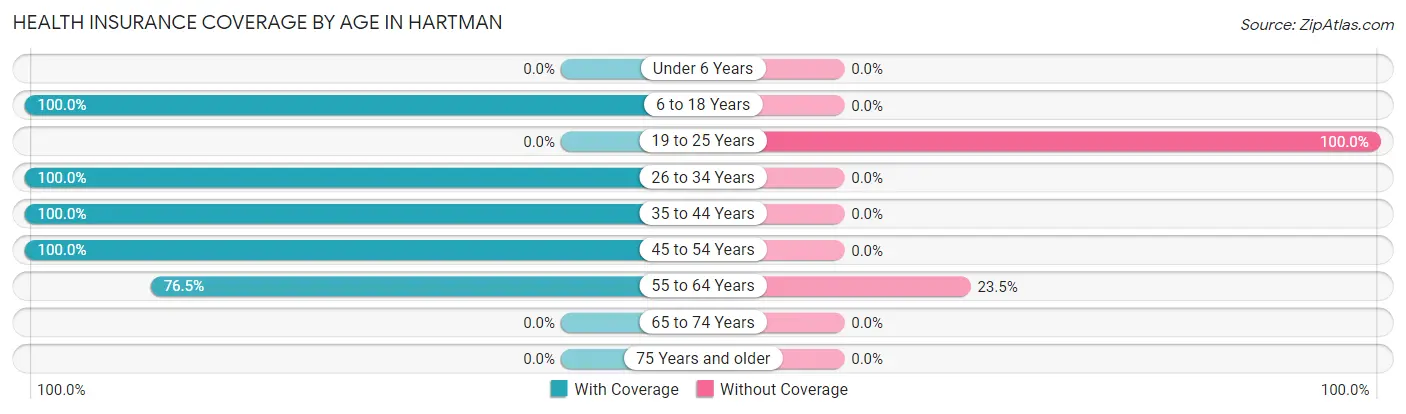
| Age Bracket | With Coverage | Without Coverage |
| Under 6 Years | 0 (0.0%) | 0 (0.0%) |
| 6 to 18 Years | 13 (100.0%) | 0 (0.0%) |
| 19 to 25 Years | 0 (0.0%) | 1 (100.0%) |
| 26 to 34 Years | 4 (100.0%) | 0 (0.0%) |
| 35 to 44 Years | 11 (100.0%) | 0 (0.0%) |
| 45 to 54 Years | 5 (100.0%) | 0 (0.0%) |
| 55 to 64 Years | 13 (76.5%) | 4 (23.5%) |
| 65 to 74 Years | 0 (0.0%) | 0 (0.0%) |
| 75 Years and older | 0 (0.0%) | 0 (0.0%) |
| Total | 46 (90.2%) | 5 (9.8%) |
Health Insurance Coverage by Citizenship Status in Hartman
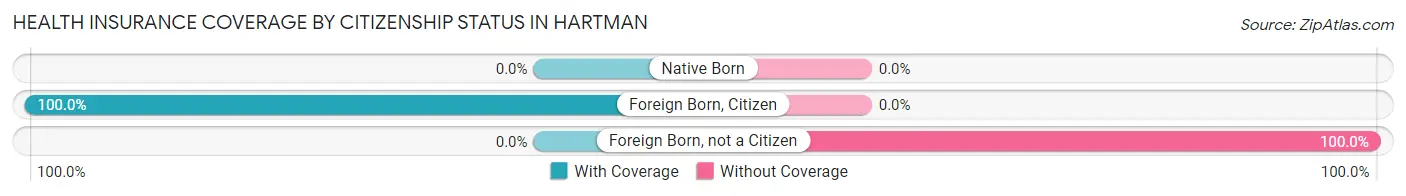
| Citizenship Status | With Coverage | Without Coverage |
| Native Born | 0 (0.0%) | 0 (0.0%) |
| Foreign Born, Citizen | 13 (100.0%) | 0 (0.0%) |
| Foreign Born, not a Citizen | 0 (0.0%) | 1 (100.0%) |
Health Insurance Coverage by Household Income in Hartman
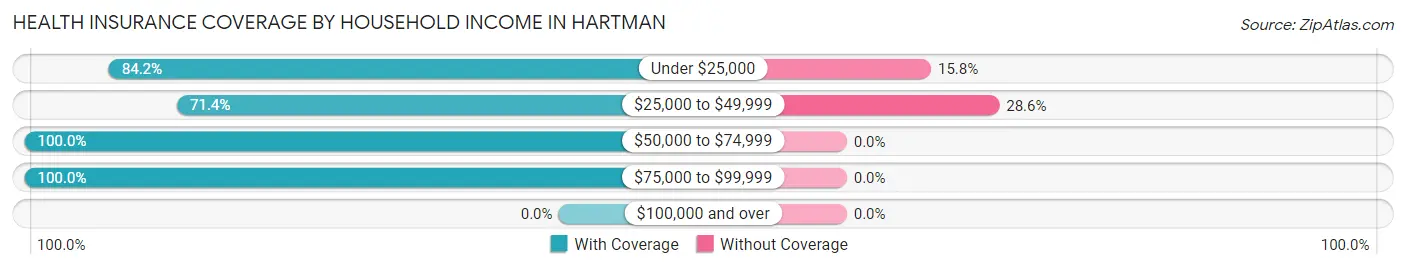
| Household Income | With Coverage | Without Coverage |
| Under $25,000 | 16 (84.2%) | 3 (15.8%) |
| $25,000 to $49,999 | 5 (71.4%) | 2 (28.6%) |
| $50,000 to $74,999 | 12 (100.0%) | 0 (0.0%) |
| $75,000 to $99,999 | 13 (100.0%) | 0 (0.0%) |
| $100,000 and over | 0 (0.0%) | 0 (0.0%) |
Public vs Private Health Insurance Coverage by Age in Hartman
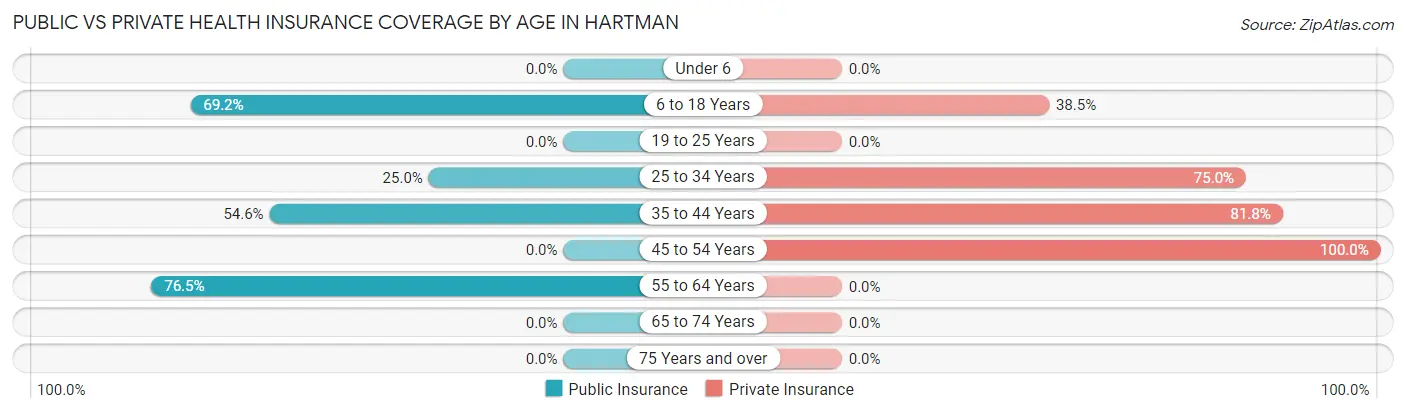
| Age Bracket | Public Insurance | Private Insurance |
| Under 6 | 0 (0.0%) | 0 (0.0%) |
| 6 to 18 Years | 9 (69.2%) | 5 (38.5%) |
| 19 to 25 Years | 0 (0.0%) | 0 (0.0%) |
| 25 to 34 Years | 1 (25.0%) | 3 (75.0%) |
| 35 to 44 Years | 6 (54.5%) | 9 (81.8%) |
| 45 to 54 Years | 0 (0.0%) | 5 (100.0%) |
| 55 to 64 Years | 13 (76.5%) | 0 (0.0%) |
| 65 to 74 Years | 0 (0.0%) | 0 (0.0%) |
| 75 Years and over | 0 (0.0%) | 0 (0.0%) |
| Total | 29 (56.9%) | 22 (43.1%) |
Disability Status by Sex by Age in Hartman
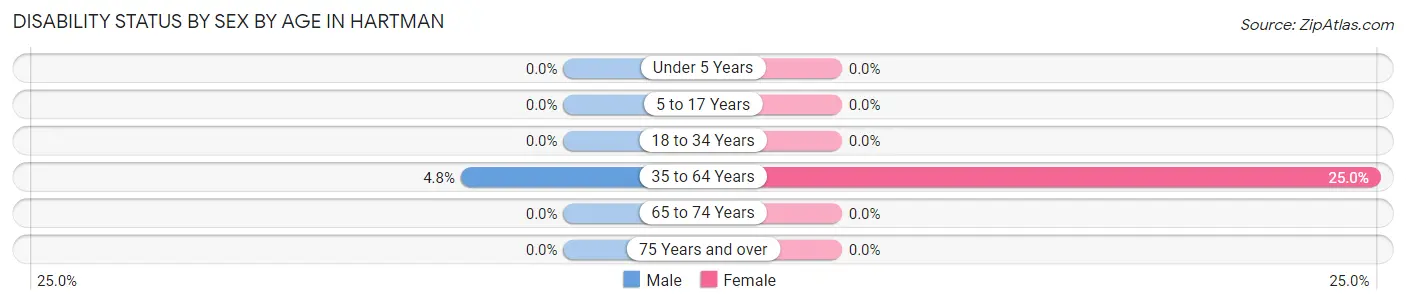
| Age Bracket | Male | Female |
| Under 5 Years | 0 (0.0%) | 0 (0.0%) |
| 5 to 17 Years | 0 (0.0%) | 0 (0.0%) |
| 18 to 34 Years | 0 (0.0%) | 0 (0.0%) |
| 35 to 64 Years | 1 (4.8%) | 3 (25.0%) |
| 65 to 74 Years | 0 (0.0%) | 0 (0.0%) |
| 75 Years and over | 0 (0.0%) | 0 (0.0%) |
Disability Class by Sex by Age in Hartman
Disability Class: Hearing Difficulty
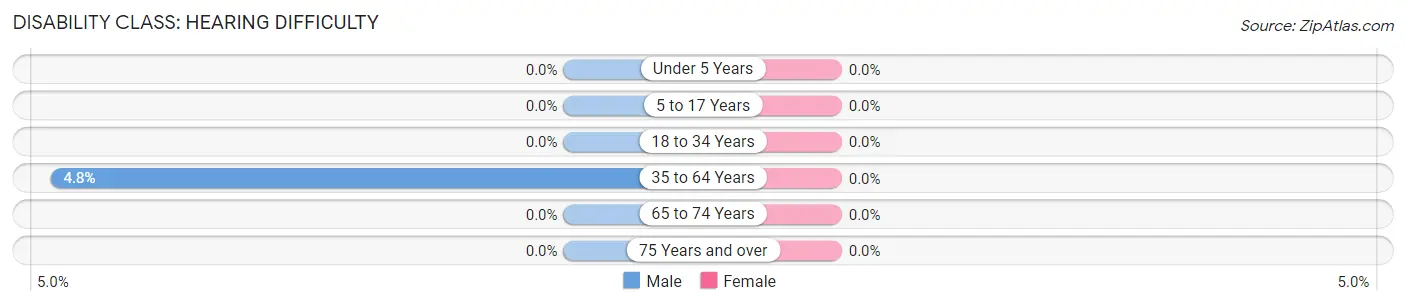
| Age Bracket | Male | Female |
| Under 5 Years | 0 (0.0%) | 0 (0.0%) |
| 5 to 17 Years | 0 (0.0%) | 0 (0.0%) |
| 18 to 34 Years | 0 (0.0%) | 0 (0.0%) |
| 35 to 64 Years | 1 (4.8%) | 0 (0.0%) |
| 65 to 74 Years | 0 (0.0%) | 0 (0.0%) |
| 75 Years and over | 0 (0.0%) | 0 (0.0%) |
Disability Class: Vision Difficulty
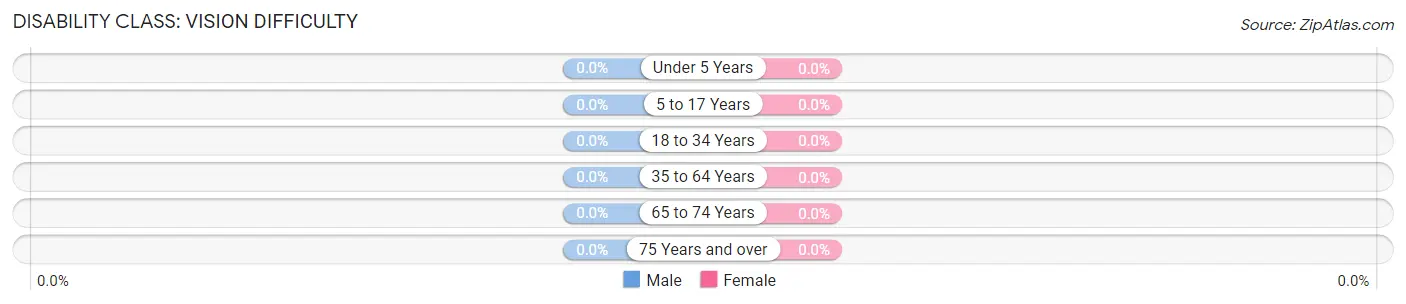
| Age Bracket | Male | Female |
| Under 5 Years | 0 (0.0%) | 0 (0.0%) |
| 5 to 17 Years | 0 (0.0%) | 0 (0.0%) |
| 18 to 34 Years | 0 (0.0%) | 0 (0.0%) |
| 35 to 64 Years | 0 (0.0%) | 0 (0.0%) |
| 65 to 74 Years | 0 (0.0%) | 0 (0.0%) |
| 75 Years and over | 0 (0.0%) | 0 (0.0%) |
Disability Class: Cognitive Difficulty
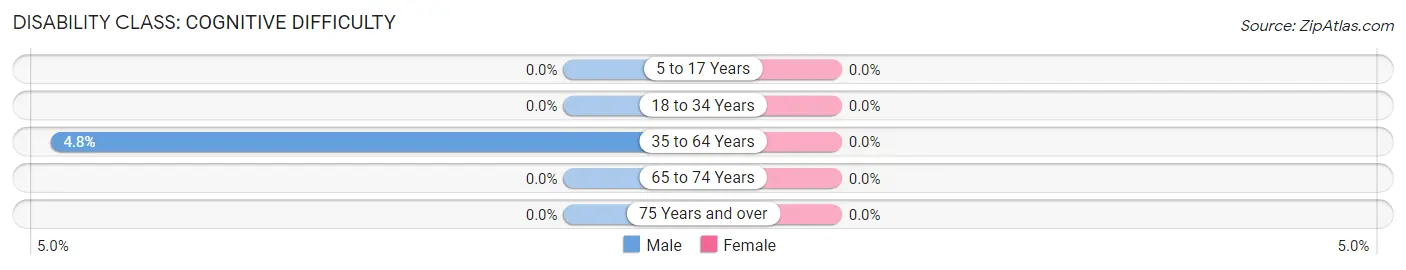
| Age Bracket | Male | Female |
| 5 to 17 Years | 0 (0.0%) | 0 (0.0%) |
| 18 to 34 Years | 0 (0.0%) | 0 (0.0%) |
| 35 to 64 Years | 1 (4.8%) | 0 (0.0%) |
| 65 to 74 Years | 0 (0.0%) | 0 (0.0%) |
| 75 Years and over | 0 (0.0%) | 0 (0.0%) |
Disability Class: Ambulatory Difficulty
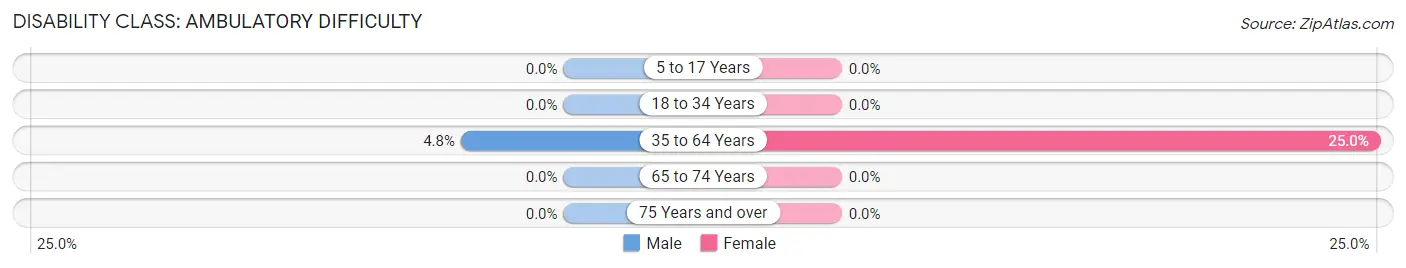
| Age Bracket | Male | Female |
| 5 to 17 Years | 0 (0.0%) | 0 (0.0%) |
| 18 to 34 Years | 0 (0.0%) | 0 (0.0%) |
| 35 to 64 Years | 1 (4.8%) | 3 (25.0%) |
| 65 to 74 Years | 0 (0.0%) | 0 (0.0%) |
| 75 Years and over | 0 (0.0%) | 0 (0.0%) |
Disability Class: Self-Care Difficulty
| Age Bracket | Male | Female |
| 5 to 17 Years | 0 (0.0%) | 0 (0.0%) |
| 18 to 34 Years | 0 (0.0%) | 0 (0.0%) |
| 35 to 64 Years | 0 (0.0%) | 0 (0.0%) |
| 65 to 74 Years | 0 (0.0%) | 0 (0.0%) |
| 75 Years and over | 0 (0.0%) | 0 (0.0%) |
Technology Access in Hartman
Computing Device Access in Hartman
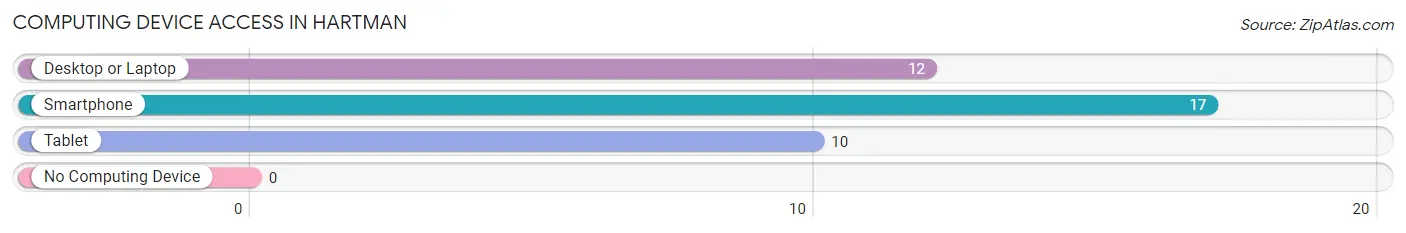
| Device Type | # Households | % Households |
| Desktop or Laptop | 12 | 57.1% |
| Smartphone | 17 | 80.9% |
| Tablet | 10 | 47.6% |
| No Computing Device | 0 | 0.0% |
| Total | 21 | 100.0% |
Internet Access in Hartman
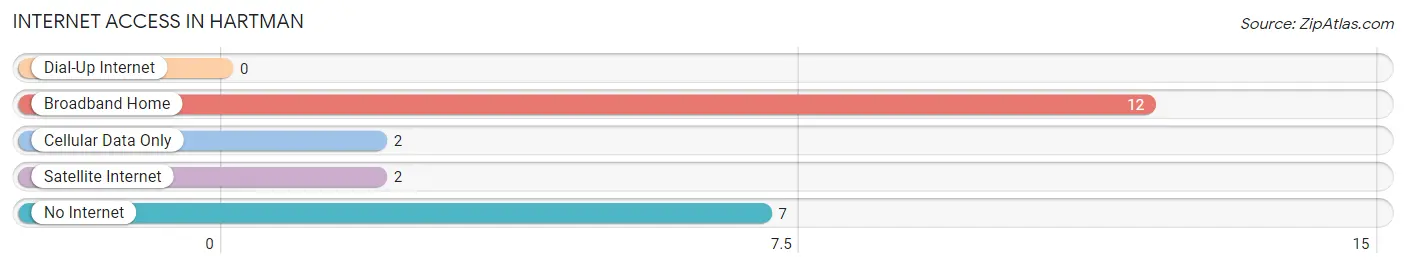
| Internet Type | # Households | % Households |
| Dial-Up Internet | 0 | 0.0% |
| Broadband Home | 12 | 57.1% |
| Cellular Data Only | 2 | 9.5% |
| Satellite Internet | 2 | 9.5% |
| No Internet | 7 | 33.3% |
| Total | 21 | 100.0% |
Hartman Summary
Hartman is a small town located in the northeastern corner of Colorado, in the county of Weld. It is situated on the banks of the South Platte River, and is surrounded by rolling hills and farmland. The town has a population of just over 500 people, and is known for its rural charm and friendly atmosphere.
History
Hartman was founded in 1887 by a group of settlers from the nearby town of Greeley. The town was named after one of the settlers, John Hartman, who was a prominent figure in the area. The town was originally a farming community, and the settlers grew wheat, corn, and other crops. As the town grew, it became a center for trade and commerce, and the first post office was established in 1891.
In the early 1900s, the town began to experience a period of growth and prosperity. The railroad arrived in 1906, and the town was connected to the rest of the state. This allowed for the transportation of goods and services, and the town began to thrive. The population grew to over 500 people by the 1920s, and the town was home to several businesses, including a bank, a hotel, and a general store.
Geography
Hartman is located in the northeastern corner of Colorado, in the county of Weld. It is situated on the banks of the South Platte River, and is surrounded by rolling hills and farmland. The town is located at an elevation of 4,890 feet, and has a total area of 0.6 square miles. The climate is semi-arid, with hot summers and cold winters.
Economy
The economy of Hartman is largely based on agriculture. The town is home to several farms, which produce wheat, corn, and other crops. The town also has a few small businesses, including a general store, a bank, and a hotel. The town is also home to a few manufacturing companies, which produce a variety of products, including furniture and clothing.
Demographics
As of the 2010 census, the population of Hartman was 514 people. The racial makeup of the town was 95.3% White, 0.6% African American, 0.4% Native American, 0.4% Asian, 0.2% Pacific Islander, and 2.1% from other races. The median household income was $41,250, and the median family income was $50,000. The per capita income was $20,845. The town has a poverty rate of 11.3%.
Conclusion
Hartman is a small town located in the northeastern corner of Colorado, in the county of Weld. It is situated on the banks of the South Platte River, and is surrounded by rolling hills and farmland. The town has a population of just over 500 people, and is known for its rural charm and friendly atmosphere. The economy of Hartman is largely based on agriculture, and the town is home to several farms, businesses, and manufacturing companies. The town has a diverse population, with a median household income of $41,250 and a poverty rate of 11.3%.
Common Questions
What is Per Capita Income in Hartman?
Per Capita income in Hartman is $17,973.
What is the Median Family Income in Hartman?
Median Family Income in Hartman is $48,750.
What is Income or Wage Gap in Hartman?
Income or Wage Gap in Hartman is 63.4%.
Women in Hartman earn 36.6 cents for every dollar earned by a man.
What is Inequality or Gini Index in Hartman?
Inequality or Gini Index in Hartman is 0.44.
What is the Total Population of Hartman?
Total Population of Hartman is 51.
What is the Total Male Population of Hartman?
Total Male Population of Hartman is 32.
What is the Total Female Population of Hartman?
Total Female Population of Hartman is 19.
What is the Ratio of Males per 100 Females in Hartman?
There are 168.42 Males per 100 Females in Hartman.
What is the Ratio of Females per 100 Males in Hartman?
There are 59.38 Females per 100 Males in Hartman.
What is the Median Population Age in Hartman?
Median Population Age in Hartman is 44.1 Years.
What is the Average Family Size in Hartman
Average Family Size in Hartman is 3.4 People.
What is the Average Household Size in Hartman
Average Household Size in Hartman is 2.4 People.
How Large is the Labor Force in Hartman?
There are 24 People in the Labor Forcein in Hartman.
What is the Percentage of People in the Labor Force in Hartman?
58.5% of People are in the Labor Force in Hartman.