Avon, CO Map & Demographics
Avon Map
Avon Overview
$51,056
PER CAPITA INCOME
$141,816
AVG FAMILY INCOME
$85,817
AVG HOUSEHOLD INCOME
23.8%
WAGE / INCOME GAP [ % ]
76.2¢/ $1
WAGE / INCOME GAP [ $ ]
0.51
INEQUALITY / GINI INDEX
6,115
TOTAL POPULATION
3,179
MALE POPULATION
2,936
FEMALE POPULATION
108.28
MALES / 100 FEMALES
92.36
FEMALES / 100 MALES
34.8
MEDIAN AGE
3.1
AVG FAMILY SIZE
2.7
AVG HOUSEHOLD SIZE
4,052
LABOR FORCE [ PEOPLE ]
82.7%
PERCENT IN LABOR FORCE
7.1%
UNEMPLOYMENT RATE
Avon Zip Codes
Avon Area Codes
Income in Avon
Income Overview in Avon
Per Capita Income in Avon is $51,056, while median incomes of families and households are $141,816 and $85,817 respectively.
| Characteristic | Number | Measure |
| Per Capita Income | 6,115 | $51,056 |
| Median Family Income | 1,367 | $141,816 |
| Mean Family Income | 1,367 | $166,582 |
| Median Household Income | 2,245 | $85,817 |
| Mean Household Income | 2,245 | $122,365 |
| Income Deficit | 1,367 | $0 |
| Wage / Income Gap (%) | 6,115 | 23.78% |
| Wage / Income Gap ($) | 6,115 | 76.22¢ per $1 |
| Gini / Inequality Index | 6,115 | 0.51 |
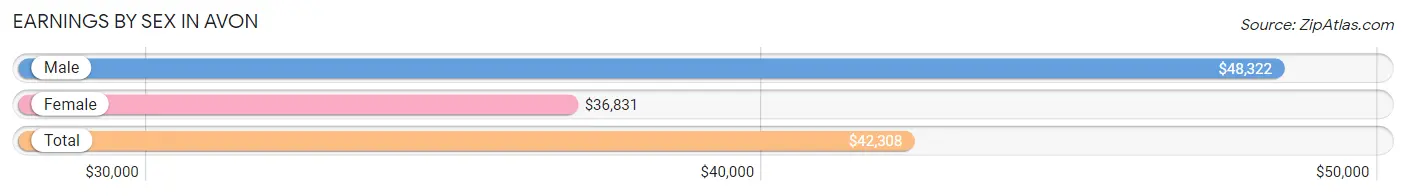
Earnings by Sex in Avon
Average Earnings in Avon are $42,308, $48,322 for men and $36,831 for women, a difference of 23.8%.
| Sex | Number | Average Earnings |
| Male | 2,158 (51.7%) | $48,322 |
| Female | 2,012 (48.2%) | $36,831 |
| Total | 4,170 (100.0%) | $42,308 |
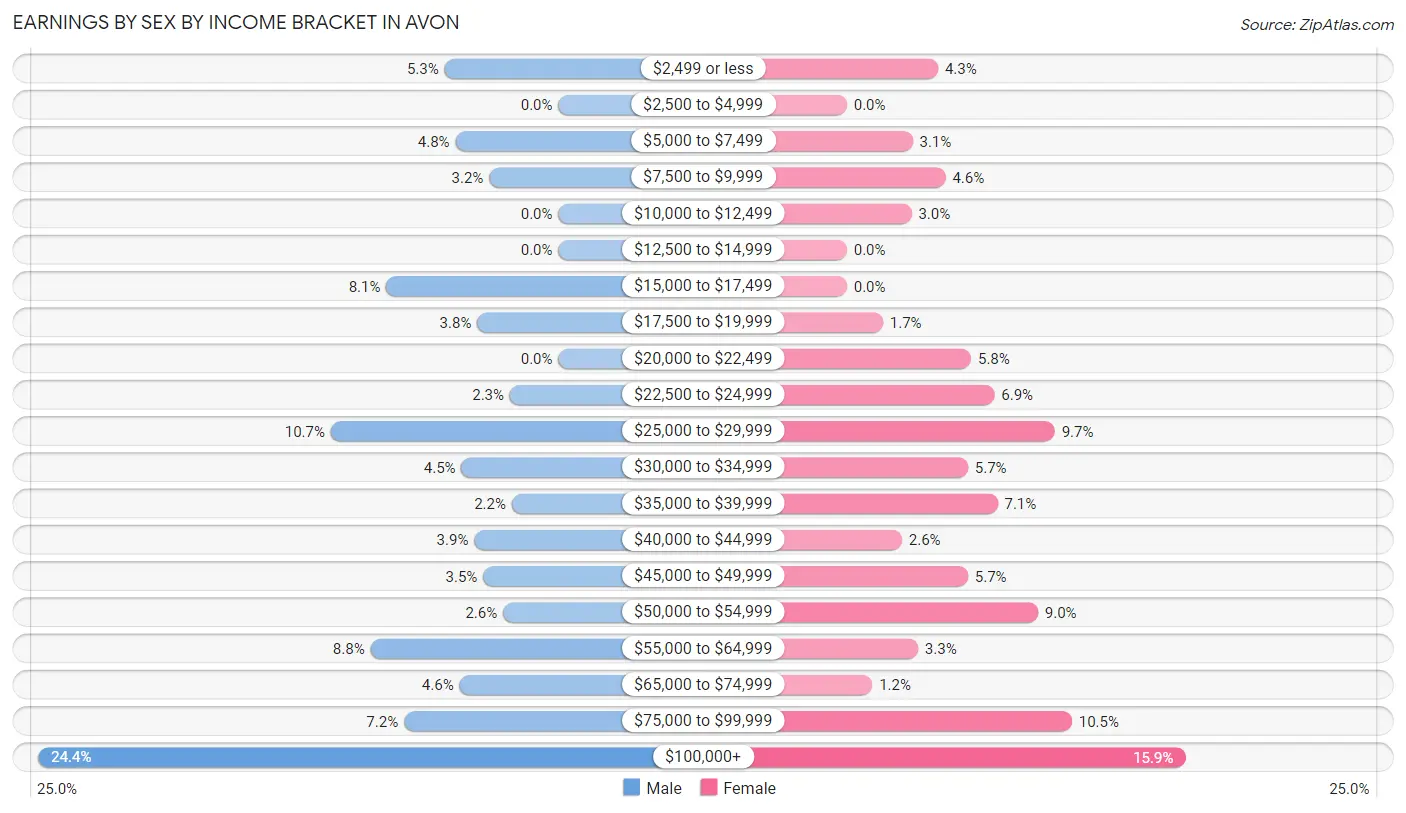
Earnings by Sex by Income Bracket in Avon
The most common earnings brackets in Avon are $100,000+ for men (526 | 24.4%) and $100,000+ for women (319 | 15.9%).
| Income | Male | Female |
| $2,499 or less | 115 (5.3%) | 86 (4.3%) |
| $2,500 to $4,999 | 0 (0.0%) | 0 (0.0%) |
| $5,000 to $7,499 | 104 (4.8%) | 62 (3.1%) |
| $7,500 to $9,999 | 70 (3.2%) | 93 (4.6%) |
| $10,000 to $12,499 | 0 (0.0%) | 61 (3.0%) |
| $12,500 to $14,999 | 0 (0.0%) | 0 (0.0%) |
| $15,000 to $17,499 | 174 (8.1%) | 0 (0.0%) |
| $17,500 to $19,999 | 82 (3.8%) | 34 (1.7%) |
| $20,000 to $22,499 | 0 (0.0%) | 117 (5.8%) |
| $22,500 to $24,999 | 49 (2.3%) | 139 (6.9%) |
| $25,000 to $29,999 | 230 (10.7%) | 196 (9.7%) |
| $30,000 to $34,999 | 98 (4.5%) | 114 (5.7%) |
| $35,000 to $39,999 | 47 (2.2%) | 142 (7.1%) |
| $40,000 to $44,999 | 85 (3.9%) | 52 (2.6%) |
| $45,000 to $49,999 | 76 (3.5%) | 114 (5.7%) |
| $50,000 to $54,999 | 56 (2.6%) | 180 (8.9%) |
| $55,000 to $64,999 | 190 (8.8%) | 67 (3.3%) |
| $65,000 to $74,999 | 100 (4.6%) | 24 (1.2%) |
| $75,000 to $99,999 | 156 (7.2%) | 212 (10.5%) |
| $100,000+ | 526 (24.4%) | 319 (15.9%) |
| Total | 2,158 (100.0%) | 2,012 (100.0%) |
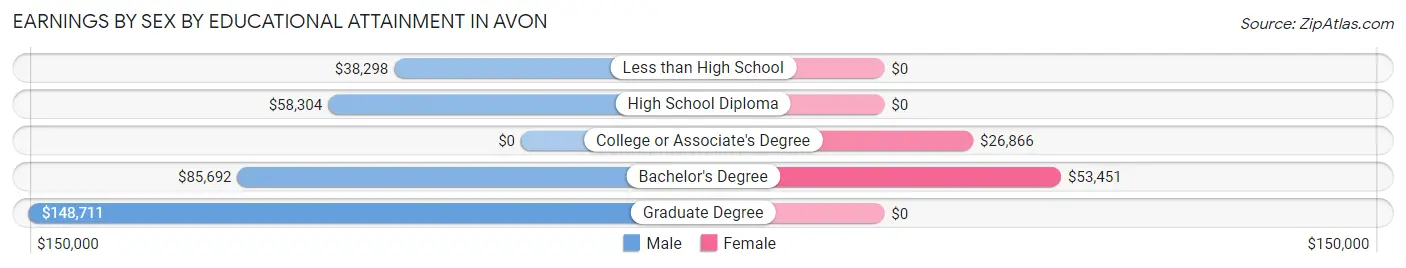
Earnings by Sex by Educational Attainment in Avon
Average earnings in Avon are $57,596 for men and $41,250 for women, a difference of 28.4%. Men with an educational attainment of graduate degree enjoy the highest average annual earnings of $148,711, while those with less than high school education earn the least with $38,298. Women with an educational attainment of bachelor's degree earn the most with the average annual earnings of $53,451, while those with college or associate's degree education have the smallest earnings of $26,866.
| Educational Attainment | Male Income | Female Income |
| Less than High School | $38,298 | $0 |
| High School Diploma | $58,304 | $0 |
| College or Associate's Degree | - | - |
| Bachelor's Degree | $85,692 | $53,451 |
| Graduate Degree | $148,711 | $0 |
| Total | $57,596 | $41,250 |
Family Income in Avon
Family Income Brackets in Avon
According to the Avon family income data, there are 409 families falling into the $200,000+ income range, which is the most common income bracket and makes up 29.9% of all families.
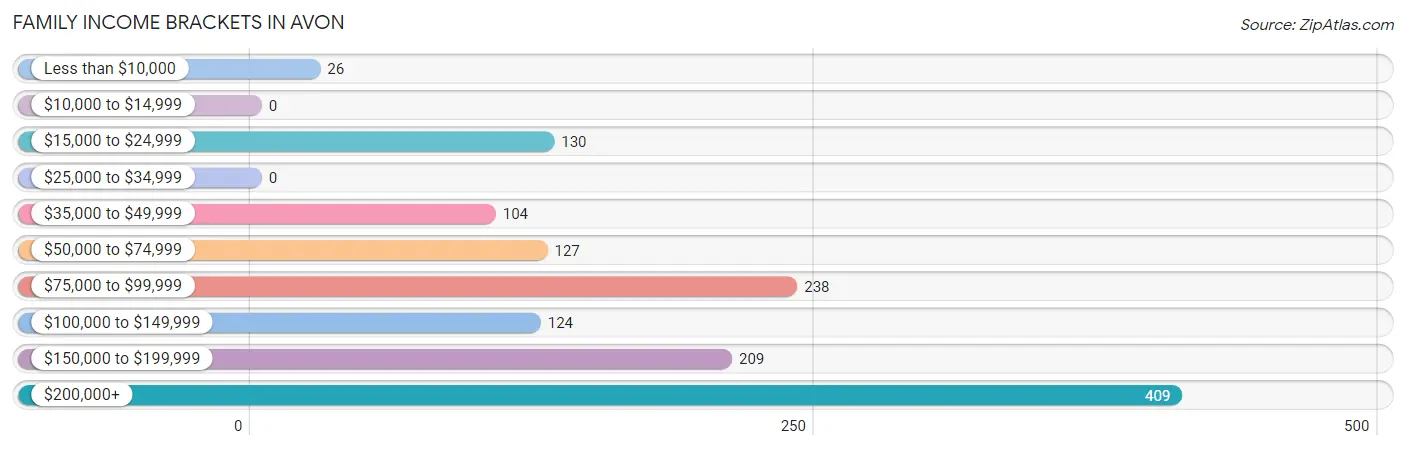
| Income Bracket | # Families | % Families |
| Less than $10,000 | 26 | 1.9% |
| $10,000 to $14,999 | 0 | 0.0% |
| $15,000 to $24,999 | 130 | 9.5% |
| $25,000 to $34,999 | 0 | 0.0% |
| $35,000 to $49,999 | 104 | 7.6% |
| $50,000 to $74,999 | 127 | 9.3% |
| $75,000 to $99,999 | 238 | 17.4% |
| $100,000 to $149,999 | 124 | 9.1% |
| $150,000 to $199,999 | 209 | 15.3% |
| $200,000+ | 409 | 29.9% |
Family Income by Famaliy Size in Avon
2-person families (724 | 53.0%) account for the highest median family income in Avon with $170,284 per family, while 2-person families (724 | 53.0%) have the highest median income of $85,142 per family member.
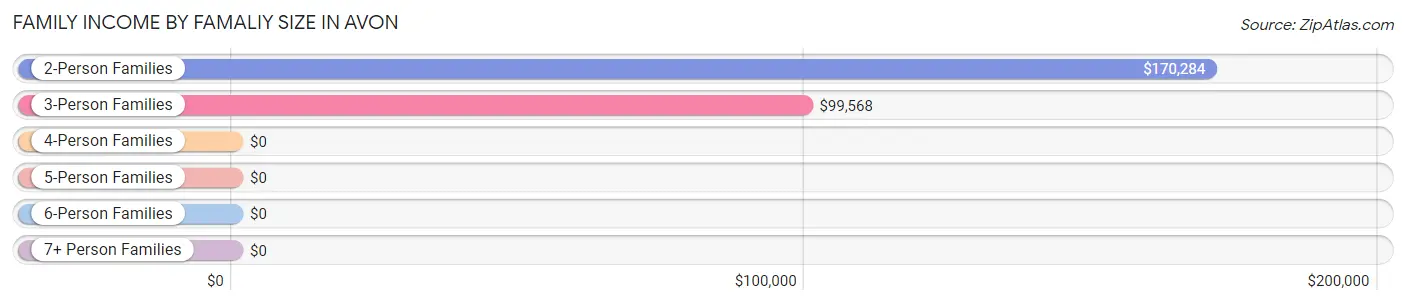
| Income Bracket | # Families | Median Income |
| 2-Person Families | 724 (53.0%) | $170,284 |
| 3-Person Families | 237 (17.3%) | $99,568 |
| 4-Person Families | 262 (19.2%) | $0 |
| 5-Person Families | 115 (8.4%) | $0 |
| 6-Person Families | 0 (0.0%) | $0 |
| 7+ Person Families | 29 (2.1%) | $0 |
| Total | 1,367 (100.0%) | $141,816 |
Family Income by Number of Earners in Avon
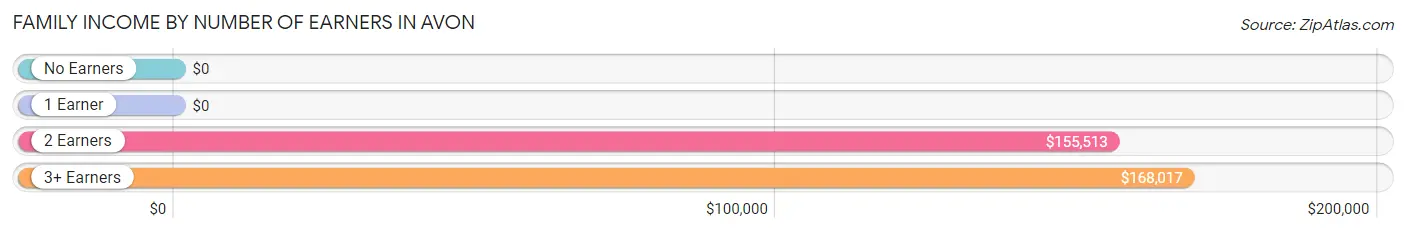
| Number of Earners | # Families | Median Income |
| No Earners | 26 (1.9%) | $0 |
| 1 Earner | 415 (30.4%) | $0 |
| 2 Earners | 768 (56.2%) | $155,513 |
| 3+ Earners | 158 (11.6%) | $168,017 |
| Total | 1,367 (100.0%) | $141,816 |
Household Income in Avon
Household Income Brackets in Avon
With 431 households falling in the category, the $200,000+ income range is the most frequent in Avon, accounting for 19.2% of all households. In contrast, only 34 households (1.5%) fall into the $10,000 to $14,999 income bracket, making it the least populous group.
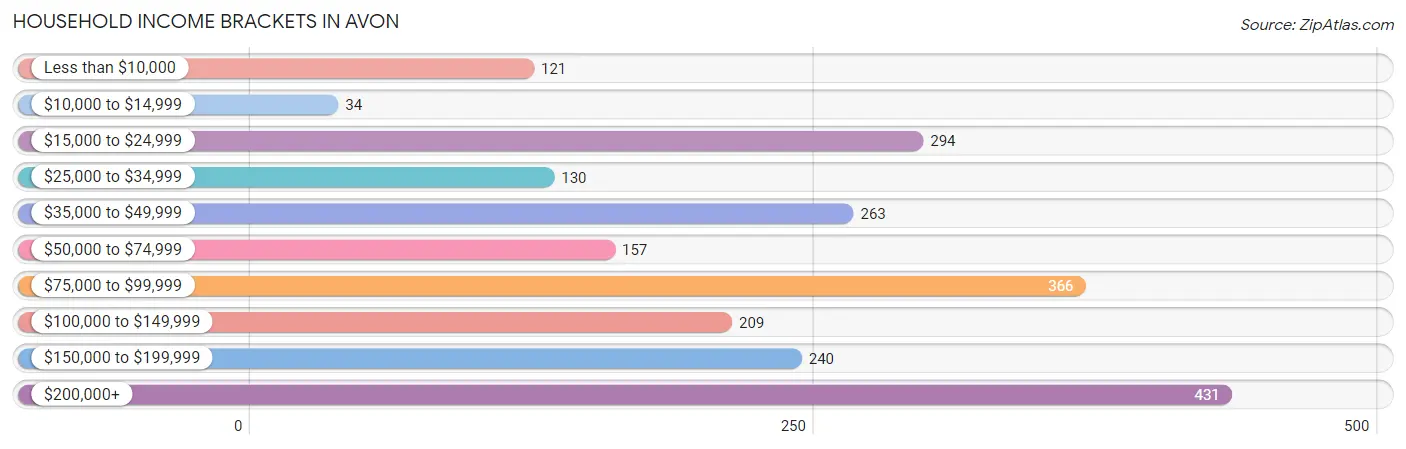
| Income Bracket | # Households | % Households |
| Less than $10,000 | 121 | 5.4% |
| $10,000 to $14,999 | 34 | 1.5% |
| $15,000 to $24,999 | 294 | 13.1% |
| $25,000 to $34,999 | 130 | 5.8% |
| $35,000 to $49,999 | 263 | 11.7% |
| $50,000 to $74,999 | 157 | 7.0% |
| $75,000 to $99,999 | 366 | 16.3% |
| $100,000 to $149,999 | 209 | 9.3% |
| $150,000 to $199,999 | 240 | 10.7% |
| $200,000+ | 431 | 19.2% |
Household Income by Householder Age in Avon
The median household income in Avon is $85,817, with the highest median household income of $236,761 found in the 65+ years age bracket for the primary householder. A total of 267 households (11.9%) fall into this category. Meanwhile, the 15 to 24 years age bracket for the primary householder has the lowest median household income of $16,157, with 128 households (5.7%) in this group.
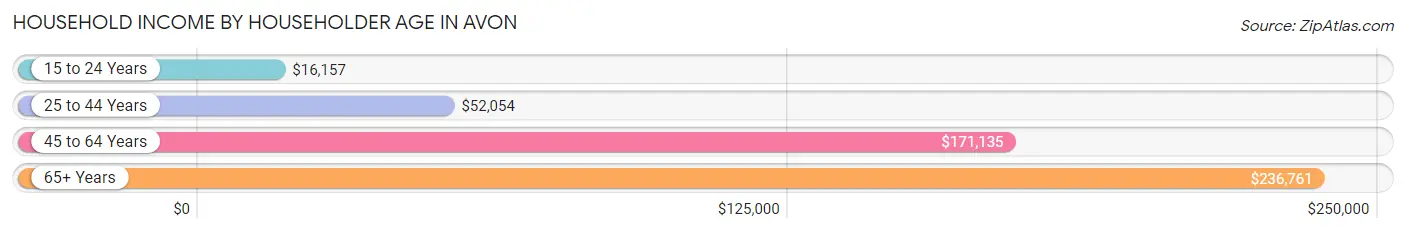
| Income Bracket | # Households | Median Income |
| 15 to 24 Years | 128 (5.7%) | $16,157 |
| 25 to 44 Years | 1,132 (50.4%) | $52,054 |
| 45 to 64 Years | 718 (32.0%) | $171,135 |
| 65+ Years | 267 (11.9%) | $236,761 |
| Total | 2,245 (100.0%) | $85,817 |
Poverty in Avon
Income Below Poverty by Sex and Age in Avon
With 11.5% poverty level for males and 15.0% for females among the residents of Avon, 45 to 54 year old males and under 5 year old females are the most vulnerable to poverty, with 130 males (29.3%) and 89 females (54.9%) in their respective age groups living below the poverty level.
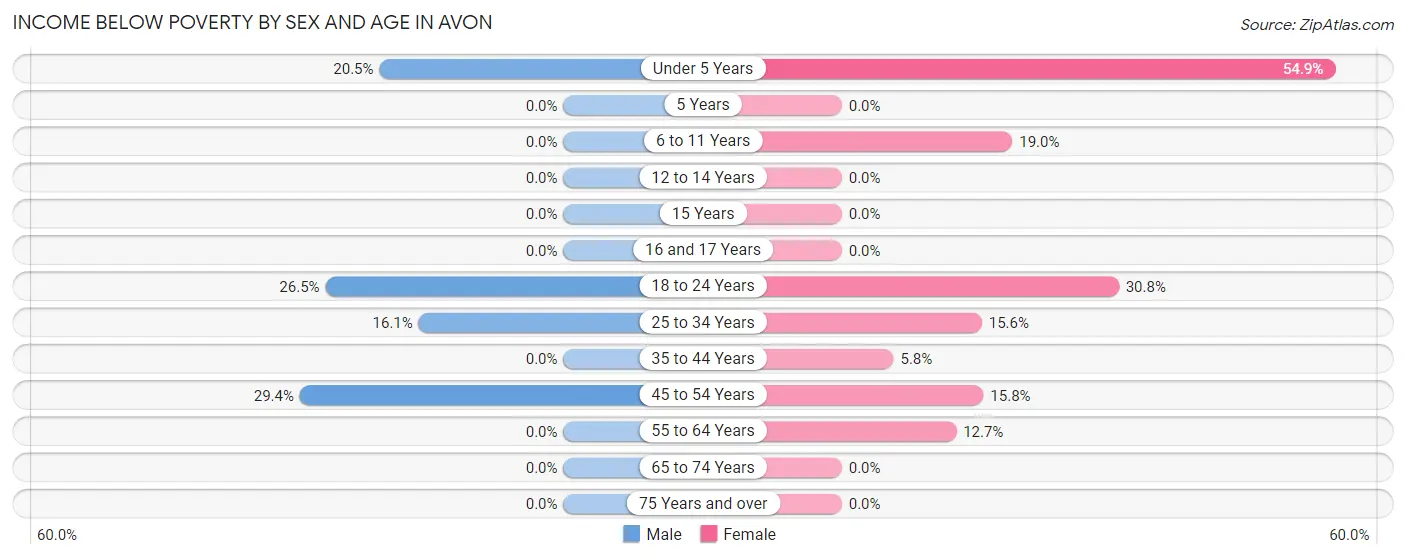
| Age Bracket | Male | Female |
| Under 5 Years | 59 (20.5%) | 89 (54.9%) |
| 5 Years | 0 (0.0%) | 0 (0.0%) |
| 6 to 11 Years | 0 (0.0%) | 49 (19.0%) |
| 12 to 14 Years | 0 (0.0%) | 0 (0.0%) |
| 15 Years | 0 (0.0%) | 0 (0.0%) |
| 16 and 17 Years | 0 (0.0%) | 0 (0.0%) |
| 18 to 24 Years | 75 (26.5%) | 33 (30.8%) |
| 25 to 34 Years | 103 (16.1%) | 109 (15.6%) |
| 35 to 44 Years | 0 (0.0%) | 26 (5.8%) |
| 45 to 54 Years | 130 (29.3%) | 76 (15.8%) |
| 55 to 64 Years | 0 (0.0%) | 59 (12.7%) |
| 65 to 74 Years | 0 (0.0%) | 0 (0.0%) |
| 75 Years and over | 0 (0.0%) | 0 (0.0%) |
| Total | 367 (11.5%) | 441 (15.0%) |
Income Above Poverty by Sex and Age in Avon
According to the poverty statistics in Avon, males aged 6 to 11 years and females aged 12 to 14 years are the age groups that are most secure financially, with 100.0% of males and 100.0% of females in these age groups living above the poverty line.
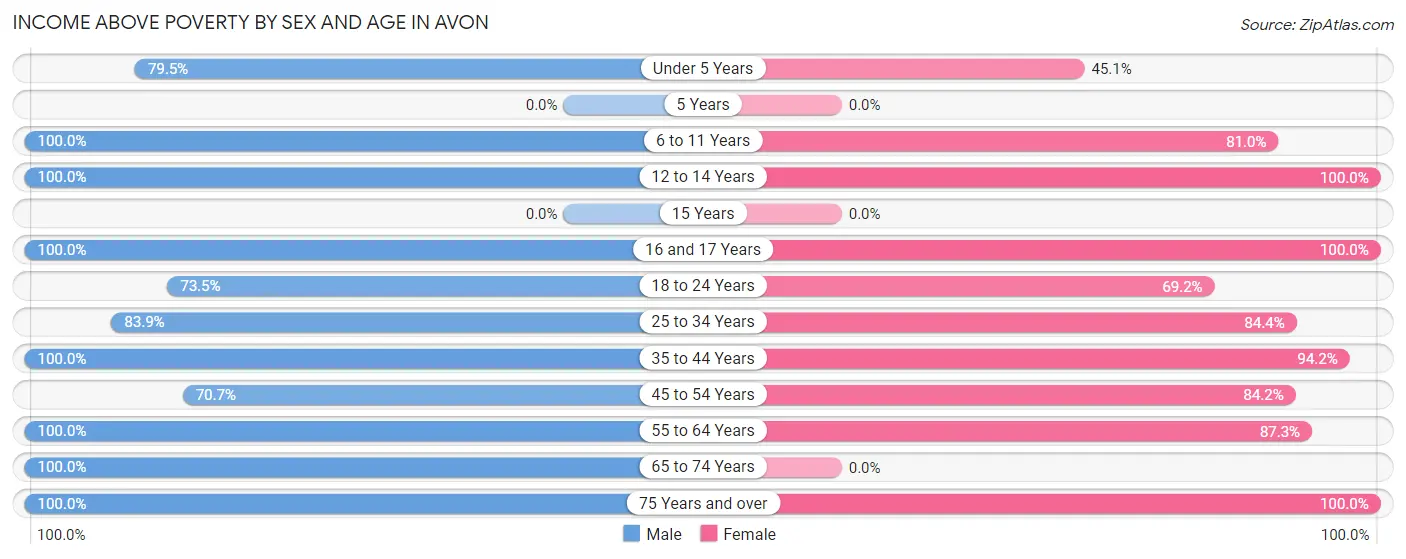
| Age Bracket | Male | Female |
| Under 5 Years | 229 (79.5%) | 73 (45.1%) |
| 5 Years | 0 (0.0%) | 0 (0.0%) |
| 6 to 11 Years | 270 (100.0%) | 209 (81.0%) |
| 12 to 14 Years | 58 (100.0%) | 179 (100.0%) |
| 15 Years | 0 (0.0%) | 0 (0.0%) |
| 16 and 17 Years | 111 (100.0%) | 48 (100.0%) |
| 18 to 24 Years | 208 (73.5%) | 74 (69.2%) |
| 25 to 34 Years | 536 (83.9%) | 590 (84.4%) |
| 35 to 44 Years | 494 (100.0%) | 425 (94.2%) |
| 45 to 54 Years | 313 (70.7%) | 406 (84.2%) |
| 55 to 64 Years | 413 (100.0%) | 404 (87.3%) |
| 65 to 74 Years | 149 (100.0%) | 0 (0.0%) |
| 75 Years and over | 31 (100.0%) | 87 (100.0%) |
| Total | 2,812 (88.5%) | 2,495 (85.0%) |
Income Below Poverty Among Married-Couple Families in Avon
The poverty statistics for married-couple families in Avon show that 6.4% or 77 of the total 1,213 families live below the poverty line. Families with 1 or 2 children have the highest poverty rate of 17.2%, comprising of 77 families. On the other hand, families with no children have the lowest poverty rate of 0.0%, which includes 0 families.
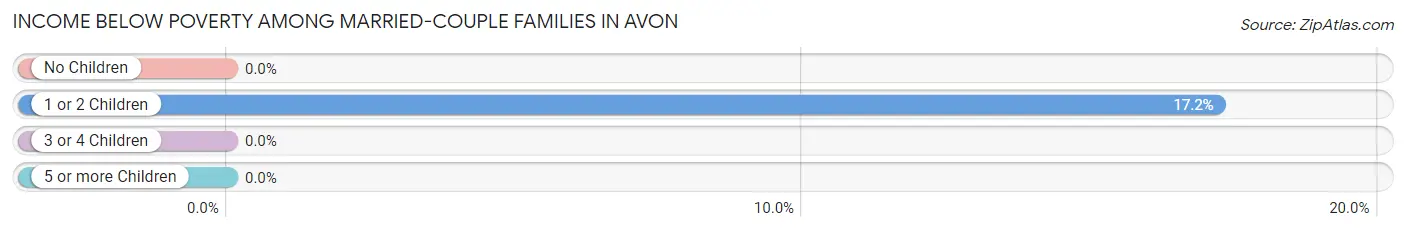
| Children | Above Poverty | Below Poverty |
| No Children | 650 (100.0%) | 0 (0.0%) |
| 1 or 2 Children | 371 (82.8%) | 77 (17.2%) |
| 3 or 4 Children | 115 (100.0%) | 0 (0.0%) |
| 5 or more Children | 0 (0.0%) | 0 (0.0%) |
| Total | 1,136 (93.6%) | 77 (6.4%) |
Income Below Poverty Among Single-Parent Households in Avon
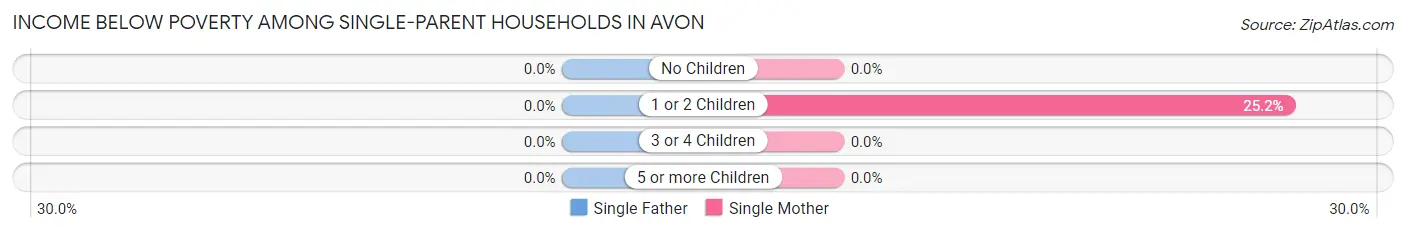
| Children | Single Father | Single Mother |
| No Children | 0 (0.0%) | 0 (0.0%) |
| 1 or 2 Children | 0 (0.0%) | 26 (25.2%) |
| 3 or 4 Children | 0 (0.0%) | 0 (0.0%) |
| 5 or more Children | 0 (0.0%) | 0 (0.0%) |
| Total | 0 (0.0%) | 26 (16.9%) |
Income Below Poverty Among Married-Couple vs Single-Parent Households in Avon
The poverty data for Avon shows that 77 of the married-couple family households (6.4%) and 26 of the single-parent households (16.9%) are living below the poverty level. Within the married-couple family households, those with 1 or 2 children have the highest poverty rate, with 77 households (17.2%) falling below the poverty line. Among the single-parent households, those with 1 or 2 children have the highest poverty rate, with 26 household (25.2%) living below poverty.
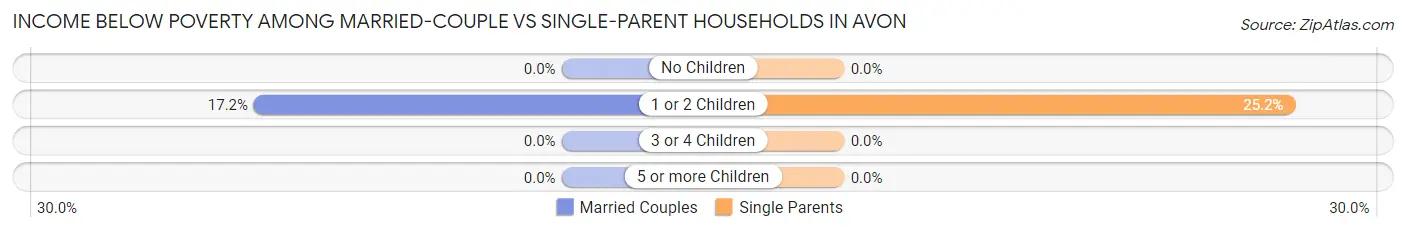
| Children | Married-Couple Families | Single-Parent Households |
| No Children | 0 (0.0%) | 0 (0.0%) |
| 1 or 2 Children | 77 (17.2%) | 26 (25.2%) |
| 3 or 4 Children | 0 (0.0%) | 0 (0.0%) |
| 5 or more Children | 0 (0.0%) | 0 (0.0%) |
| Total | 77 (6.4%) | 26 (16.9%) |
Race in Avon
The most populous races in Avon are White / Caucasian (4,298 | 70.3%), Hispanic or Latino (2,006 | 32.8%), and Two or more Races (1,221 | 20.0%).
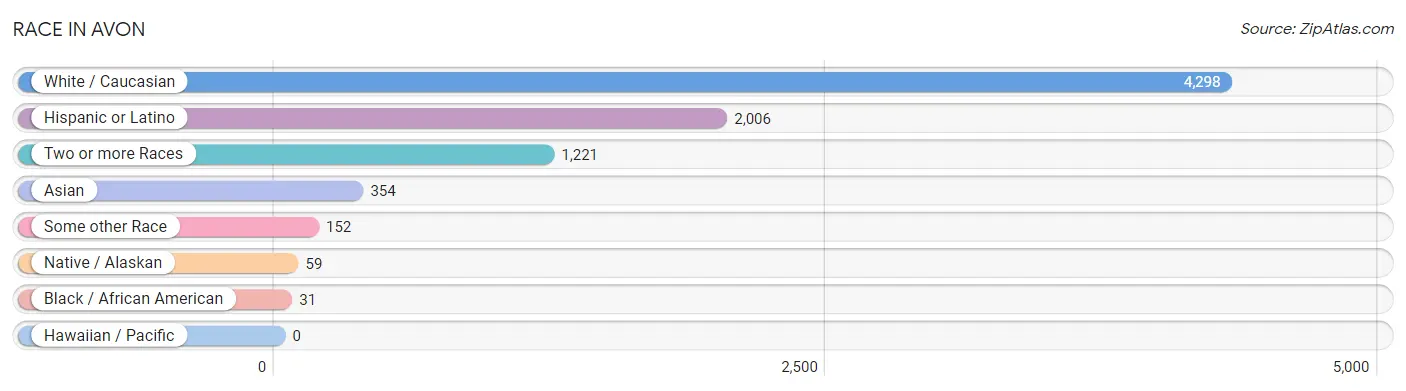
| Race | # Population | % Population |
| Asian | 354 | 5.8% |
| Black / African American | 31 | 0.5% |
| Hawaiian / Pacific | 0 | 0.0% |
| Hispanic or Latino | 2,006 | 32.8% |
| Native / Alaskan | 59 | 1.0% |
| White / Caucasian | 4,298 | 70.3% |
| Two or more Races | 1,221 | 20.0% |
| Some other Race | 152 | 2.5% |
| Total | 6,115 | 100.0% |
Ancestry in Avon
The most populous ancestries reported in Avon are Mexican (1,240 | 20.3%), Italian (626 | 10.2%), Central American (427 | 7.0%), English (388 | 6.4%), and Irish (344 | 5.6%), together accounting for 49.5% of all Avon residents.
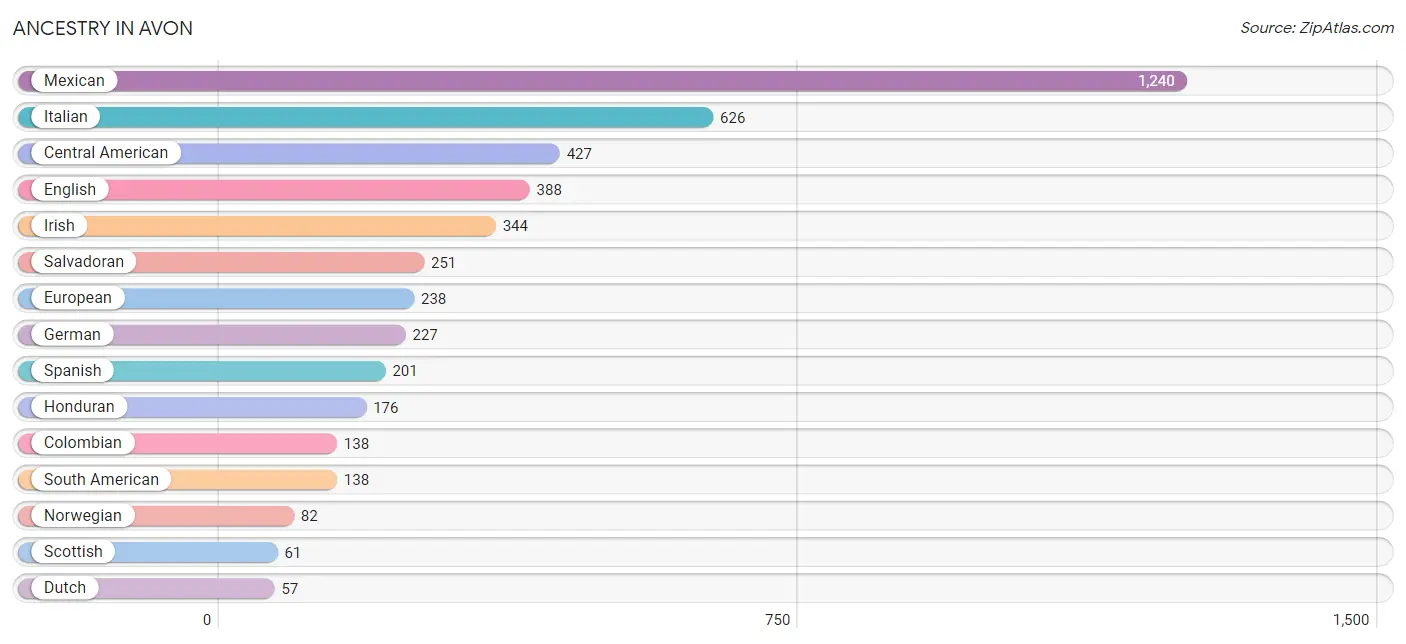
| Ancestry | # Population | % Population |
| African | 31 | 0.5% |
| Austrian | 55 | 0.9% |
| Burmese | 18 | 0.3% |
| Central American | 427 | 7.0% |
| Cherokee | 56 | 0.9% |
| Colombian | 138 | 2.3% |
| Dutch | 57 | 0.9% |
| English | 388 | 6.4% |
| European | 238 | 3.9% |
| German | 227 | 3.7% |
| Honduran | 176 | 2.9% |
| Hopi | 27 | 0.4% |
| Irish | 344 | 5.6% |
| Italian | 626 | 10.2% |
| Mexican | 1,240 | 20.3% |
| Norwegian | 82 | 1.3% |
| Polish | 45 | 0.7% |
| Salvadoran | 251 | 4.1% |
| Scotch-Irish | 53 | 0.9% |
| Scottish | 61 | 1.0% |
| South American | 138 | 2.3% |
| Spanish | 201 | 3.3% |
| Sri Lankan | 12 | 0.2% |
| Subsaharan African | 31 | 0.5% | View All 24 Rows |
Immigrants in Avon
The most numerous immigrant groups reported in Avon came from Latin America (946 | 15.5%), Central America (924 | 15.1%), Mexico (641 | 10.5%), Asia (365 | 6.0%), and South Central Asia (365 | 6.0%), together accounting for 53.0% of all Avon residents.
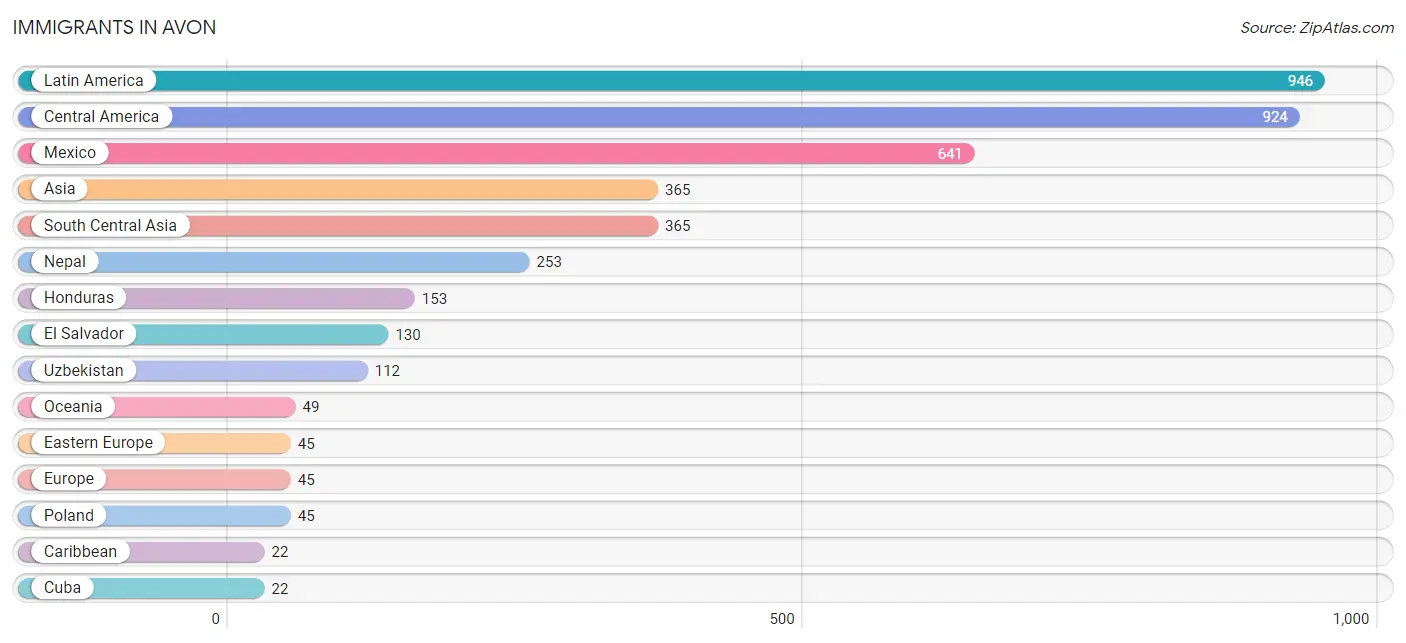
| Immigration Origin | # Population | % Population |
| Asia | 365 | 6.0% |
| Caribbean | 22 | 0.4% |
| Central America | 924 | 15.1% |
| Cuba | 22 | 0.4% |
| Eastern Europe | 45 | 0.7% |
| El Salvador | 130 | 2.1% |
| Europe | 45 | 0.7% |
| Honduras | 153 | 2.5% |
| Latin America | 946 | 15.5% |
| Mexico | 641 | 10.5% |
| Nepal | 253 | 4.1% |
| Oceania | 49 | 0.8% |
| Poland | 45 | 0.7% |
| South Central Asia | 365 | 6.0% |
| Uzbekistan | 112 | 1.8% | View All 15 Rows |
Sex and Age in Avon
Sex and Age in Avon
The most populous age groups in Avon are 30 to 34 Years (419 | 13.2%) for men and 30 to 34 Years (498 | 17.0%) for women.
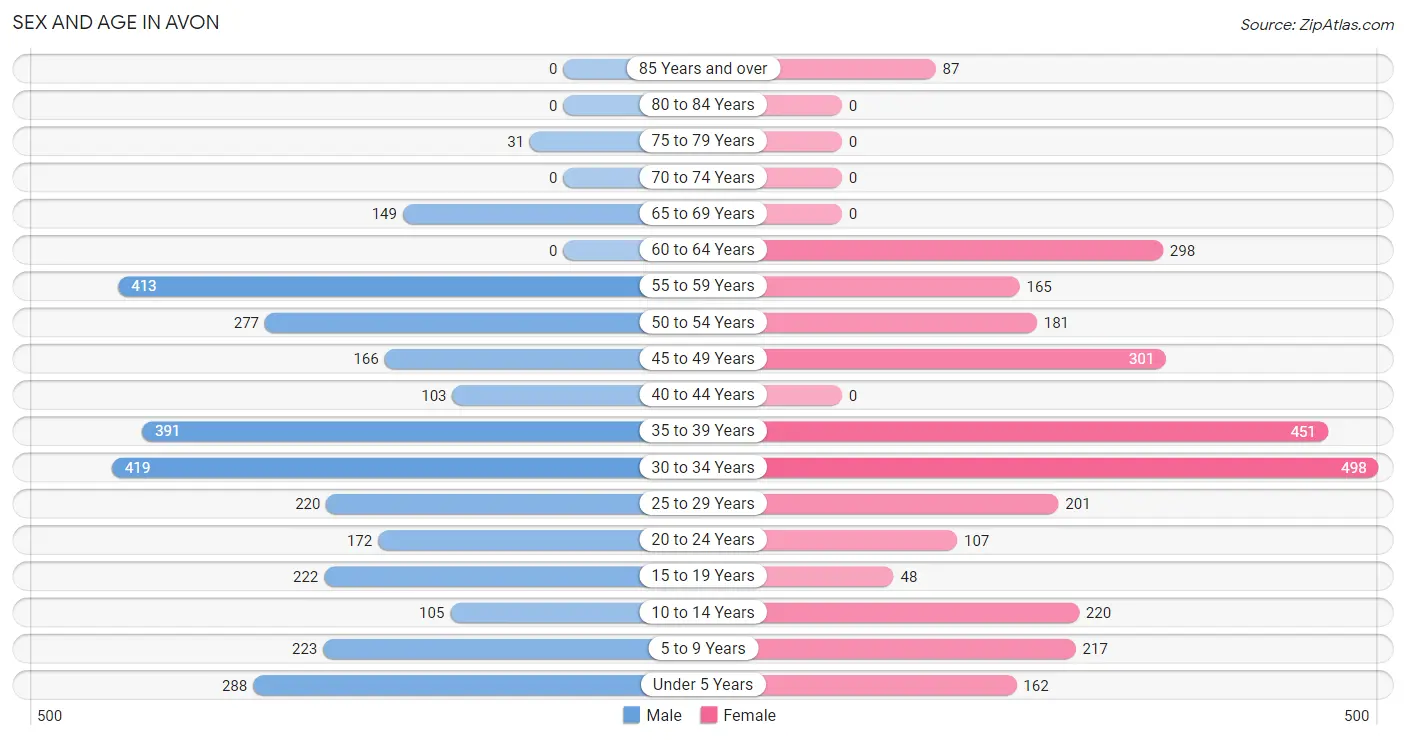
| Age Bracket | Male | Female |
| Under 5 Years | 288 (9.1%) | 162 (5.5%) |
| 5 to 9 Years | 223 (7.0%) | 217 (7.4%) |
| 10 to 14 Years | 105 (3.3%) | 220 (7.5%) |
| 15 to 19 Years | 222 (7.0%) | 48 (1.6%) |
| 20 to 24 Years | 172 (5.4%) | 107 (3.6%) |
| 25 to 29 Years | 220 (6.9%) | 201 (6.9%) |
| 30 to 34 Years | 419 (13.2%) | 498 (17.0%) |
| 35 to 39 Years | 391 (12.3%) | 451 (15.4%) |
| 40 to 44 Years | 103 (3.2%) | 0 (0.0%) |
| 45 to 49 Years | 166 (5.2%) | 301 (10.2%) |
| 50 to 54 Years | 277 (8.7%) | 181 (6.2%) |
| 55 to 59 Years | 413 (13.0%) | 165 (5.6%) |
| 60 to 64 Years | 0 (0.0%) | 298 (10.2%) |
| 65 to 69 Years | 149 (4.7%) | 0 (0.0%) |
| 70 to 74 Years | 0 (0.0%) | 0 (0.0%) |
| 75 to 79 Years | 31 (1.0%) | 0 (0.0%) |
| 80 to 84 Years | 0 (0.0%) | 0 (0.0%) |
| 85 Years and over | 0 (0.0%) | 87 (3.0%) |
| Total | 3,179 (100.0%) | 2,936 (100.0%) |
Families and Households in Avon
Median Family Size in Avon
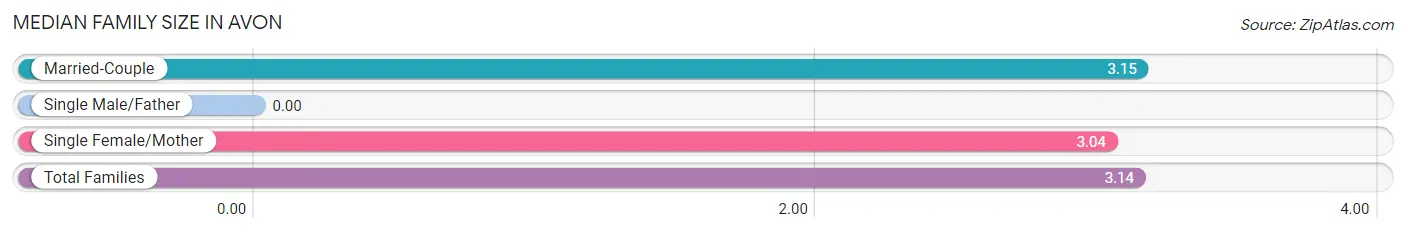
| Family Type | # Families | Family Size |
| Married-Couple | 1,213 (88.7%) | 3.15 |
| Single Male/Father | 0 (0.0%) | - |
| Single Female/Mother | 154 (11.3%) | 3.04 |
| Total Families | 1,367 (100.0%) | 3.14 |
Median Household Size in Avon
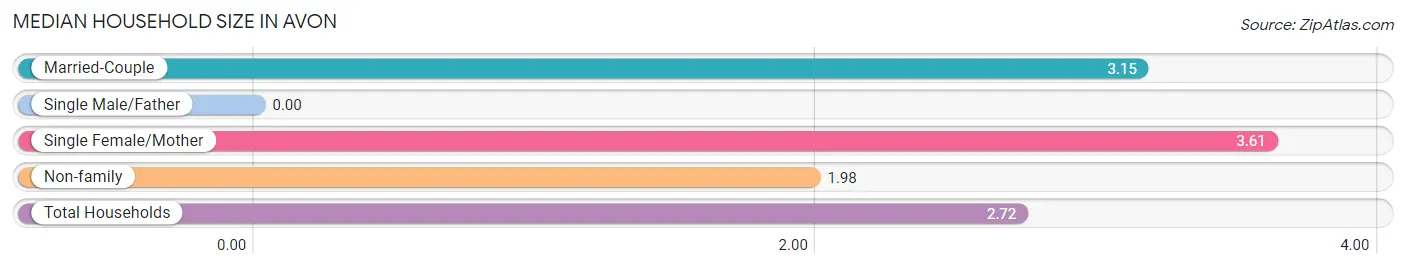
| Household Type | # Households | Household Size |
| Married-Couple | 1,213 (54.0%) | 3.15 |
| Single Male/Father | 0 (0.0%) | - |
| Single Female/Mother | 154 (6.9%) | 3.61 |
| Non-family | 878 (39.1%) | 1.98 |
| Total Households | 2,245 (100.0%) | 2.72 |
Household Size by Marriage Status in Avon
Out of a total of 2,245 households in Avon, 1,367 (60.9%) are family households, while 878 (39.1%) are nonfamily households. The most numerous type of family households are 2-person households, comprising 645, and the most common type of nonfamily households are 1-person households, comprising 569.
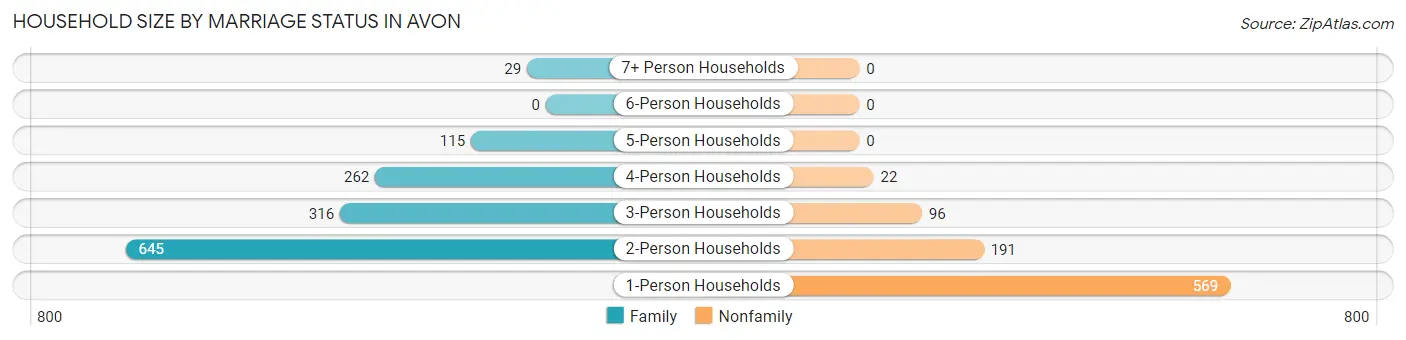
| Household Size | Family Households | Nonfamily Households |
| 1-Person Households | - | 569 (25.4%) |
| 2-Person Households | 645 (28.7%) | 191 (8.5%) |
| 3-Person Households | 316 (14.1%) | 96 (4.3%) |
| 4-Person Households | 262 (11.7%) | 22 (1.0%) |
| 5-Person Households | 115 (5.1%) | 0 (0.0%) |
| 6-Person Households | 0 (0.0%) | 0 (0.0%) |
| 7+ Person Households | 29 (1.3%) | 0 (0.0%) |
| Total | 1,367 (60.9%) | 878 (39.1%) |
Female Fertility in Avon
Fertility by Age in Avon
Average fertility rate in Avon is 103.0 births per 1,000 women. Women in the age bracket of 35 to 50 years have the highest fertility rate with 160.0 births per 1,000 women. Women in the age bracket of 35 to 50 years acount for 72.7% of all women with births.
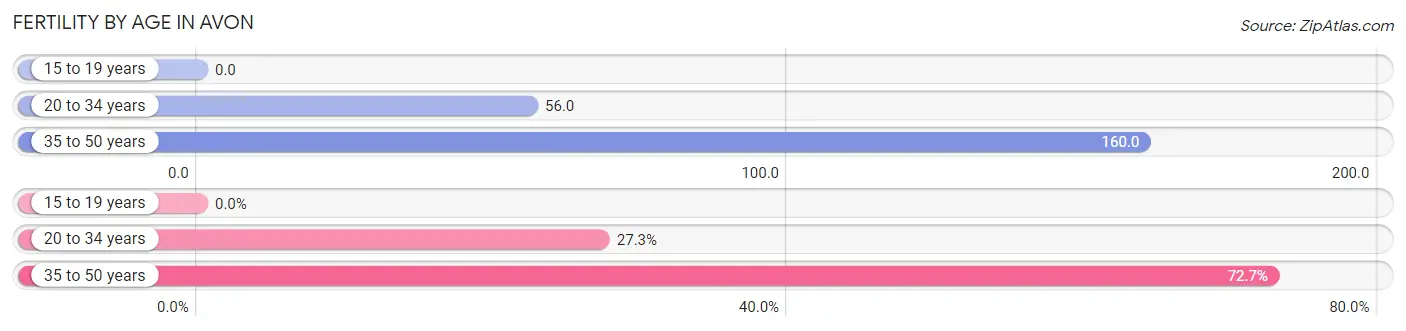
| Age Bracket | Women with Births | Births / 1,000 Women |
| 15 to 19 years | 0 (0.0%) | 0.0 |
| 20 to 34 years | 45 (27.3%) | 56.0 |
| 35 to 50 years | 120 (72.7%) | 160.0 |
| Total | 165 (100.0%) | 103.0 |
Fertility by Age by Marriage Status in Avon
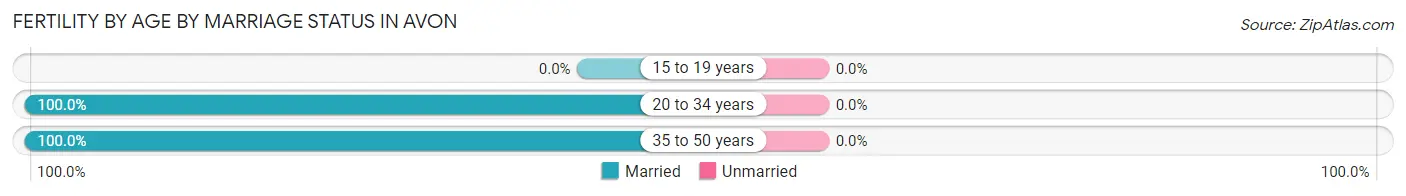
| Age Bracket | Married | Unmarried |
| 15 to 19 years | 0 (0.0%) | 0 (0.0%) |
| 20 to 34 years | 45 (100.0%) | 0 (0.0%) |
| 35 to 50 years | 120 (100.0%) | 0 (0.0%) |
| Total | 165 (100.0%) | 0 (0.0%) |
Fertility by Education in Avon
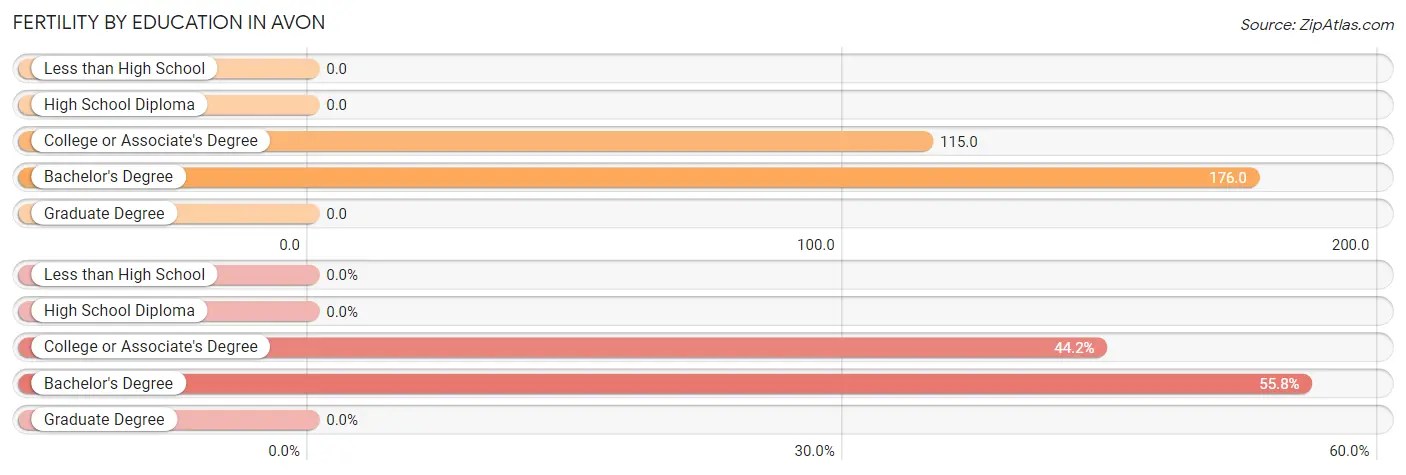
| Educational Attainment | Women with Births | Births / 1,000 Women |
| Less than High School | 0 (0.0%) | 0.0 |
| High School Diploma | 0 (0.0%) | 0.0 |
| College or Associate's Degree | 73 (44.2%) | 115.0 |
| Bachelor's Degree | 92 (55.8%) | 176.0 |
| Graduate Degree | 0 (0.0%) | 0.0 |
| Total | 165 (100.0%) | 103.0 |
Fertility by Education by Marriage Status in Avon
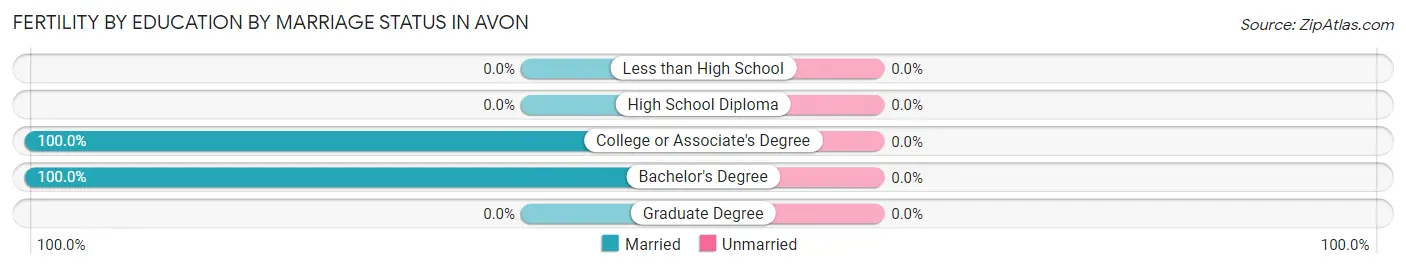
| Educational Attainment | Married | Unmarried |
| Less than High School | 0 (0.0%) | 0 (0.0%) |
| High School Diploma | 0 (0.0%) | 0 (0.0%) |
| College or Associate's Degree | 73 (100.0%) | 0 (0.0%) |
| Bachelor's Degree | 92 (100.0%) | 0 (0.0%) |
| Graduate Degree | 0 (0.0%) | 0 (0.0%) |
| Total | 165 (100.0%) | 0 (0.0%) |
Employment Characteristics in Avon
Employment by Class of Employer in Avon
Among the 3,605 employed individuals in Avon, private company employees (2,743 | 76.1%), local government employees (447 | 12.4%), and self-employed (incorporated) (196 | 5.4%) make up the most common classes of employment.
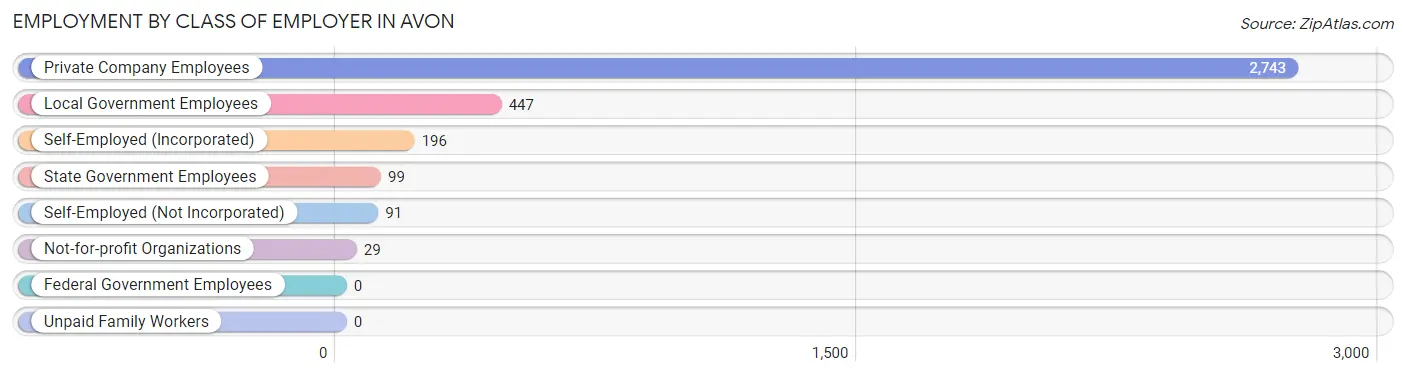
| Employer Class | # Employees | % Employees |
| Private Company Employees | 2,743 | 76.1% |
| Self-Employed (Incorporated) | 196 | 5.4% |
| Self-Employed (Not Incorporated) | 91 | 2.5% |
| Not-for-profit Organizations | 29 | 0.8% |
| Local Government Employees | 447 | 12.4% |
| State Government Employees | 99 | 2.8% |
| Federal Government Employees | 0 | 0.0% |
| Unpaid Family Workers | 0 | 0.0% |
| Total | 3,605 | 100.0% |
Employment Status by Age in Avon
According to the labor force statistics for Avon, out of the total population over 16 years of age (4,900), 82.7% or 4,052 individuals are in the labor force, with 7.1% or 288 of them unemployed. The age group with the highest labor force participation rate is 20 to 24 years, with 100.0% or 279 individuals in the labor force. Within the labor force, the 25 to 29 years age range has the highest percentage of unemployed individuals, with 27.8% or 117 of them being unemployed.
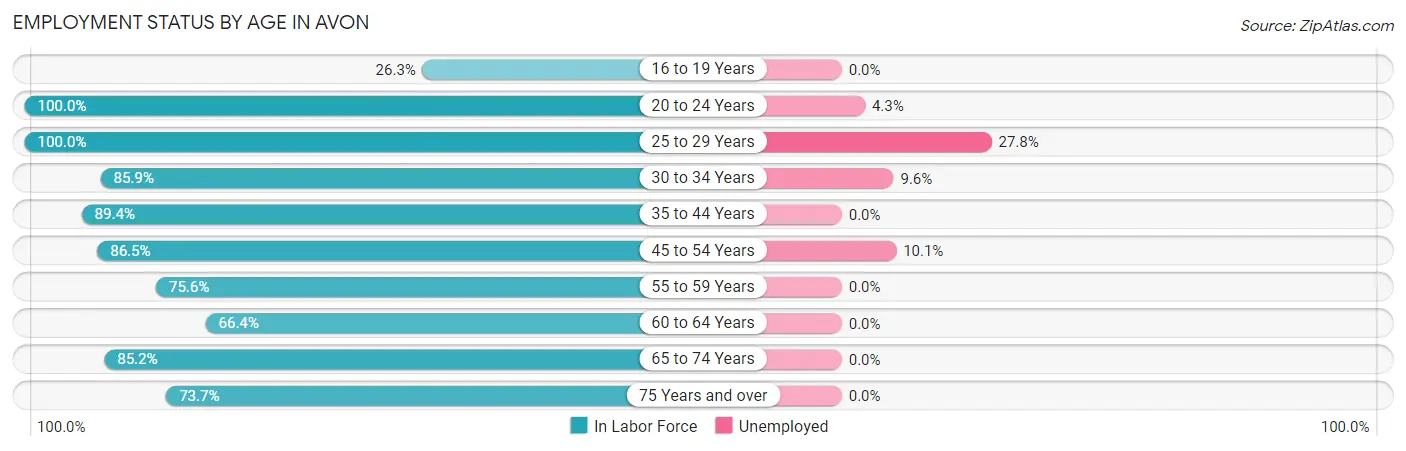
| Age Bracket | In Labor Force | Unemployed |
| 16 to 19 Years | 71 (26.3%) | 0 (0.0%) |
| 20 to 24 Years | 279 (100.0%) | 12 (4.3%) |
| 25 to 29 Years | 421 (100.0%) | 117 (27.8%) |
| 30 to 34 Years | 788 (85.9%) | 76 (9.6%) |
| 35 to 44 Years | 845 (89.4%) | 0 (0.0%) |
| 45 to 54 Years | 800 (86.5%) | 81 (10.1%) |
| 55 to 59 Years | 437 (75.6%) | 0 (0.0%) |
| 60 to 64 Years | 198 (66.4%) | 0 (0.0%) |
| 65 to 74 Years | 127 (85.2%) | 0 (0.0%) |
| 75 Years and over | 87 (73.7%) | 0 (0.0%) |
| Total | 4,052 (82.7%) | 288 (7.1%) |
Employment Status by Educational Attainment in Avon
According to labor force statistics for Avon, 85.4% of individuals (3,488) out of the total population between 25 and 64 years of age (4,084) are in the labor force, with 7.9% or 276 of them being unemployed. The group with the highest labor force participation rate are those with the educational attainment of college / associate degree, with 87.8% or 1,198 individuals in the labor force. Within the labor force, individuals with college / associate degree education have the highest percentage of unemployment, with 16.5% or 198 of them being unemployed.
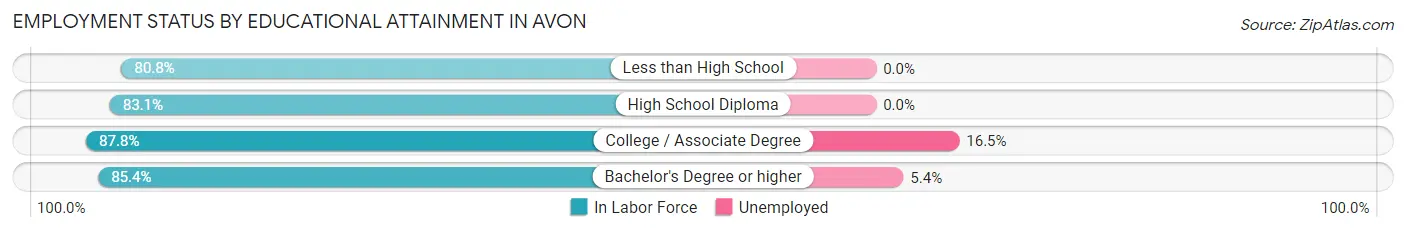
| Educational Attainment | In Labor Force | Unemployed |
| Less than High School | 206 (80.8%) | 0 (0.0%) |
| High School Diploma | 677 (83.1%) | 0 (0.0%) |
| College / Associate Degree | 1,198 (87.8%) | 225 (16.5%) |
| Bachelor's Degree or higher | 1,409 (85.4%) | 89 (5.4%) |
| Total | 3,488 (85.4%) | 323 (7.9%) |
Employment Occupations by Sex in Avon
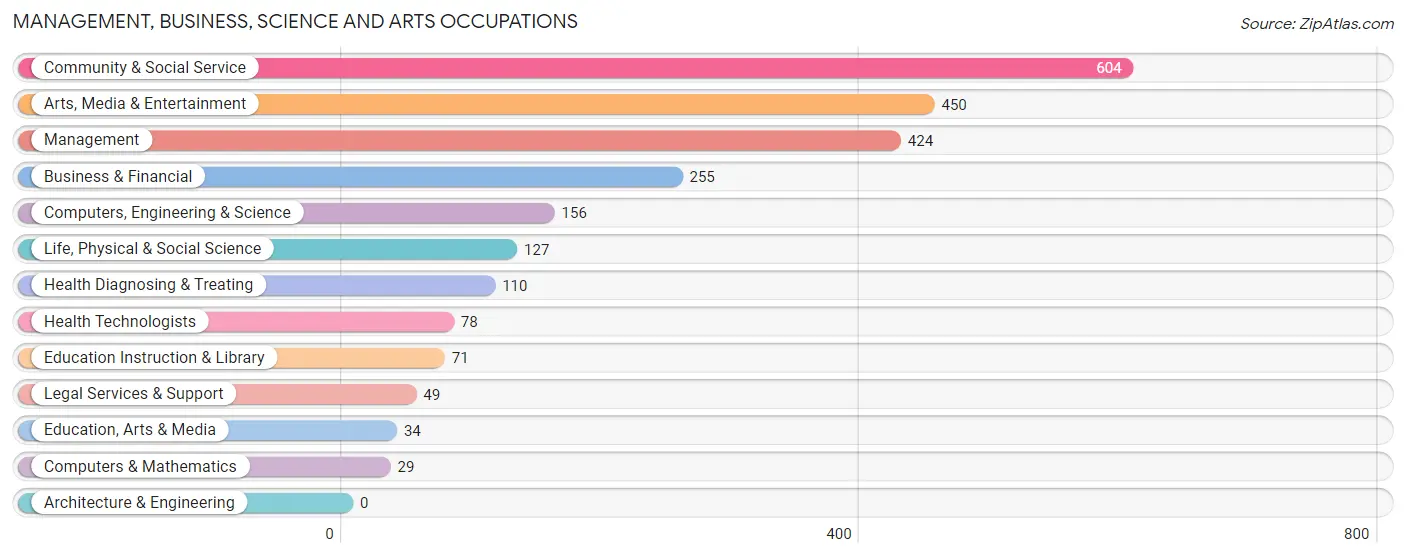
Management, Business, Science and Arts Occupations
The most common Management, Business, Science and Arts occupations in Avon are Community & Social Service (604 | 16.0%), Arts, Media & Entertainment (450 | 11.9%), Management (424 | 11.3%), Business & Financial (255 | 6.8%), and Computers, Engineering & Science (156 | 4.1%).
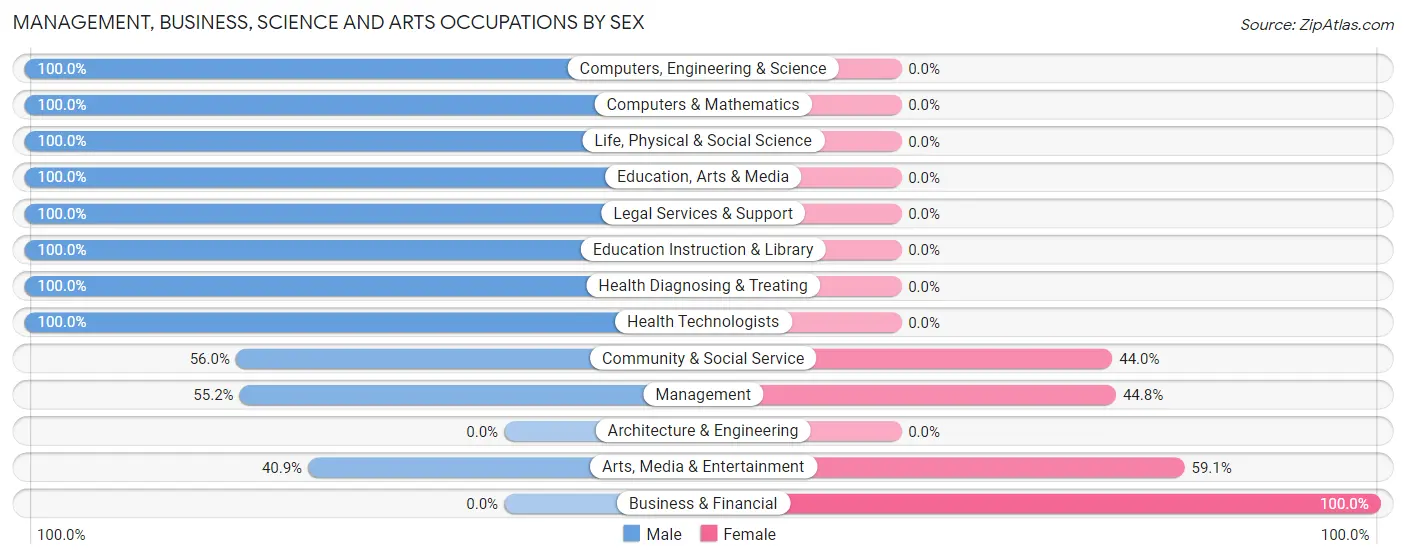
Management, Business, Science and Arts Occupations by Sex
Within the Management, Business, Science and Arts occupations in Avon, the most male-oriented occupations are Computers, Engineering & Science (100.0%), Computers & Mathematics (100.0%), and Life, Physical & Social Science (100.0%), while the most female-oriented occupations are Business & Financial (100.0%), Arts, Media & Entertainment (59.1%), and Management (44.8%).
| Occupation | Male | Female |
| Management | 234 (55.2%) | 190 (44.8%) |
| Business & Financial | 0 (0.0%) | 255 (100.0%) |
| Computers, Engineering & Science | 156 (100.0%) | 0 (0.0%) |
| Computers & Mathematics | 29 (100.0%) | 0 (0.0%) |
| Architecture & Engineering | 0 (0.0%) | 0 (0.0%) |
| Life, Physical & Social Science | 127 (100.0%) | 0 (0.0%) |
| Community & Social Service | 338 (56.0%) | 266 (44.0%) |
| Education, Arts & Media | 34 (100.0%) | 0 (0.0%) |
| Legal Services & Support | 49 (100.0%) | 0 (0.0%) |
| Education Instruction & Library | 71 (100.0%) | 0 (0.0%) |
| Arts, Media & Entertainment | 184 (40.9%) | 266 (59.1%) |
| Health Diagnosing & Treating | 110 (100.0%) | 0 (0.0%) |
| Health Technologists | 78 (100.0%) | 0 (0.0%) |
| Total (Category) | 838 (54.1%) | 711 (45.9%) |
| Total (Overall) | 1,973 (52.4%) | 1,794 (47.6%) |
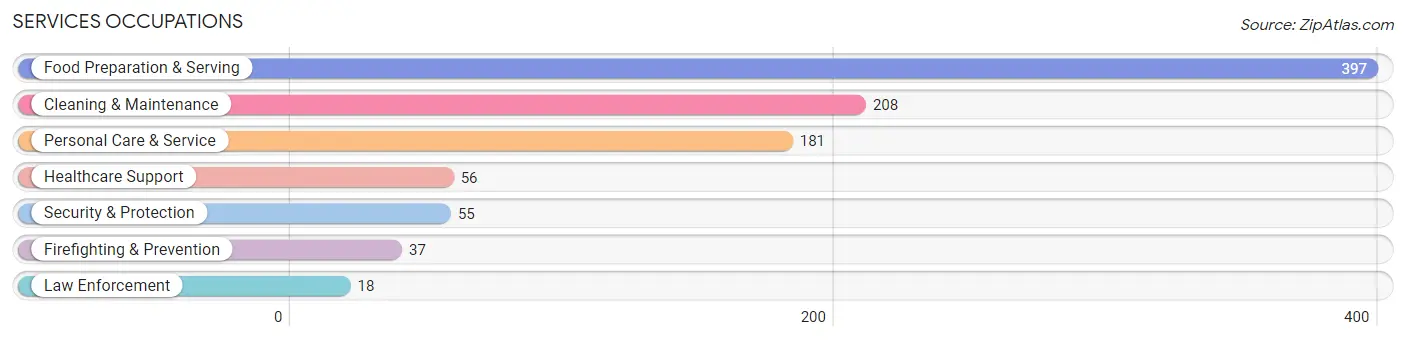
Services Occupations
The most common Services occupations in Avon are Food Preparation & Serving (397 | 10.5%), Cleaning & Maintenance (208 | 5.5%), Personal Care & Service (181 | 4.8%), Healthcare Support (56 | 1.5%), and Security & Protection (55 | 1.5%).
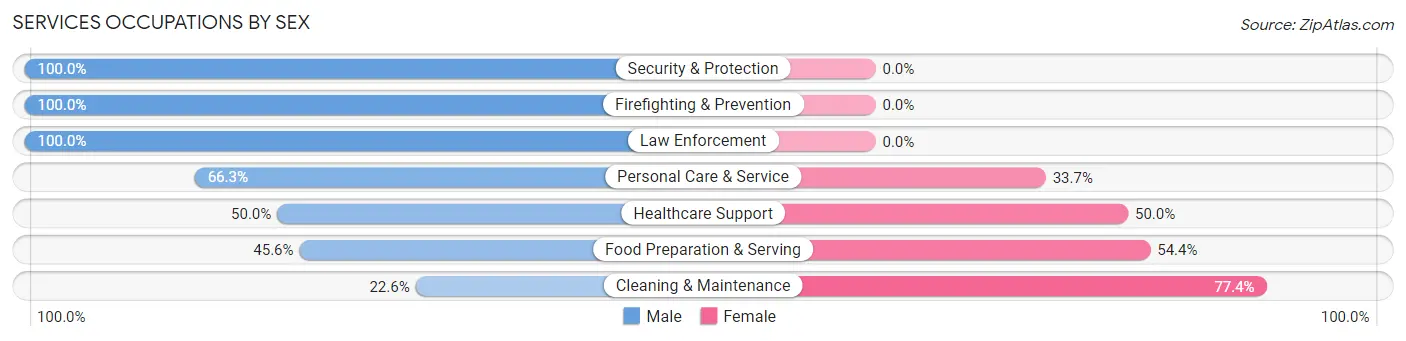
Services Occupations by Sex
Within the Services occupations in Avon, the most male-oriented occupations are Security & Protection (100.0%), Firefighting & Prevention (100.0%), and Law Enforcement (100.0%), while the most female-oriented occupations are Cleaning & Maintenance (77.4%), Food Preparation & Serving (54.4%), and Healthcare Support (50.0%).
| Occupation | Male | Female |
| Healthcare Support | 28 (50.0%) | 28 (50.0%) |
| Security & Protection | 55 (100.0%) | 0 (0.0%) |
| Firefighting & Prevention | 37 (100.0%) | 0 (0.0%) |
| Law Enforcement | 18 (100.0%) | 0 (0.0%) |
| Food Preparation & Serving | 181 (45.6%) | 216 (54.4%) |
| Cleaning & Maintenance | 47 (22.6%) | 161 (77.4%) |
| Personal Care & Service | 120 (66.3%) | 61 (33.7%) |
| Total (Category) | 431 (48.0%) | 466 (51.9%) |
| Total (Overall) | 1,973 (52.4%) | 1,794 (47.6%) |
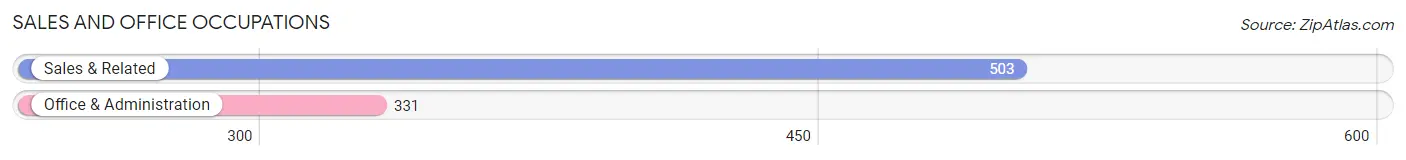
Sales and Office Occupations
The most common Sales and Office occupations in Avon are Sales & Related (503 | 13.4%), and Office & Administration (331 | 8.8%).
Sales and Office Occupations by Sex
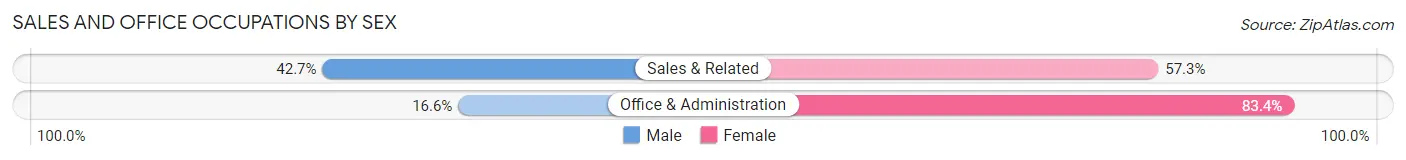
| Occupation | Male | Female |
| Sales & Related | 215 (42.7%) | 288 (57.3%) |
| Office & Administration | 55 (16.6%) | 276 (83.4%) |
| Total (Category) | 270 (32.4%) | 564 (67.6%) |
| Total (Overall) | 1,973 (52.4%) | 1,794 (47.6%) |
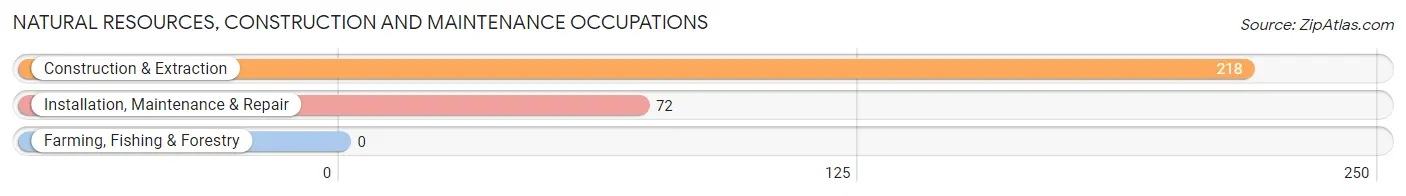
Natural Resources, Construction and Maintenance Occupations
The most common Natural Resources, Construction and Maintenance occupations in Avon are Construction & Extraction (218 | 5.8%), and Installation, Maintenance & Repair (72 | 1.9%).
Natural Resources, Construction and Maintenance Occupations by Sex
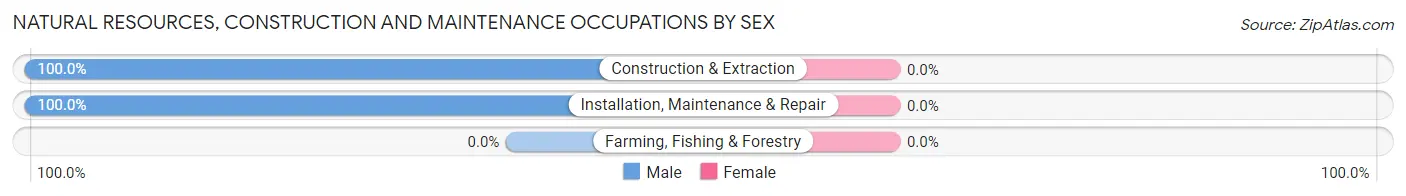
| Occupation | Male | Female |
| Farming, Fishing & Forestry | 0 (0.0%) | 0 (0.0%) |
| Construction & Extraction | 218 (100.0%) | 0 (0.0%) |
| Installation, Maintenance & Repair | 72 (100.0%) | 0 (0.0%) |
| Total (Category) | 290 (100.0%) | 0 (0.0%) |
| Total (Overall) | 1,973 (52.4%) | 1,794 (47.6%) |
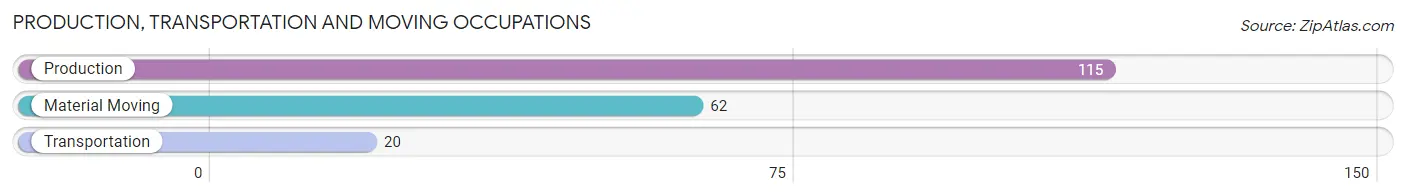
Production, Transportation and Moving Occupations
The most common Production, Transportation and Moving occupations in Avon are Production (115 | 3.0%), Material Moving (62 | 1.7%), and Transportation (20 | 0.5%).
Production, Transportation and Moving Occupations by Sex
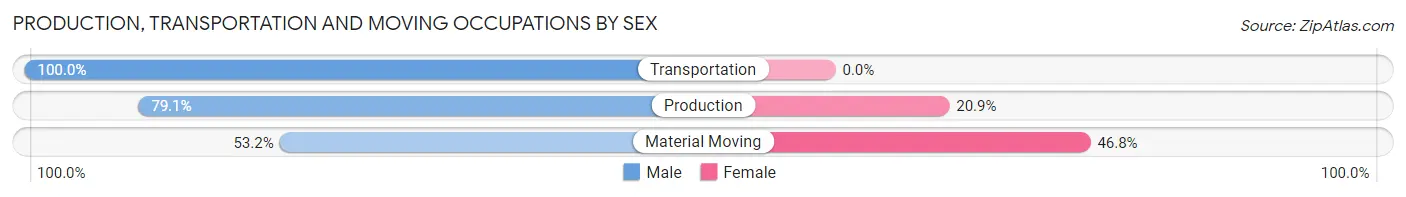
| Occupation | Male | Female |
| Production | 91 (79.1%) | 24 (20.9%) |
| Transportation | 20 (100.0%) | 0 (0.0%) |
| Material Moving | 33 (53.2%) | 29 (46.8%) |
| Total (Category) | 144 (73.1%) | 53 (26.9%) |
| Total (Overall) | 1,973 (52.4%) | 1,794 (47.6%) |
Employment Industries by Sex in Avon
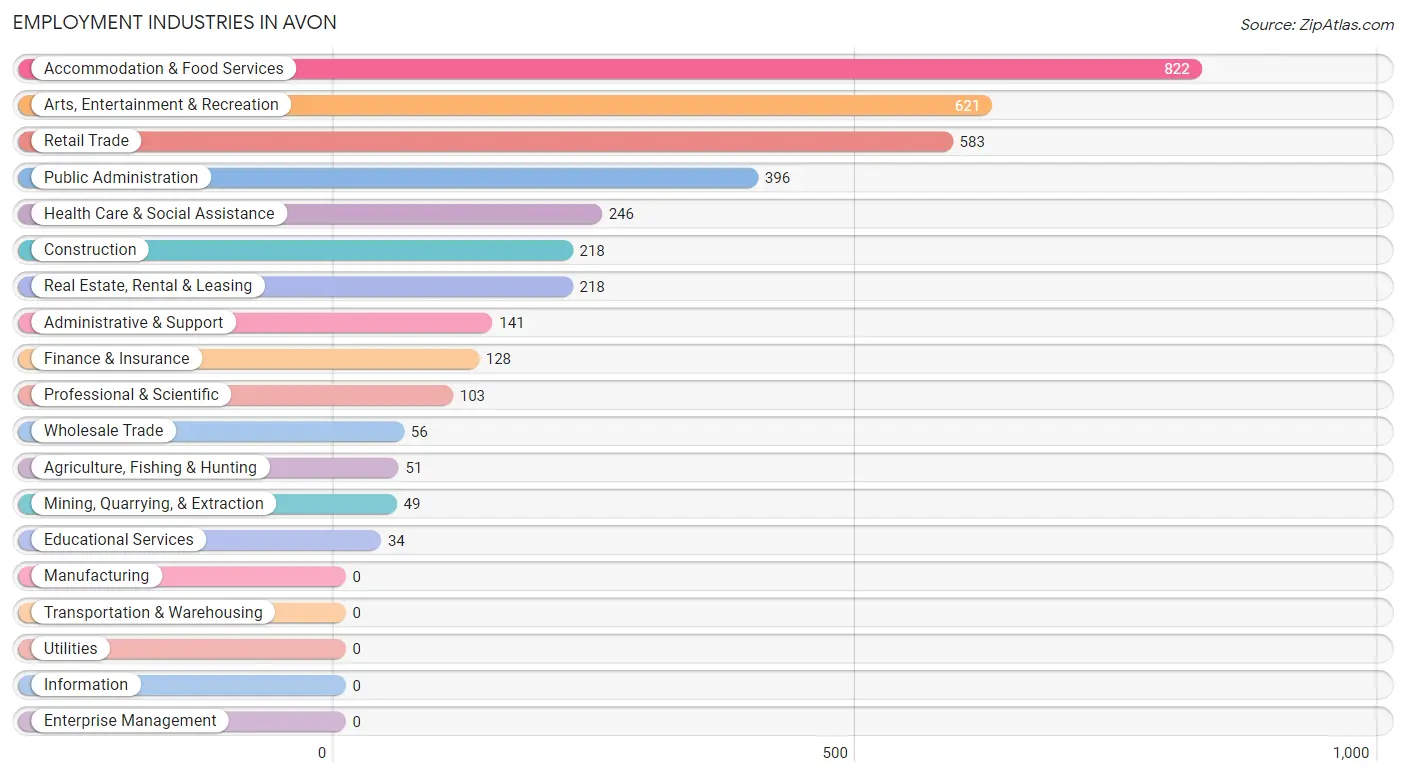
Employment Industries in Avon
The major employment industries in Avon include Accommodation & Food Services (822 | 21.8%), Arts, Entertainment & Recreation (621 | 16.5%), Retail Trade (583 | 15.5%), Public Administration (396 | 10.5%), and Health Care & Social Assistance (246 | 6.5%).
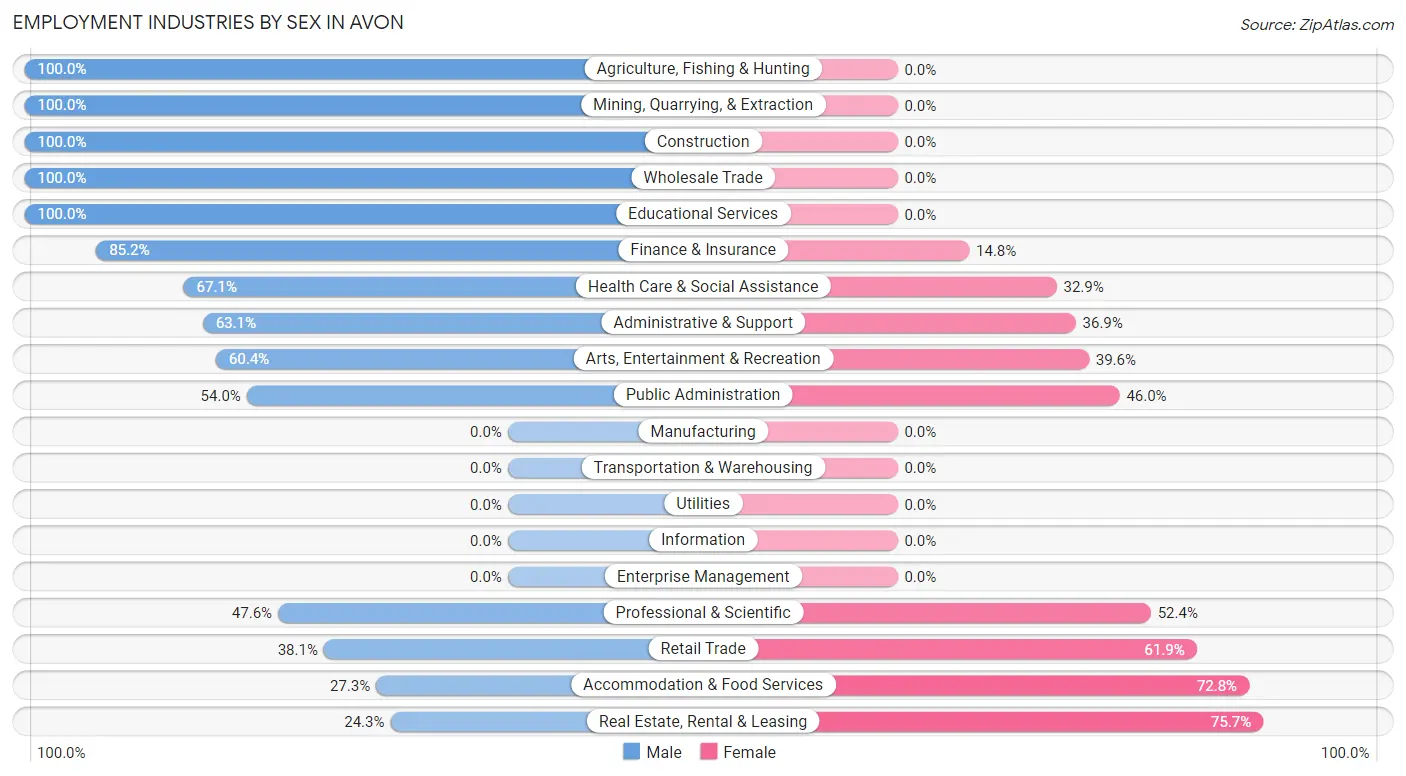
Employment Industries by Sex in Avon
The Avon industries that see more men than women are Agriculture, Fishing & Hunting (100.0%), Mining, Quarrying, & Extraction (100.0%), and Construction (100.0%), whereas the industries that tend to have a higher number of women are Real Estate, Rental & Leasing (75.7%), Accommodation & Food Services (72.8%), and Retail Trade (61.9%).
| Industry | Male | Female |
| Agriculture, Fishing & Hunting | 51 (100.0%) | 0 (0.0%) |
| Mining, Quarrying, & Extraction | 49 (100.0%) | 0 (0.0%) |
| Construction | 218 (100.0%) | 0 (0.0%) |
| Manufacturing | 0 (0.0%) | 0 (0.0%) |
| Wholesale Trade | 56 (100.0%) | 0 (0.0%) |
| Retail Trade | 222 (38.1%) | 361 (61.9%) |
| Transportation & Warehousing | 0 (0.0%) | 0 (0.0%) |
| Utilities | 0 (0.0%) | 0 (0.0%) |
| Information | 0 (0.0%) | 0 (0.0%) |
| Finance & Insurance | 109 (85.2%) | 19 (14.8%) |
| Real Estate, Rental & Leasing | 53 (24.3%) | 165 (75.7%) |
| Professional & Scientific | 49 (47.6%) | 54 (52.4%) |
| Enterprise Management | 0 (0.0%) | 0 (0.0%) |
| Administrative & Support | 89 (63.1%) | 52 (36.9%) |
| Educational Services | 34 (100.0%) | 0 (0.0%) |
| Health Care & Social Assistance | 165 (67.1%) | 81 (32.9%) |
| Arts, Entertainment & Recreation | 375 (60.4%) | 246 (39.6%) |
| Accommodation & Food Services | 224 (27.3%) | 598 (72.8%) |
| Public Administration | 214 (54.0%) | 182 (46.0%) |
| Total | 1,973 (52.4%) | 1,794 (47.6%) |
Education in Avon
School Enrollment in Avon
The most common levels of schooling among the 1,408 students in Avon are elementary school (432 | 30.7%), college / undergraduate (311 | 22.1%), and middle school (286 | 20.3%).
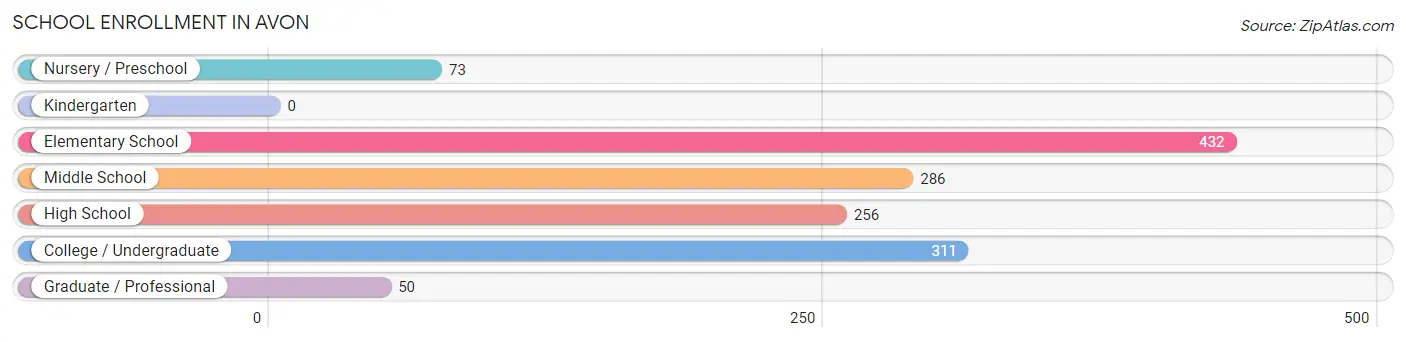
| School Level | # Students | % Students |
| Nursery / Preschool | 73 | 5.2% |
| Kindergarten | 0 | 0.0% |
| Elementary School | 432 | 30.7% |
| Middle School | 286 | 20.3% |
| High School | 256 | 18.2% |
| College / Undergraduate | 311 | 22.1% |
| Graduate / Professional | 50 | 3.5% |
| Total | 1,408 | 100.0% |
School Enrollment by Age by Funding Source in Avon
Out of a total of 1,408 students who are enrolled in schools in Avon, 208 (14.8%) attend a private institution, while the remaining 1,200 (85.2%) are enrolled in public schools. The age group of 15 to 17 year olds has the highest likelihood of being enrolled in private schools, with 159 (100.0% in the age bracket) enrolled. Conversely, the age group of 3 to 4 year olds has the lowest likelihood of being enrolled in a private school, with 73 (100.0% in the age bracket) attending a public institution.
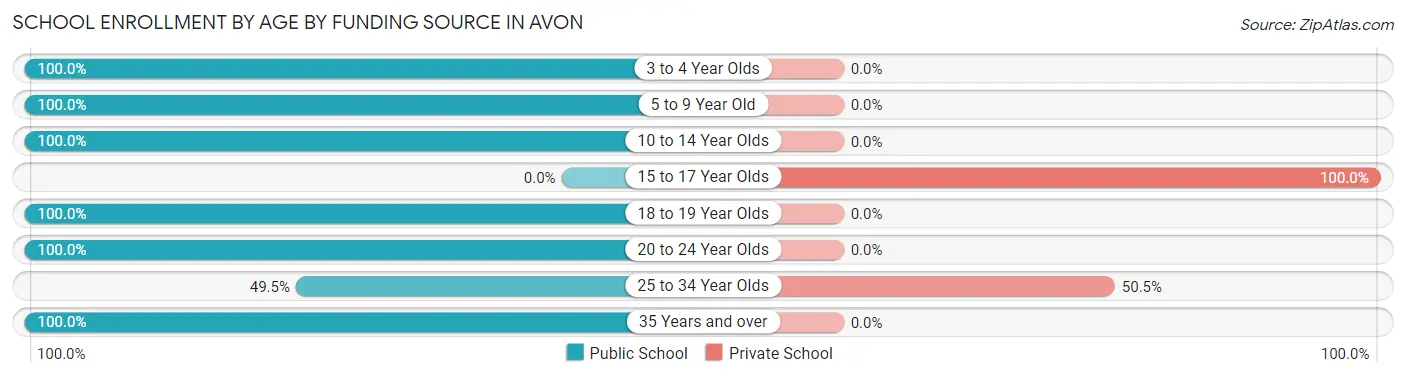
| Age Bracket | Public School | Private School |
| 3 to 4 Year Olds | 73 (100.0%) | 0 (0.0%) |
| 5 to 9 Year Old | 391 (100.0%) | 0 (0.0%) |
| 10 to 14 Year Olds | 325 (100.0%) | 0 (0.0%) |
| 15 to 17 Year Olds | 0 (0.0%) | 159 (100.0%) |
| 18 to 19 Year Olds | 111 (100.0%) | 0 (0.0%) |
| 20 to 24 Year Olds | 120 (100.0%) | 0 (0.0%) |
| 25 to 34 Year Olds | 49 (49.5%) | 50 (50.5%) |
| 35 Years and over | 130 (100.0%) | 0 (0.0%) |
| Total | 1,200 (85.2%) | 208 (14.8%) |
Educational Attainment by Field of Study in Avon
Social sciences (376 | 19.0%), liberal arts & history (315 | 15.9%), communications (282 | 14.2%), business (265 | 13.4%), and education (228 | 11.5%) are the most common fields of study among 1,981 individuals in Avon who have obtained a bachelor's degree or higher.

| Field of Study | # Graduates | % Graduates |
| Computers & Mathematics | 0 | 0.0% |
| Bio, Nature & Agricultural | 0 | 0.0% |
| Physical & Health Sciences | 34 | 1.7% |
| Psychology | 83 | 4.2% |
| Social Sciences | 376 | 19.0% |
| Engineering | 76 | 3.8% |
| Multidisciplinary Studies | 0 | 0.0% |
| Science & Technology | 50 | 2.5% |
| Business | 265 | 13.4% |
| Education | 228 | 11.5% |
| Literature & Languages | 65 | 3.3% |
| Liberal Arts & History | 315 | 15.9% |
| Visual & Performing Arts | 0 | 0.0% |
| Communications | 282 | 14.2% |
| Arts & Humanities | 207 | 10.4% |
| Total | 1,981 | 100.0% |
Transportation & Commute in Avon
Vehicle Availability by Sex in Avon
The most prevalent vehicle ownership categories in Avon are males with 2 vehicles (1,168, accounting for 61.0%) and females with 2 vehicles (904, making up 69.1%).
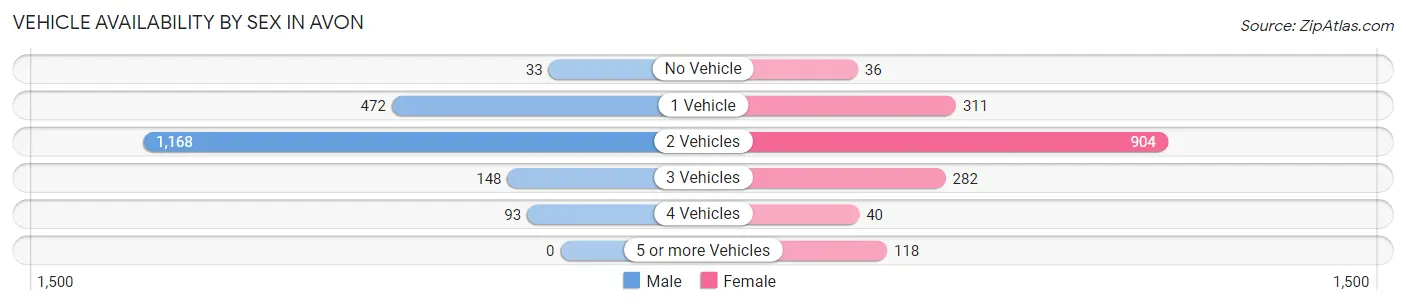
| Vehicles Available | Male | Female |
| No Vehicle | 33 (1.7%) | 36 (2.1%) |
| 1 Vehicle | 472 (24.7%) | 311 (18.4%) |
| 2 Vehicles | 1,168 (61.0%) | 904 (53.5%) |
| 3 Vehicles | 148 (7.7%) | 282 (16.7%) |
| 4 Vehicles | 93 (4.9%) | 40 (2.4%) |
| 5 or more Vehicles | 0 (0.0%) | 118 (7.0%) |
| Total | 1,914 (100.0%) | 1,691 (100.0%) |
Commute Time in Avon
The most frequently occuring commute durations in Avon are 20 to 24 minutes (665 commuters, 19.4%), 5 to 9 minutes (591 commuters, 17.3%), and 30 to 34 minutes (573 commuters, 16.7%).
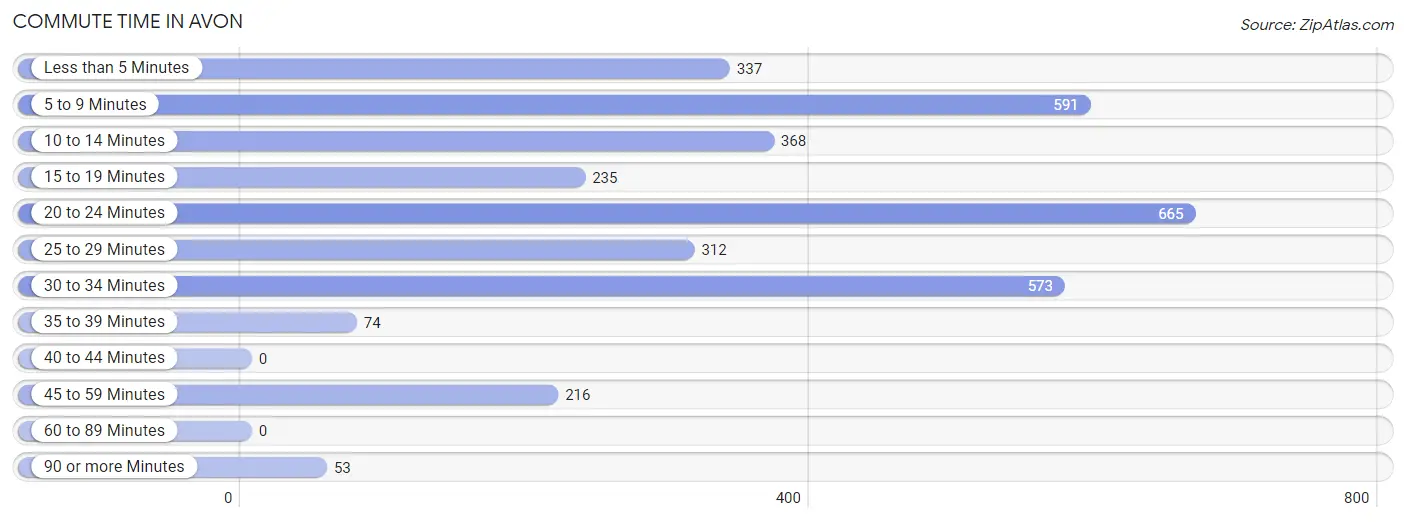
| Commute Time | # Commuters | % Commuters |
| Less than 5 Minutes | 337 | 9.8% |
| 5 to 9 Minutes | 591 | 17.3% |
| 10 to 14 Minutes | 368 | 10.7% |
| 15 to 19 Minutes | 235 | 6.9% |
| 20 to 24 Minutes | 665 | 19.4% |
| 25 to 29 Minutes | 312 | 9.1% |
| 30 to 34 Minutes | 573 | 16.7% |
| 35 to 39 Minutes | 74 | 2.2% |
| 40 to 44 Minutes | 0 | 0.0% |
| 45 to 59 Minutes | 216 | 6.3% |
| 60 to 89 Minutes | 0 | 0.0% |
| 90 or more Minutes | 53 | 1.5% |
Commute Time by Sex in Avon
The most common commute times in Avon are 30 to 34 minutes (573 commuters, 30.4%) for males and 5 to 9 minutes (329 commuters, 21.4%) for females.
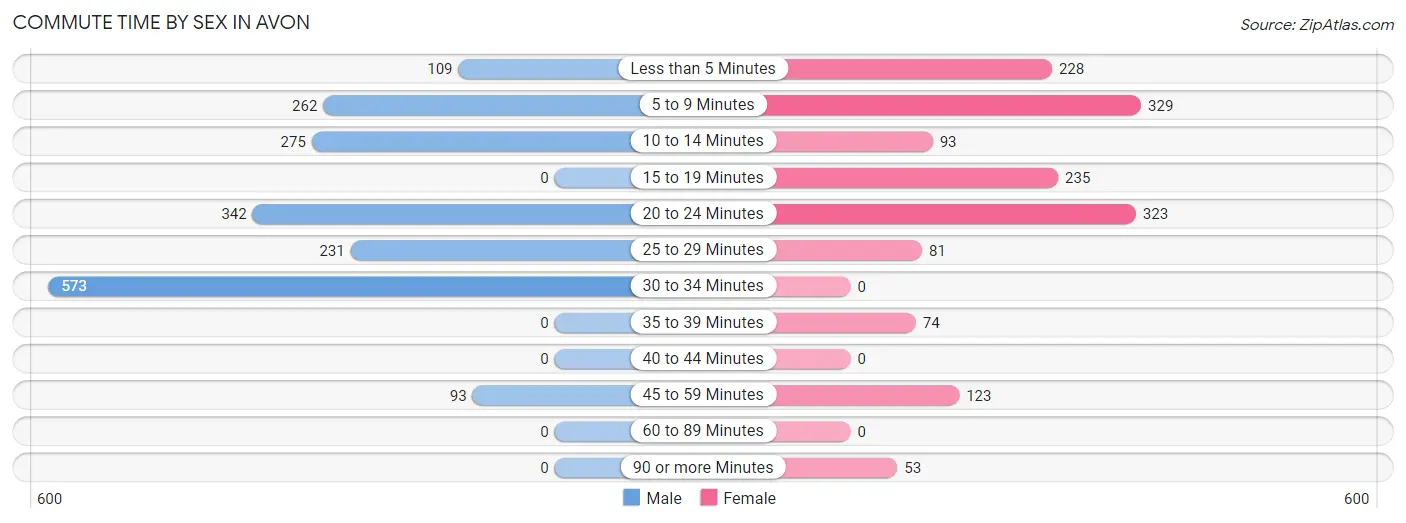
| Commute Time | Male | Female |
| Less than 5 Minutes | 109 (5.8%) | 228 (14.8%) |
| 5 to 9 Minutes | 262 (13.9%) | 329 (21.4%) |
| 10 to 14 Minutes | 275 (14.6%) | 93 (6.0%) |
| 15 to 19 Minutes | 0 (0.0%) | 235 (15.3%) |
| 20 to 24 Minutes | 342 (18.1%) | 323 (21.0%) |
| 25 to 29 Minutes | 231 (12.2%) | 81 (5.3%) |
| 30 to 34 Minutes | 573 (30.4%) | 0 (0.0%) |
| 35 to 39 Minutes | 0 (0.0%) | 74 (4.8%) |
| 40 to 44 Minutes | 0 (0.0%) | 0 (0.0%) |
| 45 to 59 Minutes | 93 (4.9%) | 123 (8.0%) |
| 60 to 89 Minutes | 0 (0.0%) | 0 (0.0%) |
| 90 or more Minutes | 0 (0.0%) | 53 (3.4%) |
Time of Departure to Work by Sex in Avon
The most frequent times of departure to work in Avon are 7:30 AM to 7:59 AM (499, 26.5%) for males and 7:30 AM to 7:59 AM (256, 16.6%) for females.
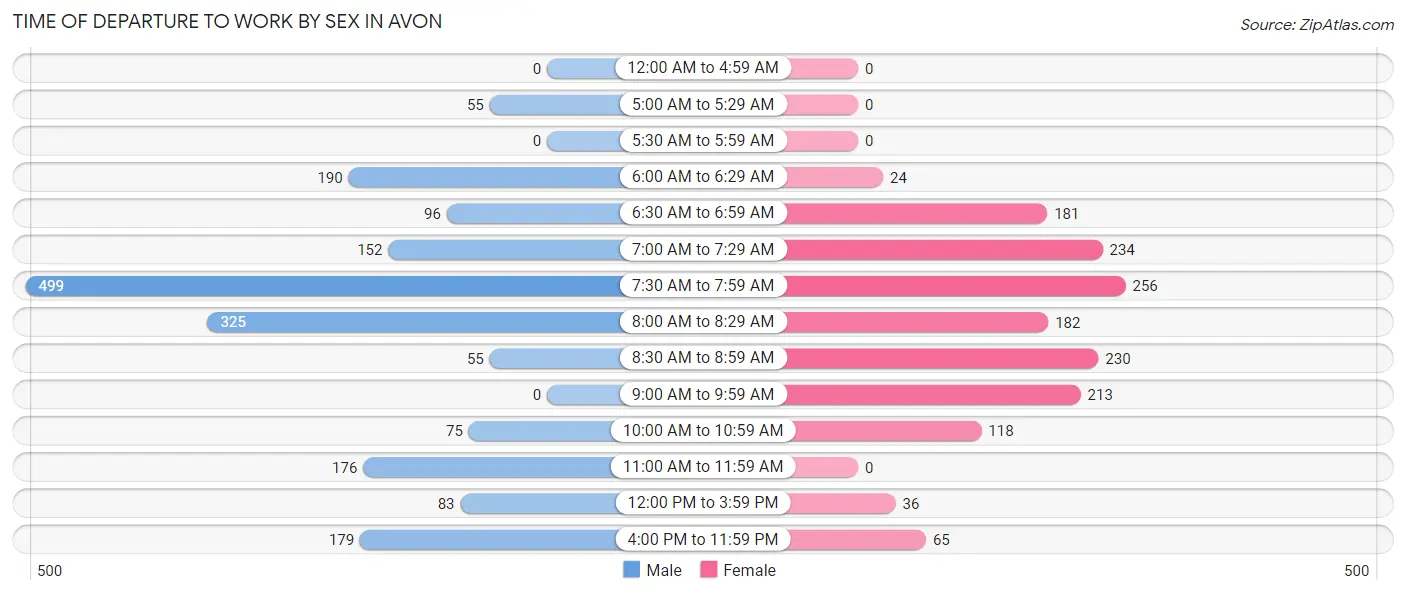
| Time of Departure | Male | Female |
| 12:00 AM to 4:59 AM | 0 (0.0%) | 0 (0.0%) |
| 5:00 AM to 5:29 AM | 55 (2.9%) | 0 (0.0%) |
| 5:30 AM to 5:59 AM | 0 (0.0%) | 0 (0.0%) |
| 6:00 AM to 6:29 AM | 190 (10.1%) | 24 (1.6%) |
| 6:30 AM to 6:59 AM | 96 (5.1%) | 181 (11.8%) |
| 7:00 AM to 7:29 AM | 152 (8.1%) | 234 (15.2%) |
| 7:30 AM to 7:59 AM | 499 (26.5%) | 256 (16.6%) |
| 8:00 AM to 8:29 AM | 325 (17.2%) | 182 (11.8%) |
| 8:30 AM to 8:59 AM | 55 (2.9%) | 230 (14.9%) |
| 9:00 AM to 9:59 AM | 0 (0.0%) | 213 (13.8%) |
| 10:00 AM to 10:59 AM | 75 (4.0%) | 118 (7.7%) |
| 11:00 AM to 11:59 AM | 176 (9.3%) | 0 (0.0%) |
| 12:00 PM to 3:59 PM | 83 (4.4%) | 36 (2.3%) |
| 4:00 PM to 11:59 PM | 179 (9.5%) | 65 (4.2%) |
| Total | 1,885 (100.0%) | 1,539 (100.0%) |
Housing Occupancy in Avon
Occupancy by Ownership in Avon
Of the total 2,245 dwellings in Avon, owner-occupied units account for 993 (44.2%), while renter-occupied units make up 1,252 (55.8%).
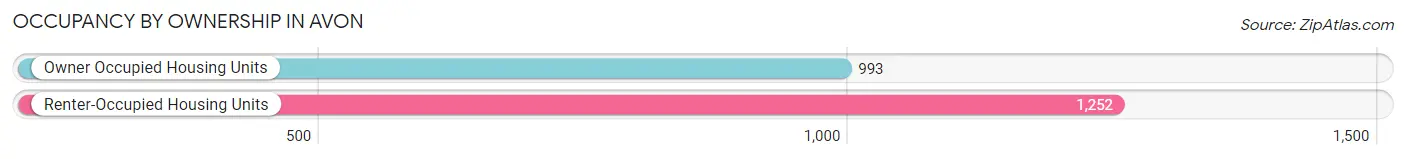
| Occupancy | # Housing Units | % Housing Units |
| Owner Occupied Housing Units | 993 | 44.2% |
| Renter-Occupied Housing Units | 1,252 | 55.8% |
| Total Occupied Housing Units | 2,245 | 100.0% |
Occupancy by Household Size in Avon
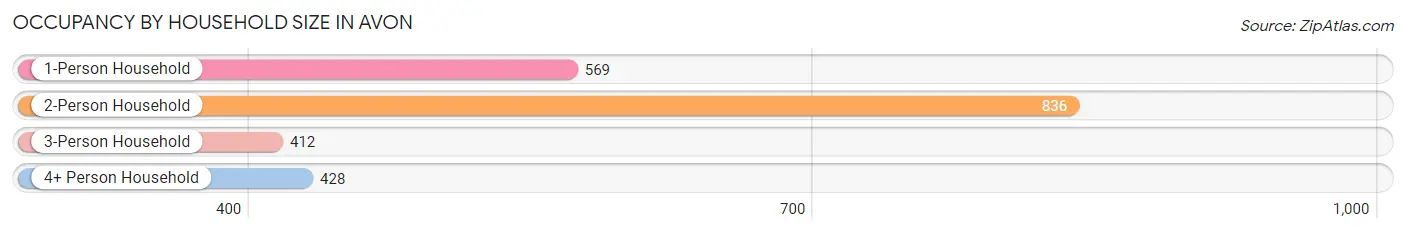
| Household Size | # Housing Units | % Housing Units |
| 1-Person Household | 569 | 25.4% |
| 2-Person Household | 836 | 37.2% |
| 3-Person Household | 412 | 18.3% |
| 4+ Person Household | 428 | 19.1% |
| Total Housing Units | 2,245 | 100.0% |
Occupancy by Ownership by Household Size in Avon
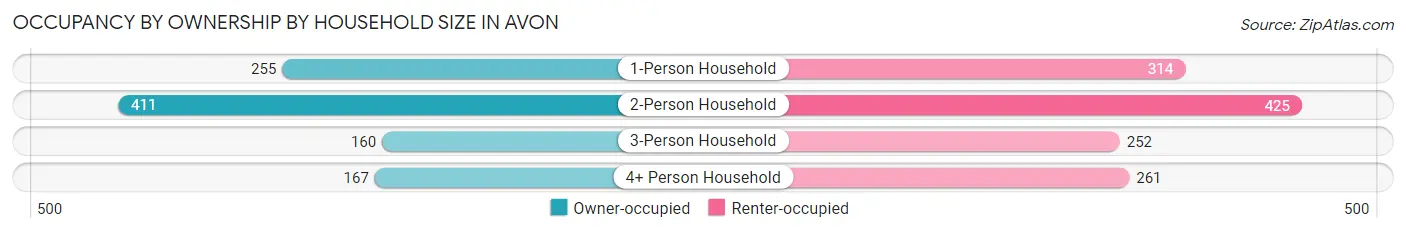
| Household Size | Owner-occupied | Renter-occupied |
| 1-Person Household | 255 (44.8%) | 314 (55.2%) |
| 2-Person Household | 411 (49.2%) | 425 (50.8%) |
| 3-Person Household | 160 (38.8%) | 252 (61.2%) |
| 4+ Person Household | 167 (39.0%) | 261 (61.0%) |
| Total Housing Units | 993 (44.2%) | 1,252 (55.8%) |
Occupancy by Educational Attainment in Avon
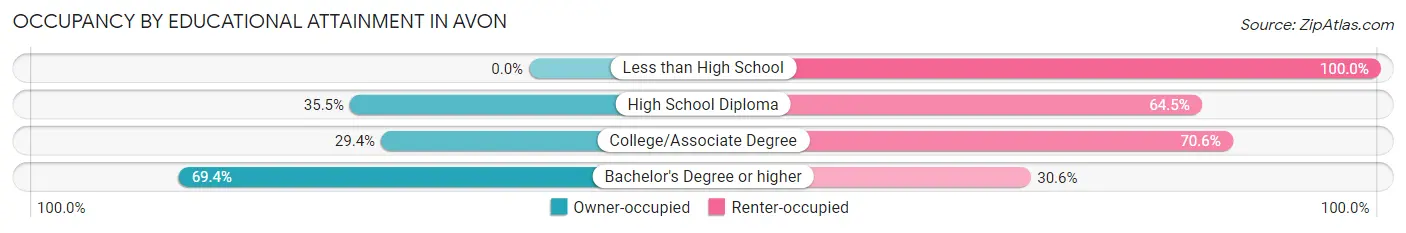
| Household Size | Owner-occupied | Renter-occupied |
| Less than High School | 0 (0.0%) | 42 (100.0%) |
| High School Diploma | 136 (35.5%) | 247 (64.5%) |
| College/Associate Degree | 298 (29.4%) | 717 (70.6%) |
| Bachelor's Degree or higher | 559 (69.4%) | 246 (30.6%) |
Occupancy by Age of Householder in Avon
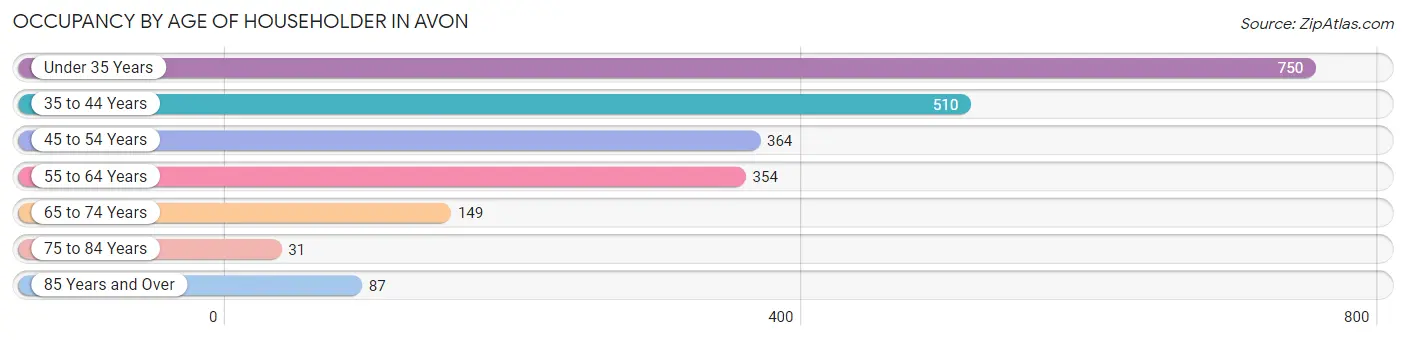
| Age Bracket | # Households | % Households |
| Under 35 Years | 750 | 33.4% |
| 35 to 44 Years | 510 | 22.7% |
| 45 to 54 Years | 364 | 16.2% |
| 55 to 64 Years | 354 | 15.8% |
| 65 to 74 Years | 149 | 6.6% |
| 75 to 84 Years | 31 | 1.4% |
| 85 Years and Over | 87 | 3.9% |
| Total | 2,245 | 100.0% |
Housing Finances in Avon
Median Income by Occupancy in Avon
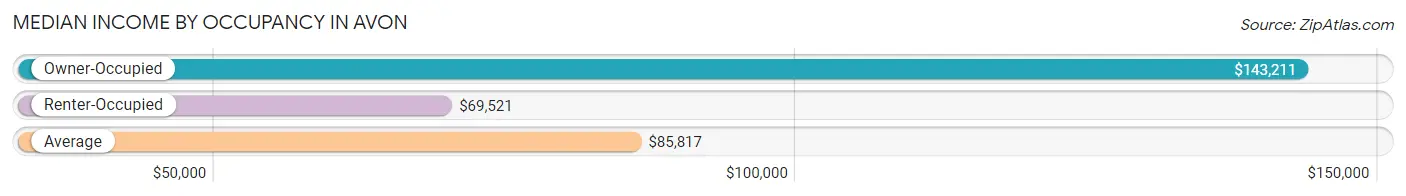
| Occupancy Type | # Households | Median Income |
| Owner-Occupied | 993 (44.2%) | $143,211 |
| Renter-Occupied | 1,252 (55.8%) | $69,521 |
| Average | 2,245 (100.0%) | $85,817 |
Occupancy by Householder Income Bracket in Avon
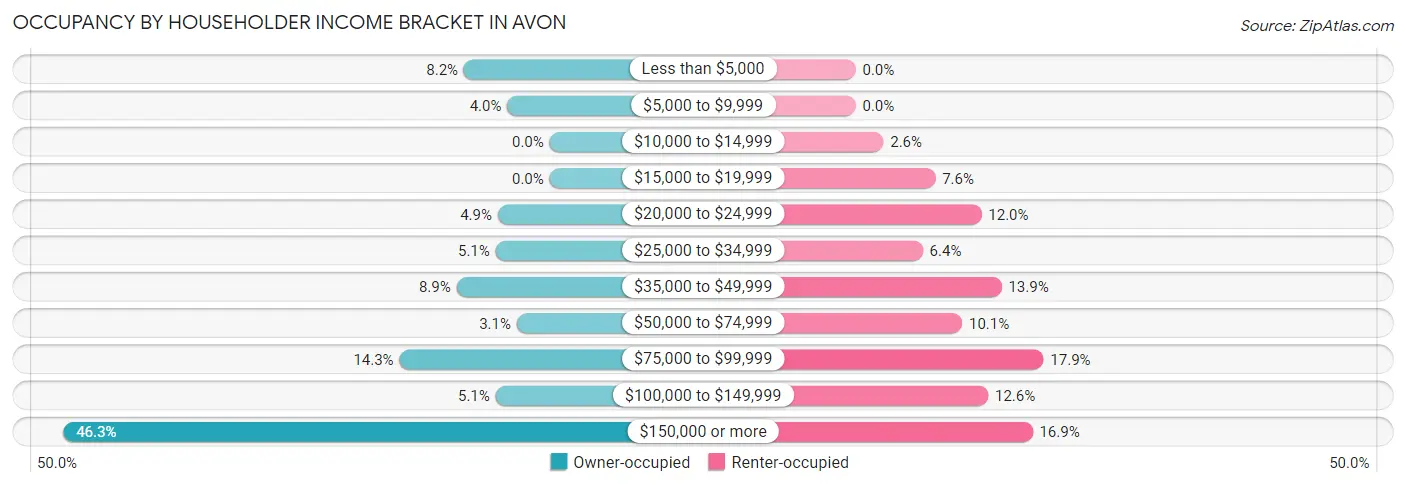
| Income Bracket | Owner-occupied | Renter-occupied |
| Less than $5,000 | 81 (8.2%) | 0 (0.0%) |
| $5,000 to $9,999 | 40 (4.0%) | 0 (0.0%) |
| $10,000 to $14,999 | 0 (0.0%) | 33 (2.6%) |
| $15,000 to $19,999 | 0 (0.0%) | 95 (7.6%) |
| $20,000 to $24,999 | 49 (4.9%) | 150 (12.0%) |
| $25,000 to $34,999 | 51 (5.1%) | 80 (6.4%) |
| $35,000 to $49,999 | 88 (8.9%) | 174 (13.9%) |
| $50,000 to $74,999 | 31 (3.1%) | 127 (10.1%) |
| $75,000 to $99,999 | 142 (14.3%) | 224 (17.9%) |
| $100,000 to $149,999 | 51 (5.1%) | 158 (12.6%) |
| $150,000 or more | 460 (46.3%) | 211 (16.9%) |
| Total | 993 (100.0%) | 1,252 (100.0%) |
Monthly Housing Cost Tiers in Avon
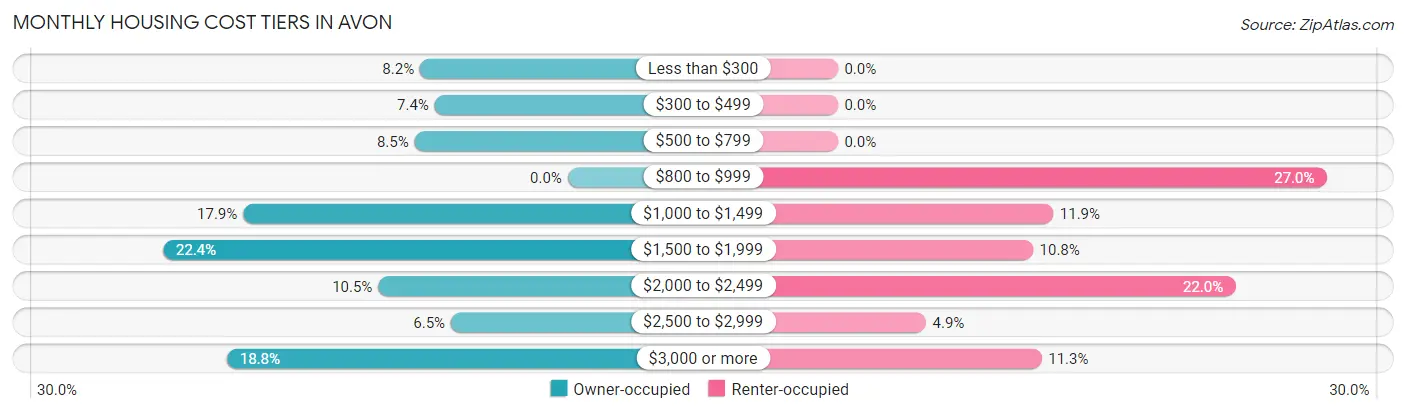
| Monthly Cost | Owner-occupied | Renter-occupied |
| Less than $300 | 81 (8.2%) | 0 (0.0%) |
| $300 to $499 | 73 (7.3%) | 0 (0.0%) |
| $500 to $799 | 84 (8.5%) | 0 (0.0%) |
| $800 to $999 | 0 (0.0%) | 338 (27.0%) |
| $1,000 to $1,499 | 178 (17.9%) | 149 (11.9%) |
| $1,500 to $1,999 | 222 (22.4%) | 135 (10.8%) |
| $2,000 to $2,499 | 104 (10.5%) | 275 (22.0%) |
| $2,500 to $2,999 | 64 (6.5%) | 61 (4.9%) |
| $3,000 or more | 187 (18.8%) | 141 (11.3%) |
| Total | 993 (100.0%) | 1,252 (100.0%) |
Physical Housing Characteristics in Avon
Housing Structures in Avon
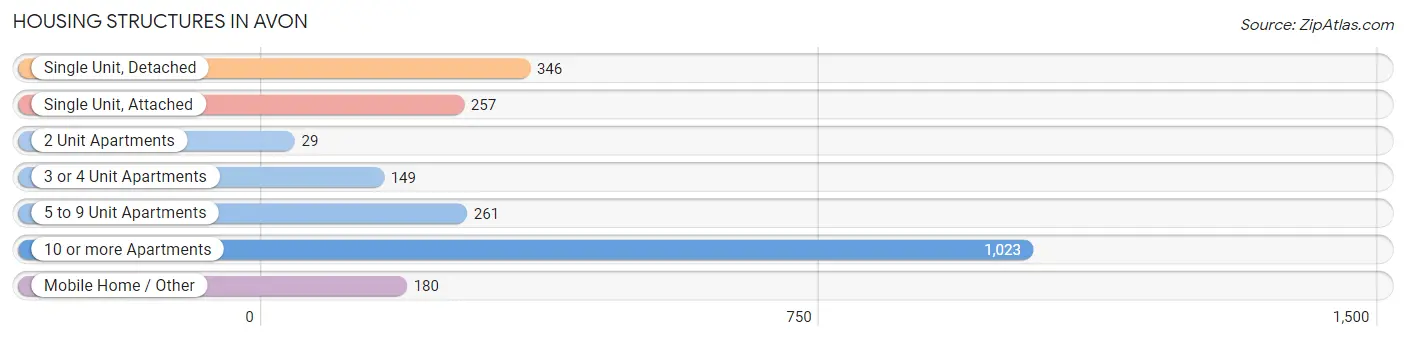
| Structure Type | # Housing Units | % Housing Units |
| Single Unit, Detached | 346 | 15.4% |
| Single Unit, Attached | 257 | 11.5% |
| 2 Unit Apartments | 29 | 1.3% |
| 3 or 4 Unit Apartments | 149 | 6.6% |
| 5 to 9 Unit Apartments | 261 | 11.6% |
| 10 or more Apartments | 1,023 | 45.6% |
| Mobile Home / Other | 180 | 8.0% |
| Total | 2,245 | 100.0% |
Housing Structures by Occupancy in Avon
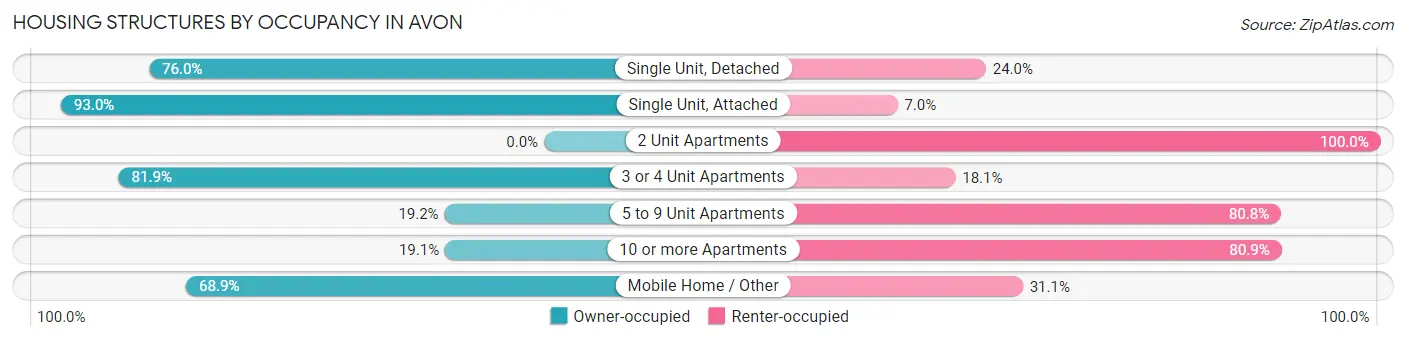
| Structure Type | Owner-occupied | Renter-occupied |
| Single Unit, Detached | 263 (76.0%) | 83 (24.0%) |
| Single Unit, Attached | 239 (93.0%) | 18 (7.0%) |
| 2 Unit Apartments | 0 (0.0%) | 29 (100.0%) |
| 3 or 4 Unit Apartments | 122 (81.9%) | 27 (18.1%) |
| 5 to 9 Unit Apartments | 50 (19.2%) | 211 (80.8%) |
| 10 or more Apartments | 195 (19.1%) | 828 (80.9%) |
| Mobile Home / Other | 124 (68.9%) | 56 (31.1%) |
| Total | 993 (44.2%) | 1,252 (55.8%) |
Housing Structures by Number of Rooms in Avon
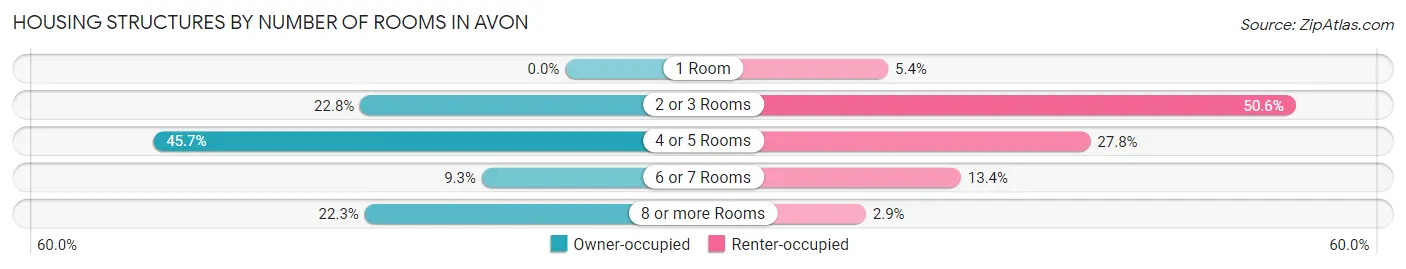
| Number of Rooms | Owner-occupied | Renter-occupied |
| 1 Room | 0 (0.0%) | 67 (5.3%) |
| 2 or 3 Rooms | 226 (22.8%) | 633 (50.6%) |
| 4 or 5 Rooms | 454 (45.7%) | 348 (27.8%) |
| 6 or 7 Rooms | 92 (9.3%) | 168 (13.4%) |
| 8 or more Rooms | 221 (22.3%) | 36 (2.9%) |
| Total | 993 (100.0%) | 1,252 (100.0%) |
Housing Structure by Heating Type in Avon
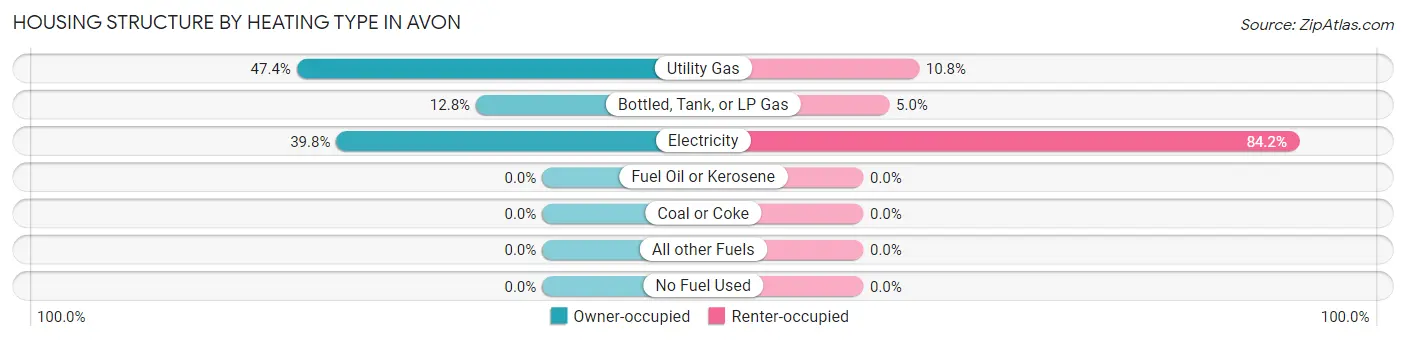
| Heating Type | Owner-occupied | Renter-occupied |
| Utility Gas | 471 (47.4%) | 135 (10.8%) |
| Bottled, Tank, or LP Gas | 127 (12.8%) | 63 (5.0%) |
| Electricity | 395 (39.8%) | 1,054 (84.2%) |
| Fuel Oil or Kerosene | 0 (0.0%) | 0 (0.0%) |
| Coal or Coke | 0 (0.0%) | 0 (0.0%) |
| All other Fuels | 0 (0.0%) | 0 (0.0%) |
| No Fuel Used | 0 (0.0%) | 0 (0.0%) |
| Total | 993 (100.0%) | 1,252 (100.0%) |
Household Vehicle Usage in Avon
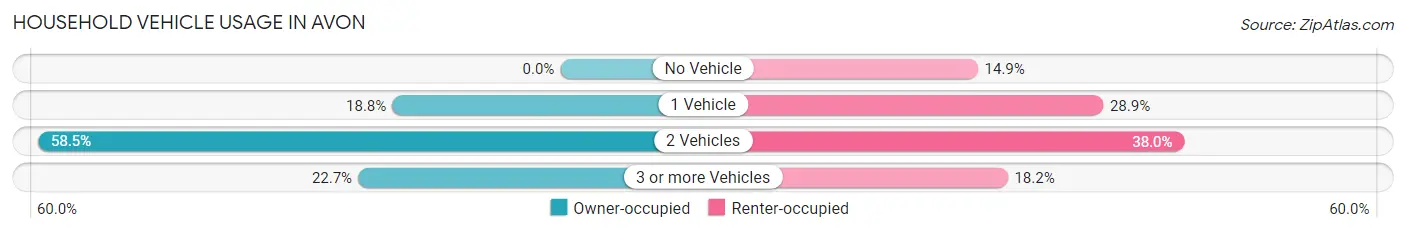
| Vehicles per Household | Owner-occupied | Renter-occupied |
| No Vehicle | 0 (0.0%) | 186 (14.9%) |
| 1 Vehicle | 187 (18.8%) | 362 (28.9%) |
| 2 Vehicles | 581 (58.5%) | 476 (38.0%) |
| 3 or more Vehicles | 225 (22.7%) | 228 (18.2%) |
| Total | 993 (100.0%) | 1,252 (100.0%) |
Real Estate & Mortgages in Avon
Real Estate and Mortgage Overview in Avon
| Characteristic | Without Mortgage | With Mortgage |
| Housing Units | 272 | 721 |
| Median Property Value | - | - |
| Median Household Income | - | - |
| Monthly Housing Costs | - | - |
| Real Estate Taxes | - | - |
Property Value by Mortgage Status in Avon
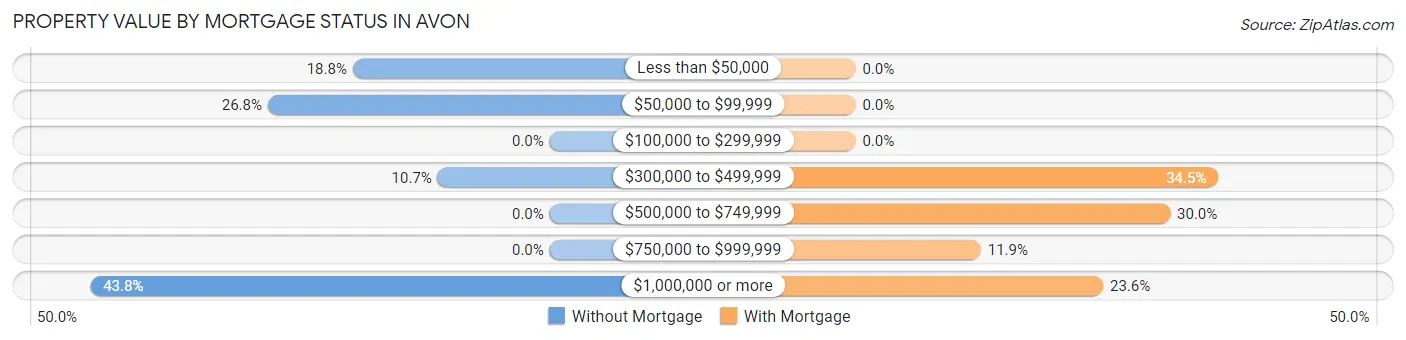
| Property Value | Without Mortgage | With Mortgage |
| Less than $50,000 | 51 (18.8%) | 0 (0.0%) |
| $50,000 to $99,999 | 73 (26.8%) | 0 (0.0%) |
| $100,000 to $299,999 | 0 (0.0%) | 0 (0.0%) |
| $300,000 to $499,999 | 29 (10.7%) | 249 (34.5%) |
| $500,000 to $749,999 | 0 (0.0%) | 216 (30.0%) |
| $750,000 to $999,999 | 0 (0.0%) | 86 (11.9%) |
| $1,000,000 or more | 119 (43.8%) | 170 (23.6%) |
| Total | 272 (100.0%) | 721 (100.0%) |
Household Income by Mortgage Status in Avon
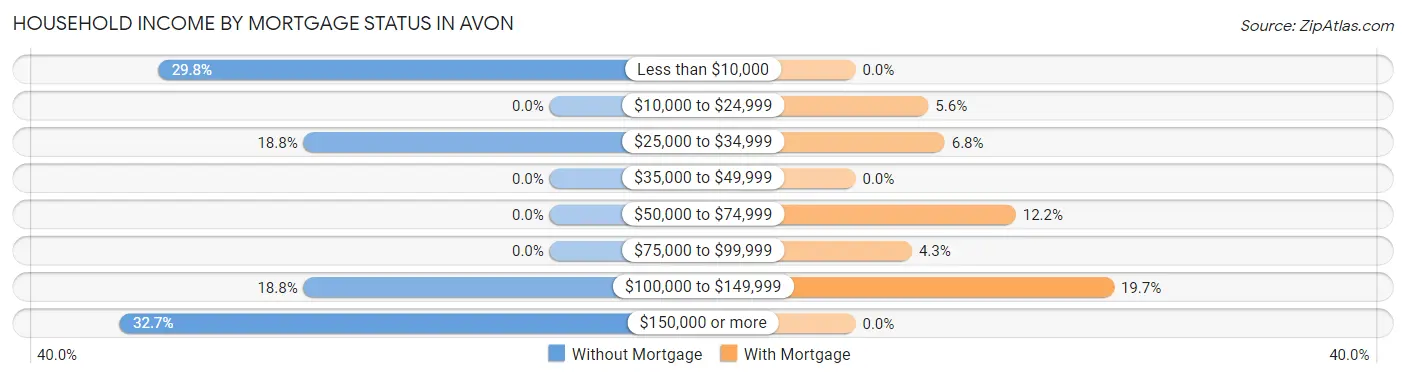
| Household Income | Without Mortgage | With Mortgage |
| Less than $10,000 | 81 (29.8%) | 0 (0.0%) |
| $10,000 to $24,999 | 0 (0.0%) | 40 (5.6%) |
| $25,000 to $34,999 | 51 (18.8%) | 49 (6.8%) |
| $35,000 to $49,999 | 0 (0.0%) | 0 (0.0%) |
| $50,000 to $74,999 | 0 (0.0%) | 88 (12.2%) |
| $75,000 to $99,999 | 0 (0.0%) | 31 (4.3%) |
| $100,000 to $149,999 | 51 (18.8%) | 142 (19.7%) |
| $150,000 or more | 89 (32.7%) | 0 (0.0%) |
| Total | 272 (100.0%) | 721 (100.0%) |
Property Value to Household Income Ratio in Avon
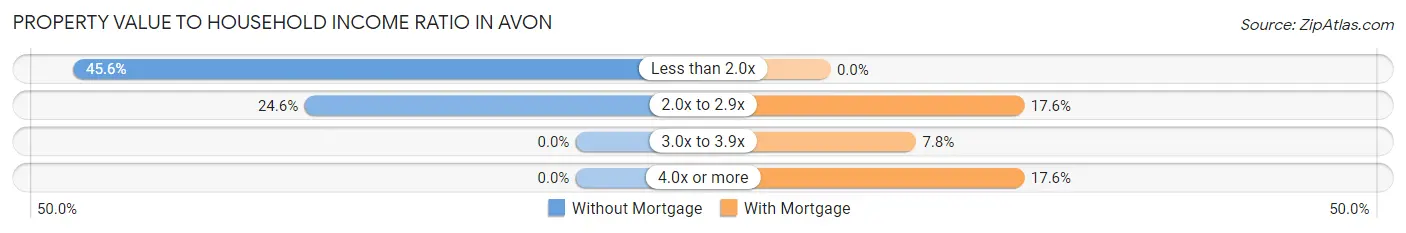
| Value-to-Income Ratio | Without Mortgage | With Mortgage |
| Less than 2.0x | 124 (45.6%) | 0 (0.0%) |
| 2.0x to 2.9x | 67 (24.6%) | 127 (17.6%) |
| 3.0x to 3.9x | 0 (0.0%) | 56 (7.8%) |
| 4.0x or more | 0 (0.0%) | 127 (17.6%) |
| Total | 272 (100.0%) | 721 (100.0%) |
Real Estate Taxes by Mortgage Status in Avon
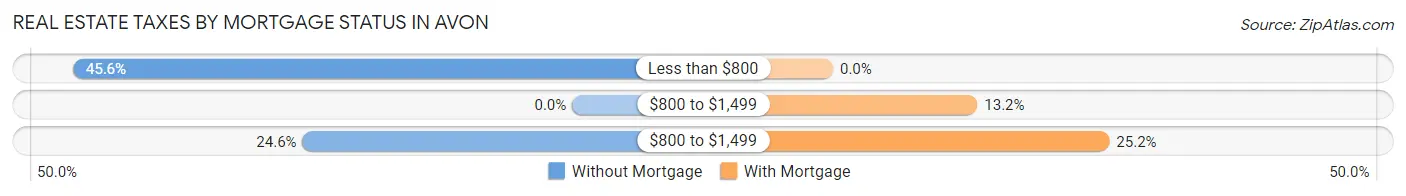
| Property Taxes | Without Mortgage | With Mortgage |
| Less than $800 | 124 (45.6%) | 0 (0.0%) |
| $800 to $1,499 | 0 (0.0%) | 95 (13.2%) |
| $800 to $1,499 | 67 (24.6%) | 182 (25.2%) |
| Total | 272 (100.0%) | 721 (100.0%) |
Health & Disability in Avon
Health Insurance Coverage by Age in Avon
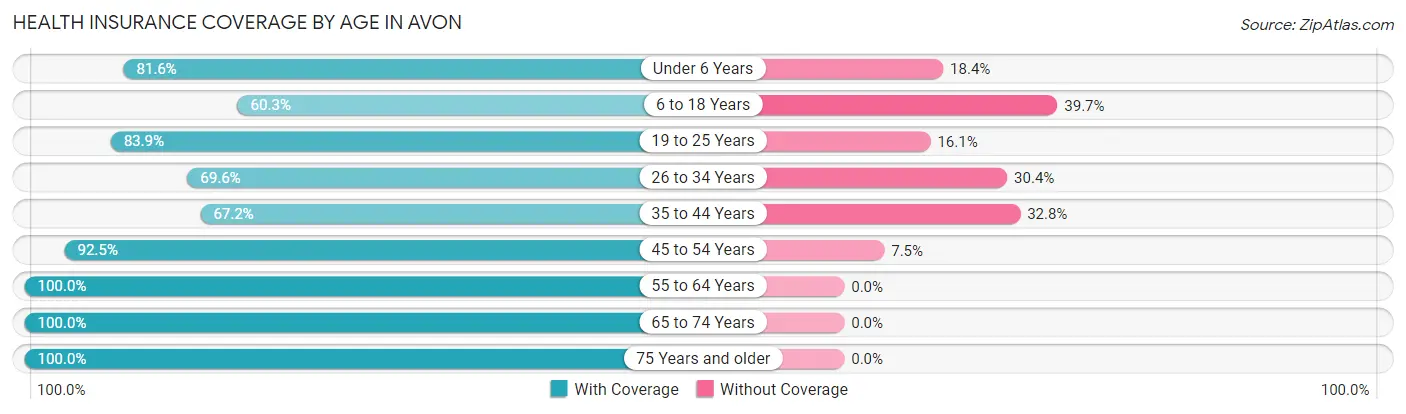
| Age Bracket | With Coverage | Without Coverage |
| Under 6 Years | 367 (81.6%) | 83 (18.4%) |
| 6 to 18 Years | 581 (60.3%) | 383 (39.7%) |
| 19 to 25 Years | 350 (83.9%) | 67 (16.1%) |
| 26 to 34 Years | 885 (69.6%) | 386 (30.4%) |
| 35 to 44 Years | 635 (67.2%) | 310 (32.8%) |
| 45 to 54 Years | 856 (92.5%) | 69 (7.5%) |
| 55 to 64 Years | 876 (100.0%) | 0 (0.0%) |
| 65 to 74 Years | 149 (100.0%) | 0 (0.0%) |
| 75 Years and older | 118 (100.0%) | 0 (0.0%) |
| Total | 4,817 (78.8%) | 1,298 (21.2%) |
Health Insurance Coverage by Citizenship Status in Avon
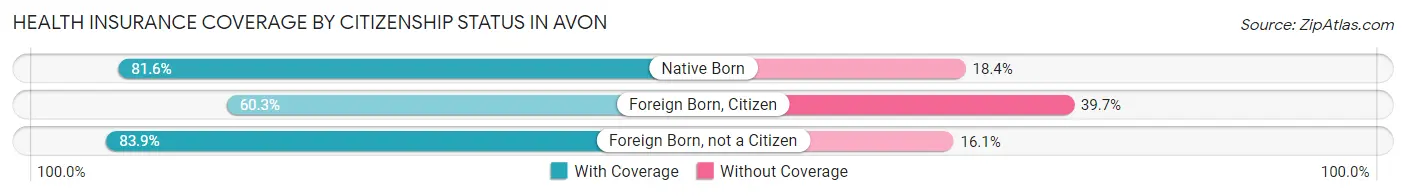
| Citizenship Status | With Coverage | Without Coverage |
| Native Born | 367 (81.6%) | 83 (18.4%) |
| Foreign Born, Citizen | 581 (60.3%) | 383 (39.7%) |
| Foreign Born, not a Citizen | 350 (83.9%) | 67 (16.1%) |
Health Insurance Coverage by Household Income in Avon
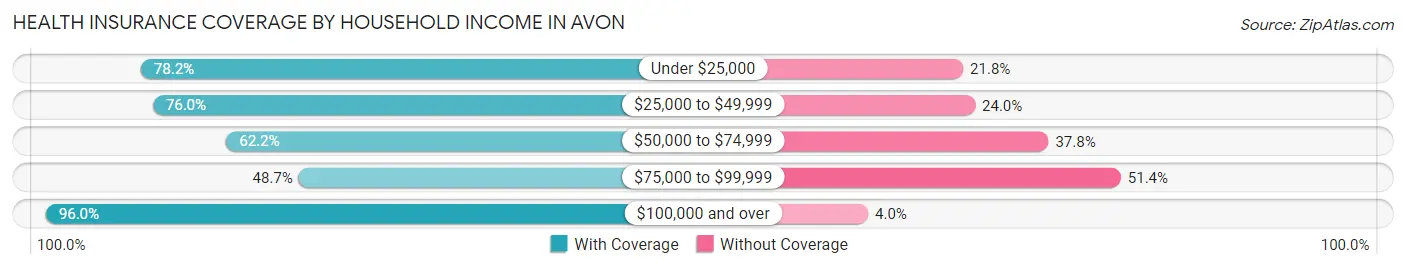
| Household Income | With Coverage | Without Coverage |
| Under $25,000 | 660 (78.2%) | 184 (21.8%) |
| $25,000 to $49,999 | 556 (76.0%) | 176 (24.0%) |
| $50,000 to $74,999 | 293 (62.2%) | 178 (37.8%) |
| $75,000 to $99,999 | 614 (48.6%) | 648 (51.3%) |
| $100,000 and over | 2,694 (96.0%) | 112 (4.0%) |
Public vs Private Health Insurance Coverage by Age in Avon
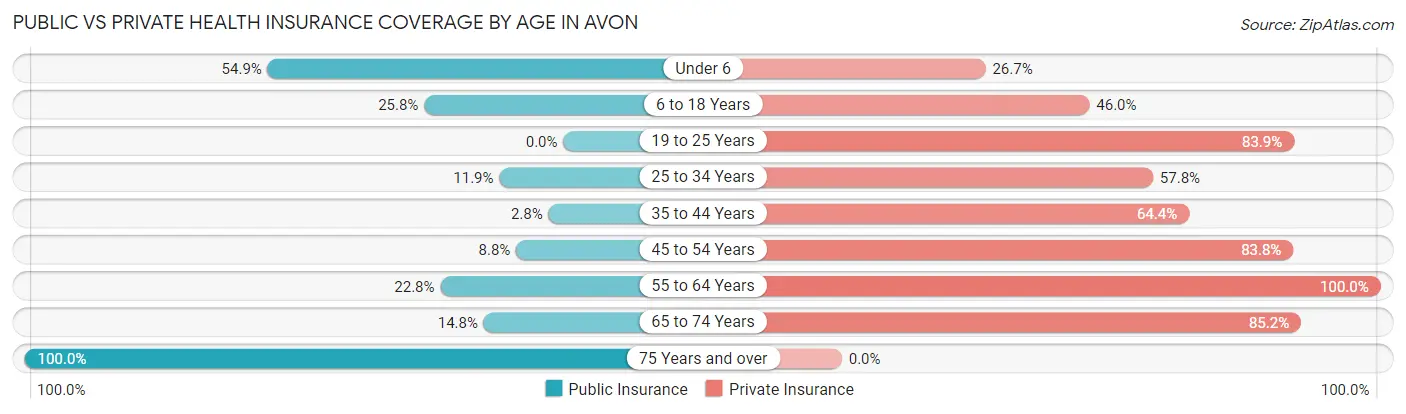
| Age Bracket | Public Insurance | Private Insurance |
| Under 6 | 247 (54.9%) | 120 (26.7%) |
| 6 to 18 Years | 249 (25.8%) | 443 (46.0%) |
| 19 to 25 Years | 0 (0.0%) | 350 (83.9%) |
| 25 to 34 Years | 151 (11.9%) | 734 (57.8%) |
| 35 to 44 Years | 26 (2.8%) | 609 (64.4%) |
| 45 to 54 Years | 81 (8.8%) | 775 (83.8%) |
| 55 to 64 Years | 200 (22.8%) | 876 (100.0%) |
| 65 to 74 Years | 22 (14.8%) | 127 (85.2%) |
| 75 Years and over | 118 (100.0%) | 0 (0.0%) |
| Total | 1,094 (17.9%) | 4,034 (66.0%) |
Disability Status by Sex by Age in Avon
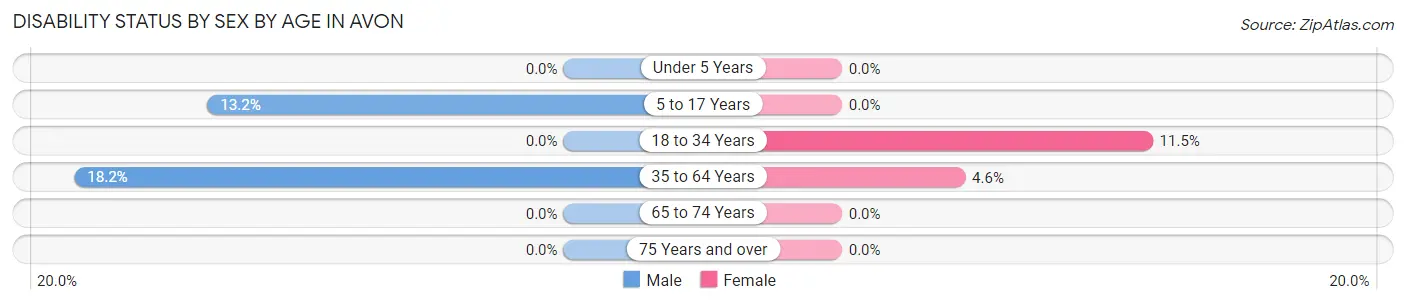
| Age Bracket | Male | Female |
| Under 5 Years | 0 (0.0%) | 0 (0.0%) |
| 5 to 17 Years | 58 (13.2%) | 0 (0.0%) |
| 18 to 34 Years | 0 (0.0%) | 93 (11.5%) |
| 35 to 64 Years | 245 (18.1%) | 64 (4.6%) |
| 65 to 74 Years | 0 (0.0%) | 0 (0.0%) |
| 75 Years and over | 0 (0.0%) | 0 (0.0%) |
Disability Class by Sex by Age in Avon
Disability Class: Hearing Difficulty
| Age Bracket | Male | Female |
| Under 5 Years | 0 (0.0%) | 0 (0.0%) |
| 5 to 17 Years | 0 (0.0%) | 0 (0.0%) |
| 18 to 34 Years | 0 (0.0%) | 0 (0.0%) |
| 35 to 64 Years | 0 (0.0%) | 0 (0.0%) |
| 65 to 74 Years | 0 (0.0%) | 0 (0.0%) |
| 75 Years and over | 0 (0.0%) | 0 (0.0%) |
Disability Class: Vision Difficulty
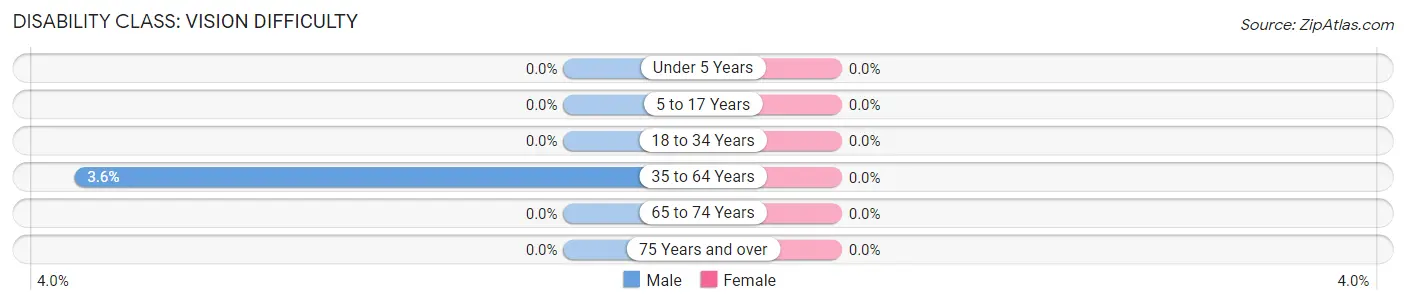
| Age Bracket | Male | Female |
| Under 5 Years | 0 (0.0%) | 0 (0.0%) |
| 5 to 17 Years | 0 (0.0%) | 0 (0.0%) |
| 18 to 34 Years | 0 (0.0%) | 0 (0.0%) |
| 35 to 64 Years | 49 (3.6%) | 0 (0.0%) |
| 65 to 74 Years | 0 (0.0%) | 0 (0.0%) |
| 75 Years and over | 0 (0.0%) | 0 (0.0%) |
Disability Class: Cognitive Difficulty
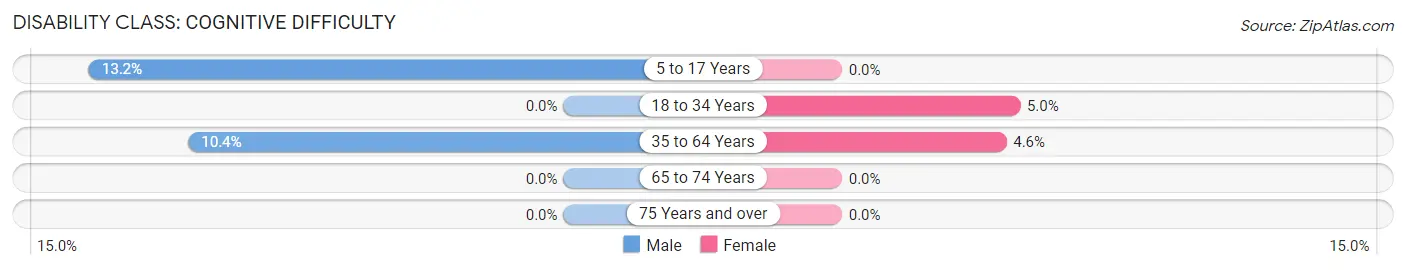
| Age Bracket | Male | Female |
| 5 to 17 Years | 58 (13.2%) | 0 (0.0%) |
| 18 to 34 Years | 0 (0.0%) | 40 (5.0%) |
| 35 to 64 Years | 141 (10.4%) | 64 (4.6%) |
| 65 to 74 Years | 0 (0.0%) | 0 (0.0%) |
| 75 Years and over | 0 (0.0%) | 0 (0.0%) |
Disability Class: Ambulatory Difficulty
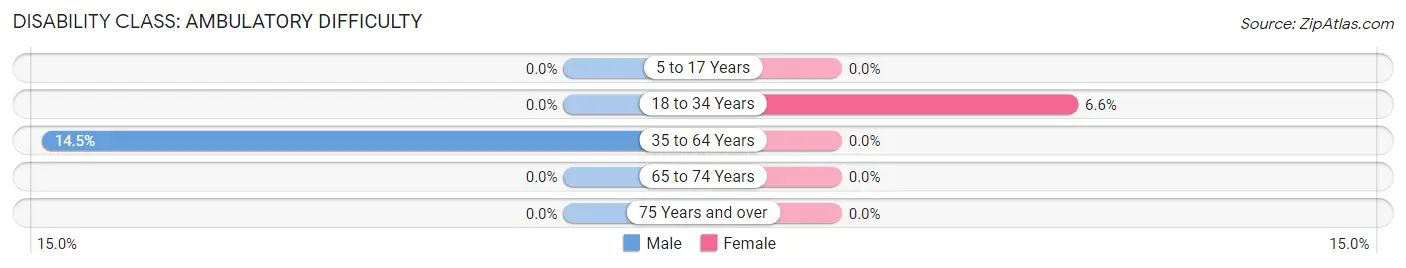
| Age Bracket | Male | Female |
| 5 to 17 Years | 0 (0.0%) | 0 (0.0%) |
| 18 to 34 Years | 0 (0.0%) | 53 (6.6%) |
| 35 to 64 Years | 196 (14.5%) | 0 (0.0%) |
| 65 to 74 Years | 0 (0.0%) | 0 (0.0%) |
| 75 Years and over | 0 (0.0%) | 0 (0.0%) |
Disability Class: Self-Care Difficulty
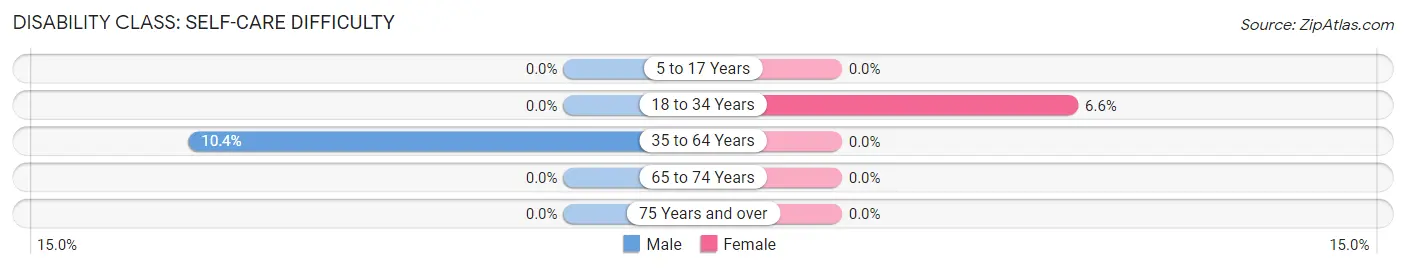
| Age Bracket | Male | Female |
| 5 to 17 Years | 0 (0.0%) | 0 (0.0%) |
| 18 to 34 Years | 0 (0.0%) | 53 (6.6%) |
| 35 to 64 Years | 141 (10.4%) | 0 (0.0%) |
| 65 to 74 Years | 0 (0.0%) | 0 (0.0%) |
| 75 Years and over | 0 (0.0%) | 0 (0.0%) |
Technology Access in Avon
Computing Device Access in Avon
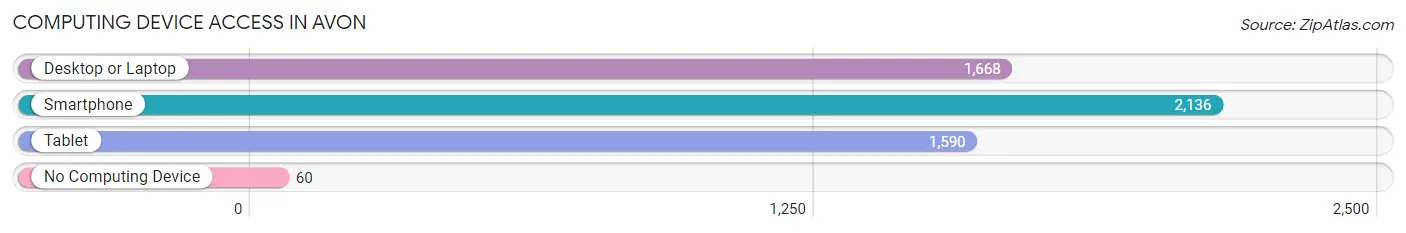
| Device Type | # Households | % Households |
| Desktop or Laptop | 1,668 | 74.3% |
| Smartphone | 2,136 | 95.1% |
| Tablet | 1,590 | 70.8% |
| No Computing Device | 60 | 2.7% |
| Total | 2,245 | 100.0% |
Internet Access in Avon
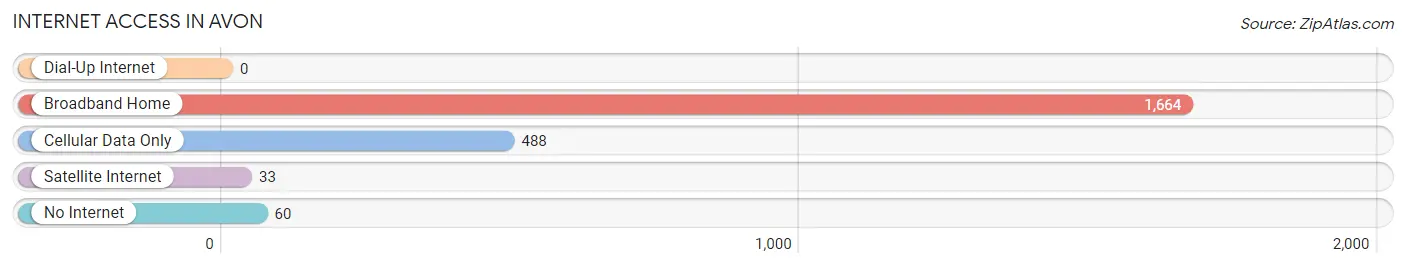
| Internet Type | # Households | % Households |
| Dial-Up Internet | 0 | 0.0% |
| Broadband Home | 1,664 | 74.1% |
| Cellular Data Only | 488 | 21.7% |
| Satellite Internet | 33 | 1.5% |
| No Internet | 60 | 2.7% |
| Total | 2,245 | 100.0% |
Avon Summary
Avon, Colorado is a small town located in Eagle County, Colorado. It is situated in the Rocky Mountains, just west of Vail and east of Eagle. The town was founded in 1881 and has a population of 6,500 people as of 2020.
Geography
Avon is located in the Rocky Mountains of Colorado, at an elevation of 8,100 feet. The town is situated in the Eagle River Valley, between the Gore Range to the north and the Sawatch Range to the south. The town is surrounded by mountains, including the Beaver Creek Ski Resort to the west, the White River National Forest to the east, and the Holy Cross Wilderness to the south. Avon is located approximately 30 miles west of Vail and 40 miles east of Eagle.
The town is situated in a semi-arid climate, with hot summers and cold winters. The average annual temperature is 45 degrees Fahrenheit, with an average high of 75 degrees in the summer and an average low of 15 degrees in the winter. The average annual precipitation is 16 inches, with most of the precipitation occurring in the spring and summer months.
Economy
Avon's economy is largely based on tourism, with the town being home to the Beaver Creek Ski Resort. The resort is one of the most popular ski resorts in the United States, and attracts visitors from all over the world. The resort is also home to the annual Birds of Prey World Cup, a major international ski race.
In addition to the ski resort, Avon is home to several other businesses, including restaurants, retail stores, and lodging. The town is also home to several corporate offices, including the headquarters of the Vail Resorts ski company.
Demographics
As of the 2020 census, Avon had a population of 6,500 people. The racial makeup of the town was 94.3% White, 1.2% Black or African American, 0.7% Native American, 0.7% Asian, 0.2% Pacific Islander, 1.2% from other races, and 2.1% from two or more races. Hispanic or Latino of any race were 5.2% of the population.
The median household income in Avon was $77,917, and the median family income was $90,917. The per capita income for the town was $41,917. About 4.3% of families and 6.2% of the population were below the poverty line, including 8.2% of those under age 18 and 4.3% of those age 65 or over.
Avon is a small town with a unique culture and economy. The town is home to a variety of businesses, including the Beaver Creek Ski Resort, and attracts visitors from all over the world. The town has a diverse population, with a mix of races and ethnicities, and a strong economy. Avon is a great place to live, work, and play.
Common Questions
What is Per Capita Income in Avon?
Per Capita income in Avon is $51,056.
What is the Median Family Income in Avon?
Median Family Income in Avon is $141,816.
What is the Median Household income in Avon?
Median Household Income in Avon is $85,817.
What is Income or Wage Gap in Avon?
Income or Wage Gap in Avon is 23.8%.
Women in Avon earn 76.2 cents for every dollar earned by a man.
What is Inequality or Gini Index in Avon?
Inequality or Gini Index in Avon is 0.51.
What is the Total Population of Avon?
Total Population of Avon is 6,115.
What is the Total Male Population of Avon?
Total Male Population of Avon is 3,179.
What is the Total Female Population of Avon?
Total Female Population of Avon is 2,936.
What is the Ratio of Males per 100 Females in Avon?
There are 108.28 Males per 100 Females in Avon.
What is the Ratio of Females per 100 Males in Avon?
There are 92.36 Females per 100 Males in Avon.
What is the Median Population Age in Avon?
Median Population Age in Avon is 34.8 Years.
What is the Average Family Size in Avon
Average Family Size in Avon is 3.1 People.
What is the Average Household Size in Avon
Average Household Size in Avon is 2.7 People.
How Large is the Labor Force in Avon?
There are 4,052 People in the Labor Forcein in Avon.
What is the Percentage of People in the Labor Force in Avon?
82.7% of People are in the Labor Force in Avon.
What is the Unemployment Rate in Avon?
Unemployment Rate in Avon is 7.1%.