Joes, CO Map & Demographics
Joes Map
Joes Overview
$23,476
PER CAPITA INCOME
$58,750
AVG FAMILY INCOME
0.40
INEQUALITY / GINI INDEX
121
TOTAL POPULATION
60
MALE POPULATION
61
FEMALE POPULATION
98.36
MALES / 100 FEMALES
101.67
FEMALES / 100 MALES
41.7
MEDIAN AGE
3.1
AVG FAMILY SIZE
3.0
AVG HOUSEHOLD SIZE
44
LABOR FORCE [ PEOPLE ]
55.0%
PERCENT IN LABOR FORCE
4.5%
UNEMPLOYMENT RATE
Joes Zip Codes
Joes Area Codes
Income in Joes
Income Overview in Joes
| Characteristic | Number | Measure |
| Per Capita Income | 121 | $23,476 |
| Median Family Income | 30 | $58,750 |
| Mean Family Income | 30 | $74,223 |
| Median Household Income | 41 | $0 |
| Mean Household Income | 41 | $62,929 |
| Income Deficit | 30 | $0 |
| Wage / Income Gap (%) | 121 | 0.00% |
| Wage / Income Gap ($) | 121 | 100.00¢ per $1 |
| Gini / Inequality Index | 121 | 0.40 |
Earnings by Sex in Joes
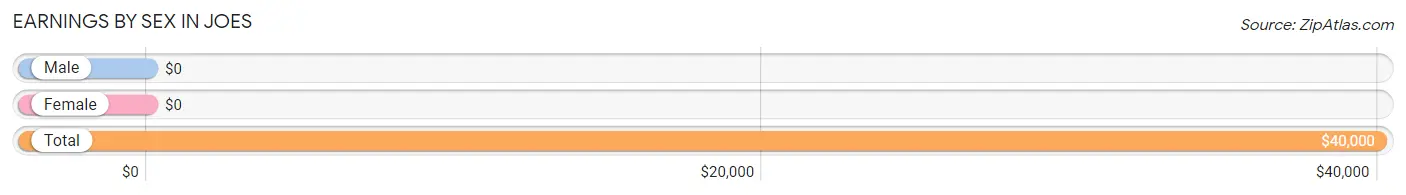
| Sex | Number | Average Earnings |
| Male | 26 (59.1%) | $0 |
| Female | 18 (40.9%) | $0 |
| Total | 44 (100.0%) | $40,000 |
Earnings by Sex by Income Bracket in Joes
The most common earnings brackets in Joes are $25,000 to $29,999 for men (6 | 23.1%) and $65,000 to $74,999 for women (5 | 27.8%).
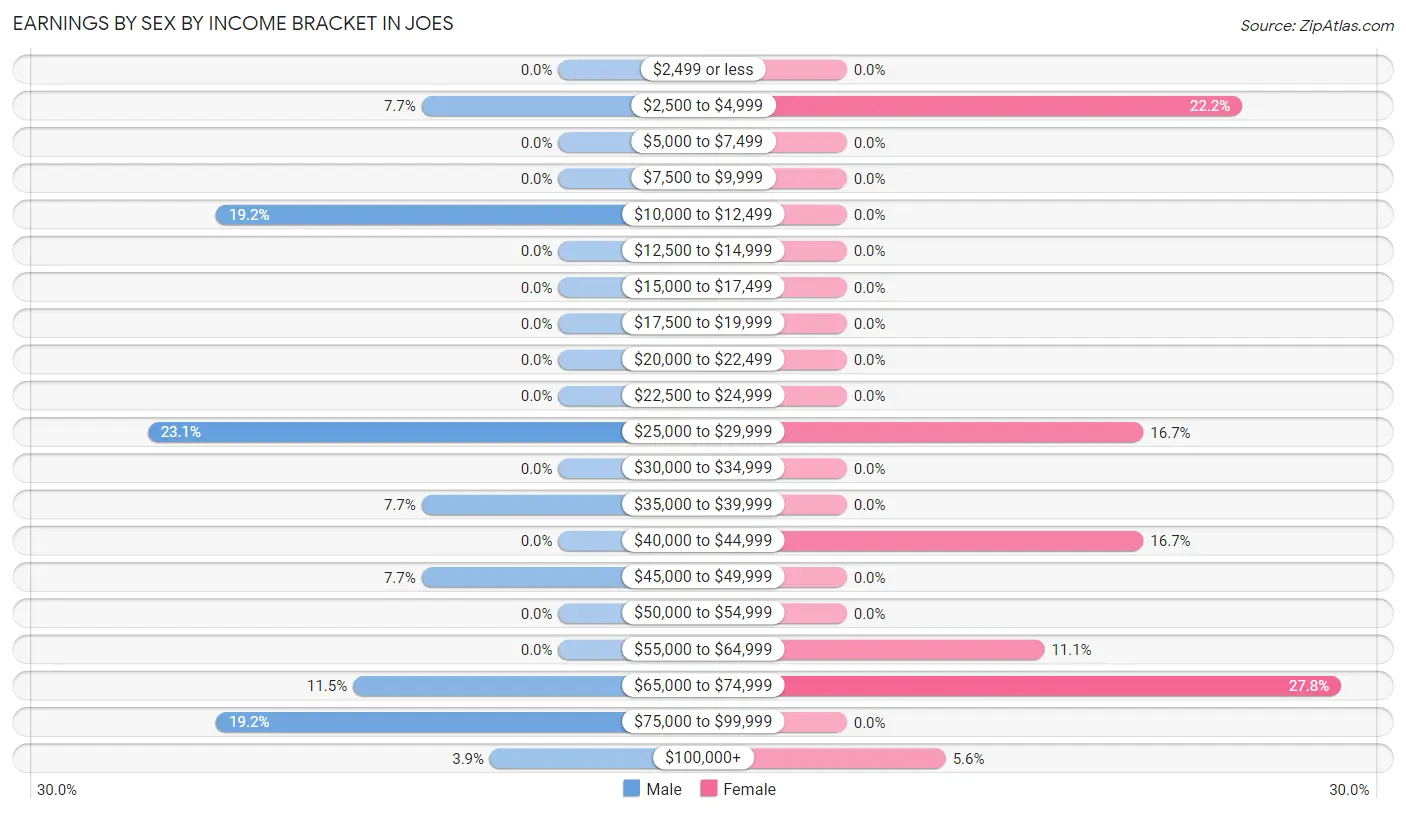
| Income | Male | Female |
| $2,499 or less | 0 (0.0%) | 0 (0.0%) |
| $2,500 to $4,999 | 2 (7.7%) | 4 (22.2%) |
| $5,000 to $7,499 | 0 (0.0%) | 0 (0.0%) |
| $7,500 to $9,999 | 0 (0.0%) | 0 (0.0%) |
| $10,000 to $12,499 | 5 (19.2%) | 0 (0.0%) |
| $12,500 to $14,999 | 0 (0.0%) | 0 (0.0%) |
| $15,000 to $17,499 | 0 (0.0%) | 0 (0.0%) |
| $17,500 to $19,999 | 0 (0.0%) | 0 (0.0%) |
| $20,000 to $22,499 | 0 (0.0%) | 0 (0.0%) |
| $22,500 to $24,999 | 0 (0.0%) | 0 (0.0%) |
| $25,000 to $29,999 | 6 (23.1%) | 3 (16.7%) |
| $30,000 to $34,999 | 0 (0.0%) | 0 (0.0%) |
| $35,000 to $39,999 | 2 (7.7%) | 0 (0.0%) |
| $40,000 to $44,999 | 0 (0.0%) | 3 (16.7%) |
| $45,000 to $49,999 | 2 (7.7%) | 0 (0.0%) |
| $50,000 to $54,999 | 0 (0.0%) | 0 (0.0%) |
| $55,000 to $64,999 | 0 (0.0%) | 2 (11.1%) |
| $65,000 to $74,999 | 3 (11.5%) | 5 (27.8%) |
| $75,000 to $99,999 | 5 (19.2%) | 0 (0.0%) |
| $100,000+ | 1 (3.8%) | 1 (5.6%) |
| Total | 26 (100.0%) | 18 (100.0%) |
Earnings by Sex by Educational Attainment in Joes
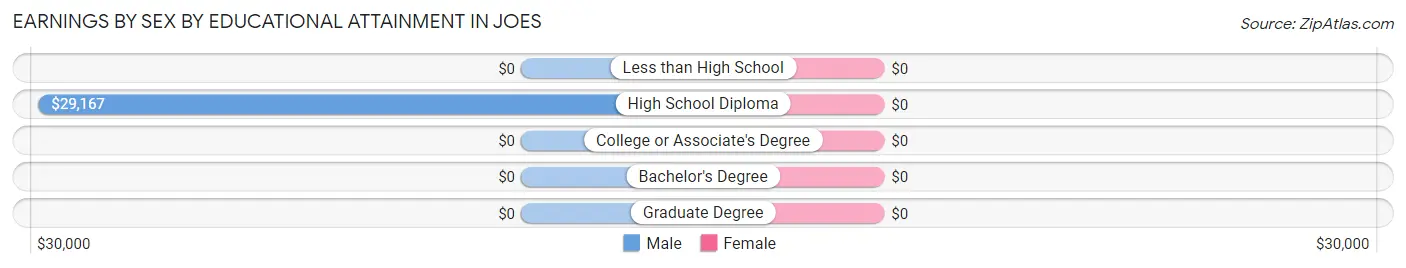
| Educational Attainment | Male Income | Female Income |
| Less than High School | - | - |
| High School Diploma | $29,167 | $0 |
| College or Associate's Degree | - | - |
| Bachelor's Degree | - | - |
| Graduate Degree | - | - |
| Total | - | - |
Family Income in Joes
Family Income Brackets in Joes
According to the Joes family income data, there are 12 families falling into the $25,000 to $34,999 income range, which is the most common income bracket and makes up 40.0% of all families.
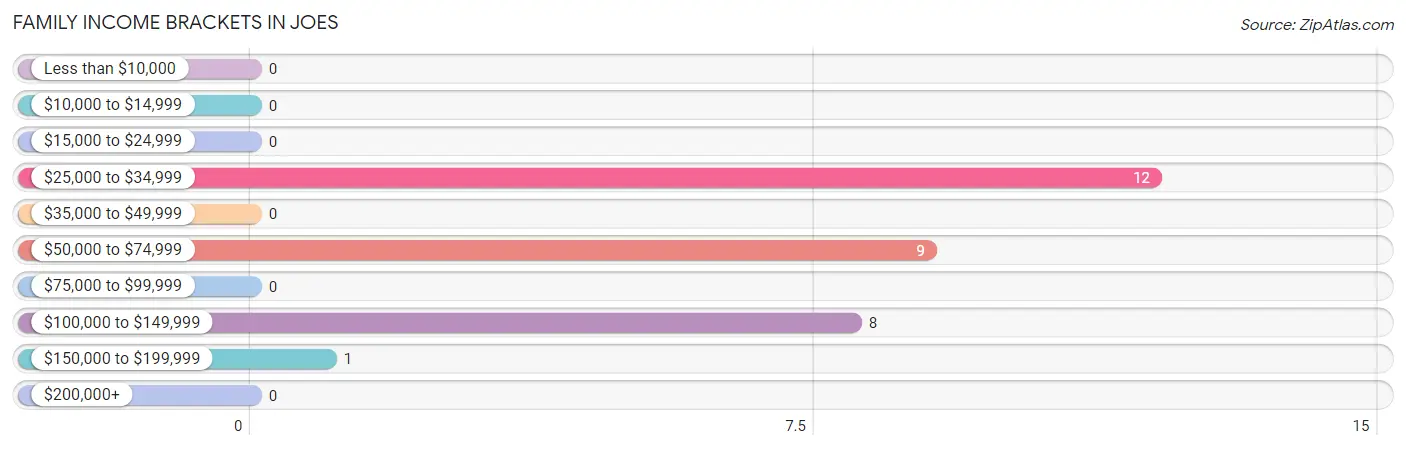
| Income Bracket | # Families | % Families |
| Less than $10,000 | 0 | 0.0% |
| $10,000 to $14,999 | 0 | 0.0% |
| $15,000 to $24,999 | 0 | 0.0% |
| $25,000 to $34,999 | 12 | 40.0% |
| $35,000 to $49,999 | 0 | 0.0% |
| $50,000 to $74,999 | 9 | 30.0% |
| $75,000 to $99,999 | 0 | 0.0% |
| $100,000 to $149,999 | 8 | 26.7% |
| $150,000 to $199,999 | 1 | 3.3% |
| $200,000+ | 0 | 0.0% |
Family Income by Famaliy Size in Joes
2-person families (12 | 40.0%) account for the highest median family income in Joes with $119,167 per family, while 2-person families (12 | 40.0%) have the highest median income of $59,584 per family member.
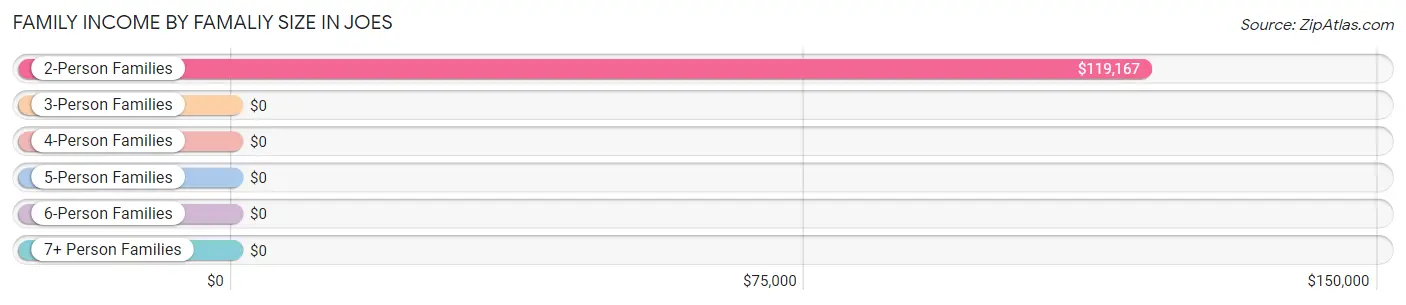
| Income Bracket | # Families | Median Income |
| 2-Person Families | 12 (40.0%) | $119,167 |
| 3-Person Families | 6 (20.0%) | $0 |
| 4-Person Families | 2 (6.7%) | $0 |
| 5-Person Families | 0 (0.0%) | $0 |
| 6-Person Families | 10 (33.3%) | $0 |
| 7+ Person Families | 0 (0.0%) | $0 |
| Total | 30 (100.0%) | $58,750 |
Family Income by Number of Earners in Joes
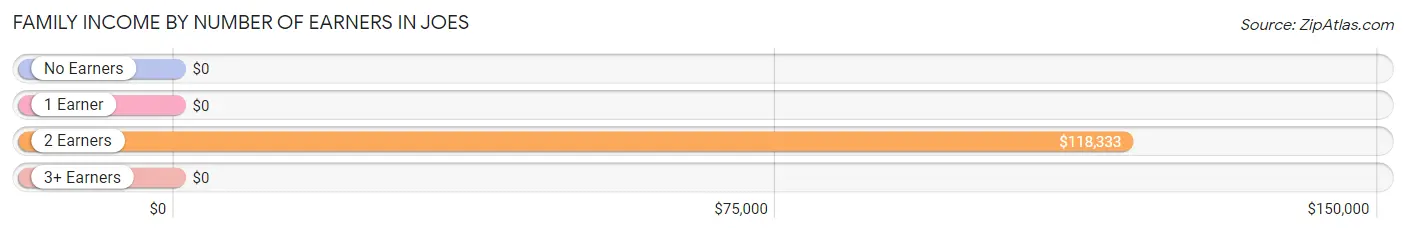
| Number of Earners | # Families | Median Income |
| No Earners | 12 (40.0%) | $0 |
| 1 Earner | 7 (23.3%) | $0 |
| 2 Earners | 10 (33.3%) | $118,333 |
| 3+ Earners | 1 (3.3%) | $0 |
| Total | 30 (100.0%) | $58,750 |
Household Income in Joes
Household Income Brackets in Joes
With 14 households falling in the category, the $25,000 to $34,999 income range is the most frequent in Joes, accounting for 34.2% of all households.
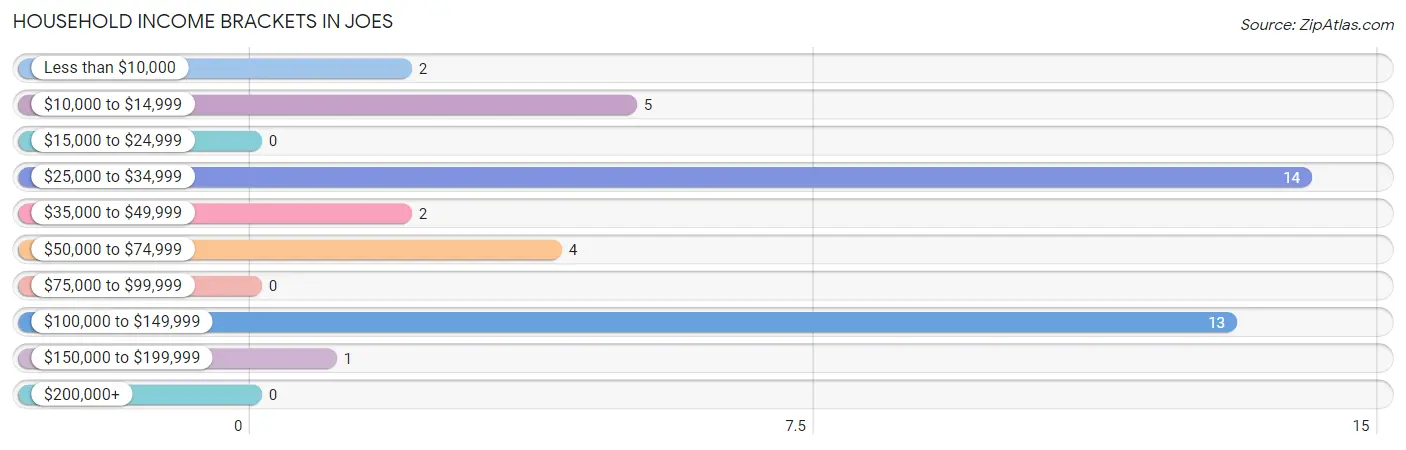
| Income Bracket | # Households | % Households |
| Less than $10,000 | 2 | 4.9% |
| $10,000 to $14,999 | 5 | 12.2% |
| $15,000 to $24,999 | 0 | 0.0% |
| $25,000 to $34,999 | 14 | 34.1% |
| $35,000 to $49,999 | 2 | 4.9% |
| $50,000 to $74,999 | 4 | 9.8% |
| $75,000 to $99,999 | 0 | 0.0% |
| $100,000 to $149,999 | 13 | 31.7% |
| $150,000 to $199,999 | 1 | 2.4% |
| $200,000+ | 0 | 0.0% |
Household Income by Householder Age in Joes
The median household income in Joes is $0, with the highest median household income of $101,500 found in the 25 to 44 years age bracket for the primary householder. A total of 10 households (24.4%) fall into this category.
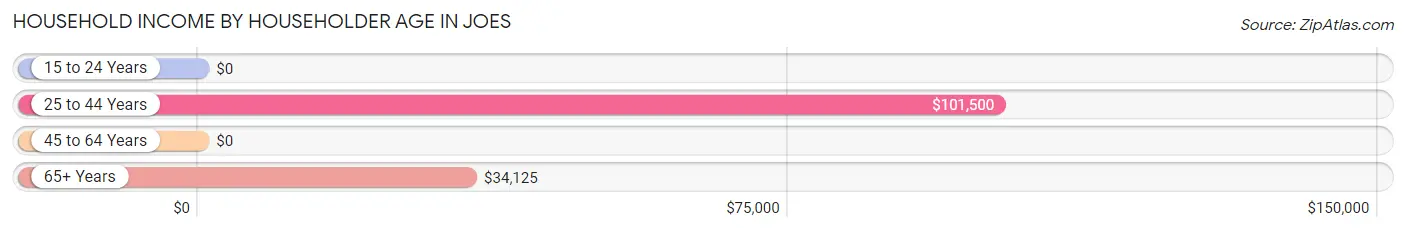
| Income Bracket | # Households | Median Income |
| 15 to 24 Years | 0 (0.0%) | $0 |
| 25 to 44 Years | 10 (24.4%) | $101,500 |
| 45 to 64 Years | 10 (24.4%) | $0 |
| 65+ Years | 21 (51.2%) | $34,125 |
| Total | 41 (100.0%) | $0 |
Poverty in Joes
Income Below Poverty by Sex and Age in Joes
With 38.3% poverty level for males and 41.7% for females among the residents of Joes, under 5 year old males and 75 year old and over females are the most vulnerable to poverty, with 8 males (100.0%) and 10 females (71.4%) in their respective age groups living below the poverty level.
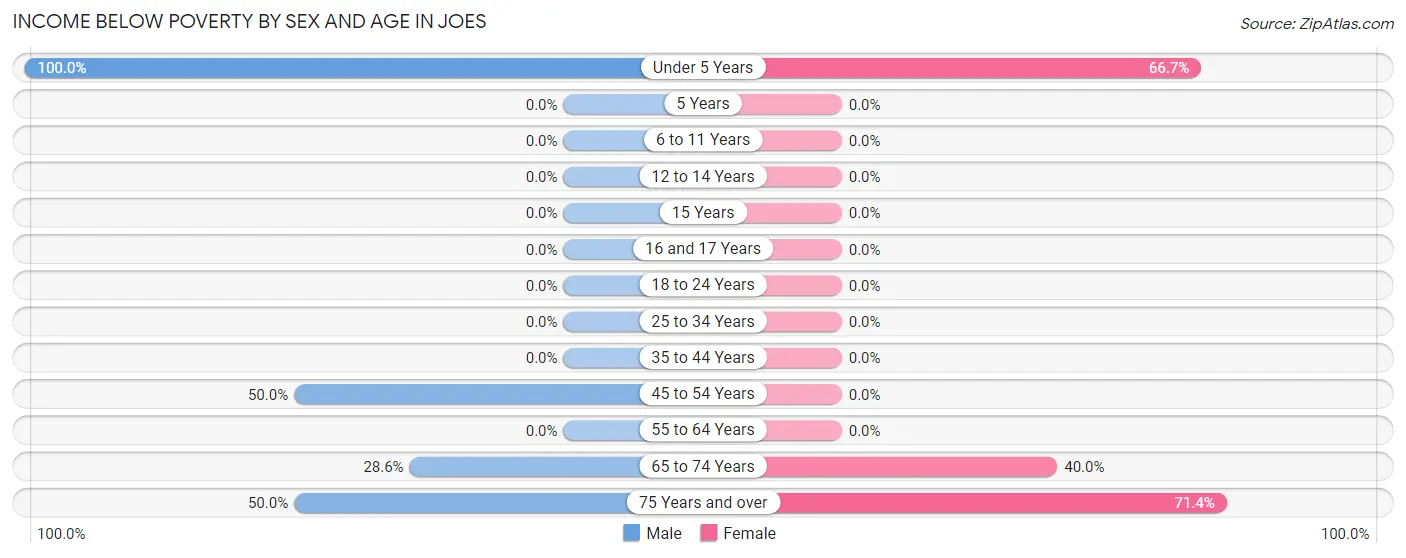
| Age Bracket | Male | Female |
| Under 5 Years | 8 (100.0%) | 8 (66.7%) |
| 5 Years | 0 (0.0%) | 0 (0.0%) |
| 6 to 11 Years | 0 (0.0%) | 0 (0.0%) |
| 12 to 14 Years | 0 (0.0%) | 0 (0.0%) |
| 15 Years | 0 (0.0%) | 0 (0.0%) |
| 16 and 17 Years | 0 (0.0%) | 0 (0.0%) |
| 18 to 24 Years | 0 (0.0%) | 0 (0.0%) |
| 25 to 34 Years | 0 (0.0%) | 0 (0.0%) |
| 35 to 44 Years | 0 (0.0%) | 0 (0.0%) |
| 45 to 54 Years | 5 (50.0%) | 0 (0.0%) |
| 55 to 64 Years | 0 (0.0%) | 0 (0.0%) |
| 65 to 74 Years | 2 (28.6%) | 2 (40.0%) |
| 75 Years and over | 8 (50.0%) | 10 (71.4%) |
| Total | 23 (38.3%) | 20 (41.7%) |
Income Above Poverty by Sex and Age in Joes
According to the poverty statistics in Joes, males aged 6 to 11 years and females aged 12 to 14 years are the age groups that are most secure financially, with 100.0% of males and 100.0% of females in these age groups living above the poverty line.
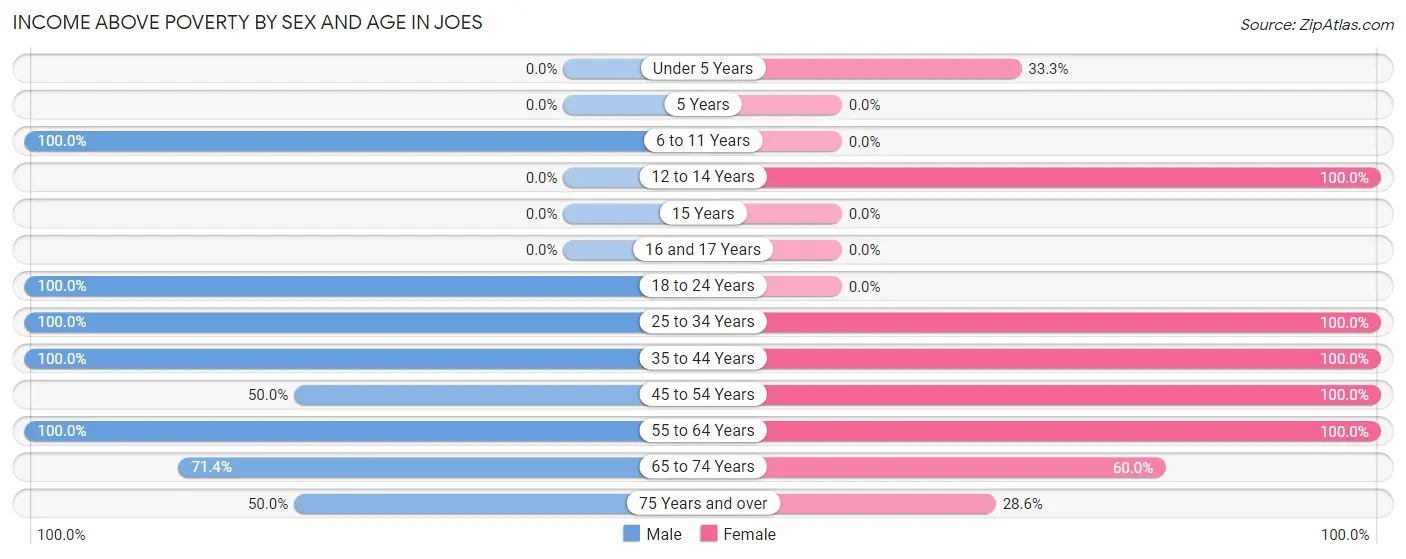
| Age Bracket | Male | Female |
| Under 5 Years | 0 (0.0%) | 4 (33.3%) |
| 5 Years | 0 (0.0%) | 0 (0.0%) |
| 6 to 11 Years | 6 (100.0%) | 0 (0.0%) |
| 12 to 14 Years | 0 (0.0%) | 2 (100.0%) |
| 15 Years | 0 (0.0%) | 0 (0.0%) |
| 16 and 17 Years | 0 (0.0%) | 0 (0.0%) |
| 18 to 24 Years | 2 (100.0%) | 0 (0.0%) |
| 25 to 34 Years | 5 (100.0%) | 3 (100.0%) |
| 35 to 44 Years | 2 (100.0%) | 9 (100.0%) |
| 45 to 54 Years | 5 (50.0%) | 1 (100.0%) |
| 55 to 64 Years | 4 (100.0%) | 2 (100.0%) |
| 65 to 74 Years | 5 (71.4%) | 3 (60.0%) |
| 75 Years and over | 8 (50.0%) | 4 (28.6%) |
| Total | 37 (61.7%) | 28 (58.3%) |
Income Below Poverty Among Married-Couple Families in Joes
The poverty statistics for married-couple families in Joes show that 43.5% or 10 of the total 23 families live below the poverty line. Families with 3 or 4 children have the highest poverty rate of 100.0%, comprising of 10 families. On the other hand, families with no children have the lowest poverty rate of 0.0%, which includes 0 families.
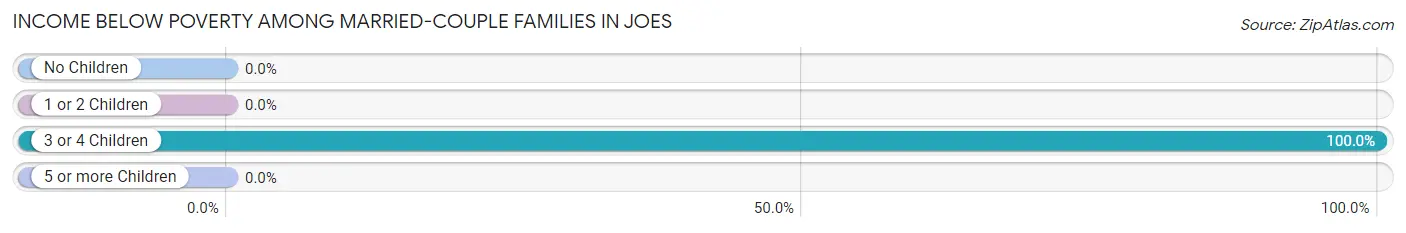
| Children | Above Poverty | Below Poverty |
| No Children | 11 (100.0%) | 0 (0.0%) |
| 1 or 2 Children | 2 (100.0%) | 0 (0.0%) |
| 3 or 4 Children | 0 (0.0%) | 10 (100.0%) |
| 5 or more Children | 0 (0.0%) | 0 (0.0%) |
| Total | 13 (56.5%) | 10 (43.5%) |
Income Below Poverty Among Single-Parent Households in Joes
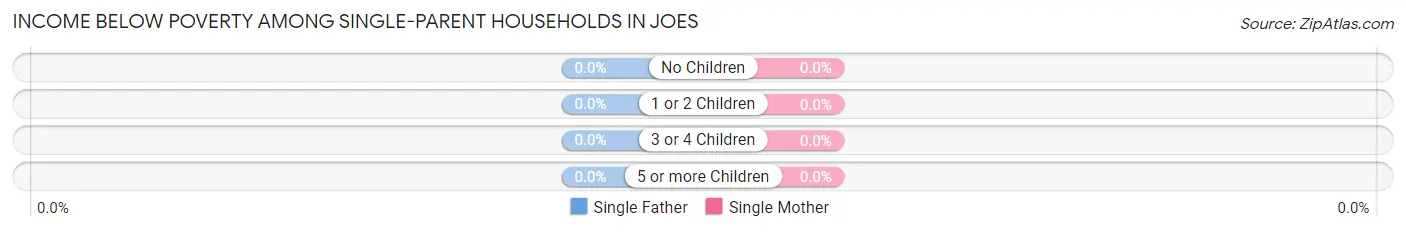
| Children | Single Father | Single Mother |
| No Children | 0 (0.0%) | 0 (0.0%) |
| 1 or 2 Children | 0 (0.0%) | 0 (0.0%) |
| 3 or 4 Children | 0 (0.0%) | 0 (0.0%) |
| 5 or more Children | 0 (0.0%) | 0 (0.0%) |
| Total | 0 (0.0%) | 0 (0.0%) |
Income Below Poverty Among Married-Couple vs Single-Parent Households in Joes
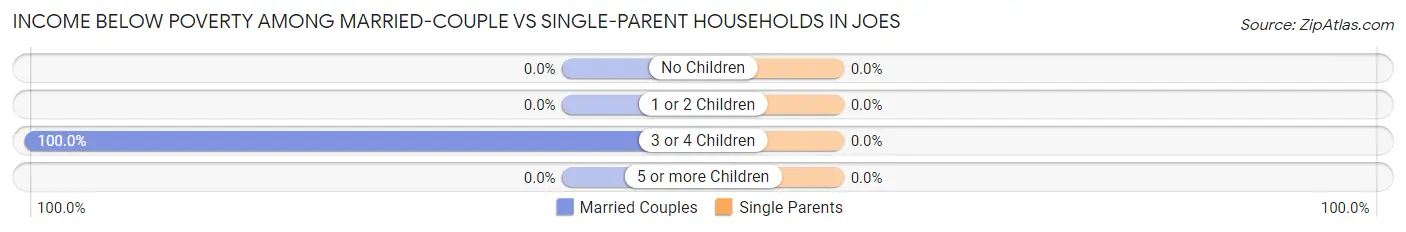
| Children | Married-Couple Families | Single-Parent Households |
| No Children | 0 (0.0%) | 0 (0.0%) |
| 1 or 2 Children | 0 (0.0%) | 0 (0.0%) |
| 3 or 4 Children | 10 (100.0%) | 0 (0.0%) |
| 5 or more Children | 0 (0.0%) | 0 (0.0%) |
| Total | 10 (43.5%) | 0 (0.0%) |
Race in Joes
The most populous races in Joes are White / Caucasian (74 | 61.2%), Hispanic or Latino (37 | 30.6%), and Asian (24 | 19.8%).
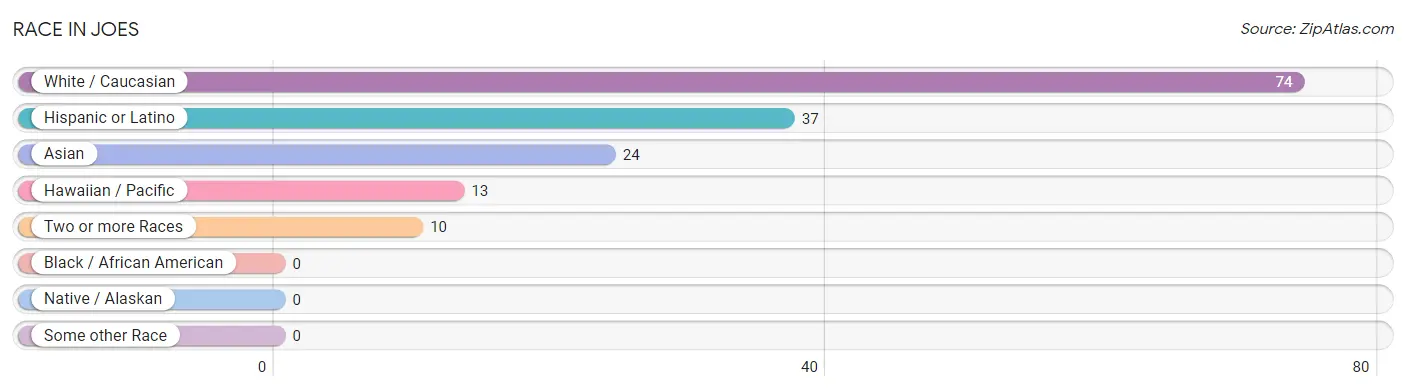
| Race | # Population | % Population |
| Asian | 24 | 19.8% |
| Black / African American | 0 | 0.0% |
| Hawaiian / Pacific | 13 | 10.7% |
| Hispanic or Latino | 37 | 30.6% |
| Native / Alaskan | 0 | 0.0% |
| White / Caucasian | 74 | 61.2% |
| Two or more Races | 10 | 8.3% |
| Some other Race | 0 | 0.0% |
| Total | 121 | 100.0% |
Ancestry in Joes
The most populous ancestries reported in Joes are Puerto Rican (37 | 30.6%), German (19 | 15.7%), Korean (16 | 13.2%), Guamanian / Chamorro (13 | 10.7%), and Native Hawaiian (10 | 8.3%), together accounting for 78.5% of all Joes residents.
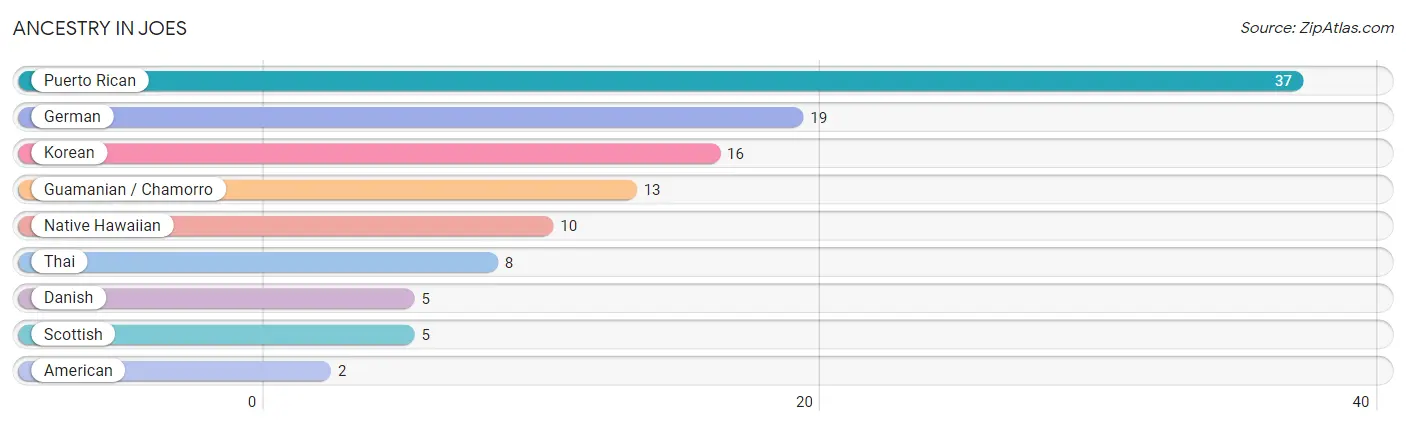
| Ancestry | # Population | % Population |
| American | 2 | 1.7% |
| Danish | 5 | 4.1% |
| German | 19 | 15.7% |
| Guamanian / Chamorro | 13 | 10.7% |
| Korean | 16 | 13.2% |
| Native Hawaiian | 10 | 8.3% |
| Puerto Rican | 37 | 30.6% |
| Scottish | 5 | 4.1% |
| Thai | 8 | 6.6% | View All 9 Rows |
Immigrants in Joes

| Immigration Origin | # Population | % Population | View All 0 Rows |
Sex and Age in Joes
Sex and Age in Joes
The most populous age groups in Joes are 85 Years and over (16 | 26.7%) for men and 5 to 9 Years (13 | 21.3%) for women.
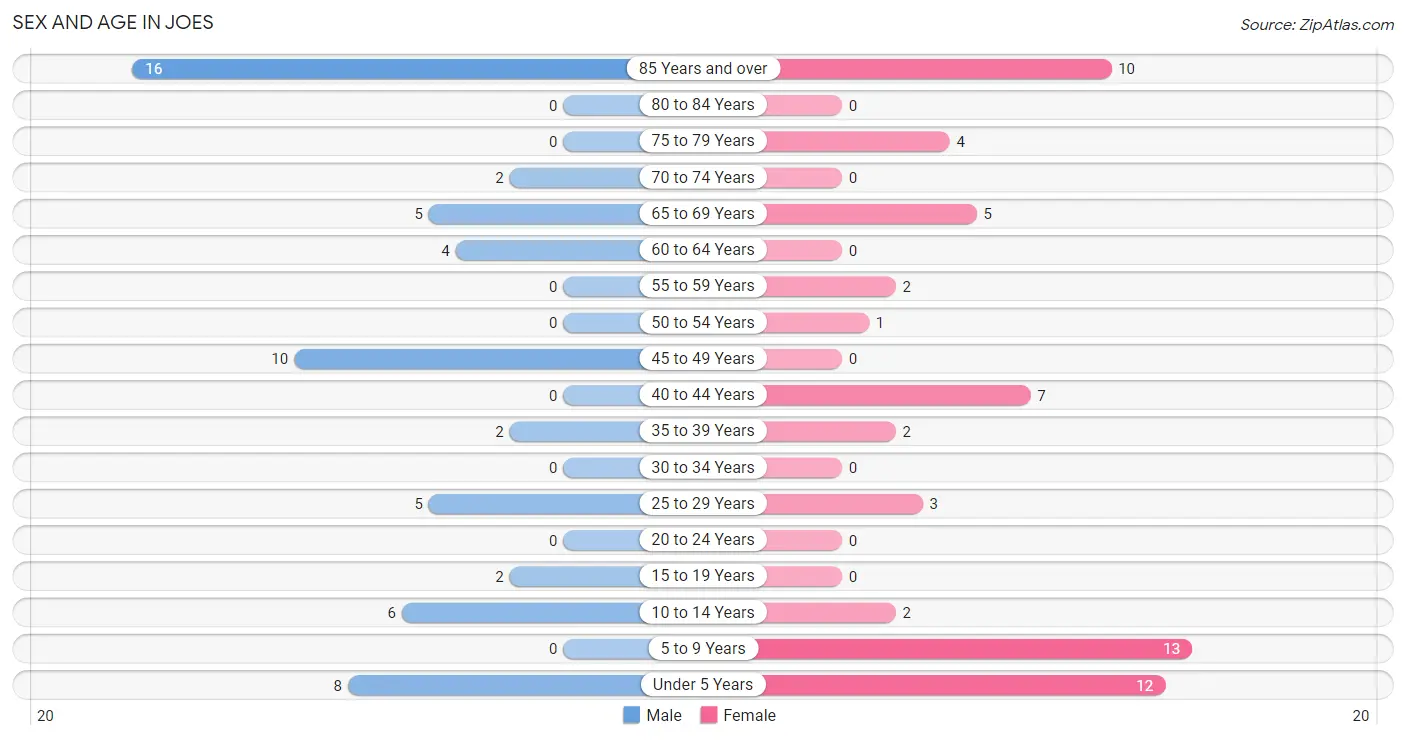
| Age Bracket | Male | Female |
| Under 5 Years | 8 (13.3%) | 12 (19.7%) |
| 5 to 9 Years | 0 (0.0%) | 13 (21.3%) |
| 10 to 14 Years | 6 (10.0%) | 2 (3.3%) |
| 15 to 19 Years | 2 (3.3%) | 0 (0.0%) |
| 20 to 24 Years | 0 (0.0%) | 0 (0.0%) |
| 25 to 29 Years | 5 (8.3%) | 3 (4.9%) |
| 30 to 34 Years | 0 (0.0%) | 0 (0.0%) |
| 35 to 39 Years | 2 (3.3%) | 2 (3.3%) |
| 40 to 44 Years | 0 (0.0%) | 7 (11.5%) |
| 45 to 49 Years | 10 (16.7%) | 0 (0.0%) |
| 50 to 54 Years | 0 (0.0%) | 1 (1.6%) |
| 55 to 59 Years | 0 (0.0%) | 2 (3.3%) |
| 60 to 64 Years | 4 (6.7%) | 0 (0.0%) |
| 65 to 69 Years | 5 (8.3%) | 5 (8.2%) |
| 70 to 74 Years | 2 (3.3%) | 0 (0.0%) |
| 75 to 79 Years | 0 (0.0%) | 4 (6.6%) |
| 80 to 84 Years | 0 (0.0%) | 0 (0.0%) |
| 85 Years and over | 16 (26.7%) | 10 (16.4%) |
| Total | 60 (100.0%) | 61 (100.0%) |
Families and Households in Joes
Median Family Size in Joes
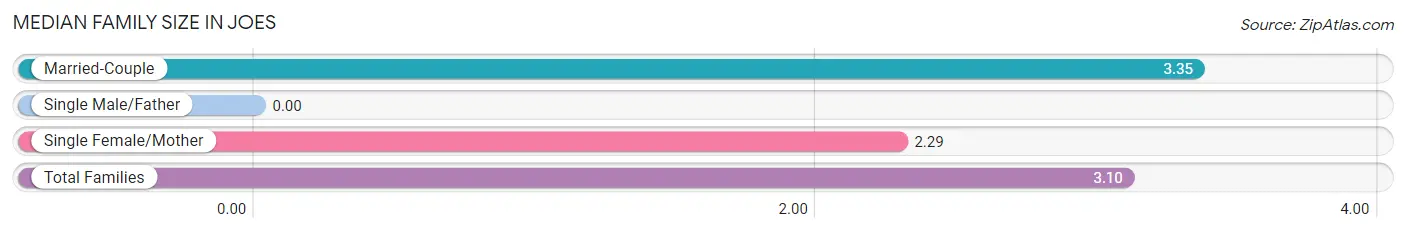
| Family Type | # Families | Family Size |
| Married-Couple | 23 (76.7%) | 3.35 |
| Single Male/Father | 0 (0.0%) | - |
| Single Female/Mother | 7 (23.3%) | 2.29 |
| Total Families | 30 (100.0%) | 3.10 |
Median Household Size in Joes
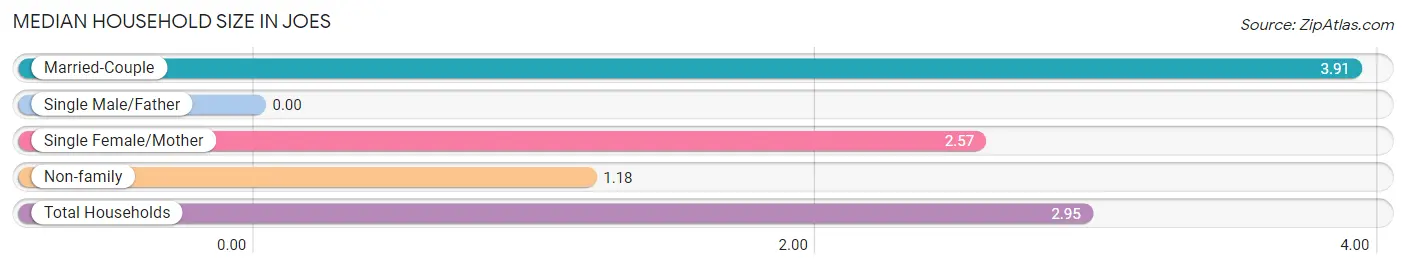
| Household Type | # Households | Household Size |
| Married-Couple | 23 (56.1%) | 3.91 |
| Single Male/Father | 0 (0.0%) | - |
| Single Female/Mother | 7 (17.1%) | 2.57 |
| Non-family | 11 (26.8%) | 1.18 |
| Total Households | 41 (100.0%) | 2.95 |
Household Size by Marriage Status in Joes
Out of a total of 41 households in Joes, 30 (73.2%) are family households, while 11 (26.8%) are nonfamily households. The most numerous type of family households are 2-person households, comprising 12, and the most common type of nonfamily households are 1-person households, comprising 9.
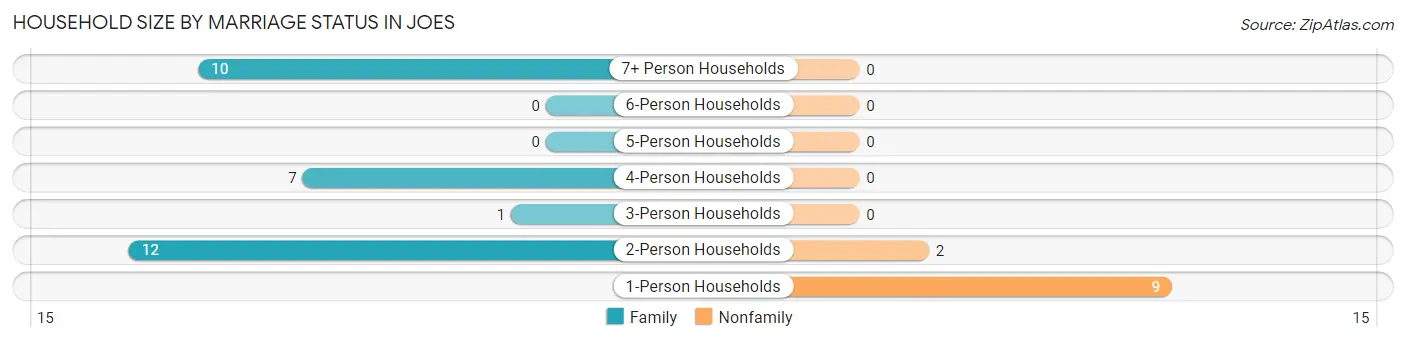
| Household Size | Family Households | Nonfamily Households |
| 1-Person Households | - | 9 (22.0%) |
| 2-Person Households | 12 (29.3%) | 2 (4.9%) |
| 3-Person Households | 1 (2.4%) | 0 (0.0%) |
| 4-Person Households | 7 (17.1%) | 0 (0.0%) |
| 5-Person Households | 0 (0.0%) | 0 (0.0%) |
| 6-Person Households | 0 (0.0%) | 0 (0.0%) |
| 7+ Person Households | 10 (24.4%) | 0 (0.0%) |
| Total | 30 (73.2%) | 11 (26.8%) |
Female Fertility in Joes
Fertility by Age in Joes
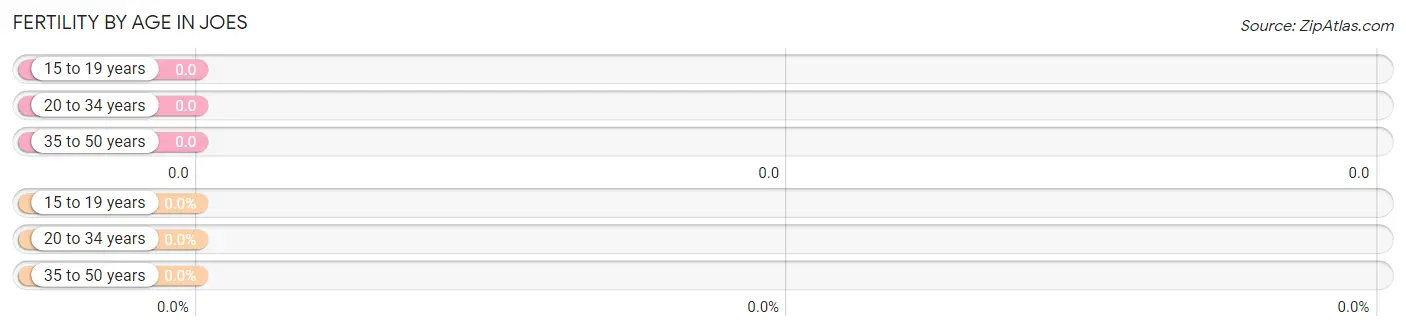
| Age Bracket | Women with Births | Births / 1,000 Women |
| 15 to 19 years | 0 (0.0%) | 0.0 |
| 20 to 34 years | 0 (0.0%) | 0.0 |
| 35 to 50 years | 0 (0.0%) | 0.0 |
| Total | 0 (0.0%) | 0.0 |
Fertility by Age by Marriage Status in Joes
| Age Bracket | Married | Unmarried |
| 15 to 19 years | 0 (0.0%) | 0 (0.0%) |
| 20 to 34 years | 0 (0.0%) | 0 (0.0%) |
| 35 to 50 years | 0 (0.0%) | 0 (0.0%) |
| Total | 0 (0.0%) | 0 (0.0%) |
Fertility by Education in Joes
| Educational Attainment | Women with Births | Births / 1,000 Women |
| Less than High School | 0 (0.0%) | 0.0 |
| High School Diploma | 0 (0.0%) | 0.0 |
| College or Associate's Degree | 0 (0.0%) | 0.0 |
| Bachelor's Degree | 0 (0.0%) | 0.0 |
| Graduate Degree | 0 (0.0%) | 0.0 |
| Total | 0 (0.0%) | 0.0 |
Fertility by Education by Marriage Status in Joes
| Educational Attainment | Married | Unmarried |
| Less than High School | 0 (0.0%) | 0 (0.0%) |
| High School Diploma | 0 (0.0%) | 0 (0.0%) |
| College or Associate's Degree | 0 (0.0%) | 0 (0.0%) |
| Bachelor's Degree | 0 (0.0%) | 0 (0.0%) |
| Graduate Degree | 0 (0.0%) | 0 (0.0%) |
| Total | 0 (0.0%) | 0 (0.0%) |
Employment Characteristics in Joes
Employment by Class of Employer in Joes
Among the 37 employed individuals in Joes, private company employees (21 | 56.8%), local government employees (7 | 18.9%), and self-employed (not incorporated) (6 | 16.2%) make up the most common classes of employment.
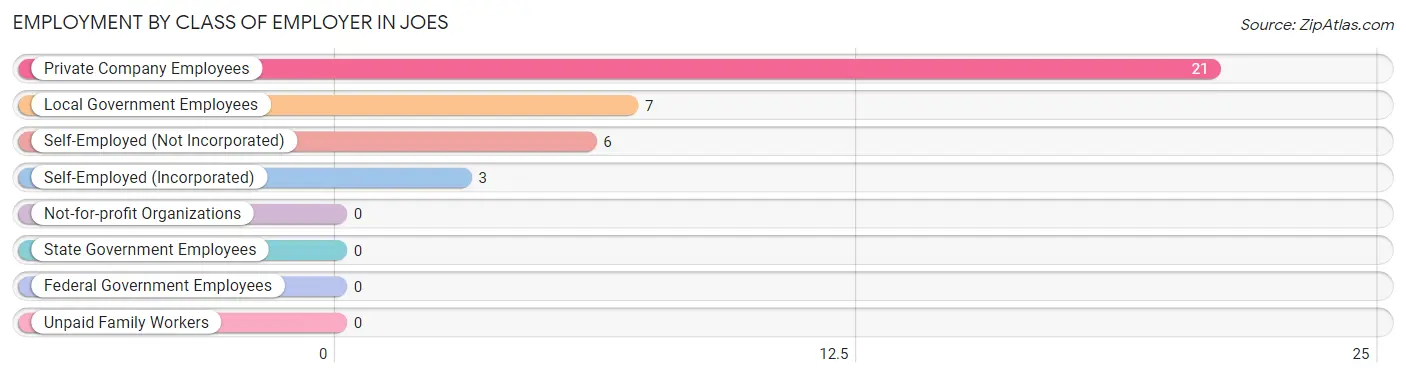
| Employer Class | # Employees | % Employees |
| Private Company Employees | 21 | 56.8% |
| Self-Employed (Incorporated) | 3 | 8.1% |
| Self-Employed (Not Incorporated) | 6 | 16.2% |
| Not-for-profit Organizations | 0 | 0.0% |
| Local Government Employees | 7 | 18.9% |
| State Government Employees | 0 | 0.0% |
| Federal Government Employees | 0 | 0.0% |
| Unpaid Family Workers | 0 | 0.0% |
| Total | 37 | 100.0% |
Employment Status by Age in Joes
According to the labor force statistics for Joes, out of the total population over 16 years of age (80), 55.0% or 44 individuals are in the labor force, with 4.5% or 2 of them unemployed. The age group with the highest labor force participation rate is 16 to 19 years, with 100.0% or 2 individuals in the labor force. Within the labor force, the 45 to 54 years age range has the highest percentage of unemployed individuals, with 18.2% or 2 of them being unemployed.
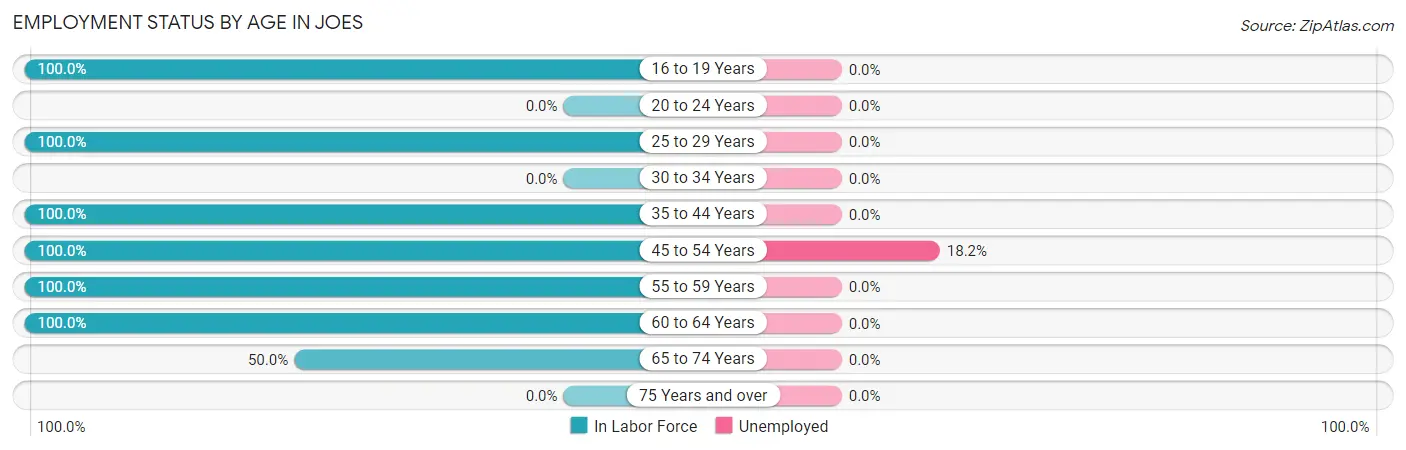
| Age Bracket | In Labor Force | Unemployed |
| 16 to 19 Years | 2 (100.0%) | 0 (0.0%) |
| 20 to 24 Years | 0 (0.0%) | 0 (0.0%) |
| 25 to 29 Years | 8 (100.0%) | 0 (0.0%) |
| 30 to 34 Years | 0 (0.0%) | 0 (0.0%) |
| 35 to 44 Years | 11 (100.0%) | 0 (0.0%) |
| 45 to 54 Years | 11 (100.0%) | 2 (18.2%) |
| 55 to 59 Years | 2 (100.0%) | 0 (0.0%) |
| 60 to 64 Years | 4 (100.0%) | 0 (0.0%) |
| 65 to 74 Years | 6 (50.0%) | 0 (0.0%) |
| 75 Years and over | 0 (0.0%) | 0 (0.0%) |
| Total | 44 (55.0%) | 2 (4.5%) |
Employment Status by Educational Attainment in Joes
According to labor force statistics for Joes, 100.0% of individuals (36) out of the total population between 25 and 64 years of age (36) are in the labor force, with 5.6% or 2 of them being unemployed. The group with the highest labor force participation rate are those with the educational attainment of high school diploma, with 100.0% or 11 individuals in the labor force. Within the labor force, individuals with high school diploma education have the highest percentage of unemployment, with 18.2% or 2 of them being unemployed.
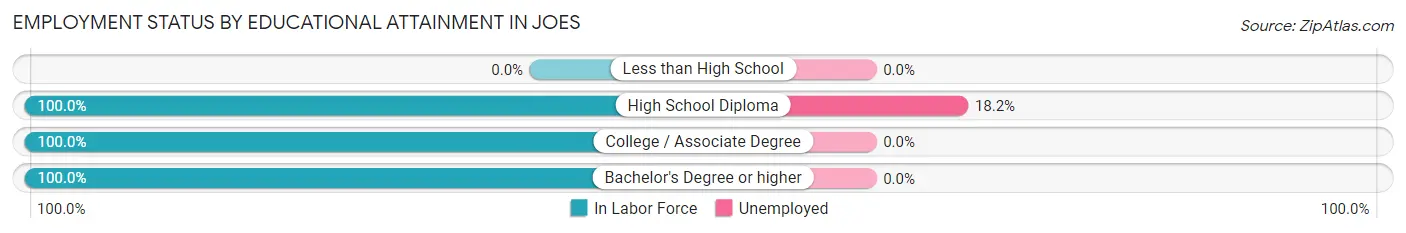
| Educational Attainment | In Labor Force | Unemployed |
| Less than High School | 0 (0.0%) | 0 (0.0%) |
| High School Diploma | 11 (100.0%) | 2 (18.2%) |
| College / Associate Degree | 17 (100.0%) | 0 (0.0%) |
| Bachelor's Degree or higher | 8 (100.0%) | 0 (0.0%) |
| Total | 36 (100.0%) | 2 (5.6%) |
Employment Occupations by Sex in Joes
Management, Business, Science and Arts Occupations
The most common Management, Business, Science and Arts occupations in Joes are Community & Social Service (5 | 11.9%), Education Instruction & Library (5 | 11.9%), Management (3 | 7.1%), Business & Financial (1 | 2.4%), and Computers, Engineering & Science (1 | 2.4%).
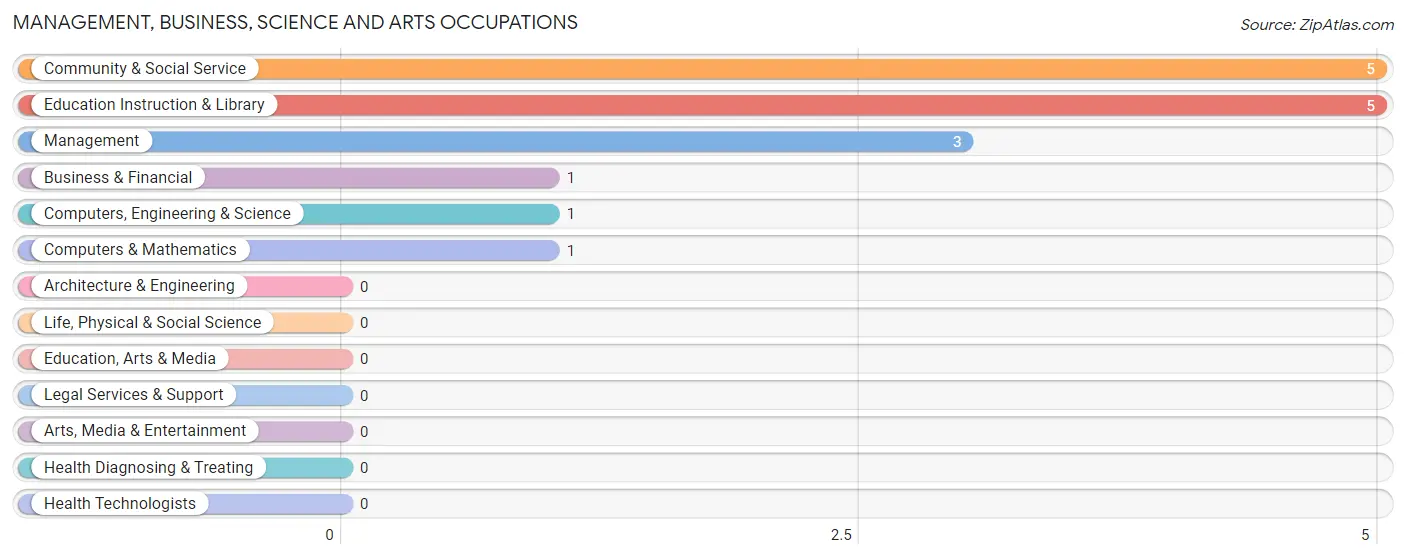
Management, Business, Science and Arts Occupations by Sex
Within the Management, Business, Science and Arts occupations in Joes, the most male-oriented occupations are Computers, Engineering & Science (100.0%), and Computers & Mathematics (100.0%), while the most female-oriented occupations are Management (100.0%), Business & Financial (100.0%), and Community & Social Service (100.0%).
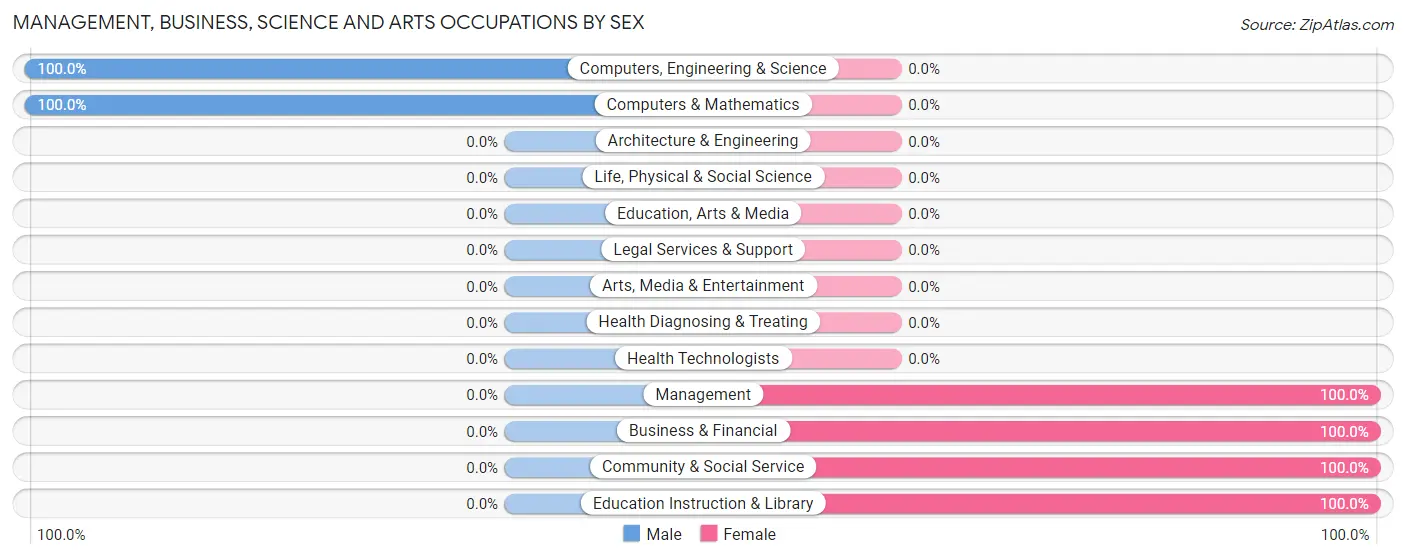
| Occupation | Male | Female |
| Management | 0 (0.0%) | 3 (100.0%) |
| Business & Financial | 0 (0.0%) | 1 (100.0%) |
| Computers, Engineering & Science | 1 (100.0%) | 0 (0.0%) |
| Computers & Mathematics | 1 (100.0%) | 0 (0.0%) |
| Architecture & Engineering | 0 (0.0%) | 0 (0.0%) |
| Life, Physical & Social Science | 0 (0.0%) | 0 (0.0%) |
| Community & Social Service | 0 (0.0%) | 5 (100.0%) |
| Education, Arts & Media | 0 (0.0%) | 0 (0.0%) |
| Legal Services & Support | 0 (0.0%) | 0 (0.0%) |
| Education Instruction & Library | 0 (0.0%) | 5 (100.0%) |
| Arts, Media & Entertainment | 0 (0.0%) | 0 (0.0%) |
| Health Diagnosing & Treating | 0 (0.0%) | 0 (0.0%) |
| Health Technologists | 0 (0.0%) | 0 (0.0%) |
| Total (Category) | 1 (10.0%) | 9 (90.0%) |
| Total (Overall) | 24 (57.1%) | 18 (42.9%) |
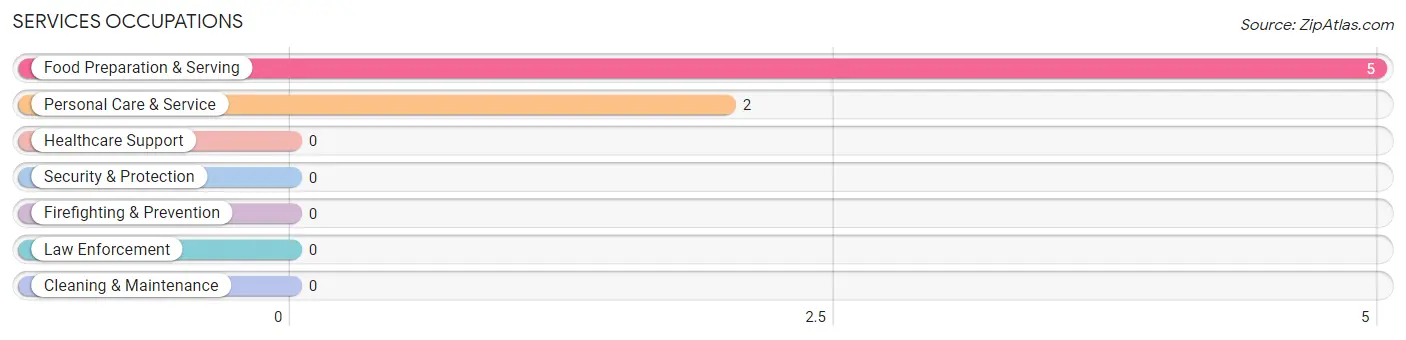
Services Occupations
The most common Services occupations in Joes are Food Preparation & Serving (5 | 11.9%), and Personal Care & Service (2 | 4.8%).
Services Occupations by Sex
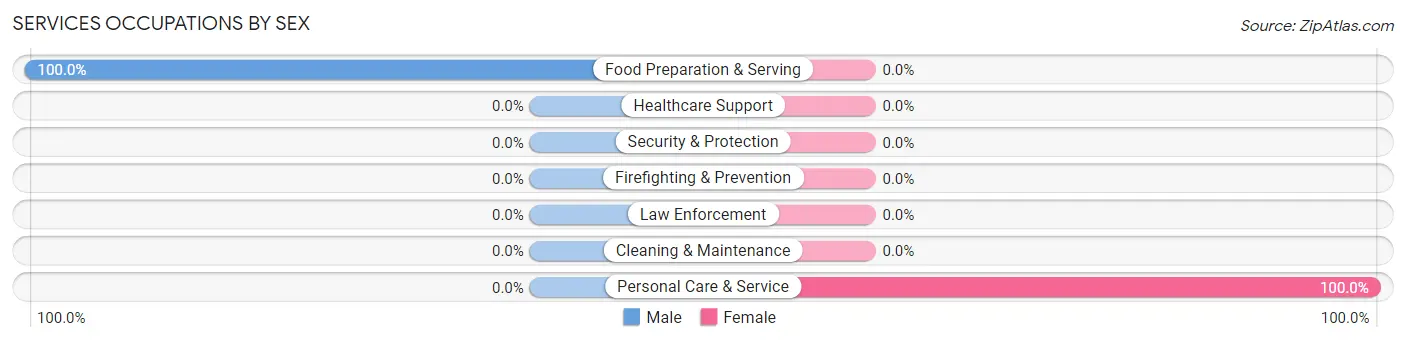
| Occupation | Male | Female |
| Healthcare Support | 0 (0.0%) | 0 (0.0%) |
| Security & Protection | 0 (0.0%) | 0 (0.0%) |
| Firefighting & Prevention | 0 (0.0%) | 0 (0.0%) |
| Law Enforcement | 0 (0.0%) | 0 (0.0%) |
| Food Preparation & Serving | 5 (100.0%) | 0 (0.0%) |
| Cleaning & Maintenance | 0 (0.0%) | 0 (0.0%) |
| Personal Care & Service | 0 (0.0%) | 2 (100.0%) |
| Total (Category) | 5 (71.4%) | 2 (28.6%) |
| Total (Overall) | 24 (57.1%) | 18 (42.9%) |
Sales and Office Occupations
The most common Sales and Office occupations in Joes are Office & Administration (5 | 11.9%), and Sales & Related (2 | 4.8%).
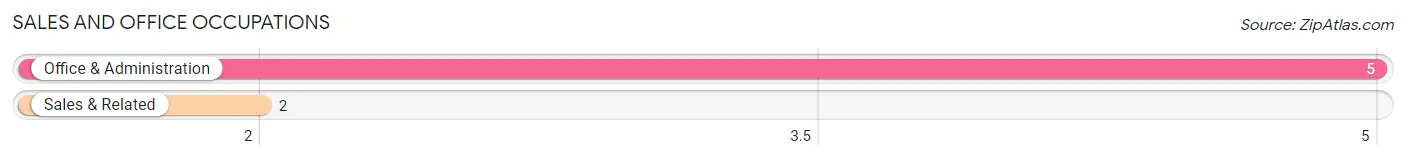
Sales and Office Occupations by Sex
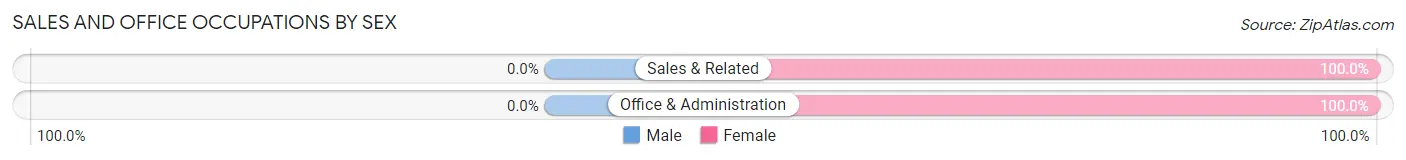
| Occupation | Male | Female |
| Sales & Related | 0 (0.0%) | 2 (100.0%) |
| Office & Administration | 0 (0.0%) | 5 (100.0%) |
| Total (Category) | 0 (0.0%) | 7 (100.0%) |
| Total (Overall) | 24 (57.1%) | 18 (42.9%) |
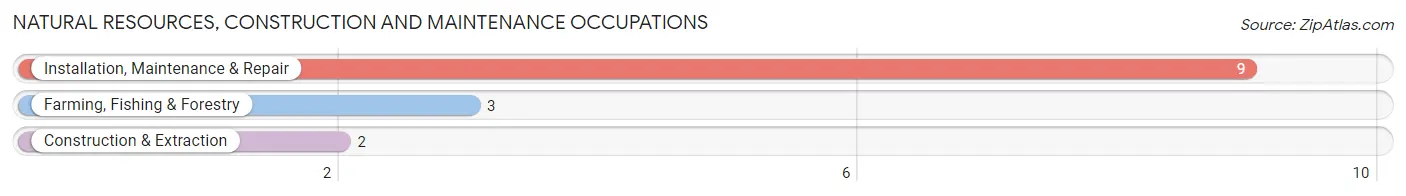
Natural Resources, Construction and Maintenance Occupations
The most common Natural Resources, Construction and Maintenance occupations in Joes are Installation, Maintenance & Repair (9 | 21.4%), Farming, Fishing & Forestry (3 | 7.1%), and Construction & Extraction (2 | 4.8%).
Natural Resources, Construction and Maintenance Occupations by Sex
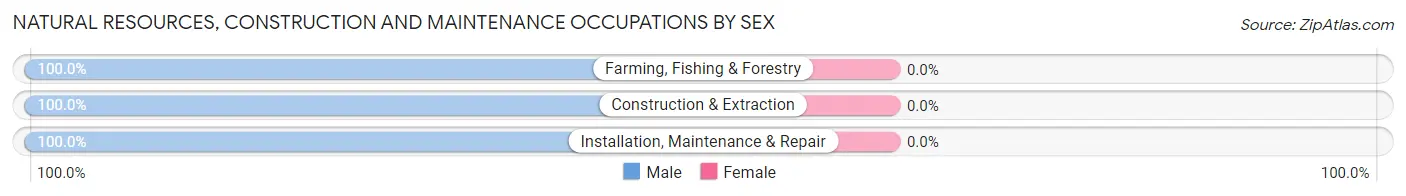
| Occupation | Male | Female |
| Farming, Fishing & Forestry | 3 (100.0%) | 0 (0.0%) |
| Construction & Extraction | 2 (100.0%) | 0 (0.0%) |
| Installation, Maintenance & Repair | 9 (100.0%) | 0 (0.0%) |
| Total (Category) | 14 (100.0%) | 0 (0.0%) |
| Total (Overall) | 24 (57.1%) | 18 (42.9%) |
Production, Transportation and Moving Occupations
The most common Production, Transportation and Moving occupations in Joes are , and Transportation (4 | 9.5%).
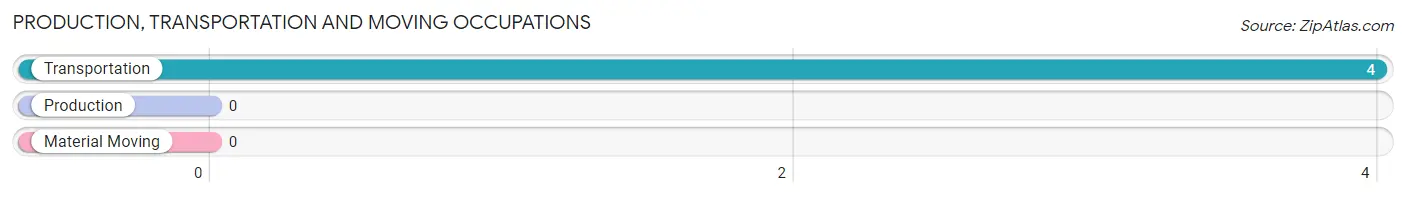
Production, Transportation and Moving Occupations by Sex
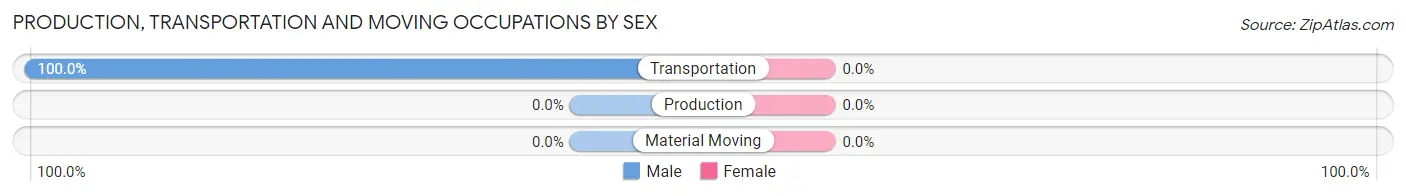
| Occupation | Male | Female |
| Production | 0 (0.0%) | 0 (0.0%) |
| Transportation | 4 (100.0%) | 0 (0.0%) |
| Material Moving | 0 (0.0%) | 0 (0.0%) |
| Total (Category) | 4 (100.0%) | 0 (0.0%) |
| Total (Overall) | 24 (57.1%) | 18 (42.9%) |
Employment Industries by Sex in Joes
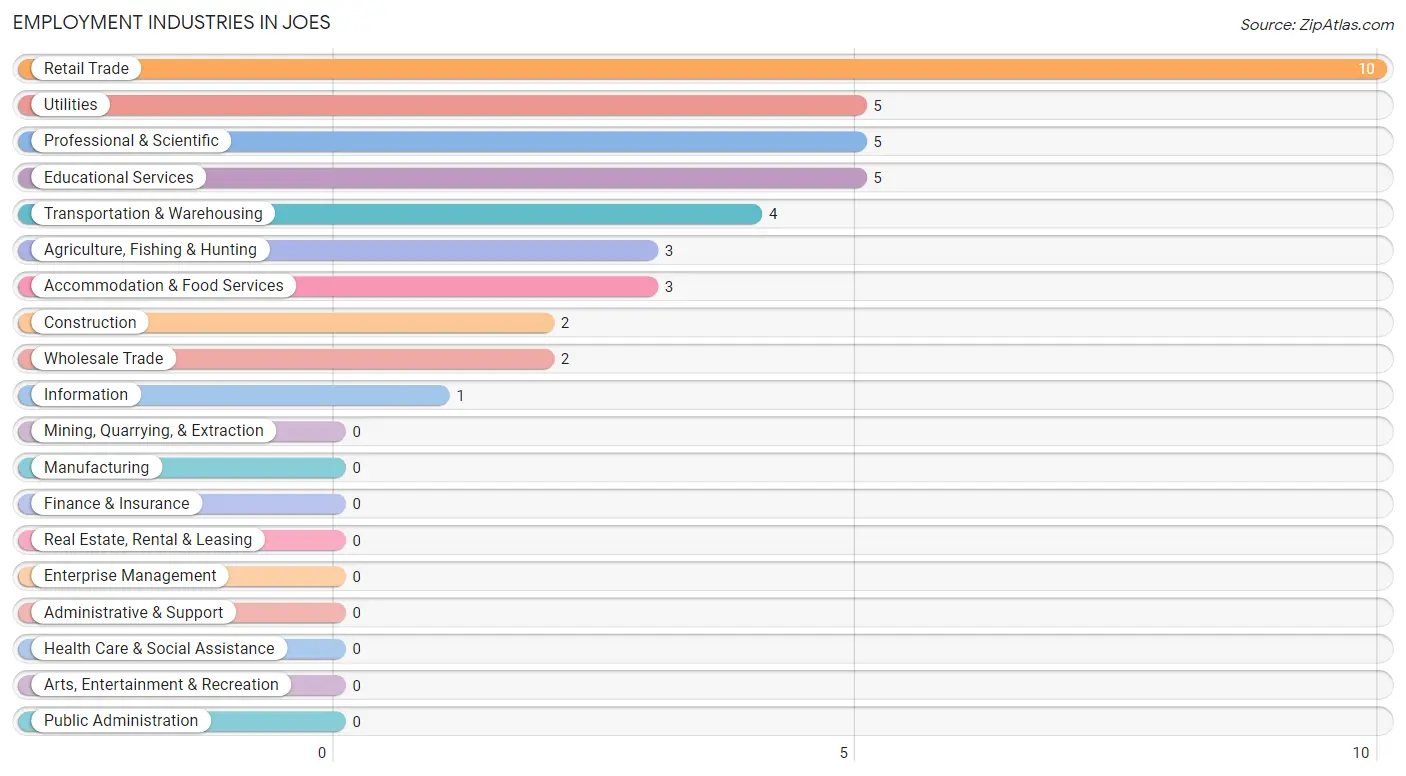
Employment Industries in Joes
The major employment industries in Joes include Retail Trade (10 | 23.8%), Utilities (5 | 11.9%), Professional & Scientific (5 | 11.9%), Educational Services (5 | 11.9%), and Transportation & Warehousing (4 | 9.5%).
Employment Industries by Sex in Joes
The Joes industries that see more men than women are Agriculture, Fishing & Hunting (100.0%), Construction (100.0%), and Wholesale Trade (100.0%), whereas the industries that tend to have a higher number of women are Professional & Scientific (100.0%), Educational Services (100.0%), and Accommodation & Food Services (100.0%).
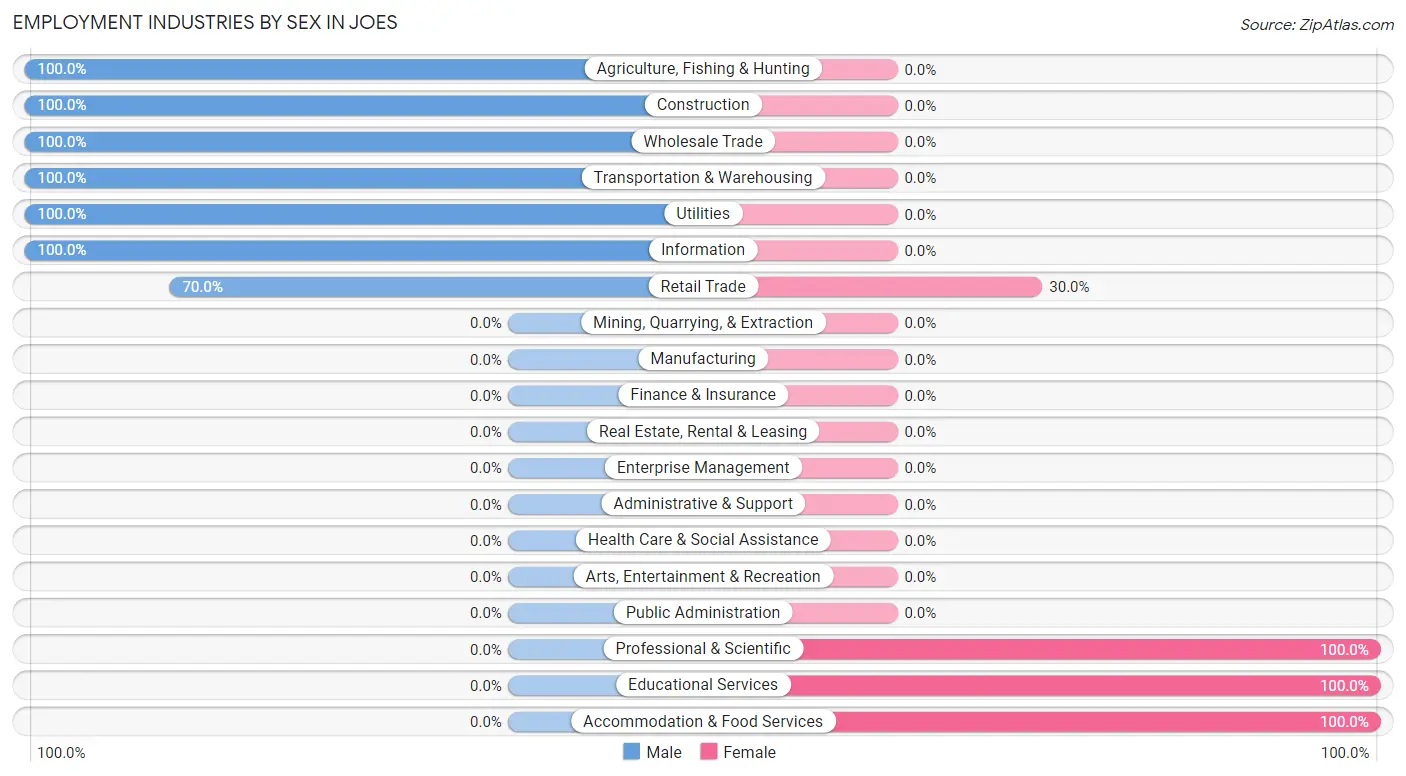
| Industry | Male | Female |
| Agriculture, Fishing & Hunting | 3 (100.0%) | 0 (0.0%) |
| Mining, Quarrying, & Extraction | 0 (0.0%) | 0 (0.0%) |
| Construction | 2 (100.0%) | 0 (0.0%) |
| Manufacturing | 0 (0.0%) | 0 (0.0%) |
| Wholesale Trade | 2 (100.0%) | 0 (0.0%) |
| Retail Trade | 7 (70.0%) | 3 (30.0%) |
| Transportation & Warehousing | 4 (100.0%) | 0 (0.0%) |
| Utilities | 5 (100.0%) | 0 (0.0%) |
| Information | 1 (100.0%) | 0 (0.0%) |
| Finance & Insurance | 0 (0.0%) | 0 (0.0%) |
| Real Estate, Rental & Leasing | 0 (0.0%) | 0 (0.0%) |
| Professional & Scientific | 0 (0.0%) | 5 (100.0%) |
| Enterprise Management | 0 (0.0%) | 0 (0.0%) |
| Administrative & Support | 0 (0.0%) | 0 (0.0%) |
| Educational Services | 0 (0.0%) | 5 (100.0%) |
| Health Care & Social Assistance | 0 (0.0%) | 0 (0.0%) |
| Arts, Entertainment & Recreation | 0 (0.0%) | 0 (0.0%) |
| Accommodation & Food Services | 0 (0.0%) | 3 (100.0%) |
| Public Administration | 0 (0.0%) | 0 (0.0%) |
| Total | 24 (57.1%) | 18 (42.9%) |
Education in Joes
School Enrollment in Joes
The most common levels of schooling among the 27 students in Joes are elementary school (13 | 48.1%), middle school (8 | 29.6%), and nursery / preschool (4 | 14.8%).
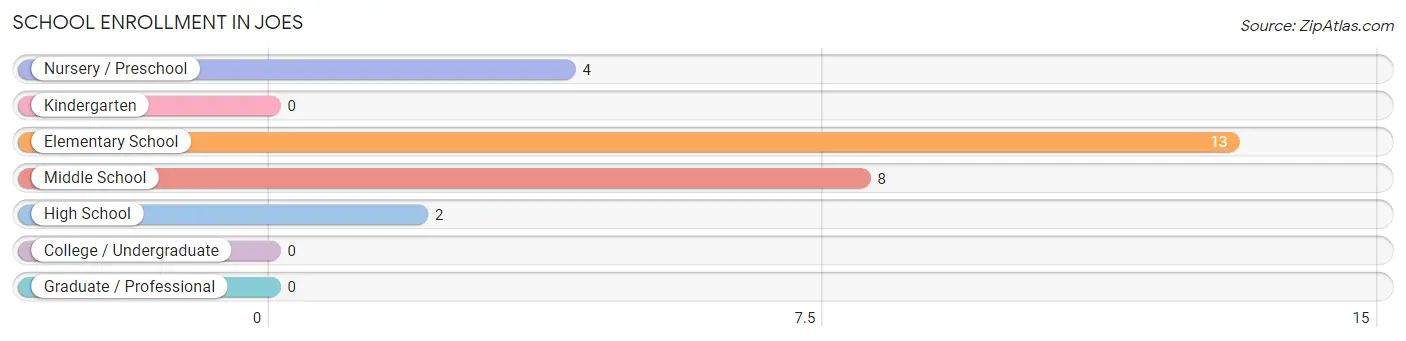
| School Level | # Students | % Students |
| Nursery / Preschool | 4 | 14.8% |
| Kindergarten | 0 | 0.0% |
| Elementary School | 13 | 48.1% |
| Middle School | 8 | 29.6% |
| High School | 2 | 7.4% |
| College / Undergraduate | 0 | 0.0% |
| Graduate / Professional | 0 | 0.0% |
| Total | 27 | 100.0% |
School Enrollment by Age by Funding Source in Joes
Out of a total of 27 students who are enrolled in schools in Joes, 4 (14.8%) attend a private institution, while the remaining 23 (85.2%) are enrolled in public schools. The age group of 3 to 4 year olds has the highest likelihood of being enrolled in private schools, with 4 (100.0% in the age bracket) enrolled. Conversely, the age group of 5 to 9 year old has the lowest likelihood of being enrolled in a private school, with 13 (100.0% in the age bracket) attending a public institution.
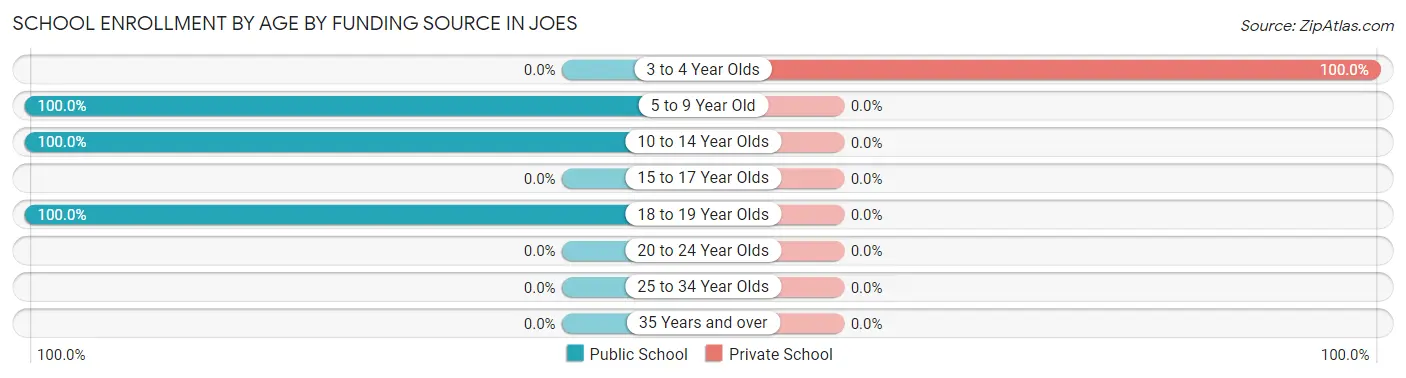
| Age Bracket | Public School | Private School |
| 3 to 4 Year Olds | 0 (0.0%) | 4 (100.0%) |
| 5 to 9 Year Old | 13 (100.0%) | 0 (0.0%) |
| 10 to 14 Year Olds | 8 (100.0%) | 0 (0.0%) |
| 15 to 17 Year Olds | 0 (0.0%) | 0 (0.0%) |
| 18 to 19 Year Olds | 2 (100.0%) | 0 (0.0%) |
| 20 to 24 Year Olds | 0 (0.0%) | 0 (0.0%) |
| 25 to 34 Year Olds | 0 (0.0%) | 0 (0.0%) |
| 35 Years and over | 0 (0.0%) | 0 (0.0%) |
| Total | 23 (85.2%) | 4 (14.8%) |
Educational Attainment by Field of Study in Joes
Social sciences (15 | 83.3%), and education (3 | 16.7%) are the most common fields of study among 18 individuals in Joes who have obtained a bachelor's degree or higher.
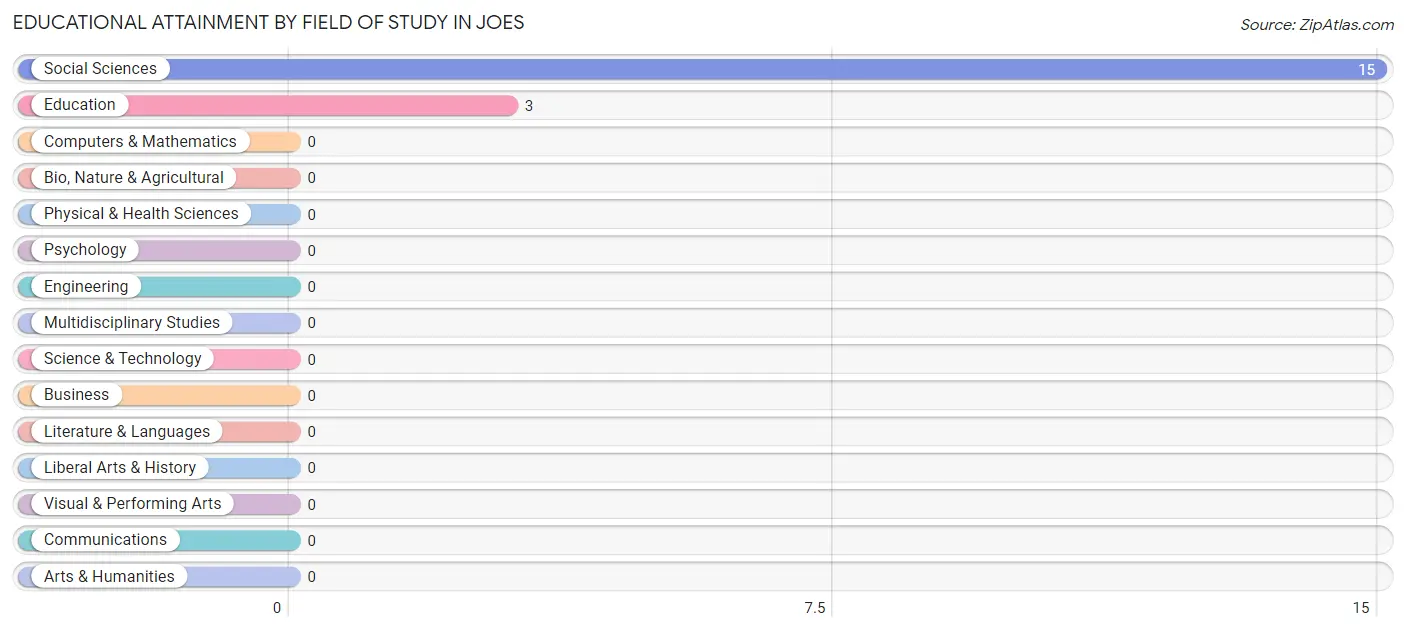
| Field of Study | # Graduates | % Graduates |
| Computers & Mathematics | 0 | 0.0% |
| Bio, Nature & Agricultural | 0 | 0.0% |
| Physical & Health Sciences | 0 | 0.0% |
| Psychology | 0 | 0.0% |
| Social Sciences | 15 | 83.3% |
| Engineering | 0 | 0.0% |
| Multidisciplinary Studies | 0 | 0.0% |
| Science & Technology | 0 | 0.0% |
| Business | 0 | 0.0% |
| Education | 3 | 16.7% |
| Literature & Languages | 0 | 0.0% |
| Liberal Arts & History | 0 | 0.0% |
| Visual & Performing Arts | 0 | 0.0% |
| Communications | 0 | 0.0% |
| Arts & Humanities | 0 | 0.0% |
| Total | 18 | 100.0% |
Transportation & Commute in Joes
Vehicle Availability by Sex in Joes
The most prevalent vehicle ownership categories in Joes are males with 3 vehicles (14, accounting for 73.7%) and females with 3 vehicles (8, making up 77.8%).
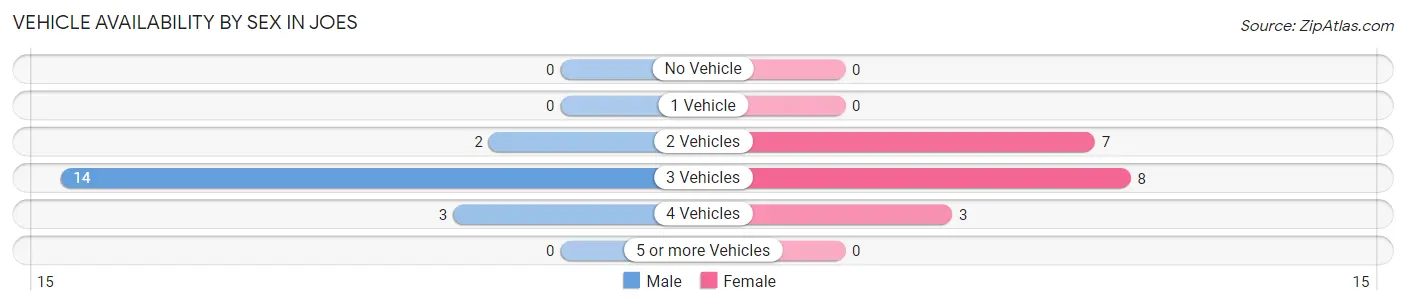
| Vehicles Available | Male | Female |
| No Vehicle | 0 (0.0%) | 0 (0.0%) |
| 1 Vehicle | 0 (0.0%) | 0 (0.0%) |
| 2 Vehicles | 2 (10.5%) | 7 (38.9%) |
| 3 Vehicles | 14 (73.7%) | 8 (44.4%) |
| 4 Vehicles | 3 (15.8%) | 3 (16.7%) |
| 5 or more Vehicles | 0 (0.0%) | 0 (0.0%) |
| Total | 19 (100.0%) | 18 (100.0%) |
Commute Time in Joes
The most frequently occuring commute durations in Joes are 5 to 9 minutes (10 commuters, 27.0%), 30 to 34 minutes (8 commuters, 21.6%), and 10 to 14 minutes (6 commuters, 16.2%).

| Commute Time | # Commuters | % Commuters |
| Less than 5 Minutes | 1 | 2.7% |
| 5 to 9 Minutes | 10 | 27.0% |
| 10 to 14 Minutes | 6 | 16.2% |
| 15 to 19 Minutes | 1 | 2.7% |
| 20 to 24 Minutes | 0 | 0.0% |
| 25 to 29 Minutes | 3 | 8.1% |
| 30 to 34 Minutes | 8 | 21.6% |
| 35 to 39 Minutes | 2 | 5.4% |
| 40 to 44 Minutes | 4 | 10.8% |
| 45 to 59 Minutes | 2 | 5.4% |
| 60 to 89 Minutes | 0 | 0.0% |
| 90 or more Minutes | 0 | 0.0% |
Commute Time by Sex in Joes
The most common commute times in Joes are 5 to 9 minutes (5 commuters, 26.3%) for males and 5 to 9 minutes (5 commuters, 27.8%) for females.
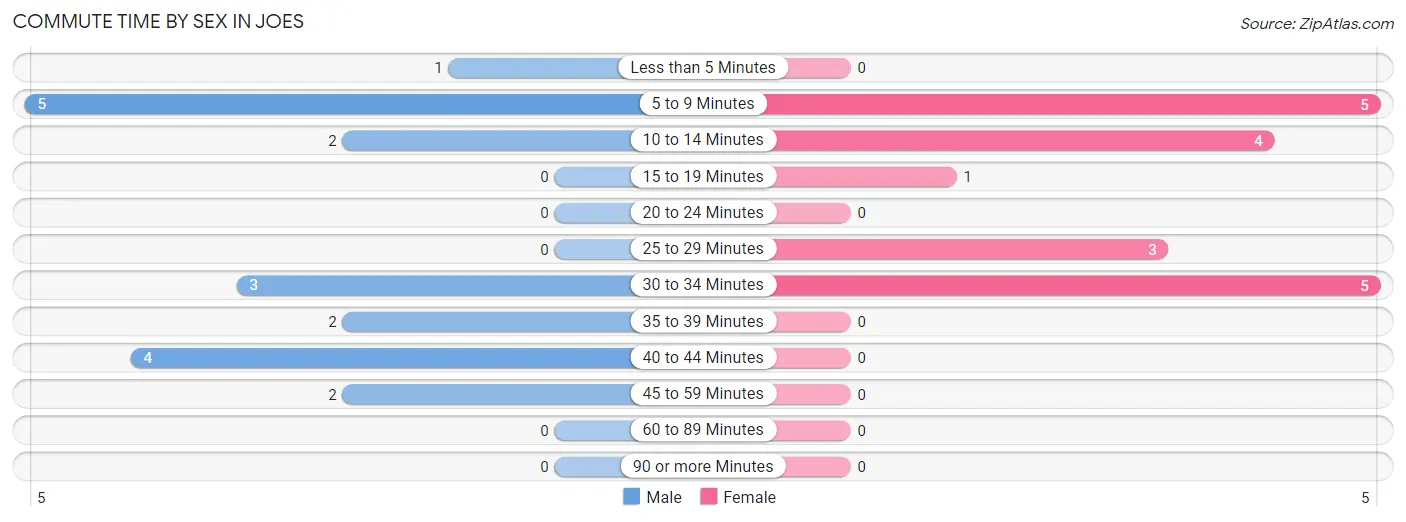
| Commute Time | Male | Female |
| Less than 5 Minutes | 1 (5.3%) | 0 (0.0%) |
| 5 to 9 Minutes | 5 (26.3%) | 5 (27.8%) |
| 10 to 14 Minutes | 2 (10.5%) | 4 (22.2%) |
| 15 to 19 Minutes | 0 (0.0%) | 1 (5.6%) |
| 20 to 24 Minutes | 0 (0.0%) | 0 (0.0%) |
| 25 to 29 Minutes | 0 (0.0%) | 3 (16.7%) |
| 30 to 34 Minutes | 3 (15.8%) | 5 (27.8%) |
| 35 to 39 Minutes | 2 (10.5%) | 0 (0.0%) |
| 40 to 44 Minutes | 4 (21.0%) | 0 (0.0%) |
| 45 to 59 Minutes | 2 (10.5%) | 0 (0.0%) |
| 60 to 89 Minutes | 0 (0.0%) | 0 (0.0%) |
| 90 or more Minutes | 0 (0.0%) | 0 (0.0%) |
Time of Departure to Work by Sex in Joes
The most frequent times of departure to work in Joes are 7:00 AM to 7:29 AM (6, 31.6%) for males and 7:00 AM to 7:29 AM (7, 38.9%) for females.
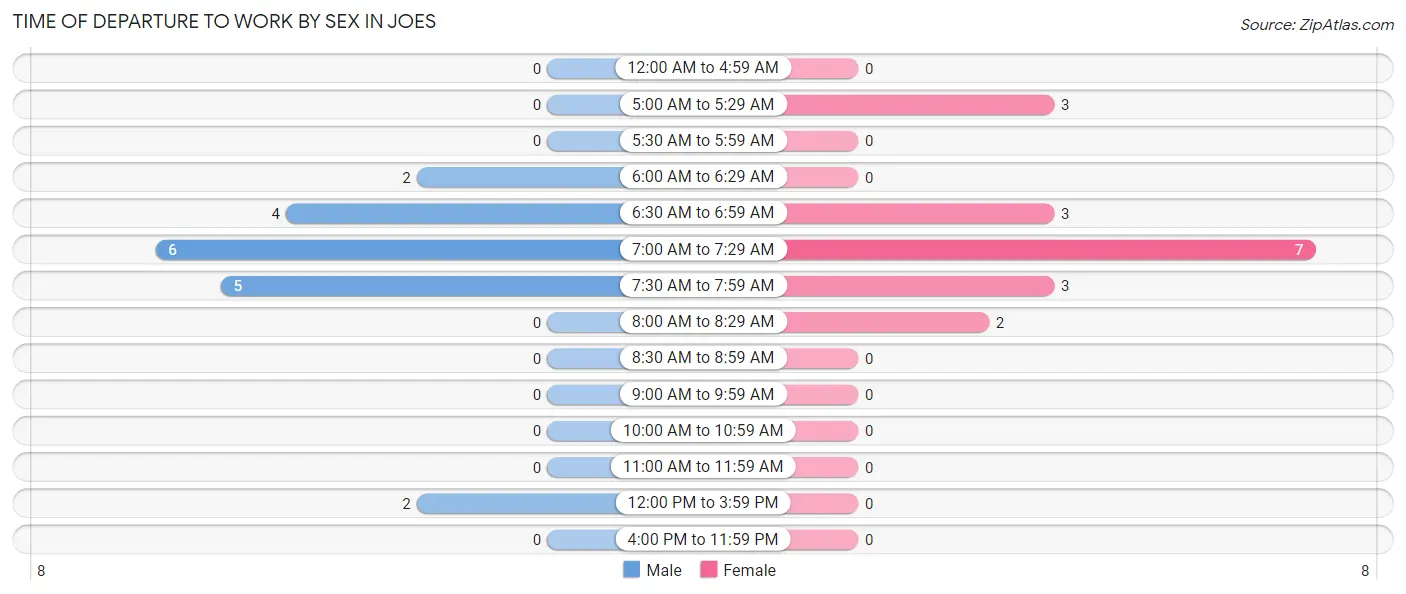
| Time of Departure | Male | Female |
| 12:00 AM to 4:59 AM | 0 (0.0%) | 0 (0.0%) |
| 5:00 AM to 5:29 AM | 0 (0.0%) | 3 (16.7%) |
| 5:30 AM to 5:59 AM | 0 (0.0%) | 0 (0.0%) |
| 6:00 AM to 6:29 AM | 2 (10.5%) | 0 (0.0%) |
| 6:30 AM to 6:59 AM | 4 (21.0%) | 3 (16.7%) |
| 7:00 AM to 7:29 AM | 6 (31.6%) | 7 (38.9%) |
| 7:30 AM to 7:59 AM | 5 (26.3%) | 3 (16.7%) |
| 8:00 AM to 8:29 AM | 0 (0.0%) | 2 (11.1%) |
| 8:30 AM to 8:59 AM | 0 (0.0%) | 0 (0.0%) |
| 9:00 AM to 9:59 AM | 0 (0.0%) | 0 (0.0%) |
| 10:00 AM to 10:59 AM | 0 (0.0%) | 0 (0.0%) |
| 11:00 AM to 11:59 AM | 0 (0.0%) | 0 (0.0%) |
| 12:00 PM to 3:59 PM | 2 (10.5%) | 0 (0.0%) |
| 4:00 PM to 11:59 PM | 0 (0.0%) | 0 (0.0%) |
| Total | 19 (100.0%) | 18 (100.0%) |
Housing Occupancy in Joes
Occupancy by Ownership in Joes
Of the total 41 dwellings in Joes, owner-occupied units account for 33 (80.5%), while renter-occupied units make up 8 (19.5%).
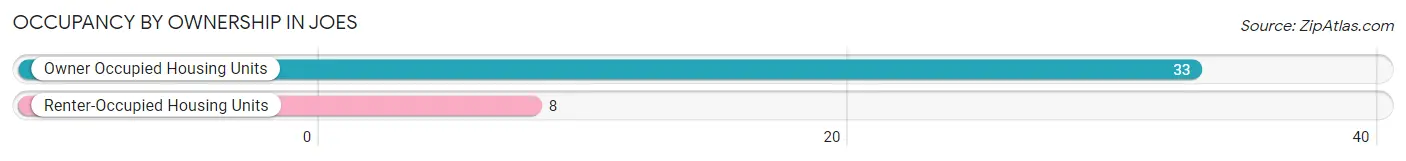
| Occupancy | # Housing Units | % Housing Units |
| Owner Occupied Housing Units | 33 | 80.5% |
| Renter-Occupied Housing Units | 8 | 19.5% |
| Total Occupied Housing Units | 41 | 100.0% |
Occupancy by Household Size in Joes
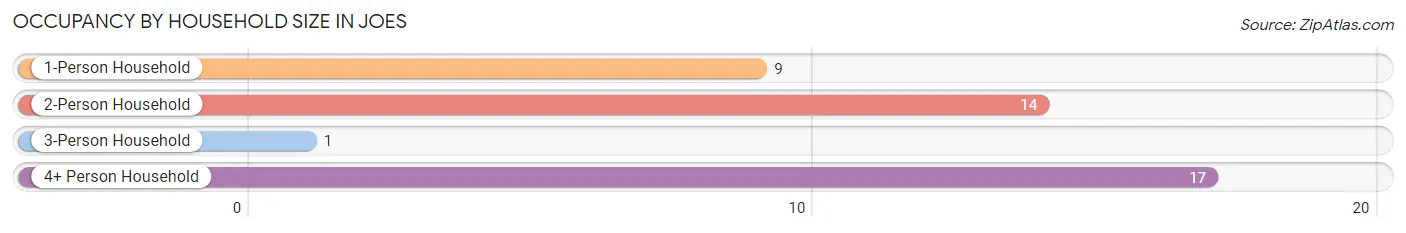
| Household Size | # Housing Units | % Housing Units |
| 1-Person Household | 9 | 22.0% |
| 2-Person Household | 14 | 34.2% |
| 3-Person Household | 1 | 2.4% |
| 4+ Person Household | 17 | 41.5% |
| Total Housing Units | 41 | 100.0% |
Occupancy by Ownership by Household Size in Joes
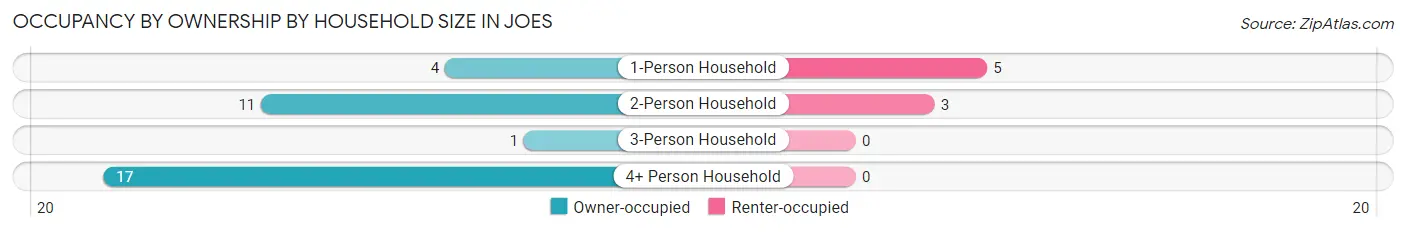
| Household Size | Owner-occupied | Renter-occupied |
| 1-Person Household | 4 (44.4%) | 5 (55.6%) |
| 2-Person Household | 11 (78.6%) | 3 (21.4%) |
| 3-Person Household | 1 (100.0%) | 0 (0.0%) |
| 4+ Person Household | 17 (100.0%) | 0 (0.0%) |
| Total Housing Units | 33 (80.5%) | 8 (19.5%) |
Occupancy by Educational Attainment in Joes
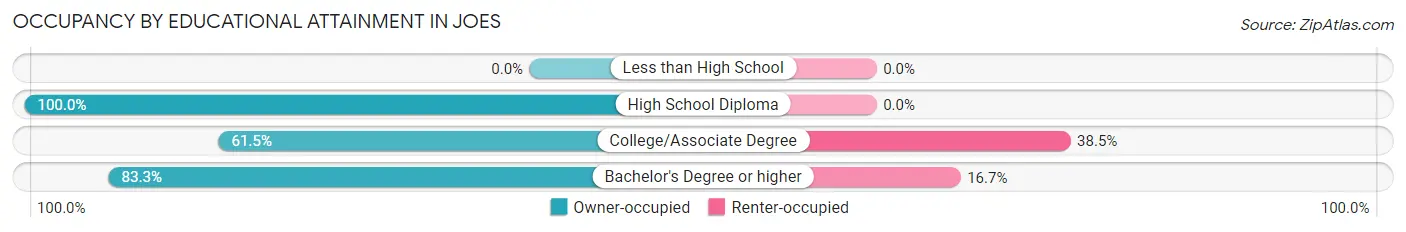
| Household Size | Owner-occupied | Renter-occupied |
| Less than High School | 0 (0.0%) | 0 (0.0%) |
| High School Diploma | 10 (100.0%) | 0 (0.0%) |
| College/Associate Degree | 8 (61.5%) | 5 (38.5%) |
| Bachelor's Degree or higher | 15 (83.3%) | 3 (16.7%) |
Occupancy by Age of Householder in Joes
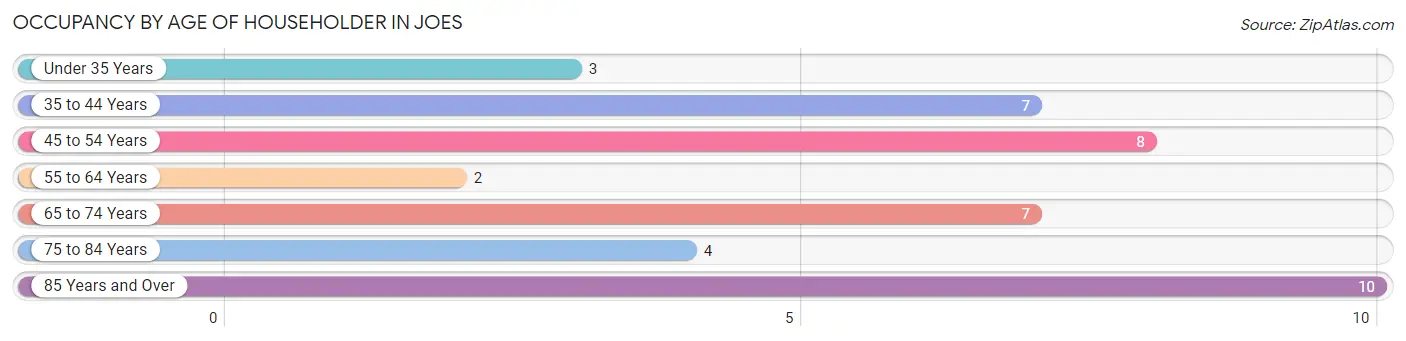
| Age Bracket | # Households | % Households |
| Under 35 Years | 3 | 7.3% |
| 35 to 44 Years | 7 | 17.1% |
| 45 to 54 Years | 8 | 19.5% |
| 55 to 64 Years | 2 | 4.9% |
| 65 to 74 Years | 7 | 17.1% |
| 75 to 84 Years | 4 | 9.8% |
| 85 Years and Over | 10 | 24.4% |
| Total | 41 | 100.0% |
Housing Finances in Joes
Median Income by Occupancy in Joes
| Occupancy Type | # Households | Median Income |
| Owner-Occupied | 33 (80.5%) | $0 |
| Renter-Occupied | 8 (19.5%) | $0 |
| Average | 41 (100.0%) | $0 |
Occupancy by Householder Income Bracket in Joes
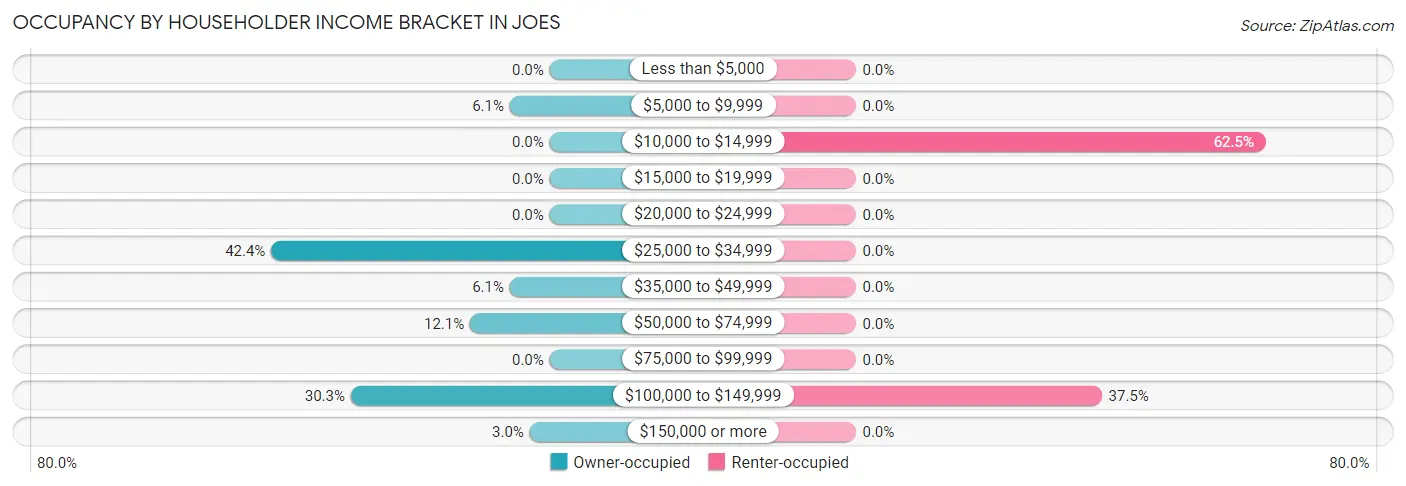
| Income Bracket | Owner-occupied | Renter-occupied |
| Less than $5,000 | 0 (0.0%) | 0 (0.0%) |
| $5,000 to $9,999 | 2 (6.1%) | 0 (0.0%) |
| $10,000 to $14,999 | 0 (0.0%) | 5 (62.5%) |
| $15,000 to $19,999 | 0 (0.0%) | 0 (0.0%) |
| $20,000 to $24,999 | 0 (0.0%) | 0 (0.0%) |
| $25,000 to $34,999 | 14 (42.4%) | 0 (0.0%) |
| $35,000 to $49,999 | 2 (6.1%) | 0 (0.0%) |
| $50,000 to $74,999 | 4 (12.1%) | 0 (0.0%) |
| $75,000 to $99,999 | 0 (0.0%) | 0 (0.0%) |
| $100,000 to $149,999 | 10 (30.3%) | 3 (37.5%) |
| $150,000 or more | 1 (3.0%) | 0 (0.0%) |
| Total | 33 (100.0%) | 8 (100.0%) |
Monthly Housing Cost Tiers in Joes
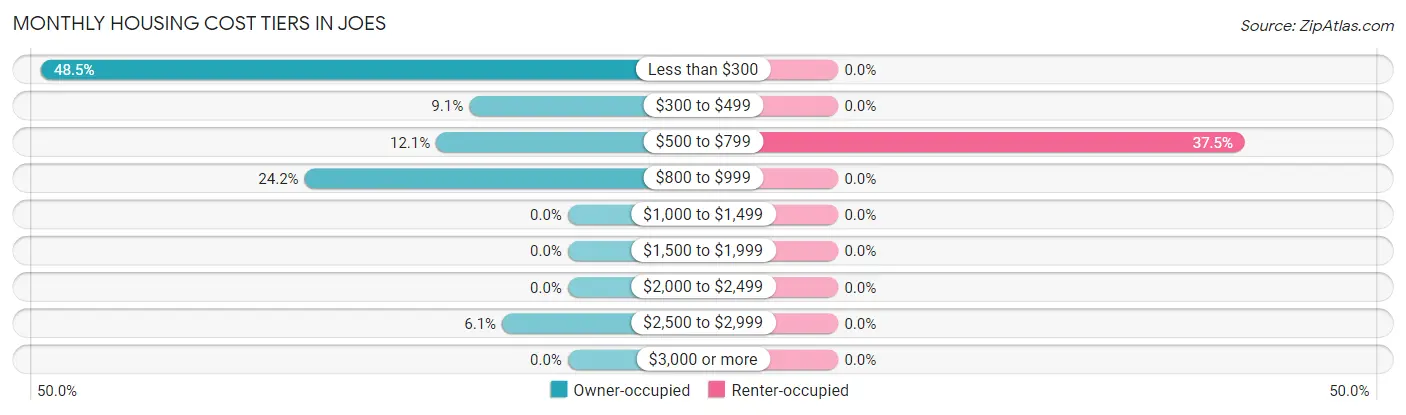
| Monthly Cost | Owner-occupied | Renter-occupied |
| Less than $300 | 16 (48.5%) | 0 (0.0%) |
| $300 to $499 | 3 (9.1%) | 0 (0.0%) |
| $500 to $799 | 4 (12.1%) | 3 (37.5%) |
| $800 to $999 | 8 (24.2%) | 0 (0.0%) |
| $1,000 to $1,499 | 0 (0.0%) | 0 (0.0%) |
| $1,500 to $1,999 | 0 (0.0%) | 0 (0.0%) |
| $2,000 to $2,499 | 0 (0.0%) | 0 (0.0%) |
| $2,500 to $2,999 | 2 (6.1%) | 0 (0.0%) |
| $3,000 or more | 0 (0.0%) | 0 (0.0%) |
| Total | 33 (100.0%) | 8 (100.0%) |
Physical Housing Characteristics in Joes
Housing Structures in Joes
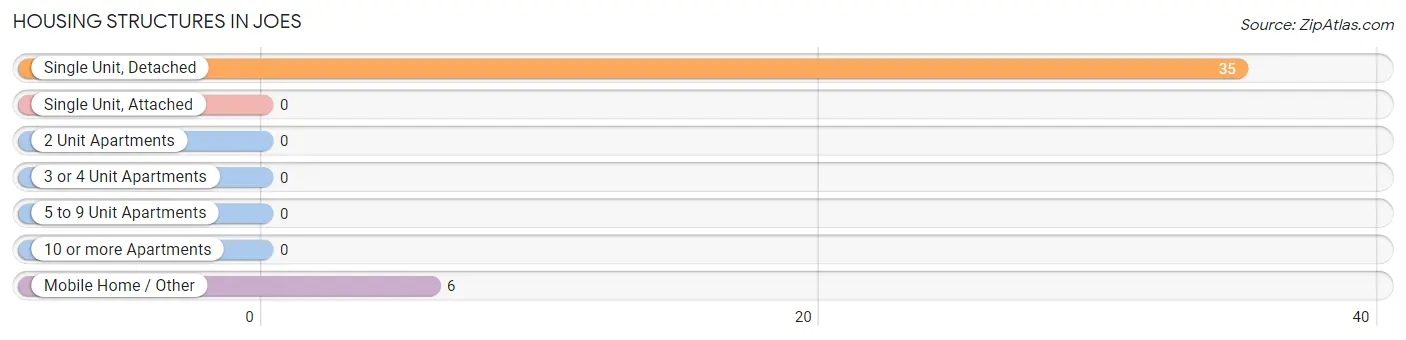
| Structure Type | # Housing Units | % Housing Units |
| Single Unit, Detached | 35 | 85.4% |
| Single Unit, Attached | 0 | 0.0% |
| 2 Unit Apartments | 0 | 0.0% |
| 3 or 4 Unit Apartments | 0 | 0.0% |
| 5 to 9 Unit Apartments | 0 | 0.0% |
| 10 or more Apartments | 0 | 0.0% |
| Mobile Home / Other | 6 | 14.6% |
| Total | 41 | 100.0% |
Housing Structures by Occupancy in Joes
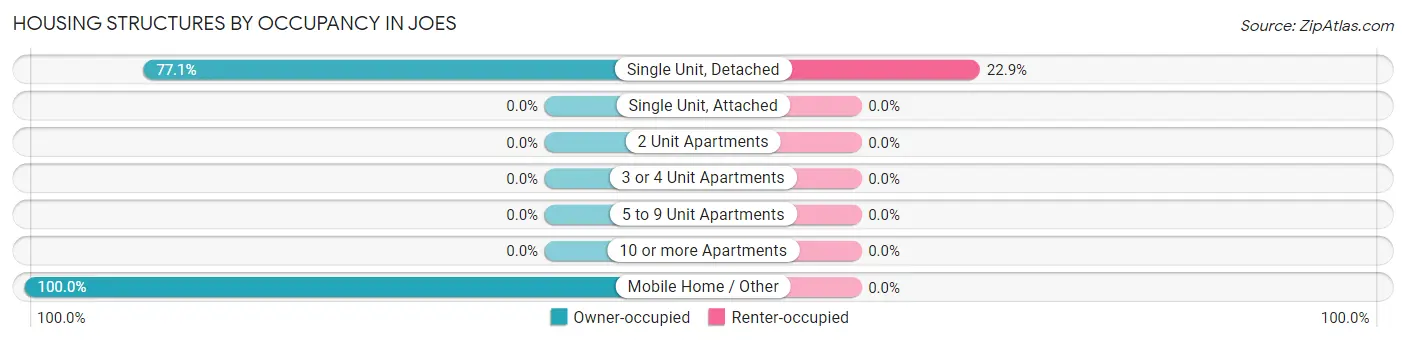
| Structure Type | Owner-occupied | Renter-occupied |
| Single Unit, Detached | 27 (77.1%) | 8 (22.9%) |
| Single Unit, Attached | 0 (0.0%) | 0 (0.0%) |
| 2 Unit Apartments | 0 (0.0%) | 0 (0.0%) |
| 3 or 4 Unit Apartments | 0 (0.0%) | 0 (0.0%) |
| 5 to 9 Unit Apartments | 0 (0.0%) | 0 (0.0%) |
| 10 or more Apartments | 0 (0.0%) | 0 (0.0%) |
| Mobile Home / Other | 6 (100.0%) | 0 (0.0%) |
| Total | 33 (80.5%) | 8 (19.5%) |
Housing Structures by Number of Rooms in Joes
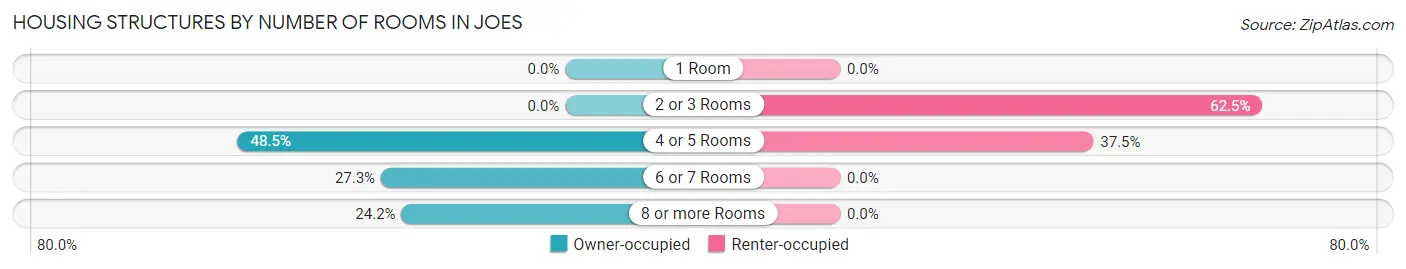
| Number of Rooms | Owner-occupied | Renter-occupied |
| 1 Room | 0 (0.0%) | 0 (0.0%) |
| 2 or 3 Rooms | 0 (0.0%) | 5 (62.5%) |
| 4 or 5 Rooms | 16 (48.5%) | 3 (37.5%) |
| 6 or 7 Rooms | 9 (27.3%) | 0 (0.0%) |
| 8 or more Rooms | 8 (24.2%) | 0 (0.0%) |
| Total | 33 (100.0%) | 8 (100.0%) |
Housing Structure by Heating Type in Joes
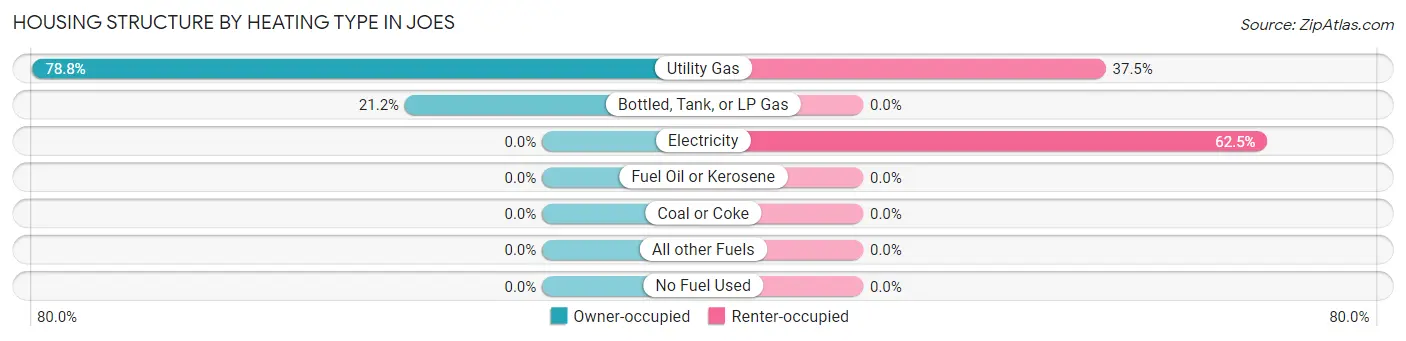
| Heating Type | Owner-occupied | Renter-occupied |
| Utility Gas | 26 (78.8%) | 3 (37.5%) |
| Bottled, Tank, or LP Gas | 7 (21.2%) | 0 (0.0%) |
| Electricity | 0 (0.0%) | 5 (62.5%) |
| Fuel Oil or Kerosene | 0 (0.0%) | 0 (0.0%) |
| Coal or Coke | 0 (0.0%) | 0 (0.0%) |
| All other Fuels | 0 (0.0%) | 0 (0.0%) |
| No Fuel Used | 0 (0.0%) | 0 (0.0%) |
| Total | 33 (100.0%) | 8 (100.0%) |
Household Vehicle Usage in Joes
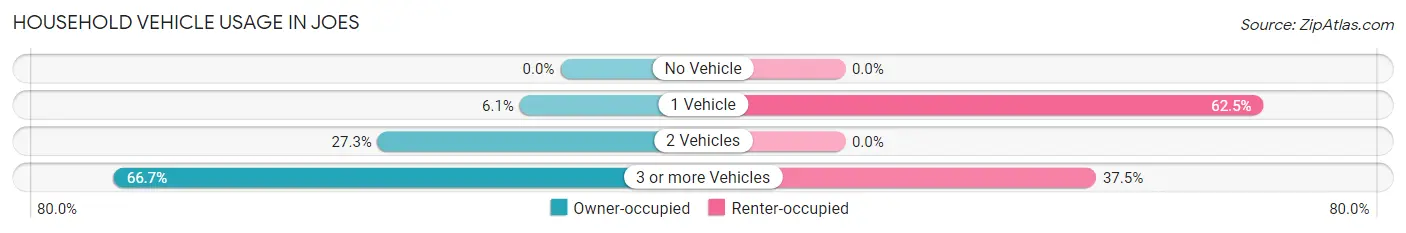
| Vehicles per Household | Owner-occupied | Renter-occupied |
| No Vehicle | 0 (0.0%) | 0 (0.0%) |
| 1 Vehicle | 2 (6.1%) | 5 (62.5%) |
| 2 Vehicles | 9 (27.3%) | 0 (0.0%) |
| 3 or more Vehicles | 22 (66.7%) | 3 (37.5%) |
| Total | 33 (100.0%) | 8 (100.0%) |
Real Estate & Mortgages in Joes
Real Estate and Mortgage Overview in Joes
| Characteristic | Without Mortgage | With Mortgage |
| Housing Units | 21 | 12 |
| Median Property Value | - | - |
| Median Household Income | $34,625 | $1 |
| Monthly Housing Costs | $194 | $0 |
| Real Estate Taxes | $199 | $5 |
Property Value by Mortgage Status in Joes
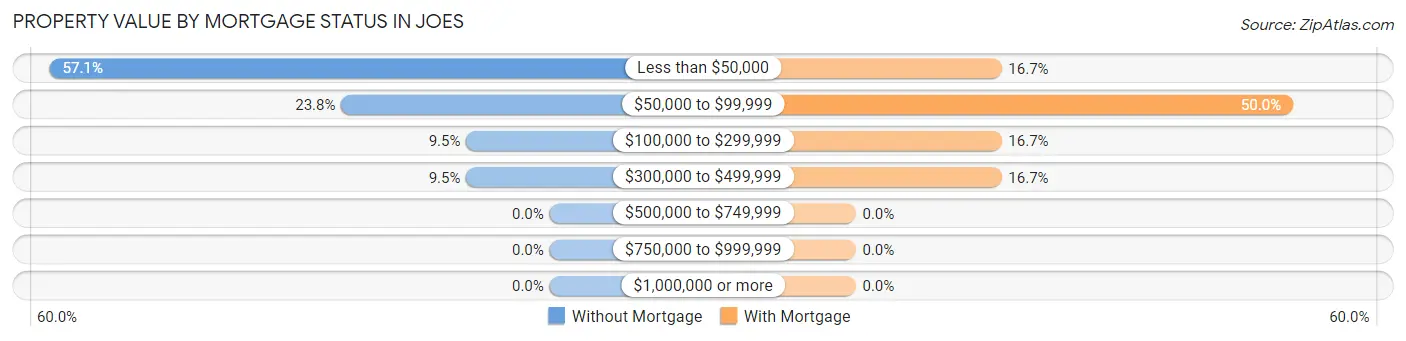
| Property Value | Without Mortgage | With Mortgage |
| Less than $50,000 | 12 (57.1%) | 2 (16.7%) |
| $50,000 to $99,999 | 5 (23.8%) | 6 (50.0%) |
| $100,000 to $299,999 | 2 (9.5%) | 2 (16.7%) |
| $300,000 to $499,999 | 2 (9.5%) | 2 (16.7%) |
| $500,000 to $749,999 | 0 (0.0%) | 0 (0.0%) |
| $750,000 to $999,999 | 0 (0.0%) | 0 (0.0%) |
| $1,000,000 or more | 0 (0.0%) | 0 (0.0%) |
| Total | 21 (100.0%) | 12 (100.0%) |
Household Income by Mortgage Status in Joes
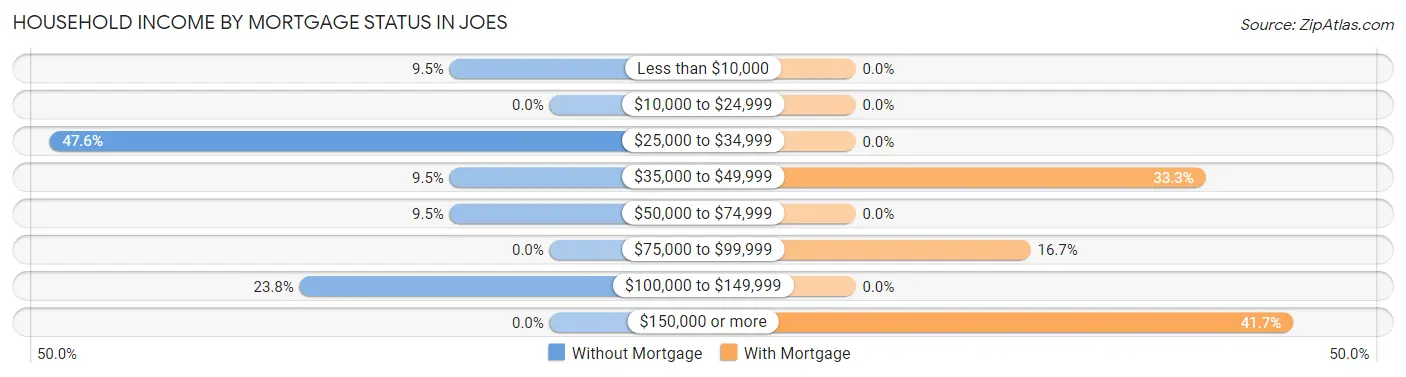
| Household Income | Without Mortgage | With Mortgage |
| Less than $10,000 | 2 (9.5%) | 0 (0.0%) |
| $10,000 to $24,999 | 0 (0.0%) | 0 (0.0%) |
| $25,000 to $34,999 | 10 (47.6%) | 0 (0.0%) |
| $35,000 to $49,999 | 2 (9.5%) | 4 (33.3%) |
| $50,000 to $74,999 | 2 (9.5%) | 0 (0.0%) |
| $75,000 to $99,999 | 0 (0.0%) | 2 (16.7%) |
| $100,000 to $149,999 | 5 (23.8%) | 0 (0.0%) |
| $150,000 or more | 0 (0.0%) | 5 (41.7%) |
| Total | 21 (100.0%) | 12 (100.0%) |
Property Value to Household Income Ratio in Joes
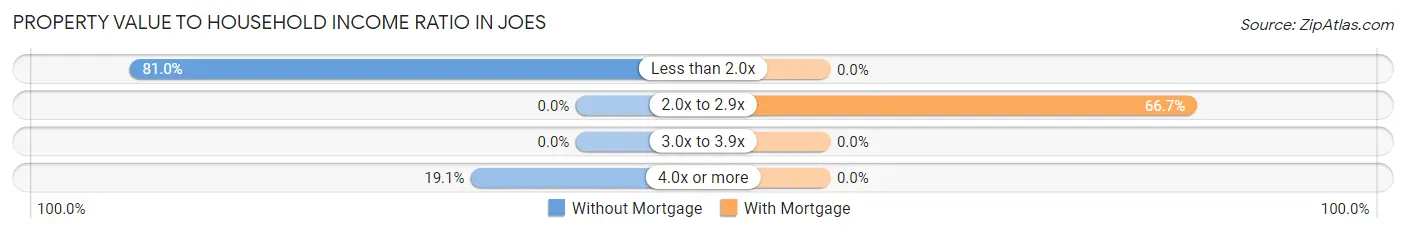
| Value-to-Income Ratio | Without Mortgage | With Mortgage |
| Less than 2.0x | 17 (80.9%) | 0 (0.0%) |
| 2.0x to 2.9x | 0 (0.0%) | 8 (66.7%) |
| 3.0x to 3.9x | 0 (0.0%) | 0 (0.0%) |
| 4.0x or more | 4 (19.1%) | 0 (0.0%) |
| Total | 21 (100.0%) | 12 (100.0%) |
Real Estate Taxes by Mortgage Status in Joes
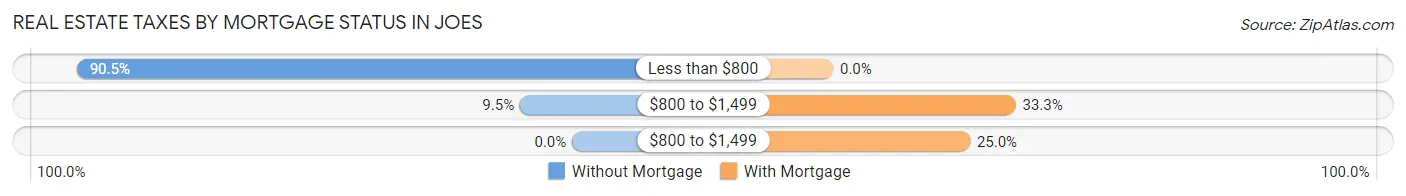
| Property Taxes | Without Mortgage | With Mortgage |
| Less than $800 | 19 (90.5%) | 0 (0.0%) |
| $800 to $1,499 | 2 (9.5%) | 4 (33.3%) |
| $800 to $1,499 | 0 (0.0%) | 3 (25.0%) |
| Total | 21 (100.0%) | 12 (100.0%) |
Health & Disability in Joes
Health Insurance Coverage by Age in Joes
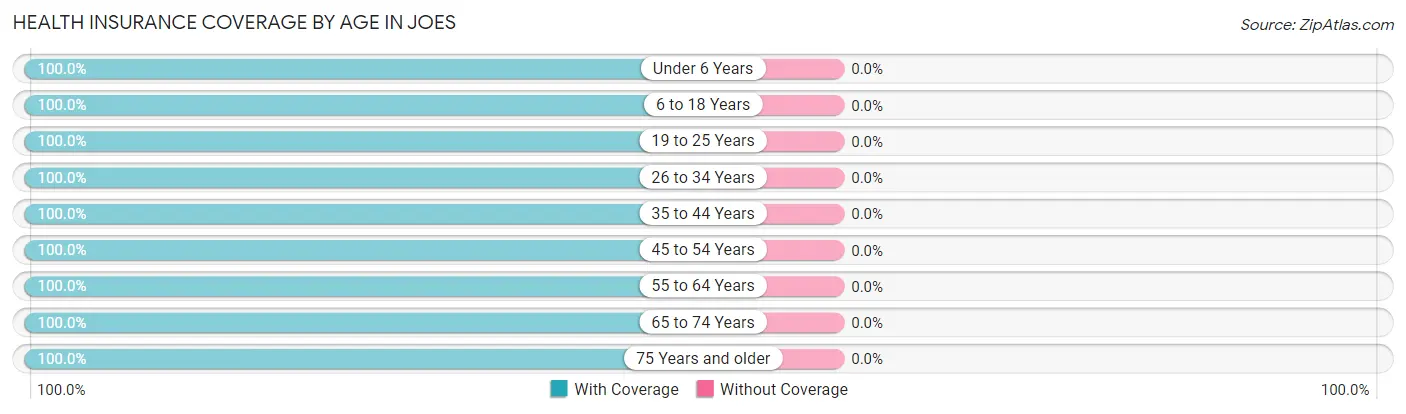
| Age Bracket | With Coverage | Without Coverage |
| Under 6 Years | 20 (100.0%) | 0 (0.0%) |
| 6 to 18 Years | 21 (100.0%) | 0 (0.0%) |
| 19 to 25 Years | 2 (100.0%) | 0 (0.0%) |
| 26 to 34 Years | 8 (100.0%) | 0 (0.0%) |
| 35 to 44 Years | 11 (100.0%) | 0 (0.0%) |
| 45 to 54 Years | 11 (100.0%) | 0 (0.0%) |
| 55 to 64 Years | 6 (100.0%) | 0 (0.0%) |
| 65 to 74 Years | 12 (100.0%) | 0 (0.0%) |
| 75 Years and older | 30 (100.0%) | 0 (0.0%) |
| Total | 121 (100.0%) | 0 (0.0%) |
Health Insurance Coverage by Citizenship Status in Joes
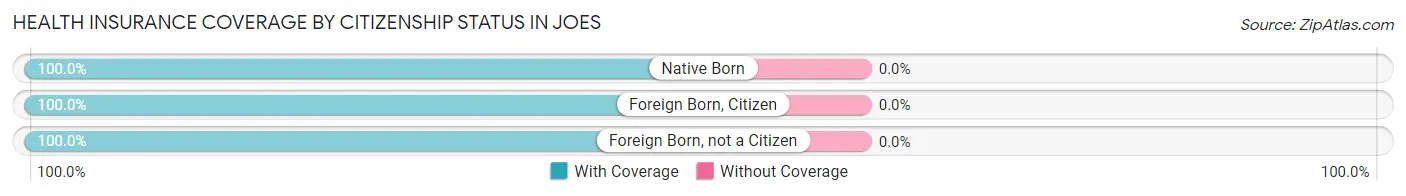
| Citizenship Status | With Coverage | Without Coverage |
| Native Born | 20 (100.0%) | 0 (0.0%) |
| Foreign Born, Citizen | 21 (100.0%) | 0 (0.0%) |
| Foreign Born, not a Citizen | 2 (100.0%) | 0 (0.0%) |
Health Insurance Coverage by Household Income in Joes
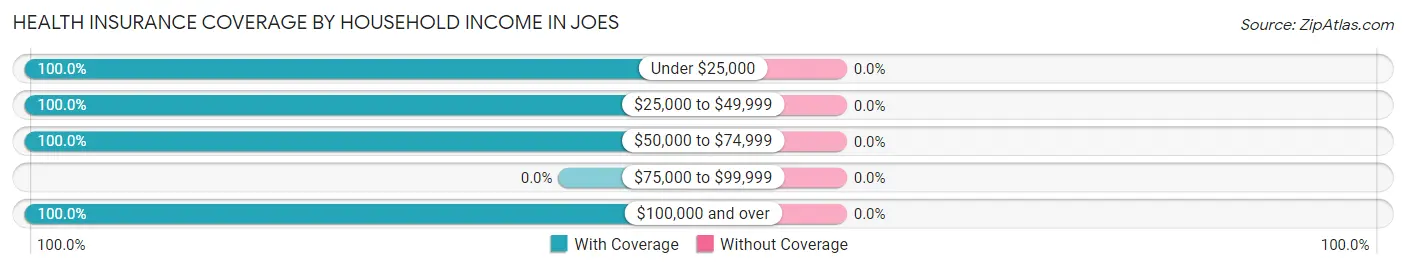
| Household Income | With Coverage | Without Coverage |
| Under $25,000 | 7 (100.0%) | 0 (0.0%) |
| $25,000 to $49,999 | 59 (100.0%) | 0 (0.0%) |
| $50,000 to $74,999 | 18 (100.0%) | 0 (0.0%) |
| $75,000 to $99,999 | 0 (0.0%) | 0 (0.0%) |
| $100,000 and over | 37 (100.0%) | 0 (0.0%) |
Public vs Private Health Insurance Coverage by Age in Joes
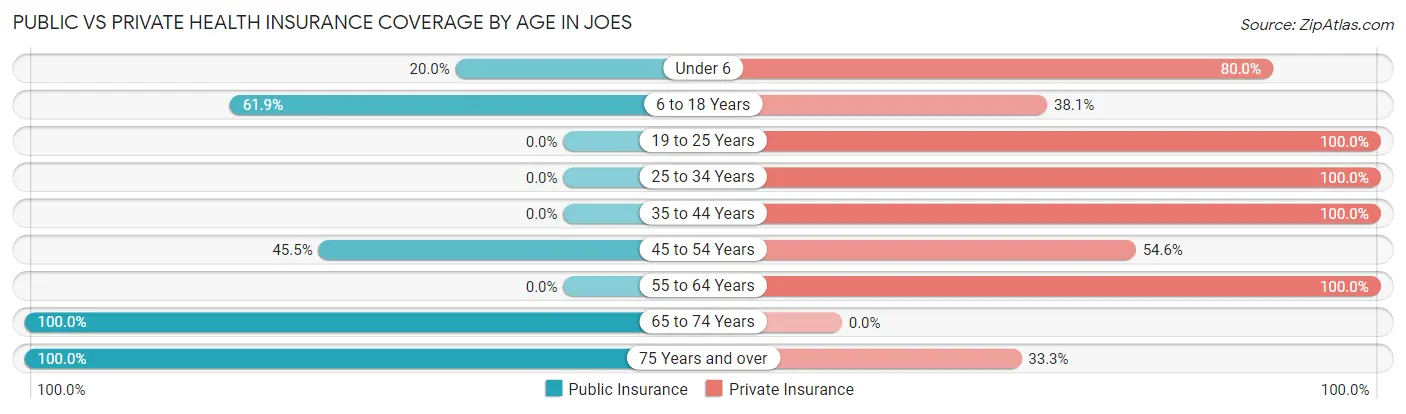
| Age Bracket | Public Insurance | Private Insurance |
| Under 6 | 4 (20.0%) | 16 (80.0%) |
| 6 to 18 Years | 13 (61.9%) | 8 (38.1%) |
| 19 to 25 Years | 0 (0.0%) | 2 (100.0%) |
| 25 to 34 Years | 0 (0.0%) | 8 (100.0%) |
| 35 to 44 Years | 0 (0.0%) | 11 (100.0%) |
| 45 to 54 Years | 5 (45.5%) | 6 (54.5%) |
| 55 to 64 Years | 0 (0.0%) | 6 (100.0%) |
| 65 to 74 Years | 12 (100.0%) | 0 (0.0%) |
| 75 Years and over | 30 (100.0%) | 10 (33.3%) |
| Total | 64 (52.9%) | 67 (55.4%) |
Disability Status by Sex by Age in Joes
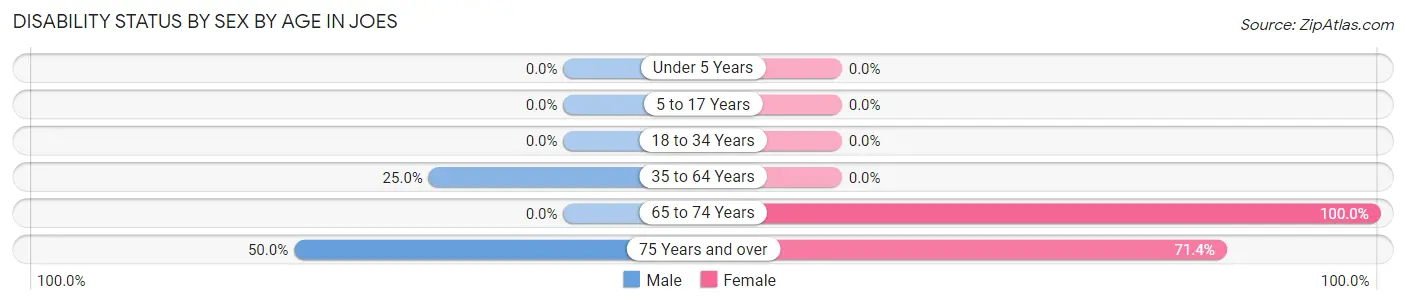
| Age Bracket | Male | Female |
| Under 5 Years | 0 (0.0%) | 0 (0.0%) |
| 5 to 17 Years | 0 (0.0%) | 0 (0.0%) |
| 18 to 34 Years | 0 (0.0%) | 0 (0.0%) |
| 35 to 64 Years | 4 (25.0%) | 0 (0.0%) |
| 65 to 74 Years | 0 (0.0%) | 5 (100.0%) |
| 75 Years and over | 8 (50.0%) | 10 (71.4%) |
Disability Class by Sex by Age in Joes
Disability Class: Hearing Difficulty
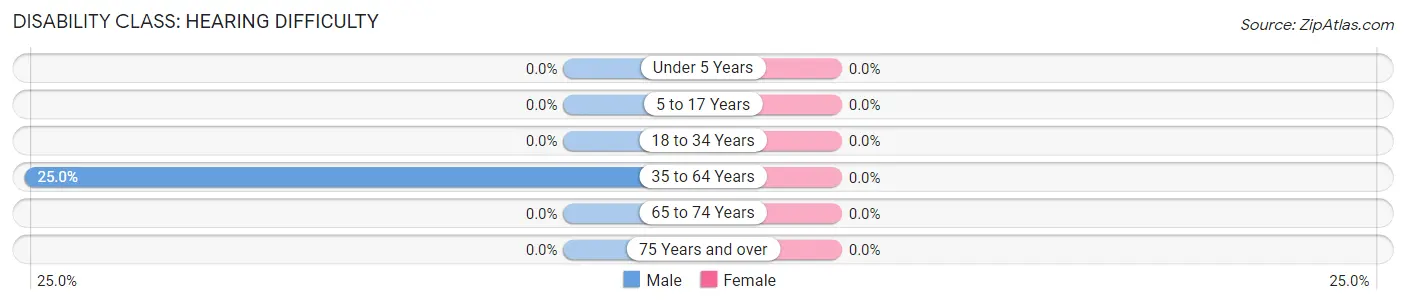
| Age Bracket | Male | Female |
| Under 5 Years | 0 (0.0%) | 0 (0.0%) |
| 5 to 17 Years | 0 (0.0%) | 0 (0.0%) |
| 18 to 34 Years | 0 (0.0%) | 0 (0.0%) |
| 35 to 64 Years | 4 (25.0%) | 0 (0.0%) |
| 65 to 74 Years | 0 (0.0%) | 0 (0.0%) |
| 75 Years and over | 0 (0.0%) | 0 (0.0%) |
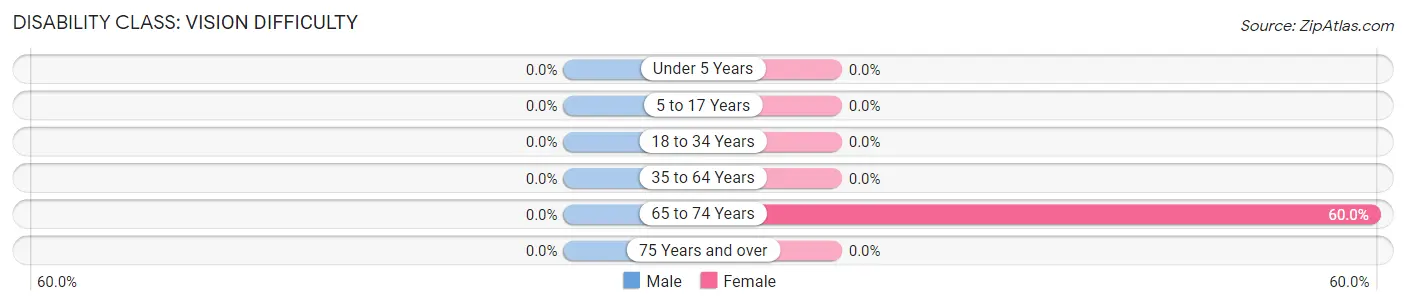
Disability Class: Vision Difficulty
| Age Bracket | Male | Female |
| Under 5 Years | 0 (0.0%) | 0 (0.0%) |
| 5 to 17 Years | 0 (0.0%) | 0 (0.0%) |
| 18 to 34 Years | 0 (0.0%) | 0 (0.0%) |
| 35 to 64 Years | 0 (0.0%) | 0 (0.0%) |
| 65 to 74 Years | 0 (0.0%) | 3 (60.0%) |
| 75 Years and over | 0 (0.0%) | 0 (0.0%) |
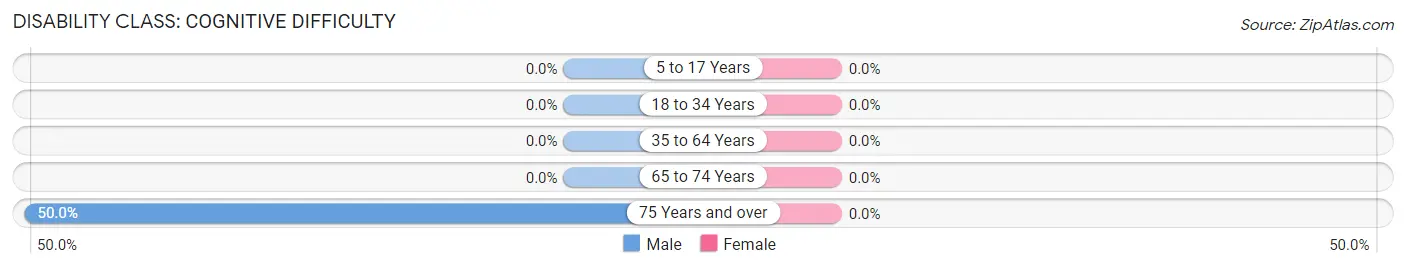
Disability Class: Cognitive Difficulty
| Age Bracket | Male | Female |
| 5 to 17 Years | 0 (0.0%) | 0 (0.0%) |
| 18 to 34 Years | 0 (0.0%) | 0 (0.0%) |
| 35 to 64 Years | 0 (0.0%) | 0 (0.0%) |
| 65 to 74 Years | 0 (0.0%) | 0 (0.0%) |
| 75 Years and over | 8 (50.0%) | 0 (0.0%) |
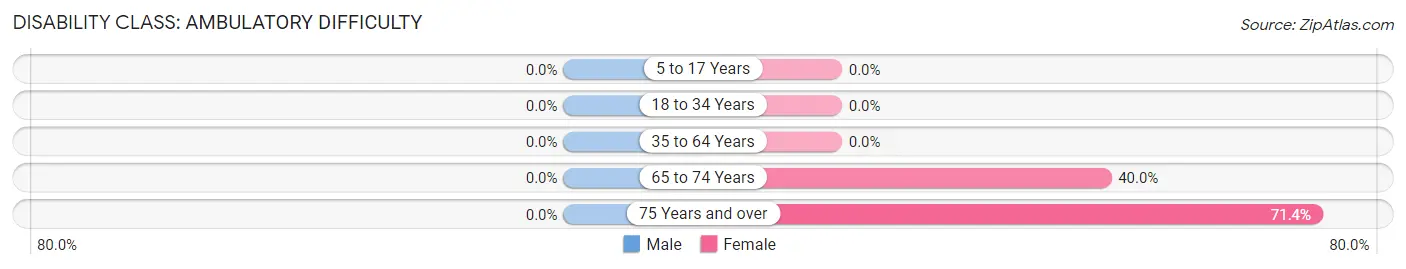
Disability Class: Ambulatory Difficulty
| Age Bracket | Male | Female |
| 5 to 17 Years | 0 (0.0%) | 0 (0.0%) |
| 18 to 34 Years | 0 (0.0%) | 0 (0.0%) |
| 35 to 64 Years | 0 (0.0%) | 0 (0.0%) |
| 65 to 74 Years | 0 (0.0%) | 2 (40.0%) |
| 75 Years and over | 0 (0.0%) | 10 (71.4%) |
Disability Class: Self-Care Difficulty
| Age Bracket | Male | Female |
| 5 to 17 Years | 0 (0.0%) | 0 (0.0%) |
| 18 to 34 Years | 0 (0.0%) | 0 (0.0%) |
| 35 to 64 Years | 0 (0.0%) | 0 (0.0%) |
| 65 to 74 Years | 0 (0.0%) | 0 (0.0%) |
| 75 Years and over | 0 (0.0%) | 0 (0.0%) |
Technology Access in Joes
Computing Device Access in Joes
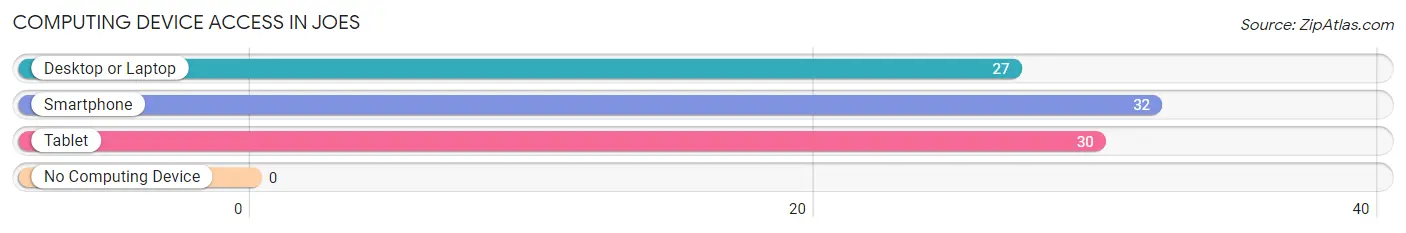
| Device Type | # Households | % Households |
| Desktop or Laptop | 27 | 65.8% |
| Smartphone | 32 | 78.0% |
| Tablet | 30 | 73.2% |
| No Computing Device | 0 | 0.0% |
| Total | 41 | 100.0% |
Internet Access in Joes
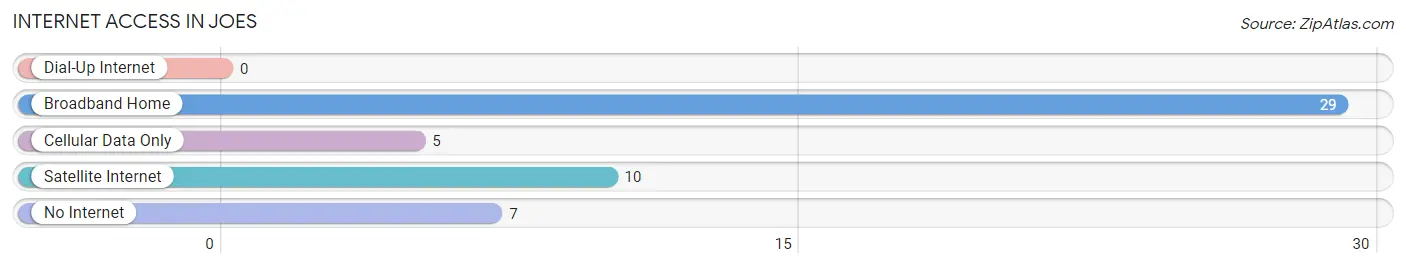
| Internet Type | # Households | % Households |
| Dial-Up Internet | 0 | 0.0% |
| Broadband Home | 29 | 70.7% |
| Cellular Data Only | 5 | 12.2% |
| Satellite Internet | 10 | 24.4% |
| No Internet | 7 | 17.1% |
| Total | 41 | 100.0% |
Joes Summary
Joe's is a small town located in the state of Colorado in the United States. It is situated in the foothills of the Rocky Mountains, about 25 miles west of Denver. The town has a population of about 1,500 people and is known for its small-town charm and friendly atmosphere.
Geography
Joe's is located in the foothills of the Rocky Mountains, at an elevation of 6,000 feet. The town is surrounded by mountains and forests, and is situated in a valley between two mountain ranges. The town is located in the Front Range of the Rocky Mountains, and is close to the Continental Divide. The town is also close to the headwaters of the South Platte River.
Climate
Joe's has a semi-arid climate, with hot summers and cold winters. The average temperature in the summer is around 80 degrees Fahrenheit, and the average temperature in the winter is around 20 degrees Fahrenheit. The town receives an average of 16 inches of precipitation per year, with most of it falling in the spring and summer months.
Economy
Joe's is a small town with a limited economy. The town is home to a few small businesses, including a grocery store, a hardware store, and a few restaurants. The town also has a few small manufacturing companies, which produce items such as furniture and clothing. The town is also home to a few small farms, which produce vegetables, fruits, and livestock.
Demographics
Joe's is a predominantly white town, with about 90% of the population being Caucasian. The town also has a small Hispanic population, which makes up about 5% of the population. The town also has a small African American population, which makes up about 2% of the population. The town also has a small Native American population, which makes up about 1% of the population.
Conclusion
Joe's is a small town located in the foothills of the Rocky Mountains in Colorado. The town has a population of about 1,500 people and is known for its small-town charm and friendly atmosphere. The town has a semi-arid climate, with hot summers and cold winters. The town has a limited economy, with most of its businesses being small and locally owned. The town is predominantly white, with a small Hispanic, African American, and Native American population.
Common Questions
What is Per Capita Income in Joes?
Per Capita income in Joes is $23,476.
What is the Median Family Income in Joes?
Median Family Income in Joes is $58,750.
What is Inequality or Gini Index in Joes?
Inequality or Gini Index in Joes is 0.40.
What is the Total Population of Joes?
Total Population of Joes is 121.
What is the Total Male Population of Joes?
Total Male Population of Joes is 60.
What is the Total Female Population of Joes?
Total Female Population of Joes is 61.
What is the Ratio of Males per 100 Females in Joes?
There are 98.36 Males per 100 Females in Joes.
What is the Ratio of Females per 100 Males in Joes?
There are 101.67 Females per 100 Males in Joes.
What is the Median Population Age in Joes?
Median Population Age in Joes is 41.7 Years.
What is the Average Family Size in Joes
Average Family Size in Joes is 3.1 People.
What is the Average Household Size in Joes
Average Household Size in Joes is 3.0 People.
How Large is the Labor Force in Joes?
There are 44 People in the Labor Forcein in Joes.
What is the Percentage of People in the Labor Force in Joes?
55.0% of People are in the Labor Force in Joes.
What is the Unemployment Rate in Joes?
Unemployment Rate in Joes is 4.5%.